User login
ASCO issues guideline for early detection, management of colorectal cancer
The American Society of Clinical Oncology has issued a new guideline on the early detection and management of colorectal cancer in people at average risk for colorectal cancer, which was written by Gilberto Lopes, MD, of the University of Miami and his associates on an ASCO expert panel.
The panel assembled by ASCO to write the guideline consisted of medical oncology, surgical oncology, surgery, gastroenterology, health technology assessment, cancer epidemiology, pathology, radiology, radiation oncology, and patient advocacy experts. Guidelines from eight different developers were examined, and recommendations from those guidelines were adapted to form the new ASCO guideline. The guideline was published in the Journal of Global Oncology.
In people who are asymptomatic, are aged 50-75 years, have no family history of colorectal cancer, are at average risk, and are in settings with high incidences of colorectal cancer, the expert panel recommends guaiac fecal occult blood test or fecal immunochemical testing every 1-2 years, flexible sigmoidoscopy every 5 years, a combination of flexible sigmoidoscopy every 10 years and annual stool-based testing, or colonoscopy every 10 years, depending on available resources. The testing strategy for those with positive stool-based testing or flexible sigmoidoscopy is colonoscopy or a double-contrast barium enema if colonoscopy is unavailable.
For patients who have polyps, polypectomy at the time of colonoscopy is recommended, with the option of referral for surgical resection if not suitable for endoscopic resection. When symptoms (iron-deficiency anemia, bleeding, abdominal pain, and/or change in bowel habits) are present, a colonoscopy should be performed if available. If colonoscopy is contraindicated, a double-contrast barium enema can be performed; if endoscopy is contraindicated, CT colonography can be performed.
More information, including a data supplement with additional evidence tables, a methodology supplement with information about evidence quality and strength of recommendations, slide sets, and clinical tools and resources is available at www.asco.org/resource-stratified-guidelines, the guideline noted.
Several members of the expert panel reported conflicts of interest.
SOURCE: Lopes G et al. J Glob Oncol. 2019 Feb 25. doi: 10.1200/JGO.18.00213.
This story was updated on March 4, 2019.
FROM THE JOURNAL OF GLOBAL ONCOLOGY
Age 1 food allergies often disappear by age 6
SAN FRANCISCO –

Among 131 infants diagnosed with a peanut allergy when they were 1 year old and then followed with repeat testing 5 years later, 41 (31%) had complete resolution of their peanut allergy, while the allergy persisted in the other 90 children, Rachel L. Peters, PhD, said at the annual meeting of the American Academy of Allergy, Asthma, and Immunology. The study also followed 404 infants diagnosed with an egg allergy at 1 year of age and found that by age 6 the allergy had resolved in 368 (91%), while persisting in 36 children, said Dr. Peters, an epidemiologist at Murdoch Children’s Research Institute in Parkville, Australia.
The analysis also identified risk factors that linked with an increased rate of allergy persistence. For peanut allergy persistence beyond the first year, the correlating factors were early-onset eczema, tree nut allergy, and a stronger peanut allergy identified by a greater than 4-mm reaction to a peanut skin-prick test. Factors that linked with an increased rate of persistent egg allergy were eczema, peanut allergy, gastrointestinal or respiratory reaction symptoms to milk, and reaction on an oral food challenge elicited by a low dose (less than 0.5 mL) of milk.
A consequence of the frequent resolution of these food allergies was that a positive skin-prick test reaction to either peanut or egg at 1 year old was poorly predictive of allergy status at age 6, while skin-prick tests at age 6 worked well for identifying a persistent food allergy at that age.
The analyses that Dr. Peters and her associates ran used data collected in the HealthNuts study, a comprehensive, prospective, population-based study of food allergies in children that enrolled 5,276 infants at 1 year old. The HealthNuts researchers enrolled infants at immunization clinics in the Melbourne area, with enrollment stratified to represent the people who live in that region (Clin Exp Allergy. 2010 Oct;40[10]:1516-22).
[email protected]
On Twitter @mitchelzoler
SOURCE: Peters R et al. J Allergy Clin Immunol. 2019 Feb;143[2]:AB421.
SAN FRANCISCO –
Among 131 infants diagnosed with a peanut allergy when they were 1 year old and then followed with repeat testing 5 years later, 41 (31%) had complete resolution of their peanut allergy, while the allergy persisted in the other 90 children, Rachel L. Peters, PhD, said at the annual meeting of the American Academy of Allergy, Asthma, and Immunology. The study also followed 404 infants diagnosed with an egg allergy at 1 year of age and found that by age 6 the allergy had resolved in 368 (91%), while persisting in 36 children, said Dr. Peters, an epidemiologist at Murdoch Children’s Research Institute in Parkville, Australia.
The analysis also identified risk factors that linked with an increased rate of allergy persistence. For peanut allergy persistence beyond the first year, the correlating factors were early-onset eczema, tree nut allergy, and a stronger peanut allergy identified by a greater than 4-mm reaction to a peanut skin-prick test. Factors that linked with an increased rate of persistent egg allergy were eczema, peanut allergy, gastrointestinal or respiratory reaction symptoms to milk, and reaction on an oral food challenge elicited by a low dose (less than 0.5 mL) of milk.
A consequence of the frequent resolution of these food allergies was that a positive skin-prick test reaction to either peanut or egg at 1 year old was poorly predictive of allergy status at age 6, while skin-prick tests at age 6 worked well for identifying a persistent food allergy at that age.
The analyses that Dr. Peters and her associates ran used data collected in the HealthNuts study, a comprehensive, prospective, population-based study of food allergies in children that enrolled 5,276 infants at 1 year old. The HealthNuts researchers enrolled infants at immunization clinics in the Melbourne area, with enrollment stratified to represent the people who live in that region (Clin Exp Allergy. 2010 Oct;40[10]:1516-22).
[email protected]
On Twitter @mitchelzoler
SOURCE: Peters R et al. J Allergy Clin Immunol. 2019 Feb;143[2]:AB421.
REPORTING FROM AAAAI
FDA Expanded Access benefits heavily pretreated patients, especially children
Single-patient use (SPU) of investigational therapies via the Food and Drug Administration’s Expanded Access program is an option worth considering for heavily pretreated cancer patients, according to a retrospective analysis of SPUs at Memorial Sloan Kettering Cancer Center.
Although approximately 2% of cancer cases at Kettering are pediatric, 34.1% of SPUs were for children, reported lead author Noah Z. Feit of Cornell University, New York, and his colleagues.
Therefore, “SPUs may provide an important means of pediatric drug access,” the investigators wrote in a JAMA Oncology letter.
The analysis involved 179 patients with 43 cancer types; these were more often solid tumors than hematologic malignancies (57.9% vs. 42.1%). The most common solid tumor type was neuroblastoma (15.3%), followed by lung (7.9%), primary brain (7.9%), and breast (5.9%). Sixty-six investigational products were given; the top three types were kinase inhibitors (28.8%), naked antibodies (12.5%), and allogeneic cell therapy (12.0%). Therapies were in various stages of development, including phase 3 (39.4%), phase 2 (36.1%), and phase 1 (18.8%). SPU approval was most often based on previous clinical experience (61.5%), although genomic data (38.0%) and preclinical evidence (30.8%) were also cited. The median number of prior treatments was four, suggesting a heavily pretreated patient population.
Analysis showed that the overall response rate to SPU agents was 20.1%, and patients with hematologic cancers responded more often than did those with solid tumors (30.4% vs. 12.2%). Median progression-free survival and overall survival were 3.9 months and 11.4 months, respectively. About one-third of patients (29.7%) had at least one serious treatment-related adverse event, with adults more often affected than children (35.3% vs. 19.1%). No treatment-related deaths occurred.
“In summary, our data provide an initial evidence basis to evaluate the FDA Expanded Access mechanism. We find its use is broad, involving a wide variety of patients and products, and clinical benefit was observed,” the investigators concluded. “Routine prospective collection of key safety and efficacy metrics should be considered moving forward.”
The study was funded by National Institutes of Health, the St. Baldrick’s Foundation, and the Nonna’s Garden Foundation Initiative in Precision Oncology. The investigators reported financial relationships with Mylan, Atara Biotherapeutics, Chugai Pharma, Boehringer Ingelheim, and others.
SOURCE: Feit et al. JAMA Onc. 2019 Feb 28. doi: 10.1001/jamaoncol.2018.7002.
FROM JAMA ONCOLOGY
Two free contraception apps for providers of family planning
Evidence-based research and guidelines regarding contraception are continually changing. Health care providers often have difficulty memorizing and staying up-to-date on all the important developments around family planning. Those who provide contraceptive counseling may not all use guidelines to inform their choices, and some may have misperceptions about patient eligibility for certain methods.1,2 Mobile health applications (apps) that present this information in an easily accessible fashion have the potential to improve family planning services.
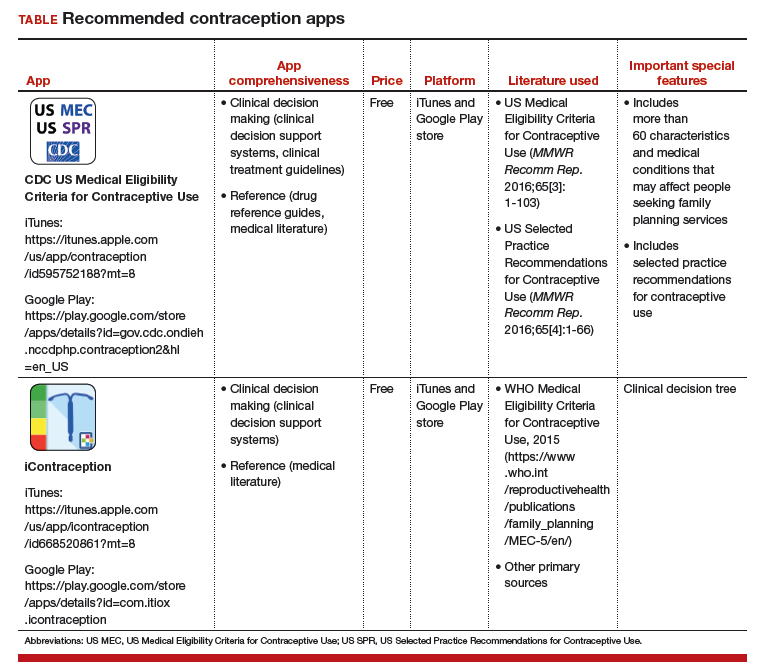
In a search for contraception apps, Dr. Rachel Perry and colleagues identified two contraception apps that were evaluated highly: 1) the Centers for Disease Control and Prevention (CDC) US Medical Eligibility Criteria for Contraceptive Use (MEC) app and 2) the iContraception app.3
Two free contraception apps for clinician use. Both the CDC Contraception and iContraception apps are based on CDC MEC information and provide guidance on contraceptive initiation and maintenance.4 Notably, the American College of Obstetricians and Gynecologists (ACOG) endorses the use of the CDC MEC.5
These two apps can aid physicians in prescribing appropriate and safe contraceptive methods and can help them tailor the extensive CDC MEC guidelines for an individual patient. Additionally, the iContraception app allows a user to input multiple clinical and demographic characteristics to determine an individual patient’s eligibility for a specific contraceptive method (that is, it incorporates a clinical decision tree).
The recommended contraception apps are listed in the TABLE and are detailed with a shortened version of the APPLICATIONS scoring system, APPLI (app comprehensiveness, price, platform, literature used, and important special features).6 I hope that the apps described here will assist you in managing patients who need contraception counseling.
- Russo JA, Chen BA, Creinin MD. Primary care physician familiarity with US medical eligibility for contraceptive use. Fam Med. 2015;47:15-21.
- Dehlendorf C, Levy K, Ruskin R, et al. Health care providers' knowledge about contraceptive evidence: a barrier to quality family planning care? Contraception. 2010;81:292-298.
- Perry R, Lunde B, Chen KT. An evaluation of contraception mobile applications for providers of family planning services. Contraception. 2016;93:539-544.
- Curtis KM, Tepper NK, Jatlaoui TC, et al. US Medical Eligibility Criteria for Contraceptive Use, 2016. MMWR Recomm Rep. 2016;65(3):1-103.
- American College of Obstetricians and Gynecologists. Committee opinion no. 505: understanding and using the US Medical Eligibility Criteria for Contraceptive Use. Obstet Gynecol. 2011;118:754-760.
- Chyjek K, Farag S, Chen KT. Rating pregnancy wheel applications using the APPLICATIONS scoring system. Obstet Gynecol. 2015;125:1478-1483.

Dr. Chen is Professor of Obstetrics, Gynecology, and Reproductive Science and Medical Education, Vice-Chair of Ob-Gyn Education for the Mount Sinai Health System, Icahn School of Medicine, Mount Sinai, New York, New York. She is an OBG Management Contributing Editor.
The author reports being an advisory board member and receiving royalties from UpToDate, Inc.
Evidence-based research and guidelines regarding contraception are continually changing. Health care providers often have difficulty memorizing and staying up-to-date on all the important developments around family planning. Those who provide contraceptive counseling may not all use guidelines to inform their choices, and some may have misperceptions about patient eligibility for certain methods.1,2 Mobile health applications (apps) that present this information in an easily accessible fashion have the potential to improve family planning services.
In a search for contraception apps, Dr. Rachel Perry and colleagues identified two contraception apps that were evaluated highly: 1) the Centers for Disease Control and Prevention (CDC) US Medical Eligibility Criteria for Contraceptive Use (MEC) app and 2) the iContraception app.3
Two free contraception apps for clinician use. Both the CDC Contraception and iContraception apps are based on CDC MEC information and provide guidance on contraceptive initiation and maintenance.4 Notably, the American College of Obstetricians and Gynecologists (ACOG) endorses the use of the CDC MEC.5
These two apps can aid physicians in prescribing appropriate and safe contraceptive methods and can help them tailor the extensive CDC MEC guidelines for an individual patient. Additionally, the iContraception app allows a user to input multiple clinical and demographic characteristics to determine an individual patient’s eligibility for a specific contraceptive method (that is, it incorporates a clinical decision tree).
The recommended contraception apps are listed in the TABLE and are detailed with a shortened version of the APPLICATIONS scoring system, APPLI (app comprehensiveness, price, platform, literature used, and important special features).6 I hope that the apps described here will assist you in managing patients who need contraception counseling.
- Russo JA, Chen BA, Creinin MD. Primary care physician familiarity with US medical eligibility for contraceptive use. Fam Med. 2015;47:15-21.
- Dehlendorf C, Levy K, Ruskin R, et al. Health care providers' knowledge about contraceptive evidence: a barrier to quality family planning care? Contraception. 2010;81:292-298.
- Perry R, Lunde B, Chen KT. An evaluation of contraception mobile applications for providers of family planning services. Contraception. 2016;93:539-544.
- Curtis KM, Tepper NK, Jatlaoui TC, et al. US Medical Eligibility Criteria for Contraceptive Use, 2016. MMWR Recomm Rep. 2016;65(3):1-103.
- American College of Obstetricians and Gynecologists. Committee opinion no. 505: understanding and using the US Medical Eligibility Criteria for Contraceptive Use. Obstet Gynecol. 2011;118:754-760.
- Chyjek K, Farag S, Chen KT. Rating pregnancy wheel applications using the APPLICATIONS scoring system. Obstet Gynecol. 2015;125:1478-1483.

Risk for Appendicitis, Cholecystitis, or Diverticulitis in Patients With Psoriasis
Psoriasis is a chronic skin condition affecting approximately 2% to 3% of the population.1,2 Beyond cutaneous manifestations, psoriasis is a systemic inflammatory state that is associated with an increased risk for cardiovascular disease, including obesity,3,4 type 2 diabetes mellitus,5,6 hypertension,5 dyslipidemia,3,7 metabolic syndrome,7 atherosclerosis,8 peripheral vascular disease,9 coronary artery calcification,10 myocardial infarction,11-13 stroke,9,14 and cardiac death.15,16
Psoriasis also has been associated with inflammatory bowel disease (IBD), possibly because of similar autoimmune mechanisms in the pathogenesis of both diseases.17,18 However, there is no literature regarding the risk for acute gastrointestinal pathologies such as appendicitis, cholecystitis, or diverticulitis in patients with psoriasis.
The primary objective of this study was to examine if patients with psoriasis are at increased risk for appendicitis, cholecystitis, or diverticulitis compared to the general population. The secondary objective was to determine if patients with severe psoriasis (ie, patients treated with phototherapy or systemic therapy) are at a higher risk for these conditions compared to patients with mild psoriasis.
Methods
Patients and Tools
A descriptive, population-based cohort study design with controls from a matched cohort was used to ascertain the effect of psoriasis status on patients’ risk for appendicitis, cholecystitis, or diverticulitis. Our cohort was selected using administrative data from Kaiser Permanente Southern California (KPSC) during the study period (January 1, 2004, through December 31, 2016).
Kaiser Permanente Southern California is a large integrated health maintenance organization that includes approximately 4 million patients as of December 31, 2016, and includes roughly 20% of the region’s population. The geographic area served extends from Bakersfield in the lower California Central Valley to San Diego on the border with Mexico. Membership demographics, socioeconomic status, and ethnicity composition are representative of California.
Patients were included if they had a diagnosis of psoriasis (International Classification of Diseases, Ninth Revision, Clinical Modification [ICD-9-CM] code 696.1; International Classification of Diseases, Tenth Revision, Clinical Modification [ICD-10-CM] codes L40.0, L40.4, L40.8, or L40.9) for at least 3 visits between January 1, 2004, and December 31, 2016. Patients were not excluded if they also had a diagnosis of psoriatic arthritis (ICD-9-CM code 696.0; ICD-10-CM code L40.5x). Patients also must have been continuously enrolled for at least 1 year before and 1 year after the index date, which was defined as the date of the third psoriasis diagnosis.
Each patient with psoriasis was assigned to 1 of 2 cohorts: (1) severe psoriasis: patients who received UVB phototherapy, psoralen plus UVA phototherapy, methotrexate, acitretin, cyclosporine, apremilast, etanercept, adalimumab, infliximab, ustekinumab, efalizumab, alefacept, secukinumab, or ixekizumab during the study period; and (2) mild psoriasis: patients who had a diagnosis of psoriasis who did not receive one of these therapies during the study period.
Patients were excluded if they had a history of appendicitis, cholecystitis, or diverticulitis at any time before the index date. Only patients older than 18 years were included.
Patients with psoriasis were frequency matched (1:5) with healthy patients, also from the KPSC network. Individuals were matched by age, sex, and ethnicity.
Statistical Analysis
Baseline characteristics were described with means and SD for continuous variables as well as percentages for categorical variables. Chi-square tests for categorical variables and the Mann-Whitney U Test for continuous variables were used to compare the patients’ characteristics by psoriasis status. Cox proportional hazards regression models were used to examine the risk for appendicitis, cholecystitis, or diverticulitis among patients with and without psoriasis and among patients with mild and severe psoriasis. Proportionality assumption was validated using Pearson product moment correlation between the scaled Schoenfeld residuals and log transformed time for each covariate.
Results were presented as crude (unadjusted) hazard ratios (HRs) and adjusted HRs, where confounding factors (ie, age, sex, ethnicity, body mass index [BMI], alcohol use, smoking status, income, education, and membership length) were adjusted. All tests were performed with SAS EG 5.1 and R software. P<.05 was considered statistically significant. Results are reported with the 95% confidence interval (CI), when appropriate.
Results
A total of 1,690,214 KPSC patients were eligible for the study; 10,307 (0.6%) met diagnostic and inclusion criteria for the psoriasis cohort. Patients with psoriasis had a significantly higher mean BMI (29.9 vs 28.7; P<.0001) as well as higher mean rates of alcohol use (56% vs 53%; P<.0001) and smoking (47% vs 38%; P<.01) compared to controls. Psoriasis patients had a shorter average duration of membership within the Kaiser network (P=.0001) compared to controls.
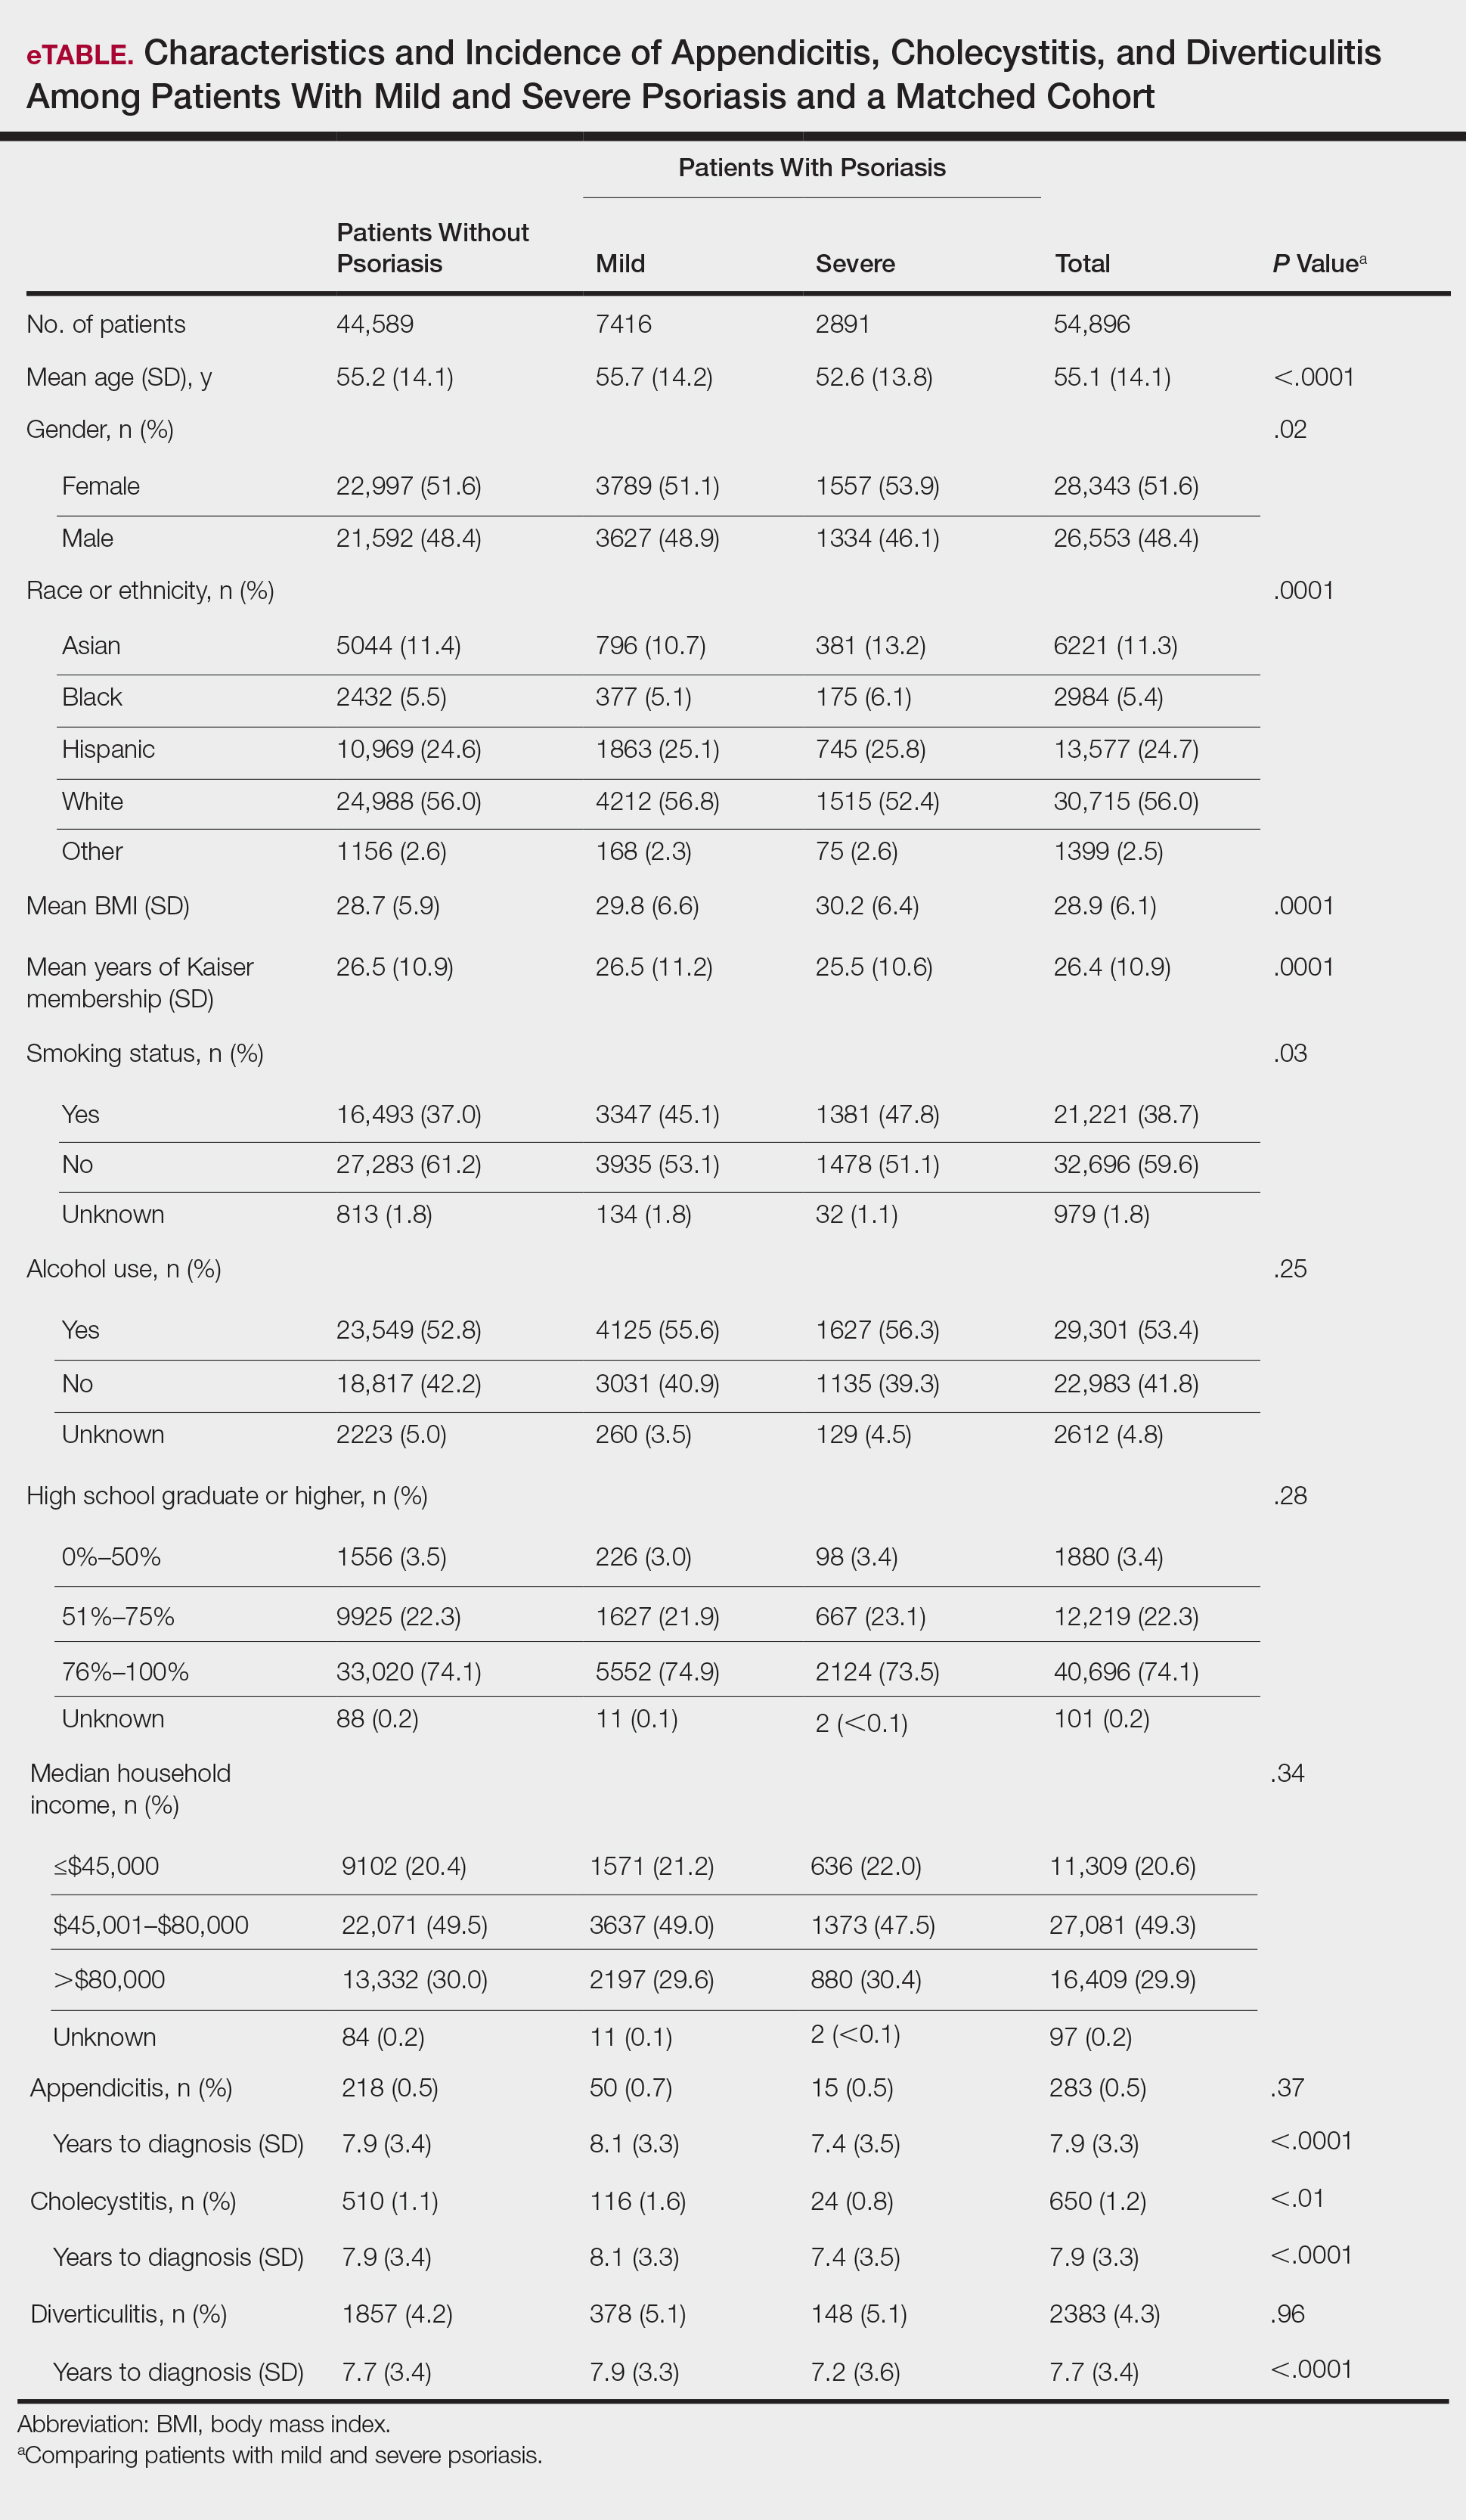
A total of 7416 patients met criteria for mild psoriasis and 2891 patients met criteria for severe psoriasis (eTable). Patients with severe psoriasis were significantly younger and had significantly higher mean BMI compared to patients with mild psoriasis (P<.0001 and P=.0001, respectively). No significant difference in rates of alcohol or tobacco use was detected among patients with mild and severe psoriasis.
Appendicitis
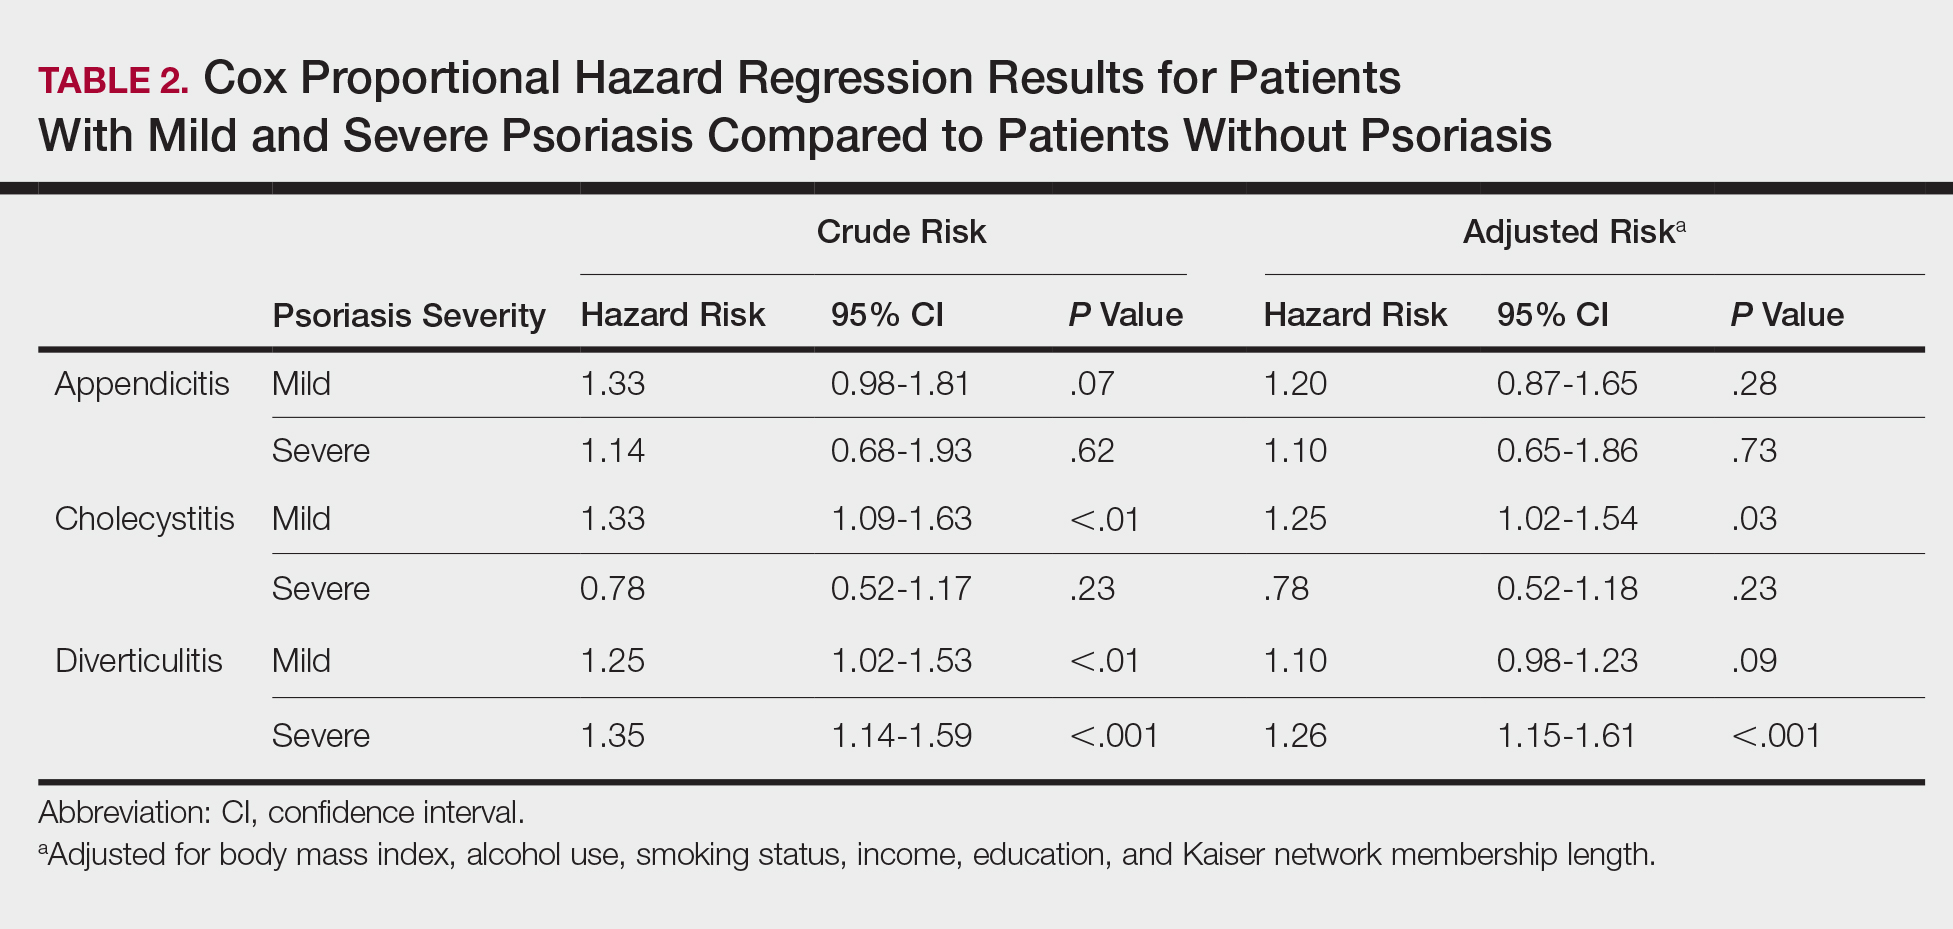
The prevalence of appendicitis was not significantly different between patients with and without psoriasis or between patients with mild and severe psoriasis, though the incidence rate was slightly higher among patients with psoriasis (0.80 per 1000 patient-years compared to 0.62 per 1000 patient-years among patients without psoriasis)(Table 1). However, there was not a significant difference in risk for appendicitis between healthy patients, patients with severe psoriasis, and patients with mild psoriasis after adjusting for potential confounding factors (Table 2). Interestingly, patients with severe psoriasis who had a diagnosis of appendicitis had a significantly shorter time to diagnosis of appendicitis compared to patients with mild psoriasis (7.4 years vs 8.1 years; P<.0001).
Cholecystitis
Psoriasis patients also did not have an increased prevalence of cholecystitis compared to healthy patients. However, patients with severe psoriasis had a significantly higher prevalence of cholecystitis compared to patients with mild psoriasis (P=.0038). Overall, patients with psoriasis had a slightly higher incidence rate (1.72 per 1000 patient-years) compared to healthy patients (1.46 per 1000 patient-years). Moreover, the time to diagnosis of cholecystitis was significantly shorter for patients with severe psoriasis than for patients with mild psoriasis (7.4 years vs 8.1 years; P<.0001). Mild psoriasis was associated with a significantly increased risk (HR, 1.33; 95% CI, 1.09-1.63; P<.01) for cholecystitis compared to individuals without psoriasis in both the crude and adjusted models (Table 2). There was no difference between mild psoriasis patients and severe psoriasis patients in risk for cholecystitis.
Diverticulitis
Patients with psoriasis had a significantly greater prevalence of diverticulitis compared to the control cohort (5.1% vs 4.2%; P<.0001). There was no difference in prevalence between the severe psoriasis group and the mild psoriasis group (P=.96), but the time to diagnosis of diverticulitis was shorter in the severe psoriasis group than in the mild psoriasis group (7.2 years vs 7.9 years; P<.0001). Psoriasis patients had an incidence rate of diverticulitis of 6.61 per 1000 patient-years compared to 5.38 per 1000 patient-years in the control group. Psoriasis conferred a higher risk for diverticulitis in both the crude and adjusted models (HR, 1.23; 95% CI, 1.11-1.35 [P<.001] and HR, 1.16; 95% CI, 1.05-1.29; [P<.01], respectively)(Table 3); however, when stratified by disease severity, only patients with severe psoriasis were found to be at higher risk (HR, 1.26; 95% CI, 1.15-1.61; P<.001 for the adjusted model).
Comment
The objective of this study was to examine the background risks for specific gastrointestinal pathologies in a large cohort of patients with psoriasis compared to the general population. After adjusting for measured confounders, patients with severe psoriasis had a significantly higher risk of diverticulitis compared to the general population. Although more patients with severe psoriasis developed appendicitis or cholecystitis, the difference was not significant.
The pathogenesis of diverticulosis and diverticulitis has been thought to be related to increased intracolonic pressure and decreased dietary fiber intake, leading to formation of diverticula in the colon.19 Our study did not correct for differences in diet between the 2 groups, making it a possible confounding variable. Studies evaluating dietary habits of psoriatic patients have found that adult males with psoriasis might consume less fiber compared to healthy patients,20 and psoriasis patients also might consume less whole-grain fiber.21 Furthermore, fiber deficiency also might affect gut flora, causing low-grade chronic inflammation,18 which also has been supported by response to anti-inflammatory medications such as mesalazine.22 Given the autoimmune association between psoriasis and IBD, it is possible that psoriasis also might create an environment of chronic inflammation in the gut, predisposing patients with psoriasis to diverticulitis. However, further research is needed to better evaluate this possibility.
Our study also does not address any potential effects on outcomes of specific treatments for psoriasis. Brandl et al23 found that patients on immunosuppressive therapy for autoimmune diseases had longer hospital and intensive care unit stays, higher rates of emergency operations, and higher mortality while hospitalized. Because our results suggest that patients with severe psoriasis, who are therefore more likely to require treatment with an immunomodulator, are at higher risk for diverticulitis, these patients also might be at risk for poorer outcomes.
There is no literature evaluating the relationship between psoriasis and appendicitis. Our study found a slightly lower incidence rate compared to the national trend (9.38 per 10,000 patient-years in the United States in 2008) in both healthy patients and psoriasis patients.24 Of note, this statistic includes children, whereas our study did not, which might in part account for the lower rate. However, Cheluvappa et al25 hypothesized a relationship between appendicitis and subsequent appendectomy at a young age and protection against IBD. They also found that the mechanism for protection involves downregulation of the helper T cell (TH17) pathway,25 which also has been found to play a role in psoriasis pathogenesis.26,27 Although our results suggest that the risk for appendicitis is not increased for patients with psoriasis, further research might be able to determine if appendicitis and subsequent appendectomy also can offer protection against development of psoriasis.
We found that patients with severe psoriasis had a higher incidence rate of cholecystitis compared to patients with mild psoriasis. Egeberg et al28 found an increased risk for cholelithiasis among patients with psoriasis, which may contribute to a higher rate of cholecystitis. Although both acute and chronic cholecystitis were incorporated in this study, a Russian study found that chronic cholecystitis may be a predictor of progression of psoriasis.29 Moreover, patients with severe psoriasis had a shorter duration to diagnosis of cholecystitis than patients with mild psoriasis. It is possible that patients with severe psoriasis are in a state of greater chronic inflammation than those with mild psoriasis, and therefore, when combined with other risk factors for cholecystitis, may progress to disease more quickly. Alternatively, this finding could be treatment related, as there have been reported cases of cholecystitis related to etanercept use in patients treated for psoriasis and juvenile polyarticular rheumatoid arthritis.30,31 The relationship is not yet well defined, however, and further research is necessary to evaluate this association.
Study Strengths
Key strengths of this study include the large sample size and diversity of the patient population. Kaiser Permanente Southern California membership generally is representative of the broader community, making our results fairly generalizable to populations with health insurance. Use of a matched control cohort allows the results to be more specific to the disease of interest, and the population-based design minimizes bias.
Study Limitations
This study has several limitations. Although the cohorts were categorized based on type of treatment received, exact therapies were not specified. As a retrospective study, it is difficult to control for potential confounding variables that are not included in the electronic medical record. The results of this study also demonstrated significantly shorter durations to diagnosis of all 3 conditions, indicating that surveillance bias may be present.
Conclusion
Patients with psoriasis may be at an increased risk for diverticulitis compared to patients without psoriasis, which could be due to the chronic inflammatory state induced by psoriasis. Therefore, it may be beneficial for clinicians to evaluate psoriasis patients for other risk factors for diverticulitis and subsequently provide counseling to these patients to minimize their risk for diverticulitis. Psoriasis patients do not appear to be at an increased risk for appendicitis or cholecystitis compared to controls; however, further research is needed for confirmation.
- Parisi R, Symmons DP, Griffiths CE, et al; Identification and Management of Psoriasis and Associated ComorbidiTy (IMPACT) project team. Global epidemiology of psoriasis: a systematic review of incidence and prevalence. J Invest Dermatol. 2013;133:377-385.
- Channual J, Wu JJ, Dann FJ. Effects of tumor necrosis factor-α blockade on metabolic syndrome in psoriasis and psoriatic arthritis and additional lessons learned from rheumatoid arthritis. Dermatol Ther. 2009;22:61-73.
- Koebnick C, Black MH, Smith N, et al. The association of psoriasis and elevated blood lipids in overweight and obese children. J Pediatr. 2011;159:577-583.
- Herron MD, Hinckley M, Hoffman MS, et al. Impact of obesity and smoking on psoriasis presentation and management. Arch Dermatol. 2005;141:1527-1534.
- Qureshi AA, Choi HK, Setty AR, et al. Psoriasis and the risk of diabetes and hypertension: a prospective study of US female nurses. Arch Dermatol. 2009;145:379-382.
- Shapiro J, Cohen AD, David M, et al. The association between psoriasis, diabetes mellitus, and atherosclerosis in Israel: a case-control study. J Am Acad Dermatol. 2007;56:629-634.
- Love TJ, Qureshi AA, Karlson EW, et al. Prevalence of the metabolic syndrome in psoriasis: results from the National Health and Nutrition Examination Survey, 2003-2006. Arch Dermatol. 2011;147:419-424.
- El-Mongy S, Fathy H, Abdelaziz A, et al. Subclinical atherosclerosis in patients with chronic psoriasis: a potential association. J Eur Acad Dermatol Venereol. 2010;24:661-666.
- Prodanovich S, Kirsner RS, Kravetz JD, et al. Association of psoriasis with coronary artery, cerebrovascular, and peripheral vascular diseases and mortality. Arch Dermatol. 2009;145:700-703.
- Ludwig RJ, Herzog C, Rostock A, et al. Psoriasis: a possible risk factor for development of coronary artery calcification. Br J Dermatol. 2007;156:271-276.
- Kaye JA, Li L, Jick SS. Incidence of risk factors for myocardial infarction and other vascular diseases in patients with psoriasis. Br J Dermatol. 2008;159:895-902.
- Kimball AB, Robinson D Jr, Wu Y, et al. Cardiovascular disease and risk factors among psoriasis patients in two US healthcare databases, 2001-2002. Dermatology. 2008;217:27-37.
- Gelfand JM, Neimann AL, Shin DB, et al. Risk of myocardial infarction in patients with psoriasis. JAMA. 2006;296:1735-1741.
- Gelfand JM, Dommasch ED, Shin DB, et al. The risk of stroke in patients with psoriasis. J Invest Dermatol. 2009;129:2411-2418.
- Mehta NN, Azfar RS, Shin DB, et al. Patients with severe psoriasis are at increased risk of cardiovascular mortality: cohort study using the General Practice Research Database. Eur Heart J. 2010;31:1000-1006.
- Abuabara K, Azfar RS, Shin DB, et al. Cause-specific mortality in patients with severe psoriasis: a population-based cohort study in the United Kingdom. Br J Dermatol. 2010;163:586-592.
- Christophers E. Comorbidities in psoriasis. Clin Dermatol. 2007;25:529-534.
- Wu JJ, Nguyen TU, Poon KY, et al. The association of psoriasis with autoimmune diseases. J Am Acad Dermatol. 2012;67:924-930.
- Floch MH, Bina I. The natural history of diverticulitis: fact and theory. Clin Gastroenterol. 2004;38(5, suppl 1):S2-S7.
- Barrea L, Macchia PE, Tarantino G, et al. Nutrition: a key environmental dietary factor in clinical severity and cardio-metabolic risk in psoriatic male patients evaluated by 7-day food-frequency questionnaire. J Transl Med. 2015;13:303.
- Afifi L, Danesh MJ, Lee KM, et al. Dietary behaviors in psoriasis: patient-reported outcomes from a U.S. National Survey. Dermatol Ther (Heidelb). 2017;7:227-242.
- Matrana MR, Margolin DA. Epidemiology and pathophysiology of diverticular disease. Clin Colon Rectal Surg. 2009;22:141-146.
- Brandl A, Kratzer T, Kafka-Ritsch R, et al. Diverticulitis in immunosuppressed patients: a fatal outcome requiring a new approach? Can J Surg. 2016;59:254-261.
- Buckius MT, McGrath B, Monk J, et al. Changing epidemiology of acute appendicitis in the United States: study period 1993-2008. J Surg Res. 2012;175:185-190.
- Cheluvappa R, Luo AS, Grimm MC. T helper type 17 pathway suppression by appendicitis and appendectomy protects against colitis. Clin Exp Immunol. 2014;175:316-322.
- Lynde CW, Poulin Y, Vender R, et al. Interleukin 17A: toward a new understanding of psoriasis pathogenesis. J Am Acad Dermatol. 2014;71:141-150.
- Arican O, Aral M, Sasmaz S, et al. Serum levels of TNF-α, IFN-γ, IL6, IL-8, IL-12, IL-17, and IL-18 in patients with active psoriasis and correlation with disease severity. Mediators Inflamm. 2005:2005;273-279.
- Egeberg A, Anderson YMF, Gislason GH, et al. Gallstone risk in adult patients with atopic dermatitis and psoriasis: possible effect of overweight and obesity. Acta Derm Venereol. 2017;97:627-631.
- Smirnova SV, Barilo AA, Smolnikova MV. Hepatobiliary system diseases as the predictors of psoriasis progression [in Russian]. Vestn Ross Akad Med Nauk. 2016:102-108.
- Bagel J, Lynde C, Tyring S, et al. Moderate to severe plaque psoriasis with scalp involvement: a randomized, double-blind, placebo-controlled study of etanercept. J Am Acad Dermatol. 2012;67:86-92.
- Foeldvari I, Krüger E, Schneider T. Acute, non-obstructive, sterile cholecystitis associated with etanercept and infliximab for the treatment of juvenile polyarticular rheumatoid arthritis. Ann Rheum Dis. 2003;62:908-909.
Psoriasis is a chronic skin condition affecting approximately 2% to 3% of the population.1,2 Beyond cutaneous manifestations, psoriasis is a systemic inflammatory state that is associated with an increased risk for cardiovascular disease, including obesity,3,4 type 2 diabetes mellitus,5,6 hypertension,5 dyslipidemia,3,7 metabolic syndrome,7 atherosclerosis,8 peripheral vascular disease,9 coronary artery calcification,10 myocardial infarction,11-13 stroke,9,14 and cardiac death.15,16
Psoriasis also has been associated with inflammatory bowel disease (IBD), possibly because of similar autoimmune mechanisms in the pathogenesis of both diseases.17,18 However, there is no literature regarding the risk for acute gastrointestinal pathologies such as appendicitis, cholecystitis, or diverticulitis in patients with psoriasis.
The primary objective of this study was to examine if patients with psoriasis are at increased risk for appendicitis, cholecystitis, or diverticulitis compared to the general population. The secondary objective was to determine if patients with severe psoriasis (ie, patients treated with phototherapy or systemic therapy) are at a higher risk for these conditions compared to patients with mild psoriasis.
Methods
Patients and Tools
A descriptive, population-based cohort study design with controls from a matched cohort was used to ascertain the effect of psoriasis status on patients’ risk for appendicitis, cholecystitis, or diverticulitis. Our cohort was selected using administrative data from Kaiser Permanente Southern California (KPSC) during the study period (January 1, 2004, through December 31, 2016).
Kaiser Permanente Southern California is a large integrated health maintenance organization that includes approximately 4 million patients as of December 31, 2016, and includes roughly 20% of the region’s population. The geographic area served extends from Bakersfield in the lower California Central Valley to San Diego on the border with Mexico. Membership demographics, socioeconomic status, and ethnicity composition are representative of California.
Patients were included if they had a diagnosis of psoriasis (International Classification of Diseases, Ninth Revision, Clinical Modification [ICD-9-CM] code 696.1; International Classification of Diseases, Tenth Revision, Clinical Modification [ICD-10-CM] codes L40.0, L40.4, L40.8, or L40.9) for at least 3 visits between January 1, 2004, and December 31, 2016. Patients were not excluded if they also had a diagnosis of psoriatic arthritis (ICD-9-CM code 696.0; ICD-10-CM code L40.5x). Patients also must have been continuously enrolled for at least 1 year before and 1 year after the index date, which was defined as the date of the third psoriasis diagnosis.
Each patient with psoriasis was assigned to 1 of 2 cohorts: (1) severe psoriasis: patients who received UVB phototherapy, psoralen plus UVA phototherapy, methotrexate, acitretin, cyclosporine, apremilast, etanercept, adalimumab, infliximab, ustekinumab, efalizumab, alefacept, secukinumab, or ixekizumab during the study period; and (2) mild psoriasis: patients who had a diagnosis of psoriasis who did not receive one of these therapies during the study period.
Patients were excluded if they had a history of appendicitis, cholecystitis, or diverticulitis at any time before the index date. Only patients older than 18 years were included.
Patients with psoriasis were frequency matched (1:5) with healthy patients, also from the KPSC network. Individuals were matched by age, sex, and ethnicity.
Statistical Analysis
Baseline characteristics were described with means and SD for continuous variables as well as percentages for categorical variables. Chi-square tests for categorical variables and the Mann-Whitney U Test for continuous variables were used to compare the patients’ characteristics by psoriasis status. Cox proportional hazards regression models were used to examine the risk for appendicitis, cholecystitis, or diverticulitis among patients with and without psoriasis and among patients with mild and severe psoriasis. Proportionality assumption was validated using Pearson product moment correlation between the scaled Schoenfeld residuals and log transformed time for each covariate.
Results were presented as crude (unadjusted) hazard ratios (HRs) and adjusted HRs, where confounding factors (ie, age, sex, ethnicity, body mass index [BMI], alcohol use, smoking status, income, education, and membership length) were adjusted. All tests were performed with SAS EG 5.1 and R software. P<.05 was considered statistically significant. Results are reported with the 95% confidence interval (CI), when appropriate.
Results
A total of 1,690,214 KPSC patients were eligible for the study; 10,307 (0.6%) met diagnostic and inclusion criteria for the psoriasis cohort. Patients with psoriasis had a significantly higher mean BMI (29.9 vs 28.7; P<.0001) as well as higher mean rates of alcohol use (56% vs 53%; P<.0001) and smoking (47% vs 38%; P<.01) compared to controls. Psoriasis patients had a shorter average duration of membership within the Kaiser network (P=.0001) compared to controls.
A total of 7416 patients met criteria for mild psoriasis and 2891 patients met criteria for severe psoriasis (eTable). Patients with severe psoriasis were significantly younger and had significantly higher mean BMI compared to patients with mild psoriasis (P<.0001 and P=.0001, respectively). No significant difference in rates of alcohol or tobacco use was detected among patients with mild and severe psoriasis.
Appendicitis
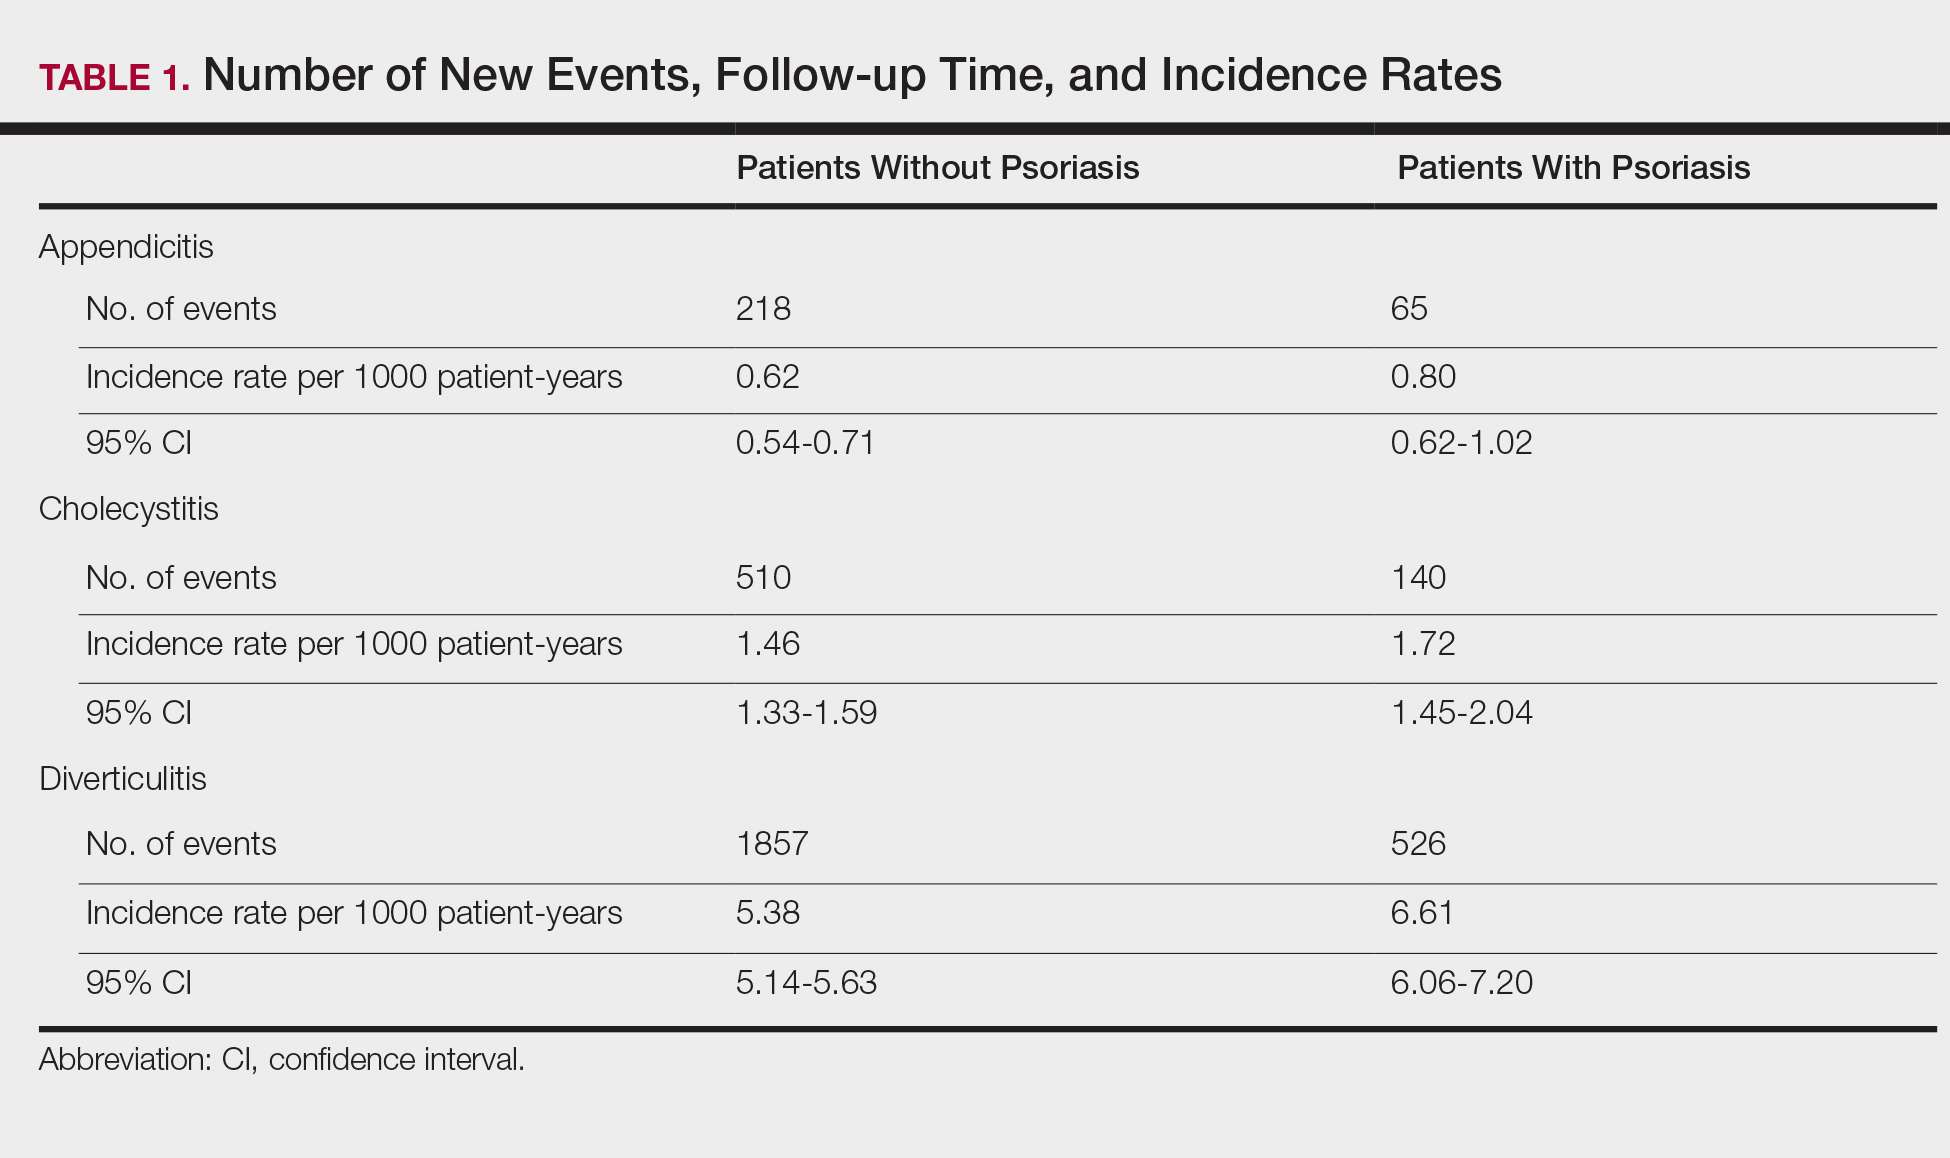
The prevalence of appendicitis was not significantly different between patients with and without psoriasis or between patients with mild and severe psoriasis, though the incidence rate was slightly higher among patients with psoriasis (0.80 per 1000 patient-years compared to 0.62 per 1000 patient-years among patients without psoriasis)(Table 1). However, there was not a significant difference in risk for appendicitis between healthy patients, patients with severe psoriasis, and patients with mild psoriasis after adjusting for potential confounding factors (Table 2). Interestingly, patients with severe psoriasis who had a diagnosis of appendicitis had a significantly shorter time to diagnosis of appendicitis compared to patients with mild psoriasis (7.4 years vs 8.1 years; P<.0001).
Cholecystitis
Psoriasis patients also did not have an increased prevalence of cholecystitis compared to healthy patients. However, patients with severe psoriasis had a significantly higher prevalence of cholecystitis compared to patients with mild psoriasis (P=.0038). Overall, patients with psoriasis had a slightly higher incidence rate (1.72 per 1000 patient-years) compared to healthy patients (1.46 per 1000 patient-years). Moreover, the time to diagnosis of cholecystitis was significantly shorter for patients with severe psoriasis than for patients with mild psoriasis (7.4 years vs 8.1 years; P<.0001). Mild psoriasis was associated with a significantly increased risk (HR, 1.33; 95% CI, 1.09-1.63; P<.01) for cholecystitis compared to individuals without psoriasis in both the crude and adjusted models (Table 2). There was no difference between mild psoriasis patients and severe psoriasis patients in risk for cholecystitis.
Diverticulitis
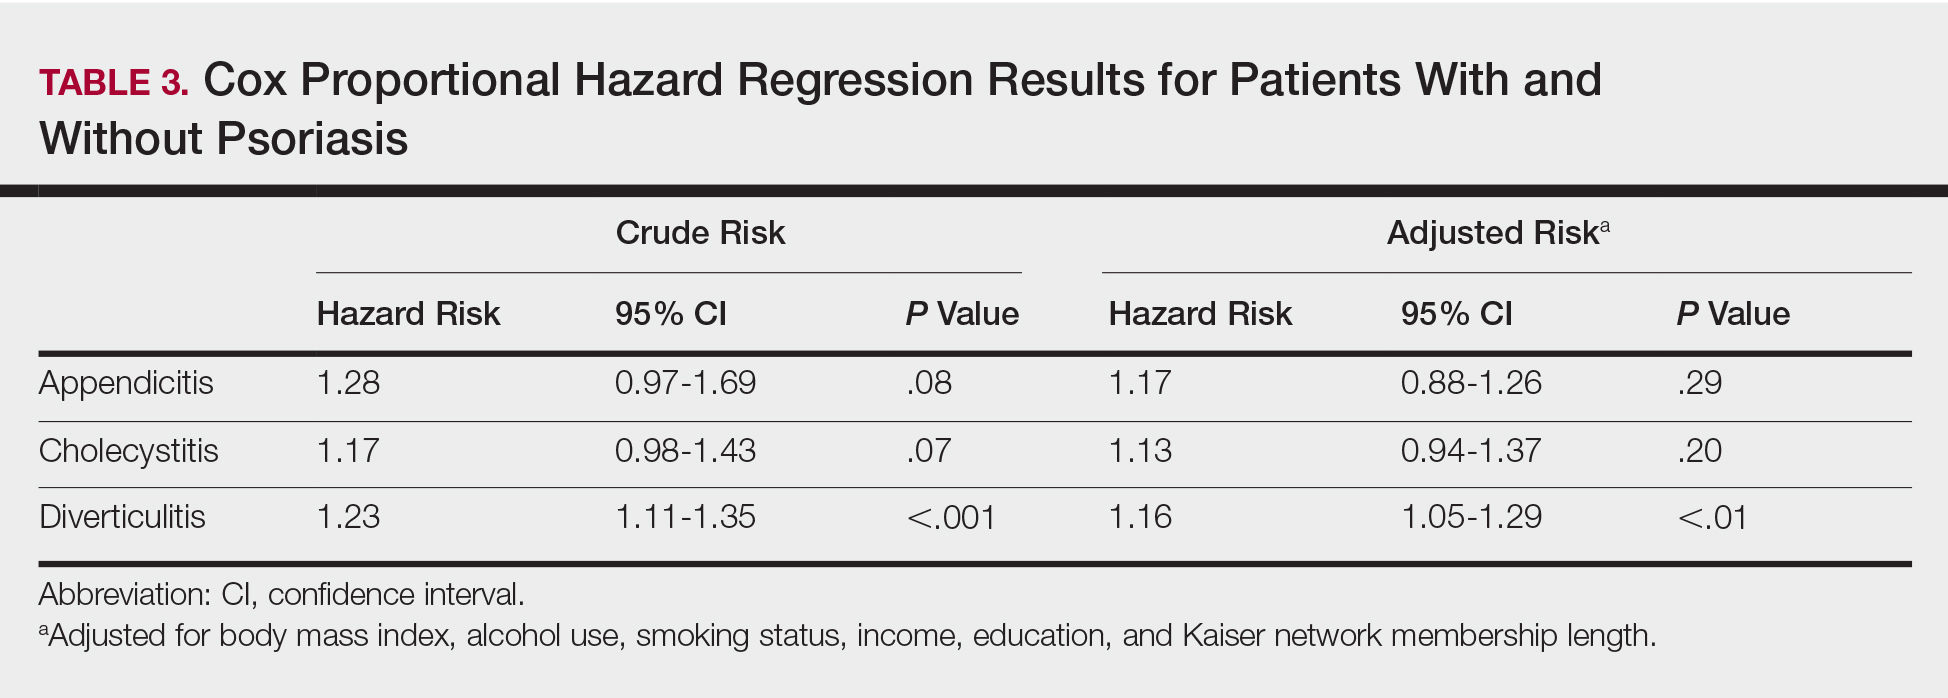
Patients with psoriasis had a significantly greater prevalence of diverticulitis compared to the control cohort (5.1% vs 4.2%; P<.0001). There was no difference in prevalence between the severe psoriasis group and the mild psoriasis group (P=.96), but the time to diagnosis of diverticulitis was shorter in the severe psoriasis group than in the mild psoriasis group (7.2 years vs 7.9 years; P<.0001). Psoriasis patients had an incidence rate of diverticulitis of 6.61 per 1000 patient-years compared to 5.38 per 1000 patient-years in the control group. Psoriasis conferred a higher risk for diverticulitis in both the crude and adjusted models (HR, 1.23; 95% CI, 1.11-1.35 [P<.001] and HR, 1.16; 95% CI, 1.05-1.29; [P<.01], respectively)(Table 3); however, when stratified by disease severity, only patients with severe psoriasis were found to be at higher risk (HR, 1.26; 95% CI, 1.15-1.61; P<.001 for the adjusted model).
Comment
The objective of this study was to examine the background risks for specific gastrointestinal pathologies in a large cohort of patients with psoriasis compared to the general population. After adjusting for measured confounders, patients with severe psoriasis had a significantly higher risk of diverticulitis compared to the general population. Although more patients with severe psoriasis developed appendicitis or cholecystitis, the difference was not significant.
The pathogenesis of diverticulosis and diverticulitis has been thought to be related to increased intracolonic pressure and decreased dietary fiber intake, leading to formation of diverticula in the colon.19 Our study did not correct for differences in diet between the 2 groups, making it a possible confounding variable. Studies evaluating dietary habits of psoriatic patients have found that adult males with psoriasis might consume less fiber compared to healthy patients,20 and psoriasis patients also might consume less whole-grain fiber.21 Furthermore, fiber deficiency also might affect gut flora, causing low-grade chronic inflammation,18 which also has been supported by response to anti-inflammatory medications such as mesalazine.22 Given the autoimmune association between psoriasis and IBD, it is possible that psoriasis also might create an environment of chronic inflammation in the gut, predisposing patients with psoriasis to diverticulitis. However, further research is needed to better evaluate this possibility.
Our study also does not address any potential effects on outcomes of specific treatments for psoriasis. Brandl et al23 found that patients on immunosuppressive therapy for autoimmune diseases had longer hospital and intensive care unit stays, higher rates of emergency operations, and higher mortality while hospitalized. Because our results suggest that patients with severe psoriasis, who are therefore more likely to require treatment with an immunomodulator, are at higher risk for diverticulitis, these patients also might be at risk for poorer outcomes.
There is no literature evaluating the relationship between psoriasis and appendicitis. Our study found a slightly lower incidence rate compared to the national trend (9.38 per 10,000 patient-years in the United States in 2008) in both healthy patients and psoriasis patients.24 Of note, this statistic includes children, whereas our study did not, which might in part account for the lower rate. However, Cheluvappa et al25 hypothesized a relationship between appendicitis and subsequent appendectomy at a young age and protection against IBD. They also found that the mechanism for protection involves downregulation of the helper T cell (TH17) pathway,25 which also has been found to play a role in psoriasis pathogenesis.26,27 Although our results suggest that the risk for appendicitis is not increased for patients with psoriasis, further research might be able to determine if appendicitis and subsequent appendectomy also can offer protection against development of psoriasis.
We found that patients with severe psoriasis had a higher incidence rate of cholecystitis compared to patients with mild psoriasis. Egeberg et al28 found an increased risk for cholelithiasis among patients with psoriasis, which may contribute to a higher rate of cholecystitis. Although both acute and chronic cholecystitis were incorporated in this study, a Russian study found that chronic cholecystitis may be a predictor of progression of psoriasis.29 Moreover, patients with severe psoriasis had a shorter duration to diagnosis of cholecystitis than patients with mild psoriasis. It is possible that patients with severe psoriasis are in a state of greater chronic inflammation than those with mild psoriasis, and therefore, when combined with other risk factors for cholecystitis, may progress to disease more quickly. Alternatively, this finding could be treatment related, as there have been reported cases of cholecystitis related to etanercept use in patients treated for psoriasis and juvenile polyarticular rheumatoid arthritis.30,31 The relationship is not yet well defined, however, and further research is necessary to evaluate this association.
Study Strengths
Key strengths of this study include the large sample size and diversity of the patient population. Kaiser Permanente Southern California membership generally is representative of the broader community, making our results fairly generalizable to populations with health insurance. Use of a matched control cohort allows the results to be more specific to the disease of interest, and the population-based design minimizes bias.
Study Limitations
This study has several limitations. Although the cohorts were categorized based on type of treatment received, exact therapies were not specified. As a retrospective study, it is difficult to control for potential confounding variables that are not included in the electronic medical record. The results of this study also demonstrated significantly shorter durations to diagnosis of all 3 conditions, indicating that surveillance bias may be present.
Conclusion
Patients with psoriasis may be at an increased risk for diverticulitis compared to patients without psoriasis, which could be due to the chronic inflammatory state induced by psoriasis. Therefore, it may be beneficial for clinicians to evaluate psoriasis patients for other risk factors for diverticulitis and subsequently provide counseling to these patients to minimize their risk for diverticulitis. Psoriasis patients do not appear to be at an increased risk for appendicitis or cholecystitis compared to controls; however, further research is needed for confirmation.
Psoriasis is a chronic skin condition affecting approximately 2% to 3% of the population.1,2 Beyond cutaneous manifestations, psoriasis is a systemic inflammatory state that is associated with an increased risk for cardiovascular disease, including obesity,3,4 type 2 diabetes mellitus,5,6 hypertension,5 dyslipidemia,3,7 metabolic syndrome,7 atherosclerosis,8 peripheral vascular disease,9 coronary artery calcification,10 myocardial infarction,11-13 stroke,9,14 and cardiac death.15,16
Psoriasis also has been associated with inflammatory bowel disease (IBD), possibly because of similar autoimmune mechanisms in the pathogenesis of both diseases.17,18 However, there is no literature regarding the risk for acute gastrointestinal pathologies such as appendicitis, cholecystitis, or diverticulitis in patients with psoriasis.
The primary objective of this study was to examine if patients with psoriasis are at increased risk for appendicitis, cholecystitis, or diverticulitis compared to the general population. The secondary objective was to determine if patients with severe psoriasis (ie, patients treated with phototherapy or systemic therapy) are at a higher risk for these conditions compared to patients with mild psoriasis.
Methods
Patients and Tools
A descriptive, population-based cohort study design with controls from a matched cohort was used to ascertain the effect of psoriasis status on patients’ risk for appendicitis, cholecystitis, or diverticulitis. Our cohort was selected using administrative data from Kaiser Permanente Southern California (KPSC) during the study period (January 1, 2004, through December 31, 2016).
Kaiser Permanente Southern California is a large integrated health maintenance organization that includes approximately 4 million patients as of December 31, 2016, and includes roughly 20% of the region’s population. The geographic area served extends from Bakersfield in the lower California Central Valley to San Diego on the border with Mexico. Membership demographics, socioeconomic status, and ethnicity composition are representative of California.
Patients were included if they had a diagnosis of psoriasis (International Classification of Diseases, Ninth Revision, Clinical Modification [ICD-9-CM] code 696.1; International Classification of Diseases, Tenth Revision, Clinical Modification [ICD-10-CM] codes L40.0, L40.4, L40.8, or L40.9) for at least 3 visits between January 1, 2004, and December 31, 2016. Patients were not excluded if they also had a diagnosis of psoriatic arthritis (ICD-9-CM code 696.0; ICD-10-CM code L40.5x). Patients also must have been continuously enrolled for at least 1 year before and 1 year after the index date, which was defined as the date of the third psoriasis diagnosis.
Each patient with psoriasis was assigned to 1 of 2 cohorts: (1) severe psoriasis: patients who received UVB phototherapy, psoralen plus UVA phototherapy, methotrexate, acitretin, cyclosporine, apremilast, etanercept, adalimumab, infliximab, ustekinumab, efalizumab, alefacept, secukinumab, or ixekizumab during the study period; and (2) mild psoriasis: patients who had a diagnosis of psoriasis who did not receive one of these therapies during the study period.
Patients were excluded if they had a history of appendicitis, cholecystitis, or diverticulitis at any time before the index date. Only patients older than 18 years were included.
Patients with psoriasis were frequency matched (1:5) with healthy patients, also from the KPSC network. Individuals were matched by age, sex, and ethnicity.
Statistical Analysis
Baseline characteristics were described with means and SD for continuous variables as well as percentages for categorical variables. Chi-square tests for categorical variables and the Mann-Whitney U Test for continuous variables were used to compare the patients’ characteristics by psoriasis status. Cox proportional hazards regression models were used to examine the risk for appendicitis, cholecystitis, or diverticulitis among patients with and without psoriasis and among patients with mild and severe psoriasis. Proportionality assumption was validated using Pearson product moment correlation between the scaled Schoenfeld residuals and log transformed time for each covariate.
Results were presented as crude (unadjusted) hazard ratios (HRs) and adjusted HRs, where confounding factors (ie, age, sex, ethnicity, body mass index [BMI], alcohol use, smoking status, income, education, and membership length) were adjusted. All tests were performed with SAS EG 5.1 and R software. P<.05 was considered statistically significant. Results are reported with the 95% confidence interval (CI), when appropriate.
Results
A total of 1,690,214 KPSC patients were eligible for the study; 10,307 (0.6%) met diagnostic and inclusion criteria for the psoriasis cohort. Patients with psoriasis had a significantly higher mean BMI (29.9 vs 28.7; P<.0001) as well as higher mean rates of alcohol use (56% vs 53%; P<.0001) and smoking (47% vs 38%; P<.01) compared to controls. Psoriasis patients had a shorter average duration of membership within the Kaiser network (P=.0001) compared to controls.
A total of 7416 patients met criteria for mild psoriasis and 2891 patients met criteria for severe psoriasis (eTable). Patients with severe psoriasis were significantly younger and had significantly higher mean BMI compared to patients with mild psoriasis (P<.0001 and P=.0001, respectively). No significant difference in rates of alcohol or tobacco use was detected among patients with mild and severe psoriasis.
Appendicitis
The prevalence of appendicitis was not significantly different between patients with and without psoriasis or between patients with mild and severe psoriasis, though the incidence rate was slightly higher among patients with psoriasis (0.80 per 1000 patient-years compared to 0.62 per 1000 patient-years among patients without psoriasis)(Table 1). However, there was not a significant difference in risk for appendicitis between healthy patients, patients with severe psoriasis, and patients with mild psoriasis after adjusting for potential confounding factors (Table 2). Interestingly, patients with severe psoriasis who had a diagnosis of appendicitis had a significantly shorter time to diagnosis of appendicitis compared to patients with mild psoriasis (7.4 years vs 8.1 years; P<.0001).
Cholecystitis
Psoriasis patients also did not have an increased prevalence of cholecystitis compared to healthy patients. However, patients with severe psoriasis had a significantly higher prevalence of cholecystitis compared to patients with mild psoriasis (P=.0038). Overall, patients with psoriasis had a slightly higher incidence rate (1.72 per 1000 patient-years) compared to healthy patients (1.46 per 1000 patient-years). Moreover, the time to diagnosis of cholecystitis was significantly shorter for patients with severe psoriasis than for patients with mild psoriasis (7.4 years vs 8.1 years; P<.0001). Mild psoriasis was associated with a significantly increased risk (HR, 1.33; 95% CI, 1.09-1.63; P<.01) for cholecystitis compared to individuals without psoriasis in both the crude and adjusted models (Table 2). There was no difference between mild psoriasis patients and severe psoriasis patients in risk for cholecystitis.
Diverticulitis
Patients with psoriasis had a significantly greater prevalence of diverticulitis compared to the control cohort (5.1% vs 4.2%; P<.0001). There was no difference in prevalence between the severe psoriasis group and the mild psoriasis group (P=.96), but the time to diagnosis of diverticulitis was shorter in the severe psoriasis group than in the mild psoriasis group (7.2 years vs 7.9 years; P<.0001). Psoriasis patients had an incidence rate of diverticulitis of 6.61 per 1000 patient-years compared to 5.38 per 1000 patient-years in the control group. Psoriasis conferred a higher risk for diverticulitis in both the crude and adjusted models (HR, 1.23; 95% CI, 1.11-1.35 [P<.001] and HR, 1.16; 95% CI, 1.05-1.29; [P<.01], respectively)(Table 3); however, when stratified by disease severity, only patients with severe psoriasis were found to be at higher risk (HR, 1.26; 95% CI, 1.15-1.61; P<.001 for the adjusted model).
Comment
The objective of this study was to examine the background risks for specific gastrointestinal pathologies in a large cohort of patients with psoriasis compared to the general population. After adjusting for measured confounders, patients with severe psoriasis had a significantly higher risk of diverticulitis compared to the general population. Although more patients with severe psoriasis developed appendicitis or cholecystitis, the difference was not significant.
The pathogenesis of diverticulosis and diverticulitis has been thought to be related to increased intracolonic pressure and decreased dietary fiber intake, leading to formation of diverticula in the colon.19 Our study did not correct for differences in diet between the 2 groups, making it a possible confounding variable. Studies evaluating dietary habits of psoriatic patients have found that adult males with psoriasis might consume less fiber compared to healthy patients,20 and psoriasis patients also might consume less whole-grain fiber.21 Furthermore, fiber deficiency also might affect gut flora, causing low-grade chronic inflammation,18 which also has been supported by response to anti-inflammatory medications such as mesalazine.22 Given the autoimmune association between psoriasis and IBD, it is possible that psoriasis also might create an environment of chronic inflammation in the gut, predisposing patients with psoriasis to diverticulitis. However, further research is needed to better evaluate this possibility.
Our study also does not address any potential effects on outcomes of specific treatments for psoriasis. Brandl et al23 found that patients on immunosuppressive therapy for autoimmune diseases had longer hospital and intensive care unit stays, higher rates of emergency operations, and higher mortality while hospitalized. Because our results suggest that patients with severe psoriasis, who are therefore more likely to require treatment with an immunomodulator, are at higher risk for diverticulitis, these patients also might be at risk for poorer outcomes.
There is no literature evaluating the relationship between psoriasis and appendicitis. Our study found a slightly lower incidence rate compared to the national trend (9.38 per 10,000 patient-years in the United States in 2008) in both healthy patients and psoriasis patients.24 Of note, this statistic includes children, whereas our study did not, which might in part account for the lower rate. However, Cheluvappa et al25 hypothesized a relationship between appendicitis and subsequent appendectomy at a young age and protection against IBD. They also found that the mechanism for protection involves downregulation of the helper T cell (TH17) pathway,25 which also has been found to play a role in psoriasis pathogenesis.26,27 Although our results suggest that the risk for appendicitis is not increased for patients with psoriasis, further research might be able to determine if appendicitis and subsequent appendectomy also can offer protection against development of psoriasis.
We found that patients with severe psoriasis had a higher incidence rate of cholecystitis compared to patients with mild psoriasis. Egeberg et al28 found an increased risk for cholelithiasis among patients with psoriasis, which may contribute to a higher rate of cholecystitis. Although both acute and chronic cholecystitis were incorporated in this study, a Russian study found that chronic cholecystitis may be a predictor of progression of psoriasis.29 Moreover, patients with severe psoriasis had a shorter duration to diagnosis of cholecystitis than patients with mild psoriasis. It is possible that patients with severe psoriasis are in a state of greater chronic inflammation than those with mild psoriasis, and therefore, when combined with other risk factors for cholecystitis, may progress to disease more quickly. Alternatively, this finding could be treatment related, as there have been reported cases of cholecystitis related to etanercept use in patients treated for psoriasis and juvenile polyarticular rheumatoid arthritis.30,31 The relationship is not yet well defined, however, and further research is necessary to evaluate this association.
Study Strengths
Key strengths of this study include the large sample size and diversity of the patient population. Kaiser Permanente Southern California membership generally is representative of the broader community, making our results fairly generalizable to populations with health insurance. Use of a matched control cohort allows the results to be more specific to the disease of interest, and the population-based design minimizes bias.
Study Limitations
This study has several limitations. Although the cohorts were categorized based on type of treatment received, exact therapies were not specified. As a retrospective study, it is difficult to control for potential confounding variables that are not included in the electronic medical record. The results of this study also demonstrated significantly shorter durations to diagnosis of all 3 conditions, indicating that surveillance bias may be present.
Conclusion
Patients with psoriasis may be at an increased risk for diverticulitis compared to patients without psoriasis, which could be due to the chronic inflammatory state induced by psoriasis. Therefore, it may be beneficial for clinicians to evaluate psoriasis patients for other risk factors for diverticulitis and subsequently provide counseling to these patients to minimize their risk for diverticulitis. Psoriasis patients do not appear to be at an increased risk for appendicitis or cholecystitis compared to controls; however, further research is needed for confirmation.
- Parisi R, Symmons DP, Griffiths CE, et al; Identification and Management of Psoriasis and Associated ComorbidiTy (IMPACT) project team. Global epidemiology of psoriasis: a systematic review of incidence and prevalence. J Invest Dermatol. 2013;133:377-385.
- Channual J, Wu JJ, Dann FJ. Effects of tumor necrosis factor-α blockade on metabolic syndrome in psoriasis and psoriatic arthritis and additional lessons learned from rheumatoid arthritis. Dermatol Ther. 2009;22:61-73.
- Koebnick C, Black MH, Smith N, et al. The association of psoriasis and elevated blood lipids in overweight and obese children. J Pediatr. 2011;159:577-583.
- Herron MD, Hinckley M, Hoffman MS, et al. Impact of obesity and smoking on psoriasis presentation and management. Arch Dermatol. 2005;141:1527-1534.
- Qureshi AA, Choi HK, Setty AR, et al. Psoriasis and the risk of diabetes and hypertension: a prospective study of US female nurses. Arch Dermatol. 2009;145:379-382.
- Shapiro J, Cohen AD, David M, et al. The association between psoriasis, diabetes mellitus, and atherosclerosis in Israel: a case-control study. J Am Acad Dermatol. 2007;56:629-634.
- Love TJ, Qureshi AA, Karlson EW, et al. Prevalence of the metabolic syndrome in psoriasis: results from the National Health and Nutrition Examination Survey, 2003-2006. Arch Dermatol. 2011;147:419-424.
- El-Mongy S, Fathy H, Abdelaziz A, et al. Subclinical atherosclerosis in patients with chronic psoriasis: a potential association. J Eur Acad Dermatol Venereol. 2010;24:661-666.
- Prodanovich S, Kirsner RS, Kravetz JD, et al. Association of psoriasis with coronary artery, cerebrovascular, and peripheral vascular diseases and mortality. Arch Dermatol. 2009;145:700-703.
- Ludwig RJ, Herzog C, Rostock A, et al. Psoriasis: a possible risk factor for development of coronary artery calcification. Br J Dermatol. 2007;156:271-276.
- Kaye JA, Li L, Jick SS. Incidence of risk factors for myocardial infarction and other vascular diseases in patients with psoriasis. Br J Dermatol. 2008;159:895-902.
- Kimball AB, Robinson D Jr, Wu Y, et al. Cardiovascular disease and risk factors among psoriasis patients in two US healthcare databases, 2001-2002. Dermatology. 2008;217:27-37.
- Gelfand JM, Neimann AL, Shin DB, et al. Risk of myocardial infarction in patients with psoriasis. JAMA. 2006;296:1735-1741.
- Gelfand JM, Dommasch ED, Shin DB, et al. The risk of stroke in patients with psoriasis. J Invest Dermatol. 2009;129:2411-2418.
- Mehta NN, Azfar RS, Shin DB, et al. Patients with severe psoriasis are at increased risk of cardiovascular mortality: cohort study using the General Practice Research Database. Eur Heart J. 2010;31:1000-1006.
- Abuabara K, Azfar RS, Shin DB, et al. Cause-specific mortality in patients with severe psoriasis: a population-based cohort study in the United Kingdom. Br J Dermatol. 2010;163:586-592.
- Christophers E. Comorbidities in psoriasis. Clin Dermatol. 2007;25:529-534.
- Wu JJ, Nguyen TU, Poon KY, et al. The association of psoriasis with autoimmune diseases. J Am Acad Dermatol. 2012;67:924-930.
- Floch MH, Bina I. The natural history of diverticulitis: fact and theory. Clin Gastroenterol. 2004;38(5, suppl 1):S2-S7.
- Barrea L, Macchia PE, Tarantino G, et al. Nutrition: a key environmental dietary factor in clinical severity and cardio-metabolic risk in psoriatic male patients evaluated by 7-day food-frequency questionnaire. J Transl Med. 2015;13:303.
- Afifi L, Danesh MJ, Lee KM, et al. Dietary behaviors in psoriasis: patient-reported outcomes from a U.S. National Survey. Dermatol Ther (Heidelb). 2017;7:227-242.
- Matrana MR, Margolin DA. Epidemiology and pathophysiology of diverticular disease. Clin Colon Rectal Surg. 2009;22:141-146.
- Brandl A, Kratzer T, Kafka-Ritsch R, et al. Diverticulitis in immunosuppressed patients: a fatal outcome requiring a new approach? Can J Surg. 2016;59:254-261.
- Buckius MT, McGrath B, Monk J, et al. Changing epidemiology of acute appendicitis in the United States: study period 1993-2008. J Surg Res. 2012;175:185-190.
- Cheluvappa R, Luo AS, Grimm MC. T helper type 17 pathway suppression by appendicitis and appendectomy protects against colitis. Clin Exp Immunol. 2014;175:316-322.
- Lynde CW, Poulin Y, Vender R, et al. Interleukin 17A: toward a new understanding of psoriasis pathogenesis. J Am Acad Dermatol. 2014;71:141-150.
- Arican O, Aral M, Sasmaz S, et al. Serum levels of TNF-α, IFN-γ, IL6, IL-8, IL-12, IL-17, and IL-18 in patients with active psoriasis and correlation with disease severity. Mediators Inflamm. 2005:2005;273-279.
- Egeberg A, Anderson YMF, Gislason GH, et al. Gallstone risk in adult patients with atopic dermatitis and psoriasis: possible effect of overweight and obesity. Acta Derm Venereol. 2017;97:627-631.
- Smirnova SV, Barilo AA, Smolnikova MV. Hepatobiliary system diseases as the predictors of psoriasis progression [in Russian]. Vestn Ross Akad Med Nauk. 2016:102-108.
- Bagel J, Lynde C, Tyring S, et al. Moderate to severe plaque psoriasis with scalp involvement: a randomized, double-blind, placebo-controlled study of etanercept. J Am Acad Dermatol. 2012;67:86-92.
- Foeldvari I, Krüger E, Schneider T. Acute, non-obstructive, sterile cholecystitis associated with etanercept and infliximab for the treatment of juvenile polyarticular rheumatoid arthritis. Ann Rheum Dis. 2003;62:908-909.
Practice Points
- Patients with psoriasis may have elevated risk of diverticulitis compared to healthy patients. However, psoriasis patients do not appear to have increased risk of appendicitis or cholecystitis.
- Clinicians treating psoriasis patients should consider assessing for other risk factors of diverticulitis at regular intervals.
Cutaneous Rosai-Dorfman Disease
Case Report
A 31-year-old black woman presented with a slow-spreading pruritic rash on the right thigh of 1 year’s duration. She had previously seen a dermatologist and was prescribed triamcinolone acetonide cream 0.1% and mupirocin ointment 2% but declined a biopsy. Review of symptoms was negative for any constitutional symptoms. Family history included hypertension and eczema with a personal history of anxiety. Clinical examination revealed grouped flesh-colored to light pink papules and plaques within a hyperpigmented patch on the right medial thigh (Figure 1).
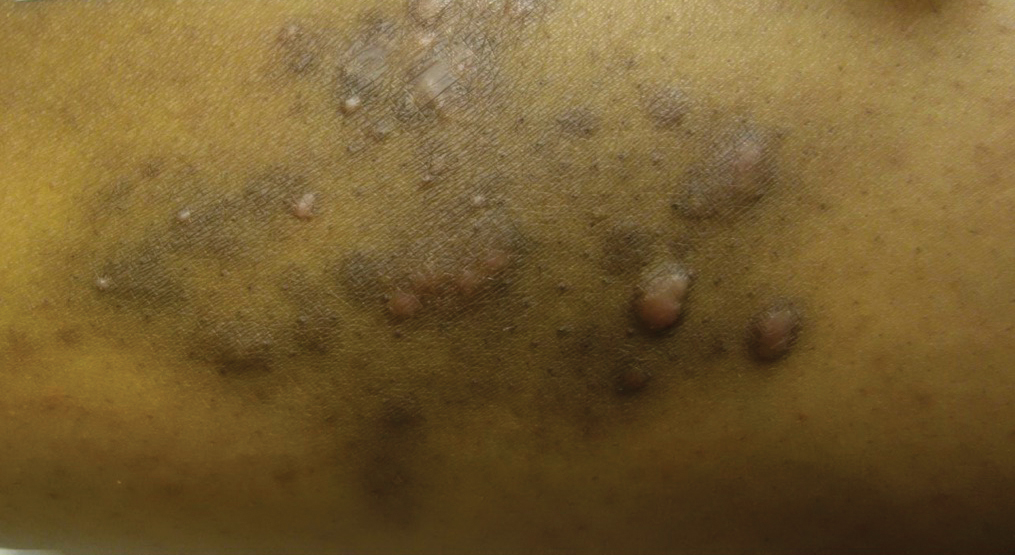
Histopathology
A punch biopsy was negative for fungal, bacterial, or acid-fast bacilli culture. Histopathologic evaluation demonstrated a dense dermal infiltrate of large histiocytes admixed with inflammatory cells composed predominantly of lymphocytes and plasma cells. The histiocytes within the inflammatory infiltrate had vesicular nuclei and abundant eosinophilic cytoplasm (Figure 2A). Areas of emperipolesis were noted (Figure 2B). The large histiocytes stained positive for S-100 protein (Figure 2C) and negative for CD1a.
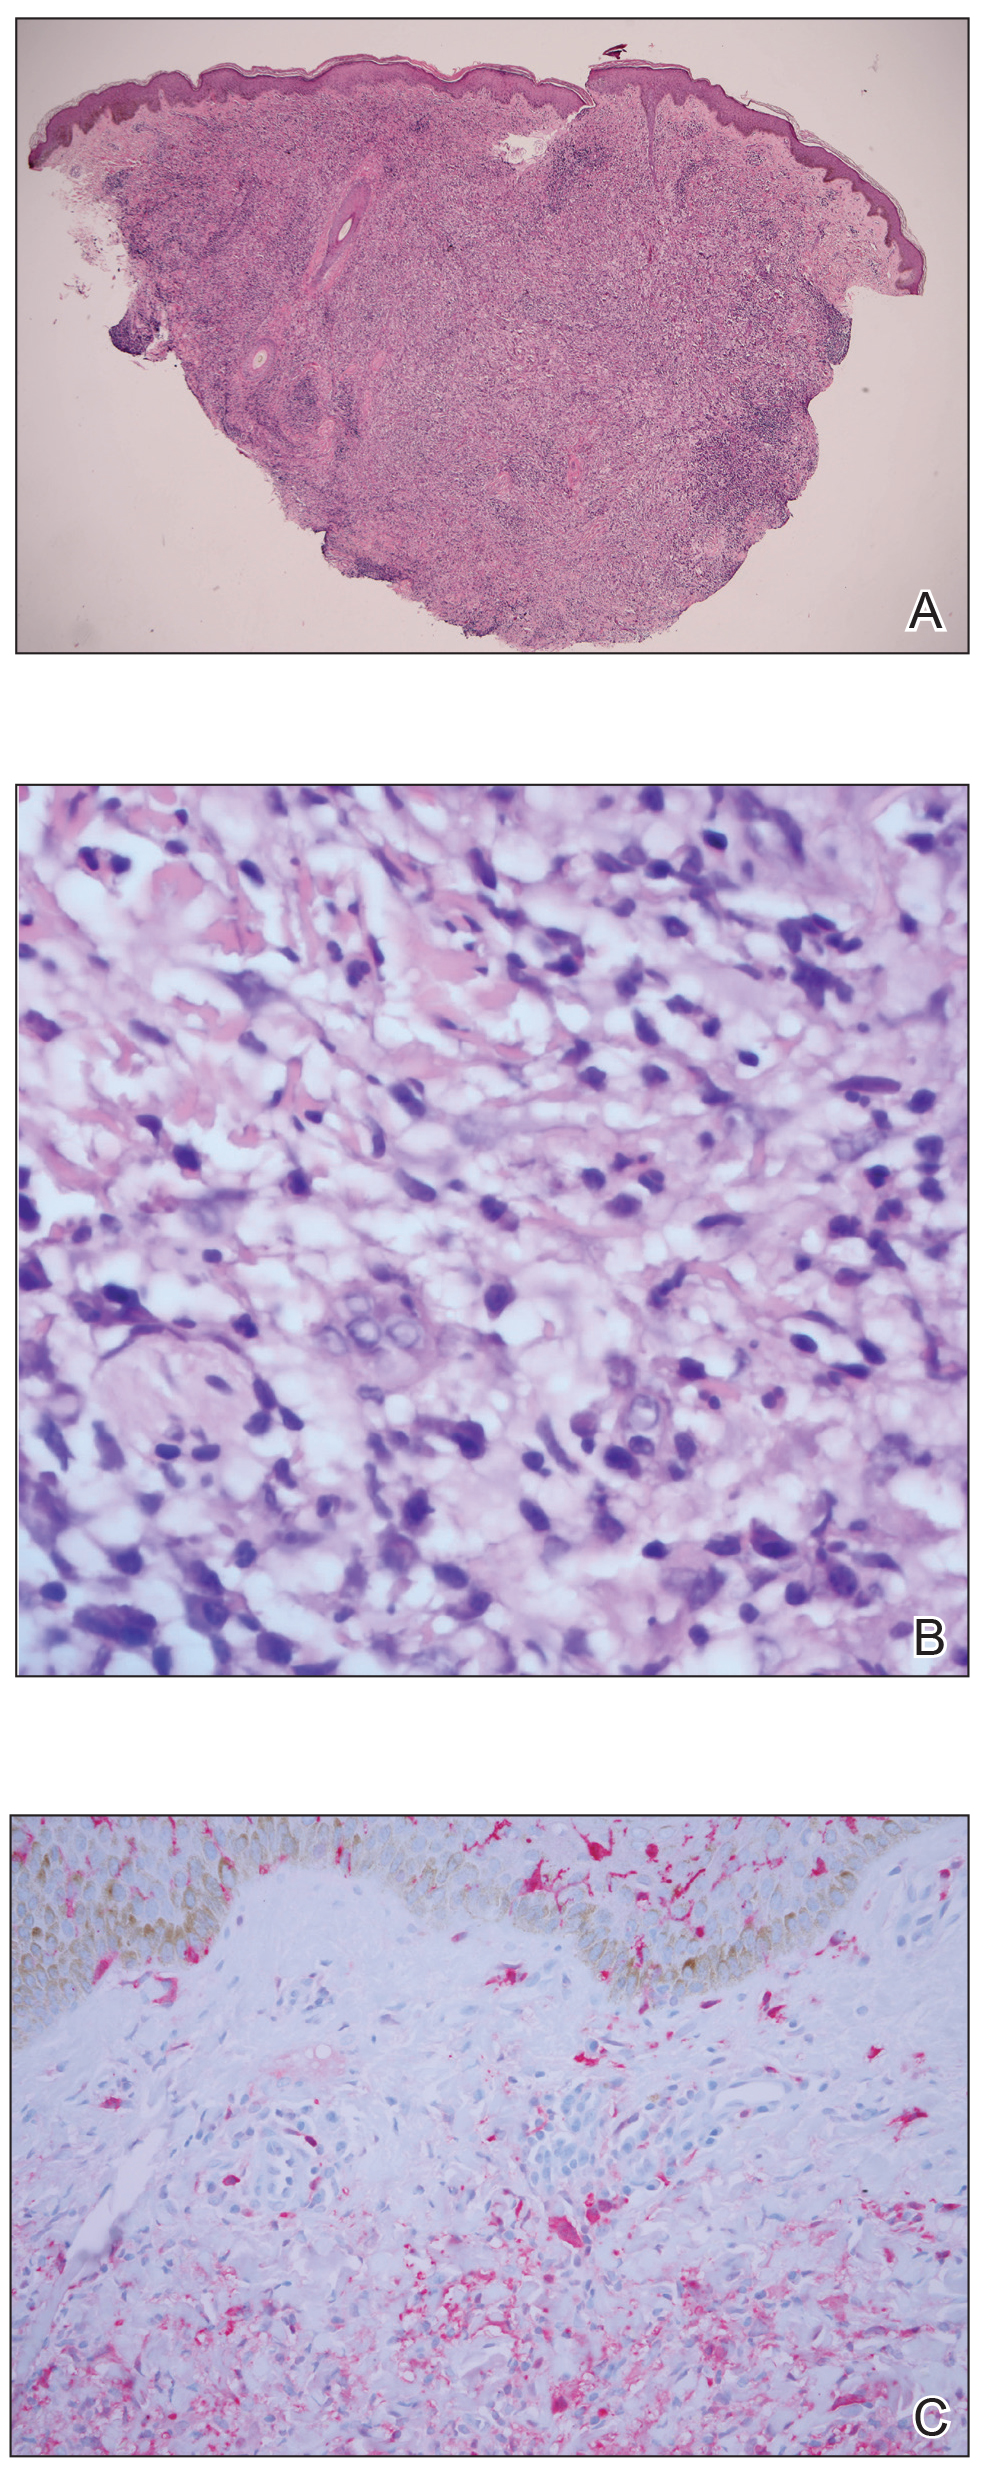
Course and Treatment
Laboratory studies revealed leukopenia. Prior to histopathologic results, empiric treatment was started with doxycycline 100 mg twice daily for 2 weeks. Once pathology confirmed the diagnosis of Rosai-Dorfman disease (RDD), computed tomography of the chest, abdomen, and pelvis was performed and within normal limits. Due to the lack of systemic involvement, we diagnosed the rare form of purely cutaneous Rosai-Dorfman disease (CRDD). In subsequent visits, treatment with oral prednisone (40 mg daily for 1 week followed by 20 mg daily for 1 week) and intralesional triamcinolone acetonide (5 areas on the right medial thigh were injected with 1.0 mL of 10 mg/mL) was attempted with mild improvement, though the patient declined surgical excision.
Comment
Rosai-Dorfman disease (also known as sinus histiocytosis with massive lymphadenopathy) is a non–Langerhans cell histiocytosis.1 There are 2 main forms of RDD: one form that affects the lymph nodes and in certain cases the extranodal organs, and the other is purely CRDD. Cutaneous RDD is extremely rare and the etiology is unknown, though a number of viral and immune causes have been postulated. Cutaneous RDD presents as solitary or numerous papules, nodules, and/or plaques. Treatment options include steroids, methotrexate, dapsone, thalidomide, and isotretinoin, with varying efficacy reported.1
Extranodal forms occur in 43% of RDD cases, with the skin being the most common site.1 Other extranodal sites include the soft tissue, upper and lower respiratory tract, bones, genitourinary tract, oral cavity, gastrointestinal tract, orbits, testes, and rarely central nervous system involvement.2
Approximately 10% of RDD patients exhibit skin lesions, and in 3% it is contained solely in the skin.3 Pure CRDD was first documented in 1978 by Thawerani et al4 who presented the case of a 48-year-old man with a solitary nodule on the shoulder.
Cutaneous RDD and RDD may be distinct clinical entities. Cutaneous RDD has a later age of onset than RDD (median age, 43.5 years vs 20.6 years) and a female predominance (2:1 vs 1.4:1). It most commonly affects Asian and white individuals while the majority of patients with RDD are of African descent with rare reports in Asians.1
The etiology of CRDD remains unknown with hypotheses of viral and immune causes such as human herpesvirus 6, Epstein-Barr virus, and parvovirus B19. The polyclonal nature of the cell infiltrate and the clinical progression of RDD suggest a reactive process rather than a neoplastic disorder.1 Rosai-Dorfman disease has been hypothesized to be closely related to autoimmune lymphoproliferative syndrome, an inherited disorder associated with defects in Fas-mediated apoptosis.5
Histologic findings in CRDD are similar to those in RDD, with a superficial and deep perivascular infiltrate of lymphocytes and plasma cells. A diffuse and nodular dermal infiltrate of foamy histiocytes exists in a background infiltrate of lymphocytes and plasma cells. Foamy histiocytes may be seen in dermal lymphatics, and lymphoid follicles with reactive germinal centers also may be present. Emperipolesis, the presence of intact inflammatory cells within histiocytes, is common in CRDD. Less often, histiocytes may contain plasma cells, neutrophils, and red blood cells. Mitoses and nuclear atypia are rare. Cutaneous RDD histiocytes stain positive for S-100 protein, CD4, factor XIIIa, and CD68, and negative for CD1a. Birbeck granules are absent on electronic microscopy of CRDD tissue, eliminating Langerhans cell histiocytosis.1,3,5
The clinical diagnosis of CRDD is hard to confirm in the absence of lymphadenopathy. The lesions in CRDD may be solitary or numerous, usually presenting as papules, nodules, and/or plaques. More rarely, the lesions may present as pustules, acneform lesions, mimickers of vasculitis and panniculitis, macular erythema, large annular lesions resembling granuloma annulare, or even a breast mass.1,3 One case report with involvement of deep subcutaneous fat presented with flank swelling beneath papules and nodules.6
The most common site of lesions in CRDD is the face, with the eyelids and malar regions frequently involved, followed by the back, chest, thighs, flanks, and shoulders.1,5 Rarely, CRDD may be associated with other disorders, including bilateral uveitis, antinuclear antibody–positive lupus erythematosus, rheumatoid arthritis, hypothyroidism, lymphoma, and human immunodeficiency virus.1
Numerous treatments have been attempted, yet the response often is poor. Because RDD is a benign and self-limiting disease, less aggressive therapeutic approaches should be used, if possible. Surgical excision of the lesions has been helpful in certain cases.6 Cryotherapy and local radiation, topical steroids, or laser treatment also have been found to improve the condition.1,7 For refractory cases, dapsone and thalidomide have been effective. Mixed results have been observed with isotretinoin and imatinib; some patients improved whereas others did not. Utikal et al8 described a patient with complete remission of CRDD after receiving imatinib therapy; however, a different study reported a patient with CRDD who was completely resistant to this treatment.9 One case presenting on the breast did not respond to topical steroids, acitretin, and thalidomide but later responded to methotrexate.10
Conclusion
Cutaneous RDD is an unusual clinical entity with varied lesions. Generally, CRDD follows a benign clinical course, with a possibility of spontaneous remission. Further studies are required to confidently classify the etiology and variance between both RDD and CRDD.
- Fang S, Chen AJ. Facial cutaneous Rosai-Dorfman disease: a case report and literature review [published online February 5, 2015]. Exp Ther Med. 2015;9:1389-1392.
- Chen A, Fernedez A, Janik M, et al. Cutaneous Rosai-Dorfman disease. J Am Acad Dermatol. 2012;66:AB48.
- James WD, Berger T, Elston D, et al. Andrews’ Diseases of the Skin. 12th ed. Philadelphia, PA: Elsevier; 2015.
- Thawerani H, Sanchez RL, Rosai J, et al. The cutaneous manifestations of sinus histiocytosis with massive lymphadenopathy. Arch Dermatol. 1978;114:191-197.
- Bolognia JL, Jorizzo JL, Schaffer JV, et al, eds. Dermatology. 3rd ed. Philadelphia, PA: Elsevier; 2012.
- Al Salamah SM, Abdullah M, Al Salamah RA, et al. Cutaneous Rosai-Dorfman disease presenting as a flank swelling. Int J Health Sci. 2014;8:434-438.
- Khan A, Musbahi E, Suchak R, et al. Cutaneous Rosai-Dorfman disease treated by surgical excision and a review of the literature. J Am Acad Dermatol. 2015;72:AB259.
- Utikal J, Ugurel S, Kurzen H, et al. Imatinib as a treatment option forsystemic non-Langerhans cell histiocytosis. Arch Dermatol. 2007;143:736-740.
- Gebhardt C, Averbeck M, Paasch V, et al. A case of cutaneous Rosai-Dorfman disease refractory to imatinib therapy. Arch Dermatol. 2009;145:571-574.
- Nadal M, Kervarrec T, Machet MC, et al. Cutaneous Rosai-Dorfman disease located on the breast: rapid effectiveness of methotrexate after failure of topical corticosteroids, acitretin and thalidomide. Acta Derm Venereol. 2015;95:758-759.
Case Report
A 31-year-old black woman presented with a slow-spreading pruritic rash on the right thigh of 1 year’s duration. She had previously seen a dermatologist and was prescribed triamcinolone acetonide cream 0.1% and mupirocin ointment 2% but declined a biopsy. Review of symptoms was negative for any constitutional symptoms. Family history included hypertension and eczema with a personal history of anxiety. Clinical examination revealed grouped flesh-colored to light pink papules and plaques within a hyperpigmented patch on the right medial thigh (Figure 1).
Histopathology
A punch biopsy was negative for fungal, bacterial, or acid-fast bacilli culture. Histopathologic evaluation demonstrated a dense dermal infiltrate of large histiocytes admixed with inflammatory cells composed predominantly of lymphocytes and plasma cells. The histiocytes within the inflammatory infiltrate had vesicular nuclei and abundant eosinophilic cytoplasm (Figure 2A). Areas of emperipolesis were noted (Figure 2B). The large histiocytes stained positive for S-100 protein (Figure 2C) and negative for CD1a.
Course and Treatment
Laboratory studies revealed leukopenia. Prior to histopathologic results, empiric treatment was started with doxycycline 100 mg twice daily for 2 weeks. Once pathology confirmed the diagnosis of Rosai-Dorfman disease (RDD), computed tomography of the chest, abdomen, and pelvis was performed and within normal limits. Due to the lack of systemic involvement, we diagnosed the rare form of purely cutaneous Rosai-Dorfman disease (CRDD). In subsequent visits, treatment with oral prednisone (40 mg daily for 1 week followed by 20 mg daily for 1 week) and intralesional triamcinolone acetonide (5 areas on the right medial thigh were injected with 1.0 mL of 10 mg/mL) was attempted with mild improvement, though the patient declined surgical excision.
Comment
Rosai-Dorfman disease (also known as sinus histiocytosis with massive lymphadenopathy) is a non–Langerhans cell histiocytosis.1 There are 2 main forms of RDD: one form that affects the lymph nodes and in certain cases the extranodal organs, and the other is purely CRDD. Cutaneous RDD is extremely rare and the etiology is unknown, though a number of viral and immune causes have been postulated. Cutaneous RDD presents as solitary or numerous papules, nodules, and/or plaques. Treatment options include steroids, methotrexate, dapsone, thalidomide, and isotretinoin, with varying efficacy reported.1
Extranodal forms occur in 43% of RDD cases, with the skin being the most common site.1 Other extranodal sites include the soft tissue, upper and lower respiratory tract, bones, genitourinary tract, oral cavity, gastrointestinal tract, orbits, testes, and rarely central nervous system involvement.2
Approximately 10% of RDD patients exhibit skin lesions, and in 3% it is contained solely in the skin.3 Pure CRDD was first documented in 1978 by Thawerani et al4 who presented the case of a 48-year-old man with a solitary nodule on the shoulder.
Cutaneous RDD and RDD may be distinct clinical entities. Cutaneous RDD has a later age of onset than RDD (median age, 43.5 years vs 20.6 years) and a female predominance (2:1 vs 1.4:1). It most commonly affects Asian and white individuals while the majority of patients with RDD are of African descent with rare reports in Asians.1
The etiology of CRDD remains unknown with hypotheses of viral and immune causes such as human herpesvirus 6, Epstein-Barr virus, and parvovirus B19. The polyclonal nature of the cell infiltrate and the clinical progression of RDD suggest a reactive process rather than a neoplastic disorder.1 Rosai-Dorfman disease has been hypothesized to be closely related to autoimmune lymphoproliferative syndrome, an inherited disorder associated with defects in Fas-mediated apoptosis.5
Histologic findings in CRDD are similar to those in RDD, with a superficial and deep perivascular infiltrate of lymphocytes and plasma cells. A diffuse and nodular dermal infiltrate of foamy histiocytes exists in a background infiltrate of lymphocytes and plasma cells. Foamy histiocytes may be seen in dermal lymphatics, and lymphoid follicles with reactive germinal centers also may be present. Emperipolesis, the presence of intact inflammatory cells within histiocytes, is common in CRDD. Less often, histiocytes may contain plasma cells, neutrophils, and red blood cells. Mitoses and nuclear atypia are rare. Cutaneous RDD histiocytes stain positive for S-100 protein, CD4, factor XIIIa, and CD68, and negative for CD1a. Birbeck granules are absent on electronic microscopy of CRDD tissue, eliminating Langerhans cell histiocytosis.1,3,5
The clinical diagnosis of CRDD is hard to confirm in the absence of lymphadenopathy. The lesions in CRDD may be solitary or numerous, usually presenting as papules, nodules, and/or plaques. More rarely, the lesions may present as pustules, acneform lesions, mimickers of vasculitis and panniculitis, macular erythema, large annular lesions resembling granuloma annulare, or even a breast mass.1,3 One case report with involvement of deep subcutaneous fat presented with flank swelling beneath papules and nodules.6
The most common site of lesions in CRDD is the face, with the eyelids and malar regions frequently involved, followed by the back, chest, thighs, flanks, and shoulders.1,5 Rarely, CRDD may be associated with other disorders, including bilateral uveitis, antinuclear antibody–positive lupus erythematosus, rheumatoid arthritis, hypothyroidism, lymphoma, and human immunodeficiency virus.1
Numerous treatments have been attempted, yet the response often is poor. Because RDD is a benign and self-limiting disease, less aggressive therapeutic approaches should be used, if possible. Surgical excision of the lesions has been helpful in certain cases.6 Cryotherapy and local radiation, topical steroids, or laser treatment also have been found to improve the condition.1,7 For refractory cases, dapsone and thalidomide have been effective. Mixed results have been observed with isotretinoin and imatinib; some patients improved whereas others did not. Utikal et al8 described a patient with complete remission of CRDD after receiving imatinib therapy; however, a different study reported a patient with CRDD who was completely resistant to this treatment.9 One case presenting on the breast did not respond to topical steroids, acitretin, and thalidomide but later responded to methotrexate.10
Conclusion
Cutaneous RDD is an unusual clinical entity with varied lesions. Generally, CRDD follows a benign clinical course, with a possibility of spontaneous remission. Further studies are required to confidently classify the etiology and variance between both RDD and CRDD.
- Fang S, Chen AJ. Facial cutaneous Rosai-Dorfman disease: a case report and literature review [published online February 5, 2015]. Exp Ther Med. 2015;9:1389-1392.
- Chen A, Fernedez A, Janik M, et al. Cutaneous Rosai-Dorfman disease. J Am Acad Dermatol. 2012;66:AB48.
- James WD, Berger T, Elston D, et al. Andrews’ Diseases of the Skin. 12th ed. Philadelphia, PA: Elsevier; 2015.
- Thawerani H, Sanchez RL, Rosai J, et al. The cutaneous manifestations of sinus histiocytosis with massive lymphadenopathy. Arch Dermatol. 1978;114:191-197.
- Bolognia JL, Jorizzo JL, Schaffer JV, et al, eds. Dermatology. 3rd ed. Philadelphia, PA: Elsevier; 2012.
- Al Salamah SM, Abdullah M, Al Salamah RA, et al. Cutaneous Rosai-Dorfman disease presenting as a flank swelling. Int J Health Sci. 2014;8:434-438.
- Khan A, Musbahi E, Suchak R, et al. Cutaneous Rosai-Dorfman disease treated by surgical excision and a review of the literature. J Am Acad Dermatol. 2015;72:AB259.
- Utikal J, Ugurel S, Kurzen H, et al. Imatinib as a treatment option forsystemic non-Langerhans cell histiocytosis. Arch Dermatol. 2007;143:736-740.
- Gebhardt C, Averbeck M, Paasch V, et al. A case of cutaneous Rosai-Dorfman disease refractory to imatinib therapy. Arch Dermatol. 2009;145:571-574.
- Nadal M, Kervarrec T, Machet MC, et al. Cutaneous Rosai-Dorfman disease located on the breast: rapid effectiveness of methotrexate after failure of topical corticosteroids, acitretin and thalidomide. Acta Derm Venereol. 2015;95:758-759.
Practice Points
- Rosai-Dorfman disease generally is characterized by painless cervical lymphadenopathy and systemic involvement.
- Cutaneous Rosai-Dorfman disease can clinically present with great variety, mimicking many other dermatologic conditions.
- Patients presenting with cutaneous lesions and lymphadenopathy warrant workup with systemic imaging.
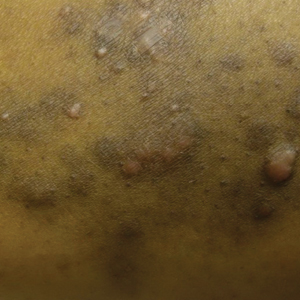
Vaginal and Scrotal Rejuvenation: The Potential Role of Dermatologists in Genital Rejuvenation
To the Editor:
I read with interest the informative Cutis article by Hashim et al,1 which not only summarized the key features of vaginal rejuvenation but also concisely reviewed noninvasive treatments, including lasers and radiofrequency devices, that can be used to address this important issue. The authors emphasized that these treatments may represent a valuable addition to the cosmetic landscape. In addition, they also asserted that noninvasive vaginal rejuvenation is an expanding focus of cosmetic dermatology.1
Genital rejuvenation includes rejuvenation of the vagina in women and the scrotum in men. Since the term initially appeared in the literature in 2007,2 a PubMed search of articles indexed for MEDLINE yields an increasing number of articles on vaginal rejuvenation. More recently, the concept of scrotal rejuvenation was introduced in 2018.3
Similar to vaginal rejuvenation, scrotal rejuvenation includes procedures to remedy medical or cosmetic conditions of the scrotum. Hashim et al1 focused on morphology-associated vaginal changes for which rejuvenation techniques have been successful, such as excess clitoral hood; excess labia majora or minora; vaginal laxity; and vulvovaginal atrophy, which is considered to be a component of genitourinary syndrome of menopause. Morphology-associated changes of the scrotum include wrinkling (cutis scrotum gyratum or scrotum rugosum) and laxity (low-hanging or sagging scrotum or scrotomegaly
Intrinsic (aging) and extrinsic (trauma) alterations also can result in other changes that may be amenable to vaginal or scrotal rejuvenation; for example, in addition to changes in morphology, there are hair (eg, alopecia, hypertrichosis) and vascular (eg, angiokeratomas) conditions of the vagina and scrotum that may be suitable for rejuvenation.3-5 Dermatologists have the opportunity to provide treatment for the genital rejuvenation of their patients.
- Hashim PW, Nia JK, Zade J, et al. Noninvasive vaginal rejuvenation. Cutis. 2018;102:243-246.
- Committee on Gynecologic Practice, American College of Obstetricians and Gynecologists. ACOG Committee Opinion No. 378: vaginal “rejuvenation” and cosmetic vaginal procedures. Obstet Gynecol. 2007;110:737-738.
- Cohen PR. Scrotal rejuvenation. Cureus. 2018;10:e2316.
- Cohen PR. Genital rejuvenation: the next frontier in medical and cosmetic dermatology. Dermatol Online J. 2018:24. http://escholarship.org/uc/item/27v774t5. Accessed February 15, 2018.
- Cohen PR. A case report of scrotal rejuvenation: laser treatment of angiokeratomas of the scrotum [published online November 26, 2018]. Dermatol Ther (Heidelb). doi:10.1007/s13555-018-0272-z.
To the Editor:
I read with interest the informative Cutis article by Hashim et al,1 which not only summarized the key features of vaginal rejuvenation but also concisely reviewed noninvasive treatments, including lasers and radiofrequency devices, that can be used to address this important issue. The authors emphasized that these treatments may represent a valuable addition to the cosmetic landscape. In addition, they also asserted that noninvasive vaginal rejuvenation is an expanding focus of cosmetic dermatology.1
Genital rejuvenation includes rejuvenation of the vagina in women and the scrotum in men. Since the term initially appeared in the literature in 2007,2 a PubMed search of articles indexed for MEDLINE yields an increasing number of articles on vaginal rejuvenation. More recently, the concept of scrotal rejuvenation was introduced in 2018.3
Similar to vaginal rejuvenation, scrotal rejuvenation includes procedures to remedy medical or cosmetic conditions of the scrotum. Hashim et al1 focused on morphology-associated vaginal changes for which rejuvenation techniques have been successful, such as excess clitoral hood; excess labia majora or minora; vaginal laxity; and vulvovaginal atrophy, which is considered to be a component of genitourinary syndrome of menopause. Morphology-associated changes of the scrotum include wrinkling (cutis scrotum gyratum or scrotum rugosum) and laxity (low-hanging or sagging scrotum or scrotomegaly
Intrinsic (aging) and extrinsic (trauma) alterations also can result in other changes that may be amenable to vaginal or scrotal rejuvenation; for example, in addition to changes in morphology, there are hair (eg, alopecia, hypertrichosis) and vascular (eg, angiokeratomas) conditions of the vagina and scrotum that may be suitable for rejuvenation.3-5 Dermatologists have the opportunity to provide treatment for the genital rejuvenation of their patients.
- Hashim PW, Nia JK, Zade J, et al. Noninvasive vaginal rejuvenation. Cutis. 2018;102:243-246.
- Committee on Gynecologic Practice, American College of Obstetricians and Gynecologists. ACOG Committee Opinion No. 378: vaginal “rejuvenation” and cosmetic vaginal procedures. Obstet Gynecol. 2007;110:737-738.
- Cohen PR. Scrotal rejuvenation. Cureus. 2018;10:e2316.
- Cohen PR. Genital rejuvenation: the next frontier in medical and cosmetic dermatology. Dermatol Online J. 2018:24. http://escholarship.org/uc/item/27v774t5. Accessed February 15, 2018.
- Cohen PR. A case report of scrotal rejuvenation: laser treatment of angiokeratomas of the scrotum [published online November 26, 2018]. Dermatol Ther (Heidelb). doi:10.1007/s13555-018-0272-z.
ASCO publishes new guideline for treatment, follow-up of early-stage colorectal cancer
An expert panel appointed by the American Society of Clinical Oncology has issued a new guideline for the treatment and follow-up of patients with early-stage colorectal cancer.
The multidisciplinary, multinational panel identified and reviewed previous guidelines from 12 different developers to create the new ASCO guideline; of these, recommendations from six guidelines were adapted into the evidence base. All recommendations have a consensus rate of at least 75%.
For patients with basic, nonobstructing stage I-IIA colon cancer, open resection is recommended; those with enhanced disease should receive laparoscopic or minimally invasive surgery. For nonobstructing stage IIB-IIC colon cancer, recommended treatment for basic disease is open resection; emergency surgical resection is recommended in enhanced disease.
Treatment for basic, obstructing IIB-IIC disease is resection and/or diversion and is emergency surgical resection in enhanced disease. In left-sided, stage IIB-IIC disease, colonic stent placement is recommended. In high-risk, obstructing stage II disease or in T4N0/T3N0 disease with high-risk features, adjuvant chemotherapy is recommended.
In cT1N0 and cT2n0 rectal cancer, total mesorectal excision is recommended; for cT3n0, total mesorectal excision is recommended in basic and limited cases, with diversion recommended in other cases. For resectable cT3N0 rectal cancer, patients should receive base neoadjuvant chemotherapy.
For follow-up, patients should receive a combination of medical history, physical examination, carcinoembryonic antigen testing, imaging, and endoscopy, with the frequency depending on patient setting.
More information, including a data supplement with additional evidence tables, a methodology supplement with information about evidence quality and strength of recommendations, slide sets, and clinical tools and resources is available at www.asco.org/resource-stratified-guidelines, according to the guideline.
Several members of the expert panel reported conflicts of interest.
SOURCE: Costas-Chavarri A et al. J Glob Oncol. 2019 Feb 25. doi: 10.1200/JGO.18.00214.
FROM THE JOURNAL OF GLOBAL ONCOLOGY
Aquatic Antagonists: Stingray Injury Update
Incidence and Characteristics
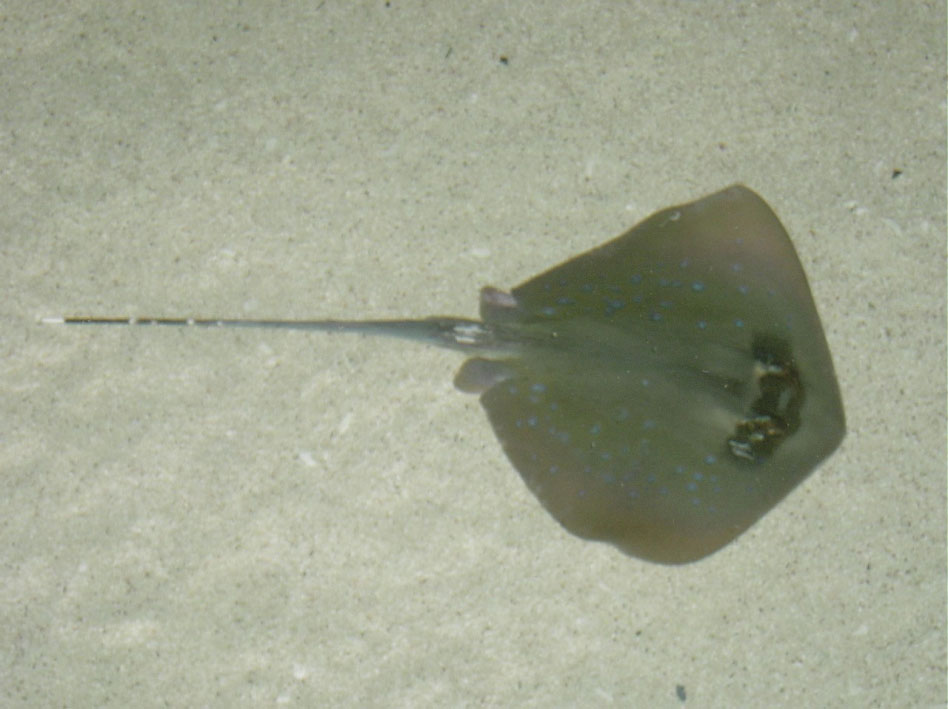

Stingrays are dorsoventrally flattened, diamond-shaped fish with light-colored ventral and dark-colored dorsal surfaces. They have strong pectoral wings that allow them to swim forward and backward and even launch off waves.3 Stingrays range in size from the palm of a human hand to 6.5 ft in width. They possess 1 or more spines (2.5 to >30 cm in length) that are disguised by much longer tails.6,7 They often are encountered accidentally because they bury themselves in the sand or mud of shallow coastal waters or rivers with only their eyes and tails exposed to fool prey and avoid predators.
Injury Clinical Presentation
Stingray injuries typically involve the lower legs, ankles, or feet after stepping on a stingray.8 Fishermen can present with injuries of the upper extremities after handling fish with their hands.9 Other rarer injuries occur when individuals are swimming alongside stingrays or when stingrays catapult off waves into moving boats.10,11 Stingrays impale victims by using their tails to direct a retroserrate barb composed of a strong cartilaginous material called vasodentin. The barb releases venom by breaking through the venom-containing integumentary sheath that encapsulates it. Stingray venom contains phosphodiesterase, serotonin, and 5′-nucleotidase. It causes severe pain, vasoconstriction, ischemia, and poor wound healing, along with systemic effects such as disorientation, syncope, seizures, salivation, nausea, vomiting, abdominal pain, diarrhea, muscle cramps or fasciculations, pruritus, allergic reaction, hypotension, cardiac arrhythmias, dyspnea, paralysis, and possibly death.1,8,12,13
Management
Pain Relief
As with many marine envenomations, immersion in hot but not scalding water can inactivate venom and reduce symptoms.8,9 In one retrospective review, 52 of 75 (69%) patients reporting to a California poison center with stingray injuries had improvement in pain within 1 hour of hot water immersion before any analgesics were instituted.8 In another review, 65 of 74 (88%) patients presenting to a California emergency department within 24 hours of sustaining a stingray injury had complete relief of pain within 30 minutes of hot water immersion. Patients who received analgesics in addition to hot water immersion did not require a second dose.9 In concordance with these studies, we suggest immersing areas affected by stingray injuries in hot water (temperature, 43.3°C to 46.1°C [110°F–115°F]; or as close to this range as tolerated) until pain subsides.8,9,14 Ice packs are an alternative to hot water immersion that may be more readily available to patients. If pain does not resolve following hot water immersion or application of an ice pack, additional analgesics and xylocaine without epinephrine may be helpful.9,15
Infection
One major complication of stingray injuries is infection.8,9 Many bacterial species reside in stingray mucus, the marine environment, or on human skin that may be introduced during a single injury. Marine envenomations can involve organisms such as Vibrio, Aeromonas, and Mycobacterium species, which often are resistant to antibiotic prophylaxis covering common causes of soft-tissue infection such as Staphylococcus and Streptococcus species.8,9,16,17 Additionally, physicians should cover for Clostridium species and ensure patients are up-to-date on vaccinations because severe cases of tetanus following stingray injuries have been reported.18 Lastly, fungal infections including fusariosis have been reported following stingray injuries and should be considered if a patient develops an infection.19
Several authors support the use of prophylactic broad-spectrum antibiotics in all but mild stingray injuries.8,9,20,21 Although no standardized definition exists, mild injuries generally represent patients with superficial lacerations or less, while deeper lacerations and puncture wounds require prophylaxis. Several authors agree on the use of fluoroquinolone antibiotics (eg, ciprofloxacin 500 mg twice daily) for 5 to 7 days following severe stingray injuries.1,9,13,22 Other proposed antibiotic regimens include trimethoprim-sulfamethoxazole (160/800 mg twice daily) or tetracycline (500 mg 4 times daily) for 7 days.13 Failure of ciprofloxacin therapy after 7 days has been reported, with resolution of infection after treatment with an intravenous cephalosporin for 7 days.20 Failure of trimethoprim-sulfamethoxazole therapy also has been reported, with one case requiring levofloxacin for a much longer course.21 Clinical follow-up remains essential after prescribing prophylactic antibiotics, as resistance is common.
Foreign Bodies
Stingray injuries also are often complicated by foreign bodies or retained spines.3,8 Although these complications are less severe than infection, all wounds should be explored for material under local anesthesia. Furthermore, there has been support for thorough debridement of necrotic tissue with referral to a hand specialist for deeper injuries to the hands as well as referral to a foot and ankle specialist for deeper injuries of the lower extremities.23,24 More serious injuries with penetration of vital structures, such as through the chest or abdomen, require immediate exploration in an operating room.1,24
Imaging
Routine imaging of stingray injuries remains controversial. In a case series of 119 patients presenting to a California emergency department with stingray injuries, Clark et al9 found that radiographs were not helpful. This finding likely is due in part to an inability to detect hypodense material such as integumentary or glandular tissue via radiography.3 However, radiographs have been used to identify retained stingray barbs in select cases in which retained barbs are suspected.2,25 Lastly, ultrasonography potentially may offer a better first choice when a barb is not readily apparent; magnetic resonance imaging may be indicated for more involved areas and for further visualization of suspected hypodense material, though at a higher expense.2,9
Biopsy
Biopsies of stingray injuries are rarely performed, and the findings are not well characterized. One case biopsied 2 months after injury showed a large zone of paucicellular necrosis with superficial ulceration and granulomatous inflammation. The stingray venom was most likely responsible for the pattern of necrosis noted in the biopsy.21
Avoidance and Prevention
Patients traveling to areas of the world inhabited by stingrays should receive counseling on how to avoid injury. Prior to entry, individuals can throw stones or use a long stick to clear their walking or swimming areas of venomous fish.26 Polarized sunglasses may help spot stingrays in shallow water. Furthermore, wading through water with a shuffling gait can help individuals avoid stepping directly on a stingray and also warns stingrays that someone is in the area. Individuals who spend more time in coastal waters or river systems inhabited by stingrays may invest in protective stingray gear such as leg guards or specialized wading boots.26 Lastly, fishermen should be advised to avoid handling stingrays with their hands and instead cut their fishing line to release the fish.
- Aurbach PS. Envenomations by aquatic vertebrates. In: Auerbach PS. Wilderness Medicine. 5th ed. St. Louis, MO: Mosby; 2007:1730-1749.
- Robins CR, Ray GC. A Field Guide to Atlantic Coast Fishes. New York, NY: Houghton Mifflin Company; 1986.
- Diaz JH. The evaluation, management, and prevention of stingray injuries in travelers. J Travel Med. 2008;15:102-109.
- Haddad V Jr, Neto DG, de Paula Neto JB, et al. Freshwater stingrays: study of epidemiologic, clinical and therapeutic aspects based on 84 envenomings in humans and some enzymatic activities of the venom. Toxicon. 2004;43:287-294.
- Marinkelle CJ. Accidents by venomous animals in Colombia. Ind Med Surg. 1966;35:988-992.
- Last PR, White WT, Caire JN, et al. Sharks and Rays of Borneo. Collingwood VIC, Australia: CSIRO Publishing; 2010.
- Mebs D. Venomous and Poisonous Animals: A Handbook for Biologists, Toxicologists and Toxinologists, Physicians and Pharmacists. Boca Raton, FL: CRC Press; 2002.
- Clark AT, Clark RF, Cantrell FL. A retrospective review of the presentation and treatment of stingray stings reported to a poison control system. Am J Ther. 2017;24:E177-E180.
- Clark RF, Girard RH, Rao D, et al. Stingray envenomation: a retrospective review of clinical presentation and treatment in 119 cases. J Emerg Med. 2007;33:33-37.
- Mahjoubi L, Joyeux A, Delambre JF, et al. Near-death thoracic trauma caused by a stingray in the Indian Ocean. Semin Thorac Cardiovasc Surg. 2017;29:262-263.
- Parra MW, Constantini EN, Rodas EB. Surviving a transfixing cardiac injury caused by a stingray barb. J Thorac Cardiovasc Surg. 2010;139:E115-E116.
- Dos Santos JC, Grund LZ, Seibert CS, et al. Stingray venom activates IL-33 producing cardiomyocytes, but not mast cell, to promote acute neutrophil-mediated injury. Sci Rep. 2017;7:7912.
- Auerbach PS, Norris RL. Marine envenomation. In: Longo DL, Kasper SL, Jameson JL, et al, eds. Harrison’s Principles of Internal Medicine. 18th ed. New York, NY: McGraw-Hill; 2012:144-148.
- Cook MD, Matteucci MJ, Lall R, et al. Stingray envenomation. J Emerg Med. 2006;30:345-347.
- Bowers RC, Mustain MV. Disorders due to physical & environmental agents. In: Humphries RL, Stone C, eds. CURRENT Diagnosis & Treatment Emergency Medicine. 7th ed. New York, NY: McGraw-Hill; 2011:835-861.
- Domingos MO, Franzolin MR, dos Anjos MT, et al. The influence of environmental bacteria in freshwater stingray wound-healing. Toxicon. 2011;58:147-153.
- Auerbach PS, Yajko DM, Nassos PS, et al. Bacteriology of the marine environment: implications for clinical therapy. Ann Emerg Med. 1987;16:643-649.
- Torrez PP, Quiroga MM, Said R, et al. Tetanus after envenomations caused by freshwater stingrays. Toxicon. 2015;97:32-35.
- Hiemenz JW, Kennedy B, Kwon-Chung KJ. Invasive fusariosis associated with an injury by a stingray barb. J Med Vet Mycol. 1990;28:209-213.
- da Silva NJ Jr, Ferreira KR, Pinto RN, et al. A severe accident caused by an ocellate river stingray (Potamotrygon motoro) in central Brazil: how well do we really understand stingray venom chemistry, envenomation, and therapeutics? Toxins (Basel). 2015;7:2272-2288.
- Tartar D, Limova M, North J. Clinical and histopathologic findings in cutaneous sting ray wounds: a case report. Dermatol Online J. 2013;19:19261.
- Jarvis HC, Matheny LM, Clanton TO. Stingray injury to the webspace of the foot. Orthopedics. 2012;35:E762-E765.
- Trickett R, Whitaker IS, Boyce DE. Sting-ray injuries to the hand: case report, literature review and a suggested algorithm for management. J Plast Reconstruct Aesthet Surg. 2009;62:E270-E273.
- Fernandez I, Valladolid G, Varon J, et al. Encounters with venomous sea-life. J Emerg Med. 2011;40:103-112.
- O’Malley GF, O’Malley RN, Pham O, et al. Retained stingray barb and the importance of imaging. Wilderness Environ Med. 2015;26:375-379.
- How to protect yourself from stingrays. Howcast website. https://www.howcast.com/videos/228034-how-to-protect-yourself-from-stingrays/. Accessed July 12, 2018.
Incidence and Characteristics
Stingrays are dorsoventrally flattened, diamond-shaped fish with light-colored ventral and dark-colored dorsal surfaces. They have strong pectoral wings that allow them to swim forward and backward and even launch off waves.3 Stingrays range in size from the palm of a human hand to 6.5 ft in width. They possess 1 or more spines (2.5 to >30 cm in length) that are disguised by much longer tails.6,7 They often are encountered accidentally because they bury themselves in the sand or mud of shallow coastal waters or rivers with only their eyes and tails exposed to fool prey and avoid predators.
Injury Clinical Presentation
Stingray injuries typically involve the lower legs, ankles, or feet after stepping on a stingray.8 Fishermen can present with injuries of the upper extremities after handling fish with their hands.9 Other rarer injuries occur when individuals are swimming alongside stingrays or when stingrays catapult off waves into moving boats.10,11 Stingrays impale victims by using their tails to direct a retroserrate barb composed of a strong cartilaginous material called vasodentin. The barb releases venom by breaking through the venom-containing integumentary sheath that encapsulates it. Stingray venom contains phosphodiesterase, serotonin, and 5′-nucleotidase. It causes severe pain, vasoconstriction, ischemia, and poor wound healing, along with systemic effects such as disorientation, syncope, seizures, salivation, nausea, vomiting, abdominal pain, diarrhea, muscle cramps or fasciculations, pruritus, allergic reaction, hypotension, cardiac arrhythmias, dyspnea, paralysis, and possibly death.1,8,12,13
Management
Pain Relief
As with many marine envenomations, immersion in hot but not scalding water can inactivate venom and reduce symptoms.8,9 In one retrospective review, 52 of 75 (69%) patients reporting to a California poison center with stingray injuries had improvement in pain within 1 hour of hot water immersion before any analgesics were instituted.8 In another review, 65 of 74 (88%) patients presenting to a California emergency department within 24 hours of sustaining a stingray injury had complete relief of pain within 30 minutes of hot water immersion. Patients who received analgesics in addition to hot water immersion did not require a second dose.9 In concordance with these studies, we suggest immersing areas affected by stingray injuries in hot water (temperature, 43.3°C to 46.1°C [110°F–115°F]; or as close to this range as tolerated) until pain subsides.8,9,14 Ice packs are an alternative to hot water immersion that may be more readily available to patients. If pain does not resolve following hot water immersion or application of an ice pack, additional analgesics and xylocaine without epinephrine may be helpful.9,15
Infection
One major complication of stingray injuries is infection.8,9 Many bacterial species reside in stingray mucus, the marine environment, or on human skin that may be introduced during a single injury. Marine envenomations can involve organisms such as Vibrio, Aeromonas, and Mycobacterium species, which often are resistant to antibiotic prophylaxis covering common causes of soft-tissue infection such as Staphylococcus and Streptococcus species.8,9,16,17 Additionally, physicians should cover for Clostridium species and ensure patients are up-to-date on vaccinations because severe cases of tetanus following stingray injuries have been reported.18 Lastly, fungal infections including fusariosis have been reported following stingray injuries and should be considered if a patient develops an infection.19
Several authors support the use of prophylactic broad-spectrum antibiotics in all but mild stingray injuries.8,9,20,21 Although no standardized definition exists, mild injuries generally represent patients with superficial lacerations or less, while deeper lacerations and puncture wounds require prophylaxis. Several authors agree on the use of fluoroquinolone antibiotics (eg, ciprofloxacin 500 mg twice daily) for 5 to 7 days following severe stingray injuries.1,9,13,22 Other proposed antibiotic regimens include trimethoprim-sulfamethoxazole (160/800 mg twice daily) or tetracycline (500 mg 4 times daily) for 7 days.13 Failure of ciprofloxacin therapy after 7 days has been reported, with resolution of infection after treatment with an intravenous cephalosporin for 7 days.20 Failure of trimethoprim-sulfamethoxazole therapy also has been reported, with one case requiring levofloxacin for a much longer course.21 Clinical follow-up remains essential after prescribing prophylactic antibiotics, as resistance is common.
Foreign Bodies
Stingray injuries also are often complicated by foreign bodies or retained spines.3,8 Although these complications are less severe than infection, all wounds should be explored for material under local anesthesia. Furthermore, there has been support for thorough debridement of necrotic tissue with referral to a hand specialist for deeper injuries to the hands as well as referral to a foot and ankle specialist for deeper injuries of the lower extremities.23,24 More serious injuries with penetration of vital structures, such as through the chest or abdomen, require immediate exploration in an operating room.1,24
Imaging
Routine imaging of stingray injuries remains controversial. In a case series of 119 patients presenting to a California emergency department with stingray injuries, Clark et al9 found that radiographs were not helpful. This finding likely is due in part to an inability to detect hypodense material such as integumentary or glandular tissue via radiography.3 However, radiographs have been used to identify retained stingray barbs in select cases in which retained barbs are suspected.2,25 Lastly, ultrasonography potentially may offer a better first choice when a barb is not readily apparent; magnetic resonance imaging may be indicated for more involved areas and for further visualization of suspected hypodense material, though at a higher expense.2,9
Biopsy
Biopsies of stingray injuries are rarely performed, and the findings are not well characterized. One case biopsied 2 months after injury showed a large zone of paucicellular necrosis with superficial ulceration and granulomatous inflammation. The stingray venom was most likely responsible for the pattern of necrosis noted in the biopsy.21
Avoidance and Prevention
Patients traveling to areas of the world inhabited by stingrays should receive counseling on how to avoid injury. Prior to entry, individuals can throw stones or use a long stick to clear their walking or swimming areas of venomous fish.26 Polarized sunglasses may help spot stingrays in shallow water. Furthermore, wading through water with a shuffling gait can help individuals avoid stepping directly on a stingray and also warns stingrays that someone is in the area. Individuals who spend more time in coastal waters or river systems inhabited by stingrays may invest in protective stingray gear such as leg guards or specialized wading boots.26 Lastly, fishermen should be advised to avoid handling stingrays with their hands and instead cut their fishing line to release the fish.
- Aurbach PS. Envenomations by aquatic vertebrates. In: Auerbach PS. Wilderness Medicine. 5th ed. St. Louis, MO: Mosby; 2007:1730-1749.
- Robins CR, Ray GC. A Field Guide to Atlantic Coast Fishes. New York, NY: Houghton Mifflin Company; 1986.
- Diaz JH. The evaluation, management, and prevention of stingray injuries in travelers. J Travel Med. 2008;15:102-109.
- Haddad V Jr, Neto DG, de Paula Neto JB, et al. Freshwater stingrays: study of epidemiologic, clinical and therapeutic aspects based on 84 envenomings in humans and some enzymatic activities of the venom. Toxicon. 2004;43:287-294.
- Marinkelle CJ. Accidents by venomous animals in Colombia. Ind Med Surg. 1966;35:988-992.
- Last PR, White WT, Caire JN, et al. Sharks and Rays of Borneo. Collingwood VIC, Australia: CSIRO Publishing; 2010.
- Mebs D. Venomous and Poisonous Animals: A Handbook for Biologists, Toxicologists and Toxinologists, Physicians and Pharmacists. Boca Raton, FL: CRC Press; 2002.
- Clark AT, Clark RF, Cantrell FL. A retrospective review of the presentation and treatment of stingray stings reported to a poison control system. Am J Ther. 2017;24:E177-E180.
- Clark RF, Girard RH, Rao D, et al. Stingray envenomation: a retrospective review of clinical presentation and treatment in 119 cases. J Emerg Med. 2007;33:33-37.
- Mahjoubi L, Joyeux A, Delambre JF, et al. Near-death thoracic trauma caused by a stingray in the Indian Ocean. Semin Thorac Cardiovasc Surg. 2017;29:262-263.
- Parra MW, Constantini EN, Rodas EB. Surviving a transfixing cardiac injury caused by a stingray barb. J Thorac Cardiovasc Surg. 2010;139:E115-E116.
- Dos Santos JC, Grund LZ, Seibert CS, et al. Stingray venom activates IL-33 producing cardiomyocytes, but not mast cell, to promote acute neutrophil-mediated injury. Sci Rep. 2017;7:7912.
- Auerbach PS, Norris RL. Marine envenomation. In: Longo DL, Kasper SL, Jameson JL, et al, eds. Harrison’s Principles of Internal Medicine. 18th ed. New York, NY: McGraw-Hill; 2012:144-148.
- Cook MD, Matteucci MJ, Lall R, et al. Stingray envenomation. J Emerg Med. 2006;30:345-347.
- Bowers RC, Mustain MV. Disorders due to physical & environmental agents. In: Humphries RL, Stone C, eds. CURRENT Diagnosis & Treatment Emergency Medicine. 7th ed. New York, NY: McGraw-Hill; 2011:835-861.
- Domingos MO, Franzolin MR, dos Anjos MT, et al. The influence of environmental bacteria in freshwater stingray wound-healing. Toxicon. 2011;58:147-153.
- Auerbach PS, Yajko DM, Nassos PS, et al. Bacteriology of the marine environment: implications for clinical therapy. Ann Emerg Med. 1987;16:643-649.
- Torrez PP, Quiroga MM, Said R, et al. Tetanus after envenomations caused by freshwater stingrays. Toxicon. 2015;97:32-35.
- Hiemenz JW, Kennedy B, Kwon-Chung KJ. Invasive fusariosis associated with an injury by a stingray barb. J Med Vet Mycol. 1990;28:209-213.
- da Silva NJ Jr, Ferreira KR, Pinto RN, et al. A severe accident caused by an ocellate river stingray (Potamotrygon motoro) in central Brazil: how well do we really understand stingray venom chemistry, envenomation, and therapeutics? Toxins (Basel). 2015;7:2272-2288.
- Tartar D, Limova M, North J. Clinical and histopathologic findings in cutaneous sting ray wounds: a case report. Dermatol Online J. 2013;19:19261.
- Jarvis HC, Matheny LM, Clanton TO. Stingray injury to the webspace of the foot. Orthopedics. 2012;35:E762-E765.
- Trickett R, Whitaker IS, Boyce DE. Sting-ray injuries to the hand: case report, literature review and a suggested algorithm for management. J Plast Reconstruct Aesthet Surg. 2009;62:E270-E273.
- Fernandez I, Valladolid G, Varon J, et al. Encounters with venomous sea-life. J Emerg Med. 2011;40:103-112.
- O’Malley GF, O’Malley RN, Pham O, et al. Retained stingray barb and the importance of imaging. Wilderness Environ Med. 2015;26:375-379.
- How to protect yourself from stingrays. Howcast website. https://www.howcast.com/videos/228034-how-to-protect-yourself-from-stingrays/. Accessed July 12, 2018.
Practice Points
- Acute pain associated with stingray injuries can be treated with hot water immersion.
- Stingray injuries are prone to secondary infection and poor wound healing.
Eccrine Porocarcinoma Presenting as a Recurrent Wart
Eccrine porocarcinoma (EPC), originally described by Pinkus and Mehregan1 in 1963, is an exceedingly rare sweat gland tumor most commonly seen in older patients. Fewer than 300 cases have been reported in the literature, and it is believed to represent only 0.005% to 0.01% of cutaneous malignancies.2 In the absence of established guidelines, wide local excision (WLE) has traditionally been considered the standard of treatment; however, local recurrence and nodal metastasis rates associated with WLE have been reported as high as 20%.3 More recently, a number of case reports and small case series have demonstrated higher cure rates with Mohs micrographic surgery (MMS), though follow-up is limited.3-5 We describe a case of EPC presenting as a recurrent wart in a 36-year-old man that was successfully treated with MMS.
Case Report
A 36-year-old man with no notable medical history presented with a 0.5×0.5-cm, asymptomatic, flesh-colored, hyperkeratotic, polypoid papule on the right medial thigh (Figure 1). The lesion was diagnosed as a wart and treated with cryotherapy by another dermatologist several years prior to presentation. Dermatoscopic examination at the current presentation showed a homogenous yellow center with a few peripheral vessels and a faint pink-tan halo (Figure 2). Our differential diagnosis included a recurrent wart, fibrosed pyogenic granuloma, irritated intradermal nevus, skin tag, and adnexal neoplasm. A shave biopsy was performed. Histopathologic analysis revealed multiple aggregations of mildly pleomorphic epithelial cells emanating from the epidermis, with many aggregations containing ductal structures (Figure 3). Rare necrotic and pyknotic cells were present, but no mitotic figures or lymphovascular invasion were identified. Immunohistochemical staining was positive for carcinoembryonic antigen and epithelial membrane antigen but negative for Ber-EP4. These findings were consistent with a well-differentiated EPC.
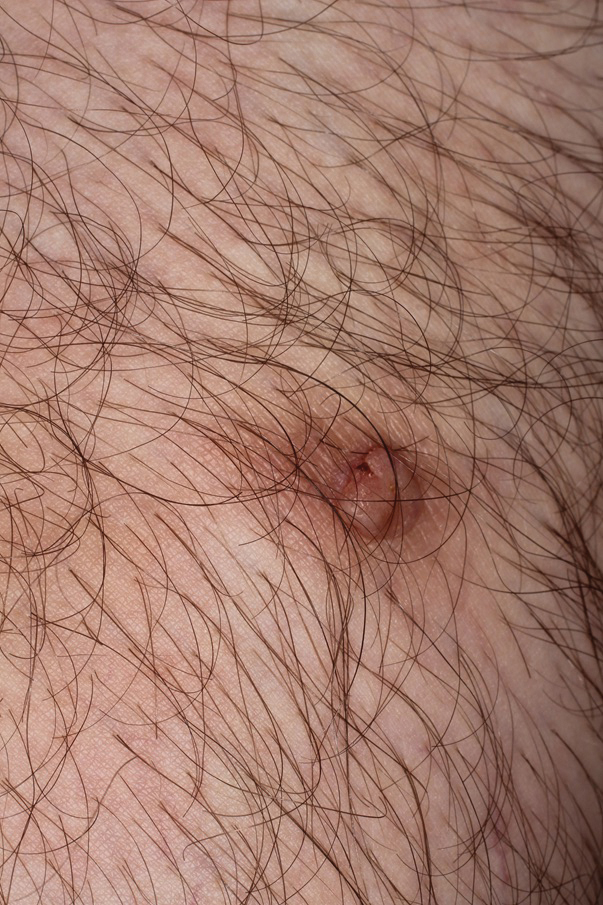
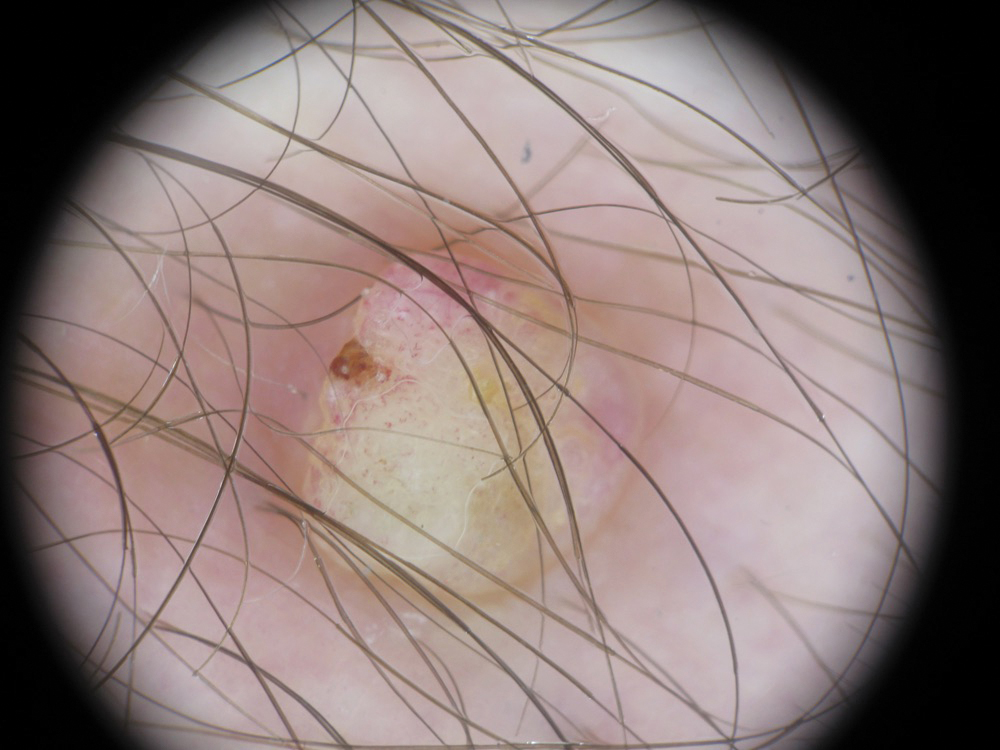
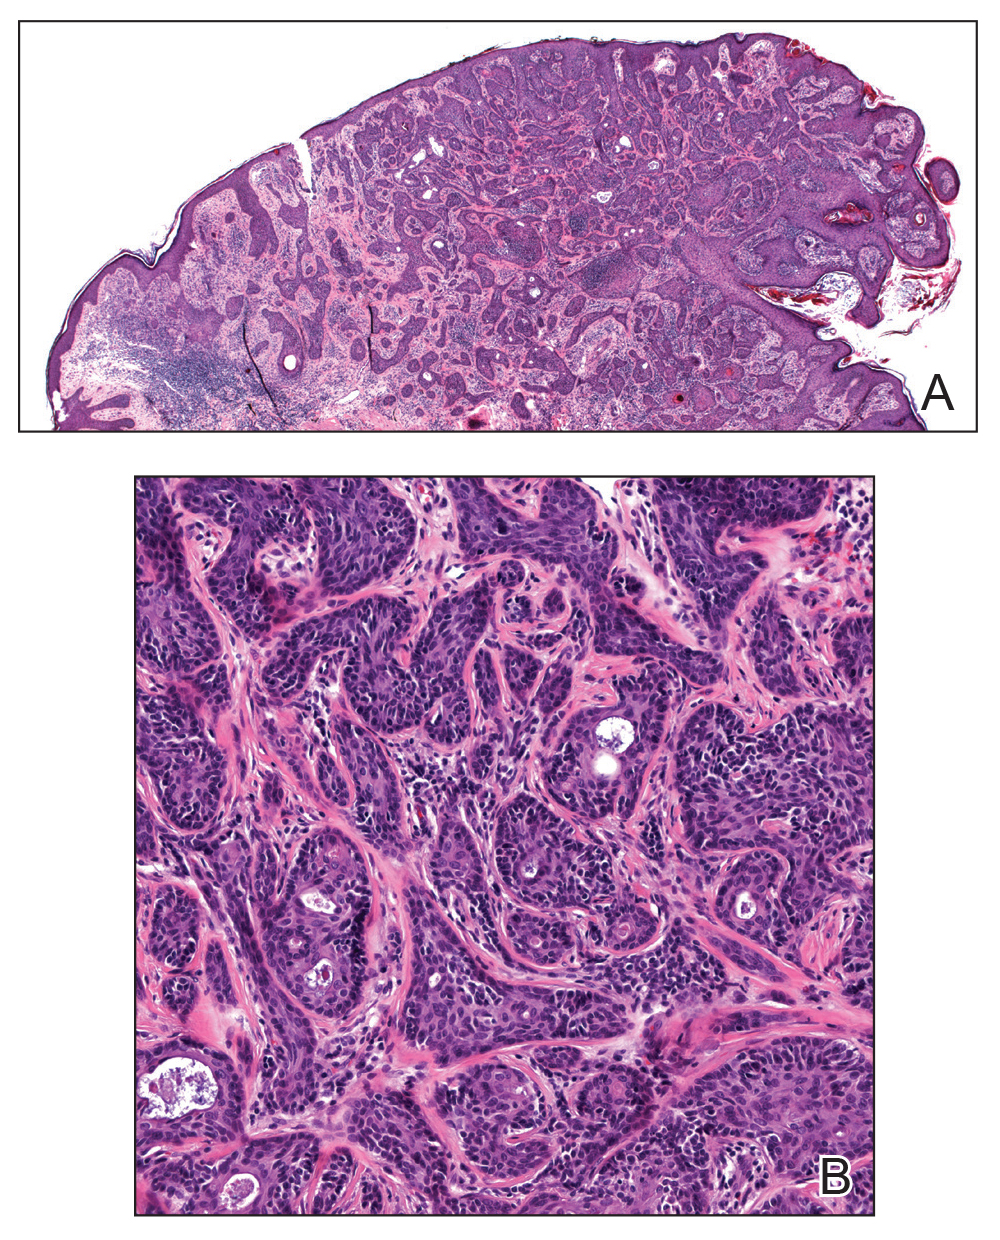
The patient was offered MMS or WLE, with or without sentinel lymph node biopsy (SLNB). He opted for MMS. The initial 1-cm margin taken during MMS was sufficient to achieve complete tumor extirpation, and the final 3.7×2.5-cm defect was closed primarily. The MMS debulking specimen was sent for permanent sectioning and showed a small focus of residual tumor cells, but no mitoses or lymphovascular invasion were seen. The patient was referred to surgical oncology to discuss the option of SLNB, which he ultimately declined. He also was offered regional or whole-body positron emission tomography–computed tomography (PET-CT) to rule out metastatic disease, which he also declined. There was no evidence of recurrence or lymphadenopathy 19 months postoperatively.
Comment
Eccrine porocarcinoma is an exceptionally rare adnexal neoplasm that most commonly affects older adults. The average age at diagnosis is 71 years in men and 75 years in women.2 Our case is rare because of the patient’s age. Benign eccrine poromas occur most frequently on the palms, soles, axillae, and forehead where eccrine density is highest; EPC occurs most frequently on the lower extremities.6 It may arise de novo or from malignant transformation of a preexisting benign poroma. Clinically, EPC may present as an asymptomatic pink-brown papule, plaque, or nodule and may have a polypoid or verrucous appearance, as in our patient. Ulceration is common.7 The differential diagnosis often includes nodular basal cell carcinoma, squamous cell carcinoma, pyogenic granuloma, and seborrheic keratosis.
Histologically, EPCs are characterized by aggregations of cohesive basaloid epithelial cells forming eccrine ductal structures.2 Cellular atypia may be extremely subtle but, if present, can be helpful in differentiating malignant from benign lesions. Features of basal and squamous cell carcinoma also may be present. Definitive diagnosis is frequently based on the overall invasive architectural pattern.5 Robson et al2 examined 69 cases of EPC for high-risk histologic features and concluded that tumor depth greater than 7 mm, mitoses greater than 14 per high-power field, and the presence of lymphovascular invasion were independently predictive of mortality. Moreover, after adjusting for mitosis and depth, an infiltrative border vs a pushing border was strongly predictive of local recurrence.2 Immunohistochemical stains, although not necessary for diagnosis, may have utility as adjunctive tools. Cells lining the ducts within EPCs commonly stain positive for carcinoembryonic antigen, though glandular myoepithelial cells stain positive for S-100. Negative Ber-EP4 staining helps to differentiate EPC from basal cell carcinoma. Abnormal expression of p53 and overexpression of p16 also has been described.4
The rarity of EPC has precluded the development of any evidence-based management guidelines. Historically, the standard of care has been WLE with 2- to 3-cm margins. A review of 105 cases of EPC treated with WLE showed 20% local recurrence, 20% regional metastases, and 12% distant metastasis rates.8 Mohs micrographic surgery, which allows examination of 100% of the surgical margin vs less than 1% for WLE with the standard bread-loafing technique, might be expected to achieve higher cure rates. A review of 29 cases treated with MMS monotherapy demonstrated no local recurrences, distant metastasis, or disease-specific deaths with follow-up ranging from 19 months to 6 years.5 One case was associated with regional lymph node metastases that were treated with completion lymphadenectomy and adjuvant radiation therapy.7 The high mortality rate of patients with nodal disease has led some to recommend PET-CT and SLNB for patients with EPC. However, the prognostic value of such procedures has not been clearly defined and there is no demonstrated survival benefit for treatment of widespread disease. Our patient declined both SLNB and PET-CT, and our plan was to follow him clinically with symptom-directed imaging only.
Conclusion
Patients with EPC generally have a favorable prognosis with prompt diagnosis and complete surgical excision. Although most commonly seen in elderly patients, EPC may present in younger patients and may be clinically and histologically nondescript with little cytologic atypia. Based on a small but growing body of literature, MMS appears to be at least as effective as WLE as a primary treatment modality for EPC, while offering the advantage of tissue sparing in cosmetically or functionally important areas.
- Pinkus H, Mehregan AH. Epidermatropic eccrine carcinoma. a case combining eccrine poroma and Paget’s dermatoses. Arch Dermatol. 1963;88:597-606.
- Robson A, Greene J, Ansari N, et al. Eccrine porocarcinoma (malignant eccrine poroma): a clinicopathologic study of 69 cases. Am J Surg Pathol. 2001;25:710-720.
- Tolkachjov SN, Hocker TL, Camilleri MJ, et al. Treatment of porocarcinoma with Mohs micrographic surgery: The Mayo Clinic Experience. Dermatol Surg. 2016;42:745-750.
- Tidwell WJ, Mayer JE, Malone J, et al. Treatment of eccrine porocarcinoma with Mohs micrographic surgery: a cases series and literature review. Int J Dermatol. 2015;54:1078-1083.
- Xu YG, Aylward J, Longley BJ, et al. Eccrine porocarcinoma treated by Mohs micrographic surgery: over 6-year follow-up of 12 cases and literature review. Dermatol Surg. 2015;41:685-692.
- D’Ambrosia RA, Ward H, Parry E. Eccrine porocarcinoma of the eyelid treated with Mohs micrographic surgery. Dermatol Surg. 2004;30:4:570-571.
- Vleugels FR, Girouard SD, Schmults CD, et al. Metastatic eccrine porocarcinoma after Mohs micrographic surgery: a case report. J Clin Oncol. 2012;30:188-191.
- Snow SN, Reizner GT. Eccrine porocarcinoma of the face. J Am Acad Dermatol. 1992;27:306-311.
Eccrine porocarcinoma (EPC), originally described by Pinkus and Mehregan1 in 1963, is an exceedingly rare sweat gland tumor most commonly seen in older patients. Fewer than 300 cases have been reported in the literature, and it is believed to represent only 0.005% to 0.01% of cutaneous malignancies.2 In the absence of established guidelines, wide local excision (WLE) has traditionally been considered the standard of treatment; however, local recurrence and nodal metastasis rates associated with WLE have been reported as high as 20%.3 More recently, a number of case reports and small case series have demonstrated higher cure rates with Mohs micrographic surgery (MMS), though follow-up is limited.3-5 We describe a case of EPC presenting as a recurrent wart in a 36-year-old man that was successfully treated with MMS.
Case Report
A 36-year-old man with no notable medical history presented with a 0.5×0.5-cm, asymptomatic, flesh-colored, hyperkeratotic, polypoid papule on the right medial thigh (Figure 1). The lesion was diagnosed as a wart and treated with cryotherapy by another dermatologist several years prior to presentation. Dermatoscopic examination at the current presentation showed a homogenous yellow center with a few peripheral vessels and a faint pink-tan halo (Figure 2). Our differential diagnosis included a recurrent wart, fibrosed pyogenic granuloma, irritated intradermal nevus, skin tag, and adnexal neoplasm. A shave biopsy was performed. Histopathologic analysis revealed multiple aggregations of mildly pleomorphic epithelial cells emanating from the epidermis, with many aggregations containing ductal structures (Figure 3). Rare necrotic and pyknotic cells were present, but no mitotic figures or lymphovascular invasion were identified. Immunohistochemical staining was positive for carcinoembryonic antigen and epithelial membrane antigen but negative for Ber-EP4. These findings were consistent with a well-differentiated EPC.
The patient was offered MMS or WLE, with or without sentinel lymph node biopsy (SLNB). He opted for MMS. The initial 1-cm margin taken during MMS was sufficient to achieve complete tumor extirpation, and the final 3.7×2.5-cm defect was closed primarily. The MMS debulking specimen was sent for permanent sectioning and showed a small focus of residual tumor cells, but no mitoses or lymphovascular invasion were seen. The patient was referred to surgical oncology to discuss the option of SLNB, which he ultimately declined. He also was offered regional or whole-body positron emission tomography–computed tomography (PET-CT) to rule out metastatic disease, which he also declined. There was no evidence of recurrence or lymphadenopathy 19 months postoperatively.
Comment
Eccrine porocarcinoma is an exceptionally rare adnexal neoplasm that most commonly affects older adults. The average age at diagnosis is 71 years in men and 75 years in women.2 Our case is rare because of the patient’s age. Benign eccrine poromas occur most frequently on the palms, soles, axillae, and forehead where eccrine density is highest; EPC occurs most frequently on the lower extremities.6 It may arise de novo or from malignant transformation of a preexisting benign poroma. Clinically, EPC may present as an asymptomatic pink-brown papule, plaque, or nodule and may have a polypoid or verrucous appearance, as in our patient. Ulceration is common.7 The differential diagnosis often includes nodular basal cell carcinoma, squamous cell carcinoma, pyogenic granuloma, and seborrheic keratosis.
Histologically, EPCs are characterized by aggregations of cohesive basaloid epithelial cells forming eccrine ductal structures.2 Cellular atypia may be extremely subtle but, if present, can be helpful in differentiating malignant from benign lesions. Features of basal and squamous cell carcinoma also may be present. Definitive diagnosis is frequently based on the overall invasive architectural pattern.5 Robson et al2 examined 69 cases of EPC for high-risk histologic features and concluded that tumor depth greater than 7 mm, mitoses greater than 14 per high-power field, and the presence of lymphovascular invasion were independently predictive of mortality. Moreover, after adjusting for mitosis and depth, an infiltrative border vs a pushing border was strongly predictive of local recurrence.2 Immunohistochemical stains, although not necessary for diagnosis, may have utility as adjunctive tools. Cells lining the ducts within EPCs commonly stain positive for carcinoembryonic antigen, though glandular myoepithelial cells stain positive for S-100. Negative Ber-EP4 staining helps to differentiate EPC from basal cell carcinoma. Abnormal expression of p53 and overexpression of p16 also has been described.4
The rarity of EPC has precluded the development of any evidence-based management guidelines. Historically, the standard of care has been WLE with 2- to 3-cm margins. A review of 105 cases of EPC treated with WLE showed 20% local recurrence, 20% regional metastases, and 12% distant metastasis rates.8 Mohs micrographic surgery, which allows examination of 100% of the surgical margin vs less than 1% for WLE with the standard bread-loafing technique, might be expected to achieve higher cure rates. A review of 29 cases treated with MMS monotherapy demonstrated no local recurrences, distant metastasis, or disease-specific deaths with follow-up ranging from 19 months to 6 years.5 One case was associated with regional lymph node metastases that were treated with completion lymphadenectomy and adjuvant radiation therapy.7 The high mortality rate of patients with nodal disease has led some to recommend PET-CT and SLNB for patients with EPC. However, the prognostic value of such procedures has not been clearly defined and there is no demonstrated survival benefit for treatment of widespread disease. Our patient declined both SLNB and PET-CT, and our plan was to follow him clinically with symptom-directed imaging only.
Conclusion
Patients with EPC generally have a favorable prognosis with prompt diagnosis and complete surgical excision. Although most commonly seen in elderly patients, EPC may present in younger patients and may be clinically and histologically nondescript with little cytologic atypia. Based on a small but growing body of literature, MMS appears to be at least as effective as WLE as a primary treatment modality for EPC, while offering the advantage of tissue sparing in cosmetically or functionally important areas.
- Pinkus H, Mehregan AH. Epidermatropic eccrine carcinoma. a case combining eccrine poroma and Paget’s dermatoses. Arch Dermatol. 1963;88:597-606.
- Robson A, Greene J, Ansari N, et al. Eccrine porocarcinoma (malignant eccrine poroma): a clinicopathologic study of 69 cases. Am J Surg Pathol. 2001;25:710-720.
- Tolkachjov SN, Hocker TL, Camilleri MJ, et al. Treatment of porocarcinoma with Mohs micrographic surgery: The Mayo Clinic Experience. Dermatol Surg. 2016;42:745-750.
- Tidwell WJ, Mayer JE, Malone J, et al. Treatment of eccrine porocarcinoma with Mohs micrographic surgery: a cases series and literature review. Int J Dermatol. 2015;54:1078-1083.
- Xu YG, Aylward J, Longley BJ, et al. Eccrine porocarcinoma treated by Mohs micrographic surgery: over 6-year follow-up of 12 cases and literature review. Dermatol Surg. 2015;41:685-692.
- D’Ambrosia RA, Ward H, Parry E. Eccrine porocarcinoma of the eyelid treated with Mohs micrographic surgery. Dermatol Surg. 2004;30:4:570-571.
- Vleugels FR, Girouard SD, Schmults CD, et al. Metastatic eccrine porocarcinoma after Mohs micrographic surgery: a case report. J Clin Oncol. 2012;30:188-191.
- Snow SN, Reizner GT. Eccrine porocarcinoma of the face. J Am Acad Dermatol. 1992;27:306-311.
Practice Points
- Eccrine porocarcinoma is more common in older patients (age range, 71–75 years).
- Local recurrence and nodal metastasis are reported as high as 20% with wide local excision.
- Higher cure rates recently have been reported with Mohs micrographic surgery.