User login
In endometrial cancer and SUI, concomitant surgery improves outcomes
TUCSON, ARIZ. – according to a study examining the effects of an SUI screen among endometrial cancer patients.

An estimated 40%-80% of women with endometrial cancer experience SUI. The malignancy often is caught early enough to be treated with curative intent, and that is leading physicians and patients to think more about quality of life outcomes.
And yet, few patients receive concomitant surgery. Twenty percent of the women in the current study opted for concomitant surgeries, yet large database studies show the frequency of concomitant surgeries is about 2.5%. “There’s huge room for improvement in this area. The take-home message is that this is prevalent, this is doable, and this is something that could truly benefit this population,” Evelyn Hall, MD, said in an interview. Dr. Hall is a fellow in female pelvic medicine and reconstructive medicine at Brown University, Providence, R.I. She presented the study at the annual scientific meeting of the Society of Gynecologic Surgeons.
It’s not entirely surprising that SUI tends to be overlooked in patients with endometrial cancer. After all, they are going through a life-changing medical diagnosis, and oncologists are laser focused on achieving a cure when possible. But a bigger picture view, especially in light of the high cure rate for endometrial cancer when detected early, should encourage physicians to think differently about patient management.
The biggest trick may be incorporating concomitant surgeries into the surgical work flow. “It can be challenging logistically. It requires surgical planning and coordination between the two surgeons,” said Dr. Hall. But she said the experience at Brown University showed that it was possible with some patience. “It took a while to get the balls rolling, but once we figured out [it] worked for our institution, we’ve seen a continued uptake,” she said.
An important remaining question is the safety of the concomitant surgeries. Dr. Hall did not report any between-group differences in her presentation, but analysis is ongoing. They found a statistically significant increase in the number of readmissions among the concomitant surgery group, but most were deemed unlikely to be related to concomitant surgery.
In the study, 1,322 endometrial surgical candidates were screened for SUI, and 53% tested positive. Of these, 556 patients were offered concomitant surgical or nonsurgical SUI treatment: 21% chose concomitant surgery, 19% chose nonsurgical SUI treatment, and 60% of patients opted for no SUI treatment.
At 6 months after surgery, the concomitant surgery group was more likely to have a Urinary Distress Inventory (UDI)–Stress score of 0 than were those who were treated nonsurgically (odds ratio, 2.8; P = .0001) and those in the no-treatment group (OR, 3.7; P less than .0001). The concomitant group also was more likely to have a surgical site infection (SSI) score of 0 than was the nonsurgical group (OR, 2.9; P = .0008) and the no-treatment group (OR, 2.7; P less than .0001). Severe/very severe SSI scores occurred in 57% of the concomitant group at baseline, and this frequency dropped to 14% at 6 weeks (P less than .0001).
The study was funded by the Patient-Centered Outcomes Research Institute. Dr. Hall has no relevant financial disclosures.
SOURCE: Hall E et al. SGS 2019, oral presentation 12.
TUCSON, ARIZ. – according to a study examining the effects of an SUI screen among endometrial cancer patients.
An estimated 40%-80% of women with endometrial cancer experience SUI. The malignancy often is caught early enough to be treated with curative intent, and that is leading physicians and patients to think more about quality of life outcomes.
And yet, few patients receive concomitant surgery. Twenty percent of the women in the current study opted for concomitant surgeries, yet large database studies show the frequency of concomitant surgeries is about 2.5%. “There’s huge room for improvement in this area. The take-home message is that this is prevalent, this is doable, and this is something that could truly benefit this population,” Evelyn Hall, MD, said in an interview. Dr. Hall is a fellow in female pelvic medicine and reconstructive medicine at Brown University, Providence, R.I. She presented the study at the annual scientific meeting of the Society of Gynecologic Surgeons.
It’s not entirely surprising that SUI tends to be overlooked in patients with endometrial cancer. After all, they are going through a life-changing medical diagnosis, and oncologists are laser focused on achieving a cure when possible. But a bigger picture view, especially in light of the high cure rate for endometrial cancer when detected early, should encourage physicians to think differently about patient management.
The biggest trick may be incorporating concomitant surgeries into the surgical work flow. “It can be challenging logistically. It requires surgical planning and coordination between the two surgeons,” said Dr. Hall. But she said the experience at Brown University showed that it was possible with some patience. “It took a while to get the balls rolling, but once we figured out [it] worked for our institution, we’ve seen a continued uptake,” she said.
An important remaining question is the safety of the concomitant surgeries. Dr. Hall did not report any between-group differences in her presentation, but analysis is ongoing. They found a statistically significant increase in the number of readmissions among the concomitant surgery group, but most were deemed unlikely to be related to concomitant surgery.
In the study, 1,322 endometrial surgical candidates were screened for SUI, and 53% tested positive. Of these, 556 patients were offered concomitant surgical or nonsurgical SUI treatment: 21% chose concomitant surgery, 19% chose nonsurgical SUI treatment, and 60% of patients opted for no SUI treatment.
At 6 months after surgery, the concomitant surgery group was more likely to have a Urinary Distress Inventory (UDI)–Stress score of 0 than were those who were treated nonsurgically (odds ratio, 2.8; P = .0001) and those in the no-treatment group (OR, 3.7; P less than .0001). The concomitant group also was more likely to have a surgical site infection (SSI) score of 0 than was the nonsurgical group (OR, 2.9; P = .0008) and the no-treatment group (OR, 2.7; P less than .0001). Severe/very severe SSI scores occurred in 57% of the concomitant group at baseline, and this frequency dropped to 14% at 6 weeks (P less than .0001).
The study was funded by the Patient-Centered Outcomes Research Institute. Dr. Hall has no relevant financial disclosures.
SOURCE: Hall E et al. SGS 2019, oral presentation 12.
REPORTING FROM SGS 2019
First-of-its-kind study looks at pregnancies in prison
according to a systematic study believed to be the first of its kind.

That works out to 0.6% of the 56,262 women housed in the 23 prison systems on Dec. 31, 2016, Carolyn Sufrin, MD, PhD, of Johns Hopkins University, Baltimore, and her associates wrote in the American Journal of Public Health.
Nearly 1,400 pregnant women were admitted to the 26 federal prisons that house women and 22 state prison systems over a 1-year period in 2016-2017. The prisons involved in the study represent 57% of all women incarcerated in the United States, they noted.
Among the pregnancies completed while women were in prison, there were 753 live births: 685 at state facilities and 68 at federal sites. About 6% of those births were preterm, compared with almost 10% nationally in 2016, and 32% were cesarean deliveries, Dr. Sufrin and her associates reported.
All but six births occurred in a hospital; three “were attributable to precipitous labor with prison nurses or paramedics in attendance, and details were not available for the others,” they wrote. Of the 8% of non–live birth pregnancies, 6% were miscarriages, 1% were abortions, and the remainder were stillbirths or ectopic pregnancies. There were three newborn deaths and no maternal deaths.
“That prison pregnancy data have previously not been systematically collected or reported signals a glaring disregard for the health and well-being of incarcerated pregnant women. The Bureau of Justice Statistics collects data on deaths during custody but not births during custody. Despite this marginalization, it is important to recognize that incarcerated women are still members of broader society, that most of them will be released, and that some will give birth while in custody; therefore, their pregnancies must be counted,” the investigators wrote.
The study was supported by the Society of Family Planning Research Fund and the Eunice Kennedy Shriver National Institute of Child Health and Development. The investigators had no conflicts of interest to report.
SOURCE: Sufrin C et al. Am J Public Health. 2019 Mar 21:e1-7. doi: 10.2105/AJPH.2019.305006.
according to a systematic study believed to be the first of its kind.
That works out to 0.6% of the 56,262 women housed in the 23 prison systems on Dec. 31, 2016, Carolyn Sufrin, MD, PhD, of Johns Hopkins University, Baltimore, and her associates wrote in the American Journal of Public Health.
Nearly 1,400 pregnant women were admitted to the 26 federal prisons that house women and 22 state prison systems over a 1-year period in 2016-2017. The prisons involved in the study represent 57% of all women incarcerated in the United States, they noted.
Among the pregnancies completed while women were in prison, there were 753 live births: 685 at state facilities and 68 at federal sites. About 6% of those births were preterm, compared with almost 10% nationally in 2016, and 32% were cesarean deliveries, Dr. Sufrin and her associates reported.
All but six births occurred in a hospital; three “were attributable to precipitous labor with prison nurses or paramedics in attendance, and details were not available for the others,” they wrote. Of the 8% of non–live birth pregnancies, 6% were miscarriages, 1% were abortions, and the remainder were stillbirths or ectopic pregnancies. There were three newborn deaths and no maternal deaths.
“That prison pregnancy data have previously not been systematically collected or reported signals a glaring disregard for the health and well-being of incarcerated pregnant women. The Bureau of Justice Statistics collects data on deaths during custody but not births during custody. Despite this marginalization, it is important to recognize that incarcerated women are still members of broader society, that most of them will be released, and that some will give birth while in custody; therefore, their pregnancies must be counted,” the investigators wrote.
The study was supported by the Society of Family Planning Research Fund and the Eunice Kennedy Shriver National Institute of Child Health and Development. The investigators had no conflicts of interest to report.
SOURCE: Sufrin C et al. Am J Public Health. 2019 Mar 21:e1-7. doi: 10.2105/AJPH.2019.305006.
FROM THE AMERICAN JOURNAL OF PUBLIC HEALTH
Delay RRT for severe AKI in septic shock or ARDS
Clinical question: Does early renal replacement therapy (RRT) initiation affect clinical outcomes in patients with severe acute kidney injury (AKI) in the setting of septic shock or acute respiratory distress syndrome (ARDS)?
Background: Critically ill patients with AKI can benefit from RRT via improvement of electrolyte abnormalities, volume overload, and acid-base status. Potential harm from RRT includes complications of central venous access, intradialytic hypotension, and the bleeding risk of anticoagulation. The optimal timing of the elective initiation of RRT for AKI in septic shock or ARDS is unknown.
Study design: A post hoc subgroup study of a randomized, controlled trial.
Setting: Thirty-one ICUs in France.
Synopsis: Using data from the Artificial Kidney Initiation in Kidney Injury trial, the authors evaluated 619 patients with severe AKI and requirement for catecholamine infusion and/or invasive mechanical ventilation. Patients were randomly given RRT in an early or a delayed time frame. The early strategy involved RRT as soon as possible after randomization. In addition to the other parameters, the patients in the delayed group were given RRT for the following: anuria/oliguria 72 hours after randomization, blood urea nitrogen greater than 112 mg/dL, serum potassium greater than 6 mmol/L, metabolic acidosis with pH less than 7.15, or pulmonary edema from fluid overload causing severe hypoxia.
Early RRT did not show significant improvement in 60-day mortality, length of mechanical ventilation, or length of stay, compared with delayed RRT. The delayed RRT strategy was significantly associated with renal function recovery, with hazard ratios of 1.7 in ARDS (P = .009) and 1.9 in septic shock (P less than .001). Additionally, the likelihood of adequate urinary output was greater in the delayed RRT group.
Bottom line: A delayed RRT strategy in those with severe AKI and septic shock or ARDS may safely afford time for renal recovery in some patients.
Citation: Gaudry S et al. Timing of renal support and outcome of septic shock and acute respiratory distress syndrome. A post hoc analysis of the AKIKI randomized clinical trial. Am J Respir Crit Care Med. 2018;198(1):58-66.
Dr. James is a hospitalist at Emory University Hospital Midtown and an assistant professor at Emory University, both in Atlanta.

Weight gain highest with integrase inhibitors for HIV
SEATTLE – Weight gain in HIV treatment is highest with integrase inhibitors, especially dolutegravir (Tivicay), followed by raltegravir (Isentress), according to a review of thousands of North American patients during their first 5 years of therapy.
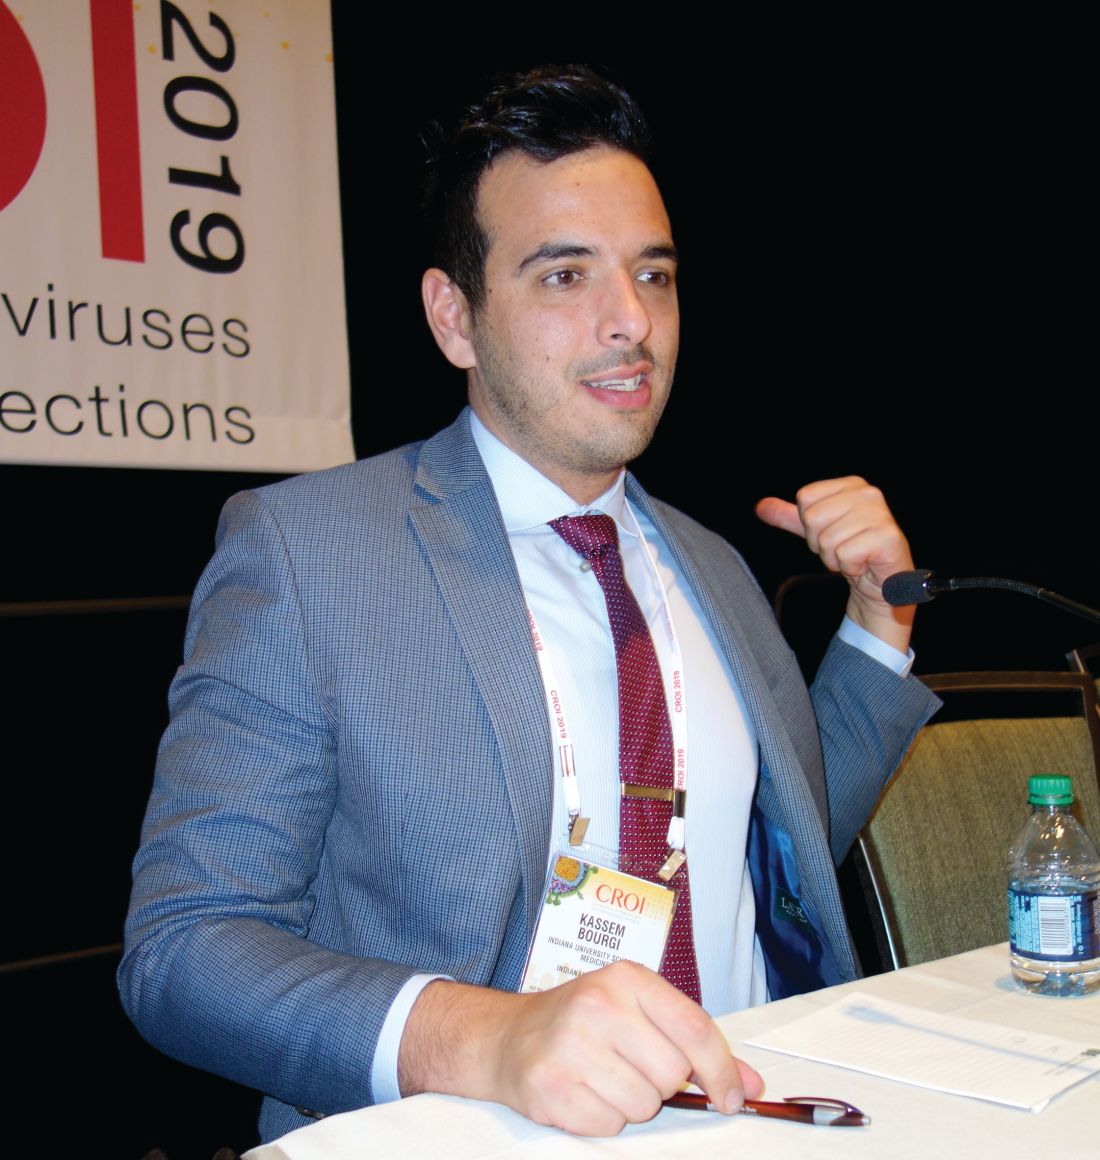
People “starting integrase inhibitors are gaining significantly more weight than ART [antiretroviral therapy] naive patients starting NNRTIs [nonnucleoside reverse transcriptase inhibitors]. They are also gaining more weight than ART patients starting PIs [protease inhibitors],” however, the differences do not always reach statistical significance, said lead investigator Kassem Bourgi, MD, an infectious disease fellow at Vanderbilt University, Nashville, Tenn.
“This is clinically important as” integrase inhibitor-based “regimens are now recommended first line,” and, as people with HIV live normal lifespans, they “are at increasing risk for obesity, metabolic comorbidities, and cardiovascular disease,” just like the rest of the population, he said.
Dr. Bourgi’s presentation was one of several at the Conference on Retroviruses and Opportunistic Infections tackling the issue of ART-induced obesity. There was great interest in the topic, and his study wasn’t the only one to find an increased risk of excess weight gain with integrase inhibitors.
“This is a real-world issue, and this is what we are seeing in our patients; they are dealing with this every day,” explained moderator Jane O’Halloran, MD, when asked about the impressive audience turnout for the ART obesity session.

Dr. Bourgi’s team turned to the North American AIDS Cohort Collaboration on Research and Design, which includes data on HIV patients throughout Canada and the United States, to compare weight gain outcomes among 24,001 people who started HIV treatment from 2007-2016; 49% started on NNRTI-based regimens, 31% on PIs, and 20% on integrase inhibitors. Elvitegravir (Vitekta) was most commonly used in the integrase group (45%), followed by raltegravir (35%), and dolutegravir (20%).
At 2 and 5 years, patients started on integrase inhibitors gained 4.9 and 6 kg, respectively, over their predicted weight, compared with 3.3 and 4.3 kg for NNRTIs, and 4.4 and 5.1 kg for PIs, adjusted for age, sex, race, cohort site, HIV acquisition mode, ART initiation year, and baseline weight, HIV-1 RNA, and CD4 cell count.
At 2 years among the integrase group, weight gain was 6 kg for dolutegravir, 4.9 kg for raltegravir, and 3.8 kg for elvitegravir; the weight gain for those on elvitegravir was comparable to that for those on PIs.
“Patients who started dolutegravir or raltegravir gained significantly more weight by year 2 compared with those who started elvitegravir,” Dr. Bourgi noted.
The mechanisms for the differences are unknown.
Integrase inhibitors are very well tolerated, so it could be that once on them, people feel so much better that, as one audience member put it, they just do “what everyone else does”: overeat. Dolutegravir also is associated with psychiatric symptoms, so maybe people on it are more likely to be taking psychiatric drugs that pack on the weight. Perhaps it’s something peculiar to the drugs. More work is needed on the issue, Dr. O’Halloran said.
Most of the subjects were men, and 38% were men who have sex with men. The median age at ART initiation was 42 years, and median weight body mass index 25 kg/m2. The median CD4 cell count was 303 cells/mm3.
The work was funded by Gilead, through an investigator sponsored grant. Dr. Bourgi didn’t say he had any disclosures.
SOURCE: Bourgi K et al. CROI 2019, Abstract 670.
SEATTLE – Weight gain in HIV treatment is highest with integrase inhibitors, especially dolutegravir (Tivicay), followed by raltegravir (Isentress), according to a review of thousands of North American patients during their first 5 years of therapy.
People “starting integrase inhibitors are gaining significantly more weight than ART [antiretroviral therapy] naive patients starting NNRTIs [nonnucleoside reverse transcriptase inhibitors]. They are also gaining more weight than ART patients starting PIs [protease inhibitors],” however, the differences do not always reach statistical significance, said lead investigator Kassem Bourgi, MD, an infectious disease fellow at Vanderbilt University, Nashville, Tenn.
“This is clinically important as” integrase inhibitor-based “regimens are now recommended first line,” and, as people with HIV live normal lifespans, they “are at increasing risk for obesity, metabolic comorbidities, and cardiovascular disease,” just like the rest of the population, he said.
Dr. Bourgi’s presentation was one of several at the Conference on Retroviruses and Opportunistic Infections tackling the issue of ART-induced obesity. There was great interest in the topic, and his study wasn’t the only one to find an increased risk of excess weight gain with integrase inhibitors.
“This is a real-world issue, and this is what we are seeing in our patients; they are dealing with this every day,” explained moderator Jane O’Halloran, MD, when asked about the impressive audience turnout for the ART obesity session.
Dr. Bourgi’s team turned to the North American AIDS Cohort Collaboration on Research and Design, which includes data on HIV patients throughout Canada and the United States, to compare weight gain outcomes among 24,001 people who started HIV treatment from 2007-2016; 49% started on NNRTI-based regimens, 31% on PIs, and 20% on integrase inhibitors. Elvitegravir (Vitekta) was most commonly used in the integrase group (45%), followed by raltegravir (35%), and dolutegravir (20%).
At 2 and 5 years, patients started on integrase inhibitors gained 4.9 and 6 kg, respectively, over their predicted weight, compared with 3.3 and 4.3 kg for NNRTIs, and 4.4 and 5.1 kg for PIs, adjusted for age, sex, race, cohort site, HIV acquisition mode, ART initiation year, and baseline weight, HIV-1 RNA, and CD4 cell count.
At 2 years among the integrase group, weight gain was 6 kg for dolutegravir, 4.9 kg for raltegravir, and 3.8 kg for elvitegravir; the weight gain for those on elvitegravir was comparable to that for those on PIs.
“Patients who started dolutegravir or raltegravir gained significantly more weight by year 2 compared with those who started elvitegravir,” Dr. Bourgi noted.
The mechanisms for the differences are unknown.
Integrase inhibitors are very well tolerated, so it could be that once on them, people feel so much better that, as one audience member put it, they just do “what everyone else does”: overeat. Dolutegravir also is associated with psychiatric symptoms, so maybe people on it are more likely to be taking psychiatric drugs that pack on the weight. Perhaps it’s something peculiar to the drugs. More work is needed on the issue, Dr. O’Halloran said.
Most of the subjects were men, and 38% were men who have sex with men. The median age at ART initiation was 42 years, and median weight body mass index 25 kg/m2. The median CD4 cell count was 303 cells/mm3.
The work was funded by Gilead, through an investigator sponsored grant. Dr. Bourgi didn’t say he had any disclosures.
SOURCE: Bourgi K et al. CROI 2019, Abstract 670.
REPORTING FROM CROI 2019
An HCV-infected population showed gaps in HBV testing, vaccination, and care
Assessment of a large cohort of hepatitis C virus (HCV)–infected patients revealed a high prevalence of current or past hepatitis B virus. However, within this cohort, there were notable gaps in HBV testing, directed care, and vaccination, according to Aaron M. Harris, MD, of the Centers for Disease Control and Prevention.

Dr. Harris and his colleagues abstracted patient-level data from the Grady Health System EHR in August 2016 to create an HCV patient registry. They found that, among 4,224 HCV-infected patients, 3,629 (86%) had test results for the hepatitis B surface antigen (HBsAg), with 43 (1.2%) being HBsAg positive.
“Our results identified a gap in care as a minority of HBsAg-positive patients with HCV coinfection received HBV DNA and/or e-antigen [HBeAg] testing,” the researchers stated.
Overall, only 2,342 (55.4%) patients had test results for all three HBV serologic markers. Among these, 789 (33.7%) were anti-HBc positive only, 678 (28.9%) were anti-HBc/anti-HBs positive, 190 (8.1%) were anti-HBs positive only, and 642 (27.4%) were HBV susceptible. In addition, only 50% of the HBV-susceptible patients received at least one dose of hepatitis B vaccine, according to the report published in Vaccine.
“Strategies are needed to increase hepatitis B testing, linkage to hepatitis B–directed care of HBV/HCV-coinfected patients, and to increase uptake in hepatitis B vaccination for HCV-infected patients within the Grady Health System,” the researchers concluded.
The study was funded by the CDC and the authors reported that they had no conflicts.
SOURCE: Harris AM et al. Vaccine. 2019;37:2188-93.
Assessment of a large cohort of hepatitis C virus (HCV)–infected patients revealed a high prevalence of current or past hepatitis B virus. However, within this cohort, there were notable gaps in HBV testing, directed care, and vaccination, according to Aaron M. Harris, MD, of the Centers for Disease Control and Prevention.
Dr. Harris and his colleagues abstracted patient-level data from the Grady Health System EHR in August 2016 to create an HCV patient registry. They found that, among 4,224 HCV-infected patients, 3,629 (86%) had test results for the hepatitis B surface antigen (HBsAg), with 43 (1.2%) being HBsAg positive.
“Our results identified a gap in care as a minority of HBsAg-positive patients with HCV coinfection received HBV DNA and/or e-antigen [HBeAg] testing,” the researchers stated.
Overall, only 2,342 (55.4%) patients had test results for all three HBV serologic markers. Among these, 789 (33.7%) were anti-HBc positive only, 678 (28.9%) were anti-HBc/anti-HBs positive, 190 (8.1%) were anti-HBs positive only, and 642 (27.4%) were HBV susceptible. In addition, only 50% of the HBV-susceptible patients received at least one dose of hepatitis B vaccine, according to the report published in Vaccine.
“Strategies are needed to increase hepatitis B testing, linkage to hepatitis B–directed care of HBV/HCV-coinfected patients, and to increase uptake in hepatitis B vaccination for HCV-infected patients within the Grady Health System,” the researchers concluded.
The study was funded by the CDC and the authors reported that they had no conflicts.
SOURCE: Harris AM et al. Vaccine. 2019;37:2188-93.
FROM VACCINE
Rash with hair loss

The FP had never seen a condition like this before, so he used some online resources to come up with a differential diagnosis that included sarcoidosis, leprosy, drug eruption, and mycosis fungoides. Aside from an occasional drug eruption, the other conditions were ones that he had seen in textbooks only.
Based on that differential diagnosis, the FP decided to do a punch biopsy of the largest nodule, which was near the patient’s mouth. (See the Watch & Learn video on “Punch biopsy.”)
The pathology report came back as folliculotropic mycosis fungoides. The FP researched the diagnosis and determined that this was a cutaneous T-cell lymphoma that involved hair follicles and tended to occur on the head and neck. This explained the patient’s hair loss in his beard and right eyebrow. While the prognosis for mycosis fungoides is quite good, the same cannot be said for the folliculotropic variant.
The FP referred the patient to Dermatology for further evaluation and treatment. In consultation with Hematology, the patient was treated with a potent topical steroid, chemotherapy, and narrowband ultraviolet B light therapy. His condition improved, but ongoing treatment and surveillance were needed.
Photos and text for Photo Rounds Friday courtesy of Richard P. Usatine, MD. This case was adapted from: Chacon G, Nayar A. Cutaneous T-cell lymphoma. In: Usatine R, Smith M, Mayeaux EJ, et al. Color Atlas and Synopsis of Family Medicine. 3rd ed. New York, NY: McGraw-Hill;2019:1124-1131.
To learn more about the newest 3rd edition of the Color Atlas and Synopsis of Family Medicine, see: https://www.amazon.com/Color-Atlas-Synopsis-Family-Medicine/dp/1259862046/
You can get the Color Atlas of Family Medicine app by clicking on this link: usatinemedia.com

Was Declining Treatment a Bad Idea?
A 50-year-old African-American man is referred to dermatology by his primary care provider for evaluation of colored stripes in most of his fingernails. These have been present, without change, for most of his adult life.
The patient has been told these changes probably represent fungal infection, but being dubious of that diagnosis, he declined recommended treatment. Nonetheless, he is interested in knowing exactly what is happening to his nails.
He denies personal or family history of skin cancer and of excessive sun exposure. He reports that several maternal family members have similar nail changes.

EXAMINATION
Seven of the patient’s 10 fingernails demonstrate linear brown streaks that uniformly average 1.5 to 2 mm in width. The streaks run the length of the nail, with no involvement of the adjacent cuticle. Some are darker than others.
The patient has type V skin with no evidence of excessive sun damage.
What’s the diagnosis?
DISCUSSION
Fortunately, this patient’s problem is benign and likely to remain so. Termed longitudinal (or linear) melanonychia (LM), these changes are seen in nearly all African-Americans older than 50 (although it is not uncommon for the condition to develop in the third decade of life). Other populations with dark skin are also at risk for LM, albeit at far lower rates. In white populations, the incidence is around 0.5% to 1%.
LM is caused by activation and proliferation of melanocytes in the nail matrix; they are focally incorporated into the nail plate as onychocytes that grow out with the nail. Typically 1 to 3 mm in uniform width, the streaks of LM range from tan to dark brown and can be solitary or multiple in a given nail.
As mentioned, LM is entirely benign, with almost no potential for malignant transformation. However, two notes of caution are in order: First, although African-American persons generally have very low risk for melanoma, the malignancy tends to manifest in this population in areas with the least pigment (eg, palms, soles, oral cavities, nail beds—unusual locations for most other racial groups). Second, the prognosis for these types of melanomas is poor; most patients and providers are unaware of them until an advanced stage that typically includes metastasis.
Therefore, in patients with skin of color, new or changing lesions in the nail bed must be evaluated by a knowledgeable dermatology provider, who may choose to biopsy the proximal aspect of the lesion to rule out cancer. Of course, any such lesion in a white person needs to be monitored carefully as well, since linear melanonychia is relatively uncommon in this group. Changes in the width, color, or border should cause concern, as should extension of the darker color onto the adjacent cuticle.
The differential for linear discoloration in nails or nail beds includes foreign body, warts, benign tumors (eg, nevi), glomus tumors (which are usually painful), and of course, fungal, mold, or yeast infections.
TAKE-HOME LEARNING POINTS
- Longitudinal (or linear) melanonychia (LM) is quite common in African-Americans, approaching a prevalence of 100% in those older than 50.
- Having multiple LMs in more than one finger is common in this population.
- However, a new or changing subungual lesion bears close monitoring, or even biopsy, by an experienced dermatology provider.
- Although African-Americans rarely develop melanoma, when they do, it’s often in the least pigmented areas (eg, palms, soles, mouth, and nails).
- The prognosis for proven melanoma in African-American patients is poor, making close monitoring a necessity.
A 50-year-old African-American man is referred to dermatology by his primary care provider for evaluation of colored stripes in most of his fingernails. These have been present, without change, for most of his adult life.
The patient has been told these changes probably represent fungal infection, but being dubious of that diagnosis, he declined recommended treatment. Nonetheless, he is interested in knowing exactly what is happening to his nails.
He denies personal or family history of skin cancer and of excessive sun exposure. He reports that several maternal family members have similar nail changes.
EXAMINATION
Seven of the patient’s 10 fingernails demonstrate linear brown streaks that uniformly average 1.5 to 2 mm in width. The streaks run the length of the nail, with no involvement of the adjacent cuticle. Some are darker than others.
The patient has type V skin with no evidence of excessive sun damage.
What’s the diagnosis?
DISCUSSION
Fortunately, this patient’s problem is benign and likely to remain so. Termed longitudinal (or linear) melanonychia (LM), these changes are seen in nearly all African-Americans older than 50 (although it is not uncommon for the condition to develop in the third decade of life). Other populations with dark skin are also at risk for LM, albeit at far lower rates. In white populations, the incidence is around 0.5% to 1%.
LM is caused by activation and proliferation of melanocytes in the nail matrix; they are focally incorporated into the nail plate as onychocytes that grow out with the nail. Typically 1 to 3 mm in uniform width, the streaks of LM range from tan to dark brown and can be solitary or multiple in a given nail.
As mentioned, LM is entirely benign, with almost no potential for malignant transformation. However, two notes of caution are in order: First, although African-American persons generally have very low risk for melanoma, the malignancy tends to manifest in this population in areas with the least pigment (eg, palms, soles, oral cavities, nail beds—unusual locations for most other racial groups). Second, the prognosis for these types of melanomas is poor; most patients and providers are unaware of them until an advanced stage that typically includes metastasis.
Therefore, in patients with skin of color, new or changing lesions in the nail bed must be evaluated by a knowledgeable dermatology provider, who may choose to biopsy the proximal aspect of the lesion to rule out cancer. Of course, any such lesion in a white person needs to be monitored carefully as well, since linear melanonychia is relatively uncommon in this group. Changes in the width, color, or border should cause concern, as should extension of the darker color onto the adjacent cuticle.
The differential for linear discoloration in nails or nail beds includes foreign body, warts, benign tumors (eg, nevi), glomus tumors (which are usually painful), and of course, fungal, mold, or yeast infections.
TAKE-HOME LEARNING POINTS
- Longitudinal (or linear) melanonychia (LM) is quite common in African-Americans, approaching a prevalence of 100% in those older than 50.
- Having multiple LMs in more than one finger is common in this population.
- However, a new or changing subungual lesion bears close monitoring, or even biopsy, by an experienced dermatology provider.
- Although African-Americans rarely develop melanoma, when they do, it’s often in the least pigmented areas (eg, palms, soles, mouth, and nails).
- The prognosis for proven melanoma in African-American patients is poor, making close monitoring a necessity.

BACE-1 inhibition worsens cognition in patients with prodromal Alzheimer’s disease
More bad news for Alzheimer’s research. Two more BACE inhibitors fall far short of the finish line.
Declining cognitive scores, falls, suicidal ideation, and liver enzyme abnormalities were all seen in clinical trials.
The news doesn’t bode well for the therapeutic target of BACE (beta-site APP cleaving enzyme) inhibition. BACE is one of the enzymes that trims the amyloid precursor protein (APP). Inhibiting it does reduce the amount of toxic amyloid-beta in cerebrospinal fluid, and amyloid plaque in the brain. But none of these molecules has shown clinical benefit in dementia patients, whether their disease is mild, or moderate or – now – prodromal. And it is now apparent that inhibiting BACE also produces serious off-target problems.
“BACE-1 inhibition certainly seemed to have a sound rationale assuming the basis for amyloid’s role in Alzheimer’s disease pathogenesis is a gain of toxicity,” Richard J. Caselli, MD, of the Mayo Clinic, Rochester, Minn., said in an interview. “That APP is important for Alzheimer’s pathogenesis still seems clear but whether amyloid-beta toxicity is the driving force is no longer clear. Further, interruption of the APP system disrupts more than amyloid-beta peptide, possibly explaining the adverse cognitive effects of BACE-1 inhibition shown exhibited now by three different BACE-1 inhibitors.”
Verubecestat
Researchers got their first dose of bad news regarding verubecestat at the 2017 Clinical Trials in Alzheimer’s Disease meeting. There, Michael F. Egan, MD, Merck’s associate vice president of clinical neuroscience, discussed the molecule’s failure to slow cognitive decline in patients with mild to moderate Alzheimer’s disease. There was plenty of biomarker evidence that the drug did block amyloid-beta production, but there also was a plethora of concerning adverse events, Dr. Egan said in an interview.
However, verubecestat still was being pursued in patients with prodromal Alzheimer’s disease. In February, Merck stopped the trial after a futility analysis and announced that the company was terminating studies of verubecestat in that population as well. In the April 11 issue of the New England Journal of Medicine, Dr. Egan and his colleagues report the full extent of verubecestat’s failure in prodromal patients, and the accompanying adverse events.
At the time of termination, 1,454 patients had been enrolled. Of these, 485 received 12 mg/day, 484 received 40 mg/day, and 485 received placebo. About half of each group completed 104 weeks of treatment in the study, which was designed to extend up to 5 years.
The primary outcome was change in the Clinical Dementia Rating Scale–Sum of Boxes score (CDR-SB). Seven secondary outcomes examined other cognitive and functional end points, along with changes in hippocampal volume on MRI and amyloid burden as determined in PET imaging.
Not only did verubecestat fail to slow cognitive decline, it appeared to exacerbate it. The mean change on the CDR-SB was 1.65 in the 12-mg group, 2.02 in the 40-mg group, and 1.58 in the placebo group, favoring placebo.
“In an exploratory analysis according to time point, scores on the CDR-SB were also higher [signifying more impairment of cognition and daily functioning] in the 40-mg group than in the placebo group at 13, 26, and 52 weeks ... suggesting but not confirming the possibility of worse performance at these earlier time points in the high-dose verubecestat group,” the investigators said.
Verubecestat also was associated with more conversions to Alzheimer’s disease. Per 100 patient-years, the Alzheimer’s disease event rates were 24.5 in the 12-mg group, 25.5 in the 40-mg group, and 19.3 in the placebo group. Compared with placebo, those taking 12-mg doses were 30% more likely to develop Alzheimer’s disease and those taking 40-mg doses were 38% more likely. The findings suggest that “verubecestat may have accelerated the progression to diagnosis of dementia due to Alzheimer’s disease,” the investigators said.
The negative impact of verubecestat was apparent quite early in the study. “In exploratory analyses, both dose levels of verubecestat were associated with poorer outcomes on the [Composite Cognition Score-3 Domain] and the ADAS-Cog [Alzheimer’s Disease Assessment Scale–Cognitive Subscale] measures of cognition that, relative to placebo, appeared worse at week 13 and did not appear to progress thereafter.”
Results of the secondary end points, including the ADAS-Cog and the Mini-Mental State Exam, also indicated that verubecestat may have worsened cognitive performance.
Imaging outcomes were positive, however. Hippocampal volume was 6,448 mL in the 12-mg group, 6,469 mL in the 40-mg group, and 6,435 mL in the placebo group. Brain amyloid increased in the placebo group, as expected, and decreased in the active groups. The small group of patients who underwent cerebrospinal fluid sampling showed reductions of more than 60% in amyloid-beta and soluble APP-beta associated with verubecestat. These results show that the molecule was indeed hitting its intended target, but that doing so was not clinically beneficial.
Adverse events were more common in the verubecestat groups. These included rash, dermatitis, urticaria, sleep disturbance, weight loss, and cough. Hair coloring changed in 2.5% of patients in the 12-mg group and 5% of the 40-mg group, but in none of the subjects taking placebo.
Patients taking verubecestat were more likely to sustain falls and injuries and to express suicidal ideation.
The results of this trial differ from the study of verubecestat in mild to moderate Alzheimer’s disease, the investigators noted. Those patients did not decline cognitively as did those with prodromal disease.
“Patients at an earlier stage of the disease may be more sensitive to the effects of substantial BACE-1 inhibition, perhaps because of a role of BACE-1 in normal synaptic function. It is also possible that the effects of verubecestat are due to inhibition of BACE-2,” they said.
Atabecestat
In a research letter in the same issue of the New England Journal of Medicine (2019 Apr 11;380:1483-5), David Henley, MD, senior director of Janssen’s Alzheimer’s clinical development core, released similarly negative results from an interim analysis of EARLY (Efficacy and Safety Study of Atabecestat in Participants Who Are Asymptomatic at Risk for Developing Alzheimer’s Dementia) trial, a randomized study of the BACE-1 inhibitor candidate, atabecestat.
The phase 2 trial enrolled 557 patients with prodromal Alzheimer’s disease. The primary cognitive end point was change from baseline in the Preclinical Alzheimer’s Cognitive Composite (PACC) score.
This trial was discontinued in May 2018 because of liver-related adverse events, although safety follow-up continues. The research letter did not disclose details of the hepatic events, but a company press release from May 2018 referred to them in a general sense.
“Elevations of liver enzymes, which were serious in nature, have been observed in some study participants who received the Janssen BACE inhibitor, atabecestat. After a thorough evaluation of all available liver safety data from our studies, Janssen has concluded that the benefit-risk ratio is no longer favorable to continue development of atabecestat for people who have late-onset preclinical stage Alzheimer’s disease.”
Patients in EARLY were randomized to 5 mg, 25 mg, or placebo. As in the verubecestat trial, those randomized to placebo did better. The mean changes from baseline in the PACC score were −1.44 in the 25-mg group, −0.58 in the 5-mg group, and −0.32 in the placebo group.
“At month 6, the difference between the 25-mg group and the placebo group was −1.12 and the difference between the 5-mg group and the placebo group was −0.26, favoring placebo over the higher dose,” the authors said.
This theme reemerged in a secondary end point, the Repeatable Battery for the Assessment of Neuropsychological Status. The 25-mg group declined 3.58 points more than placebo, and the 5-mg group, 1.43 points more.
Adverse events were more common in the active groups and included depression, effects on sleep and dreams, and anxiety.
“The differences in cognitive performance between the groups are of uncertain clinical significance; however, given similar findings favoring placebo over BACE-1 inhibitors in other trial, we are communicating this potential signal of worsening cognitive function in the treated groups,” Dr. Henley said.
SOURCE: Egan MF et al. N Engl J Med. 2019 Apr 11;380:1408-20.
“Some trials fail because the experimental treatment proves to be no different than a control or standard intervention,” David Knopman, MD, wrote in an accompanying editorial (N Engl J Med. 2019 Apr 11;380:1476-8). “Others fail because of unacceptable side effects. In this issue of the Journal, an article by Egan et al. and a letter to the editor by Henley et al. (N Engl J Med. 2019 Apr 11;380:1483-5) describe a third reason for failure – a treatment worsens the target symptoms.
Certainly, beta-site amyloid precursor protein-cleaving enzyme 1 (BACE-1) inhibition makes sense when viewed in the light of the current understanding of Alzheimer’s disease neuropathology. The amyloid cascade hypothesis holds that toxic amyloid-beta fragments accumulate in the brain, form dense neuritic plaques, and lead to neuronal death and cognitive decline.
“The model is rooted in the inseparability of Alzheimer’s disease from abundant amyloid-beta pathologic features,” Dr. Knopman wrote. But, “Over the past 2 decades, the amyloid-beta–lowering strategy has been put to the test in trials of antiamyloid antibodies, none of which have been successful.”
Therefore, hitting amyloid at the source – the transmembrane cleavage domain – seemed important and, potentially, effective. But three BACE inhibitors (verubecestat, atabecestat, and lanabecestat) have shown similarly negative cognitive effects. “Together, these results suggest that preserved BACE-1 activity may be critical to normal synaptic functions. These observations place a limitation on how amyloid-beta lowering can be accomplished.”
It is possible that decreasing the level of BACE inhibition might ameliorate off-target effects and neuronal compromise but still be enough to reduce the generation of toxic amyloid-beta fragments, Dr. Knopman said. But, “Adjustments in the dose to a narrow window of BACE-1 inhibition would be difficult to accomplish in a clinical trial until there are peripheral biomarkers that reflect the activity of the agent in the brain.”
Thus far, most of the studied antiamyloid drugs have indeed reduced amyloid-beta levels, but none of those reductions affected cognition. A rethinking of amyloid-beta’s place in dementia progression may be in order.
“The dissociation between amyloid-beta lowering and cognitive benefits with both BACE-1 inhibition and antiamyloid antibody therapy is troubling. To be blunt, amyloid-beta lowering seems to be an ineffective approach, and it is time to focus on other targets to move therapeutics for Alzheimer’s disease forward.”
Dr. Knopman is a clinical neurologist and Alzheimer’s researcher at the Mayo Clinic, Rochester, Minn.
More bad news for Alzheimer’s research. Two more BACE inhibitors fall far short of the finish line.
Declining cognitive scores, falls, suicidal ideation, and liver enzyme abnormalities were all seen in clinical trials.
The news doesn’t bode well for the therapeutic target of BACE (beta-site APP cleaving enzyme) inhibition. BACE is one of the enzymes that trims the amyloid precursor protein (APP). Inhibiting it does reduce the amount of toxic amyloid-beta in cerebrospinal fluid, and amyloid plaque in the brain. But none of these molecules has shown clinical benefit in dementia patients, whether their disease is mild, or moderate or – now – prodromal. And it is now apparent that inhibiting BACE also produces serious off-target problems.
“BACE-1 inhibition certainly seemed to have a sound rationale assuming the basis for amyloid’s role in Alzheimer’s disease pathogenesis is a gain of toxicity,” Richard J. Caselli, MD, of the Mayo Clinic, Rochester, Minn., said in an interview. “That APP is important for Alzheimer’s pathogenesis still seems clear but whether amyloid-beta toxicity is the driving force is no longer clear. Further, interruption of the APP system disrupts more than amyloid-beta peptide, possibly explaining the adverse cognitive effects of BACE-1 inhibition shown exhibited now by three different BACE-1 inhibitors.”
Verubecestat
Researchers got their first dose of bad news regarding verubecestat at the 2017 Clinical Trials in Alzheimer’s Disease meeting. There, Michael F. Egan, MD, Merck’s associate vice president of clinical neuroscience, discussed the molecule’s failure to slow cognitive decline in patients with mild to moderate Alzheimer’s disease. There was plenty of biomarker evidence that the drug did block amyloid-beta production, but there also was a plethora of concerning adverse events, Dr. Egan said in an interview.
However, verubecestat still was being pursued in patients with prodromal Alzheimer’s disease. In February, Merck stopped the trial after a futility analysis and announced that the company was terminating studies of verubecestat in that population as well. In the April 11 issue of the New England Journal of Medicine, Dr. Egan and his colleagues report the full extent of verubecestat’s failure in prodromal patients, and the accompanying adverse events.
At the time of termination, 1,454 patients had been enrolled. Of these, 485 received 12 mg/day, 484 received 40 mg/day, and 485 received placebo. About half of each group completed 104 weeks of treatment in the study, which was designed to extend up to 5 years.
The primary outcome was change in the Clinical Dementia Rating Scale–Sum of Boxes score (CDR-SB). Seven secondary outcomes examined other cognitive and functional end points, along with changes in hippocampal volume on MRI and amyloid burden as determined in PET imaging.
Not only did verubecestat fail to slow cognitive decline, it appeared to exacerbate it. The mean change on the CDR-SB was 1.65 in the 12-mg group, 2.02 in the 40-mg group, and 1.58 in the placebo group, favoring placebo.
“In an exploratory analysis according to time point, scores on the CDR-SB were also higher [signifying more impairment of cognition and daily functioning] in the 40-mg group than in the placebo group at 13, 26, and 52 weeks ... suggesting but not confirming the possibility of worse performance at these earlier time points in the high-dose verubecestat group,” the investigators said.
Verubecestat also was associated with more conversions to Alzheimer’s disease. Per 100 patient-years, the Alzheimer’s disease event rates were 24.5 in the 12-mg group, 25.5 in the 40-mg group, and 19.3 in the placebo group. Compared with placebo, those taking 12-mg doses were 30% more likely to develop Alzheimer’s disease and those taking 40-mg doses were 38% more likely. The findings suggest that “verubecestat may have accelerated the progression to diagnosis of dementia due to Alzheimer’s disease,” the investigators said.
The negative impact of verubecestat was apparent quite early in the study. “In exploratory analyses, both dose levels of verubecestat were associated with poorer outcomes on the [Composite Cognition Score-3 Domain] and the ADAS-Cog [Alzheimer’s Disease Assessment Scale–Cognitive Subscale] measures of cognition that, relative to placebo, appeared worse at week 13 and did not appear to progress thereafter.”
Results of the secondary end points, including the ADAS-Cog and the Mini-Mental State Exam, also indicated that verubecestat may have worsened cognitive performance.
Imaging outcomes were positive, however. Hippocampal volume was 6,448 mL in the 12-mg group, 6,469 mL in the 40-mg group, and 6,435 mL in the placebo group. Brain amyloid increased in the placebo group, as expected, and decreased in the active groups. The small group of patients who underwent cerebrospinal fluid sampling showed reductions of more than 60% in amyloid-beta and soluble APP-beta associated with verubecestat. These results show that the molecule was indeed hitting its intended target, but that doing so was not clinically beneficial.
Adverse events were more common in the verubecestat groups. These included rash, dermatitis, urticaria, sleep disturbance, weight loss, and cough. Hair coloring changed in 2.5% of patients in the 12-mg group and 5% of the 40-mg group, but in none of the subjects taking placebo.
Patients taking verubecestat were more likely to sustain falls and injuries and to express suicidal ideation.
The results of this trial differ from the study of verubecestat in mild to moderate Alzheimer’s disease, the investigators noted. Those patients did not decline cognitively as did those with prodromal disease.
“Patients at an earlier stage of the disease may be more sensitive to the effects of substantial BACE-1 inhibition, perhaps because of a role of BACE-1 in normal synaptic function. It is also possible that the effects of verubecestat are due to inhibition of BACE-2,” they said.
Atabecestat
In a research letter in the same issue of the New England Journal of Medicine (2019 Apr 11;380:1483-5), David Henley, MD, senior director of Janssen’s Alzheimer’s clinical development core, released similarly negative results from an interim analysis of EARLY (Efficacy and Safety Study of Atabecestat in Participants Who Are Asymptomatic at Risk for Developing Alzheimer’s Dementia) trial, a randomized study of the BACE-1 inhibitor candidate, atabecestat.
The phase 2 trial enrolled 557 patients with prodromal Alzheimer’s disease. The primary cognitive end point was change from baseline in the Preclinical Alzheimer’s Cognitive Composite (PACC) score.
This trial was discontinued in May 2018 because of liver-related adverse events, although safety follow-up continues. The research letter did not disclose details of the hepatic events, but a company press release from May 2018 referred to them in a general sense.
“Elevations of liver enzymes, which were serious in nature, have been observed in some study participants who received the Janssen BACE inhibitor, atabecestat. After a thorough evaluation of all available liver safety data from our studies, Janssen has concluded that the benefit-risk ratio is no longer favorable to continue development of atabecestat for people who have late-onset preclinical stage Alzheimer’s disease.”
Patients in EARLY were randomized to 5 mg, 25 mg, or placebo. As in the verubecestat trial, those randomized to placebo did better. The mean changes from baseline in the PACC score were −1.44 in the 25-mg group, −0.58 in the 5-mg group, and −0.32 in the placebo group.
“At month 6, the difference between the 25-mg group and the placebo group was −1.12 and the difference between the 5-mg group and the placebo group was −0.26, favoring placebo over the higher dose,” the authors said.
This theme reemerged in a secondary end point, the Repeatable Battery for the Assessment of Neuropsychological Status. The 25-mg group declined 3.58 points more than placebo, and the 5-mg group, 1.43 points more.
Adverse events were more common in the active groups and included depression, effects on sleep and dreams, and anxiety.
“The differences in cognitive performance between the groups are of uncertain clinical significance; however, given similar findings favoring placebo over BACE-1 inhibitors in other trial, we are communicating this potential signal of worsening cognitive function in the treated groups,” Dr. Henley said.
SOURCE: Egan MF et al. N Engl J Med. 2019 Apr 11;380:1408-20.
FROM THE NEW ENGLAND JOURNAL OF MEDICINE
Bendamustine/rituximab combo proves viable for comorbid CLL
A combination of bendamustine and rituximab generated an 88% overall response rate and 96% overall survival rate at 2 years among patients with chronic lymphocytic leukemia (CLL) in a study of 83 patients aged 53-83 years.
Although combined fludarabine, cyclophosphamide, and rituximab has demonstrated success in younger patients with CLL, this therapy is often considered too aggressive for the majority of CLL patients, who tend to be older and have multiple comorbidities, wrote Martin Špacek, MD, of Charles University and General University Hospital in Prague and his colleagues.
The alternative treatment combination of bendamustine and rituximab (BR) has not been well studied in patients with comorbidities, they said.
In a study published in Leukemia Research, the researchers enrolled 83 previously untreated adults with progressive CLL. The average age of the participants was 71 years, and 61% were men. The median creatinine clearance for the study population was 65 mL/min, and all patients had comorbidities, defined as scores greater than 6 on the Cumulative Illness Rating Scale (CIRS).
All patients were prescribed 90 mg/m2 bendamustine on days 1 and 2 combined with 375 mg/m2 rituximab on day 0 of the first course, and 500 mg/m2 rituximab on day 1 during subsequent courses every 28 days for a maximum of six cycles.
The overall response rate to BR was 88.0%, with a complete response rate of 20.5%. At 2 years, progression-free survival and overall survival rates were 69.9% and 96.2%, respectively.
A total of 51 patients (61.4%) experienced at least one grade 3 or 4 adverse event. The most common hematologic effects were neutropenia (40 patients), thrombocytopenia (14 patients), and anemia (8 patients). The most common nonhematologic effects were grade 3– or grade 4–level infections in 12 patients. Six patients developed severe skin rash.
Additionally, one patient developed sepsis during treatment and died after the first course of therapy.
“Age and CIRS failed to predict any severe toxicities or BR dose reduction,” the researchers noted.
The findings support data from previous studies and represent the largest study of CLL patients with significant comorbidities to be treated with BR, the researchers said.
More prospective research is needed, but the results demonstrate that “chemoimmunotherapy with BR is an effective therapeutic option with manageable toxicity for the initial treatment of CLL patients with significant comorbidities,” the investigators wrote.
The study was supported by the Ministry of Health, Czech Republic, the Charles University Progres program, and the Czech CLL Study Group. Researchers reported honoraria and travel grants from Mundipharma and Roche.
SOURCE: Spacek M et al. Leuk Res. 2019;79:17-21.
FROM LEUKEMIA RESEARCH
Key clinical point:
Major finding: The overall response rate for the combination therapy was 88.0%; complete response was 20.5%.
Study details: A prospective, observational study of 83 patients with chronic lymphocytic leukemia.
Disclosures: The study was supported by the Ministry of Health, Czech Republic, the Charles University Progres program, and the Czech CLL Study Group. Researchers reported honoraria and travel grants from Mundipharma and Roche.
Source: Spacek M et al. Leuk Res. 2019;79:17-21.
Study explores intracranial hemorrhage management in type 2 VWD
A lack of consistency exists surrounding the management of intracranial hemorrhage (ICH) in patients with von Willebrand disease (VWD), according to a clinical case report and literature review.
“Intracranial hemorrhage (ICH) in von Willebrand patients is a very rare event,” Ezio Zanon, MD, of the University Hospital of Padua (Italy), and his colleagues wrote in a letter to the editor published in Haemophilia.
The researchers reported findings from a case of a woman with type 2B VWD who experienced two spontaneous ICH events 12 years apart. Shortly after her admission for the second episode, the patient died as a result of severe bleeding.
Additionally, the team reviewed the body of literature for other cases of ICH and summarized the management strategies used in these patients.
“To date, only a few cases of intracranial hemorrhages in VWD are reported in literature,” the researchers wrote.
After analysis, the researchers found that a lack of consistency exists in the management of ICH in patients with VWD.
With respect to management strategies, Dr. Zanon and his colleagues suggested that ongoing prophylactic therapy with replacement concentrate could lower the risk of ICH recurrence. In the case presented, the patient was started on prophylaxis after the first ICH episode but it was interrupted 1 year later.
The team also recommended that hypertension should be closely monitored as it is a key risk factor for developing ICH. In the case presented, the patient had poorly controlled arterial hypertension.
“Studies and registries would be very important to define the burden of ICH in VWD patients clearly and establish its proper management,” they wrote.
No funding sources were reported. The authors reported having no conflicts of interest.
SOURCE: Zanon E et al. Haemophilia. 2019 Mar 29. doi: 10.1111/hae.13742.
FROM HAEMOPHILIA