User login
Enhanced team-based CVD care found to benefit diabetes patients
PHOENIX, ARIZ. – Diabetes patients in China who were enrolled in a team-based care intervention with clinical decision support systems significantly reduced their hemoglobin A1c, systolic blood pressure, and LDL cholesterol over 18 months, compared with those who received team-based care alone.

The finding comes from the Diabetes Complication Control in Community Clinics (D4C), a cluster randomized trial conducted in 38 community health centers in Xiamen, China.
“Diabetes has become a major public health challenge worldwide, especially in low- and middle-income countries where populations are large and growing and health care resources are limited,” Jiang He, MD, PhD, said at the Epidemiology and Prevention/Lifestyle and Cardiometabolic Health meeting.
According to Dr. He, chair and professor of epidemiology at Tulane School of Public Health and Tropical Medicine, New Orleans, the prevalence of diabetes has increased rapidly in recent decades in China, from 2.5% in 1994 to 11.6% in 2010. “It was estimated that 114 million Chinese adults had diabetes in 2010,” he said. “Hyperglycemia, high blood pressure, and elevated LDL cholesterol are major risk factors for cardiovascular disease and premature death. The majority of patients with diabetes have multiple uncontrolled CVD risk factors due to suboptimal care. Diabetes and its complications further strain an already overburdened and overwhelmed health care system, especially tertiary care facilities, in China. On the other hand, community health centers are underutilized.”
In D4C, Dr. He and colleagues set out to evaluate changes in CVD risk factors among patients with diabetes after implementing a team-based care model at community health centers in Xiamen, China. They compared the effectiveness of team-based care with clinical decision support systems versus team-based care alone on CVD risk factor control among patients with diabetes at these community health centers.
The study population consisted of 10,942 patients aged 50 years and older with uncontrolled diabetes and at least one of the following three additional CVD risk factors: systolic BP of at least 140 mm Hg and/or diastolic BP of at least 90 mm Hg; LDL cholesterol of at least 100 mg/dL, or clinical atherosclerotic cardiovascular disease (ASCVD). At the intervention clinics, team-based care was delivered by a team of primary care physicians, nurses, and diabetes specialists. The researchers trained the primary care physicians and nurses, and a clinical decision support system was integrated with guideline-based treatment algorithms for controlling glycemia, blood pressure, and lipids.
At the enhanced care control clinics, team-based care was delivered by a team of primary care physicians, nurses, and diabetes specialists. The city health commission trained the primary care physicians and nurses. The intervention lasted for 18 months in both groups.
Dr. He, the D4C study chair, reported findings from 10,942 patients: 5,394 in the intervention group and 5,548 in the enhanced care group. The mean baseline age was similar between the intervention group and the enhanced care group (a mean of 63 years), as was body mass index (a mean of 24.9 kg/m2), hemoglobin A1c (a mean of 8.8 vs. 8.7%, respectively), LDL cholesterol (121.2 vs. 121.1 mg/dL), systolic blood pressure (136.6 vs. 136.9 mm Hg), and diastolic blood pressure (79.7 vs. 79.8 mm Hg).
The researchers found patients in both groups experienced significant reductions in HbA1c, LDL cholesterol, and BP over the 18-month follow-up, but those in the intervention group fared better in all measures. Specifically, the mean change in HbA1c from baseline was –.85% in the intervention group, compared with –.66% in the enhanced care group, while the change in LDL was –19 mg/dL, compared with –12.8 mg/dL, respectively; the change in systolic blood pressure was –8.9 mm Hg vs. –7.7 mm Hg, and the change in 10-year ASCVD risk was .57% vs. .28% (P < .0001 for all associations).
The researchers also observed that the proportions of controlled HbA1c, LDL, and blood pressure at 18 months were higher in the intervention group, compared with the enhanced care group. Specifically, 38% of patients in the intervention group achieved glycemic control, compared with 35% of those in the enhanced care group (P =. 0006), while 48% vs. 39%, respectively, achieved control of LDL cholesterol (P < .0001), and 78% vs. 75% achieved control of blood pressure (P = .0009). In addition, 15% vs. 12% achieved control of all three risk factors at 18 months (P < .0001).
“Implementing team-based care with a clinical decision support system is an effective and sustainable strategy for diabetes control in primary care settings,” Dr. He said at the meeting, which was sponsored by the American Heart Association. “This implementation strategy could be scaled up within primary care settings in China and other low- to middle-income countries to improve CVD risk factor control in patients with diabetes.”
In an interview, session moderator Joshua J. Joseph, MD, of Ohio State University, Columbus, pointed out that since only 12%-15% of study participants achieved control of all three CVD risk factors, “that leaves a great opportunity for [figuring out] how to we get the other 88% or 85% of patients to target levels. That’s going to be important as we think about cardiovascular disease prevention in type 2 diabetes. The more we can use team-based care along with clinical decision support tools, the more we will continue to improve the lives of patients.”
The study was supported by the Xiamen City Health Commission. Dr. He reported having no financial disclosures.
SOURCE: He J et al. EPI/LIFESTYLE 2020, session 7A, abstract 17.
PHOENIX, ARIZ. – Diabetes patients in China who were enrolled in a team-based care intervention with clinical decision support systems significantly reduced their hemoglobin A1c, systolic blood pressure, and LDL cholesterol over 18 months, compared with those who received team-based care alone.
The finding comes from the Diabetes Complication Control in Community Clinics (D4C), a cluster randomized trial conducted in 38 community health centers in Xiamen, China.
“Diabetes has become a major public health challenge worldwide, especially in low- and middle-income countries where populations are large and growing and health care resources are limited,” Jiang He, MD, PhD, said at the Epidemiology and Prevention/Lifestyle and Cardiometabolic Health meeting.
According to Dr. He, chair and professor of epidemiology at Tulane School of Public Health and Tropical Medicine, New Orleans, the prevalence of diabetes has increased rapidly in recent decades in China, from 2.5% in 1994 to 11.6% in 2010. “It was estimated that 114 million Chinese adults had diabetes in 2010,” he said. “Hyperglycemia, high blood pressure, and elevated LDL cholesterol are major risk factors for cardiovascular disease and premature death. The majority of patients with diabetes have multiple uncontrolled CVD risk factors due to suboptimal care. Diabetes and its complications further strain an already overburdened and overwhelmed health care system, especially tertiary care facilities, in China. On the other hand, community health centers are underutilized.”
In D4C, Dr. He and colleagues set out to evaluate changes in CVD risk factors among patients with diabetes after implementing a team-based care model at community health centers in Xiamen, China. They compared the effectiveness of team-based care with clinical decision support systems versus team-based care alone on CVD risk factor control among patients with diabetes at these community health centers.
The study population consisted of 10,942 patients aged 50 years and older with uncontrolled diabetes and at least one of the following three additional CVD risk factors: systolic BP of at least 140 mm Hg and/or diastolic BP of at least 90 mm Hg; LDL cholesterol of at least 100 mg/dL, or clinical atherosclerotic cardiovascular disease (ASCVD). At the intervention clinics, team-based care was delivered by a team of primary care physicians, nurses, and diabetes specialists. The researchers trained the primary care physicians and nurses, and a clinical decision support system was integrated with guideline-based treatment algorithms for controlling glycemia, blood pressure, and lipids.
At the enhanced care control clinics, team-based care was delivered by a team of primary care physicians, nurses, and diabetes specialists. The city health commission trained the primary care physicians and nurses. The intervention lasted for 18 months in both groups.
Dr. He, the D4C study chair, reported findings from 10,942 patients: 5,394 in the intervention group and 5,548 in the enhanced care group. The mean baseline age was similar between the intervention group and the enhanced care group (a mean of 63 years), as was body mass index (a mean of 24.9 kg/m2), hemoglobin A1c (a mean of 8.8 vs. 8.7%, respectively), LDL cholesterol (121.2 vs. 121.1 mg/dL), systolic blood pressure (136.6 vs. 136.9 mm Hg), and diastolic blood pressure (79.7 vs. 79.8 mm Hg).
The researchers found patients in both groups experienced significant reductions in HbA1c, LDL cholesterol, and BP over the 18-month follow-up, but those in the intervention group fared better in all measures. Specifically, the mean change in HbA1c from baseline was –.85% in the intervention group, compared with –.66% in the enhanced care group, while the change in LDL was –19 mg/dL, compared with –12.8 mg/dL, respectively; the change in systolic blood pressure was –8.9 mm Hg vs. –7.7 mm Hg, and the change in 10-year ASCVD risk was .57% vs. .28% (P < .0001 for all associations).
The researchers also observed that the proportions of controlled HbA1c, LDL, and blood pressure at 18 months were higher in the intervention group, compared with the enhanced care group. Specifically, 38% of patients in the intervention group achieved glycemic control, compared with 35% of those in the enhanced care group (P =. 0006), while 48% vs. 39%, respectively, achieved control of LDL cholesterol (P < .0001), and 78% vs. 75% achieved control of blood pressure (P = .0009). In addition, 15% vs. 12% achieved control of all three risk factors at 18 months (P < .0001).
“Implementing team-based care with a clinical decision support system is an effective and sustainable strategy for diabetes control in primary care settings,” Dr. He said at the meeting, which was sponsored by the American Heart Association. “This implementation strategy could be scaled up within primary care settings in China and other low- to middle-income countries to improve CVD risk factor control in patients with diabetes.”
In an interview, session moderator Joshua J. Joseph, MD, of Ohio State University, Columbus, pointed out that since only 12%-15% of study participants achieved control of all three CVD risk factors, “that leaves a great opportunity for [figuring out] how to we get the other 88% or 85% of patients to target levels. That’s going to be important as we think about cardiovascular disease prevention in type 2 diabetes. The more we can use team-based care along with clinical decision support tools, the more we will continue to improve the lives of patients.”
The study was supported by the Xiamen City Health Commission. Dr. He reported having no financial disclosures.
SOURCE: He J et al. EPI/LIFESTYLE 2020, session 7A, abstract 17.
REPORTING FROM EPI/LIFESTYLE 2020
Comorbidities more common in hospitalized COVID-19 patients
Greater prevalence of underlying health conditions such as diabetes and chronic lung disease was seen among nearly 7,200 Americans hospitalized with coronavirus disease 2019 (COVID-19), according to the Centers for Disease Control and Prevention.
Of the 122,653 laboratory-confirmed COVID-19 cases reported to the CDC as of March 28, the COVID-19 Response Team had access to data on the presence or absence of underlying health conditions and other recognized risk factors for severe outcomes from respiratory infections for 7,162 (5.8%) patients.
“Among these patients, higher percentages of patients with underlying conditions were admitted to the hospital and to an ICU than patients without reported underlying conditions. These results are consistent with findings from China and Italy,” Katherine Fleming-Dutra, MD, and associates said in the MMWR.
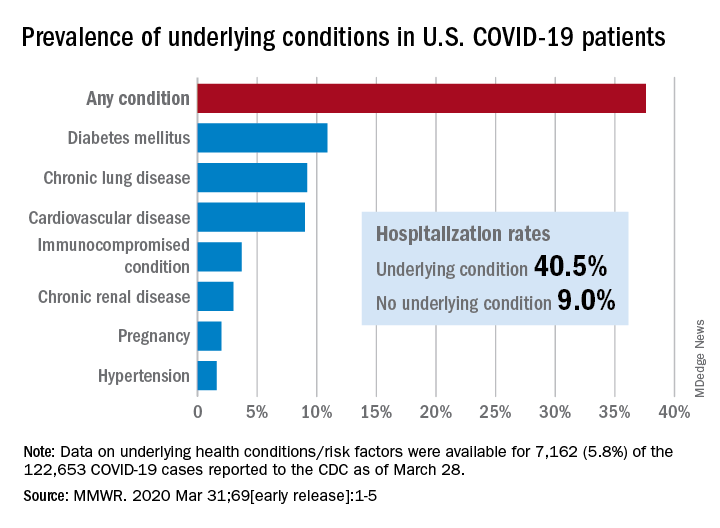
Individuals with underlying health conditions/risk factors made up 37.6% of all COVID-19 patients in the study but represented a majority of ICU (78%) and non-ICU (71%) hospital admissions. In contrast, 73% of COVID-19 patients who were not hospitalized had no underlying conditions, Dr. Fleming-Dutra and the CDC COVID-19 Response Team reported.
With a prevalence of 10.9%, diabetes mellitus was the most common condition reported among all COVID-19 patients, followed by chronic lung disease (9.2%) and cardiovascular disease (9.0%), the investigators said.
Another look at the data shows that 40.5% of those with underlying conditions were hospitalized, compared with 9.0% of the 4,470 COVID-19 patients without any risk factors.
“Strategies to protect all persons and especially those with underlying health conditions, including social distancing and handwashing, should be implemented by all communities and all persons to help slow the spread of COVID-19,” the response team wrote.
SOURCE: Fleming-Dutra K et al. MMWR. 2020 Mar 31;69 (early release):1-5.
Greater prevalence of underlying health conditions such as diabetes and chronic lung disease was seen among nearly 7,200 Americans hospitalized with coronavirus disease 2019 (COVID-19), according to the Centers for Disease Control and Prevention.
Of the 122,653 laboratory-confirmed COVID-19 cases reported to the CDC as of March 28, the COVID-19 Response Team had access to data on the presence or absence of underlying health conditions and other recognized risk factors for severe outcomes from respiratory infections for 7,162 (5.8%) patients.
“Among these patients, higher percentages of patients with underlying conditions were admitted to the hospital and to an ICU than patients without reported underlying conditions. These results are consistent with findings from China and Italy,” Katherine Fleming-Dutra, MD, and associates said in the MMWR.
Individuals with underlying health conditions/risk factors made up 37.6% of all COVID-19 patients in the study but represented a majority of ICU (78%) and non-ICU (71%) hospital admissions. In contrast, 73% of COVID-19 patients who were not hospitalized had no underlying conditions, Dr. Fleming-Dutra and the CDC COVID-19 Response Team reported.
With a prevalence of 10.9%, diabetes mellitus was the most common condition reported among all COVID-19 patients, followed by chronic lung disease (9.2%) and cardiovascular disease (9.0%), the investigators said.
Another look at the data shows that 40.5% of those with underlying conditions were hospitalized, compared with 9.0% of the 4,470 COVID-19 patients without any risk factors.
“Strategies to protect all persons and especially those with underlying health conditions, including social distancing and handwashing, should be implemented by all communities and all persons to help slow the spread of COVID-19,” the response team wrote.
SOURCE: Fleming-Dutra K et al. MMWR. 2020 Mar 31;69 (early release):1-5.
FROM MMWR
SARS serum neutralizing antibodies may inform the treatment of COVID-19
The immune responses of specific antibodies were maintained in more than 90% of recovered SARS-CoV patients for 2 years, raising the likelihood that the similarly behaving SARS-CoV-2 might provoke the same response, according to an online communication published in the Journal of Microbiology, Immunology and Infection.

The authors cited a cohort study of convalescent SARS-CoV patients (56 cases, from the Beijing hospital of the Armed Forces Police, China) that showed that specific IgG antibodies and neutralizing antibodies were highly correlated, peaking at month 4 after the onset of disease and decreasing gradually thereafter.
This and other studies suggest that the immune responses of specific antibodies were maintained in more than 90% of recovered SARS-CoV patients for 2 years, according to the authors.
However, of particular concern is the fact that only 11.8% of patients acquire specific SARS-CoV Abs in the early period after recovery at day 7, not reaching 100% until day 90, which highlights the importance of the detection of antibody titers for convalescent COVID-19 patients, according to the authors. “Otherwise, these patients with low titers of antibodies may not be efficient for the clearance of SARS-CoV-2.”
The authors also cited a recent study that showed how neutralizing antibody from a convalescent SARS patient could block the SARS-CoV-2 from entering into target cells in vitro, and suggested that previous experimental SARS-CoV vaccines and neutralizing antibodies could provide novel preventive and therapeutic options for COVID-19.
“These experiences from SARS-CoV are expected to have some implications for the treatment, management and surveillance of SARS-CoV-2 patients,” the authors concluded.
SOURCE: Lin Q et al. J Microbiol Immunol Infect. 2020 Mar 25. https://doi.org/10.1016/j.jmii.2020.03.015.
The immune responses of specific antibodies were maintained in more than 90% of recovered SARS-CoV patients for 2 years, raising the likelihood that the similarly behaving SARS-CoV-2 might provoke the same response, according to an online communication published in the Journal of Microbiology, Immunology and Infection.
The authors cited a cohort study of convalescent SARS-CoV patients (56 cases, from the Beijing hospital of the Armed Forces Police, China) that showed that specific IgG antibodies and neutralizing antibodies were highly correlated, peaking at month 4 after the onset of disease and decreasing gradually thereafter.
This and other studies suggest that the immune responses of specific antibodies were maintained in more than 90% of recovered SARS-CoV patients for 2 years, according to the authors.
However, of particular concern is the fact that only 11.8% of patients acquire specific SARS-CoV Abs in the early period after recovery at day 7, not reaching 100% until day 90, which highlights the importance of the detection of antibody titers for convalescent COVID-19 patients, according to the authors. “Otherwise, these patients with low titers of antibodies may not be efficient for the clearance of SARS-CoV-2.”
The authors also cited a recent study that showed how neutralizing antibody from a convalescent SARS patient could block the SARS-CoV-2 from entering into target cells in vitro, and suggested that previous experimental SARS-CoV vaccines and neutralizing antibodies could provide novel preventive and therapeutic options for COVID-19.
“These experiences from SARS-CoV are expected to have some implications for the treatment, management and surveillance of SARS-CoV-2 patients,” the authors concluded.
SOURCE: Lin Q et al. J Microbiol Immunol Infect. 2020 Mar 25. https://doi.org/10.1016/j.jmii.2020.03.015.
FROM THE JOURNAL OF MICROBIOLOGY, IMMUNOLOGY AND INFECTION
Which tube placement is best for a patient requiring enteral nutrition?
Comparative advantages of EN tubes
Case

A 68-year-old diabetic nonverbal female presents to the ED because of “seizure” 1 hour ago. On exam, her blood glucose is 200. She is unable to speak and has dysphagia because of a stroke she sustained last month. The patient’s husband adds that she hasn’t been eating and drinking sufficiently in the past couple of days. Imaging was negative for any acute intracranial bleeds or lesions. Labs showed a serum sodium level of 150 milliequivalents/L. D5W is started, and the following day, the patient has a sodium level of 154 milliequivalents/L.
Brief overview

Many hospitalized patients are unable to maintain hydration and/or nutritional status by mouth and will need enteral nutrition. Variables such as past medical history, swallowing ability, history of aspiration, prognosis, and functional capacity of each gastrointestinal segment will determine the best option for enteral nutrition for each patient. Each type of enteral tube feeding has advantages, disadvantages, and complications.
Overview of the data

Enteral nutrition should be started within 24-48 hours in a critically ill patient who is unable to maintain intake according to the American Society of Parenteral and Enteral Nutrition.1 This can be provided through a nasogastric (NG) tube, percutaneous endoscopic gastrostomy (PEG) tube, PEG tube with jejunal extension (PEG-J), or a percutaneous endoscopic jejunal (PEJ) tube.1
NG tubes are often the first method deployed because of their low cost and convenience. They are also suitable for the patient who requires this type of feeding for less than 4 weeks. However, NG tubes do require some patient cooperation (to place and maintain)and are contraindicated in some patients with orofacial trauma, upper GI tumors, inadequate lower esophageal sphincter tone, and gastroparesis.2

Another option is a PEG tube, which is a good alternative for patients who are sedated; ventilated; or have neurodegenerative processes, stroke with dysphagia, or head and neck cancers. These are typically recommended when enteral nutrition will be needed for more than 4 weeks. Disadvantages of PEG tubes include tube obstruction or displacement, gastroesophageal reflux, and leakage of gastric content around the percutaneous site or into the peritoneum.
PEG-J tubes, PEJ tubes, or jejunostomy tubes are best suited for patients with GI dysmotility, patients who have unsuccessfully undergone the aforementioned methods, patients with histories of partial gastrectomies, or patients with gastric or pancreatic cancers/multiple traumas. The PEG-J tube extends into the distal duodenum; because it is longer and more narrow, it is more likely to coil and occlude the flow of nutrients during feedings.2,3 Jejunal feeding methods incorporate a continuous pump controlled infusion; if set too rapidly, this could cause dumping syndrome. A benefit of jejunal nutrition is a lower risk of aspiration, compared with other enteral tubes.4
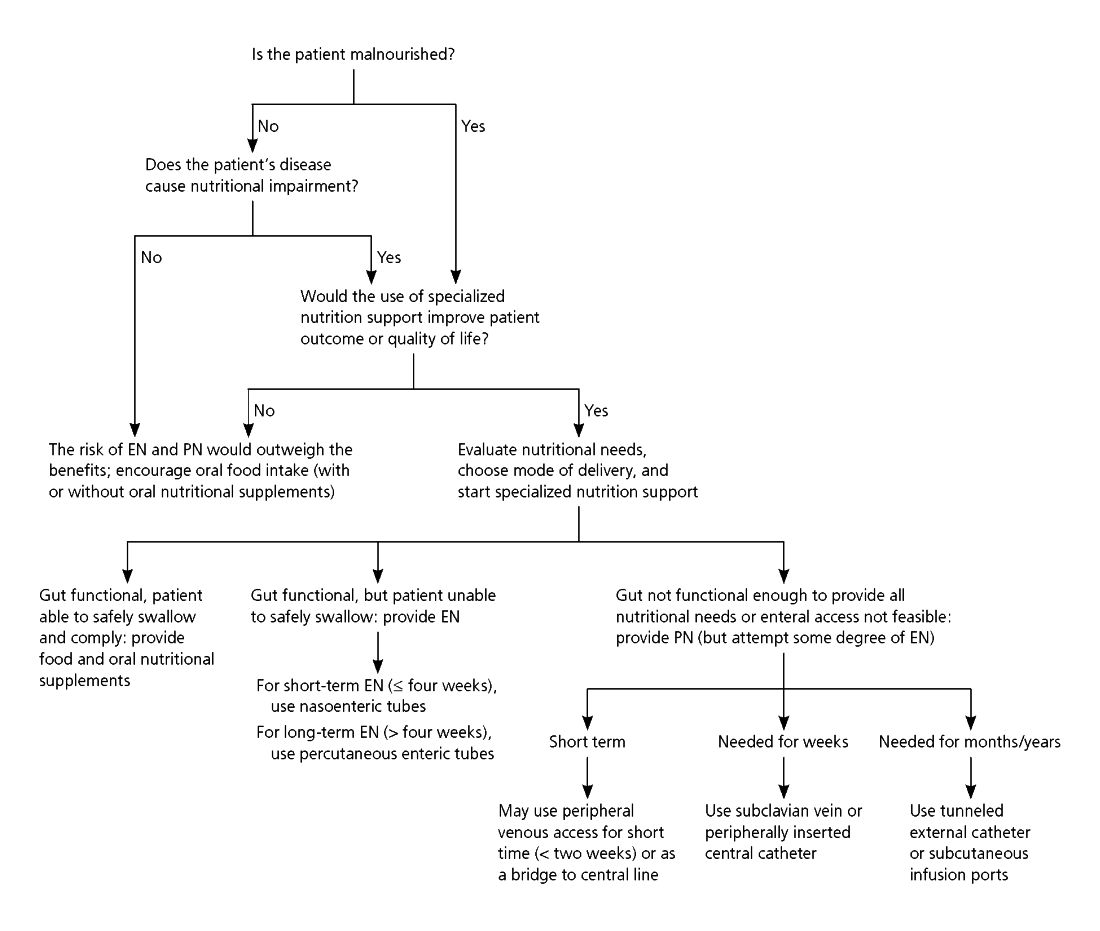
It is best to appraise the selected method for its efficacy and patient preference. The American College of Gastroenterology recommends starting with orogastric or nasogastric feeds, and switching to postpyloric or jejunal feeds for those intolerant to or at high risk for aspiration.5 The most important aspect is early enteral nutrition in hospitalized patients unable to maintain oral nutrition.
Application of the data to the original case

This is a severely hypernatremic diabetic patient unable to swallow. On day 2 of her hospitalization, the clinical team provided the patient with an NG tube for increased free-water intake to gradually decrease her serum sodium. By hospital day 4, the patient’s sodium had normalized. Considering the patient’s long-term prognosis and dysphagia, discussions were held with the patient and husband for PEG tube placement. The patient received a PEG tube and was subsequently discharged 2 days later.
Bottom line
Enteral nutrition is a common need among hospitalized patients. Modality of enteral nutrition will depend on the patient’s past medical history, anticipated duration, and preferences.
Dr. Basnet is the hospitalist program director for Apogee Physicians Group at Eastern New Mexico Medical Center in Roswell. Ms. Tayes is a third-year medical student at Burrell College of Osteopathic Medicine in Las Cruces, N.M., with interests in surgery, internal medicine, and emergency medicine. Ms. Gallivan is a third-year medical student at Burrell College of Osteopathic Medicine, with interests in cardiothoracic surgery, general surgery, and internal medicine.
References
1. Boullata JI et al. ASPEN Safe Practices for Enteral Nutrition Therapy. J Parenter Enteral Nutr. 2016;1-89.
2. Kirby DF et al. American Gastroenterological Association technical review on tube feeding for enteral nutrition. Gastroenterology. 1995;108:1282.
3. Lazarus BA et al. Aspiration associated with long-term gastric versus jejunal feeding: A critical analysis of the literature. Arch Phys Med Rehabil. 1990;71:46.
4. Alkhawaja S et al. Postpyloric versus gastric tube feeding for preventing pneumonia and improving nutritional outcomes in critically ill adults. Cochrane Database Syst Rev. 2015 Aug 4;(8):CD008875.
5. McCalve SA et al. ACG Clinical Guideline: Nutrition therapy in the hospitalized patient. Am J Gastroenterol. 2016;111:315-34. doi: 10.1038/ajg.2016.28.
Additional reading
Bellini LM. Nutrition Support in Advanced Lung Disease. UptoDate. https://www-uptodate-com.ezproxy.ad.bcomnm.org/contents/nutritional-support-in-advanced-lung-disease?. Published April 20, 2018.
Commercial Formulas for the Feeding Tube. The Oral Cancer Foundation. https://oralcancerfoundation.org/nutrition/commercial-formulas-feeding-tube/. Published June 5, 2018.
Marik Z. Immunonutrition in critically ill patients: A systematic review and analysis of the literature. Intensive Care Med. 2008;34(11). doi: 10.1007/s00134-008-1213-6.
Wischmeyer PE. Enteral nutrition can be given to patients on vasopressors. Crit Care Med. 2020;48(1):122-5. doi: 10.1097/CCM.0000000000003965.
Comparative advantages of EN tubes
Comparative advantages of EN tubes
Case
A 68-year-old diabetic nonverbal female presents to the ED because of “seizure” 1 hour ago. On exam, her blood glucose is 200. She is unable to speak and has dysphagia because of a stroke she sustained last month. The patient’s husband adds that she hasn’t been eating and drinking sufficiently in the past couple of days. Imaging was negative for any acute intracranial bleeds or lesions. Labs showed a serum sodium level of 150 milliequivalents/L. D5W is started, and the following day, the patient has a sodium level of 154 milliequivalents/L.
Brief overview
Many hospitalized patients are unable to maintain hydration and/or nutritional status by mouth and will need enteral nutrition. Variables such as past medical history, swallowing ability, history of aspiration, prognosis, and functional capacity of each gastrointestinal segment will determine the best option for enteral nutrition for each patient. Each type of enteral tube feeding has advantages, disadvantages, and complications.
Overview of the data
Enteral nutrition should be started within 24-48 hours in a critically ill patient who is unable to maintain intake according to the American Society of Parenteral and Enteral Nutrition.1 This can be provided through a nasogastric (NG) tube, percutaneous endoscopic gastrostomy (PEG) tube, PEG tube with jejunal extension (PEG-J), or a percutaneous endoscopic jejunal (PEJ) tube.1
NG tubes are often the first method deployed because of their low cost and convenience. They are also suitable for the patient who requires this type of feeding for less than 4 weeks. However, NG tubes do require some patient cooperation (to place and maintain)and are contraindicated in some patients with orofacial trauma, upper GI tumors, inadequate lower esophageal sphincter tone, and gastroparesis.2
Another option is a PEG tube, which is a good alternative for patients who are sedated; ventilated; or have neurodegenerative processes, stroke with dysphagia, or head and neck cancers. These are typically recommended when enteral nutrition will be needed for more than 4 weeks. Disadvantages of PEG tubes include tube obstruction or displacement, gastroesophageal reflux, and leakage of gastric content around the percutaneous site or into the peritoneum.
PEG-J tubes, PEJ tubes, or jejunostomy tubes are best suited for patients with GI dysmotility, patients who have unsuccessfully undergone the aforementioned methods, patients with histories of partial gastrectomies, or patients with gastric or pancreatic cancers/multiple traumas. The PEG-J tube extends into the distal duodenum; because it is longer and more narrow, it is more likely to coil and occlude the flow of nutrients during feedings.2,3 Jejunal feeding methods incorporate a continuous pump controlled infusion; if set too rapidly, this could cause dumping syndrome. A benefit of jejunal nutrition is a lower risk of aspiration, compared with other enteral tubes.4
It is best to appraise the selected method for its efficacy and patient preference. The American College of Gastroenterology recommends starting with orogastric or nasogastric feeds, and switching to postpyloric or jejunal feeds for those intolerant to or at high risk for aspiration.5 The most important aspect is early enteral nutrition in hospitalized patients unable to maintain oral nutrition.
Application of the data to the original case
This is a severely hypernatremic diabetic patient unable to swallow. On day 2 of her hospitalization, the clinical team provided the patient with an NG tube for increased free-water intake to gradually decrease her serum sodium. By hospital day 4, the patient’s sodium had normalized. Considering the patient’s long-term prognosis and dysphagia, discussions were held with the patient and husband for PEG tube placement. The patient received a PEG tube and was subsequently discharged 2 days later.
Bottom line
Enteral nutrition is a common need among hospitalized patients. Modality of enteral nutrition will depend on the patient’s past medical history, anticipated duration, and preferences.
Dr. Basnet is the hospitalist program director for Apogee Physicians Group at Eastern New Mexico Medical Center in Roswell. Ms. Tayes is a third-year medical student at Burrell College of Osteopathic Medicine in Las Cruces, N.M., with interests in surgery, internal medicine, and emergency medicine. Ms. Gallivan is a third-year medical student at Burrell College of Osteopathic Medicine, with interests in cardiothoracic surgery, general surgery, and internal medicine.
References
1. Boullata JI et al. ASPEN Safe Practices for Enteral Nutrition Therapy. J Parenter Enteral Nutr. 2016;1-89.
2. Kirby DF et al. American Gastroenterological Association technical review on tube feeding for enteral nutrition. Gastroenterology. 1995;108:1282.
3. Lazarus BA et al. Aspiration associated with long-term gastric versus jejunal feeding: A critical analysis of the literature. Arch Phys Med Rehabil. 1990;71:46.
4. Alkhawaja S et al. Postpyloric versus gastric tube feeding for preventing pneumonia and improving nutritional outcomes in critically ill adults. Cochrane Database Syst Rev. 2015 Aug 4;(8):CD008875.
5. McCalve SA et al. ACG Clinical Guideline: Nutrition therapy in the hospitalized patient. Am J Gastroenterol. 2016;111:315-34. doi: 10.1038/ajg.2016.28.
Additional reading
Bellini LM. Nutrition Support in Advanced Lung Disease. UptoDate. https://www-uptodate-com.ezproxy.ad.bcomnm.org/contents/nutritional-support-in-advanced-lung-disease?. Published April 20, 2018.
Commercial Formulas for the Feeding Tube. The Oral Cancer Foundation. https://oralcancerfoundation.org/nutrition/commercial-formulas-feeding-tube/. Published June 5, 2018.
Marik Z. Immunonutrition in critically ill patients: A systematic review and analysis of the literature. Intensive Care Med. 2008;34(11). doi: 10.1007/s00134-008-1213-6.
Wischmeyer PE. Enteral nutrition can be given to patients on vasopressors. Crit Care Med. 2020;48(1):122-5. doi: 10.1097/CCM.0000000000003965.
Ten Tips for a Crisis: Lessons from a Soldier
A few days ago, I had a heartfelt conversation with my good friend Dr Omayra Mansfield. Dr Mansfield has been an Emergency Department Physician for more than 12 years. She is also the wife of another physician and the mother of two young children, the recently appointed Chief Medical Officer at a hospital at AdventHealth, and one of the first graduates of the Physician Leader Development Course I teach.
“During the leadership course, you always provided examples of how physicians are like soldiers,” she began. She reminded me of my words describing how both doctors and soldiers are part of a professional body, how both have a cherished ethos and a set of directing values to guide both their path and their actions as a very special part of our society, and how of all the professions in our society, the military and medicine are the only two that deal in life and death, albeit in very different ways.
She had certainly paid attention in our seminars. Now, as she and her team faced the COVID-19 pandemic, she realized their daily challenges are expanding and they are now going to war. The leadership discussions that had sparked so much debate in our colloquia had now become real.
Dr Mansfield explained that beyond caring for patients, one of her key concerns was the physical and emotional well-being of the clinical staff at her hospital: the physicians, nurses, technicians, and clinicians under her care. Getting to her point, she asked if I might have any suggestions based on my time and experiences in combat that might be helpful to her as she “cared for her troops” as they faced the battle ahead.
Her request was a good one. Lessons from my military past immediately rushed to my mind. I started scribbling and came up with a Top Ten list of recommendations for anyone going into a tough fight. Here’s what I sent to her:
- Find a battle-buddy. On the first day of Army basic training, drill sergeants pair new recruits with one another. That’s primarily for accountability purposes throughout the weeks of training—to ensure soldiers hold each other responsible for getting to the right place, at the right time, in the right uniform—but it’s also part of a larger psychological dynamic related to building teams and mutual support within organizations. Your battle-buddy is charged with keeping you out of trouble, having your back, and being there when you need it most. In combat, battle-buddies do all those things and then some; they protect you from harm in so many other ways. Healthcare providers during this crisis will sometimes feel all alone, and they need to rely on someone else to help them when times get really tough. Having a battle-buddy—for those at the healthcare team level, of course, but also among those at the level of clinical director, hospital administrator, CMO, or even CEO—will help get you through the tough times and provide sanity when you need it the most. So my first piece of advice: Find a battle-buddy.
- Plan and prepare for things you don’t expect will happen. During a preparatory training exercise for our unit’s deployment to Iraq during the surge, when we thought the exercise was about to end, the trainers surprised us with a final crisis we had to solve. According to the scenario, Al Qaida had blown up a major bridge in our area, causing dire logistical problems for the security forces and challenges to the population as they brought their goods to market. I remember my initial reaction: “They don’t have the strength to do that. This’ll never happen,” I said to the Chief of Staff under my breath, as we started developing the required drill to counter the action and please the trainers. I quickly forgot about that lesson, until after we deployed. Two weeks into our 15-month tour in Iraq, the enemy blew the exact bridge that was part of the scenario, causing the exact problems that were predicted. Because we had prepared for the unexpected, we were able to quickly repair the bridge, reestablish the logistics flow, and satisfy the worried population. The lesson: Teams can hope for the best, but it’s always important to prepare for the worst—a lack of equipment, a key member of the team not being available to contribute, an overwhelming surge of patients—and then develop a plan to mitigate it. Take time to reflect, and ask yourself, What is the worst that can happen, what can the “enemy” do to disrupt our lives, and how do we prepare to counter it?
- Get everyone into the fight. In every organizations, it’s often true that some people take on too much and try and do it all themselves, others do only what they’re told to do, there’s the unique few who want to contribute but don’t know how they can to help, and then there’s some who even attempt to avoid contributing at all. It’s important for leaders to know who on their team fits each of these categories. It’s even more critical for leaders to be able to find ways to relieve the overworked, assign tasks to those who might not know their role, bring those who want to contribute into the fold, and cross-train teams to help relieve those who are exhausted. Leaders must look across their “battlespace” and ensure everyone is contributing. Leaders assign everyone tasks and do their best to level—and lighten—the load of the overworked.
- “Fatigue makes cowards of us all.” During any type of crisis, the body and mind will rapidly break down from lack of sleep, emotional strain, or overwhelming stress. While a 12-hour shift in a hospital is exceedingly tough even during normal operations, the COVID-19 crisis will demand dramatically more of all the members of any healthcare team. For that reason, leaders must incorporate rest cycles, team rotations, and half-days away from the hospitals even when all hands are on deck, as well as consider reducing shift times, if possible. Many who have experienced the disease in hot spots say this is really tough, but not attempting to plan for this will cause eventual breakdown and dysfunction. Take a break, do all you can to maintain a modicum of balance, and get away for a while.
- Take time to huddle. Communication and information are always key, but especially critical during any crisis. One technique that has proven valuable, beyond meetings and shift changes, is a preshift and postshift huddle. Different from the formal passing of critical information, the huddle is a brief opportunity for teams to pass informal information, look each other in the eye, and perhaps even pray together. As a two-star general, I did that every morning in combat with my small team of sergeants, captains, and privates before we left the headquarters to visit units, and it gave us all the power of knowing we had shared information, and we had a common operating picture. It gave us strength. During a crisis, all kinds of communication, formal and informal, are key.
- This ain’t peacetime. In a crisis, the enemy gets a vote. If leaders don’t find ways to counter the enemy’s action (and fast!), they’ll be behind the curve! It’s important to find the techniques and procedures that are bureaucratic (or even dumb) and overturn or eliminate them quickly. Decisions must be made with alacrity and with an understood flow, and people must be assigned responsibilities and held accountable to make things happen. In a crisis, speed in action will almost always trump perfection in understanding. Stay calm but ensure that those who might not understand this come around to the dynamics associated with the threat. A crisis isn’t the time for business as usual.
- Force adaptation—don’t wait ’til things are over to adjust. In a crisis, faults and disconnects in techniques and procedures often bubble to the surface and cause consternation. Don’t wait for a break in the action to adjust and find new ways to do things because a break in the action will usually never happen. The military has an expression: “Those who adapt the fastest on the battlefield win.” Find ways to look for and then publicize your methods of adaptation to the team, pin the rose on someone to ensure the changes are made, and then have someone make a historical record so other teams might also learn from your scar tissue. Lessons from the fight must be incorporated by the organization, or they’re not “lessons learned.”
- Talkin’ ain’t fightin’. During a crisis, it’s important to establish techniques of verbal shorthand between the members of a team, and everyone must know their responsibilities and required actions. In the military, this is called a battle drill; in medicine, you know it as a code. In these situations, leaders must find ways to pass information quickly, and the reaction should be immediate response. In a crisis, normal process must take on the dynamics of a “code.” All members of the team must understand that there are just times when things can’t be explained, but it’s also important that leaders know when to use this abbreviated format. Explain when you can, but act when you must.
- Cherish your teams. Every single team will experience things that human beings aren’t designed or meant to handle—even those in the medical profession, who likely thought they had seen it all. There will be repeated and overwhelming trauma, with the expected emotional reactions. The approach during these situations requires empathy, humility, emotional understanding, and validation. Praise your team at every opportunity, find ways to turn mistakes into learning opportunities, but most importantly be human and find ways to provide memories that your team can cherish and look back upon. Give them memories.
- Leaders don’t have the right to have a bad day. In 2004, after a 12-month deployment in Iraq, our unit was on our way home. We had been a long time away from our families, and we had experienced some tough fighting. A third of our unit had already returned to their families in Germany when we were told we would be extended because of a changing situation on the ground. A wave of frustration went through our 18,000 soldiers. Our commander then pulled us together, communicated our new mission, and told us he was also disappointed, but it was time we had to show our grit by getting those soldiers who had already returned to Europe back, unpack our equipment, and return to the fight. Then he said something I will always remember: “It’s tough, but understand your soldiers are looking at you to lead in this crisis … and leaders don’t have the right to have a bad day.” He didn’t mean we couldn’t be frustrated, or disappointed, or emotional, or even pissed off. He meant we just couldn’t show it when others were around. That’s one of the toughest things about leading during a crisis: The unimaginable is expected of leaders. And leaders have to be ready to lead.
All this advice may seem like philosophical musings rather than pragmatic thoughts for a crisis, but hopefully this advice will make a difference as healthcare providers tackle the issues ahead. Stay healthy, mitigate risks, but know that the calm provided by leaders will make a difference.
Younger gynecologic cancer patients at risk for early bone loss
Younger women treated for uterine or ovarian cancer are at increased risk for decreased bone mineral density and osteoporosis, especially in the first year after diagnosis, and they should be screened for bone changes, investigators advise.
This recommendation is based on results from a retrospective study of women, age 65 years and younger, all of whom underwent oophorectomy and most of whom received chemotherapy. Half of the women who had normal bone mineral density (BMD) at baseline were at risk for osteopenia or osteoporosis 5 years after diagnosis.
Rates of patients at risk for osteoporosis roughly doubled each year for the first 3 years of follow-up, reported study author Janelle Sobecki, MD, of the University of Wisconsin–Madison, and colleagues.
Their research is detailed in an abstract that had been slated for presentation at the Society of Gynecologic Oncology’s Annual Meeting on Women’s Cancer. The meeting was canceled because of the COVID-19 pandemic.
“Clinicians should follow current National Comprehensive Cancer Network guidelines regarding bone mineral density screening in women under 65 years old with cancer who have undergone therapy affecting their ovarian function [ovarian removal and/or antiestrogen therapies],” Dr. Sobecki said in an interview.
“Our findings indicate women with gynecologic cancer undergoing ovarian removal and chemotherapy may warrant sooner bone density evaluation, as early as 1 year following treatment. Bone loss screening in this population is feasible using opportunistic CT imaging,” she added.
Current guidelines recommending routine BMD evaluation every 2 years in women who received treatments impairing ovarian function are based largely on data in breast cancer patients, but there is a paucity of data on women who undergo oophorectomy and cancer therapies, both of which are known risk factors for bone loss, Dr. Sobecki noted.
“Bone loss is an important issue for women’s cancer survivorship, particularly for women who we expect to have long survival,” she said. “Identifying bone loss early is important for long-term bone health and prevention of osteoporosis in cancer survivors.”
Patient analysis
To get a better picture of long-term BMD changes and osteoporosis risk in younger patients, Dr. Sobecki and colleagues conducted a retrospective cohort study of women with uterine or ovarian cancers who underwent oophorectomy from 2010 to 2015.
The investigators calculated CT-based L1 trabecular attenuation BMD measurements (Hounsfield units, HU) on CT scans performed at baseline and at 1 year, 3 years, 5 years, and beyond 5 years after cancer diagnosis.
Osteoporosis risk was defined based on HU. Less than 100 HU was deemed “concerning” for osteoporosis, 100-150 HU was suggestive of osteopenia, and more than 150 HU indicated normal BMD.
The investigators reviewed scans for 185 patients with a median age of 55 years and a mean body mass index of 32 kg/m2. Each patient had at least a baseline scan and one additional CT scan during follow-up.
The majority of patients (78.1%) had ovarian cancer, 78.1% underwent chemotherapy, and 17.1% were treated with external beam radiation. As of 2019, 118 patients (63.6%) were still alive.
Results and next steps
The investigators found that BMD decreased from a mean of 179.4 HU at baseline to 146.5 HU at 1 year, a significant decline (P < .001), and to 123.63 HU beyond 5 years (P < .001). As noted before, half of the patients with normal BMD at baseline were at risk for osteopenia or osteoporosis at 5 years.
The proportion of patients at risk for osteoporosis at baseline was 4.3%, compared with 7.4% at 1 year, 15.7% at 3 years, 18% at 5 years, and 23.3% beyond 5 years. BMD at baseline was a significant predictor for bone loss at all time points. In multivariate analysis, chemotherapy predicted bone loss at 1 year (P = .03), and current smoking predicted BMD decrease at 5 years (P < .01).
“We plan to further investigate the role of chemotherapy in bone loss in gynecologic cancer patients, including chemotherapy dose-related bone loss,” Dr. Sobecki said. “We also plan to investigate bone loss in older women [over the age of 65] undergoing treatment for gynecologic cancer as they may be at greater risk than their baseline age-related risk.”
This study was internally funded. Dr. Sobecki reported no conflicts of interest.
SOURCE: Sobecki J et al. SGO 2020, Abstract 130.
FROM SGO 2020
FDA approves recombinant treatment for hemophilia A or B with inhibitors
The Food and Drug Administration has approved a new rabbit-derived recombinant analog of human coagulation factor VII (Sevenfact) for the treatment of hemophilia A or B, according to a release from the agency.

The treatment’s approval is for use in patients aged 12 years and older who’ve developed inhibitors (neutralizing antibodies). This factor VII (FVII) analog bypasses the FVIII and FIX reactions, which are no longer effective pathways for treatment in these patients because of the inhibitors they’ve developed.
According to the release, “the active ingredient of Sevenfact is a recombinant analog of human FVII, which is expressed in the mammary gland of genetically engineered rabbits and secreted into the rabbits’ milk. During purification and processing of the milk, FVII is converted into activated FVII.” The FDA’s Center for Veterinary Medicine has, after “comprehensive analysis of the scientific evidence,” determined that the process is safe for both the rabbits and handlers and that it is an effective means of producing the coagulation factor.
The approval is based on a clinical study that evaluated 27 patients with hemophilia A or B and included treatment for 465 mild to moderate events and 3 severe ones. The low (75 mcg/kg) or high (225 mcg/kg) dose was able to successfully treat 86% of the mild to moderate episodes, and all three of the severe ones were successfully treated with the high dose.
The most common side effects were headache, dizziness, infusion-site discomfort, infusion-related reaction, infusion-site hematoma, and fever. This product is contraindicated in patients with known allergies or hypersensitivities to rabbits or rabbit proteins. There is potential for increased risk of serious arterial or venous thrombotic events among patients with other risk factors for blood clots. More safety information can be found in the prescribing information, and more information about the approval can be found in the full release.
The Food and Drug Administration has approved a new rabbit-derived recombinant analog of human coagulation factor VII (Sevenfact) for the treatment of hemophilia A or B, according to a release from the agency.
The treatment’s approval is for use in patients aged 12 years and older who’ve developed inhibitors (neutralizing antibodies). This factor VII (FVII) analog bypasses the FVIII and FIX reactions, which are no longer effective pathways for treatment in these patients because of the inhibitors they’ve developed.
According to the release, “the active ingredient of Sevenfact is a recombinant analog of human FVII, which is expressed in the mammary gland of genetically engineered rabbits and secreted into the rabbits’ milk. During purification and processing of the milk, FVII is converted into activated FVII.” The FDA’s Center for Veterinary Medicine has, after “comprehensive analysis of the scientific evidence,” determined that the process is safe for both the rabbits and handlers and that it is an effective means of producing the coagulation factor.
The approval is based on a clinical study that evaluated 27 patients with hemophilia A or B and included treatment for 465 mild to moderate events and 3 severe ones. The low (75 mcg/kg) or high (225 mcg/kg) dose was able to successfully treat 86% of the mild to moderate episodes, and all three of the severe ones were successfully treated with the high dose.
The most common side effects were headache, dizziness, infusion-site discomfort, infusion-related reaction, infusion-site hematoma, and fever. This product is contraindicated in patients with known allergies or hypersensitivities to rabbits or rabbit proteins. There is potential for increased risk of serious arterial or venous thrombotic events among patients with other risk factors for blood clots. More safety information can be found in the prescribing information, and more information about the approval can be found in the full release.
FDA calls for market removal of ranitidine
A problem with both branded and generic over-the-counter and prescription forms, from the market.
![]()
The NDMA contamination does not stem from a manufacturing concern, but rather the levels have been found to increase over time depending on how the ranitidine is stored.
In particular, the FDA found through product testing that the NDMA impurity developed over time when the ranitidine was stored above room temperature.
“The testing also showed that the older a ranitidine product is, or the longer the length of time since it was manufactured, the greater the level of NDMA,” FDA said in a statement announcing the call for product withdrawal.
The FDA has been investigating NDMA contamination since September 2019 when the agency first announced the contamination in ranitidine. Manufacturers have been withdrawing their products from the market since the first reports of contamination surfaced. Despite these recalls, there were still ranitidine products on the market, according to an FDA spokesperson, necessitating the further action taken by the agency.
In addition to products being removed from the market, FDA is asking consumers to discard any ranitidine products they may have.
“There are still questions about how the impurity is formed in ranitidine over time during storage,” Janet Woodcock, MD, director of the FDA Center for Drug Evaluation and Research, said during an April 1 conference call with reporters announcing the withdrawal request. “For example, what impact does the drug packaging have on the development or the specific formulation have on the development of NDMA.”

She said the issue may be fixable over time, and the agency is open to reformulations that demonstrate that ranitidine is stable over time and under various storage conditions.
Dr. Woodcock stressed that the products at the point of manufacture do not have unacceptable levels of NDMA.
“This is a market withdrawal, this is not a recall because technically the products are okay. They met all their specs,” she said. “It is only when they are subjected generally to heat stress do they manifest higher levels” of NDMA.
“Clearly, we can’t have products on the market that if they are stored under conditions consumers might store them under that they would become unacceptable.”
Dr. Woodcock said FDA is not withdrawing approvals for the products, but manufacturers would need to show the product remains stable under normal storage conditions.
This article was updated 4/7/20.
A problem with both branded and generic over-the-counter and prescription forms, from the market.
![]()
The NDMA contamination does not stem from a manufacturing concern, but rather the levels have been found to increase over time depending on how the ranitidine is stored.
In particular, the FDA found through product testing that the NDMA impurity developed over time when the ranitidine was stored above room temperature.
“The testing also showed that the older a ranitidine product is, or the longer the length of time since it was manufactured, the greater the level of NDMA,” FDA said in a statement announcing the call for product withdrawal.
The FDA has been investigating NDMA contamination since September 2019 when the agency first announced the contamination in ranitidine. Manufacturers have been withdrawing their products from the market since the first reports of contamination surfaced. Despite these recalls, there were still ranitidine products on the market, according to an FDA spokesperson, necessitating the further action taken by the agency.
In addition to products being removed from the market, FDA is asking consumers to discard any ranitidine products they may have.
“There are still questions about how the impurity is formed in ranitidine over time during storage,” Janet Woodcock, MD, director of the FDA Center for Drug Evaluation and Research, said during an April 1 conference call with reporters announcing the withdrawal request. “For example, what impact does the drug packaging have on the development or the specific formulation have on the development of NDMA.”
She said the issue may be fixable over time, and the agency is open to reformulations that demonstrate that ranitidine is stable over time and under various storage conditions.
Dr. Woodcock stressed that the products at the point of manufacture do not have unacceptable levels of NDMA.
“This is a market withdrawal, this is not a recall because technically the products are okay. They met all their specs,” she said. “It is only when they are subjected generally to heat stress do they manifest higher levels” of NDMA.
“Clearly, we can’t have products on the market that if they are stored under conditions consumers might store them under that they would become unacceptable.”
Dr. Woodcock said FDA is not withdrawing approvals for the products, but manufacturers would need to show the product remains stable under normal storage conditions.
This article was updated 4/7/20.
Liraglutide gives adolescents with obesity an edge in managing weight loss
Prescribing liraglutide plus lifestyle therapy for adolescents with obesity resulted in greater weight loss and greater reduction in body mass index, compared with those prescribed lifestyle therapy alone, according to findings from a new study published in The New England Journal of Medicine.
Liraglutide with lifestyle therapy also “compared favorably in terms of [body mass index] reduction,” compared with other pediatric weight-management programs in the United States and with use of orlistat, wrote Aaron S. Kelly, PhD, of the University of Minnesota, Minneapolis, and colleagues. The study abstract was presented during a virtual news conference held by The Endocrine Society. It had been slated for presentation during ENDO 2020, the society’s annual meeting, which was canceled because of the COVID-19 pandemic.
The study included adolescents aged 12-17 years, who had obesity (BMI, ≥30 kg/m2) and had responded poorly to recommendations involving lifestyle therapy only, as judged by the site investigator and documented in the participant’s medical records. The adolescents participated at one of five sites in Belgium, Mexico, Russia, Sweden, and the United States.
In the randomized, controlled, double-blind trial, 125 participants received 3 mg liraglutide, and 126 received placebo for 56 weeks, during which both groups received lifestyle therapy, “defined as counseling about healthy nutrition and physical activity for weight loss,” the authors wrote.
After 12-weeks of run-in, the treatment period lasted 56 weeks, with a follow-up 26 weeks after treatment ended. The liraglutide group retained 80.8% of its participants, and the placebo group, 79.4%.
At week 56, there were no significant differences between the groups in blood pressure, fasting lipids, fasting plasma glucose, or hemoglobin A1c, the authors noted.
However, in the liraglutide group, 43.3% of participants lost at least 5% of their BMI, compared with 18.7% in the control group. Similarly, 26.1% of those in the liraglutide group had a BMI reduction of at least 10%, compared with 8.1% in the control group.
Participants in the liraglutide group also saw a greater reduction in BMI, compared with those in the placebo group (estimated difference, 4.64 percentage points), and those taking liraglutide lost 9.9 pounds (4.5 kg) more than those receiving placebo – a relative reduction of 5%. The authors noted that a weight loss of 3%-5% “significantly improves some health-related outcomes in adults.”
In addition, the liraglutide group had a BMI standard-deviation score that was 0.22 lower than that in the placebo group (P = .002), but after the participants discontinued with the trial, “a greater increase in the BMI standard-deviation score was observed with liraglutide than with placebo (0.15),” the authors reported.
“Although evidence in children is limited, a change in BMI standard-deviation score of at least 0.20 has been suggested to be clinically meaningful,” they wrote. “Some studies indicate that even temporary weight loss may have long-term benefits, but the extent to which this applies in adolescents and the extent to which long-term adherence to pharmacotherapy can be expected are unknown.”
The researchers added that the reduction in standard-deviation score seen in this study, of 0.22, was a bigger reduction than that seen in lifestyle therapy trials from the U.S. Preventive Services Task Force and from an overview of six Cochrane reviews. Their trial also, however, had a fairly high adherence rate, over 80%.
No notable differences in cardiometabolic markers or in quality of life showed up between the liraglutide and placebo groups. The heterogeneous treatment response in this and past studies suggests the need for future trials to “characterize predictors of treatment response to identify patients who would benefit the most from treatment,” the authors wrote.
About twice as many participants taking liraglutide experienced gastrointestinal adverse events compared with those receiving placebo (64.8% vs. 36.5%, respectively). Those symptoms, a known side effect of this drug type, included nausea, vomiting, and diarrhea and occurred primarily during escalation of the drug dose before then dropping in frequency. Still, the authors note that the high rate of gastrointestinal effects “suggests that this treatment may not be suitable for all patients.”
None of the adolescents receiving the placebo stopped treatment, but 10.4% of those taking liraglutide discontinued. One participant in the liraglutide group died by suicide, but the death was determined to be unrelated to the therapy.
Although the 0.22 reduction in the BMI standard-deviation score was for the intent-to-treat population, the authors calculated that the difference would have been 0.26 “if all participants had adhered to the treatment throughout the trial.”
Novo Nordisk funded the research. Several of the authors reported that they are employees of the company.
The abstract will also be published in a special supplemental issue of the Journal of the Endocrine Society. In addition to a series of news conferences on March 30-31, the society will ost ENDO Online 2020 during June 8-22, which will present programming for clinicians and researchers.
Source: Kelly AS et al. NEJM. 2020 Mar 31. doi: 10.1056/NEJMoa1916038.
FROM THE NEW ENGLAND JOURNAL OF MEDICINE
Routinely screen for depression in atopic dermatitis
Jonathan I. Silverberg, MD, PhD, declared in a video presentation during a virtual meeting held by the George Washington University department of dermatology.

The virtual meeting included presentations that had been slated for the annual meeting of the American Academy of Dermatology, which was canceled because of the COVID-19 pandemic.
Dr. Silverberg presented highlights of his recent study of depression screening rates in the National Ambulatory Medical Care Survey, an annual population-based survey by the National Center for Health Statistics. He and his coinvestigator analyzed 9,345 office visits for atopic dermatitis (AD) and 2,085 for psoriasis (Br J Dermatol. 2019 Oct 24. doi: 10.1111/bjd.18629.). The picture that emerged showed that there is much room for improvement.
“We found that depression screening rates were abysmally low in atopic dermatitis patients, with less than 2% patients being screened. There was very little difference in screening rates between patients on an advanced therapy, like systemic phototherapy or a biologic, compared to those who were just on topical therapy alone, meaning even the more severe patients aren’t being asked these questions. And no difference between dermatologists and primary care physicians,” said Dr. Silverberg, director of clinical research and contact dermatitis in the department of dermatology at George Washington University, Washington.
For Dr. Silverberg, known for his pioneering work documenting the marked yet often-underappreciated negative impact of AD on quality of life and mental health, these rock-bottom screening rates were particularly galling.
“There are very high rates of anxiety and depression amongst our patients with atopic dermatitis,” the dermatologist emphasized. “Mental health symptoms are an incredibly important domain in atopic dermatitis that we need to ask our patients about. We don’t ask enough.
“This to me is actually a very important symptom to measure. It’s not just a theoretical construct involved in understanding the burden of the disease, it’s something that’s actionable because most of these cases of mental health symptoms are reversible or modifiable with improved control of the atopic dermatitis,” he continued. “I use this as an indication to step up therapy. If a patient is clinically depressed and we believe that’s secondary to their chronic atopic dermatitis, this is a reason to step up therapy to something stronger.”
If the depressive symptoms don’t improve after stepping up the intensity of the dermatologic therapy, it’s probably time for the patient to see a mental health professional, Dr. Silverberg advised, adding, “I’m not telling every dermatology resident out there to become a psychiatrist.”
Depression and anxiety in AD: How common?
In an analysis of multiyear data from the Medical Expenditure Panel Surveys, an annual population-based project conducted by the Agency for Healthcare Research and Quality, Dr. Silverberg and a coinvestigator found that adults with AD were an adjusted 186% more likely than those without AD to screen positive for depressive symptoms on the two-item Patient Health Questionnaire (PHQ-2), with rates of 44.3% and 21.9%, respectively. The AD patients were also 500% more likely to screen positive for severe psychological distress, with a 25.9% rate of having a Kessler-6 index score of 13 or more, compared with 5.5% in adults without AD.
The rate of severe psychological distress was higher in adults with AD than in those with asthma, diabetes, hypertension, urticaria, or psoriasis, and was comparable with the rate in individuals with autoimmune disease (Ann Allergy Asthma Immunol. 2019 Aug;123[2]:179-85).
“It’s surprising when you think that the majority of the cases of atopic dermatitis in the population are mild and yet when you look at a population-based sample such as this you see a strong signal come up. It means that, with all the dilution of mild disease, the signal is still there. It emphasizes that even patients with mild disease get these depressive symptoms and psychosocial distress,” Dr. Silverberg observed.
In a separate analysis of the same national database, this time looking at Short Form-6D health utility scores – a measure of overall quality of life encompassing key domains including vitality, physical function, mental health, fatigue – adults with AD scored markedly worse than individuals with no chronic health disorders. Health utility scores were particularly low in adults with AD and comorbid symptoms of anxiety or depression, suggesting that those affective symptoms are major drivers of the demonstrably poor quality of life in adult AD (Ann Allergy Asthma Immunol. 2020 Jan;124[1]:88-9).
In the Atopic Dermatitis in America Study, Dr. Silverberg and coinvestigators cross-sectionally surveyed 2,893 adults using the seven-item Hospital Anxiety and Depression Scale anxiety (HADS-A) and depression (HADS-D) assessment instruments. Individuals with AD as determined using the modified U.K. Diagnostic Criteria had dramatically higher rates of both depression and anxiety. For example, the prevalence of a HADS-A score of 11 or more, which is considered to be case finding for clinically important anxiety, was 28.6% in adults with AD, nearly twice the 15.5% prevalence in those without the dermatologic disease. A HADS-D score of 11 or greater was present in 13.5% of subjects with AD and 9% of those without.
HADS-A and -D scores were higher in adults with moderate AD, compared with mild disease, and higher still in those with severe AD. Indeed, virtually all individuals with moderate to severe AD had symptoms of anxiety and depression, which in a large proportion had gone undiagnosed. A multivariate analysis strongly suggested that AD severity was the major driver of anxiety and depression in adults with AD (Br J Dermatol. 2019 Sep;181[3]:554-65).
An important finding was that 100% of adults with AD who had scores in the severe range on three validated measures of itch, frequency of symptoms, and lesion severity had borderline or abnormal scores on the HADS-A and -D.
“Of course, if you don’t ask, you’re not going to know about it,” Dr. Silverberg noted.
Dr. Silverberg reported receiving research grants from Galderma and GlaxoSmithKline and serving as a consultant to those pharmaceutical companies and more than a dozen others.
Jonathan I. Silverberg, MD, PhD, declared in a video presentation during a virtual meeting held by the George Washington University department of dermatology.
The virtual meeting included presentations that had been slated for the annual meeting of the American Academy of Dermatology, which was canceled because of the COVID-19 pandemic.
Dr. Silverberg presented highlights of his recent study of depression screening rates in the National Ambulatory Medical Care Survey, an annual population-based survey by the National Center for Health Statistics. He and his coinvestigator analyzed 9,345 office visits for atopic dermatitis (AD) and 2,085 for psoriasis (Br J Dermatol. 2019 Oct 24. doi: 10.1111/bjd.18629.). The picture that emerged showed that there is much room for improvement.
“We found that depression screening rates were abysmally low in atopic dermatitis patients, with less than 2% patients being screened. There was very little difference in screening rates between patients on an advanced therapy, like systemic phototherapy or a biologic, compared to those who were just on topical therapy alone, meaning even the more severe patients aren’t being asked these questions. And no difference between dermatologists and primary care physicians,” said Dr. Silverberg, director of clinical research and contact dermatitis in the department of dermatology at George Washington University, Washington.
For Dr. Silverberg, known for his pioneering work documenting the marked yet often-underappreciated negative impact of AD on quality of life and mental health, these rock-bottom screening rates were particularly galling.
“There are very high rates of anxiety and depression amongst our patients with atopic dermatitis,” the dermatologist emphasized. “Mental health symptoms are an incredibly important domain in atopic dermatitis that we need to ask our patients about. We don’t ask enough.
“This to me is actually a very important symptom to measure. It’s not just a theoretical construct involved in understanding the burden of the disease, it’s something that’s actionable because most of these cases of mental health symptoms are reversible or modifiable with improved control of the atopic dermatitis,” he continued. “I use this as an indication to step up therapy. If a patient is clinically depressed and we believe that’s secondary to their chronic atopic dermatitis, this is a reason to step up therapy to something stronger.”
If the depressive symptoms don’t improve after stepping up the intensity of the dermatologic therapy, it’s probably time for the patient to see a mental health professional, Dr. Silverberg advised, adding, “I’m not telling every dermatology resident out there to become a psychiatrist.”
Depression and anxiety in AD: How common?
In an analysis of multiyear data from the Medical Expenditure Panel Surveys, an annual population-based project conducted by the Agency for Healthcare Research and Quality, Dr. Silverberg and a coinvestigator found that adults with AD were an adjusted 186% more likely than those without AD to screen positive for depressive symptoms on the two-item Patient Health Questionnaire (PHQ-2), with rates of 44.3% and 21.9%, respectively. The AD patients were also 500% more likely to screen positive for severe psychological distress, with a 25.9% rate of having a Kessler-6 index score of 13 or more, compared with 5.5% in adults without AD.
The rate of severe psychological distress was higher in adults with AD than in those with asthma, diabetes, hypertension, urticaria, or psoriasis, and was comparable with the rate in individuals with autoimmune disease (Ann Allergy Asthma Immunol. 2019 Aug;123[2]:179-85).
“It’s surprising when you think that the majority of the cases of atopic dermatitis in the population are mild and yet when you look at a population-based sample such as this you see a strong signal come up. It means that, with all the dilution of mild disease, the signal is still there. It emphasizes that even patients with mild disease get these depressive symptoms and psychosocial distress,” Dr. Silverberg observed.
In a separate analysis of the same national database, this time looking at Short Form-6D health utility scores – a measure of overall quality of life encompassing key domains including vitality, physical function, mental health, fatigue – adults with AD scored markedly worse than individuals with no chronic health disorders. Health utility scores were particularly low in adults with AD and comorbid symptoms of anxiety or depression, suggesting that those affective symptoms are major drivers of the demonstrably poor quality of life in adult AD (Ann Allergy Asthma Immunol. 2020 Jan;124[1]:88-9).
In the Atopic Dermatitis in America Study, Dr. Silverberg and coinvestigators cross-sectionally surveyed 2,893 adults using the seven-item Hospital Anxiety and Depression Scale anxiety (HADS-A) and depression (HADS-D) assessment instruments. Individuals with AD as determined using the modified U.K. Diagnostic Criteria had dramatically higher rates of both depression and anxiety. For example, the prevalence of a HADS-A score of 11 or more, which is considered to be case finding for clinically important anxiety, was 28.6% in adults with AD, nearly twice the 15.5% prevalence in those without the dermatologic disease. A HADS-D score of 11 or greater was present in 13.5% of subjects with AD and 9% of those without.
HADS-A and -D scores were higher in adults with moderate AD, compared with mild disease, and higher still in those with severe AD. Indeed, virtually all individuals with moderate to severe AD had symptoms of anxiety and depression, which in a large proportion had gone undiagnosed. A multivariate analysis strongly suggested that AD severity was the major driver of anxiety and depression in adults with AD (Br J Dermatol. 2019 Sep;181[3]:554-65).
An important finding was that 100% of adults with AD who had scores in the severe range on three validated measures of itch, frequency of symptoms, and lesion severity had borderline or abnormal scores on the HADS-A and -D.
“Of course, if you don’t ask, you’re not going to know about it,” Dr. Silverberg noted.
Dr. Silverberg reported receiving research grants from Galderma and GlaxoSmithKline and serving as a consultant to those pharmaceutical companies and more than a dozen others.