User login
Pandemic poses new challenges for rural doctors
These include struggling with seeing patients virtually and treating patients who have politicized the virus. Additionally, the pandemic has exposed rural practices to greater financial difficulties.
Before the pandemic some rurally based primary care physicians were already working through big challenges, such as having few local medical colleagues to consult and working in small practices with lean budgets. In fact, data gathered by the National Rural Health Association showed that there are only 40 primary care physicians per 100,000 patients in rural regions, compared with 53 in urban areas – and the number of physicians overall is 13 per 10,000 in rural areas, compared with 31 in cities.
In the prepandemic world, for some doctors, the challenges were balanced by the benefits of practicing in these sparsely populated communities with scenic, low-traffic roads. Some perks of practicing in rural areas touted by doctors included having a fast commute, being able to swim in a lake near the office before work, having a low cost of living, and feeling like they are making a difference in their communities as they treat generations of the families they see around town.
But today, new hurdles to practicing medicine in rural America created by the COVID-19 pandemic have caused the hardships to feel heavier than the joys at times for some physicians interviewed by MDedge.
Many independent rural practices in need of assistance were not able to get much from the federal Provider Relief Funds, said John M. Westfall, MD, who is director of the Robert Graham Center for Policy Studies in Family Medicine and Primary Care, in an interview.
“Rural primary care doctors function independently or in smaller critical access hospitals and community health centers,” said Dr. Westfall, who previously practiced family medicine in a small town in Colorado. “Many of these have much less financial reserves so are at risk of cutbacks and closure.”
Jacqueline W. Fincher, MD, an internist based in a tiny Georgia community along the highway between Atlanta and Augusta, said her small practice works on really thin margins and doesn’t have much cushion. At the beginning of the pandemic, all visits were down, and her practice operated at a loss. To help, Dr. Fincher and her colleagues applied for funding from the Small Business Administration’s Paycheck Protection Program (PPP) through the CARES Act.
“COVID-19 has had a tremendous impact especially on primary care practices. We live and die by volume. … Our volume in mid-March to mid-May really dropped dramatically,” explained Dr. Fincher, who is also president of the American College of Physicians. “The PPP sustained us for 2 months, enabling us to pay our staff and to remain open and get us up and running on telehealth.”
Starting up telemedicine
Experiencing spotty or no access to broadband Internet is nothing new to rural physicians, but having this problem interfere with their ability to provide care to patients is.
As much of the American health system rapidly embraced telehealth during the pandemic, obtaining access to high-speed Internet has been a major challenge for rural patients, noted Dr. Westfall.
“Some practices were able to quickly adopt some telehealth capacity with phone and video. Changes in payment for telehealth helped. But in some rural communities there was not adequate Internet bandwidth for quality video connections. And some patients did not have the means for high-speed video connections,” Dr. Westfall said.
Indeed, according to a 2019 Pew Research Center survey, 63% of rural Americans say they can access the Internet through a broadband connection at home, compared with 75% and 79% in suburban and urban areas, respectively.

In the Appalachian town of Zanesville, Ohio, for example, family physician Shelly L. Dunmyer, MD, and her colleagues discovered that many patients don’t have Internet access at home. Dr. Fincher has to go to the office to conduct telehealth visits because her own Internet access at home is unpredictable. As for patients, it may take 15 minutes for them to work out technical glitches and find good Internet reception, said Dr. Fincher. For internist Y. Ki Shin, MD, who practices in the coastal town of Montesano in Washington state, about 25% of his practice’s telehealth visits must be conducted by phone because of limitations on video, such as lack of high-speed access.
But telephone visits are often insufficient replacements for appointments via video, according to several rural physicians interviewed for this piece.
“Telehealth can be frustrating at times due to connectivity issues which can be difficult at times in the rural areas,” said Dr. Fincher. “In order for telehealth to be reasonably helpful to patients and physicians to care for people with chronic problems, the patients must have things like blood pressure monitors, glucometers, and scales to address problems like hypertension, diabetes myelitis, and congestive heart failure.”
“If you have the audio and video and the data from these devices, you’re good. If you don’t have these data, and/or don’t have the video you just can’t provide good care,” she explained.

Dr. Dunmyer and her colleagues at Medical Home Primary Care Center in Zanesville, Ohio, found a way to get around the problem of patients not being able to access Internet to participate in video visits from their homes. This involved having her patients drive into her practice’s parking lot to participate in modified telehealth visits. Staffers gave iPads to patients in their cars, and Dr. Dunmyer conducted visits from her office, about 50 yards away.
“We were even doing Medicare wellness visits: Instead of asking them to get up and move around the room, we would sit at the window and wave at them, ask them to get out, walk around the car. We were able to check mobility and all kinds of things that we’d normally do in the office,” Dr. Dunmyer explained in an interview.
The family physician noted that her practice is now conducting fewer parking lot visits since her office is allowing in-person appointments, but that they’re still an option for her patients.
Treating political adversaries
Some rural physicians have experienced strained relationships with patients for reasons other than technology – stark differences in opinion over the pandemic itself. Certain patients are following President Trump’s lead and questioning everything from the pandemic death toll to preventive measures recommended by scientists and medical experts, physicians interviewed by MDedge said.
Patients everywhere share these viewpoints, of course, but research and election results confirm that rural areas are more receptive to conservative viewpoints. In 2018, a Pew Research Center survey reported that rural and urban areas are “becoming more polarized politically,” and “rural areas tend to have a higher concentration of Republicans and Republican-leaning independents.” For example, 40% of rural respondents reported “very warm” or “somewhat warm” feelings toward Donald Trump, compared with just 19% in urban areas.
Dr. Shin has struggled to cope with patients who want to argue about pandemic safety precautions like wearing masks and seem to question whether systemic racism exists.
“We are seeing a lot more people who feel that this pandemic is not real, that it’s a political and not-true infection,” he said in an interview. “We’ve had patients who were angry at us because we made them wear masks, and some were demanding hydroxychloroquine and wanted to have an argument because we’re not going to prescribe it for them.”
In one situation, which he found especially disturbing, Dr. Shin had to leave the exam room because a patient wouldn’t stop challenging him regarding the pandemic. Things have gotten so bad that Dr. Shin has even questioned whether he wants to continue his long career in his small town because of local political attitudes such as opposition to mask-wearing and social distancing.
“Mr. Trump’s misinformation on this pandemic made my job much more difficult. As a minority, I feel less safe in my community than ever,” said Dr. Shin, who described himself as Asian American.
Despite these new stressors, Dr. Shin has experienced some joyful moments while practicing medicine in the pandemic.

He said a recent home visit to a patient who had been hospitalized for over 3 months and nearly died helped him put political disputes with his patients into perspective.
“He was discharged home but is bedbound. He had gangrene on his toes, and I could not fully examine him using video,” Dr. Shin recalled. “It was tricky to find the house, but a very large Trump sign was very helpful in locating it. It was a good visit: He was happy to see me, and I was happy to see that he was doing okay at home.”
“I need to remind myself that supporting Mr. Trump does not always mean that my patient supports Mr. Trump’s view on the pandemic and the race issues in our country,” Dr. Shin added.
The Washington-based internist said he also tells himself that, even if his patients refuse to follow his strong advice regarding pandemic precautions, it does not mean he has failed as a doctor.
“I need to continue to educate patients about the dangers of COVID infection but cannot be angry if they don’t choose to follow my recommendations,” he noted.
Dr. Fincher says her close connection with patients has allowed her to smooth over politically charged claims about the pandemic in the town of Thomson, Georgia, with a population 6,800.
“I have a sense that, even though we may differ in our understanding of some basic facts, they appreciate what I say since we have a long-term relationship built on trust,” she said. This kind of trust, Dr. Fincher suggested, may be more common than in urban areas where there’s a larger supply of physicians, and patients don’t see the same doctors for long periods of time.
“It’s more meaningful when it comes from me, rather than doctors who are [new to patients] every year when their employer changes their insurance,” she noted.
These include struggling with seeing patients virtually and treating patients who have politicized the virus. Additionally, the pandemic has exposed rural practices to greater financial difficulties.
Before the pandemic some rurally based primary care physicians were already working through big challenges, such as having few local medical colleagues to consult and working in small practices with lean budgets. In fact, data gathered by the National Rural Health Association showed that there are only 40 primary care physicians per 100,000 patients in rural regions, compared with 53 in urban areas – and the number of physicians overall is 13 per 10,000 in rural areas, compared with 31 in cities.
In the prepandemic world, for some doctors, the challenges were balanced by the benefits of practicing in these sparsely populated communities with scenic, low-traffic roads. Some perks of practicing in rural areas touted by doctors included having a fast commute, being able to swim in a lake near the office before work, having a low cost of living, and feeling like they are making a difference in their communities as they treat generations of the families they see around town.
But today, new hurdles to practicing medicine in rural America created by the COVID-19 pandemic have caused the hardships to feel heavier than the joys at times for some physicians interviewed by MDedge.
Many independent rural practices in need of assistance were not able to get much from the federal Provider Relief Funds, said John M. Westfall, MD, who is director of the Robert Graham Center for Policy Studies in Family Medicine and Primary Care, in an interview.
“Rural primary care doctors function independently or in smaller critical access hospitals and community health centers,” said Dr. Westfall, who previously practiced family medicine in a small town in Colorado. “Many of these have much less financial reserves so are at risk of cutbacks and closure.”
Jacqueline W. Fincher, MD, an internist based in a tiny Georgia community along the highway between Atlanta and Augusta, said her small practice works on really thin margins and doesn’t have much cushion. At the beginning of the pandemic, all visits were down, and her practice operated at a loss. To help, Dr. Fincher and her colleagues applied for funding from the Small Business Administration’s Paycheck Protection Program (PPP) through the CARES Act.
“COVID-19 has had a tremendous impact especially on primary care practices. We live and die by volume. … Our volume in mid-March to mid-May really dropped dramatically,” explained Dr. Fincher, who is also president of the American College of Physicians. “The PPP sustained us for 2 months, enabling us to pay our staff and to remain open and get us up and running on telehealth.”
Starting up telemedicine
Experiencing spotty or no access to broadband Internet is nothing new to rural physicians, but having this problem interfere with their ability to provide care to patients is.
As much of the American health system rapidly embraced telehealth during the pandemic, obtaining access to high-speed Internet has been a major challenge for rural patients, noted Dr. Westfall.
“Some practices were able to quickly adopt some telehealth capacity with phone and video. Changes in payment for telehealth helped. But in some rural communities there was not adequate Internet bandwidth for quality video connections. And some patients did not have the means for high-speed video connections,” Dr. Westfall said.
Indeed, according to a 2019 Pew Research Center survey, 63% of rural Americans say they can access the Internet through a broadband connection at home, compared with 75% and 79% in suburban and urban areas, respectively.
In the Appalachian town of Zanesville, Ohio, for example, family physician Shelly L. Dunmyer, MD, and her colleagues discovered that many patients don’t have Internet access at home. Dr. Fincher has to go to the office to conduct telehealth visits because her own Internet access at home is unpredictable. As for patients, it may take 15 minutes for them to work out technical glitches and find good Internet reception, said Dr. Fincher. For internist Y. Ki Shin, MD, who practices in the coastal town of Montesano in Washington state, about 25% of his practice’s telehealth visits must be conducted by phone because of limitations on video, such as lack of high-speed access.
But telephone visits are often insufficient replacements for appointments via video, according to several rural physicians interviewed for this piece.
“Telehealth can be frustrating at times due to connectivity issues which can be difficult at times in the rural areas,” said Dr. Fincher. “In order for telehealth to be reasonably helpful to patients and physicians to care for people with chronic problems, the patients must have things like blood pressure monitors, glucometers, and scales to address problems like hypertension, diabetes myelitis, and congestive heart failure.”
“If you have the audio and video and the data from these devices, you’re good. If you don’t have these data, and/or don’t have the video you just can’t provide good care,” she explained.
Dr. Dunmyer and her colleagues at Medical Home Primary Care Center in Zanesville, Ohio, found a way to get around the problem of patients not being able to access Internet to participate in video visits from their homes. This involved having her patients drive into her practice’s parking lot to participate in modified telehealth visits. Staffers gave iPads to patients in their cars, and Dr. Dunmyer conducted visits from her office, about 50 yards away.
“We were even doing Medicare wellness visits: Instead of asking them to get up and move around the room, we would sit at the window and wave at them, ask them to get out, walk around the car. We were able to check mobility and all kinds of things that we’d normally do in the office,” Dr. Dunmyer explained in an interview.
The family physician noted that her practice is now conducting fewer parking lot visits since her office is allowing in-person appointments, but that they’re still an option for her patients.
Treating political adversaries
Some rural physicians have experienced strained relationships with patients for reasons other than technology – stark differences in opinion over the pandemic itself. Certain patients are following President Trump’s lead and questioning everything from the pandemic death toll to preventive measures recommended by scientists and medical experts, physicians interviewed by MDedge said.
Patients everywhere share these viewpoints, of course, but research and election results confirm that rural areas are more receptive to conservative viewpoints. In 2018, a Pew Research Center survey reported that rural and urban areas are “becoming more polarized politically,” and “rural areas tend to have a higher concentration of Republicans and Republican-leaning independents.” For example, 40% of rural respondents reported “very warm” or “somewhat warm” feelings toward Donald Trump, compared with just 19% in urban areas.
Dr. Shin has struggled to cope with patients who want to argue about pandemic safety precautions like wearing masks and seem to question whether systemic racism exists.
“We are seeing a lot more people who feel that this pandemic is not real, that it’s a political and not-true infection,” he said in an interview. “We’ve had patients who were angry at us because we made them wear masks, and some were demanding hydroxychloroquine and wanted to have an argument because we’re not going to prescribe it for them.”
In one situation, which he found especially disturbing, Dr. Shin had to leave the exam room because a patient wouldn’t stop challenging him regarding the pandemic. Things have gotten so bad that Dr. Shin has even questioned whether he wants to continue his long career in his small town because of local political attitudes such as opposition to mask-wearing and social distancing.
“Mr. Trump’s misinformation on this pandemic made my job much more difficult. As a minority, I feel less safe in my community than ever,” said Dr. Shin, who described himself as Asian American.
Despite these new stressors, Dr. Shin has experienced some joyful moments while practicing medicine in the pandemic.
He said a recent home visit to a patient who had been hospitalized for over 3 months and nearly died helped him put political disputes with his patients into perspective.
“He was discharged home but is bedbound. He had gangrene on his toes, and I could not fully examine him using video,” Dr. Shin recalled. “It was tricky to find the house, but a very large Trump sign was very helpful in locating it. It was a good visit: He was happy to see me, and I was happy to see that he was doing okay at home.”
“I need to remind myself that supporting Mr. Trump does not always mean that my patient supports Mr. Trump’s view on the pandemic and the race issues in our country,” Dr. Shin added.
The Washington-based internist said he also tells himself that, even if his patients refuse to follow his strong advice regarding pandemic precautions, it does not mean he has failed as a doctor.
“I need to continue to educate patients about the dangers of COVID infection but cannot be angry if they don’t choose to follow my recommendations,” he noted.
Dr. Fincher says her close connection with patients has allowed her to smooth over politically charged claims about the pandemic in the town of Thomson, Georgia, with a population 6,800.
“I have a sense that, even though we may differ in our understanding of some basic facts, they appreciate what I say since we have a long-term relationship built on trust,” she said. This kind of trust, Dr. Fincher suggested, may be more common than in urban areas where there’s a larger supply of physicians, and patients don’t see the same doctors for long periods of time.
“It’s more meaningful when it comes from me, rather than doctors who are [new to patients] every year when their employer changes their insurance,” she noted.
Congenital Defect of the Toenail
The Diagnosis: Onychodystrophy Secondary to Polydactyly
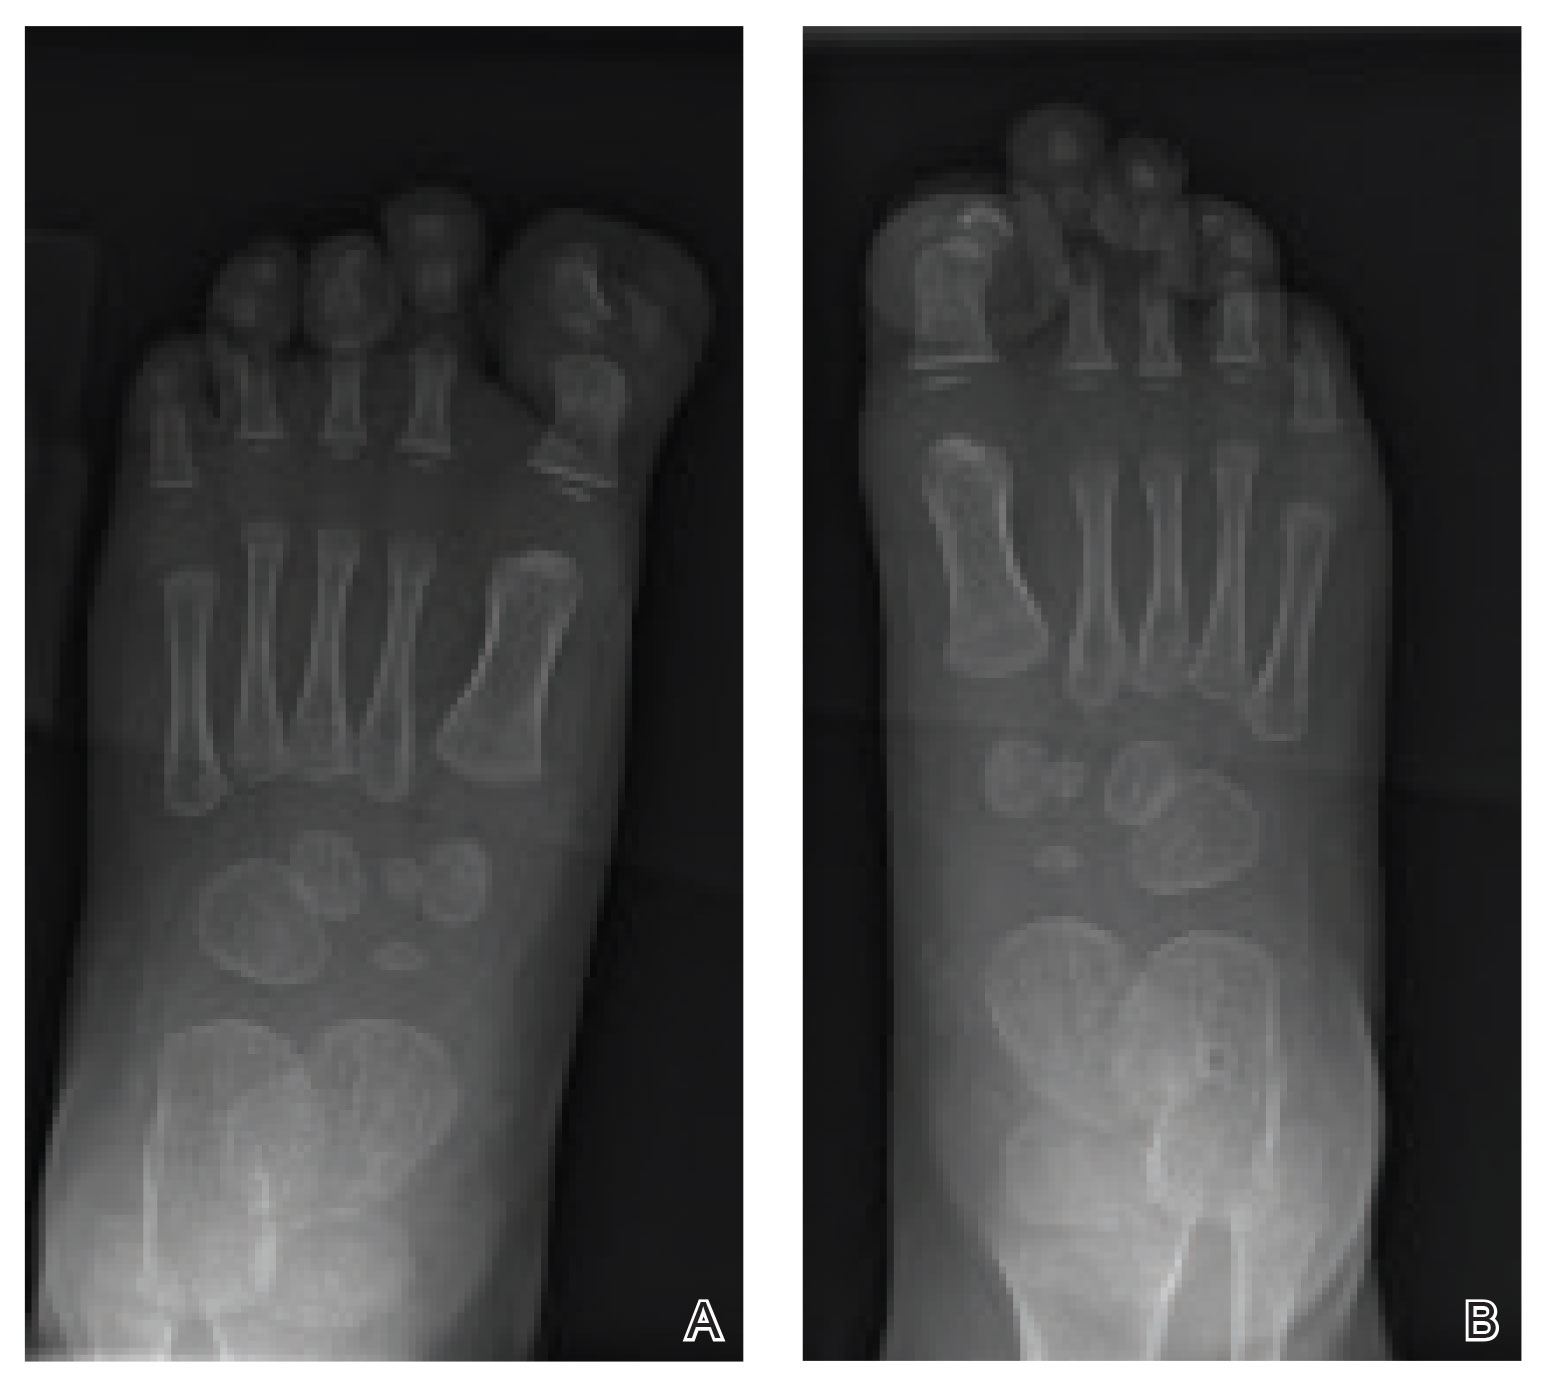
Radiographs of the feet demonstrated an accessory distal phalanx of the left great toe with a similar smaller accessory distal phalanx on the right great toe (Figure). The patient was referred to orthopedic surgery, and surgical intervention was recommended for only the left great toe given recurrent skin inflammation and nail complications. An excision of the left great toe polydactyly was performed. The patient healed well without complications.
Many clinically heterogeneous phenotypes exist for polydactyly and syndactyly, which both are common entities with incidences of 1 in 700 to 1000 births and 1 in 2000 to 3000 births, respectively.1 Both polydactyly and syndactyly can be an isolated variant in newborns or present with multiple concurrent malformations as part of a genetic syndrome, with more than 300 syndromic anomalies described. The genetic basis of these conditions is equally diverse, with homeobox genes, hedgehog pathways, fibroblast growth factors, and boneand cartilage-derived morphogenetic proteins implicated in their development.1
The differential diagnosis for our patient included congenital malalignment of the great toenails, nail-patella syndrome, onychodystrophy secondary to polydactyly, and congenital hypertrophy of the lateral nail fold. Given the strong family history, polydactyly was suspected.
Congenital malalignment of the great toenails results in lateral deviation of the nail plates.2 It is an underdiagnosed condition with different etiologies hypothesized, such as genetic factors with possible autosomal-dominant transmission and extrinsic factors.3 One proposed mechanism of pathogenesis is desynchronization during growth of the nail and distal phalanx of the hallux, leading to larger nail plates that grow laterally.4 Typical features associated with this disease are nail discoloration, nail plate thickening, and transversal grooves or ridges, none of which were seen in our patient.2
Children with nail-patella syndrome have dysplastic nails and associated bony abnormalities, such as absent patellae.5 This syndrome results from an autosomaldominant mutation in the LIM homeobox transcription factor 1-beta gene, LMX1B, which is responsible for dorsal-ventral patterning of the limb, as well as patterning of the nails, patellae and long bones, and even the kidney tubule.6 As such, patients with nail-patella syndrome have associated renal abnormalities. The findings in our patient were limited to the feet, making an underlying syndrome unlikely to be the cause.
First described in 1968 by Meadow,7 fetal hydantoin syndrome is a well-documented sequela in women taking phenytoin throughout pregnancy. Multiple malformations are possible, including cardiac defects, cleft lip/palate, digit and nail hypoplasia, abnormal facial features, mental disability, and growth abnormalities.8 The teratogenicity behind phenytoin results from reactive oxygen species that alter embryonic DNA, proteins, and lipids.9 The mother of this child was not on any seizure prophylaxis, eliminating it from the differential.
Congenital hypertrophy of the lateral nail fold is a defect of the soft tissue of the hallux leading to hypertrophy of the nail fold, commonly presenting with inflammation and pain10 possibly due to dyssynchronous growth between the soft tissue and nail plate.11 With this defect, a lip covering the nail plate is common, which was not seen in our patient.
As demonstrated in our patient, family history can help guide the diagnosis. Seven of 9 nonsyndromic forms of syndactyly are inherited in an autosomal-dominant fashion and range from mild presentations, as in our patient, to more severe deformations with underlying bone fusion and functional impairment.12 Polydactyly also often is expressed in an autosomal-dominant pattern, with up to 30% of patients having a positive family history. Polydactyly traditionally is classified by the location of the supernumerary digit as preaxial (radial), central, or postaxial (ulnar), and many further morphologic variations exist within these groups. Overall, preaxial polydactyly is relatively rare and represents 15% of polydactylies, with central and postaxial comprising the other 6% and 79%, respectively.13 Delineation of the underlying anatomy may reveal ray duplications (digit and corresponding metacarpal or metatarsal bone), metatarsal variants, and duplicated phalanges that may be hypoplastic or deformed. Patients may report difficulty finding comfortable footwear, cosmetic concerns, and nail-related complications. Although not always required, surgical intervention may provide definitive treatment but can leave residual deformities in the surrounding altered anatomy; thus, orthopedic or plastic surgery consultations are critical in appropriately counseling patients.
- Ahmed H, Akbari H, Emanmi A, et al. Genetic overview of syndactyly and polydactyly. Plast Reconstr Surg Glob Open. 2017;5:e1549.
- Catalfo P, Musumeci ML, Lacarrubba F, et al. Congenital malalignment of the great toenails: a review. Skin Appendage Disord. 2018;4:230-235.
- Kus S, Tahmaz E, Gurunluoglu R, et al. Congenital malalignment of the great toenails in dizygotic twins. Pediatr Dermatol. 2005;22:434-435.
- Chaniotakis I, Bonitsis N, Stergiopoulou C, et al. Dizygotic twins with congenital malalignment of the great toenails: reappraisal of the pathogenesis. J Am Acad Dermatol. 2007;57:711-715.
- Witzgall R. Nail-patella syndrome. Pflugers Arch. 2017;469:927-936.
- Dreyer SD, Zhou G, Baldini A, et al, Mutations in LMX1B cause abnormal skeletal patterning and renal dysplasia in nail patella syndrome. Nat Genet. 1998;19:47-50.
- Meadow SR. Anticonvulsant drugs and congenital abnormalities. Lancet. 1968;2:1296.
- Scheinfeld N. Phenytoin in cutaneous medicine: its uses, mechanisms and side effects. Dermatol Online J. 2003;9:6.
- Winn LM, Wells PG. Phenytoin-initiated DNA oxidation in murine embryo culture, and embryo protection by the antioxidative enzymes superoxide dismutase and catalase: evidence for reactive oxygen species-mediated DNA oxidation in the molecular mechanism of phenytoin teratogenicity. Mol Pharmacol. 1995;48:112-120.
- Piraccini BM, Parente GL, Varotti E, et al. Congenital hypertrophy of the lateral nail folds of the hallux: clinical features and follow-up of seven cases. Pediatr Dermatol. 2000;17:348-351.
- Martinet C, Pascal M, Civatte J, et al. Lateral nail-pad of the big toe in infants. apropos of 2 cases. Ann Dermatol Venereol. 1984;111:731-732.
- Malik S. Syndactyly: phenotypes, genetics and current classification. Eur J Hum Genet. 2012;20:817-824.
- Belthur MV, Linton JL, Barnes DA. The spectrum of preaxial polydactyly of the foot. J Pediatr Orthop. 2011;31:435-447.
The Diagnosis: Onychodystrophy Secondary to Polydactyly
Radiographs of the feet demonstrated an accessory distal phalanx of the left great toe with a similar smaller accessory distal phalanx on the right great toe (Figure). The patient was referred to orthopedic surgery, and surgical intervention was recommended for only the left great toe given recurrent skin inflammation and nail complications. An excision of the left great toe polydactyly was performed. The patient healed well without complications.
Many clinically heterogeneous phenotypes exist for polydactyly and syndactyly, which both are common entities with incidences of 1 in 700 to 1000 births and 1 in 2000 to 3000 births, respectively.1 Both polydactyly and syndactyly can be an isolated variant in newborns or present with multiple concurrent malformations as part of a genetic syndrome, with more than 300 syndromic anomalies described. The genetic basis of these conditions is equally diverse, with homeobox genes, hedgehog pathways, fibroblast growth factors, and boneand cartilage-derived morphogenetic proteins implicated in their development.1
The differential diagnosis for our patient included congenital malalignment of the great toenails, nail-patella syndrome, onychodystrophy secondary to polydactyly, and congenital hypertrophy of the lateral nail fold. Given the strong family history, polydactyly was suspected.
Congenital malalignment of the great toenails results in lateral deviation of the nail plates.2 It is an underdiagnosed condition with different etiologies hypothesized, such as genetic factors with possible autosomal-dominant transmission and extrinsic factors.3 One proposed mechanism of pathogenesis is desynchronization during growth of the nail and distal phalanx of the hallux, leading to larger nail plates that grow laterally.4 Typical features associated with this disease are nail discoloration, nail plate thickening, and transversal grooves or ridges, none of which were seen in our patient.2
Children with nail-patella syndrome have dysplastic nails and associated bony abnormalities, such as absent patellae.5 This syndrome results from an autosomaldominant mutation in the LIM homeobox transcription factor 1-beta gene, LMX1B, which is responsible for dorsal-ventral patterning of the limb, as well as patterning of the nails, patellae and long bones, and even the kidney tubule.6 As such, patients with nail-patella syndrome have associated renal abnormalities. The findings in our patient were limited to the feet, making an underlying syndrome unlikely to be the cause.
First described in 1968 by Meadow,7 fetal hydantoin syndrome is a well-documented sequela in women taking phenytoin throughout pregnancy. Multiple malformations are possible, including cardiac defects, cleft lip/palate, digit and nail hypoplasia, abnormal facial features, mental disability, and growth abnormalities.8 The teratogenicity behind phenytoin results from reactive oxygen species that alter embryonic DNA, proteins, and lipids.9 The mother of this child was not on any seizure prophylaxis, eliminating it from the differential.
Congenital hypertrophy of the lateral nail fold is a defect of the soft tissue of the hallux leading to hypertrophy of the nail fold, commonly presenting with inflammation and pain10 possibly due to dyssynchronous growth between the soft tissue and nail plate.11 With this defect, a lip covering the nail plate is common, which was not seen in our patient.
As demonstrated in our patient, family history can help guide the diagnosis. Seven of 9 nonsyndromic forms of syndactyly are inherited in an autosomal-dominant fashion and range from mild presentations, as in our patient, to more severe deformations with underlying bone fusion and functional impairment.12 Polydactyly also often is expressed in an autosomal-dominant pattern, with up to 30% of patients having a positive family history. Polydactyly traditionally is classified by the location of the supernumerary digit as preaxial (radial), central, or postaxial (ulnar), and many further morphologic variations exist within these groups. Overall, preaxial polydactyly is relatively rare and represents 15% of polydactylies, with central and postaxial comprising the other 6% and 79%, respectively.13 Delineation of the underlying anatomy may reveal ray duplications (digit and corresponding metacarpal or metatarsal bone), metatarsal variants, and duplicated phalanges that may be hypoplastic or deformed. Patients may report difficulty finding comfortable footwear, cosmetic concerns, and nail-related complications. Although not always required, surgical intervention may provide definitive treatment but can leave residual deformities in the surrounding altered anatomy; thus, orthopedic or plastic surgery consultations are critical in appropriately counseling patients.
- Ahmed H, Akbari H, Emanmi A, et al. Genetic overview of syndactyly and polydactyly. Plast Reconstr Surg Glob Open. 2017;5:e1549.
- Catalfo P, Musumeci ML, Lacarrubba F, et al. Congenital malalignment of the great toenails: a review. Skin Appendage Disord. 2018;4:230-235.
- Kus S, Tahmaz E, Gurunluoglu R, et al. Congenital malalignment of the great toenails in dizygotic twins. Pediatr Dermatol. 2005;22:434-435.
- Chaniotakis I, Bonitsis N, Stergiopoulou C, et al. Dizygotic twins with congenital malalignment of the great toenails: reappraisal of the pathogenesis. J Am Acad Dermatol. 2007;57:711-715.
- Witzgall R. Nail-patella syndrome. Pflugers Arch. 2017;469:927-936.
- Dreyer SD, Zhou G, Baldini A, et al, Mutations in LMX1B cause abnormal skeletal patterning and renal dysplasia in nail patella syndrome. Nat Genet. 1998;19:47-50.
- Meadow SR. Anticonvulsant drugs and congenital abnormalities. Lancet. 1968;2:1296.
- Scheinfeld N. Phenytoin in cutaneous medicine: its uses, mechanisms and side effects. Dermatol Online J. 2003;9:6.
- Winn LM, Wells PG. Phenytoin-initiated DNA oxidation in murine embryo culture, and embryo protection by the antioxidative enzymes superoxide dismutase and catalase: evidence for reactive oxygen species-mediated DNA oxidation in the molecular mechanism of phenytoin teratogenicity. Mol Pharmacol. 1995;48:112-120.
- Piraccini BM, Parente GL, Varotti E, et al. Congenital hypertrophy of the lateral nail folds of the hallux: clinical features and follow-up of seven cases. Pediatr Dermatol. 2000;17:348-351.
- Martinet C, Pascal M, Civatte J, et al. Lateral nail-pad of the big toe in infants. apropos of 2 cases. Ann Dermatol Venereol. 1984;111:731-732.
- Malik S. Syndactyly: phenotypes, genetics and current classification. Eur J Hum Genet. 2012;20:817-824.
- Belthur MV, Linton JL, Barnes DA. The spectrum of preaxial polydactyly of the foot. J Pediatr Orthop. 2011;31:435-447.
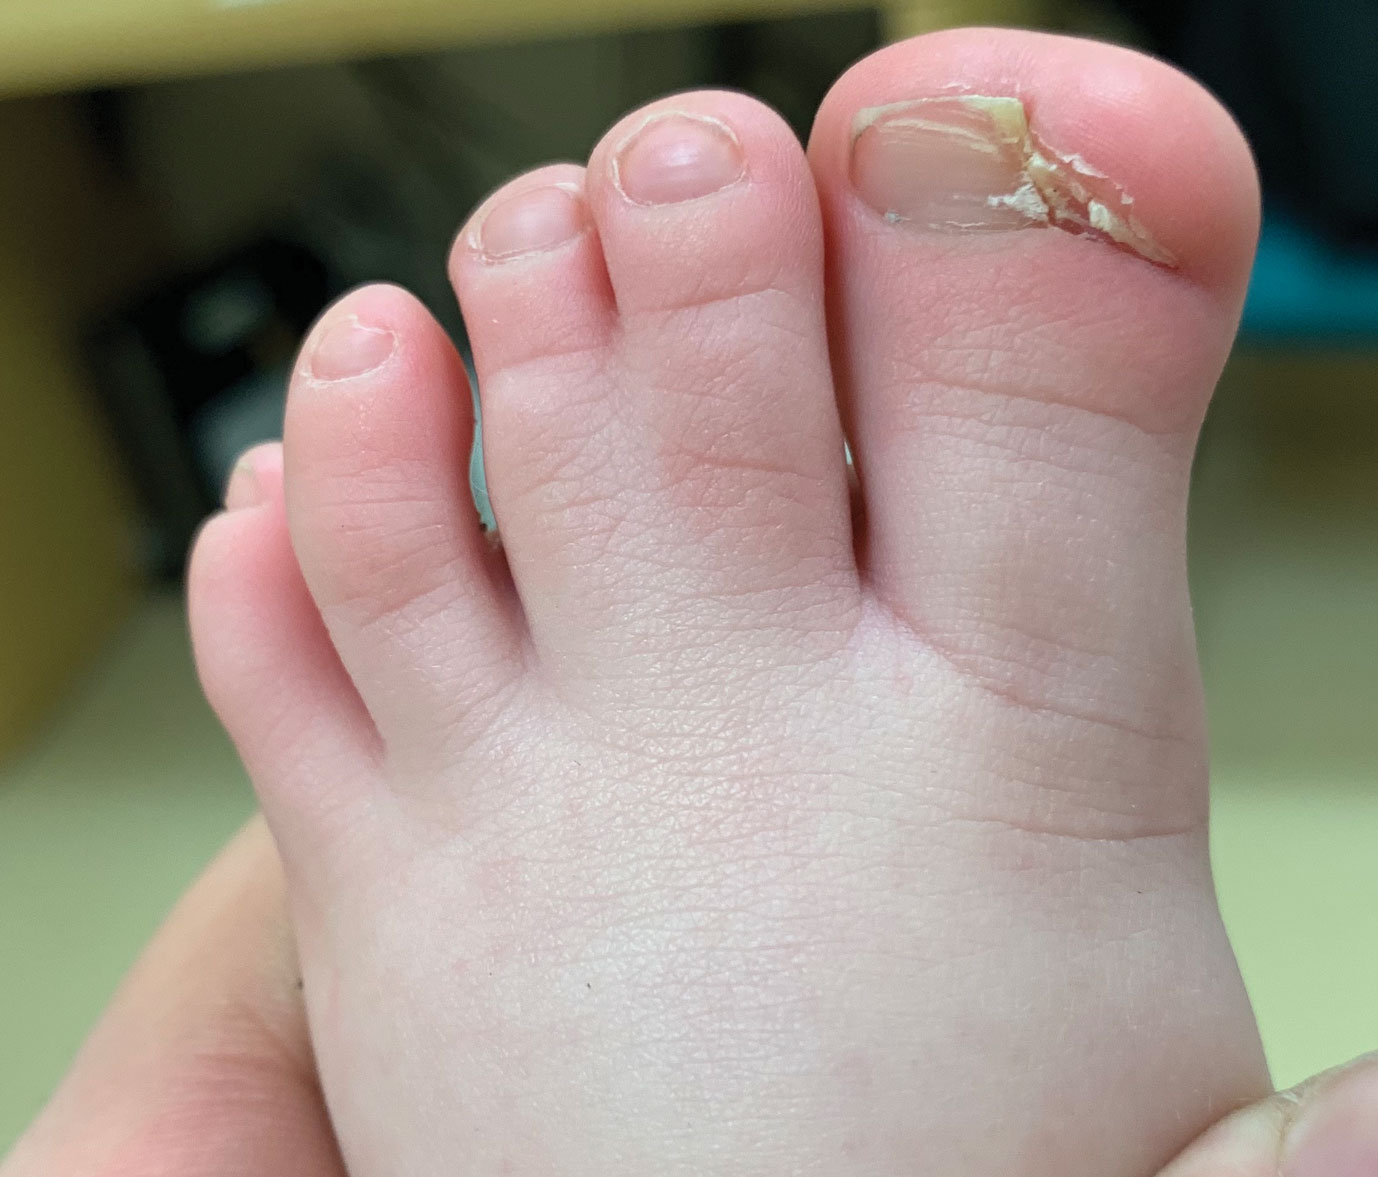
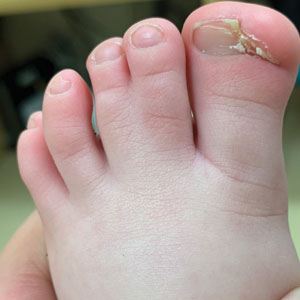
An 18-month-old girl presented for evaluation of nail dystrophy. The patient’s parents stated that the left great toenail had been dystrophic since birth, leading to skin irritation and “snagging” of the toenail on socks and footwear. Additional history revealed that the patient also had webbed toes, and there was a paternal family history of polydactyly and syndactyly. Physical examination revealed webbing of the second and third toes to the distal interphalangeal joints on both feet, marked nail plate dystrophy on the left big toe, and an irregularly shaped nail plate on the right big toe. The patient had no similar findings on the hands.
Dr. Brian Mandell gives his take on ACR’s newest gout guideline
Guidance on the initiation and use of urate-lowering therapies was among the strong recommendations in the updated gout guideline recently issued by the American College of Rheumatology, said Brian F. Mandell, MD, PhD, in a virtual presentation at the annual Perspectives in Rheumatic Diseases held by Global Academy for Medical Education.

The 2020 American College of Rheumatology Guideline for the Management of Gout is “intended to provide guidance for particular patterns of practice and not to dictate the care of a particular patient,” said Dr. Mandell, chair of academic medicine at the Cleveland Clinic in Ohio and cochair of the conference. However, “there was a hope that, with additional evidence since the previous guideline issued in 2012, the recommendations are more firmly based and will improve care,” he said.
Of 42 recommendations, 16 were strong, and these included guidance on several points: when to initiate urate-lowering therapy and using a treat-to-target strategy for lowering serum uric acid to less than 6 mg/dL; prophylaxis against attacks; the use of allopurinol as the first-choice drug and how to avoid hypersensitivity reactions; the use of pegloticase (Krystexxa); and treating flares.
Hyperuricemia does not automatically equal gout, Dr. Mandell said. A 2018 published analysis of data from several large cohorts including 18,889 adults who were gout-free at baseline showed that serum uric acid levels could not accurately predict an initial gout attack. Therefore, the guideline conditionally recommends against initiating any pharmacologic urate-lowering therapy in patients with asymptomatic hyperuricemia. The guideline authors intentionally did not include the presence of comorbidities or deposits of uric acid in making their recommendation. But when advising an individual patient, these factors plus the patient’s age and family history should be considered, he said. “Individualize the decision to use ULT [urate-lowering therapy] to prevent possible future flares,” he advised, with consideration of age, the effects of the flare on the patient’s life, and challenges in treating flares.
For patients who are being treated with urate-lowering therapy, a published study indicated that if treatment is discontinued, “gout attacks will recur, depending on the new serum urate level,” Dr. Mandell said. “Maintenance of low SUA [serum uric acid] must be lifelong to stop attacks,” he emphasized, noting that this is counter to a management guideline published by the American College of Physicians in 2017.
“For patients starting any ULT, we strongly recommend allopurinol over all other urate-lowering therapies as the preferred first-line agent for all patients, including those with CKD [chronic kidney disease] stage 3 or higher,” according to the new guideline, which also recommends starting at a low dose followed by dose titration to target versus starting at a higher dose.
Two reasons in support of a slow up-titration of urate-lowering therapy are a lower frequency of mobilization flares and a possibly lower chance of allopurinol hypersensitivity reactions, Dr. Mandell said.
Although the guideline recommends allopurinol over probenecid, “probenecid works well as monotherapy and effectively as add-on therapy to a xanthine oxidase inhibitor, and it is cheap,” Dr. Mandell said.
Allopurinol can be associated with life-threatening hypersensitivity reactions, but most of these have been associated with a higher-than-recommended starting dose, according to the literature, he noted. The new guideline suggests checking for the HLA-B*5801 haplotype in high-risk demographic groups, and if it is present, to use an alternative to allopurinol if possible
The updated guideline also carries a strong recommendation for the use of pegloticase for patients with frequent gout flares and nonresolving subcutaneous tophi, but it strongly recommends against switching to pegloticase for patients with infrequent gout flares and no tophi.
However, Dr. Mandell said that he will consider off-label treatment of gout with pegloticase “in patients where a shorter time to response really matters,” which is consistent with his belief that, within these treatment principles, the management of gout must be individualized to the specific patient.
For treating acute gout flares, the guideline recommendations strongly supports the use of oral colchicine, NSAIDs, or glucocorticoids as an appropriate first-line therapy, based on patient factors and preferences, instead of using interleukin-1 inhibitors or adrenocorticotropic hormone. However, the interleukin-1 inhibitor anakinra has shown relatively rapid and successful response in treating patients hospitalized with acute gout, Dr. Mandell said. No large, randomized, trials have been conducted, but he cited his experience at the Cleveland Clinic in Ohio, where anakinra is the most common treatment for acute gout on inpatient consults, and he cited a representative small study of 26 patients in which 73% showed “significant response” within 5 days of treatment, which meant that they were able to move and bear weight without pain. In addition, a more recent study of 100 hospitalized patients in the Journal of Rheumatology, found that 75% showed a rapid response to anakinra and improvement or resolution of flares within 4 days, Dr. Mandell said.
Dr. Mandell disclosed relationships with companies including Horizon, Ardea/AstraZeneca/Ironwood, and Takeda. He served as coauthor on the 2012 American College of Rheumatology gout guideline.
Global Academy for Medical Education and this news organization are owned by the same parent company.
Guidance on the initiation and use of urate-lowering therapies was among the strong recommendations in the updated gout guideline recently issued by the American College of Rheumatology, said Brian F. Mandell, MD, PhD, in a virtual presentation at the annual Perspectives in Rheumatic Diseases held by Global Academy for Medical Education.
The 2020 American College of Rheumatology Guideline for the Management of Gout is “intended to provide guidance for particular patterns of practice and not to dictate the care of a particular patient,” said Dr. Mandell, chair of academic medicine at the Cleveland Clinic in Ohio and cochair of the conference. However, “there was a hope that, with additional evidence since the previous guideline issued in 2012, the recommendations are more firmly based and will improve care,” he said.
Of 42 recommendations, 16 were strong, and these included guidance on several points: when to initiate urate-lowering therapy and using a treat-to-target strategy for lowering serum uric acid to less than 6 mg/dL; prophylaxis against attacks; the use of allopurinol as the first-choice drug and how to avoid hypersensitivity reactions; the use of pegloticase (Krystexxa); and treating flares.
Hyperuricemia does not automatically equal gout, Dr. Mandell said. A 2018 published analysis of data from several large cohorts including 18,889 adults who were gout-free at baseline showed that serum uric acid levels could not accurately predict an initial gout attack. Therefore, the guideline conditionally recommends against initiating any pharmacologic urate-lowering therapy in patients with asymptomatic hyperuricemia. The guideline authors intentionally did not include the presence of comorbidities or deposits of uric acid in making their recommendation. But when advising an individual patient, these factors plus the patient’s age and family history should be considered, he said. “Individualize the decision to use ULT [urate-lowering therapy] to prevent possible future flares,” he advised, with consideration of age, the effects of the flare on the patient’s life, and challenges in treating flares.
For patients who are being treated with urate-lowering therapy, a published study indicated that if treatment is discontinued, “gout attacks will recur, depending on the new serum urate level,” Dr. Mandell said. “Maintenance of low SUA [serum uric acid] must be lifelong to stop attacks,” he emphasized, noting that this is counter to a management guideline published by the American College of Physicians in 2017.
“For patients starting any ULT, we strongly recommend allopurinol over all other urate-lowering therapies as the preferred first-line agent for all patients, including those with CKD [chronic kidney disease] stage 3 or higher,” according to the new guideline, which also recommends starting at a low dose followed by dose titration to target versus starting at a higher dose.
Two reasons in support of a slow up-titration of urate-lowering therapy are a lower frequency of mobilization flares and a possibly lower chance of allopurinol hypersensitivity reactions, Dr. Mandell said.
Although the guideline recommends allopurinol over probenecid, “probenecid works well as monotherapy and effectively as add-on therapy to a xanthine oxidase inhibitor, and it is cheap,” Dr. Mandell said.
Allopurinol can be associated with life-threatening hypersensitivity reactions, but most of these have been associated with a higher-than-recommended starting dose, according to the literature, he noted. The new guideline suggests checking for the HLA-B*5801 haplotype in high-risk demographic groups, and if it is present, to use an alternative to allopurinol if possible
The updated guideline also carries a strong recommendation for the use of pegloticase for patients with frequent gout flares and nonresolving subcutaneous tophi, but it strongly recommends against switching to pegloticase for patients with infrequent gout flares and no tophi.
However, Dr. Mandell said that he will consider off-label treatment of gout with pegloticase “in patients where a shorter time to response really matters,” which is consistent with his belief that, within these treatment principles, the management of gout must be individualized to the specific patient.
For treating acute gout flares, the guideline recommendations strongly supports the use of oral colchicine, NSAIDs, or glucocorticoids as an appropriate first-line therapy, based on patient factors and preferences, instead of using interleukin-1 inhibitors or adrenocorticotropic hormone. However, the interleukin-1 inhibitor anakinra has shown relatively rapid and successful response in treating patients hospitalized with acute gout, Dr. Mandell said. No large, randomized, trials have been conducted, but he cited his experience at the Cleveland Clinic in Ohio, where anakinra is the most common treatment for acute gout on inpatient consults, and he cited a representative small study of 26 patients in which 73% showed “significant response” within 5 days of treatment, which meant that they were able to move and bear weight without pain. In addition, a more recent study of 100 hospitalized patients in the Journal of Rheumatology, found that 75% showed a rapid response to anakinra and improvement or resolution of flares within 4 days, Dr. Mandell said.
Dr. Mandell disclosed relationships with companies including Horizon, Ardea/AstraZeneca/Ironwood, and Takeda. He served as coauthor on the 2012 American College of Rheumatology gout guideline.
Global Academy for Medical Education and this news organization are owned by the same parent company.
FROM PRD 2020
HM20 Virtual: Combating racism in medicine
HM20 Virtual session title
When Grief and Crises Intersect: Perspectives of a Black Physician in the Time of Two Pandemics
Presenter
Kimberly Manning, MD, FACP, FAAP
Session summary

Dr. Kimberly Manning, associate vice chair of diversity, equity, and inclusion at Emory University, Atlanta, masterfully discussed the dual pandemics of COVID-19 and racism that we are currently experiencing and tried to describe the unique perspective of Black Americans.
Though it is easy to see that COVID-19 is a pandemic, racism is not always seen in this way. Dr. Manning demonstrated that when a pandemic is defined as “that which occurs over a wide geographic area and affects a high proportion of the population,” racism is absolutely a pandemic. She gave a great analogy: when sticking your hand into a bowl of Lucky Charms cereal, you do not expect to always end up with marshmallows alone, yet repeatedly, we see that Black Americans have been disproportionately affected by COVID-19. We often hear that we are in unprecedented times but as far as racism is concerned, there is nothing new about this.
Dr. Manning discussed the life stories of her grandfather, her father, and even her own life’s milestones such as starting college, getting into medical school, finishing residency – all the way to becoming a full professor. She described how each of these instances, though marked by something beautiful, was also marked by something truly awful. Each time she had a reason to smile and laugh, there was something awful happening in the country simultaneously that showed us how racism was still present. Though this was one person’s story, all Black Americans, not just those working in health care, can recount similar stories, emotions, and feelings of grief.
Dr. Manning concluded by telling us how we can “Do the Work” to combat the pandemic of racism:
- Broaden your fund of knowledge: Read books, listen to podcasts, watch documentaries.
- Remember that people are grieving.
- Explore your implicit biases.
- Be a brave bystander.
- Avoid performative allyship.
Key takeaways
- Though the COVID-19 pandemic is unprecedented, the pandemic of racism is not.
- The story of COVID-19 is the story of social determinants of health.
- We all must “Do the Work” to combat everyday racism and be cognizant of what our Black colleagues are going through every day.
Dr. Doraiswamy is an assistant professor of medicine and pediatrics and a med-peds hospitalist at The Ohio State University and Nationwide Children’s Hospital, Columbus.
HM20 Virtual session title
When Grief and Crises Intersect: Perspectives of a Black Physician in the Time of Two Pandemics
Presenter
Kimberly Manning, MD, FACP, FAAP
Session summary
Dr. Kimberly Manning, associate vice chair of diversity, equity, and inclusion at Emory University, Atlanta, masterfully discussed the dual pandemics of COVID-19 and racism that we are currently experiencing and tried to describe the unique perspective of Black Americans.
Though it is easy to see that COVID-19 is a pandemic, racism is not always seen in this way. Dr. Manning demonstrated that when a pandemic is defined as “that which occurs over a wide geographic area and affects a high proportion of the population,” racism is absolutely a pandemic. She gave a great analogy: when sticking your hand into a bowl of Lucky Charms cereal, you do not expect to always end up with marshmallows alone, yet repeatedly, we see that Black Americans have been disproportionately affected by COVID-19. We often hear that we are in unprecedented times but as far as racism is concerned, there is nothing new about this.
Dr. Manning discussed the life stories of her grandfather, her father, and even her own life’s milestones such as starting college, getting into medical school, finishing residency – all the way to becoming a full professor. She described how each of these instances, though marked by something beautiful, was also marked by something truly awful. Each time she had a reason to smile and laugh, there was something awful happening in the country simultaneously that showed us how racism was still present. Though this was one person’s story, all Black Americans, not just those working in health care, can recount similar stories, emotions, and feelings of grief.
Dr. Manning concluded by telling us how we can “Do the Work” to combat the pandemic of racism:
- Broaden your fund of knowledge: Read books, listen to podcasts, watch documentaries.
- Remember that people are grieving.
- Explore your implicit biases.
- Be a brave bystander.
- Avoid performative allyship.
Key takeaways
- Though the COVID-19 pandemic is unprecedented, the pandemic of racism is not.
- The story of COVID-19 is the story of social determinants of health.
- We all must “Do the Work” to combat everyday racism and be cognizant of what our Black colleagues are going through every day.
Dr. Doraiswamy is an assistant professor of medicine and pediatrics and a med-peds hospitalist at The Ohio State University and Nationwide Children’s Hospital, Columbus.
Divergent findings with paclitaxel and nab-paclitaxel in TNBC
The trials, IMpassion130 and IMpassion131, both enrolled patients with metastatic or unresectable, locally advanced TNBC.
In IMpassion131, adding atezolizumab to paclitaxel did not improve progression-free survival (PFS) or overall survival (OS), regardless of programmed death–ligand 1 (PD-L1) expression.
In IMpassion130, adding atezolizumab to nab-paclitaxel did not improve OS in the intention-to-treat (ITT) population but did provide a “clinically meaningful” improvement in OS among PD-L1-positive patients, according to investigators.
IMpassion130 and IMpassion131 were presented during the same session at the European Society for Medical Oncology (ESMO) Virtual Congress 2020.
Potential reasons for the different outcomes in the two studies require further exploration, according to David Miles, MD, of Mount Vernon Cancer Centre in Northwood, England, who presented the findings from IMpassion131.
ESMO discussant Lisa A. Carey, MD, of the University of North Carolina at Chapel Hill, posited three possible explanations for the divergent findings. The steroids necessary with paclitaxel dosing may have had a negative effect on immune checkpoint inhibitor activity, differences in study populations may have played a role, or the divergent findings could be caused by chance.
Steroid use in IMpassion131 could have played a negative role because of its lympholytic activity, but other indications with steroid use have not demonstrated attenuated benefits, said Leisha A. Emens, MD, PhD, of the University of Pittsburgh Medical Center, who presented the findings from IMpassion130 at ESMO 2020.
“If I were a patient, based on the data to date, I would want nab-paclitaxel with atezolizumab,” Dr. Emens said.
Trial details
Both trials are phase 3, double-blind, placebo-controlled studies of women with metastatic or unresectable locally advanced TNBC who had received no prior therapy for advanced TNBC.
IMpassion130 included 451 patients randomized to atezolizumab plus nab-paclitaxel and 451 randomized to placebo plus nab-paclitaxel. Patients received nab-paclitaxel at a starting dose of 100 mg/m2 via IV infusion on days 1, 8, and 15 of each 28-day cycle for at least six cycles.
In both studies, patients received atezolizumab at 840 mg on days 1 and 15 of a 28-day cycle in their active treatment arms.
IMpassion131 included 651 patients randomized 2:1 to atezolizumab plus paclitaxel (n = 431) or placebo plus paclitaxel (n = 220). Patients received paclitaxel at 90 mg/m2 on days 1, 8, and 15 every 28 days until disease progression or unacceptable toxicity.
Baseline characteristics were well balanced between the treatment arms in both studies. Less than half of patients – 45% in IMpassion131 and 41% in IMpassion130 – were PD-L1 positive.
Results of IMpassion131
The primary endpoint in IMpassion131 was PFS, and there was no significant difference in PFS between the treatment arms.
“The primary objective of IMpassion131 was not met,” Dr. Miles said. “[The] addition of atezolizumab to paclitaxel did not significantly improve PFS in patients with PD-L1-positive metastatic triple-negative breast cancer.”
In the PD-L1-positive population, the median PFS was 5.7 months in the placebo arm and 6.0 months in the atezolizumab arm (stratified hazard ratio, 0.82, P = .20).
In the ITT population, the median PFS was 5.6 months in the control arm and 5.7 months in the atezolizumab arm (HR, 0.86).
In subgroup analyses, Dr. Miles noted, “There was no clue about adverse or beneficial effects in any subgroup.”
The updated OS analysis demonstrated no benefit with atezolizumab in the ITT population or the PD-L1-positive population. In fact, there was a trend toward better OS for the control group in the latter analysis.
In the PD-L1-positive population, the median OS was 28.3 months in the control arm and 22.1 months in the atezolizumab arm (HR, 1.12). The 2-year OS rates were 51% and 49%, respectively.
In the ITT population, the median OS was 22.8 months in the control arm and 19.2 months in the atezolizumab arm (HR, 1.11). The 2-year OS rates were 45% and 42%, respectively.
The safety profile of the atezolizumab-paclitaxel combination was consistent with known side effects of the individual drugs, Dr. Miles said. There were four fatal treatment-related adverse events in the atezolizumab arm.
Results of IMpassion130
Presenting the final OS analysis from IMpassion130, Dr. Emens noted that the study’s findings have led to recommendations for atezolizumab plus nab-paclitaxel as first-line treatment of PD-L1-positive TNBC in international guidelines.
The median OS in the ITT population was 18.7 months in the placebo arm and 21.0 months in the atezolizumab arm (stratified HR, 0.87, P = .077). The 3-year OS rates were 25% and 28%, respectively.
The median OS in the PD-L1-positive population was 17.9 months in the placebo arm and 25.4 months in the atezolizumab arm (HR, 0.67). The 3-year OS rates were 22% and 36%, respectively.
A P value is not available for the between-arm OS comparison in the PD-L1-positive population. OS was not formally tested in this group because the OS boundary for statistical significance was not crossed in the ITT population. However, Dr. Emens said there was a “clinically meaningful” OS benefit observed with atezolizumab in the PD-L1-positive patients.
Treatment withdrawals caused by adverse events were more common in the atezolizumab arm (19% vs. 8%). The most common of these was neuropathy, Dr. Emens said. However, she noted that atezolizumab-related adverse events were generally low grade and easily managed.
“These results support a positive benefit-risk profile for atezolizumab plus nab-paclitaxel as first-line therapy in patients with PD-L1-positive metastatic triple-negative breast cancer,” Dr. Emens concluded.
Both studies were funded by F. Hoffman–La Roche. Dr. Miles, Dr. Emens, and Dr. Carey disclosed financial relationships with Roche and other companies.
SOURCES: Miles D et al. ESMO 2020, Abstract LBA15; Emens LA et al. ESMO 2020, Abstract LBA16.
FROM ESMO 2020
Higher glycemic time in range may benefit T2D patients
Patients with type 2 or type 1 diabetes who stay in a blood glucose range of 70-180 mg/dL at least 70% of the time have the lowest rates of major adverse coronary events, severe hypoglycemic episodes, and microvascular events, according to a post hoc analysis of data collected from 5,774 patients with type 2 diabetes.

Data collected by the DEVOTE trial showed that every additional 10% of the time that a patient with type 2 diabetes (T2D) spent in their target range for blood glucose linked with a significant 6% reduced rate for developing a major adverse cardiovascular event (MACE), Richard M. Bergenstal, MD, said at the virtual annual meeting of the European Association for the Study of Diabetes.
For every 10% increase in time in range (TIR), patients showed an average 10% drop in their incidence of severe hypoglycemic episodes.
Increasing evidence from post hoc analyses
These findings confirmed a prior post hoc analysis of data collected in the DCCT trial (NCT00360815), which were published in the New England Journal of Medicine, although those results showed significant relationships between increased TIR and decreased rates of retinopathy and microalbuminuria. For every 10% drop in TIR, retinopathy rose by 64% and microalbuminuria increased by 40%, according to a post hoc analysis of the DCCT data that Dr. Bergenstal helped run and was published in Diabetes Care.
“It’s becoming clear that time in range is an important metric for diabetes management, and our new findings and those previously reported with the DCCT data make it look like time in range is becoming a good marker for clinical outcomes as well,” said Dr. Bergenstal, an endocrinologist at the Park Nicollet Clinic in Minneapolis.
“It’s a new concept, getting time-in-range data,” said Dr. Bergenstal, who was a coauthor of recommendations from Diabetes Care that were made in 2019 by an expert panel organized by the Advanced Technologies & Treatments for Diabetes Congress. “We think this will be a good marker to keep glycemia in a safe range, and the results look positive.” Patients who stay in the blood glucose range of 70-180 mg/dL (3.9-10.0 mmol/L) at least 70% of the time generally have an hemoglobin A1c of about 7%, which is what makes it a good target for patients and clinicians to focus on. Patients with a 50% TIR rate generally have an HbA1c of about 8%.
But a TIR assessment can be more informative than HbA1c, said the 2019 recommendations document. It called TIR assessments “appropriate and useful as clinical targets and outcome measurements that complement A1c for a wide range of people with diabetes.”
Data mining from DEVOTE
The analysis run by Dr. Bergenstal and his associates used data from 5,774 of the 7,637 patients enrolled in the DEVOTE trial, for whom adequate longitudinal blood glucose data were available to derive and track TIR. DEVOTE had the primary aim of comparing two different types of insulin in patients with T2D, according to its explanation in the New England Journal of Medicine. The DEVOTE patients did not undergo routine continuous blood glucose monitoring, so derivation of TIR was the only option with the dataset, Dr. Bergenstal said. “We’re trying to get continuous blood monitoring into T2D trials,” he said.
The post hoc analysis showed that, during the study’s follow-up of just under 2 years, patients who maintained a derived TIR of 70%-100% had about a 6% MACE rate, which peaked at nearly twice that in patients whose TIR was 30% or less. The analysis showed a roughly positive linear relationship between TIR and MACE rates across the range of TIR values. In an adjusted analysis, patients with at least a 70% TIR had a significant 31% lower rate of MACE events, compared with patients whose TIR was 50% or less.
A second analysis that looked for the association between TIR and incidence of hypoglycemic episodes showed a somewhat similar positive relationship, with incidence rates of severe hypoglycemia episodes of about 4%-5% among patients with a TIR of 70% or greater, and a rate of about 7% in patients with a TIR of 30% or less, spiking to 14% among patients with a TIR of 10% or less. In an adjusted analysis, patients with a TIR of at least 70% had a significant 46% lower rate of severe hypoglycemic events, compared with patients whose TIR was 50% or less. This finding belies a common misconception that the tighter glycemic control that produces a higher TIR will lead to increased episodes of severe hypoglycemia, Dr. Bergenstal noted.
He also reported less extensive data on microvascular events. In an adjusted analysis, patients with a TIR of at least 70% had a significant 40% cut in these events compared with patients with 50% or less TIR.
DEVOTE was funded by Novo Nordisk. Dr. Bergenstal has had financial relationships with Novo Nordisk and several other companies.
SOURCE: Bergenstal R et al. EASD 2020, abstract 159.
Patients with type 2 or type 1 diabetes who stay in a blood glucose range of 70-180 mg/dL at least 70% of the time have the lowest rates of major adverse coronary events, severe hypoglycemic episodes, and microvascular events, according to a post hoc analysis of data collected from 5,774 patients with type 2 diabetes.
Data collected by the DEVOTE trial showed that every additional 10% of the time that a patient with type 2 diabetes (T2D) spent in their target range for blood glucose linked with a significant 6% reduced rate for developing a major adverse cardiovascular event (MACE), Richard M. Bergenstal, MD, said at the virtual annual meeting of the European Association for the Study of Diabetes.
For every 10% increase in time in range (TIR), patients showed an average 10% drop in their incidence of severe hypoglycemic episodes.
Increasing evidence from post hoc analyses
These findings confirmed a prior post hoc analysis of data collected in the DCCT trial (NCT00360815), which were published in the New England Journal of Medicine, although those results showed significant relationships between increased TIR and decreased rates of retinopathy and microalbuminuria. For every 10% drop in TIR, retinopathy rose by 64% and microalbuminuria increased by 40%, according to a post hoc analysis of the DCCT data that Dr. Bergenstal helped run and was published in Diabetes Care.
“It’s becoming clear that time in range is an important metric for diabetes management, and our new findings and those previously reported with the DCCT data make it look like time in range is becoming a good marker for clinical outcomes as well,” said Dr. Bergenstal, an endocrinologist at the Park Nicollet Clinic in Minneapolis.
“It’s a new concept, getting time-in-range data,” said Dr. Bergenstal, who was a coauthor of recommendations from Diabetes Care that were made in 2019 by an expert panel organized by the Advanced Technologies & Treatments for Diabetes Congress. “We think this will be a good marker to keep glycemia in a safe range, and the results look positive.” Patients who stay in the blood glucose range of 70-180 mg/dL (3.9-10.0 mmol/L) at least 70% of the time generally have an hemoglobin A1c of about 7%, which is what makes it a good target for patients and clinicians to focus on. Patients with a 50% TIR rate generally have an HbA1c of about 8%.
But a TIR assessment can be more informative than HbA1c, said the 2019 recommendations document. It called TIR assessments “appropriate and useful as clinical targets and outcome measurements that complement A1c for a wide range of people with diabetes.”
Data mining from DEVOTE
The analysis run by Dr. Bergenstal and his associates used data from 5,774 of the 7,637 patients enrolled in the DEVOTE trial, for whom adequate longitudinal blood glucose data were available to derive and track TIR. DEVOTE had the primary aim of comparing two different types of insulin in patients with T2D, according to its explanation in the New England Journal of Medicine. The DEVOTE patients did not undergo routine continuous blood glucose monitoring, so derivation of TIR was the only option with the dataset, Dr. Bergenstal said. “We’re trying to get continuous blood monitoring into T2D trials,” he said.
The post hoc analysis showed that, during the study’s follow-up of just under 2 years, patients who maintained a derived TIR of 70%-100% had about a 6% MACE rate, which peaked at nearly twice that in patients whose TIR was 30% or less. The analysis showed a roughly positive linear relationship between TIR and MACE rates across the range of TIR values. In an adjusted analysis, patients with at least a 70% TIR had a significant 31% lower rate of MACE events, compared with patients whose TIR was 50% or less.
A second analysis that looked for the association between TIR and incidence of hypoglycemic episodes showed a somewhat similar positive relationship, with incidence rates of severe hypoglycemia episodes of about 4%-5% among patients with a TIR of 70% or greater, and a rate of about 7% in patients with a TIR of 30% or less, spiking to 14% among patients with a TIR of 10% or less. In an adjusted analysis, patients with a TIR of at least 70% had a significant 46% lower rate of severe hypoglycemic events, compared with patients whose TIR was 50% or less. This finding belies a common misconception that the tighter glycemic control that produces a higher TIR will lead to increased episodes of severe hypoglycemia, Dr. Bergenstal noted.
He also reported less extensive data on microvascular events. In an adjusted analysis, patients with a TIR of at least 70% had a significant 40% cut in these events compared with patients with 50% or less TIR.
DEVOTE was funded by Novo Nordisk. Dr. Bergenstal has had financial relationships with Novo Nordisk and several other companies.
SOURCE: Bergenstal R et al. EASD 2020, abstract 159.
FROM EASD 2020
Exercise cuts diabetes death risk by a third in two studies
Type 2 diabetes patients could lower their risk for death from any cause by up to a third by exercising at a moderate to high level or by cycling, according to data from two studies reported at the virtual annual meeting of the European Association for the Study of Diabetes.

Yun-Ju Lai, MD, and colleagues from the Puli branch of Taichung Veterans General Hospital in Nantou, Taiwan, found that persons with type 2 diabetes who exercised at moderate to high intensity had a 25%-32% decreased risk for death, compared with those who did not exercise.
In a separate study, Mathias Ried-Larsen, MSc, PhD, group leader at the Centre for Physical Activity Research, Rigshospitalet, Copenhagen, and associates found that cycling was associated with a 25%-31% decreased risk for all-cause death compared to no cycling, and that cycling also reduced cardiovascular mortality.
Results fit with ADA recommendations
“There is really nothing surprising about these results as others have shown that regular participation in physical activity lowers both overall mortality rates and morbidity,” commented Sheri Colberg-Ochs, PhD, professor emerita in exercise science at Old Dominion University in Norfolk, Va., in an interview.

“Regular exercise participation lowers the risk of mortality in almost all populations with many different health conditions. It is not specific to people with type 2 diabetes,” Dr. Colberg-Ochs said. “These data add further support to the ADA [American Diabetes Association] recommendations by again suggesting that being more active leads to many health benefits for people with type 2 diabetes.”
Dr. Colberg-Ochs, who was not involved in either study, is recognized by the ADA as an Outstanding Educator in Diabetes. She was also involved in writing the ADA’s position statement on physical activity/exercise in diabetes, which advocate that adults with type 2 diabetes should reduce sedentary time and undertake both aerobic and resistance exercise training to help optimize their glycemic and general health outcomes.
Asian population understudied
In an interview Dr. Lai acknowledged that epidemiologic studies had shown that exercise reduced the risk of cardiovascular events and mortality in subjects with type 2 diabetes. “However, the dose of exercise capacity for reducing mortality risk in people with type 2 diabetes was not yet well investigated, especially in the Asian population.”
Dr. Lai and colleagues analyzed data on 4,859 subjects drawn from two Taiwanese databases – the National Health Interview Survey and the National Health Insurance research database – to study what effect exercise “capacity” had on the risk for death in those with type 2 diabetes.
“Information about physical activity during leisure time was collected by asking the questions: ‘How often do you exercise every week? What kind of exercise do you do? How long do you do the exercise?’, Dr. Lai said. “We included nearly all kinds of exercise in the analysis, such as jogging, swimming, walking, dancing, riding, and so on.”
Each exercise had an activity intensity code expressed as kilocalories per minute. This was used to determine the exercise “capacity” by multiplying it by how frequently the exercise was performed per week and for how long each time.
“I don’t think ‘capacity’ is the right word to use here. The equation they used describes their exercise ‘volume,’ not their capacity. Self-reported exercise is notoriously inaccurate,” Dr. Colberg-Ochs observed. Furthermore, “just asking people how much they exercise and at what intensity [without using a validated exercise questionnaire] gives questionable results.”
The study’s findings, however, were clear: Those who exercised at a higher level had a significantly decreased risk for all-cause mortality than did those with no exercise habits. The hazard ratio for death by any cause was 0.75 for those who undertook a moderate level of exercise, burning 0-800 kcal per week. Exercising at a higher level burned more than 800 kcal had a HR of 0.68. A significant (P < .01) trend in favor of more exercise was noted.
Cycling reduces all-cause and cardiovascular mortality
In their prospective cohort study, Dr. Ried-Larsen and associates took a more specific look at the effects of exercise on mortality in diabetes by studying a single exercise: cycling. They sampled data on more than 5,000 people collected as part of the European Prospective Investigation into Cancer and Nutrition study. First, they identified participants with diabetes – although they couldn’t distinguish type 1 from type 2 forms because this was self-reported or obtained from registries. They then identified those who reported cycling at their baseline assessment and those who reported a change in cycling habits at their second examination around 5 years later.
At baseline, 38% of participants reported that they cycled every week. The mean age was 56 years, diabetes duration was 8 years, one-fifth were smokers, and the average body mass index was 29 kg/m2.
Participants who reported cycling up to 1 hour every week at baseline had a 25% reduction in all-cause mortality, compared with those who did not cycle. The biggest reduction (31%) in all-cause mortality was seen for cycling 2.5-5 hours a week; cycling for 1-2.5 hours, and for more than 5 hours, yielded 23% and 24% risk reductions, respectively.
A reverse J–shaped relationship between cycling duration and reduction in all-cause mortality was seen, Dr. Ried-Larsen noted during a live oral session at the virtual meeting. “The maximum benefit [was at] around 5 hours per week, and the benefits persisted until around 9 hours per week.” Adjustment for the prevalence of stroke, MI, cancer, hyperlipidemia, hypertension, and central obesity did not alter the findings.
“The direction of the association was the same for cardiovascular mortality as all-cause mortality, although a bit weaker, with the maximum benefit being around 4 hours per week, and that persisted up until around 8 hours per week,” Dr. Ried-Larsen said.
The benefits of cycling on all-cause and cardiovascular mortality were lost, however, if those who cycled at baseline stopped by the second examination. Those who did not cycle at the first but did at the second examination got a benefit on both, as did those who continued cycling.
“Cycling is among one of the preferred activities for diabetes patients, so it actually may help them to achieve the recommend level of physical activity,” Dr. Ried-Larsen said.
Tailored exercise program important
Advice for exercise “should be tailored to the individual and based on starting fitness levels and activity levels,” Dr. Colberg-Ochs recommended.
“Those who are the most sedentary and the least fit have the most to gain from doing any activity. They should be advised to start out slowly and progress slowly with both aerobic activities and some resistance training,” Dr. Colberg-Ochs said.
She added: “In addition, individuals over 40 should engage in regular balance training, and all individuals should do some flexibility exercises.”
The studies received no commercial funding and all those mentioned in this article had no conflicts of interest to disclose.
SOURCE: Lai Y-J et al. EASD 2020, Poster presentation 267; Ried-Larsen M et al. EASD 2020, Oral presentation 194.
Type 2 diabetes patients could lower their risk for death from any cause by up to a third by exercising at a moderate to high level or by cycling, according to data from two studies reported at the virtual annual meeting of the European Association for the Study of Diabetes.
Yun-Ju Lai, MD, and colleagues from the Puli branch of Taichung Veterans General Hospital in Nantou, Taiwan, found that persons with type 2 diabetes who exercised at moderate to high intensity had a 25%-32% decreased risk for death, compared with those who did not exercise.
In a separate study, Mathias Ried-Larsen, MSc, PhD, group leader at the Centre for Physical Activity Research, Rigshospitalet, Copenhagen, and associates found that cycling was associated with a 25%-31% decreased risk for all-cause death compared to no cycling, and that cycling also reduced cardiovascular mortality.
Results fit with ADA recommendations
“There is really nothing surprising about these results as others have shown that regular participation in physical activity lowers both overall mortality rates and morbidity,” commented Sheri Colberg-Ochs, PhD, professor emerita in exercise science at Old Dominion University in Norfolk, Va., in an interview.
“Regular exercise participation lowers the risk of mortality in almost all populations with many different health conditions. It is not specific to people with type 2 diabetes,” Dr. Colberg-Ochs said. “These data add further support to the ADA [American Diabetes Association] recommendations by again suggesting that being more active leads to many health benefits for people with type 2 diabetes.”
Dr. Colberg-Ochs, who was not involved in either study, is recognized by the ADA as an Outstanding Educator in Diabetes. She was also involved in writing the ADA’s position statement on physical activity/exercise in diabetes, which advocate that adults with type 2 diabetes should reduce sedentary time and undertake both aerobic and resistance exercise training to help optimize their glycemic and general health outcomes.
Asian population understudied
In an interview Dr. Lai acknowledged that epidemiologic studies had shown that exercise reduced the risk of cardiovascular events and mortality in subjects with type 2 diabetes. “However, the dose of exercise capacity for reducing mortality risk in people with type 2 diabetes was not yet well investigated, especially in the Asian population.”
Dr. Lai and colleagues analyzed data on 4,859 subjects drawn from two Taiwanese databases – the National Health Interview Survey and the National Health Insurance research database – to study what effect exercise “capacity” had on the risk for death in those with type 2 diabetes.
“Information about physical activity during leisure time was collected by asking the questions: ‘How often do you exercise every week? What kind of exercise do you do? How long do you do the exercise?’, Dr. Lai said. “We included nearly all kinds of exercise in the analysis, such as jogging, swimming, walking, dancing, riding, and so on.”
Each exercise had an activity intensity code expressed as kilocalories per minute. This was used to determine the exercise “capacity” by multiplying it by how frequently the exercise was performed per week and for how long each time.
“I don’t think ‘capacity’ is the right word to use here. The equation they used describes their exercise ‘volume,’ not their capacity. Self-reported exercise is notoriously inaccurate,” Dr. Colberg-Ochs observed. Furthermore, “just asking people how much they exercise and at what intensity [without using a validated exercise questionnaire] gives questionable results.”
The study’s findings, however, were clear: Those who exercised at a higher level had a significantly decreased risk for all-cause mortality than did those with no exercise habits. The hazard ratio for death by any cause was 0.75 for those who undertook a moderate level of exercise, burning 0-800 kcal per week. Exercising at a higher level burned more than 800 kcal had a HR of 0.68. A significant (P < .01) trend in favor of more exercise was noted.
Cycling reduces all-cause and cardiovascular mortality
In their prospective cohort study, Dr. Ried-Larsen and associates took a more specific look at the effects of exercise on mortality in diabetes by studying a single exercise: cycling. They sampled data on more than 5,000 people collected as part of the European Prospective Investigation into Cancer and Nutrition study. First, they identified participants with diabetes – although they couldn’t distinguish type 1 from type 2 forms because this was self-reported or obtained from registries. They then identified those who reported cycling at their baseline assessment and those who reported a change in cycling habits at their second examination around 5 years later.
At baseline, 38% of participants reported that they cycled every week. The mean age was 56 years, diabetes duration was 8 years, one-fifth were smokers, and the average body mass index was 29 kg/m2.
Participants who reported cycling up to 1 hour every week at baseline had a 25% reduction in all-cause mortality, compared with those who did not cycle. The biggest reduction (31%) in all-cause mortality was seen for cycling 2.5-5 hours a week; cycling for 1-2.5 hours, and for more than 5 hours, yielded 23% and 24% risk reductions, respectively.
A reverse J–shaped relationship between cycling duration and reduction in all-cause mortality was seen, Dr. Ried-Larsen noted during a live oral session at the virtual meeting. “The maximum benefit [was at] around 5 hours per week, and the benefits persisted until around 9 hours per week.” Adjustment for the prevalence of stroke, MI, cancer, hyperlipidemia, hypertension, and central obesity did not alter the findings.
“The direction of the association was the same for cardiovascular mortality as all-cause mortality, although a bit weaker, with the maximum benefit being around 4 hours per week, and that persisted up until around 8 hours per week,” Dr. Ried-Larsen said.
The benefits of cycling on all-cause and cardiovascular mortality were lost, however, if those who cycled at baseline stopped by the second examination. Those who did not cycle at the first but did at the second examination got a benefit on both, as did those who continued cycling.
“Cycling is among one of the preferred activities for diabetes patients, so it actually may help them to achieve the recommend level of physical activity,” Dr. Ried-Larsen said.
Tailored exercise program important
Advice for exercise “should be tailored to the individual and based on starting fitness levels and activity levels,” Dr. Colberg-Ochs recommended.
“Those who are the most sedentary and the least fit have the most to gain from doing any activity. They should be advised to start out slowly and progress slowly with both aerobic activities and some resistance training,” Dr. Colberg-Ochs said.
She added: “In addition, individuals over 40 should engage in regular balance training, and all individuals should do some flexibility exercises.”
The studies received no commercial funding and all those mentioned in this article had no conflicts of interest to disclose.
SOURCE: Lai Y-J et al. EASD 2020, Poster presentation 267; Ried-Larsen M et al. EASD 2020, Oral presentation 194.
FROM EASD 2020
My opus was myopic
I had been in practice only 6 or 7 years when I got the itch to do some writing. I had been exchanging letters with my father since I left for college. He was a professional writer but I had never done more than was required to get through school. What motivated me to sit down at the keyboard of his old hand-me-down portable typewriter was my frustration with grandmothers, as nearly every day I found myself struggling to counter some grandmother’s well-intentioned but somewhat off-the-mark childrearing advice.

Occasionally this would be during a face-to-face encounter with a grandmother who had tagged along to the well-baby visit. More often, I was trying to arm a mother or father with the “facts” (at least as I understood them) that they could carry home and use to defend my position as the child care expert for the family.
These were not knock-down-drag-out disagreements but I always felt badly that I might be tarnishing a grandmother’s reputation. Grandfathers seemed to have learned it was best to keep silent on childrearing. I knew from my own family that most grandmothers had years of experience raising children that, if properly delivered, could make childrearing a more positive experience for new parents. My father, whose mother was widowed when he was an infant, was raised by his grandmother. However, too often I found that grandmotherly advice came packaged with just enough old wives’ tales and factually incorrect medical information to be dangerous.
The title of my opus would be “The Good Grandmother Handbook” and it would be an effort to update grandmothers with the latest information on childrearing from a recently trained and cocky board-certified pediatrician with only 6 years’ practice under his belt. The book would reassure grandmothers that, although some of the things they had done as parents are now frowned upon, most of what they did has stood the test of time and probably is worth sharing.
The final chapter of the book would be about grandparent etiquette. How to deal with the fact that there is another set of grandparents who have opinions and would like to have time with their grandchildren. When and how to give advice: Basically, only if asked or you feel your grandchild’s life is at stake. And, finally, how to deal with the disappointment of not being asked for advice and not being involved.
Not surprisingly that sophomoric and condescending effort never got further than the first draft. It reflected my early experiences in a minimally diverse and relatively affluent community. As my world view broadened, I realized that for many families it’s not a question of how to deal with a grandmother’s unsolicited advice. There are numerous grandparents who have been forced to become safe havens in which a family in distress can ride out the turbulent economic times and societal upheaval.

A Pediatrics article estimates that 2% of children in this country are being raised by their grandparents. And, it turns out that grandparents are doing a surprisingly good job. The researchers concluded that: “Despite caring for children with greater developmental problems and poorer temperament grandparent caregivers seem to cope with parenting about as well as parents.”
As pediatricians we must continue to reach out to grandmothers and grandfathers who are caring for some of our most challenged patients. They need our medical advice but even more they need our compassion and emotional support. Over the last 5 decades I’ve come to learn that, although there are some grandmothers who can be meddlesome dispensers of old wives’ tales, many are the backbone of families in need.
Dr. Wilkoff practiced primary care pediatrics in Brunswick, Maine, for nearly 40 years. He has authored several books on behavioral pediatrics, including “How to Say No to Your Toddler.” Email him at [email protected].
I had been in practice only 6 or 7 years when I got the itch to do some writing. I had been exchanging letters with my father since I left for college. He was a professional writer but I had never done more than was required to get through school. What motivated me to sit down at the keyboard of his old hand-me-down portable typewriter was my frustration with grandmothers, as nearly every day I found myself struggling to counter some grandmother’s well-intentioned but somewhat off-the-mark childrearing advice.
Occasionally this would be during a face-to-face encounter with a grandmother who had tagged along to the well-baby visit. More often, I was trying to arm a mother or father with the “facts” (at least as I understood them) that they could carry home and use to defend my position as the child care expert for the family.
These were not knock-down-drag-out disagreements but I always felt badly that I might be tarnishing a grandmother’s reputation. Grandfathers seemed to have learned it was best to keep silent on childrearing. I knew from my own family that most grandmothers had years of experience raising children that, if properly delivered, could make childrearing a more positive experience for new parents. My father, whose mother was widowed when he was an infant, was raised by his grandmother. However, too often I found that grandmotherly advice came packaged with just enough old wives’ tales and factually incorrect medical information to be dangerous.
The title of my opus would be “The Good Grandmother Handbook” and it would be an effort to update grandmothers with the latest information on childrearing from a recently trained and cocky board-certified pediatrician with only 6 years’ practice under his belt. The book would reassure grandmothers that, although some of the things they had done as parents are now frowned upon, most of what they did has stood the test of time and probably is worth sharing.
The final chapter of the book would be about grandparent etiquette. How to deal with the fact that there is another set of grandparents who have opinions and would like to have time with their grandchildren. When and how to give advice: Basically, only if asked or you feel your grandchild’s life is at stake. And, finally, how to deal with the disappointment of not being asked for advice and not being involved.
Not surprisingly that sophomoric and condescending effort never got further than the first draft. It reflected my early experiences in a minimally diverse and relatively affluent community. As my world view broadened, I realized that for many families it’s not a question of how to deal with a grandmother’s unsolicited advice. There are numerous grandparents who have been forced to become safe havens in which a family in distress can ride out the turbulent economic times and societal upheaval.
A Pediatrics article estimates that 2% of children in this country are being raised by their grandparents. And, it turns out that grandparents are doing a surprisingly good job. The researchers concluded that: “Despite caring for children with greater developmental problems and poorer temperament grandparent caregivers seem to cope with parenting about as well as parents.”
As pediatricians we must continue to reach out to grandmothers and grandfathers who are caring for some of our most challenged patients. They need our medical advice but even more they need our compassion and emotional support. Over the last 5 decades I’ve come to learn that, although there are some grandmothers who can be meddlesome dispensers of old wives’ tales, many are the backbone of families in need.
Dr. Wilkoff practiced primary care pediatrics in Brunswick, Maine, for nearly 40 years. He has authored several books on behavioral pediatrics, including “How to Say No to Your Toddler.” Email him at [email protected].
Identify the dominant symptom in IBS
Many factors can prompt individuals with irritable bowel syndrome (IBS) to seek consultation with a specialist said Anthony Lembo, MD, of Harvard Medical School and Beth Israel Deaconess Medical Center, Boston, in a virtual presentation at the conference jointly provided by Rutgers and Global Academy for Medical Education.

Most patients with IBS suffer with symptoms for years before seeking care, he said.
Common reasons to cause an individual with IBS to seek care include severity of abdominal pain, psychological disturbance such as anxiety, and concerns about organic disease such as colon cancer, perhaps because they know someone who was recently diagnosed with it,” he said.
Our understanding of the pathophysiology of IBS has expanded dramatically over the past decade, Dr. Lembo said. IBS was once thought to be primarily a motility disorder, but currently the many interacting factors include not only motility but also diet, gut microflora, visceral hypersensitivity, immune dysregulation, and brain-gut interactions, he said.
The pathophysiology of postinfectious IBS has been particularly well described and includes the role of anti-CdtB and antivinculin antibodies, and low-grade inflammation in the lining of the intestines, Dr. Lembo explained.
These cases of postinfection IBS can linger for up to a year in approximately 10% of patients, he said.
IBS can affect anyone, anywhere, but it tends to be more common in younger individuals than older adults, and more common in women than men, Dr. Lembo said.
When diagnosing IBS in the clinic setting, a history should include a timeline and triggers for symptoms, he advised. A detailed dietary history, review of medications, and an assessment for alarm features (such as family history of colon cancer or celiac disease, weight loss, anemia, blood in stools, nocturnal awakening, or an onset of symptoms at age older than 50 years) should also be included he said.
Physical signs of systemic and local disease, and a digital rectal exam to assess patients for dyssynergia, especially those with constipation should also be performed, Dr. Lembo added.
In some cases, consider a colonoscopy for patients with IBS, namely those with alarm features, age-appropriate screening criteria, the presence of persistent and frequent watery diarrhea, or in patients who don’t respond to therapy, he added.
Treatment strategies for IBS should start with diet and lifestyle modifications when appropriate, Dr. Lembo said. Encourage patients to pursue moderate to vigorous exercise or some physical activity 3-5 times a week, to get enough sleep, and to start with a traditional IBS diet. Such a diet involves three meals a day, with three or fewer snacks, and not overeating at any of these times, he said. Other diet tips include reducing consumption of fatty or spicy foods, as well as coffee, alcohol, onions, beans, and cabbage. He also advised encouraging patients to avoid gum and soft drinks, as well as artificial sweeteners, and to use soluble rather than insoluble fiber. The low-FODMAP (fermentable oligo-, di-, monosaccharides and polyols) diet has shown benefit in some patients. For those who respond to the low-FODMAP diet it is important to reintroduce foods into their diet. Nutrition consultation should be considered for most patients.
Follow a stepwise approach to treatment, Dr. Lembo emphasized that, if IBS patients with constipation are not improving with diet and lifestyle, over-the-counter medications such as polyethylene glycol can be considered to improve bowel consistency, although the drug’s effect on pain is limited. Prescription options include secretogogues (linaclotide, plenecatide, lubiprostone), and prokinetics (tegaserod, a 5-HT4 partial agonist that was recently reapproved by the FDA for women < 65 years without cardiovascular risk factors). In general, prescription drugs for IBS-C have similar efficacy in most endpoints though differences in their mechanisms of action and side effects should be considered when prescribing a particular agent, he said.
Other perspectives on managing IBS include cognitive behavior therapy and fecal microbiota transplant, Dr. Lembo said. Cognitive behavior therapy improves IBS symptoms after 12 weeks in patients who had weekly sessions compared with controls who received 4 weeks of basic patient education, he noted. As for fecal microbiota transplant, the jury is still out and it is important to note that FMT is not currently approved for clinical practice for patients with IBS, he noted.
Dr. Lembo disclosed relationships with Allergan, Ardelyx, Bayer, Bioamerica, Ironwood, Mylan and Takeda.
Global Academy for Medical Education and this news organization are owned by the same parent company.
Many factors can prompt individuals with irritable bowel syndrome (IBS) to seek consultation with a specialist said Anthony Lembo, MD, of Harvard Medical School and Beth Israel Deaconess Medical Center, Boston, in a virtual presentation at the conference jointly provided by Rutgers and Global Academy for Medical Education.
Most patients with IBS suffer with symptoms for years before seeking care, he said.
Common reasons to cause an individual with IBS to seek care include severity of abdominal pain, psychological disturbance such as anxiety, and concerns about organic disease such as colon cancer, perhaps because they know someone who was recently diagnosed with it,” he said.
Our understanding of the pathophysiology of IBS has expanded dramatically over the past decade, Dr. Lembo said. IBS was once thought to be primarily a motility disorder, but currently the many interacting factors include not only motility but also diet, gut microflora, visceral hypersensitivity, immune dysregulation, and brain-gut interactions, he said.
The pathophysiology of postinfectious IBS has been particularly well described and includes the role of anti-CdtB and antivinculin antibodies, and low-grade inflammation in the lining of the intestines, Dr. Lembo explained.
These cases of postinfection IBS can linger for up to a year in approximately 10% of patients, he said.
IBS can affect anyone, anywhere, but it tends to be more common in younger individuals than older adults, and more common in women than men, Dr. Lembo said.
When diagnosing IBS in the clinic setting, a history should include a timeline and triggers for symptoms, he advised. A detailed dietary history, review of medications, and an assessment for alarm features (such as family history of colon cancer or celiac disease, weight loss, anemia, blood in stools, nocturnal awakening, or an onset of symptoms at age older than 50 years) should also be included he said.
Physical signs of systemic and local disease, and a digital rectal exam to assess patients for dyssynergia, especially those with constipation should also be performed, Dr. Lembo added.
In some cases, consider a colonoscopy for patients with IBS, namely those with alarm features, age-appropriate screening criteria, the presence of persistent and frequent watery diarrhea, or in patients who don’t respond to therapy, he added.
Treatment strategies for IBS should start with diet and lifestyle modifications when appropriate, Dr. Lembo said. Encourage patients to pursue moderate to vigorous exercise or some physical activity 3-5 times a week, to get enough sleep, and to start with a traditional IBS diet. Such a diet involves three meals a day, with three or fewer snacks, and not overeating at any of these times, he said. Other diet tips include reducing consumption of fatty or spicy foods, as well as coffee, alcohol, onions, beans, and cabbage. He also advised encouraging patients to avoid gum and soft drinks, as well as artificial sweeteners, and to use soluble rather than insoluble fiber. The low-FODMAP (fermentable oligo-, di-, monosaccharides and polyols) diet has shown benefit in some patients. For those who respond to the low-FODMAP diet it is important to reintroduce foods into their diet. Nutrition consultation should be considered for most patients.
Follow a stepwise approach to treatment, Dr. Lembo emphasized that, if IBS patients with constipation are not improving with diet and lifestyle, over-the-counter medications such as polyethylene glycol can be considered to improve bowel consistency, although the drug’s effect on pain is limited. Prescription options include secretogogues (linaclotide, plenecatide, lubiprostone), and prokinetics (tegaserod, a 5-HT4 partial agonist that was recently reapproved by the FDA for women < 65 years without cardiovascular risk factors). In general, prescription drugs for IBS-C have similar efficacy in most endpoints though differences in their mechanisms of action and side effects should be considered when prescribing a particular agent, he said.
Other perspectives on managing IBS include cognitive behavior therapy and fecal microbiota transplant, Dr. Lembo said. Cognitive behavior therapy improves IBS symptoms after 12 weeks in patients who had weekly sessions compared with controls who received 4 weeks of basic patient education, he noted. As for fecal microbiota transplant, the jury is still out and it is important to note that FMT is not currently approved for clinical practice for patients with IBS, he noted.
Dr. Lembo disclosed relationships with Allergan, Ardelyx, Bayer, Bioamerica, Ironwood, Mylan and Takeda.
Global Academy for Medical Education and this news organization are owned by the same parent company.
FROM Digestive Diseases: New Advances
Combination beats misoprostol monotherapy on cost effectiveness
A combination of mifepristone followed by misoprostol was significantly more cost effective for the medical management of miscarriage than misoprostol alone, based on a decision-tree model and simulations using a range of patient income levels, cost variables, and practice patterns.

Although the American College of Obstetricians and Gynecologists recommends a combination of mifepristone and misoprostol for the medical management of miscarriage, some physicians may hesitate because of the high cost of mifepristone, wrote Holly H. Berkley, MD, of the Naval Medical Center, San Diego, and colleagues.
Previous research has supported the cost effectiveness of combination therapy, but the data came from a secondary analysis that limited the generalizability of the findings, they wrote. In a study published in Obstetrics & Gynecology, the researchers created a decision-tree model using two standard practice patterns.
In the first, patients received mifepristone and one dose of misoprostol (combination therapy) or one dose of misoprostol alone (monotherapy) at their initial visit with follow-up within 3 days. Combination therapy was defined as 200 mg of oral mifepristone followed by one or two doses of 800 micrograms of vaginal misoprostol; monotherapy was defined as one or two doses of 800 micrograms of vaginal misoprostol.
“If miscarriage is not completed, a second dose of misoprostol is given, and the patient will have a second follow-up visit 8 days after initiation of treatment. If miscarriage is not complete at the second follow-up visit, surgical management is prescribed,” Dr. Berkley and associates reported.
In the second pattern, patients receive two doses of misoprostol at the first visit and an initial follow-up visit 8 days later.
Patient hourly income was based on the wages of three employment levels of the military patient population, estimated at $7.25/hour, $15.90/hour, and $35.10 per hour. “For clinicians outside of the military health system, these wage categories may also serve as an estimate of earnings for low-income, low-middle income, and middle-income patients across the United States,” Dr. Berkley and colleagues noted.
The researchers also considered costs for time of work, transportation, and the costs of the medical visits. Costs also were computed for surgical management with in–operating room dilation and curettage or in-office manual vacuum aspiration, if needed.
The greatest difference in favor of combination therapy resulted in a savings of $190.20 per patient, compared with monotherapy, in the first practice pattern and the lowest wage group (19.5%).
“In every scenario, and for every wage level, the average cost of combination therapy is less than that of monotherapy,” Dr. Berkley and associates noted. In addition, the differences in cost between combination therapy and monotherapy increased with patients’ wages, “reflecting wage differences as well as the net savings owing to increased completion rates.”
Completion rates are key to cost effectiveness
“The higher completion rate of combination therapy leads to decreased time spent on treatment and therefore decreased time off work, decreased office visits, and a decreased need for surgical management for persistent pregnancy, which significantly reduces cost,” they noted.
The model shows that the cost of mifepristone, which some clinicians may see as a barrier, contributes little to the overall treatment costs, Dr. Berkley and colleagues emphasized.
The study findings were limited by several factors including the large ranges in costs for office visits and procedures and the inability to replicate all clinical settings and variables, the researchers noted. However, the results were strengthened by the use of current practice patterns and costs, and they support the mifepristone/misoprostol combination as being the most cost effective for medical management of miscarriage, they said.
The findings of the current study, combined with higher effectiveness reported in recent randomized controlled trials and the endorsement of the American College of Obstetricians and Gynecologists “make a strong case for mifepristone followed by misoprostol to become the standard, first-line treatment regimen for the medical management of miscarriage,” Dr. Berkley and associates concluded.
Research is clear, policy needs to catch up
“There is clear research showing that using mifepristone with misoprostol to medically manage early pregnancy loss is significantly more effective than misoprostol alone,” Sarah Prager, MD, of the University of Washington, Seattle, said in an interview. “The combination protocol does include an expensive medication, so it’s important to evaluate if the cost of this more effective method is ‘worth it,’ ” she said. “ including fewer projected days off work and fewer patients needing procedures to complete their miscarriage.”
Dr. Prager said she was not surprised by the study findings because similar results have been found in other studies evaluating treatment of abortion with misoprostol alone versus mifepristone and misoprostol. “When something is significantly more effective, it usually will also come with a cost benefit.”
Potential barriers to the use of combination therapy are related to policy rather than drug safety or effectiveness, according to Dr. Prager.
“The primary barrier is that mifepristone use is regulated by a REMS [Risk Evaluation and Mitigation Strategy] restriction which requires that providers dispense the medication directly to patients, rather than being able to prescribe it and have patients then pick it up at a pharmacy,” she said. “This restriction is typically used for medications that are dangerous and need to be closely controlled. In the case of mifepristone, the restriction does not serve a safety purpose; it simply limits access to the medication which is still primarily used to medically treat abortion.
“The secondary barrier is stigma against using a medication that is seen as an abortion medication. I fear many providers or practices may avoid putting it on formulary due to this stigma,” Dr. Prager noted.
“There is already sufficient evidence that the combination therapy is superior to monotherapy, and there is also evidence that mifepristone can be safely prescribed [not dispensed] and does not need the REMS requirement,” Dr. Prager said. “I don’t believe more research is needed; just policy change.”
The study received no outside funding. The researchers had no financial conflicts to disclose. Dr. Prager had no financial conflicts to disclose.
SOURCE: Berkley HH et al. Obstet Gynecol. 2020 Oct. doi: 10.1097/AOG.0000000000004063.
A combination of mifepristone followed by misoprostol was significantly more cost effective for the medical management of miscarriage than misoprostol alone, based on a decision-tree model and simulations using a range of patient income levels, cost variables, and practice patterns.
Although the American College of Obstetricians and Gynecologists recommends a combination of mifepristone and misoprostol for the medical management of miscarriage, some physicians may hesitate because of the high cost of mifepristone, wrote Holly H. Berkley, MD, of the Naval Medical Center, San Diego, and colleagues.
Previous research has supported the cost effectiveness of combination therapy, but the data came from a secondary analysis that limited the generalizability of the findings, they wrote. In a study published in Obstetrics & Gynecology, the researchers created a decision-tree model using two standard practice patterns.
In the first, patients received mifepristone and one dose of misoprostol (combination therapy) or one dose of misoprostol alone (monotherapy) at their initial visit with follow-up within 3 days. Combination therapy was defined as 200 mg of oral mifepristone followed by one or two doses of 800 micrograms of vaginal misoprostol; monotherapy was defined as one or two doses of 800 micrograms of vaginal misoprostol.
“If miscarriage is not completed, a second dose of misoprostol is given, and the patient will have a second follow-up visit 8 days after initiation of treatment. If miscarriage is not complete at the second follow-up visit, surgical management is prescribed,” Dr. Berkley and associates reported.
In the second pattern, patients receive two doses of misoprostol at the first visit and an initial follow-up visit 8 days later.
Patient hourly income was based on the wages of three employment levels of the military patient population, estimated at $7.25/hour, $15.90/hour, and $35.10 per hour. “For clinicians outside of the military health system, these wage categories may also serve as an estimate of earnings for low-income, low-middle income, and middle-income patients across the United States,” Dr. Berkley and colleagues noted.
The researchers also considered costs for time of work, transportation, and the costs of the medical visits. Costs also were computed for surgical management with in–operating room dilation and curettage or in-office manual vacuum aspiration, if needed.
The greatest difference in favor of combination therapy resulted in a savings of $190.20 per patient, compared with monotherapy, in the first practice pattern and the lowest wage group (19.5%).
“In every scenario, and for every wage level, the average cost of combination therapy is less than that of monotherapy,” Dr. Berkley and associates noted. In addition, the differences in cost between combination therapy and monotherapy increased with patients’ wages, “reflecting wage differences as well as the net savings owing to increased completion rates.”
Completion rates are key to cost effectiveness
“The higher completion rate of combination therapy leads to decreased time spent on treatment and therefore decreased time off work, decreased office visits, and a decreased need for surgical management for persistent pregnancy, which significantly reduces cost,” they noted.
The model shows that the cost of mifepristone, which some clinicians may see as a barrier, contributes little to the overall treatment costs, Dr. Berkley and colleagues emphasized.
The study findings were limited by several factors including the large ranges in costs for office visits and procedures and the inability to replicate all clinical settings and variables, the researchers noted. However, the results were strengthened by the use of current practice patterns and costs, and they support the mifepristone/misoprostol combination as being the most cost effective for medical management of miscarriage, they said.
The findings of the current study, combined with higher effectiveness reported in recent randomized controlled trials and the endorsement of the American College of Obstetricians and Gynecologists “make a strong case for mifepristone followed by misoprostol to become the standard, first-line treatment regimen for the medical management of miscarriage,” Dr. Berkley and associates concluded.
Research is clear, policy needs to catch up
“There is clear research showing that using mifepristone with misoprostol to medically manage early pregnancy loss is significantly more effective than misoprostol alone,” Sarah Prager, MD, of the University of Washington, Seattle, said in an interview. “The combination protocol does include an expensive medication, so it’s important to evaluate if the cost of this more effective method is ‘worth it,’ ” she said. “ including fewer projected days off work and fewer patients needing procedures to complete their miscarriage.”
Dr. Prager said she was not surprised by the study findings because similar results have been found in other studies evaluating treatment of abortion with misoprostol alone versus mifepristone and misoprostol. “When something is significantly more effective, it usually will also come with a cost benefit.”
Potential barriers to the use of combination therapy are related to policy rather than drug safety or effectiveness, according to Dr. Prager.
“The primary barrier is that mifepristone use is regulated by a REMS [Risk Evaluation and Mitigation Strategy] restriction which requires that providers dispense the medication directly to patients, rather than being able to prescribe it and have patients then pick it up at a pharmacy,” she said. “This restriction is typically used for medications that are dangerous and need to be closely controlled. In the case of mifepristone, the restriction does not serve a safety purpose; it simply limits access to the medication which is still primarily used to medically treat abortion.
“The secondary barrier is stigma against using a medication that is seen as an abortion medication. I fear many providers or practices may avoid putting it on formulary due to this stigma,” Dr. Prager noted.
“There is already sufficient evidence that the combination therapy is superior to monotherapy, and there is also evidence that mifepristone can be safely prescribed [not dispensed] and does not need the REMS requirement,” Dr. Prager said. “I don’t believe more research is needed; just policy change.”
The study received no outside funding. The researchers had no financial conflicts to disclose. Dr. Prager had no financial conflicts to disclose.
SOURCE: Berkley HH et al. Obstet Gynecol. 2020 Oct. doi: 10.1097/AOG.0000000000004063.
FROM OBSTETRICS & GYNECOLOGY