User login
Cutaneous Filariasis in an American Traveler
To the Editor:
Cutaneous filariasis is a group of infectious diseases caused by more than 60 different nematode species and endemic to approximately 83 countries.1,2 These infections are transmitted to humans by vectors such as mosquitoes, blackflies, biting midges, or Tabanid flies.1 The blood meal taken by vectors allow microfilariae to enter the skin and develop into adult worms.1-3 It is postulated that filarial infections were first described in 2000
Filarial parasites have been categorized into groups based on the site of adult worm stage habitat. The cutaneous group includes Loa loa, Onchocerca volvulus, Mansonella perstans, and Dipetalonema streptocerca. The lymphatic group includes Wuchereria bancrofti, Brugia malayi, and Brugia timori. Lastly, the body cavity group includes Mansonella ozzardi. Because humidity is required for survival of the infective larval stage, individuals from tropical countries in Africa, Central America, and South America most commonly are affected.1 These diseases also are related to poor housing quality and inadequate sanitation.1,3,4 Travel for business, medical missions, pleasure, or emigration has caused increased filarial infections globally. In fact, dermatologic disorders with infectious etiologies cause approximately 17% of travelers to seek medical attention.3
Dermatologic manifestations indicative of a potential cutaneous filarial infection include papules, nodules, excoriations with secondary xerosis, lichenification, skin pigment changes, and/or severe pruritus. However, individuals from filarial endemic regions may not demonstrate any clinical signs or symptoms, despite having microfilariae in their blood,1 which enables the disease to propagate and poses a major public health concern. In fact, patients with chronic filarial infections are at increased risk for developing lymphedema, elephantiasis, or blindness, which are hypothesized to be the second largest cause of permanent disability worldwide.1 Although rarely seen in US citizens, cutaneous filariasis should always be a diagnostic consideration in patients who present with a pruritic eruption and have a travel history to tropical countries. We report a case of cutaneous onchocerciasis in a US citizen who developed a pruritic eczematous eruption on the right upper arm following an arthropod assault while working in an Onchocerca endemic region approximately 1.5 years prior.
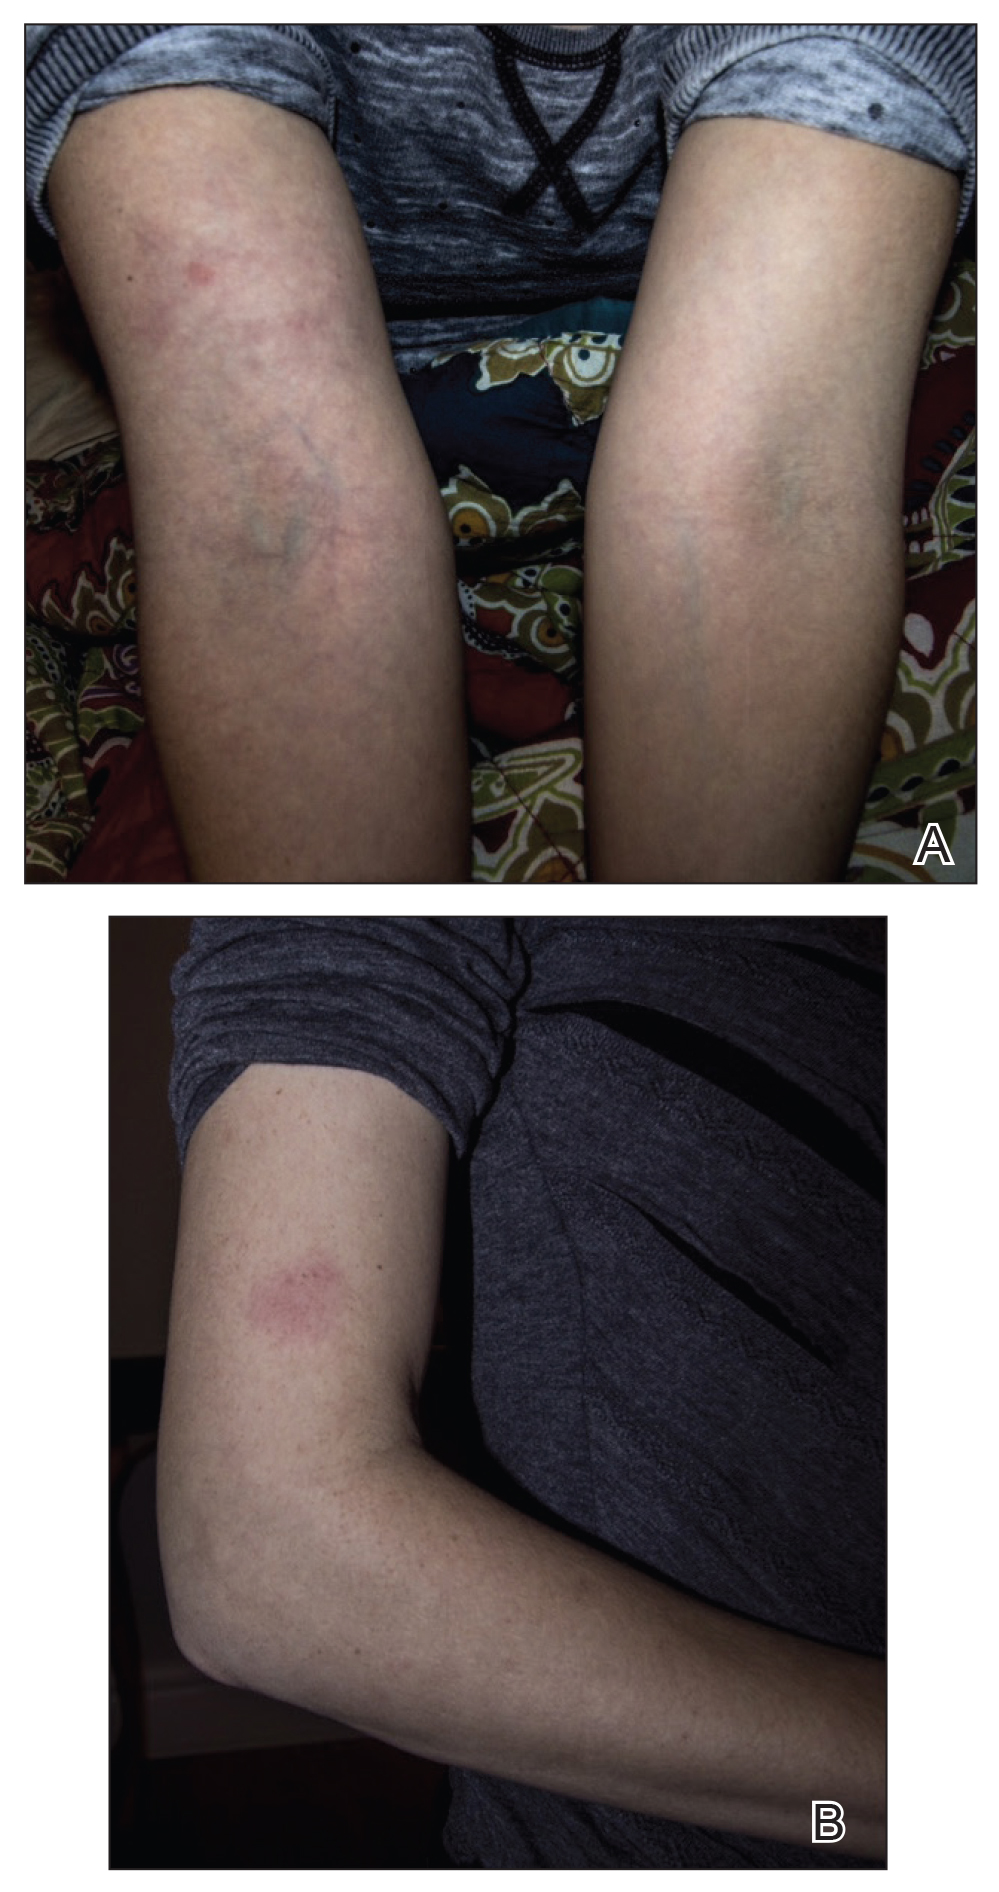
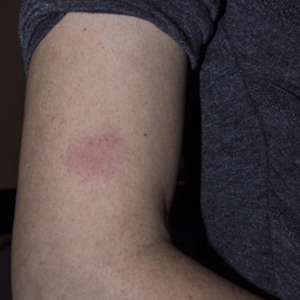
A 33-year-old woman presented to our outpatient dermatology clinic with the chief concern of a pruritic rash on the right arm (Figure 1). She revealed a history of travel to Peru, associated symptoms, prior diagnoses, and attempted treatment regimens. Over a 1.5-year period, the patient traveled for work-related reasons to Madre de Dios, Peru. During that time, the patient experienced 2 bouts of severe abdominal pain, nausea, and vomiting that she attributed to poor food and water quality. She did not immediately seek medical attention. She also developed skin manifestations that began as a pruritic and irritating pinpoint-sized red papule on the right eyelid, possibly a site of an arthropod assault. She then experienced episodic eyelash loss (Figure 2) and subsequent vision changes, including blurry vision, halos around lights, and dimming around the periphery. When the patient developed circular, pink, pruritic plaques on the right upper extremity, she sought medical attention in Lima, Peru. She was diagnosed with tinea corporis and prescribed an oral antibiotic and topical antifungal.

This treatment regimen did not result in improvement. In the following months, the patient noticed worsening of the ocular symptoms, and she developed a dry cough with occasional dyspnea. She again sought medical attention in Peru and was referred to an ophthalmologist who suspected Demodex mite or fungal infection; however, workup for those pathologies was negative. The respiratory symptoms continued to worsen, particularly at night, and she began to experience palpitations.
Upon returning to the United States, the patient was evaluated by her primary care physician who ordered the following laboratory tests: a complete blood cell count with differential, comprehensive metabolic panel, vitamin D level, blood culture, lipid panel, ferritin level, and thyroid function. An electrocardiogram, throat culture, and stool culture for ova and parasites also were obtained. The electrocardiogram showed sinus tachycardia, and the stool culture revealed blastocystis, for which she was prescribed oral metronidazole and tinidazole. The other results were within reference range, and the throat culture showed normal oropharyngeal microbes.
A few days after the treatment for the blastocystis, the gastrointestinal tract symptoms improved, but dermatologic, ocular, pulmonary, and cardiac symptoms persisted. She also began experiencing night sweats and hot flashes. In between visits to the primary care physician, she sought medical attention at an urgent care clinic for worsening pulmonary and cardiac symptoms. At that time, results of a chest radiograph were normal.
The primary care physician referred her to infectious disease and dermatology for further evaluation within a few weeks of returning to the United States. Upon presentation to dermatology, the patient described a waxing and waning nature to the rash on the arm with associated intermittent pain. Physical examination revealed several erythematous patches on the triceps and a 1-cm subcutaneous nodule on the right elbow with overlying skin discoloration. The patient stated that she first noticed the inflamed painful nodule when she returned to the United States. Since its discovery, the nodule increased in size and became firm. The patient also described occasional limited range of motion of the right arm due to the discomfort of the rash and inflamed nodule. Interestingly, the patient’s partner who accompanied her to Peru also developed a similar pruritic rash on the chest. He was evaluated by dermatology and infectious disease; however, biopsies of his rash performed at a different practice revealed nonspecific results. Due to her partner’s inconclusive results, our patient initially refused a biopsy; however, she returned to the office after 1 week with worsening symptoms, and a 4-mm punch biopsy of the right arm was obtained in addition to rapid plasma reagin and QuantiFERON-TB Gold test.
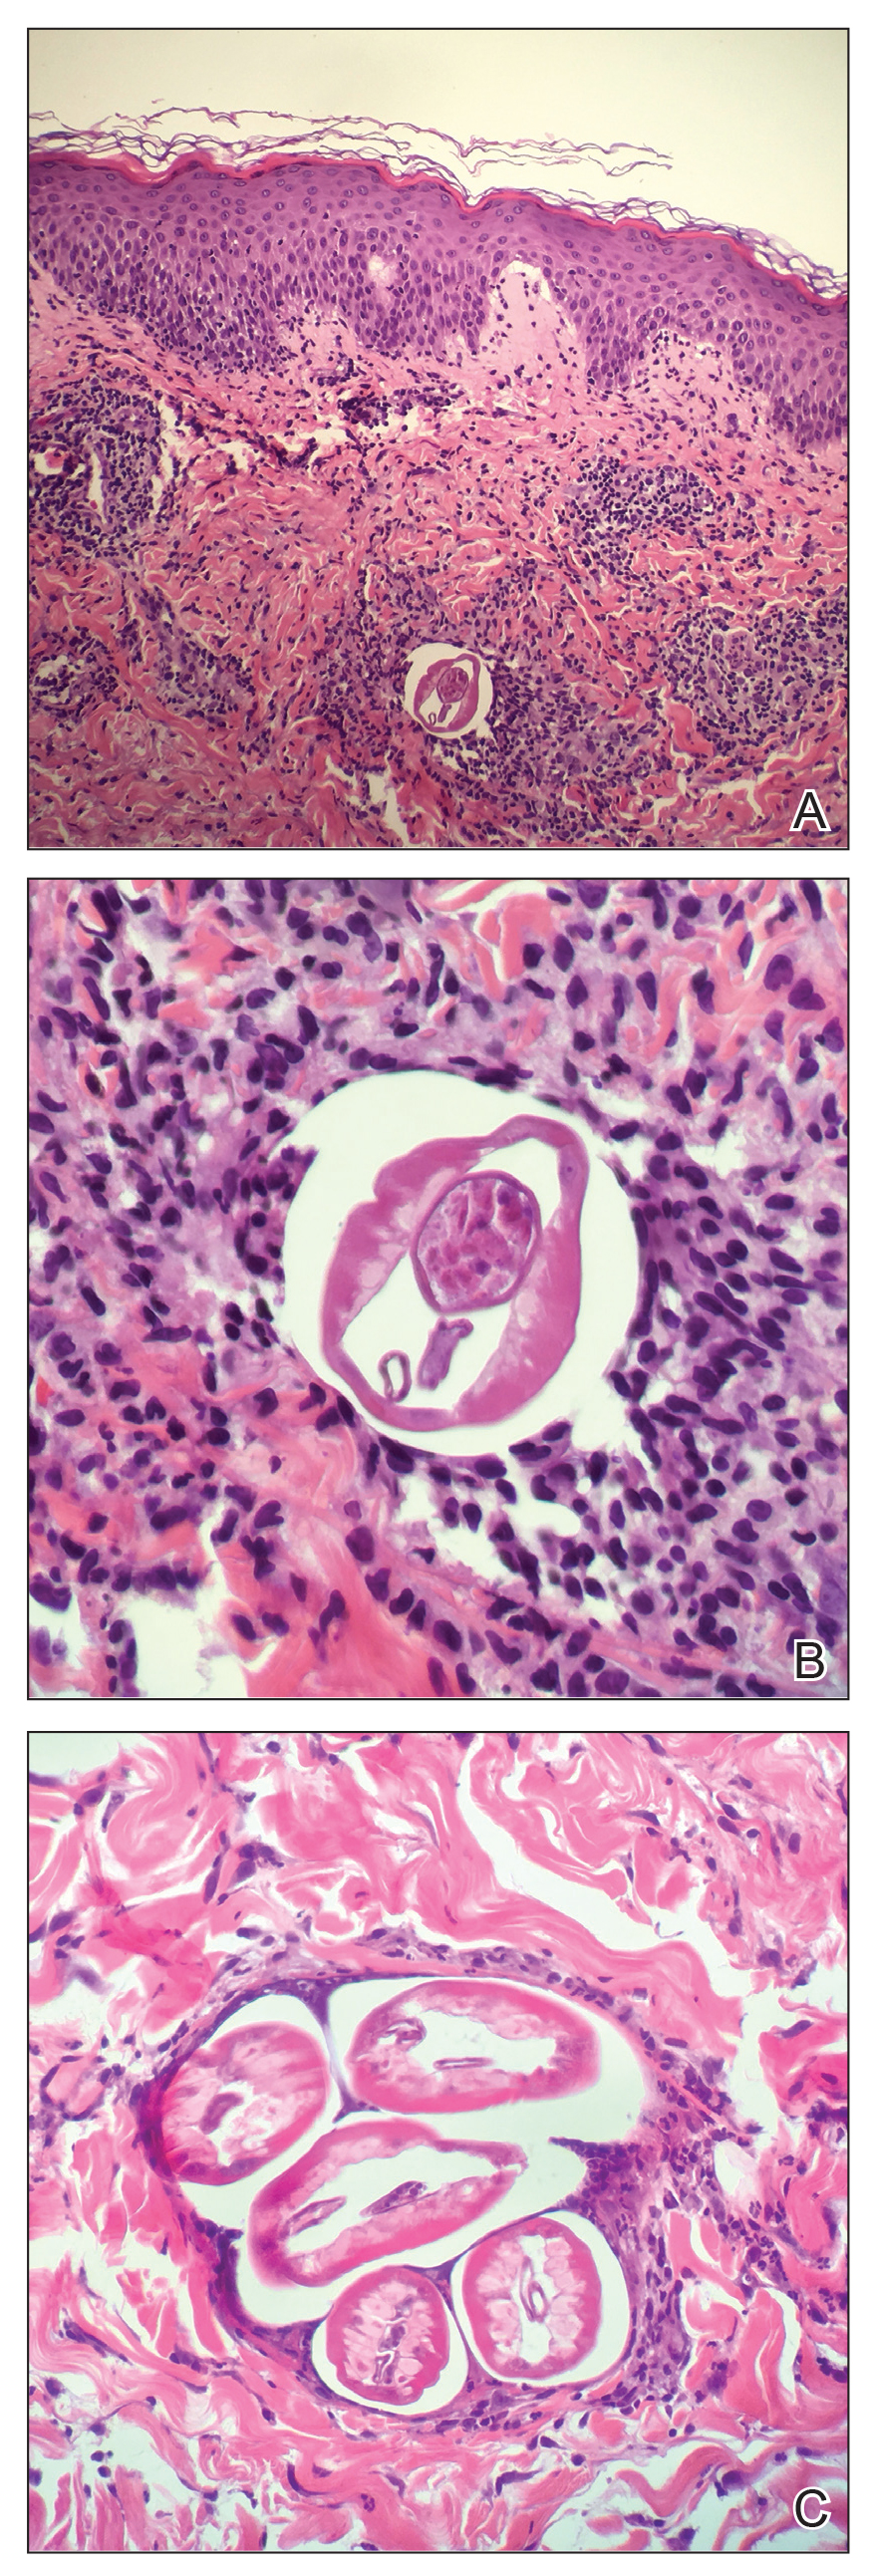
Based on the patient’s travel history, clinical course, and physical examination, the clinical differential diagnosis included nummular dermatitis, panniculitis/nodular vasculitis, tinea corporis, secondary syphilis, pinta, tuberculosis, or cutaneous filariasis. Rapid plasma reagin and QuantiFERON-TB Gold test results were negative, and a periodic acid–Schiff stain of the biopsy was negative for fungal elements. Dermatopathology revealed intradermal filarial nematodes of 120 to 150 µm in diameter and 1-to 2-mm cuticles eliciting a predominantly superficial and deep lymphohistiocytic reaction (Figure 3). The histopathologic differential diagnosis based on the diameter of the nematode included M perstans, W bancrofti, and O volvulus. Clinical correlation was highly recommended to obtain a final diagnosis and management plan. A portion of the biopsy was sent to the Centers for Disease Control and Prevention, which confirmed the presence of a filarial nematode consistent with a zoonotic Brugia but also with zoonotic Onchocerca as a possible differential. Therefore, considering the history, clinical course, and histopathologic analysis, the final diagnosis of cutaneous onchocerciasis was made.
The patient was referred back to infectious disease and started on combination therapy of ivermectin (25.5 mg) plus albendazole (800 mg) taken at once followed by doxycycline (200 mg) for 6 weeks. The symptoms initially worsened, then she experienced near-complete resolution of dermatologic, pulmonary, and ocular symptoms after approximately 2 weeks of treatment. She continued to report fatigue and palpitations, for she continued to see a cardiologist. We highly encouraged her to continue following up with infectious disease to ensure complete eradication of the infection.
Onchocerciasis is common in individuals who live or work in equatorial Africa, Central America, and South America. The disease process has dermatologic, ocular, and other systemic manifestations if the infection continues long-term without treatment.2,5 Although rare, this infection has been observed in US citizens who have traveled to filarial endemic regions for a period of time ranging from 2 weeks to 39 years.2,6,7
Blackflies (genus Simulium), the intermediate host of O volvulus, breed in areas close to freely flowing water. The blackfly bites a human host, and within 7 days the microfilariae undergo 2 molts to reach the infective stage. The larvae remain in the dermis and subcutaneous tissue for 2 additional molts until they develop into adult worms. Then, adult worms may become encapsulated, eliciting and forming subcutaneous nodules, also known as onchocercomas.2,3
A fertilized female in the subcutaneous tissue releases microfilariae that may remain in the skin or travel to the eyes of the host.3 The host may demonstrate signs of infection within 3 to 15 months.2 Most commonly, patients report localized or generalized pruritus, and one extremity develops swelling, papules, lymphadenopathy, and alterations of skin pigment (hypopigmentation or hyperpigmentation).5-8 Our patient developed a pruritic eczematous eruption that only affected her right arm with an inflamed firm nodule overlying the elbow, a suspected onchocercoma. Onchocercomas are the direct result of adult worms coiled in the dermis, subcutaneous tissue, and deep fascia. These commonly are found in close proximity to bony prominences with the specific location pending the geographic area of infection.8 For example, onchocercomas more commonly are found over bony prominences in the head and upper body region in patients who acquired the disease from Central or South America, whereas individuals infected in Africa more commonly develop onchocercomas near the femoral, coccyx, or sacral regions.2
The immune response mounted by the infected host is responsible for the ocular signs and symptoms.2 Specifically, the inflammatory reaction may impact the patient’s cornea, anterior uveal tract, chorioretinal zone, or optic nerve. In fact, onchocerciasis, or river blindness, is the leading cause of blindness in the world.2 The host immune response also is responsible for the dermatologic manifestations of this disease. In addition to the dermatologic manifestations already mentioned, others include epidermal atrophy, ulcerations, femoral or inguinal lymphadenitis, lymphedema, and/or general wasting in more severe long-standing infections. Additionally, patients may experience systemic signs resulting from an underlying O volvulus infection.8 Our patient demonstrated a subjectively remarkable systemic response manifested by shortness of breath, dyspnea, cough, and palpitations, likely the result of her existing filarial infection.
Diagnosis of onchocerciasis is made by identification of microfilariae or adult worms in skin snips or punch biopsies. Histopathologic analysis of onchocerciasis has been described as several adult worms in the subcutaneous tissue surrounded by a granulomatous, fibrotic, calcified, or sometimes ossified inflammatory reaction.8 Microfilariae may migrate to the upper dermis and typically are surrounded by lymphocytes, histiocytes, plasma cells, and eosinophils with an absence of neutrophils,5,8 which directly causes the overlying epidermis to undergo reactive changes. Measurement of filarial nematodes often helps differentiate species. For example, O volvulus typically measures 230 to 500 mm in length for females and 16 to 42 mm in length for males.8 The thickness of cuticles typically measures 4 to 8 µm for females and 3 to 5 µm for males. Microfilariae of O volvulus also have been identified in patient’s sputum, urine, blood, and spinal fluid.8 An alternative diagnostic method described by Stingl et al9 is a diethylcarbamazine (DEC) patch test that was 92% accurate in onchocerciasis cases diagnosed by skin snip analysis.9 Therefore, this test may be a practical alternative when skin specimens are inconclusive.
Management of onchocerciasis should include excision of subcutaneous nodules to remove adult worms. In the past, DEC with suramin was prescribed and kills both microfilariae and adult worms.8 However, DEC may induce pruritus, chorioretinal damage, and optic neuritis and suramin is nephrotoxic.2 Therefore, oral ivermectin (0.15–0.20 mg/kg one-time dose, may be repeated in 3–12 months) is supported to be a less harmful option. Patients treated with ivermectin have a decreased risk for transmitting infection to the blackfly vector for up to 6 months after treatment, and it is a more effective microfilaricidal agent than DEC.2,3 Oral doxycycline (100 mg/d for 6 weeks) commonly is added as adjuvant therapy because it kills Wolbachia species, a bacterium that is needed for O volvulus reproduction.3
Although rare in the United States, cutaneous filariasis has become a prevalent public health concern, especially in tropical countries. Individuals with chronic cutaneous filarial infections are at increased risk for debilitating complications that negatively affect their quality of life and productivity. Although the World Health Organization has attempted to eradicate cutaneous filarial infections by mass drug administration, transmission of these diseases remains a challenge. Further research on treatment and methods to prevent transmission by controlling arthropod vectors is required to avoid short-term and long-term health consequences caused by cutaneous filariasis.
Parasitic infections should always be a diagnostic consideration in individuals who present with a pruritic eruption and a history of travel to foreign countries located in Africa, Central America, and South America. Dermatologists in the United States should increase familiarity with these infections because of increased travel, economic globalization, and the impact of global climate change on the geographic distribution of vector arthropods. To control these infections, research efforts should focus on improved sanitation; drug treatment; transmission prevention; and improved education of their clinical manifestations, especially mucocutaneous signs.
- Mendoza N, Li A, Gill A, et al. Filariasis: diagnosis and treatment. Dermatol Ther. 2009;22:475-490.
- Maso MJ, Kapila R, Schwartz RA, et al. Cutaneous onchocerciasis. Int J Dermatol. 1987;26:593-596.
- Lupi O, Downing C, Lee M, et al. Mucocutaneous manifestations of helminth infections. J Am Acad Dermatol. 2015;73:929-944.
- Bolivar-Meija A, Alarcon-Olave C, Rodriguez-Morales AJ. Skin manifestations of arthropod-borne infection in Latin America. Curr Opin. 2014;27:288-294.
- Okulicz JF, Stibich AS, Elston DM, et al. Cutaneous onchocercoma. Int J Dermatol. 2004;43:170-172.
- Nguyen JC, Murphy ME, Nutman TB, et al. Cutaneous onchocerciasis in an American traveler. Int Soc Dermatol. 2005;44:125-128.
- Toovey S, Moerman F, van Gompel A. Special infectious disease risks of expatriates and long-term travelers in tropical countries part II: infections other than malaria. J Travel Med. 2007;14:50-60.
- Meyers WM, Neafie RC, Connor DH. Bancroftian and malayan filariasis. In Binford CH, ed. Pathology of Tropical and Extraordinary Diseases. Vol 2. Fort Sam Houston, TX: Armed Forces Institute of Pathology; 1976:340-355.
- Stingl P, Ross M, Gibson DW, et al. A diagnostic “patch-test” for onchocerciasis using topical diethylcarbamazine. Trans R Soc Trop Med Hyg.
To the Editor:
Cutaneous filariasis is a group of infectious diseases caused by more than 60 different nematode species and endemic to approximately 83 countries.1,2 These infections are transmitted to humans by vectors such as mosquitoes, blackflies, biting midges, or Tabanid flies.1 The blood meal taken by vectors allow microfilariae to enter the skin and develop into adult worms.1-3 It is postulated that filarial infections were first described in 2000
Filarial parasites have been categorized into groups based on the site of adult worm stage habitat. The cutaneous group includes Loa loa, Onchocerca volvulus, Mansonella perstans, and Dipetalonema streptocerca. The lymphatic group includes Wuchereria bancrofti, Brugia malayi, and Brugia timori. Lastly, the body cavity group includes Mansonella ozzardi. Because humidity is required for survival of the infective larval stage, individuals from tropical countries in Africa, Central America, and South America most commonly are affected.1 These diseases also are related to poor housing quality and inadequate sanitation.1,3,4 Travel for business, medical missions, pleasure, or emigration has caused increased filarial infections globally. In fact, dermatologic disorders with infectious etiologies cause approximately 17% of travelers to seek medical attention.3
Dermatologic manifestations indicative of a potential cutaneous filarial infection include papules, nodules, excoriations with secondary xerosis, lichenification, skin pigment changes, and/or severe pruritus. However, individuals from filarial endemic regions may not demonstrate any clinical signs or symptoms, despite having microfilariae in their blood,1 which enables the disease to propagate and poses a major public health concern. In fact, patients with chronic filarial infections are at increased risk for developing lymphedema, elephantiasis, or blindness, which are hypothesized to be the second largest cause of permanent disability worldwide.1 Although rarely seen in US citizens, cutaneous filariasis should always be a diagnostic consideration in patients who present with a pruritic eruption and have a travel history to tropical countries. We report a case of cutaneous onchocerciasis in a US citizen who developed a pruritic eczematous eruption on the right upper arm following an arthropod assault while working in an Onchocerca endemic region approximately 1.5 years prior.
A 33-year-old woman presented to our outpatient dermatology clinic with the chief concern of a pruritic rash on the right arm (Figure 1). She revealed a history of travel to Peru, associated symptoms, prior diagnoses, and attempted treatment regimens. Over a 1.5-year period, the patient traveled for work-related reasons to Madre de Dios, Peru. During that time, the patient experienced 2 bouts of severe abdominal pain, nausea, and vomiting that she attributed to poor food and water quality. She did not immediately seek medical attention. She also developed skin manifestations that began as a pruritic and irritating pinpoint-sized red papule on the right eyelid, possibly a site of an arthropod assault. She then experienced episodic eyelash loss (Figure 2) and subsequent vision changes, including blurry vision, halos around lights, and dimming around the periphery. When the patient developed circular, pink, pruritic plaques on the right upper extremity, she sought medical attention in Lima, Peru. She was diagnosed with tinea corporis and prescribed an oral antibiotic and topical antifungal.
This treatment regimen did not result in improvement. In the following months, the patient noticed worsening of the ocular symptoms, and she developed a dry cough with occasional dyspnea. She again sought medical attention in Peru and was referred to an ophthalmologist who suspected Demodex mite or fungal infection; however, workup for those pathologies was negative. The respiratory symptoms continued to worsen, particularly at night, and she began to experience palpitations.
Upon returning to the United States, the patient was evaluated by her primary care physician who ordered the following laboratory tests: a complete blood cell count with differential, comprehensive metabolic panel, vitamin D level, blood culture, lipid panel, ferritin level, and thyroid function. An electrocardiogram, throat culture, and stool culture for ova and parasites also were obtained. The electrocardiogram showed sinus tachycardia, and the stool culture revealed blastocystis, for which she was prescribed oral metronidazole and tinidazole. The other results were within reference range, and the throat culture showed normal oropharyngeal microbes.
A few days after the treatment for the blastocystis, the gastrointestinal tract symptoms improved, but dermatologic, ocular, pulmonary, and cardiac symptoms persisted. She also began experiencing night sweats and hot flashes. In between visits to the primary care physician, she sought medical attention at an urgent care clinic for worsening pulmonary and cardiac symptoms. At that time, results of a chest radiograph were normal.
The primary care physician referred her to infectious disease and dermatology for further evaluation within a few weeks of returning to the United States. Upon presentation to dermatology, the patient described a waxing and waning nature to the rash on the arm with associated intermittent pain. Physical examination revealed several erythematous patches on the triceps and a 1-cm subcutaneous nodule on the right elbow with overlying skin discoloration. The patient stated that she first noticed the inflamed painful nodule when she returned to the United States. Since its discovery, the nodule increased in size and became firm. The patient also described occasional limited range of motion of the right arm due to the discomfort of the rash and inflamed nodule. Interestingly, the patient’s partner who accompanied her to Peru also developed a similar pruritic rash on the chest. He was evaluated by dermatology and infectious disease; however, biopsies of his rash performed at a different practice revealed nonspecific results. Due to her partner’s inconclusive results, our patient initially refused a biopsy; however, she returned to the office after 1 week with worsening symptoms, and a 4-mm punch biopsy of the right arm was obtained in addition to rapid plasma reagin and QuantiFERON-TB Gold test.
Based on the patient’s travel history, clinical course, and physical examination, the clinical differential diagnosis included nummular dermatitis, panniculitis/nodular vasculitis, tinea corporis, secondary syphilis, pinta, tuberculosis, or cutaneous filariasis. Rapid plasma reagin and QuantiFERON-TB Gold test results were negative, and a periodic acid–Schiff stain of the biopsy was negative for fungal elements. Dermatopathology revealed intradermal filarial nematodes of 120 to 150 µm in diameter and 1-to 2-mm cuticles eliciting a predominantly superficial and deep lymphohistiocytic reaction (Figure 3). The histopathologic differential diagnosis based on the diameter of the nematode included M perstans, W bancrofti, and O volvulus. Clinical correlation was highly recommended to obtain a final diagnosis and management plan. A portion of the biopsy was sent to the Centers for Disease Control and Prevention, which confirmed the presence of a filarial nematode consistent with a zoonotic Brugia but also with zoonotic Onchocerca as a possible differential. Therefore, considering the history, clinical course, and histopathologic analysis, the final diagnosis of cutaneous onchocerciasis was made.
The patient was referred back to infectious disease and started on combination therapy of ivermectin (25.5 mg) plus albendazole (800 mg) taken at once followed by doxycycline (200 mg) for 6 weeks. The symptoms initially worsened, then she experienced near-complete resolution of dermatologic, pulmonary, and ocular symptoms after approximately 2 weeks of treatment. She continued to report fatigue and palpitations, for she continued to see a cardiologist. We highly encouraged her to continue following up with infectious disease to ensure complete eradication of the infection.
Onchocerciasis is common in individuals who live or work in equatorial Africa, Central America, and South America. The disease process has dermatologic, ocular, and other systemic manifestations if the infection continues long-term without treatment.2,5 Although rare, this infection has been observed in US citizens who have traveled to filarial endemic regions for a period of time ranging from 2 weeks to 39 years.2,6,7
Blackflies (genus Simulium), the intermediate host of O volvulus, breed in areas close to freely flowing water. The blackfly bites a human host, and within 7 days the microfilariae undergo 2 molts to reach the infective stage. The larvae remain in the dermis and subcutaneous tissue for 2 additional molts until they develop into adult worms. Then, adult worms may become encapsulated, eliciting and forming subcutaneous nodules, also known as onchocercomas.2,3
A fertilized female in the subcutaneous tissue releases microfilariae that may remain in the skin or travel to the eyes of the host.3 The host may demonstrate signs of infection within 3 to 15 months.2 Most commonly, patients report localized or generalized pruritus, and one extremity develops swelling, papules, lymphadenopathy, and alterations of skin pigment (hypopigmentation or hyperpigmentation).5-8 Our patient developed a pruritic eczematous eruption that only affected her right arm with an inflamed firm nodule overlying the elbow, a suspected onchocercoma. Onchocercomas are the direct result of adult worms coiled in the dermis, subcutaneous tissue, and deep fascia. These commonly are found in close proximity to bony prominences with the specific location pending the geographic area of infection.8 For example, onchocercomas more commonly are found over bony prominences in the head and upper body region in patients who acquired the disease from Central or South America, whereas individuals infected in Africa more commonly develop onchocercomas near the femoral, coccyx, or sacral regions.2
The immune response mounted by the infected host is responsible for the ocular signs and symptoms.2 Specifically, the inflammatory reaction may impact the patient’s cornea, anterior uveal tract, chorioretinal zone, or optic nerve. In fact, onchocerciasis, or river blindness, is the leading cause of blindness in the world.2 The host immune response also is responsible for the dermatologic manifestations of this disease. In addition to the dermatologic manifestations already mentioned, others include epidermal atrophy, ulcerations, femoral or inguinal lymphadenitis, lymphedema, and/or general wasting in more severe long-standing infections. Additionally, patients may experience systemic signs resulting from an underlying O volvulus infection.8 Our patient demonstrated a subjectively remarkable systemic response manifested by shortness of breath, dyspnea, cough, and palpitations, likely the result of her existing filarial infection.
Diagnosis of onchocerciasis is made by identification of microfilariae or adult worms in skin snips or punch biopsies. Histopathologic analysis of onchocerciasis has been described as several adult worms in the subcutaneous tissue surrounded by a granulomatous, fibrotic, calcified, or sometimes ossified inflammatory reaction.8 Microfilariae may migrate to the upper dermis and typically are surrounded by lymphocytes, histiocytes, plasma cells, and eosinophils with an absence of neutrophils,5,8 which directly causes the overlying epidermis to undergo reactive changes. Measurement of filarial nematodes often helps differentiate species. For example, O volvulus typically measures 230 to 500 mm in length for females and 16 to 42 mm in length for males.8 The thickness of cuticles typically measures 4 to 8 µm for females and 3 to 5 µm for males. Microfilariae of O volvulus also have been identified in patient’s sputum, urine, blood, and spinal fluid.8 An alternative diagnostic method described by Stingl et al9 is a diethylcarbamazine (DEC) patch test that was 92% accurate in onchocerciasis cases diagnosed by skin snip analysis.9 Therefore, this test may be a practical alternative when skin specimens are inconclusive.
Management of onchocerciasis should include excision of subcutaneous nodules to remove adult worms. In the past, DEC with suramin was prescribed and kills both microfilariae and adult worms.8 However, DEC may induce pruritus, chorioretinal damage, and optic neuritis and suramin is nephrotoxic.2 Therefore, oral ivermectin (0.15–0.20 mg/kg one-time dose, may be repeated in 3–12 months) is supported to be a less harmful option. Patients treated with ivermectin have a decreased risk for transmitting infection to the blackfly vector for up to 6 months after treatment, and it is a more effective microfilaricidal agent than DEC.2,3 Oral doxycycline (100 mg/d for 6 weeks) commonly is added as adjuvant therapy because it kills Wolbachia species, a bacterium that is needed for O volvulus reproduction.3
Although rare in the United States, cutaneous filariasis has become a prevalent public health concern, especially in tropical countries. Individuals with chronic cutaneous filarial infections are at increased risk for debilitating complications that negatively affect their quality of life and productivity. Although the World Health Organization has attempted to eradicate cutaneous filarial infections by mass drug administration, transmission of these diseases remains a challenge. Further research on treatment and methods to prevent transmission by controlling arthropod vectors is required to avoid short-term and long-term health consequences caused by cutaneous filariasis.
Parasitic infections should always be a diagnostic consideration in individuals who present with a pruritic eruption and a history of travel to foreign countries located in Africa, Central America, and South America. Dermatologists in the United States should increase familiarity with these infections because of increased travel, economic globalization, and the impact of global climate change on the geographic distribution of vector arthropods. To control these infections, research efforts should focus on improved sanitation; drug treatment; transmission prevention; and improved education of their clinical manifestations, especially mucocutaneous signs.
- Mendoza N, Li A, Gill A, et al. Filariasis: diagnosis and treatment. Dermatol Ther. 2009;22:475-490.
- Maso MJ, Kapila R, Schwartz RA, et al. Cutaneous onchocerciasis. Int J Dermatol. 1987;26:593-596.
- Lupi O, Downing C, Lee M, et al. Mucocutaneous manifestations of helminth infections. J Am Acad Dermatol. 2015;73:929-944.
- Bolivar-Meija A, Alarcon-Olave C, Rodriguez-Morales AJ. Skin manifestations of arthropod-borne infection in Latin America. Curr Opin. 2014;27:288-294.
- Okulicz JF, Stibich AS, Elston DM, et al. Cutaneous onchocercoma. Int J Dermatol. 2004;43:170-172.
- Nguyen JC, Murphy ME, Nutman TB, et al. Cutaneous onchocerciasis in an American traveler. Int Soc Dermatol. 2005;44:125-128.
- Toovey S, Moerman F, van Gompel A. Special infectious disease risks of expatriates and long-term travelers in tropical countries part II: infections other than malaria. J Travel Med. 2007;14:50-60.
- Meyers WM, Neafie RC, Connor DH. Bancroftian and malayan filariasis. In Binford CH, ed. Pathology of Tropical and Extraordinary Diseases. Vol 2. Fort Sam Houston, TX: Armed Forces Institute of Pathology; 1976:340-355.
- Stingl P, Ross M, Gibson DW, et al. A diagnostic “patch-test” for onchocerciasis using topical diethylcarbamazine. Trans R Soc Trop Med Hyg.
Practice Points
- Parasitic infections should always be a diagnostic consideration in individuals who present with a pruritic eruption and a history of travel.
- To control parasitic infections, research efforts should focus on improved sanitation, drug treatment, transmission prevention, and improved education of clinical manifestations to increase early detection.
The Dermatologist Nose Best: Correlation of Nose-Picking Habits and <i>Staphylococcus aureus</i>–Related Dermatologic Disease
Primitive human habits have withstood the test of time but can pose health risks. Exploring a nasal cavity with a finger might have first occurred shortly after whichever species first developed a nasal opening and a digit able to reach it. Humans have been keen on continuing the long-standing yet taboo habit of nose-picking (rhinotillexis).
Even though nose-picking is stigmatized, anonymous surveys show that almost all adolescents and adults do it.1 People are typically unaware of the risks of regular rhinotillexis. Studies exploring the intranasal human microbiome have elicited asymptomatic yet potential disease-causing microbes, including the notorious bacterium Staphylococcus aureus. As many as 30% of humans are asymptomatically permanently colonized with S aureus in their anterior nares.2 These natural reservoirs can be the source of opportunistic infection that increases morbidity, mortality, and overall health care costs.
With the rise of antimicrobial resistance, especially methicillin-resistant S aureus (MRSA), a more direct approach might be necessary to curb nasally sourced cutaneous infection. Since dermatology patients deal with a wide array of skin barrier defects that put them at risk for S aureus–related infection, a medical provider’s understanding about the role of nasal colonization and transmission is important. Addressing the awkward question of “Do you pick your nose?” and providing education on the topic might be uncomfortable, but it might be necessary for dermatology patients at risk for S aureus–related cutaneous disease.
Staphylococcus aureus colonizes the anterior nares of 20% to 80% of humans; nasal colonization can begin during the first days of life.2 The anterior nares are noted as the main reservoir of chronic carriage of S aureus, but carriage can occur at various body sites, including the rectum, vagina, gastrointestinal tract, and axilla, as well as other cutaneous sites. Hands are noted as the main vector of S aureus transmission from source to nose; a positive correlation between nose-picking habits and nasal carriage of S aureus has been noted.2
The percentage of S aureus–colonized humans who harbor MRSA is unknown, but it is a topic of concern with the rise of MRSA-related infection. Multisite MRSA carriage increases the risk for nasal MRSA colonization, and nasal MRSA has been noted to be more difficult to decolonize than nonresistant strains. Health care workers carrying S aureus can trigger a potential hospital outbreak of MRSA. Studies have shown that bacterial transmission is increased 40-fold when the nasal host is co-infected by rhinovirus.2 Health care workers can be a source of MRSA during outbreaks, but they have not been shown to be more likely to carry MRSA than the general population.2 Understanding which patients might be at risk for S aureus–associated disease in dermatology can lead clinicians to consider decolonization strategies.
Nasal colonization has been noted more frequently in patients with predisposing risk factors, including human immunodeficiency virus infection, obesity, diabetes mellitus, granulomatosis with polyangiitis, HLA-DR3 phenotype, skin and soft-tissue infections, atopic dermatitis, impetigo, and recurrent furunculosis.2Staphylococcus aureus is the most frequently noted pathogen in diabetic foot infection. A study found that 36% of sampled diabetic foot-infection patients also had S aureus isolated from both nares and the foot wound, with 65% of isolated strains being identical.2 Although there are clear data on decolonization of patients prior to heart and orthopedic surgery, more data are needed to determine the benefit of screening and treating nasal carriers in populations with diabetic foot ulcers.
Staphylococcus aureus nasal colonization also has been shown in approximately 60% of patients with recurrent furunculosis and impetigo.2 Although it is clear that there is a correlation between S aureus–related skin infection and nasal colonization, it is unclear what role nose-picking might have in perpetuating these complications.
There are multiple approaches to S aureus decolonization, including intranasal mupirocin, chlorhexidine body wipes, bleach baths, and even oral antibiotics (eg, trimethoprim-sulfamethoxazole, clindamycin). The Infectious Diseases Society of America has published guidelines for treating recurrent MRSA infection, including 5 to 10 days of intranasal mupirocin plus either body decolonization with a daily chlorhexidine wash for 5 to 14 days or a 15-minute dilute bleach bath twice weekly for 3 months.3,4
There are ample meta-analyses and systematic reviews regarding S aureus decolonization and management in patients undergoing dialysis or surgery but limited data when it comes to this topic in dermatology. Those limited studies do show a benefit to decolonization in several diseases, including atopic dermatitis, hand dermatitis, recurrent skin and soft-tissue infections, cutaneous T-cell lymphoma, and surgical infection following Mohs micrographic surgery.4 Typically, it also is necessary to treat those who might come in contact with the patient or caregiver; in theory, treating contacts helps reduce the chance that the patient will become recolonized shortly afterward, but the data are limited regarding long-term colonization status following treatment. Contact surfaces, especially cell phones, are noted to be a contributing factor to nares colonization; therefore, it also may be necessary to educate patients on surface-cleaning techniques.5 Because there are multiple sources of S aureus that patients can come in contact with after decolonization attempts, a nose-picking habit might play a vital role in recolonization.
Due to rising bacterial resistance to mupirocin and chlorhexidine decolonization strategies, there is a growing need for more effective, long-term decolonization strategies.4 These strategies must address patients’ environmental exposure and nasal-touching habits. Overcoming the habit of nose-picking might aid S aureus decolonization strategies and thus aid in preventing future antimicrobial resistance.
But are at-risk patients receiving sufficient screening and education on the dangers of a nose-picking habit? Effective strategies to assess these practices and recommend the discontinuation of the habit could have positive effects in maintaining long-term decolonization. Potential euphemistic ways to approach this somewhat taboo topic include questions that elicit information on whether the patient ever touches the inside of his/her nose, washes his/her hands before and after touching the inside of the nose, knows about transfer of bacteria from hand to nose, or understands what decolonization is doing for them. The patient might be inclined to deny such activity, but education on nasal hygiene should be provided regardless, especially in pediatric patients.
Staphylococcus aureus might be a normal human nasal inhabitant, but it can cause a range of problems for dermatologic disease. Although pharmacotherapeutic decolonization strategies can have a positive effect on dermatologic disease, growing antibiotic resistance calls for health care providers to assess patients’ nose picking-habits and educate them on effective ways to prevent finger-to-nose practices.
- Andrade C, Srihari BS. A preliminary survey of rhinotillexomania in an adolescent sample. J Clin Psychiatry. 2001;62:426-431.
- Sakr A, Brégeon F, Mège J-L, et al. Staphylococcus aureus nasal colonization: an update on mechanisms, epidemiology, risk factors, and subsequent infections. Front Microbiol. 2018;9:2419.
- Liu C, Bayer A, Cosgrove SE, et al. Clinical practice guidelines by the Infectious Diseases Society of America for the treatment of methicillin-resistant Staphylococcus aureus infections in adults and children: executive summary. Clin Infect Dis. 2011;52:285-292.
- Kuraitis D, Williams L. Decolonization of Staphylococcus aureus in healthcare: a dermatology perspective. J Healthc Eng. 2018;2018:2382050.
- Creech CB, Al-Zubeidi DN, Fritz SA. Prevention of recurrent staphylococcal kin infections. Infect Dis Clin North Am. 2015;29:429-464.
Primitive human habits have withstood the test of time but can pose health risks. Exploring a nasal cavity with a finger might have first occurred shortly after whichever species first developed a nasal opening and a digit able to reach it. Humans have been keen on continuing the long-standing yet taboo habit of nose-picking (rhinotillexis).
Even though nose-picking is stigmatized, anonymous surveys show that almost all adolescents and adults do it.1 People are typically unaware of the risks of regular rhinotillexis. Studies exploring the intranasal human microbiome have elicited asymptomatic yet potential disease-causing microbes, including the notorious bacterium Staphylococcus aureus. As many as 30% of humans are asymptomatically permanently colonized with S aureus in their anterior nares.2 These natural reservoirs can be the source of opportunistic infection that increases morbidity, mortality, and overall health care costs.
With the rise of antimicrobial resistance, especially methicillin-resistant S aureus (MRSA), a more direct approach might be necessary to curb nasally sourced cutaneous infection. Since dermatology patients deal with a wide array of skin barrier defects that put them at risk for S aureus–related infection, a medical provider’s understanding about the role of nasal colonization and transmission is important. Addressing the awkward question of “Do you pick your nose?” and providing education on the topic might be uncomfortable, but it might be necessary for dermatology patients at risk for S aureus–related cutaneous disease.
Staphylococcus aureus colonizes the anterior nares of 20% to 80% of humans; nasal colonization can begin during the first days of life.2 The anterior nares are noted as the main reservoir of chronic carriage of S aureus, but carriage can occur at various body sites, including the rectum, vagina, gastrointestinal tract, and axilla, as well as other cutaneous sites. Hands are noted as the main vector of S aureus transmission from source to nose; a positive correlation between nose-picking habits and nasal carriage of S aureus has been noted.2
The percentage of S aureus–colonized humans who harbor MRSA is unknown, but it is a topic of concern with the rise of MRSA-related infection. Multisite MRSA carriage increases the risk for nasal MRSA colonization, and nasal MRSA has been noted to be more difficult to decolonize than nonresistant strains. Health care workers carrying S aureus can trigger a potential hospital outbreak of MRSA. Studies have shown that bacterial transmission is increased 40-fold when the nasal host is co-infected by rhinovirus.2 Health care workers can be a source of MRSA during outbreaks, but they have not been shown to be more likely to carry MRSA than the general population.2 Understanding which patients might be at risk for S aureus–associated disease in dermatology can lead clinicians to consider decolonization strategies.
Nasal colonization has been noted more frequently in patients with predisposing risk factors, including human immunodeficiency virus infection, obesity, diabetes mellitus, granulomatosis with polyangiitis, HLA-DR3 phenotype, skin and soft-tissue infections, atopic dermatitis, impetigo, and recurrent furunculosis.2Staphylococcus aureus is the most frequently noted pathogen in diabetic foot infection. A study found that 36% of sampled diabetic foot-infection patients also had S aureus isolated from both nares and the foot wound, with 65% of isolated strains being identical.2 Although there are clear data on decolonization of patients prior to heart and orthopedic surgery, more data are needed to determine the benefit of screening and treating nasal carriers in populations with diabetic foot ulcers.
Staphylococcus aureus nasal colonization also has been shown in approximately 60% of patients with recurrent furunculosis and impetigo.2 Although it is clear that there is a correlation between S aureus–related skin infection and nasal colonization, it is unclear what role nose-picking might have in perpetuating these complications.
There are multiple approaches to S aureus decolonization, including intranasal mupirocin, chlorhexidine body wipes, bleach baths, and even oral antibiotics (eg, trimethoprim-sulfamethoxazole, clindamycin). The Infectious Diseases Society of America has published guidelines for treating recurrent MRSA infection, including 5 to 10 days of intranasal mupirocin plus either body decolonization with a daily chlorhexidine wash for 5 to 14 days or a 15-minute dilute bleach bath twice weekly for 3 months.3,4
There are ample meta-analyses and systematic reviews regarding S aureus decolonization and management in patients undergoing dialysis or surgery but limited data when it comes to this topic in dermatology. Those limited studies do show a benefit to decolonization in several diseases, including atopic dermatitis, hand dermatitis, recurrent skin and soft-tissue infections, cutaneous T-cell lymphoma, and surgical infection following Mohs micrographic surgery.4 Typically, it also is necessary to treat those who might come in contact with the patient or caregiver; in theory, treating contacts helps reduce the chance that the patient will become recolonized shortly afterward, but the data are limited regarding long-term colonization status following treatment. Contact surfaces, especially cell phones, are noted to be a contributing factor to nares colonization; therefore, it also may be necessary to educate patients on surface-cleaning techniques.5 Because there are multiple sources of S aureus that patients can come in contact with after decolonization attempts, a nose-picking habit might play a vital role in recolonization.
Due to rising bacterial resistance to mupirocin and chlorhexidine decolonization strategies, there is a growing need for more effective, long-term decolonization strategies.4 These strategies must address patients’ environmental exposure and nasal-touching habits. Overcoming the habit of nose-picking might aid S aureus decolonization strategies and thus aid in preventing future antimicrobial resistance.
But are at-risk patients receiving sufficient screening and education on the dangers of a nose-picking habit? Effective strategies to assess these practices and recommend the discontinuation of the habit could have positive effects in maintaining long-term decolonization. Potential euphemistic ways to approach this somewhat taboo topic include questions that elicit information on whether the patient ever touches the inside of his/her nose, washes his/her hands before and after touching the inside of the nose, knows about transfer of bacteria from hand to nose, or understands what decolonization is doing for them. The patient might be inclined to deny such activity, but education on nasal hygiene should be provided regardless, especially in pediatric patients.
Staphylococcus aureus might be a normal human nasal inhabitant, but it can cause a range of problems for dermatologic disease. Although pharmacotherapeutic decolonization strategies can have a positive effect on dermatologic disease, growing antibiotic resistance calls for health care providers to assess patients’ nose picking-habits and educate them on effective ways to prevent finger-to-nose practices.
- Andrade C, Srihari BS. A preliminary survey of rhinotillexomania in an adolescent sample. J Clin Psychiatry. 2001;62:426-431.
- Sakr A, Brégeon F, Mège J-L, et al. Staphylococcus aureus nasal colonization: an update on mechanisms, epidemiology, risk factors, and subsequent infections. Front Microbiol. 2018;9:2419.
- Liu C, Bayer A, Cosgrove SE, et al. Clinical practice guidelines by the Infectious Diseases Society of America for the treatment of methicillin-resistant Staphylococcus aureus infections in adults and children: executive summary. Clin Infect Dis. 2011;52:285-292.
- Kuraitis D, Williams L. Decolonization of Staphylococcus aureus in healthcare: a dermatology perspective. J Healthc Eng. 2018;2018:2382050.
- Creech CB, Al-Zubeidi DN, Fritz SA. Prevention of recurrent staphylococcal kin infections. Infect Dis Clin North Am. 2015;29:429-464.
Practice Points
- Staphylococcus aureus colonizes the anterior nares of approximately 20% to 80% of humans and can play a large factor in dermatologic disease.
- Staphylococcus aureus decolonization practices for at-risk dermatology patients may overlook the role that nose-picking plays.
Shared decision-making aids choice of PrEP
A patient-centered approach can help guide persons at risk for HIV exposure to decide on the best choice of pre-exposure prophylaxis (PrEP) regimens for them, stifling the noise generated by direct-to-consumer advertising, an infectious disease specialist recommends.
The decision for patients whether to start or remain on the PrEP combination of tenofovir disoproxil fumarate (TDF) plus emtricitabine (FTC; Truvada and generic) or on tenofovir alafenamide (TAF) plus FTC (Descovy) is made more fraught by confusion regarding the use of the newer and allegedly safer TAF prodrug of tenofovir in HIV treatment regimens, said Oni Blackstock, MD, founder and executive director of Health Justice and an attending physician in the division of infectious diseases at Harlem Hospital, New York.
“There have been commercials on TV as well as on social media around class-action lawsuits against [Truvada maker] Gilead,” she said in an online presentation during IDWeek 2020, an annual scientific meeting on infectious diseases, held virtually this year.
“These lawsuits focus on TDF for HIV treatment, but they have sown a great deal of confusion about TDF versus TAF for PrEP among potential and actual PrEP users,” she added.
Dr. Blackstock described her approach to shared decision-making regarding TDF/FTC versus TAF/FTC, and to helping patients understand the relative benefits and risks of each formulation.
In January of 2020, Dr. Blackstock, who was then assistant commissioner of the HIV bureau of the New York City Department of Health and Mental Hygiene, issued with other Bureau members a “Dear colleague” letter stating why they believed that TDF/FTC should remain the first-line regimen for PrEP.
That opinion, she said, was bolstered by an editorial published in February 2020 by Douglas E. Krakower, MD, from Beth Israel Deaconess Medical Center in Boston, and colleagues, which questioned the rush to shift from TDF to TAF in HIV treatment, and cautioned against the same approach to PrEP.
“Despite evidence that TAF/FTC would not be cost-effective, compared with generic TDF/FTC , the newer regimen quickly and irrevocably displaced TDF/FTC for HIV treatment in the U.S. A similar shift for PrEP – especially for populations in which TAF/FTC is untested – would be premature, costly, and counterproductive for population impact,” Krakower et al. wrote.
Shared decision-making
Clinicians can help patients who may be a candidate for either PrEP regimen by engaging them in shared decision-making.
“The clinician provides information in this case about a prevention strategy, options, benefits and risks, alternatives, and the patient provides their preferences and values, and together the clinician and patient make a decision,” Dr. Blackstock said.
The process differs from the model of informed decision-making, where the clinician gives the patient the information and the patient comes to a decision, or the old, “paternalistic” model in which the clinician gives information and makes recommendations to the patient.
“Shared decision-making has been studied extensively and has been shown to improve patient satisfaction, patient communication, and also potentially reducing health inequities that we see,” she said.
The model for shared decision-making for clinical practice includes three distinct portions: a choice talk, option talk, and decision talk.
Choice
To begin the discussion, the physician informs the patients of the availability of choices and justifies them, saying, for example, “there is good information about how these two PrEP options differ that I’d like to discuss with you,” and “the two PrEP options have different side effects … some will matter more to you than other people.”
At this stage the clinician should defer closure by offering a more detailed discussion of the choices.
Option
Here the clinician solicits information about what the patient has heard or read about PrEP, describes each option in practical terms, and points out where the two regimens differ, being specific about the pros and cons of each (for example, potential bone mineral density loss or renal complications with TDF, and potential weight gain with subsequent metabolic and cardiovascular consequences with TAF).
The TDF versus TAF-based PrEP discussion could also focus on what’s known about the comparative effectiveness of each regimen.
For example, TDF/FTC has been shown to be about 99% effective at preventing infection in men who have sex with men and in transgender women, also about 99% effective in heterosexual women and men, and 74%-84% effective in persons who inject drugs.
In contrast, TAF/FTC has been shown to be about 99% effective in men who have sex with men and transgender women, but it’s efficacy in the other two categories is unknown, Dr. Blackstock said.
The option discussion should include a comparison of the evidence base for each regimen, including the real-world experience with TDF/FTC since 2012, and much more limited experience with TAF/FTC.
Discussing relative costs, although the wholesale costs of the regimens are similar, there is now a generic version of TDF/FTC made by Teva Pharmaceuticals that sells for about $400 less per month than the brand name, which might make the option more acceptable to health insurers.
Decision
The decision talk is about considering the patients preferences and deciding with them what is best.
The clinician could say, for example: “What, from your point of view, matters most to you?”
The clinician should also be willing to allow the patient to defer a decision or to guide them depending on their stated wish, asking something like: “Are you ready to decide, or do you want more time? Do you have more questions? Are there more things we should discuss?
Offering the patient a chance to review the decision can also be a good way to arrive at closure, Dr. Blackstock said.
Robert Goldstein, MD, PhD, an infectious disease specialist and medical director of the transgender health program at Massachusetts General Hospital in Boston, who comoderated the session where Dr. Blackstock presented her talk, said that he also uses a similar approach to the PrEP discussion.
“I use a very patient-centered approach of providing information and talking through the data that are available,” he said.
“I will say that, as patients come to me talking about the transition from TDF to TAF for pre-exposure prophylaxis, I am very clear with them about the limited benefit or no benefit that I see with TAF for pre-exposure prophylaxis, and all of my patients have remained on TDF for pre-exposure prophylaxis,” he added.
No funding source for the presentation was reported. Dr. Blackstock and Dr. Goldstein reported having no conflicts of interest to disclose.
FROM IDWEEK 2020
Cerebral blood flow may predict children’s recovery from persistent postconcussion symptoms
, according to a study presented at the 2020 CNS-ICNA Conjoint Meeting, held virtually this year. Furthermore, cerebral blood flow at 4-6 weeks predicts recovery during the next 4 weeks in 77% of children.

“This is the first study to examine cerebral blood flow changes in children with persistent postconcussion symptoms,” said Karen Barlow, MBChB, associate professor of biomedical sciences at the University of Queensland in St. Lucia, Australia. “Our findings support the link between neurovascular unit dysfunction and persistent postconcussion symptoms in children, potentially because of injury or dysfunction in the GABAergic interneurons.”
Quantifying cerebral tissue perfusion
At least 25% of children with concussion have persistent postconcussion symptoms at 1 month post injury. Understanding the factors that influence the speed of recovery may help clarify the biology of postconcussion symptoms and suggest new treatments. In previous research, Dr. Barlow and colleagues found that children with early recovery (i.e., recovery by 4 weeks post injury) have decreases in cerebral blood flow, when compared with normal children. Children with persistent symptoms, however, have increases in cerebral blood flow. Dr. Barlow and colleagues conducted a new study to examine how cerebral blood flow changes in children with persistent postconcussion symptoms.
The investigators recruited participants through the randomized controlled Play Game trial, which examined melatonin as a treatment for persistent postconcussion symptoms. Among the exclusion criteria were history of assault, drug or alcohol use, significant past medical or psychiatric history, concussion within the previous 3 months, and use of psychoactive medications.
Children entered the study at 4-8 weeks after injury and received treatment for 4 weeks. Participants underwent 3-D pseudo-continuous arterial spin–labeled MRI before and after the treatment period (i.e., at 5 and 10 weeks post injury). This imaging technique provides a quantitative assessment of cerebral tissue perfusion. “You can do it without manipulating the cerebral circulation, making it particularly useful for research and in children,” said Dr. Barlow.
She and her colleagues evaluated recovery using the Post-Concussion Symptom Inventory. They defined good recovery as a total score at or below baseline at 10 weeks post injury. They considered any children who did not meet this criterion to have poor recovery.
Speed of blood-flow change varied
In all, 124 children were eligible for the study, and 76 had MRIs at both time points. Fourteen participants were excluded because of motion artifacts, slice truncation, and normalization failure. The population’s average age was approximately 14 years. About half of participants were males. The first MRI was performed at 37 days post injury, and the second MRI at around 70 days post injury. Twenty-three children had good recovery.
Children with poor recovery at 10 weeks had higher relative cerebral blood flow, compared with children with good recovery. Treatment group, age, and sex did not affect the changes in relative cerebral blood flow over time. Dr. Barlow and colleagues also measured mean total gray matter cerebral blood flow. Children with poor recovery had higher cerebral blood flow at 5 and 10 weeks post injury, compared with children with good recovery. In addition, cerebral blood flow changed more slowly in participants with poor recovery, compared with those with good recovery. Logistic regression analysis indicated that the mean absolute gray matter cerebral blood flow at 4-6 weeks post injury significantly predicted which children would recover by 10 weeks post injury, with an area under the receiver operating characteristic curve of 77%.
Funders for the study included Alberta Children’s Hospital, the Canadian Institutes of Health Research, and the University of Calgary. Dr. Barlow had no disclosures or conflicts of interest.
SOURCE: Barlow K et al. CNS-ICNA 2020. Abstract PL100.
, according to a study presented at the 2020 CNS-ICNA Conjoint Meeting, held virtually this year. Furthermore, cerebral blood flow at 4-6 weeks predicts recovery during the next 4 weeks in 77% of children.
“This is the first study to examine cerebral blood flow changes in children with persistent postconcussion symptoms,” said Karen Barlow, MBChB, associate professor of biomedical sciences at the University of Queensland in St. Lucia, Australia. “Our findings support the link between neurovascular unit dysfunction and persistent postconcussion symptoms in children, potentially because of injury or dysfunction in the GABAergic interneurons.”
Quantifying cerebral tissue perfusion
At least 25% of children with concussion have persistent postconcussion symptoms at 1 month post injury. Understanding the factors that influence the speed of recovery may help clarify the biology of postconcussion symptoms and suggest new treatments. In previous research, Dr. Barlow and colleagues found that children with early recovery (i.e., recovery by 4 weeks post injury) have decreases in cerebral blood flow, when compared with normal children. Children with persistent symptoms, however, have increases in cerebral blood flow. Dr. Barlow and colleagues conducted a new study to examine how cerebral blood flow changes in children with persistent postconcussion symptoms.
The investigators recruited participants through the randomized controlled Play Game trial, which examined melatonin as a treatment for persistent postconcussion symptoms. Among the exclusion criteria were history of assault, drug or alcohol use, significant past medical or psychiatric history, concussion within the previous 3 months, and use of psychoactive medications.
Children entered the study at 4-8 weeks after injury and received treatment for 4 weeks. Participants underwent 3-D pseudo-continuous arterial spin–labeled MRI before and after the treatment period (i.e., at 5 and 10 weeks post injury). This imaging technique provides a quantitative assessment of cerebral tissue perfusion. “You can do it without manipulating the cerebral circulation, making it particularly useful for research and in children,” said Dr. Barlow.
She and her colleagues evaluated recovery using the Post-Concussion Symptom Inventory. They defined good recovery as a total score at or below baseline at 10 weeks post injury. They considered any children who did not meet this criterion to have poor recovery.
Speed of blood-flow change varied
In all, 124 children were eligible for the study, and 76 had MRIs at both time points. Fourteen participants were excluded because of motion artifacts, slice truncation, and normalization failure. The population’s average age was approximately 14 years. About half of participants were males. The first MRI was performed at 37 days post injury, and the second MRI at around 70 days post injury. Twenty-three children had good recovery.
Children with poor recovery at 10 weeks had higher relative cerebral blood flow, compared with children with good recovery. Treatment group, age, and sex did not affect the changes in relative cerebral blood flow over time. Dr. Barlow and colleagues also measured mean total gray matter cerebral blood flow. Children with poor recovery had higher cerebral blood flow at 5 and 10 weeks post injury, compared with children with good recovery. In addition, cerebral blood flow changed more slowly in participants with poor recovery, compared with those with good recovery. Logistic regression analysis indicated that the mean absolute gray matter cerebral blood flow at 4-6 weeks post injury significantly predicted which children would recover by 10 weeks post injury, with an area under the receiver operating characteristic curve of 77%.
Funders for the study included Alberta Children’s Hospital, the Canadian Institutes of Health Research, and the University of Calgary. Dr. Barlow had no disclosures or conflicts of interest.
SOURCE: Barlow K et al. CNS-ICNA 2020. Abstract PL100.
FROM CNS-ICNA 2020
Unneeded meds at discharge could cause harm
A significant number of patients leave the hospital with inappropriate drugs because of a lack of medication reconciliation at discharge, new research shows.
Proton pump inhibitors – known to have adverse effects, such as fractures, osteoporosis, and progressive kidney disease – make up 30% of inappropriate prescriptions at discharge.
“These medications can have a significant toxic effect, especially in the long term,” said Harsh Patel, MD, from Medical City Healthcare in Fort Worth, Tex.
And “when we interviewed patients, they were unable to recall ever partaking in a pulmonary function test or endoscopy to warrant the medications,” he said in an interview.
For their retrospective chart review, Dr. Patel and colleagues assessed patients admitted to the ICU in 13 hospitals over a 6-month period in northern Texas. Of the 12,930 patients, 2,557 had not previously received but were prescribed during their hospital stay a bronchodilator, a proton pump inhibitor, or an H2 receptor agonist.
Of those 2,557 patients, 26.8% were discharged on a proton pump inhibitor, 8.4% on an H2 receptor agonist, and 5.49% on a bronchodilator.
There were no corresponding diseases or diagnoses to justify continued use, Dr. Patel said during his presentation at the annual meeting of the American College of Chest Physicians, held virtually this year.
Button fatigue
The problem stems from a technology disconnect when patients are transferred from the ICU to the general population.
Doctors expect that the medications will be reconciled at discharge, said one of the study investigators, Prashanth Reddy, MD, from Medical City Las Colinas (Tex.).
But in some instances, clinicians unfamiliar with the case click through the electronic health record to get the patient “out of the ICU to the floor,” he explained. “They don’t always know what medications to keep.”
“They may have button fatigue, so they just accept and continue,” Dr. Reddy said in an interviews.
In light of these findings, the team has kick-started a project to improve transition out of the ICU and minimize overprescription at discharge.
“This is the kind of a problem where we thought we could have some influence,” said Dr. Reddy.
One solution would be to put “stop orders” on potentially harmful medications. “But we don’t want to increase button fatigue even more, so we have to find a happy medium,” he said. “It’s going to take a while to formulate the best path on this.”
The inclusion of pharmacy residents in rounds could make a difference. “When we rounded with pharmacy residents, these issues got addressed,” Dr. Patel said. The pharmacy residents often asked: “Can we go over the meds? Does this person really need all this?”
Medication reconciliations not only have a positive effect on a patient’s health, they can also cut costs by eliminating unneeded drugs. And “patients are always happy to hear we’re taking them off a drug,” Dr. Patel added.
He said he remembers one of his mentors telling him that, if he could get his patients down to five medications, “then you’ve achieved success as a physician.”
“I’m still working toward that,” he said. “The end goal should sometimes be, less is more.”
COPD patients overprescribed home oxygen
In addition to medications, home oxygen therapy is often prescribed when patients are discharged from the hospital.
A study of 69 patients who were continued on home oxygen therapy after hospitalization for an exacerbation of chronic obstructive pulmonary disease was presented by Analisa Taylor, MD, from the University of Illinois at Chicago.
Despite guideline recommendations that patients be reassessed within 90 days of discharge, only 38 patients in the cohort were reassessed, and “28 were considered eligible for discontinuation,” she said during her presentation.
However, “of those, only four were ultimately discontinued,” she reported.
The reason for this gap needs to be examined, noted Dr. Taylor, suggesting that “perhaps clinical inertia plays a role in the continuation of previously prescribed therapy despite a lack of ongoing clinical benefit.”
A version of this article originally appeared on Medscape.com.
FROM CHEST 2020
Avelumab Maintenance Therapy Improves Survival in Metastatic Urothelial Carcinoma
Study Overview
Objective. To evaluate the efficacy of maintenance avelumab in patients with advanced urothelial carcinoma who had received first-line platinum-based chemotherapy.
Design. International, open-label, randomized, phase 3 trial.
Intervention. Patients were randomized in a 1:1 ratio to receive either maintenance therapy with avelumab 10 mg/kg plus best supportive care (BSC) or BSC alone, per local practice. Randomization was stratified according to best response to first-line chemotherapy and metastatic site (visceral vs nonvisceral). Treatment was continued until progression, unacceptable toxicities, or patient withdrawal occurred.
Setting and participants. A total of 700 patients were enrolled at 197 sites (350 in the avelumab group and 350 in the BSC group). All patients had histologically confirmed unresectable or metastatic urothelial carcinoma. Patients received 4 to 6 cycles of chemotherapy with either gemcitabine plus cisplatin or carboplatin and had no evidence of progression after completion. Patients had a treatment-free interval of 4 to 10 weeks prior to starting maintenance therapy. Patients who received neoadjuvant or adjuvant platinum-based therapy within the prior 12 months were excluded.
Main outcome measures. The primary endpoint was overall survival (OS) assessed in both the overall population and PD-L1–positive population. Secondary endpoints included progression-free survival (PFS), objective response, time to response, duration of response, and disease control. PD-L1 expression was determined via the Ventana PD-L1 assay (SP263), and patients were classified as PD-L1 positive if they met 1 of the following: (1) at least 25% of tumor cells were positive for PD-L1; (2) at least 25% of immune cells were positive for PD-L1 if more than 1% of the tumor area contained immune cells;
Results. The baseline characteristics were well balanced between the groups. A total of 51.1% of patients had PD-L1–positive tumors (57.6% in the avelumab group and 56.3% in the control group). At the time of analysis, 24% of patients in the avelumab group were still receiving therapy compared with only 7% in the BSC group. The most common reason for discontinuation of therapy was disease progression; 43.7% of patients in the control group received anti-PD-1 or anti-PD-L1 therapy at progression. The median follow-up was 19 months. OS at 1 year was 71.3% in the avelumab group and 58.4% in the control group. The median OS was 21.4 months in the avelumab group compared with 14.3 months in the control group (hazard ratio [HR] for death, 0.69; confidence interval [CI], 0.56-0.86, P = 0.001). In the PD-L1–positive population, OS was also significantly longer in the avelumab group (NE vs 17.1 months, HR, 0.56; CI, 0.40-0.79; P < 0.001). In the PD-L1–negative population, median OS was 18.8 months in the avelumab group versus 13.7 months in the control group (HR, 0.85). PFS was longer in the avelumab group than in the control group, with a median PFS of 3.7 months versus 2 months, respectively. The median PFS was 5.7 months in the avelumab group and 2.1 months in the control group in the PD-L1–positive population.
Adverse events (AEs) of any grade occurred in 98% of patients in the avelumab group and 77% in the control group. Grade 3 or higher AEs occurred in 47.4% of patients in the avelumab group. AEs led to discontinuation in 11.9% of patients in the avelumab group. Two patients died in the avelumab group as a result of toxicity (urinary tract infection with sepsis and ischemic stroke). Immune-related adverse events occurred in 29.4% of patients in the avelumab group. Of those, 7% were grade 3 in nature, and there were no grade 4 or 5 immune-related AEs. The most commonly seen immune-related AEs were thyroid disorders.
Conclusion. Avelumab maintenance significantly improved OS compared with BSC in patients with advanced/metastatic urothelial carcinoma whose disease did not progress after first-line platinum-based chemotherapy.
Commentary
In summary, the JAVELIN Bladder 100 trial showed significantly longer OS with the use of maintenance avelumab following first-line platinum-based chemotherapy. This survival benefit was seen in all subgroups, including those who received cisplatin or carboplatin therapy, as well as those with stable disease, partial response, or complete response to initial chemotherapy. Furthermore, the survival benefit was seen in both the overall population as well as in the PD-L1–positive population. There did not appear to be any new safety concerns noted in this trial. Based on these findings, avelumab maintenance in those who do not progress on first-line platinum-based therapy certainly represents a potentially new standard of care in this patient population. While the results of this study are promising and potentially practice changing, whether this “switch maintenance” approach is superior to treatment at progression (ie, use of checkpoint inhibition in the second-line setting) remains debatable. Nevertheless, for most patients, this appears to be the preferred approach given the notable longer OS and improved PFS, which is meaningful, particularly if the progression event is symptomatic. Furthermore, a portion of patients will not proceed to second-line therapy for a variety of reasons, and thus will not be exposed to checkpoint inhibitors if one takes a treatment break approach.
In the previous KEYNOTE-45 study evaluating pembrolizumab versus chemotherapy in the second-line setting after progression on previous platinum therapy, the median OS was just 10 months in the pembrolizumab arm.1 This is markedly different from the 21.4-month median OS noted in the current study. While there are many limitations to this comparison, it does appear that switch maintenance leads to meaningful improvements in patient outcomes. It should be noted, however, that a portion of patients will have a durable response to platinum-based therapy, and thus there may be a portion of patients who would be “overtreated” with such an approach.
A similar approach has been explored in a randomized phase 2 trial looking at maintenance pembrolizumab after first-line chemotherapy (HCRN GU14-182).2 This trial similarly showed improvement in PFS; however, OS was not yet mature at the time of data analysis. It should be noted that crossover was permitted in the HCRN study, while this was not allowed in the current Javelin 100 study. Certainly, this crossover effect influenced OS data in that trial. Thus, the current study is the first and only to show an OS benefit with such an approach in this population. Numerous ongoing studies are seeking to evaluate the efficacy of immune checkpoint inhibitors in the first-line setting for advanced urothelial carcinoma, and the results of these studies will help shed additional light regarding the efficacy of this approach.
Applications for Clinical Practice
First-line maintenance avelumab in patients who do not progress on platinum-based chemotherapy improves both progression-free and overall survival. This approach is certainly practice-changing and represents a new standard of care in this patient population. Careful discussion with each patient about the benefits and risks of a switch maintenance approach is warranted.
Daniel Isaac, DO, MS
1. Bellmunt J, de Wit R, Vaughn DJ; KEYNOTE-045 Investigators. Pembrolizumab as second-line therapy for advanced urothelial carcinoma. N Engl J Med. 2017;376:1015-1026.
2. Galsky MD, Mortazavi A, Milowsky MI, et al. Randomized double-blind phase ii study of maintenance pembrolizumab versus placebo after first-line chemotherapy in patients with metastatic urothelial cancer. J Clin Oncol. 2020;38:1797-1806.
Study Overview
Objective. To evaluate the efficacy of maintenance avelumab in patients with advanced urothelial carcinoma who had received first-line platinum-based chemotherapy.
Design. International, open-label, randomized, phase 3 trial.
Intervention. Patients were randomized in a 1:1 ratio to receive either maintenance therapy with avelumab 10 mg/kg plus best supportive care (BSC) or BSC alone, per local practice. Randomization was stratified according to best response to first-line chemotherapy and metastatic site (visceral vs nonvisceral). Treatment was continued until progression, unacceptable toxicities, or patient withdrawal occurred.
Setting and participants. A total of 700 patients were enrolled at 197 sites (350 in the avelumab group and 350 in the BSC group). All patients had histologically confirmed unresectable or metastatic urothelial carcinoma. Patients received 4 to 6 cycles of chemotherapy with either gemcitabine plus cisplatin or carboplatin and had no evidence of progression after completion. Patients had a treatment-free interval of 4 to 10 weeks prior to starting maintenance therapy. Patients who received neoadjuvant or adjuvant platinum-based therapy within the prior 12 months were excluded.
Main outcome measures. The primary endpoint was overall survival (OS) assessed in both the overall population and PD-L1–positive population. Secondary endpoints included progression-free survival (PFS), objective response, time to response, duration of response, and disease control. PD-L1 expression was determined via the Ventana PD-L1 assay (SP263), and patients were classified as PD-L1 positive if they met 1 of the following: (1) at least 25% of tumor cells were positive for PD-L1; (2) at least 25% of immune cells were positive for PD-L1 if more than 1% of the tumor area contained immune cells;
Results. The baseline characteristics were well balanced between the groups. A total of 51.1% of patients had PD-L1–positive tumors (57.6% in the avelumab group and 56.3% in the control group). At the time of analysis, 24% of patients in the avelumab group were still receiving therapy compared with only 7% in the BSC group. The most common reason for discontinuation of therapy was disease progression; 43.7% of patients in the control group received anti-PD-1 or anti-PD-L1 therapy at progression. The median follow-up was 19 months. OS at 1 year was 71.3% in the avelumab group and 58.4% in the control group. The median OS was 21.4 months in the avelumab group compared with 14.3 months in the control group (hazard ratio [HR] for death, 0.69; confidence interval [CI], 0.56-0.86, P = 0.001). In the PD-L1–positive population, OS was also significantly longer in the avelumab group (NE vs 17.1 months, HR, 0.56; CI, 0.40-0.79; P < 0.001). In the PD-L1–negative population, median OS was 18.8 months in the avelumab group versus 13.7 months in the control group (HR, 0.85). PFS was longer in the avelumab group than in the control group, with a median PFS of 3.7 months versus 2 months, respectively. The median PFS was 5.7 months in the avelumab group and 2.1 months in the control group in the PD-L1–positive population.
Adverse events (AEs) of any grade occurred in 98% of patients in the avelumab group and 77% in the control group. Grade 3 or higher AEs occurred in 47.4% of patients in the avelumab group. AEs led to discontinuation in 11.9% of patients in the avelumab group. Two patients died in the avelumab group as a result of toxicity (urinary tract infection with sepsis and ischemic stroke). Immune-related adverse events occurred in 29.4% of patients in the avelumab group. Of those, 7% were grade 3 in nature, and there were no grade 4 or 5 immune-related AEs. The most commonly seen immune-related AEs were thyroid disorders.
Conclusion. Avelumab maintenance significantly improved OS compared with BSC in patients with advanced/metastatic urothelial carcinoma whose disease did not progress after first-line platinum-based chemotherapy.
Commentary
In summary, the JAVELIN Bladder 100 trial showed significantly longer OS with the use of maintenance avelumab following first-line platinum-based chemotherapy. This survival benefit was seen in all subgroups, including those who received cisplatin or carboplatin therapy, as well as those with stable disease, partial response, or complete response to initial chemotherapy. Furthermore, the survival benefit was seen in both the overall population as well as in the PD-L1–positive population. There did not appear to be any new safety concerns noted in this trial. Based on these findings, avelumab maintenance in those who do not progress on first-line platinum-based therapy certainly represents a potentially new standard of care in this patient population. While the results of this study are promising and potentially practice changing, whether this “switch maintenance” approach is superior to treatment at progression (ie, use of checkpoint inhibition in the second-line setting) remains debatable. Nevertheless, for most patients, this appears to be the preferred approach given the notable longer OS and improved PFS, which is meaningful, particularly if the progression event is symptomatic. Furthermore, a portion of patients will not proceed to second-line therapy for a variety of reasons, and thus will not be exposed to checkpoint inhibitors if one takes a treatment break approach.
In the previous KEYNOTE-45 study evaluating pembrolizumab versus chemotherapy in the second-line setting after progression on previous platinum therapy, the median OS was just 10 months in the pembrolizumab arm.1 This is markedly different from the 21.4-month median OS noted in the current study. While there are many limitations to this comparison, it does appear that switch maintenance leads to meaningful improvements in patient outcomes. It should be noted, however, that a portion of patients will have a durable response to platinum-based therapy, and thus there may be a portion of patients who would be “overtreated” with such an approach.
A similar approach has been explored in a randomized phase 2 trial looking at maintenance pembrolizumab after first-line chemotherapy (HCRN GU14-182).2 This trial similarly showed improvement in PFS; however, OS was not yet mature at the time of data analysis. It should be noted that crossover was permitted in the HCRN study, while this was not allowed in the current Javelin 100 study. Certainly, this crossover effect influenced OS data in that trial. Thus, the current study is the first and only to show an OS benefit with such an approach in this population. Numerous ongoing studies are seeking to evaluate the efficacy of immune checkpoint inhibitors in the first-line setting for advanced urothelial carcinoma, and the results of these studies will help shed additional light regarding the efficacy of this approach.
Applications for Clinical Practice
First-line maintenance avelumab in patients who do not progress on platinum-based chemotherapy improves both progression-free and overall survival. This approach is certainly practice-changing and represents a new standard of care in this patient population. Careful discussion with each patient about the benefits and risks of a switch maintenance approach is warranted.
Daniel Isaac, DO, MS
1. Bellmunt J, de Wit R, Vaughn DJ; KEYNOTE-045 Investigators. Pembrolizumab as second-line therapy for advanced urothelial carcinoma. N Engl J Med. 2017;376:1015-1026.
2. Galsky MD, Mortazavi A, Milowsky MI, et al. Randomized double-blind phase ii study of maintenance pembrolizumab versus placebo after first-line chemotherapy in patients with metastatic urothelial cancer. J Clin Oncol. 2020;38:1797-1806.
Twelve end-of-year tax tips: How COVID-19 could lower your tax bite
COVID-19 has had a huge impact on every aspect of physicians’ medical practice, incomes, and business. Although this will probably not end soon, there are some key tax strategies that can help your financial position if you take some important actions by the end of the year.
Some of the ways in which physicians were hard hit include:
- Physicians who are self-employed are facing increased costs for personal protective equipment, cleaning protocols, and new telehealth infrastructure. Many are also facing staffing shortages as employees fall to part-time work or take time off work to care for family members.
- Even physicians working for large hospitals are not isolated from the financial impact of the virus. A recent survey conducted by Medscape concluded that over 60% of physicians in the United States have experienced a decrease in income since the start of the pandemic.
- Saving and investing have been affected: Physicians may expect to see that companies in which they are invested are cutting dividends. Interest rates (CDs, bonds) are lower, and capital gains distributions are reduced this year. Overall, that makes for a fairly grim financial picture.
While taxable income this year has mostly declined, the applicable tax rates overall are low. However, federal, state, and local budget deficits have been skyrocketing owing to the demands of the pandemic. That means, in all likelihood, there will be tax increases in the coming years to cover spending. However, this year’s financial challenges could lend themselves to a unique tax planning scenario that could potentially benefit physicians as they make long-term plans for their investments.
Given these circumstances, these 12 tips can help you to lessen your tax bite this tax season. Many of these tips entail actions that you need to take before Dec. 31, 2020.
1. Coronavirus stimulus rebates
If you have significantly depressed income this year or have lost your job, you may find that you qualify for an Economic Impact Payment, a refundable tax credit on the 2020 tax return. The credit is $1,200 for individuals or $2,400 for joint filers, plus an additional $500 for each qualifying child aged 16 years or younger. You begin to phase out of the credit at an adjusted gross income (AGI) of $75,000 for individuals and $150,000 for joint filers. People who had AGI below these thresholds in 2019 already would have received the credit in advance, but those who now find themselves qualifying will receive the credit when they file their 2020 tax return. No action is needed on your part; your tax preparer will calculate whether you are eligible for the credit when filing your return.
2. Look to accelerate income at lower brackets
With reduced earned income, many physicians will find themselves in significantly lower tax brackets this year. Once you fall below $200,000 for individuals or $250,000 for joint filers, you no longer trigger two additional surcharge taxes. The first is the additional Medicare tax, which is a further 0.9% applied to earned income above those thresholds, on top of ordinary income tax brackets. The second is the Net Investment Income Tax (NIIT), which is an additional 3.8% applied to your investment income on top of capital gains tax brackets.
If you are someone to whom the additional Medicare tax or NIIT no longer applies for 2020, you might consider generating income this year in order to realize the lower tax rates. You could consider selling highly appreciated investments in your taxable portfolio and reinvest the proceeds by repurchasing the same securities, thereby receiving a step-up in cost basis. Remember, when you go to sell securities in retirement, you are only taxed on the gain on the security over your cost basis. By bringing the cost basis up to today’s fair market value, you could be greatly reducing the future tax applied on a sale.
For those with IRA or inherited IRA accounts who also have required minimum distributions (RMDs), you might consider making voluntary withdrawals this year and then reinvesting the proceeds into a savings or taxable account for when you need it. Keep in mind that under the CARES Act, you are no longer required to take RMDs for 2020. However, this action would help avoid being forced to withdraw the amount when you may be at a higher tax bracket. You would need to do this before Dec. 31.
3. Build Roth assets strategies
With reduced incomes and lower marginal tax rates applying to the last dollar of income this year, physicians should carefully consider how to take advantage of current tax rates by building Roth assets. There are a few strategies, including switching 401(k) or 457 contributions from pretax to Roth or performing a backdoor Roth IRA contribution. However, neither is as powerful as converting IRA assets to Roth assets because there is no restriction on conversion amount or income cutoffs.
The goal is to convert enough assets to fill up lower applicable marginal tax brackets while avoiding tax surcharges, where possible. Roth IRA conversions can get you in trouble if you don’t know what to expect, so it’s best to work with a financial advisor or tax professional to give you guidance. For example, Roth conversions can trigger some tax surprises, such as the phaseout for the 199A qualified business income deduction, increased taxation on your Social Security benefits, or higher Income-Related Monthly Adjustment Amount surcharges on Medicare Part B and Part D premiums.
Bear in mind that Roth conversions generate taxable income and cannot be undone once completed. However, paying the lower marginal tax rate today may be a big win when RMDs could push physicians into tax brackets as high as or higher than during their working years.
4. Coronavirus-related distributions
New this year is a penalty-free way to withdraw qualified retirement plan funds for those who are not yet eligible to make penalty-free withdrawals.
Congress introduced the Coronavirus-Related Distribution under the CARES Act. It allows individuals who have been affected by the pandemic to withdraw up to $100,000 before Dec. 31, 2020, without paying the 10% early withdrawal penalty. If you are considering an early retirement because of the pandemic, it may make sense to take this withdrawal while the option lasts and keep the cash available to help fund the gap before the remainder of your retirement plan assets are available penalty free. Keep in mind that this withdrawal generates taxable ordinary income, even though the early withdrawal penalty does not apply. Taking this withdrawal can boost your taxable income bracket, so calculate carefully before you do this.
5. Charitable donations for 2020
There is no shortage of people in need owing to the pandemic. For those who continue to be charitable-minded, a decrease in income may mean you have more opportunity for your regularly recurring charitable donations to decrease your taxes this year. Normally, charitable donations for itemizers are limited to 60% of AGI. However, the CARES Act increased the charitable deduction limit to 100% of AGI for 2020. Even those who claim the standard deduction can take advantage of a new “above-the-line” deduction worth $300 for individuals and $600 for joint filers by making qualified cash donations in 2020. Take special note that the contributions do not apply to donor-advised funds or nonoperating private foundations.
6. Noncash charitable donations
Many physicians are working longer and harder than ever, and for many, that means vacation plans have been placed on hold for the remainder of the year. Don’t let your paid-time-off days go to waste! The IRS now permits leave-based donation programs, which allow employers to make deductible charitable donations for the relief of victims of the COVID-19 pandemic on the basis of the value of the sick, vacation, or personal leave that employees voluntarily forgo. The value of the donation will not be treated as compensation for the employee and will be free of any otherwise applicable Federal Insurance Contributions Act (FICA) taxes, and the employer can deduct the donation as ordinary and necessary business expenses if they meet certain requirements.
7. Claiming 2020 losses on prior tax returns
For self-employed physicians, a wealth of tax planning strategies are available. One of the most significant may be the new provisions under the CARES Act that allow 100% of net operating losses (NOLs) for 3 calendar years of losses – namely 2018, 2019, and 2020 – to be carried back to the prior 5 tax years. Using these NOLs, you may be able to claim a refund for tax returns from prior tax years when there was otherwise a limit on NOLs at 80% of taxable income. If you think this applies to you, it’s wise to meet with your accountant or financial professional to discuss this.
8. Delay payroll taxes where possible
For physicians with employees looking for some cash flow relief, a new payroll tax deferral is available to you this year. Under the CARES Act, employers can delay payment of their 2020 employer payroll tax, namely the 6.2% Social Security tax, with 50% not due until Dec. 31, 2021, and the remainder due Dec. 31, 2022. The deferral will not incur any interest or penalties and is also available to those who are self-employed.
On top of that, a new payroll tax credit was created under the Families First Coronavirus Response Act. Eligible employers can receive this tax credit for the amount of wages they pay to eligible employees who are taking pandemic-related paid family leave or paid sick leave this year. The credit is also available to those who are self-employed. If you think this credit may be applicable to you, it’s worth speaking with your tax preparer about it.
9. Increased business property deductions
The nature of many physician business operations has drastically changed this year. For physicians who already have invested in and implemented new telehealth infrastructure, this can create valuable tax deductions to offset their ordinary income. Businesses may take 100% bonus depreciation on the cost of qualified property both acquired and placed in service after Sept. 27, 2017, and before Jan. 1, 2023. In general, during the last quarter of the year, you should look to decelerate business purchases until after Jan. 1, 2021, to get a deduction in 2021 at a higher marginal tax bracket.
10. Switch to cash accounting instead of accrual accounting
With higher expenses and lower profits, some large practice groups may take a second look to see whether they qualify to switch to cash accounting from accrual accounting to defer taxes. This rule change was adopted back in 2017 to allow small-business taxpayers with average annual gross receipts of $25 million or less in the prior 3 years to use the cash method of accounting. Ultimately, this switch should allow practices to owe the IRS money only after invoices were paid.
11. Physicians looking to sell their unprofitable practices
For physicians looking to make a quick exit from their practice in response to the pandemic, there is some tax relief in the event of a sale at a loss. Certain business owners who sell failed businesses will be able to use up to $50,000 of net losses as individuals or $100,000 as joint filers from the sale to offset ordinary income, current or future, under Internal Revenue Code (IRC) Section 1244. Remember that ordinary income tax rates are much higher than capital gains rates, so you could see some tax relief through a sale. The provision covers shareholders of domestic small-business corporations, both C or S corporations, but not partnerships. You would have to sell the business before Dec. 31 to get this deduction in 2020.
12. Physicians looking to sell their profitable practices
Even self-employed physicians who have managed to maintain profitable practices may be looking for early retirement after the exhaustion of the pandemic. If you own stock in a C corporation engaged in an active trade or business that has not had assets of more than $50 million at any time, you can take advantage of the IRC Section 1202 exemption. Section 1202 provides an exclusion from gain from the sale of stock of either $10 million or 10 times the adjusted basis of the stock, owned at least 5 years, in corporations regarded as “qualified small businesses.” This means you may be able to sell your practice at a gain with a handsome tax shield. Again, to get this tax benefit for April’s tax return, you’d have to engage in this activity before year end.
Regardless of whether the pandemic has placed financial constraints on you this year, tax-savvy opportunities are available to capitalize on your reduced income and lower tax rates. It’s always important to keep in mind not just your taxes in any one given year, but your lifetime tax obligations. Financial advisors and tax planners can perform multiyear tax calculations and recommend ways to manage your tax bracket and help lower your overall lifetime tax obligations.
A version of this article originally appeared on Medscape.com.
Switching to riociguat effective for some patients with PAH not at treatment goal
In patients with intermediate-risk pulmonary arterial hypertension (PAH) who are not at treatment goal on standard therapy, switching to riociguat is a promising strategy across a broad range of patient subgroups, an investigator said at the annual meeting of the American College of Chest Physicians, held virtually this year.
Patients switching to riociguat in the REPLACE study more frequently met the primary efficacy endpoint, compared with patients who remained on a phosphodiesterase-5 (PDE5) inhibitor, said Marius M. Hoeper, MD, of the Clinic for Respiratory Medicine at Hannover (Germany) Medical School.
That clinical benefit of switching to riociguat, a soluble guanylate cyclase (sGC) stimulator, was relatively consistent across patient subgroups including age, sex, PAH subtype, according to Dr. Hoeper.
“At the end of the day, we believe that switching from a PDE5 inhibitor to riociguat can benefit patients with PAH at intermediate risk and may serve as a new strategic option for treatment escalation,” he said in a live virtual presentation of the study results.
About 40% of patients switching to riociguat met the primary endpoint of clinical improvement in absence of clinical worsening versus just 20% of patients who stayed on a PDE5 inhibitor, according to top-line results of the phase 4 REPLACE study, which were reported Sept. 7 at the annual meeting of the European Respiratory Society.
Results of REPLACE presented at the CHEST meeting show a benefit across most patient subgroups, including PAH subtype and whether patients came from monotherapy or combination treatment to riociguat. Some groups did not appear to respond quite as well to switching, including elderly patients, patients with a 6-minute walk distance (6MWD) of less than 320 meters at baseline, and patients switching from tadalafil as opposed to sildenafil. However, these findings were not statistically significant and may have been chance findings, according to Dr. Hoeper.
These results of REPLACE suggest the efficacy of riociguat “across the board” for intermediate-risk PAH patients with inadequate response to standard therapy, said Vijay Balasubramanian, MD, FCCP, clinical professor of medicine at the University of California San Francisco, Fresno.
Based on REPLACE results, switching from a PDE5 inhibitor to riociguat is now a “strong potential option” beyond adding a third drug such as selexipag or an inhaled prostacyclin to usual treatment with a PDE5 inhibitor plus an endothelin receptor antagonist, Dr. Balasubramanian said in an interview.
“We now have an evidence-based option where you can stay on a two-drug regimen and see whether the switch would work just as well,” said Dr. Balasubramanian, vice chair of the Pulmonary Vascular Disease Steering Committee for the American College of Chest Physicians.
REPLACE is a randomized phase 4 study including 226 patients with PAH considered to be at intermediate risk according to World Health Organization functional class III or 6MWD of 165-440 meters. The composite primary endpoint was defined as no clinical worsening (death, disease progression, or hospitalization for worsening PAH) plus clinical improvement on at least two measures including an improvement in 6MWD, achieving WHO functional class I/II, or a decrease in N-terminal pro-brain natriuretic peptide (NT-proBNP).
The primary endpoint of REPLACE was met, showing that 45 patients (41%) who switched to riociguat had clinical improvement without clinical worsening versus 22 patient (20%) who stayed on the PDE5 inhibitor (odds ratio, 2.78; 95% confidence interval, 1.53-5.06; P = .0007), Dr. Hoeper reported.
The benefit appeared consistent across PAH subgroups, according to Dr. Hoeper. In patients with idiopathic, heritable, or drug- and toxin-induced PAH, the primary endpoint favored riociguat over PDE5 inhibitor, at 45% and 23%, respectively. Similarly, a higher proportion of patients with PAH associated with congenital heart disease or portal hypertension achieved the primary endpoint (46% vs. 8%), as did patients with PAH associated with connective tissue disease (25% vs. 16%).
Adverse events were seen in 71% of riociguat-treated patients and 66% of PDE5 inhibitor–treated patients, according to Dr. Hoeper, who said severe adverse events were more frequent with PDE5-inhibitor treatment, at 17% versus 7% for riociguat. There were three clinical worsening events in the PDE5 inhibitor group leading to death, while a fourth patient died in safety follow-up, according to the reported results, whereas there were no deaths reported with riociguat.
The REPLACE study was cofunded by Bayer AG and Merck Sharpe & Dohme, a subsidiary of Merck & Co. Dr. Hoeper reported receiving fees for consultations or lectures from Acceleron, Actelion, Bayer AG, Janssen, MSD, and Pfizer.
SOURCE: Hoeper MM. CHEST 2020, Abstract A2156-A2159.
FROM CHEST 2020
Score predicts risk for ventilation in COVID-19 patients
A new scoring system can predict whether COVID-19 patients will require invasive mechanical ventilation, researchers report.

The score uses three variables to predict future risk: heart rate; the ratio of oxygen saturation (SpO2) to fraction of inspired oxygen (FiO2); and a positive troponin I level.
“What excites us is it’s a really benign tool,” said Muhtadi Alnababteh, MD, from the Medstar Washington (D.C.) Hospital Center. “For the first two variables you only need to look at vital signs, no labs or invasive diagnostics.”
“The third part is a simple lab, which is performed universally and can be done in any hospital,” he told this news organization. “We know that even rural hospitals can do this.”
For their retrospective analysis, Dr. Alnababteh and his colleagues assessed 265 adults with confirmed COVID-19 infection who were admitted to a single tertiary care center in March and April. They looked at demographic characteristics, lab results, and clinical and outcome information.
Ultimately, 54 of these patients required invasive mechanical ventilation.
On multiple-regression analysis, the researchers determined that three variables independently predicted the need for invasive mechanical ventilation.

Calibration of the model was good (Hosmer–Lemeshow score, 6.3; P = .39), as was predictive ability (area under the curve, 0.80).
The risk for invasive mechanical ventilation increased as the number of positive variables increased (P < .001), from 15.4% for those with one positive variable, to 29.0% for those with two, to 60.5% for those with three positive variables.
The team established cutoff points for each variable and developed a points-based scoring system to predict risk.

It was an initial surprise that troponin – a cardiac marker – would be a risk factor. “Originally, we thought COVID-19 only affects the lung,” Dr. Alnababteh explained during his presentation at CHEST 2020. Later studies, however, showed it can cause myocarditis symptoms.
The case for looking at cardiac markers was made when a study of young athletes who recovered from COVID-19 after experiencing mild or no symptoms showed that 15% had signs of myocarditis on cardiac MRI.
“If mild COVID disease in young patients caused cardiac injury, you can imagine what it can do to older patients with severe disease,” Alnababteh said.
This tool will help triage patients who are not sick enough for the ICU but are known to be at high risk for ventilation. “It’s one of the biggest decisions you have to make: Where do you send your patient? This score helps determine that,” he said.
The researchers are now working to validate the score and evaluate how it performs, he reported.
Existing scores evaluated for COVID-19 outcome prediction
The MuLBSTA score can also be used to predict outcomes in patients with COVID-19.
A retrospective evaluation of 163 patients was presented at CHEST 2020 by Jurgena Tusha, MD, from Wayne State University in Detroit.
Patients who survived their illness had a mean MuLBSTA score of 8.67, whereas patients who died had a mean score of 13.60.
The score “correlated significantly with mortality, ventilator support, and length of stay, which may be used to provide guidance to screen patients and make further clinical decisions,” Dr. Tusha said in a press release.
“Further studies are required to validate this study in larger patient cohorts,” she added.
The three-variable scoring system is easier to use than the MuLBSTA, and more specific, said Dr. Alnababteh.
“The main difference between our study and the MuLBSTA study is that we came up with a novel score for COVID-19 patients,” he said. “Our study score doesn’t require chest x-rays or blood cultures, and the outcome is need for invasive mechanical ventilation, not mortality.”
A version of this article originally appeared on Medscape.com.
A new scoring system can predict whether COVID-19 patients will require invasive mechanical ventilation, researchers report.
The score uses three variables to predict future risk: heart rate; the ratio of oxygen saturation (SpO2) to fraction of inspired oxygen (FiO2); and a positive troponin I level.
“What excites us is it’s a really benign tool,” said Muhtadi Alnababteh, MD, from the Medstar Washington (D.C.) Hospital Center. “For the first two variables you only need to look at vital signs, no labs or invasive diagnostics.”
“The third part is a simple lab, which is performed universally and can be done in any hospital,” he told this news organization. “We know that even rural hospitals can do this.”
For their retrospective analysis, Dr. Alnababteh and his colleagues assessed 265 adults with confirmed COVID-19 infection who were admitted to a single tertiary care center in March and April. They looked at demographic characteristics, lab results, and clinical and outcome information.
Ultimately, 54 of these patients required invasive mechanical ventilation.
On multiple-regression analysis, the researchers determined that three variables independently predicted the need for invasive mechanical ventilation.
Calibration of the model was good (Hosmer–Lemeshow score, 6.3; P = .39), as was predictive ability (area under the curve, 0.80).
The risk for invasive mechanical ventilation increased as the number of positive variables increased (P < .001), from 15.4% for those with one positive variable, to 29.0% for those with two, to 60.5% for those with three positive variables.
The team established cutoff points for each variable and developed a points-based scoring system to predict risk.
It was an initial surprise that troponin – a cardiac marker – would be a risk factor. “Originally, we thought COVID-19 only affects the lung,” Dr. Alnababteh explained during his presentation at CHEST 2020. Later studies, however, showed it can cause myocarditis symptoms.
The case for looking at cardiac markers was made when a study of young athletes who recovered from COVID-19 after experiencing mild or no symptoms showed that 15% had signs of myocarditis on cardiac MRI.
“If mild COVID disease in young patients caused cardiac injury, you can imagine what it can do to older patients with severe disease,” Alnababteh said.
This tool will help triage patients who are not sick enough for the ICU but are known to be at high risk for ventilation. “It’s one of the biggest decisions you have to make: Where do you send your patient? This score helps determine that,” he said.
The researchers are now working to validate the score and evaluate how it performs, he reported.
Existing scores evaluated for COVID-19 outcome prediction
The MuLBSTA score can also be used to predict outcomes in patients with COVID-19.
A retrospective evaluation of 163 patients was presented at CHEST 2020 by Jurgena Tusha, MD, from Wayne State University in Detroit.
Patients who survived their illness had a mean MuLBSTA score of 8.67, whereas patients who died had a mean score of 13.60.
The score “correlated significantly with mortality, ventilator support, and length of stay, which may be used to provide guidance to screen patients and make further clinical decisions,” Dr. Tusha said in a press release.
“Further studies are required to validate this study in larger patient cohorts,” she added.
The three-variable scoring system is easier to use than the MuLBSTA, and more specific, said Dr. Alnababteh.
“The main difference between our study and the MuLBSTA study is that we came up with a novel score for COVID-19 patients,” he said. “Our study score doesn’t require chest x-rays or blood cultures, and the outcome is need for invasive mechanical ventilation, not mortality.”
A version of this article originally appeared on Medscape.com.
Trump and Biden face off over COVID-19, ACA in final debate
The COVID-19 pandemic figured prominently in the final debate between President Donald Trump and former Vice President Joe Biden when they met on stage for a 90-minute debate in Nashville, Tennessee, Thursday evening.

The adequacy of the COVID-19 response to date, the likely timeline for vaccine availability, and how to reopen businesses while keeping Americans safe were among the points on which the two candidates disagreed. The two candidates also sparred over the value of the Affordable Care Act (ACA) and the future of healthcare in the United States.
Trump and Biden also differed on whether or not the country is facing a “dark winter” because of the pandemic.
Moderator Kristen Welker, NBC News White House correspondent, asked Trump to comment on the fact that 40,000 people are in the hospital on debate night with COVID-19 and that 16,000 have died since the last presidential debate.
Trump said, “2.2 million people modeled out were expected to die.” He said COVID-19 is a worldwide disease that does not only affect the United States.
“The mortality rate is down 85%, and the excess mortality is also down,” he added. He pointed out that previous spikes in Florida, Texas, and Arizona are now gone, and “spikes and surges in other places will soon be gone.
“It will go away, we are rounding the corner,” Trump said. “From personal experience, I was in the hospital, I had it, and they gave me a therapeutic, some would call it a cure...and now they say I’m immune. Whether it’s for a month or lifetime, nobody has been able to say that, but I’m immune.”
Biden countered by saying that “220,000 people are dead. If you hear nothing else I say tonight, hear this: Anyone who’s responsible for that many deaths should not remain president of the United States of America.”
Biden said there are a thousand deaths a day now and that there are over 70K new cases per day. “The expectation is we will have another 200,000 people down before the end of this year. If we just all wore these masks, we could save 100,000.”
“The New England Journal of Medicine said the way the president has handled this is absolutely tragic,” Biden added.
Vaccine timeline
Welker asked Trump if he could guarantee that there will be a COVID-19 vaccine within weeks.
“I can’t guarantee that, but it will be by end of the year. It will be distributed very quickly,” Trump said. He added that three leading vaccine developers, Johnson & Johnson, Moderna, and Pfizer, “are doing very well.”
“We’re about to go into a dark winter and he has no clear plan,” Biden said. “There is no prospect there will be a vaccine for most Americans by middle of next year.”
“It will not be a dark winter,” Trump responded.
Reopening the economy
Trump and Biden disagreed on how aggressively the economy should be reopened in light of the pandemic.
“I want to open the schools. We can’t keep this country closed,” Trump said. “This is a massive country with a massive economy.” He pointed out that rates of depression and suicide have risen because of the economic shutdown. “The cure cannot be worse than the problem.
“His Democrat governors...shut down so tight, and they’re dying,” the president added, gesturing toward Biden. “We are not going to shut down. We are going to open the schools.” As an example of the resiliency of young people, he mentioned that his son Barron tested positive for COVID-19 and recovered.
“I would shut down the virus, not the country,” Biden said. “It’s his ineptitude that caused so many schools and businesses to close in large part. Instead of being in a sand trap playing golf, he should have been negotiating with Nancy Pelosi.”
“He says we’re learning to live with it,” the former vice president said, but instead, “people are learning to die with it.”
Biden added that reopening the economy and minimizing transmission of COVID-19 are not mutually exclusive. “We can walk and chew gum at the same time.”
Divergence over the ACA
The fate of the ACA also garnered considerable attention. The discussion underlined a vast difference of opinion between the two candidates on the US healthcare system.
The moderator asked Trump what he would do for the 20 million Americans who get their healthcare through the ACA if it’s taken away.
“Through the legislature, I terminated the individual mandate, the worst part of Obamacare,” Trump said. “And now it’s in court because Obamacare is no good.
“Preexisting conditions will stay,” Trump added.
“I want to terminate Obamacare, and I want to come up with a beautiful healthcare [plan],” Trump added, turning the discussion toward private health insurance. “One thing that is very important is we have 180 million out there who have great private healthcare. Joe Biden will terminate all of their healthcare.”
Trump described Biden’s plan as “socialized medicine.” He also emphasized that protections for people with preexisting conditions “will stay.”
The Trump administration is supporting a lawsuit to overturn the ACA. The suit was filed by 18 Republican-led states. Arguments before the US Supreme Court on the constitutionality of the ACA are scheduled for November 10.
The moderator asked what Biden plans to do if the ACA is struck down. “I will pass Obamacare with a public option ― that will be ‘Bidencare.’ “ He said his plan will reduce premiums and drug prices. “I support private insurance. No one lost their private insurance under Obamacare.
“There is no way he can protect preexisting conditions,” Biden said. He added that 10 million people have already lost their private healthcare through unemployment during the pandemic.
Muting the mic
Following what many described as a chaotic first debate at the Cleveland Clinic in Ohio on September 29, the Commission on Presidential Debate opted to allow the muting of the microphone during the first 2 minutes of remarks made by each candidate during each debate segment.
The muting of the microphones appeared to prevent crosstalk during the beginning of each segment of the debate. The candidates did manage to talk over and interrupt each other, as well as the moderator, during portions of the debate.
This article first appeared on Medscape.com.
The COVID-19 pandemic figured prominently in the final debate between President Donald Trump and former Vice President Joe Biden when they met on stage for a 90-minute debate in Nashville, Tennessee, Thursday evening.
The adequacy of the COVID-19 response to date, the likely timeline for vaccine availability, and how to reopen businesses while keeping Americans safe were among the points on which the two candidates disagreed. The two candidates also sparred over the value of the Affordable Care Act (ACA) and the future of healthcare in the United States.
Trump and Biden also differed on whether or not the country is facing a “dark winter” because of the pandemic.
Moderator Kristen Welker, NBC News White House correspondent, asked Trump to comment on the fact that 40,000 people are in the hospital on debate night with COVID-19 and that 16,000 have died since the last presidential debate.
Trump said, “2.2 million people modeled out were expected to die.” He said COVID-19 is a worldwide disease that does not only affect the United States.
“The mortality rate is down 85%, and the excess mortality is also down,” he added. He pointed out that previous spikes in Florida, Texas, and Arizona are now gone, and “spikes and surges in other places will soon be gone.
“It will go away, we are rounding the corner,” Trump said. “From personal experience, I was in the hospital, I had it, and they gave me a therapeutic, some would call it a cure...and now they say I’m immune. Whether it’s for a month or lifetime, nobody has been able to say that, but I’m immune.”
Biden countered by saying that “220,000 people are dead. If you hear nothing else I say tonight, hear this: Anyone who’s responsible for that many deaths should not remain president of the United States of America.”
Biden said there are a thousand deaths a day now and that there are over 70K new cases per day. “The expectation is we will have another 200,000 people down before the end of this year. If we just all wore these masks, we could save 100,000.”
“The New England Journal of Medicine said the way the president has handled this is absolutely tragic,” Biden added.
Vaccine timeline
Welker asked Trump if he could guarantee that there will be a COVID-19 vaccine within weeks.
“I can’t guarantee that, but it will be by end of the year. It will be distributed very quickly,” Trump said. He added that three leading vaccine developers, Johnson & Johnson, Moderna, and Pfizer, “are doing very well.”
“We’re about to go into a dark winter and he has no clear plan,” Biden said. “There is no prospect there will be a vaccine for most Americans by middle of next year.”
“It will not be a dark winter,” Trump responded.
Reopening the economy
Trump and Biden disagreed on how aggressively the economy should be reopened in light of the pandemic.
“I want to open the schools. We can’t keep this country closed,” Trump said. “This is a massive country with a massive economy.” He pointed out that rates of depression and suicide have risen because of the economic shutdown. “The cure cannot be worse than the problem.
“His Democrat governors...shut down so tight, and they’re dying,” the president added, gesturing toward Biden. “We are not going to shut down. We are going to open the schools.” As an example of the resiliency of young people, he mentioned that his son Barron tested positive for COVID-19 and recovered.
“I would shut down the virus, not the country,” Biden said. “It’s his ineptitude that caused so many schools and businesses to close in large part. Instead of being in a sand trap playing golf, he should have been negotiating with Nancy Pelosi.”
“He says we’re learning to live with it,” the former vice president said, but instead, “people are learning to die with it.”
Biden added that reopening the economy and minimizing transmission of COVID-19 are not mutually exclusive. “We can walk and chew gum at the same time.”
Divergence over the ACA
The fate of the ACA also garnered considerable attention. The discussion underlined a vast difference of opinion between the two candidates on the US healthcare system.
The moderator asked Trump what he would do for the 20 million Americans who get their healthcare through the ACA if it’s taken away.
“Through the legislature, I terminated the individual mandate, the worst part of Obamacare,” Trump said. “And now it’s in court because Obamacare is no good.
“Preexisting conditions will stay,” Trump added.
“I want to terminate Obamacare, and I want to come up with a beautiful healthcare [plan],” Trump added, turning the discussion toward private health insurance. “One thing that is very important is we have 180 million out there who have great private healthcare. Joe Biden will terminate all of their healthcare.”
Trump described Biden’s plan as “socialized medicine.” He also emphasized that protections for people with preexisting conditions “will stay.”
The Trump administration is supporting a lawsuit to overturn the ACA. The suit was filed by 18 Republican-led states. Arguments before the US Supreme Court on the constitutionality of the ACA are scheduled for November 10.
The moderator asked what Biden plans to do if the ACA is struck down. “I will pass Obamacare with a public option ― that will be ‘Bidencare.’ “ He said his plan will reduce premiums and drug prices. “I support private insurance. No one lost their private insurance under Obamacare.
“There is no way he can protect preexisting conditions,” Biden said. He added that 10 million people have already lost their private healthcare through unemployment during the pandemic.
Muting the mic
Following what many described as a chaotic first debate at the Cleveland Clinic in Ohio on September 29, the Commission on Presidential Debate opted to allow the muting of the microphone during the first 2 minutes of remarks made by each candidate during each debate segment.
The muting of the microphones appeared to prevent crosstalk during the beginning of each segment of the debate. The candidates did manage to talk over and interrupt each other, as well as the moderator, during portions of the debate.
This article first appeared on Medscape.com.