User login
Neurodegeneration complicates psychiatric care for Parkinson’s patients
Managing depression and anxiety in Parkinson’s disease should start with a review of medications and involve multidisciplinary care, according to a recent summary of evidence.
“Depression and anxiety have a complex relationship with the disease and while the exact mechanism for this association is unknown, both disturbances occur with increased prevalence across the disease course and when present earlier in life, increase the risk of PD by about twofold,” wrote Gregory M. Pontone, MD, of Johns Hopkins University, Baltimore, and colleagues.
Randomized trials to guide treatment of anxiety and depression in patients with Parkinson’s disease (PD) are limited, the researchers noted. However, data from a longitudinal study showed that PD patients whose depression remitted spontaneously or responded to treatment were able to attain a level of function similar to that of never-depressed PD patients, Dr. Pontone and colleagues said.
The researchers offered a pair of treatment algorithms to help guide clinicians in managing depression and anxiety in PD. However, a caveat to keep in mind is that “the benefit of antidepressant medications, used for depression or anxiety, can be confounded when motor symptoms are not optimally treated,” the researchers emphasized.
For depression, the researchers advised starting with some lab work; “at a minimum we suggest checking a complete blood count, metabolic panel, TSH, B12, and folate,” they noted. They recommended an antidepressant, cognitive-behavioral therapy, or both, as a first-line treatment, such as monotherapy with selective norepinephrine reuptake inhibitors or selective serotonin reuptake inhibitors. They advised titrating the chosen monotherapy to a minimum effective dose over a 2- to 3-week period to assess response.
“We recommend continuing antidepressant therapy for at least 1 year based on literature in non-PD populations and anecdotal clinical experience. At 1 year, if not in remission, consider continuing treatment or augmenting to improve response,” the researchers said.
, and they recommended using anxiety rating scales to diagnose anxiety in PD. “Given the high prevalence of atypical anxiety syndromes in PD and their potential association with both motor and nonmotor symptoms of the disease, working with the neurologist to achieve optimal control of PD is an essential first step to alleviating anxiety,” they emphasized.
The researchers also advised addressing comorbidities, including cardiovascular disease, chronic pain, diabetes, gastrointestinal issues, hyperthyroidism, and lung disease, all of which can be associated with anxiety. Once comorbidities are addressed, they advised caution given the lack of evidence for efficacy of both pharmacologic and nonpharmacologic anxiety treatments for PD patients. However, first-tier treatment for anxiety could include monotherapy with serotonin-norepinephrine reuptake inhibitors or selective serotonin reuptake inhibitors, they said.
PD patients with depression and anxiety also may benefit from nonpharmacologic interventions, including exercise, mindfulness, relaxation therapy, and cognitive behavioral therapy the researchers said.
Although the algorithm may not differ significantly from current treatment protocols, it highlights aspects unique to PD patients, the researchers said. In particular, the algorithm shows “that interventions used for motor symptoms, for example, dopamine agonists, may be especially potent for mood in the PD population and that augmentation strategies, such as antipsychotics and lithium, may not be well tolerated given their outsized risk of adverse events in PD,” they said.
“While an article of this kind cannot hope to address the gap in knowledge on comparative efficacy between interventions, it can guide readers on the best strategies for implementation and risk mitigation in PD – essentially focusing more on effectiveness,” they concluded.
The study received no outside funding. Dr. Pontone disclosed serving as a consultant for Acadia Pharmaceuticals and Concert Pharmaceuticals.
FROM THE AMERICAN JOURNAL OF GERIATRIC PSYCHIATRY
Safety-net burden linked with poorer inpatient cirrhosis outcomes
Patients with cirrhosis treated at hospitals with the highest safety-net burden, defined by their proportion of Medicaid or uninsured patients, had a 5% higher mortality rate than patients who were treated at hospitals with the lowest burden, according to a study of over 300,000 patients.

The study, which was published in the Journal of Clinical Gastroenterology, analyzed inpatient data from the National Inpatient Sample (NIS) database focusing on a 4-year time span between 2012 and 2016. The hospitals were categorized by safety-net burden, which was defined as having either a high, medium, or low number of uninsured patients or patients with Medicaid.
This is the first-known study to evaluate the impact of a hospital’s safety-net burden on hospitalization outcomes in cirrhosis patients, wrote authors Robert J. Wong, MD, MS, of Stanford (Calif.) University and Grishma Hirode, MAS, of the University of Toronto. Previous studies have shown that safety-net hospitals, especially those with a high safety-net burden, have poorer patient outcomes. These hospitals also serve a patient population that is at high risk for chronic liver disease and cirrhosis.
The new analysis included 322,944 individual hospitalizations of patients with cirrhosis. Of these, 57.8% were male, 63.7% were White, 9.9% were Black, and 15.6% were Hispanic. In terms of safety-net burden, 107,446 hospitalizations were at high-burden hospitals, 103,508 were at medium-burden hospitals, and 111,990 hospitalizations were at low-burden hospitals.
Overall, cirrhosis-related hospitalizations in hospitals with the highest burden were found to have significantly greater odds of in-hospital mortality than the lowest tertile hospitals (odds ratio, 1.05, P = .044). The patients were also younger (mean age, 56.7 years vs. 59.8 years in low-burden hospitals). They also had a higher proportion of male patients, minority patients, Hispanic patients, and patients with Medicaid or no insurance.
The odds of hospitalization in the highest tertile hospitals were found to be significantly higher, compared with the middle and lowest tertiles for Blacks and Hispanics, compared with Whites (OR 1.26 and OR 1.63, respectively). Black patients (OR, 1.26; 95%CI, 1.17-1.35; P < .001) and Hispanic patients (OR, 1.63; 95% CI, 1.50-1.78; P< .001) were more likely to be admitted for care at high-burden hospitals (26% to 54%). In-hospital mortality rates among all hospitalizations were 5.95% and the rate did not significantly differ by hospital burden status.
“Despite adjusting for safety-net burden, our study continued to demonstrate ethnic disparities in in-hospital mortality among cirrhosis-related hospitalizations,” the researchers wrote. Overall, the odds of in-hospital mortality were 27% higher in Black patients as compared with White patients.
However, significantly lower mortality was observed in Hispanic patients as compared with White patients (4.9% vs. 6.0%, P < .001), but why this occurred was not entirely clear. “Hispanic patients may be more likely to have NASH [nonalcoholic steatohepatitis]-related cirrhosis, which generally has a slower disease progression, compared with [hepatitis C virus] or alcoholic cirrhosis. As such, it is likely that NASH-cirrhosis Hispanic patients had less severe disease at presentation,” the researchers wrote.
Study design has limitations, but shows concerning trends
The study findings were limited by several factors including the inability to show causality based on the observational study design and cross-sectional nature of the database, the researchers said. The NIS database records individual hospitalizations, not individual patient data which means that it may include repeat hospitalizations from the same patient. In addition, the study was limited by a lack of data on outpatient cirrhosis outcomes and non–liver-related comorbidities.
However, the finding that ethnic minorities with cirrhosis were significantly more likely to be hospitalized in high safety-net hospitals than White patients is concerning, and more research is needed, they said.
“These observations highlight that, while disparities in resources and health care delivery inherent to safety-net health systems may partly explain and provide opportunities to improve cirrhosis hospitalization care, they alone do not explain all of the ethnic disparities in cirrhosis outcomes observed,” they concluded.
The current study was important to conduct at this time because rates of cirrhosis are on the rise, Michael Volk, MD, of Loma Linda (Calif.) University Health, said in an interview. “Millions of patients receive care in safety-net hospitals across the country.”
Dr. Volk said that he was not surprised by the overall outcomes. “Unfortunately, I expected that patient outcomes would be worse at safety-net hospitals than wealthier hospitals. However, I was surprised that Blacks had higher in-hospital mortality than Whites, even after adjusting for the hospital.”
Dr. Volk echoed the study’s stated limitation of the lack of data to address disparities.
“Additional research is needed to determine whether the higher in-hospital mortality among Blacks is related to biological differences such as differential rates of disease progression, or social differences such as access to outpatient care,” he said.
The study received no outside funding. The researchers had no financial conflicts to disclose. Dr. Volk had no relevant financial conflicts to disclose.
Patients with cirrhosis treated at hospitals with the highest safety-net burden, defined by their proportion of Medicaid or uninsured patients, had a 5% higher mortality rate than patients who were treated at hospitals with the lowest burden, according to a study of over 300,000 patients.
The study, which was published in the Journal of Clinical Gastroenterology, analyzed inpatient data from the National Inpatient Sample (NIS) database focusing on a 4-year time span between 2012 and 2016. The hospitals were categorized by safety-net burden, which was defined as having either a high, medium, or low number of uninsured patients or patients with Medicaid.
This is the first-known study to evaluate the impact of a hospital’s safety-net burden on hospitalization outcomes in cirrhosis patients, wrote authors Robert J. Wong, MD, MS, of Stanford (Calif.) University and Grishma Hirode, MAS, of the University of Toronto. Previous studies have shown that safety-net hospitals, especially those with a high safety-net burden, have poorer patient outcomes. These hospitals also serve a patient population that is at high risk for chronic liver disease and cirrhosis.
The new analysis included 322,944 individual hospitalizations of patients with cirrhosis. Of these, 57.8% were male, 63.7% were White, 9.9% were Black, and 15.6% were Hispanic. In terms of safety-net burden, 107,446 hospitalizations were at high-burden hospitals, 103,508 were at medium-burden hospitals, and 111,990 hospitalizations were at low-burden hospitals.
Overall, cirrhosis-related hospitalizations in hospitals with the highest burden were found to have significantly greater odds of in-hospital mortality than the lowest tertile hospitals (odds ratio, 1.05, P = .044). The patients were also younger (mean age, 56.7 years vs. 59.8 years in low-burden hospitals). They also had a higher proportion of male patients, minority patients, Hispanic patients, and patients with Medicaid or no insurance.
The odds of hospitalization in the highest tertile hospitals were found to be significantly higher, compared with the middle and lowest tertiles for Blacks and Hispanics, compared with Whites (OR 1.26 and OR 1.63, respectively). Black patients (OR, 1.26; 95%CI, 1.17-1.35; P < .001) and Hispanic patients (OR, 1.63; 95% CI, 1.50-1.78; P< .001) were more likely to be admitted for care at high-burden hospitals (26% to 54%). In-hospital mortality rates among all hospitalizations were 5.95% and the rate did not significantly differ by hospital burden status.
“Despite adjusting for safety-net burden, our study continued to demonstrate ethnic disparities in in-hospital mortality among cirrhosis-related hospitalizations,” the researchers wrote. Overall, the odds of in-hospital mortality were 27% higher in Black patients as compared with White patients.
However, significantly lower mortality was observed in Hispanic patients as compared with White patients (4.9% vs. 6.0%, P < .001), but why this occurred was not entirely clear. “Hispanic patients may be more likely to have NASH [nonalcoholic steatohepatitis]-related cirrhosis, which generally has a slower disease progression, compared with [hepatitis C virus] or alcoholic cirrhosis. As such, it is likely that NASH-cirrhosis Hispanic patients had less severe disease at presentation,” the researchers wrote.
Study design has limitations, but shows concerning trends
The study findings were limited by several factors including the inability to show causality based on the observational study design and cross-sectional nature of the database, the researchers said. The NIS database records individual hospitalizations, not individual patient data which means that it may include repeat hospitalizations from the same patient. In addition, the study was limited by a lack of data on outpatient cirrhosis outcomes and non–liver-related comorbidities.
However, the finding that ethnic minorities with cirrhosis were significantly more likely to be hospitalized in high safety-net hospitals than White patients is concerning, and more research is needed, they said.
“These observations highlight that, while disparities in resources and health care delivery inherent to safety-net health systems may partly explain and provide opportunities to improve cirrhosis hospitalization care, they alone do not explain all of the ethnic disparities in cirrhosis outcomes observed,” they concluded.
The current study was important to conduct at this time because rates of cirrhosis are on the rise, Michael Volk, MD, of Loma Linda (Calif.) University Health, said in an interview. “Millions of patients receive care in safety-net hospitals across the country.”
Dr. Volk said that he was not surprised by the overall outcomes. “Unfortunately, I expected that patient outcomes would be worse at safety-net hospitals than wealthier hospitals. However, I was surprised that Blacks had higher in-hospital mortality than Whites, even after adjusting for the hospital.”
Dr. Volk echoed the study’s stated limitation of the lack of data to address disparities.
“Additional research is needed to determine whether the higher in-hospital mortality among Blacks is related to biological differences such as differential rates of disease progression, or social differences such as access to outpatient care,” he said.
The study received no outside funding. The researchers had no financial conflicts to disclose. Dr. Volk had no relevant financial conflicts to disclose.
FROM THE JOURNAL OF CLINICAL GASTROENTEROLOGY
Long-acting injectable antipsychotics deserve first-line consideration
Long-acting injectable (LAI) antipsychotic therapies continue to be largely reserved for patients who already have adherence issues. But most patients, including first-episode patients, should be considering drugs with this mode of delivery for their broad array of advantages, according to an overview presented by Current Psychiatry and the American Academy of Clinical Psychiatrists.

“Due to the perception that long-acting injectables are for coercive applications, patients are not hearing about the many reasons this option might be preferable,” reported Diana Perkins, MD, MPH, professor, department of psychiatry, University of North Carolina, Chapel Hill.
According to Dr. Perkins, patients starting treatment for first-episode schizophrenia are particularly unlikely to even hear about injectable therapies even though “these might be the best candidates.”
The advantage of LAI in first-episode patients is that it takes adherence off the table as a risk for treatment failure. Ultimately, many patients educated about LAI in the context of other options, prefer LAI, according to Dr. Perkins, and she provided data to support these assertions.
Of several published articles reporting that patients fail to discuss LAI with patients, one was published last year (J Clin Psychopharmacol. 2020 Jul/Aug;40:346-9). For evidence that patients prefer LAI over pills for antipsychotic treatment, Dr. Perkins cited a study with data from more than 1,400 patients (Patient Prefer Adherence. 2020;14:1093-102).
In this latter analysis, 77% of patients preferred LAI over pills, Dr. Perkins reported at the virtual meeting, presented by MedscapeLive. Moreover, 50% of patients preferred every-3-month injections over monthly injections. For those who preferred LAI, the reasons included the convenience of avoiding daily therapy but also the empowerment derived from feeling healthier from not having to depend on a daily schedule of treatment.
LAI has benefits independent of adherence
“Some patients prefer injectables because the daily pills remind them of their illness even when they are feeling well,” Dr. Perkins said.
By eliminating pills and pill bottles, injections also provide a certain degree of confidentiality, said Dr. Perkins. She said that LAI, which avoids the peaks and troughs inherent in pill taking, provides more consistent drug levels even to the degree that doses can sometimes be lowered and adverse events reduced.
Yet, of all the reasons that patients might want to consider LAI, the most compelling is a lower risk of failure from inadequate adherence to daily pills. The evidence that patients do not take daily pills for chronic diseases, whether schizophrenia or any other illness that requires maintenance regimens for persistent disease control, is extensive and overwhelming, according to Dr. Perkins, who cited multiple studies.
For schizophrenia, with a relapsing and remitting pattern of symptoms, poor adherence is a particular risk. When symptoms abate, the cue and motivation for adherence dissipates.
“Most patients with schizophrenia already have some ambivalence about taking their medication.
When patients forget their daily pills or when the they decide to skip doses when they feel well, they do not necessarily tell their physicians.
Poor adherence often goes unrecognized
“Clinicians are not very good at estimating adherence in their patients,” Dr. Perkins said. While she listed several strategies to help patients adhere to daily pills, she also said that LAI should not be discounted as a means to circumvent this problem altogether.
Importantly, suboptimal adherence by itself places the patient at a high risk for relapse. In one study of partial adherence, delayed doses were associated with increased risk of hospitalization overall, but each increment in further delay led to still more risk (Psychiatr Serv. 2004;55:886-91).
Imperfect adherence to daily pills is very common. In one study evaluating 34,000 veterans with schizophrenia, the proportion with consistently good adherence over the 12 months of study was not quite 40% (J Clin Psychiatry. 2006 Oct;67[10]:1542-50). While most of the remaining were intermittently adherent, more than 15% of the populations was consistently poorly adherent.
Simple regimens and adherence closely linked
In general, the simpler the regimen, the greater the adherence, according to Dr. Perkins. For oral therapies, one pill per day is associated with greater adherence than is more than one. LAI, which is even simpler, is consistently associated with a large relative advantage. In one comparative study, 77% were adherent to LAI versus about 30% (P < .001) over a period of 12 months (Ment Health Clin. 2018 Mar 26;8[2]:56-62).
In a large recently published meta-analysis, LAI was associated with objective advantages over oral therapy (Lancet Psychiatry. 2021 May 1;8:[5]387-404). This included a statistically significant lower risk of hospitalizations or relapses for LAI over oral therapy whether the two modes of delivery were compared in randomized controls studies (RR 0.88; P = .033) or cohort studies (RR 0.92; P = .0044).
Overall, clinicians should discard several false assumptions about LAI, including the fact they are not appropriate in first-episode disease and that patients will not elect to take LAI if informed of the choices, according to Dr. Perkins. Rather than just listing LAI among options, Dr. Perkins suggested that clinicians should specifically explain the many advantages.
“When people say I do not like shots, this is not necessarily a no,” she said. If patients understand the potential for a reduced risk of relapse without having to take a daily pill, injections might be preferable whether or not they like shots in particular.
This is not an isolated view among experienced physicians. John M. Kane, MD, chairman of psychiatry, Zucker Hillside Hospital, Northwell Health, Glen Oaks, N.Y., also sees LAI as method of drug delivery that should be considered widely in schizophrenia.
“I am in complete agreement with Dr. Perkins that long-acting injectable formulations of antipsychotic medications should be presented routinely to patients and families as an option for illness management and relapse prevention,” said Dr. Kane, who was a coauthor of the meta-analysis published in Lancet Psychiatry.
“This would include patients early in the course of illness who currently have an unnecessarily high risk of relapse and hospitalization,” he added.
MedscapeLive and this news organization are owned by the same parent company. Dr. Perkins has a financial relationship with Alkermes. Dr. Kane has financial relationships with Abbott, AstraZeneca, Bristol-Myers Squibb, Janssen, Lilly, Otsuka, Pfizer, and Wyeth.
Long-acting injectable (LAI) antipsychotic therapies continue to be largely reserved for patients who already have adherence issues. But most patients, including first-episode patients, should be considering drugs with this mode of delivery for their broad array of advantages, according to an overview presented by Current Psychiatry and the American Academy of Clinical Psychiatrists.
“Due to the perception that long-acting injectables are for coercive applications, patients are not hearing about the many reasons this option might be preferable,” reported Diana Perkins, MD, MPH, professor, department of psychiatry, University of North Carolina, Chapel Hill.
According to Dr. Perkins, patients starting treatment for first-episode schizophrenia are particularly unlikely to even hear about injectable therapies even though “these might be the best candidates.”
The advantage of LAI in first-episode patients is that it takes adherence off the table as a risk for treatment failure. Ultimately, many patients educated about LAI in the context of other options, prefer LAI, according to Dr. Perkins, and she provided data to support these assertions.
Of several published articles reporting that patients fail to discuss LAI with patients, one was published last year (J Clin Psychopharmacol. 2020 Jul/Aug;40:346-9). For evidence that patients prefer LAI over pills for antipsychotic treatment, Dr. Perkins cited a study with data from more than 1,400 patients (Patient Prefer Adherence. 2020;14:1093-102).
In this latter analysis, 77% of patients preferred LAI over pills, Dr. Perkins reported at the virtual meeting, presented by MedscapeLive. Moreover, 50% of patients preferred every-3-month injections over monthly injections. For those who preferred LAI, the reasons included the convenience of avoiding daily therapy but also the empowerment derived from feeling healthier from not having to depend on a daily schedule of treatment.
LAI has benefits independent of adherence
“Some patients prefer injectables because the daily pills remind them of their illness even when they are feeling well,” Dr. Perkins said.
By eliminating pills and pill bottles, injections also provide a certain degree of confidentiality, said Dr. Perkins. She said that LAI, which avoids the peaks and troughs inherent in pill taking, provides more consistent drug levels even to the degree that doses can sometimes be lowered and adverse events reduced.
Yet, of all the reasons that patients might want to consider LAI, the most compelling is a lower risk of failure from inadequate adherence to daily pills. The evidence that patients do not take daily pills for chronic diseases, whether schizophrenia or any other illness that requires maintenance regimens for persistent disease control, is extensive and overwhelming, according to Dr. Perkins, who cited multiple studies.
For schizophrenia, with a relapsing and remitting pattern of symptoms, poor adherence is a particular risk. When symptoms abate, the cue and motivation for adherence dissipates.
“Most patients with schizophrenia already have some ambivalence about taking their medication.
When patients forget their daily pills or when the they decide to skip doses when they feel well, they do not necessarily tell their physicians.
Poor adherence often goes unrecognized
“Clinicians are not very good at estimating adherence in their patients,” Dr. Perkins said. While she listed several strategies to help patients adhere to daily pills, she also said that LAI should not be discounted as a means to circumvent this problem altogether.
Importantly, suboptimal adherence by itself places the patient at a high risk for relapse. In one study of partial adherence, delayed doses were associated with increased risk of hospitalization overall, but each increment in further delay led to still more risk (Psychiatr Serv. 2004;55:886-91).
Imperfect adherence to daily pills is very common. In one study evaluating 34,000 veterans with schizophrenia, the proportion with consistently good adherence over the 12 months of study was not quite 40% (J Clin Psychiatry. 2006 Oct;67[10]:1542-50). While most of the remaining were intermittently adherent, more than 15% of the populations was consistently poorly adherent.
Simple regimens and adherence closely linked
In general, the simpler the regimen, the greater the adherence, according to Dr. Perkins. For oral therapies, one pill per day is associated with greater adherence than is more than one. LAI, which is even simpler, is consistently associated with a large relative advantage. In one comparative study, 77% were adherent to LAI versus about 30% (P < .001) over a period of 12 months (Ment Health Clin. 2018 Mar 26;8[2]:56-62).
In a large recently published meta-analysis, LAI was associated with objective advantages over oral therapy (Lancet Psychiatry. 2021 May 1;8:[5]387-404). This included a statistically significant lower risk of hospitalizations or relapses for LAI over oral therapy whether the two modes of delivery were compared in randomized controls studies (RR 0.88; P = .033) or cohort studies (RR 0.92; P = .0044).
Overall, clinicians should discard several false assumptions about LAI, including the fact they are not appropriate in first-episode disease and that patients will not elect to take LAI if informed of the choices, according to Dr. Perkins. Rather than just listing LAI among options, Dr. Perkins suggested that clinicians should specifically explain the many advantages.
“When people say I do not like shots, this is not necessarily a no,” she said. If patients understand the potential for a reduced risk of relapse without having to take a daily pill, injections might be preferable whether or not they like shots in particular.
This is not an isolated view among experienced physicians. John M. Kane, MD, chairman of psychiatry, Zucker Hillside Hospital, Northwell Health, Glen Oaks, N.Y., also sees LAI as method of drug delivery that should be considered widely in schizophrenia.
“I am in complete agreement with Dr. Perkins that long-acting injectable formulations of antipsychotic medications should be presented routinely to patients and families as an option for illness management and relapse prevention,” said Dr. Kane, who was a coauthor of the meta-analysis published in Lancet Psychiatry.
“This would include patients early in the course of illness who currently have an unnecessarily high risk of relapse and hospitalization,” he added.
MedscapeLive and this news organization are owned by the same parent company. Dr. Perkins has a financial relationship with Alkermes. Dr. Kane has financial relationships with Abbott, AstraZeneca, Bristol-Myers Squibb, Janssen, Lilly, Otsuka, Pfizer, and Wyeth.
FROM CP/AACP PSYCHIATRY UPDATE
Diaphragmatic endometriosis diagnosed many years after symptom onset
Diaphragmatic endometriosis is often diagnosed several years after the start of symptoms – mainly moderate to severe pain – and this is potentially because of general lack of awareness of diaphragmatic endometriosis among the general population and medical professionals.
Findings of the international survey that explored the diagnosis and treatment of diaphragmatic endometriosis were presented at this year’s Royal College of Obstetricians and Gynecologists 2021 Virtual World Congress by medical student Rachel Piccus, MSc, based at the University of Birmingham (England). Robert Sutcliffe, MD, consultant in hepatobiliary and pancreatic surgery, at Queen Elizabeth Hospital Birmingham was senior author. Results were also published in the May 2021 issue of the European Journal of Obstetrics and Gynaecology and Reproductive Biology.
The study found that it took an average of five visits to a primary physician before referral to a gynecologist.
“Late diagnosis could also be due to the idea that diaphragmatic endometriosis symptoms often present before pelvic symptoms and therefore the site of pain is considered atypical for pelvic endometriosis,” Ms. Piccus said, adding that “clinicians are screening for cyclical pain, which is typical of endometriosis, but our study has shown that pain can in fact be more frequent – daily and weekly.”
These significant diagnostic delays, seen from the time of the initial primary care and gynecology consultation has the potential to significantly affect quality of life as seen in pelvic endometriosis, said Ms. Piccus. “These delays are partly due to a lack of awareness among gynecologists, but could also be due to pelvic laparoscopy being insufficient to examine the diaphragm behind the liver.”
Justin Clark, MD, consultant gynaecologist, Birmingham (England) Women’s and Children Hospital, moderated the session and agreed that the study highlights the need for greater awareness of this variant of endometriosis. “Whilst endometriosis affecting the diaphragm, subdiaphragm, and thorax is rare, the condition causes substantial morbidity.”
“Greater knowledge of thoracic endometriosis amongst clinicians in both primary and secondary care is needed to ensure accurate and timely diagnosis,” he added.
Diaphragmatic endometriosis is estimated to affect 1%-1.5% of all endometriosis patients and presents as cyclical pain in the chest, abdomen, and shoulder tip, as well as other respiratory symptoms such as catamenial pneumothorax and difficulty breathing.
“Cross-sectional imaging has shown low sensitivity so upper abdominal laparoscopy is the gold standard; however, this has implications for diagnostic delay because a strong clinical suspicion is required to refer for this invasive procedure,” explained Ms. Piccus referring to one of the reasons underpinning the need for the study.
When successfully diagnosed, treatment requires excision or ablation surgery and studies show symptomatic relief in 75%-100% of cases.
To gauge the extent of delayed diagnosis as well as treatment outcomes from a patient perspective, Ms. Piccus circulated an anonymous online survey among women with a previous history of surgery for diaphragmatic endometriosis.
Diaphragmatic endometriosis pain – daily and weekly as well as cyclical
A total of 137 participants responded to the survey, with a median age of 34 years (range, 19-53). Median age of diaphragmatic endometriosis onset was 27 years (range, 11-50), and importantly, diaphragmatic endometriosis symptoms started before pelvic symptoms in 90 respondents (66%).
The dominant symptom was pain. A total of 38% reported cyclical pain (related to endometrial shedding during menstruation), 15% weekly pain, and 47% daily pain, both of which were worse during the menstrual cycle. Furthermore, 14% reported other symptoms including catamenial pneumothorax, difficulty breathing, and hemoptysis.
“Whilst this cyclical pain is typical of endometriosis, we see that diagnostic delays may be due to misdiagnosis because clinicians are screening for this cyclical pain whilst our study has shown that pain can in fact be more frequent, being daily and weekly,” noted Ms. Piccus. Moderate to severe pain was reported in 67% of respondents and moderate in 31%, only 2% reported pain as mild.
Location of pain comprised moderate to severe pain in the upper abdomen (68%), chest (64%) and shoulder (54%). Pain was right-sided in 54%, left-sided in 11% and bilateral in 35%. Upper back and neck were also reported as sites of pain.
Indirectly providing a measure of the lack of awareness of diaphragmatic endometriosis on behalf of primary care, 122 participants reported initially visiting their primary care physician for help and 65 were given a diagnosis – in only 14 cases was that diaphragmatic endometriosis. There were a range of other gynecologic (e.g. ovarian cyst, two), respiratory (spontaneous pneumothorax, seven), gastrointestinal (gastritis/reflux, eight), musculoskeletal (six), and psychological (anxiety/stress, four) diagnoses.
A median of 5 primary care consultations (range, 1-100) were required before referral to a gynecologist, with 30% seeing a primary care physician over 10 times. A further 14 patients self-referred to gynecologist.
“These findings have implications for diagnostic delay, added Ms. Piccus. “While the majority of respondents were diagnosed less than a year from the first GP visit, the median delay was 2 years, with 31% diagnosed after 5 or more years. One took 23 years for an initial diagnosis.”
Most cases were diagnosed at the time of surgery – 93%, with 52% at pelvic laparoscopy, 35% upper abdominal laparoscopy, with 30% requiring two or more laparoscopies before they were diagnosed with diaphragmatic endometriosis. A total of 7% were diagnosed via cross-sectional imaging prior to surgery.
Treatment outcomes for diaphragmatic endometriosis
Reflecting the literature, surgery to remove the endometriosis lesions was mainly laparoscopic with 47% abdominal excisions, and 29% abdominal ablations; 6% received open abdominal procedures, and 18% received open thoracotomy or video-assisted thoracoscopic surgery.
The survey asked about postoperative symptoms 6 months after surgery and at the time of survey. Symptoms at 6 months post surgery had completely resolved in 18%, shown significant improvement in 48%, and no improvement in 20%. Worsening of symptoms was seen in 14%. Long-term pain was reported by 21% as severe, 27% as moderate, 35% as mild, and 17% had no symptoms.
Further findings included that 23% underwent additional procedures to treat their diaphragmatic endometriosis, and that there was no significant difference between excision and ablation, nor between age of onset of symptoms or length of diagnostic delay.
“Surgical treatment to remove these extra pelvic deposits of endometriosis will depend upon the type and distribution of thoracic endometriosis and a variety of surgical specialties may need to be involved including gynecologists, cardiothoracic, and upper gastrointestinal/liver surgeons,” Dr. Clark said.
He added that familiar hormonal medical treatments for more typical pelvic endometriosis should also be considered for primary and maintenance treatment. “These data suggest a high symptomatic recurrence rate after surgical treatment and so medical treatments should be considered to try and minimize the risks of endometriosis symptoms returning.”
Dr. Clark also pointed out that multidisciplinary clinical teams should be established in specialized centers to plan surgical and medical management to enhance clinical outcomes and collect data to better understand this enigmatic condition.
Ms. Piccus and Dr. Clark have no relevant conflicts of interest.
Allergic conjunctivitis severely affects children’s quality of life
Allergic conjunctivitis harms quality of life for children and their parents, apparently causing greater day-to-day worries than potentially blinding diseases, researchers report.
Parents worry especially that treatments might not be effective, according to Shi-yao Zhang, MD, and colleagues from Sun Yat-sen University, Guangzhou, China. “This finding suggests that more communication with parents regarding treatment and prognosis is needed,” they write in an article published online June 10 in JAMA Ophthalmology.
One of the most prevalent eye disorders in children, allergic conjunctivitis is often chronic, leading patients to ask repeatedly for help from physicians. It can take an emotional toll and can cause children to miss school.
“With any sign of a slightly pink eye [or a] runny nose, which are very common with allergies, children are being sent home, because everyone’s concerned about COVID,” said Yi Ning J. Strube, MD, an associate professor of ophthalmology and pediatrics at Queen’s University, Kingston, Canada, whose commentary appears in the same issue of JAMA Ophthalmology.
Adolescents are also sometimes accused of smoking cannabis because of their red eyes, she said.
However, little research has examined the effects of allergic conjunctivitis on the quality of life of children and their guardians, Dr. Zhang and colleagues write. To fill that gap, the researchers administered the Pediatric Quality of Life Inventory (PedsQL) to 92 children with allergic conjunctivitis and their parents. The children were aged 5 to 18 years.
The researchers administered the same questionnaire to 96 healthy children of the same ages, along with their parents. These participants served as a control group.
On a scale of 0 to 100, in which a higher score signifies a better quality of life, the median total PedsQL score was 69.6 for children with allergic conjunctivitis versus 96.7 for the control group.
Subscores of physical, emotional, social, and especially school functioning were all significantly lower for the children with allergic conjunctivitis than for the control persons. “Because children generally spend most of their time in the school environment, this outcome raises an issue regarding whether children have a poorer performance in their education,” Dr. Zhang and colleagues write.
Dr. Strube recommends that physicians educate their patients about allergic conjunctivitis using handouts or high-quality websites. She often refers patients and their families to the allergic conjunctivitis webpage of the American Academy of Pediatric Ophthalmology and Strabismus.
She tells parents to have their child “take a shower and wash their hair when they get home before they rub their pollen-filled hair on their pillowcase and make their allergy symptoms worse.”
Parents and schools should try to filter pollen and other allergens from indoor air, she added.
Parents of the children with allergic conjunctivitis in the study also reported lower quality of life; they scored 68.8, versus 96.5 for parents of children in the control group. The differences for both parents and children were statistically significant (P < .001). Overall, the parents’ quality-of-life scores correlated with their children’s (correlation coefficient, r = 0.59; P < .001).
Children with vernal or atopic keratoconjunctivitis scored 3.3 points lower on health-related quality of life than those with seasonal allergic conjunctivitis.
Children with higher corneal fluorescein staining scores also had lower quality-of-life scores. Parents whose children had higher corneal fluorescein staining scores and also those who had multiple consultations with health care practitioners also reported lower quality of life.
The quality-of-life scores of the children with allergic conjunctivitis were lower than scores in previous studies for children with vision-threatening diseases, such as glaucoma and congenital cataract. This may be because glaucoma and cataracts do not typically cause discomfort even if they impair the patient’s vision, said Dr. Strube.
She pointed out one potential flaw in the study: In the cohort with allergic conjunctivitis, 83.7% were boys, compared to 42.7% of the control group. Vernal keratoconjunctivitis affects more boys than girls, and not controlling for this factor could have confounded the data, Dr. Strube said.
It could also be useful to replicate the study in other countries to see whether geographic or cultural factors affected the results, she said. “A lot of these big centers around the world, including in China, have poor air quality, so that may be contributing to patients’ symptoms,” she said. “With regards to reported health quality of life and impact on education, results from different parts of the world may be different, due to parenting styles and education styles,” she said.
The study was supported by the National Natural Science Foundation of China and the Science Foundation of Guangdong Province. Dr. Zhang and colleagues reported no relevant financial relationships. Dr. Strube reported receiving personal fees from Santen Canada Advisory Board Consultant outside the submitted work.
A version of this article first appeared on Medscape.com.
Americans’ sun protection practices fall short of intentions
commissioned by the American Academy of Dermatology.
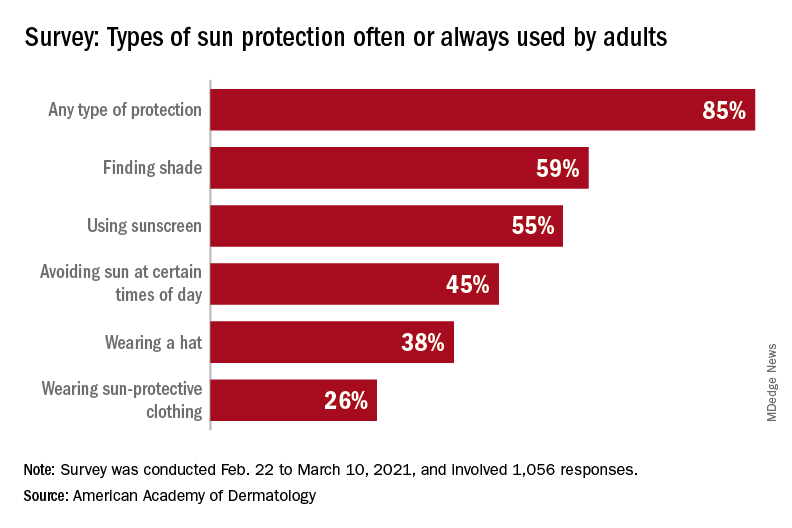
With the pandemic seemingly behind it, the United States enters the summer months facing the paradox of sun protection. Four out of five adults know that sunscreen should be reapplied every 2 hours when they’re outdoors, but only one in three make the actual effort, and 77% are likely to use sunscreen at the beach or a pool, compared with 41% when they’re gardening or working outside on their homes, the AAD reported.
“These findings are surprising and seem to suggest that many people do not take skin cancer seriously or perhaps believe skin cancer won’t happen to them,” Robert T. Brodell, MD, professor of dermatology at the University of Mississippi Medical Center, Jackson, said in a written statement from the AAD, adding that “unprotected exposure to ultraviolet rays is the most preventable risk factor for skin cancer, including melanoma.”
A quarter of all survey respondents reported getting sunburned in 2020, with the youngest adults most likely to feel the wrath of the sun. Sunburn was reported by 43% of those aged 18-23 years, 37% of those aged 24-39, 25% of the 40- to 55-year-olds, 12% of the 56- to 74-year-olds, and 7% of those aged 75 and older. More than a quarter of those who got sunburned said that it was bad enough to make their clothes feel uncomfortable, the academy said.
“Americans see the damaging effects of the sun on their skin as they get older, and two out of three look back and wish they had been more careful. But when it comes to cancer, specifically, most feel unconcerned in spite of their own risk,” according to a statement from Versta Research, which conducted the poll on behalf of the AAD. The survey was conducted from Feb. 22 to March 10, 2021, and involved 1,056 respondents, with a ±3% margin of error.
The lack of concern for skin cancer looks like this: More than two-thirds of the respondents (69%) have at least one possible risk factor – lighter skin tone, blue or green eyes, more than 50 moles, family history – but only 36% expressed concern about developing it. “Indeed, half of survey respondents (49%) say they are more worried about avoiding sunburn than they are about preventing skin cancer, and a third (32%) are more worried about avoiding premature wrinkles than they are about preventing cancer,” the AAD said.
The AAD is considering the creation of a social media quiz or interactive tool, and if the results of this survey were recast as a potential “Knowledge and Awareness Quiz” and graded with a traditional scheme (A = 90%-100%, B = 80%-89%, etc.), then 34% of the respondents would have failed, 15% would have gotten a D, and only 5% would have earned an A, the academy noted.
commissioned by the American Academy of Dermatology.
With the pandemic seemingly behind it, the United States enters the summer months facing the paradox of sun protection. Four out of five adults know that sunscreen should be reapplied every 2 hours when they’re outdoors, but only one in three make the actual effort, and 77% are likely to use sunscreen at the beach or a pool, compared with 41% when they’re gardening or working outside on their homes, the AAD reported.
“These findings are surprising and seem to suggest that many people do not take skin cancer seriously or perhaps believe skin cancer won’t happen to them,” Robert T. Brodell, MD, professor of dermatology at the University of Mississippi Medical Center, Jackson, said in a written statement from the AAD, adding that “unprotected exposure to ultraviolet rays is the most preventable risk factor for skin cancer, including melanoma.”
A quarter of all survey respondents reported getting sunburned in 2020, with the youngest adults most likely to feel the wrath of the sun. Sunburn was reported by 43% of those aged 18-23 years, 37% of those aged 24-39, 25% of the 40- to 55-year-olds, 12% of the 56- to 74-year-olds, and 7% of those aged 75 and older. More than a quarter of those who got sunburned said that it was bad enough to make their clothes feel uncomfortable, the academy said.
“Americans see the damaging effects of the sun on their skin as they get older, and two out of three look back and wish they had been more careful. But when it comes to cancer, specifically, most feel unconcerned in spite of their own risk,” according to a statement from Versta Research, which conducted the poll on behalf of the AAD. The survey was conducted from Feb. 22 to March 10, 2021, and involved 1,056 respondents, with a ±3% margin of error.
The lack of concern for skin cancer looks like this: More than two-thirds of the respondents (69%) have at least one possible risk factor – lighter skin tone, blue or green eyes, more than 50 moles, family history – but only 36% expressed concern about developing it. “Indeed, half of survey respondents (49%) say they are more worried about avoiding sunburn than they are about preventing skin cancer, and a third (32%) are more worried about avoiding premature wrinkles than they are about preventing cancer,” the AAD said.
The AAD is considering the creation of a social media quiz or interactive tool, and if the results of this survey were recast as a potential “Knowledge and Awareness Quiz” and graded with a traditional scheme (A = 90%-100%, B = 80%-89%, etc.), then 34% of the respondents would have failed, 15% would have gotten a D, and only 5% would have earned an A, the academy noted.