User login
Powering down cellphone use in middle schools
As vice principal of Pennsville Middle School in New Jersey, Adam J. Slusher knows he’s not always going to be Mr. Popularity.
Part of a vice principal’s job includes scheduling, enforcing policy, and discipline, so Dr. Slusher – who holds a doctorate in education from Wilmington University in Delaware – sometimes has to send emails or make phone calls that address unpleasant topics or unpopular new policies.
Or punishments.
But there was a much different reaction this past July, after he sent a message to the homes of Pennsville’s 450 students spanning grades 6 to 8. The email blast announced a new cellphone policy for the school. Starting in September, as he explained in the message – which also went out to the school’s 60 faculty and staff members – the use of cellphones by Pennsville students would be prohibited during school hours for any reason.
Phones, he emphasized, “are to be turned OFF” and stowed away in backpacks or handbags, not carried or tucked into back pockets.
The announcement of the new Away for the Day policy, which was decided upon by Dr. Slusher and Pennsville Principal Carolyn Carels, provoked a response different from those to his announcements on, say, test dates, emergency procedures, or new detention policies.
“It was one of the most popular emails I’ve ever sent,” chuckled Dr. Slusher, who has been an educator for 17 years. “We’ve gotten so many thanks from teachers for this.”
Ditto with the staff, who in conversations with Dr. Slusher and Ms. Carels, had reported on the rampant use of phones in the cafeteria and hallways – confirming what both of them had seen.
“They were telling us, ‘You’ve got to do something about the phones’ ” he recalled. “They were delighted that a clear policy was now going to be in place.”
The overwhelming majority of Pennsville parents have also supported the new policy, especially when presented with some of the sobering evidence about the extent of phone use among this population. One study Dr. Slusher cited in his email showed that the average middle school child is spending between 6 and 9 hours a day on screens.
“That’s like a full-time job,” he said.
The heavy cellphone use by kids – in school, out of school, anywhere and everywhere – was part of what prompted internal medicine doctor and filmmaker Delaney Ruston, MD, to create the “Away for the Day” initiative, which Pennsville has adopted.
She and collaborator Lisa Tabb were driven to do “Away for the Day” while working on Screenagers, their award-winning 2016 film examining the impact of social media, videos, and screen time on youngsters and their families that also offered tips for better navigating the digital world.
“Over 3 years of making the film, I was visiting schools all over the country,” Dr. Ruston said. “By the end, I was seeing devices all over the place, even in elementary schools. When I’d ask a student in the hall, ‘What’s the policy?’ they would shrug and say ‘I don’t know.’ When I got the same reaction from teachers – who in many cases were left to decide on their own, so that they had to be the bad guys – I realized there was a problem here.”
The result was what Dr. Ruston and Ms. Tabb describe on their website as a “movement,” designed to provide tools to parents, teachers, and administrators to help them make policies that put phones away during the school day.
The age of social centrality
As even a casual glance in the homeroom of every high school or college lecture hall will confirm, phone use is high in teenagers and young adults. But Dr. Ruston and Ms. Tabb decided to focus on middle schools.
“That’s the age where we know schools are facing the most challenges,” Dr. Ruston said. “This is also the age when social centrality becomes a major focus for youth. Thus, the pull to be on social media games, where their peers are, is incredibly enticing.”
A recent study in the journal JAMA Pediatrics found that middle schoolers who compulsively check social networks on their phones appear to have changes in areas of the brain linked to reward and punishment.
It was in middle schools, she concluded, “where effective policies on cellphones are most needed.”
As part of their research into the issue, she and ms. Tabb did a survey using email contacts collected by Dr. Ruston’s company, MyDoc Productions, during the making of the film, along with subscribers to her blog. In all, 1,200 parents – each of whom had at least one child in middle school at the time – were surveyed. The researchers found an interesting disconnect: Eighty-two percent of the parents surveyed did not want their children using phones in school. Yet 55% of middle schools allowed students to carry phones during the school day.
That survey was done in 2017. Since the COVID-19 pandemic, the use of cellphones by children, both in school and at home, has risen dramatically. A literature review of 46 studies, published in JAMA Pediatrics in November, found that average screen time among children and adolescents has increased by 52% – or 84 minutes a day – during the pandemic.
That trend has given many schools, including Pennsville, the drive to adopt an Away for the Day–type policy. As part of the program, Dr. Ruston’s website provides ammunition against the kinds of pushback they might expect to get. One of the most common is the idea that banning cellphone use among middle school children is a misguided, antitechnology measure.
“We’re not at all antitech,” Dr. Ruston asserts. Away for the Day, she explains, advocates the use of learning technologies in school that are monitored and supervised by teachers.
“The majority of students have access to learning devices in the school,” she said. “These have different kinds of blockers, making it harder for their kid to respond to their friend on TikTok when they’re supposed to be using technology for learning.”
Dr. Ruston estimates that about 10,000 middle schools are now using various pieces of the Away for the Day campaign, which includes videos, posters, fact sheets, and other materials. Other schools have adopted similar measures in the same spirit.
Predictable and calm? Not so much
When Katherine Holden was named principal of Oregon’s Talent Middle School in 2022, one of the first things she wanted to do was create some structure for the routines of students (and parents) who were frazzled after 2 years of remote learning, staggered schedules, and mask mandates.
“Predictable and calm,” she said, with a laugh. “I use those words every day.”
Achieving both is hard enough in a middle school without a pandemic – not to mention an epidemic of cellphone use. (Talent also endured a massive fire in 2020 that left many families homeless.)
For this school year, Ms. Holden is using a new and clearly articulated policy: “Devices are put away from the first bell to the last bell,” she said. “We want them to have a focus on other things. We want them to be socializing, interacting with their peers face to face, thinking about getting to class. We want them making eye contact, asking questions. Learning how to make a friend face to face. Those are important developmental social skills they should be practicing.”
Instead of scrolling through photos on Instagram, watching trending videos on TikTok, or texting their friends.
Like Dr. Slusher, she announced the new cellphone policy last summer, in a letter sent home to parents along with the list of school supplies their children would need.
“Students are welcome to use their cell phones and personal devices before entering the building prior to 8:30 a.m. and after exiting the school building at 3:10 p.m.,” she wrote. “However, during the school day students’ cellphones and personal devices need to be off and out of sight.
“I think parents generally understand the need for this,” Ms. Holden said. “They’ve watched their children getting distracted at home by these devices, so they have a sense of how a cellphone adds a layer of challenge to learning. And parents are aware of the unkind behavior that often happens online.”
As for the kids themselves? Safe to say the excitement that Dr. Slusher’s email got from Pennsville faculty, staff, and parents didn’t extend to students.
“They don’t like it all, to be honest,” he said. “But they understand it’s for their benefit. When we sold it to them at our beginning-of-the-year meeting, we presented our rationale. From the kids I speak to, I think the majority understand why we’re doing it.”
A version of this article first appeared on WebMD.com.
Sleep complaints in major depression flag risk for other psychiatric disorders
Investigators studied 3-year incidence rates of psychiatric disorders in almost 3,000 patients experiencing an MDE. Results showed that having a history of difficulty falling asleep, early morning awakening, and hypersomnia increased risk for incident psychiatric disorders.
“The findings of this study suggest the potential value of including insomnia and hypersomnia in clinical assessments of all psychiatric disorders,” write the investigators, led by Bénédicte Barbotin, MD, Département de Psychiatrie et d’Addictologie, Assistance Publique-Hôpitaux de Paris, Hôpital Bichat-Claude Bernard, France.
“Insomnia and hypersomnia symptoms may be prodromal transdiagnostic biomarkers and easily modifiable therapeutic targets for the prevention of psychiatric disorders,” they add.
The findings were published online recently in the Journal of Clinical Psychiatry.
Bidirectional association
The researchers note that sleep disturbance is “one of the most common symptoms” associated with major depressive disorder (MDD) and may be “both a consequence and a cause.”
Moreover, improving sleep disturbances for patients with an MDE “tends to improve depressive symptom and outcomes,” they add.
Although the possibility of a bidirectional association between MDEs and sleep disturbances “offers a new perspective that sleep complaints might be a predictive prodromal symptom,” the association of sleep complaints with the subsequent development of other psychiatric disorders in MDEs “remains poorly documented,” the investigators write.
The observation that sleep complaints are associated with psychiatric complications and adverse outcomes, such as suicidality and substance overdose, suggests that longitudinal studies “may help to better understand these relationships.”
To investigate these issues, the researchers examined three sleep complaints among patients with MDE: trouble falling asleep, early morning awakening, and hypersomnia. They adjusted for an array of variables, including antisocial personality disorders, use of sedatives or tranquilizers, sociodemographic characteristics, MDE severity, poverty, obesity, educational level, and stressful life events.
They also used a “bifactor latent variable approach” to “disentangle” a number of effects, including those shared by all psychiatric disorders; those specific to dimensions of psychopathology, such as internalizing dimension; and those specific to individual psychiatric disorders, such as dysthymia.
“To our knowledge, this is the most extensive prospective assessment [ever conducted] of associations between sleep complaints and incident psychiatric disorders,” the investigators write.
They drew on data from Waves 1 and 2 of the National Epidemiological Survey on Alcohol and Related Conditions, a large nationally representative survey conducted in 2001-2002 (Wave 1) and 2004-2005 (Wave 2) by the National Institute on Alcoholism and Alcohol Abuse.
The analysis included 2,864 participants who experienced MDE in the year prior to Wave 1 and who completed interviews at both waves.
Researchers assessed past-year DSM-IV Axis I disorders and baseline sleep complaints at Wave 1, as well as incident DSM-IV Axis I disorders between the two waves – including substance use, mood, and anxiety disorders.
Screening needed?
Results showed a wide range of incidence rates for psychiatric disorders between Wave 1 and Wave 2, ranging from 2.7% for cannabis use to 8.2% for generalized anxiety disorder.
The lifetime prevalence of sleep complaints was higher among participants who developed a psychiatric disorder between the two waves than among those who did not have sleep complaints. The range (from lowest to highest percentage) is shown in the accompanying table.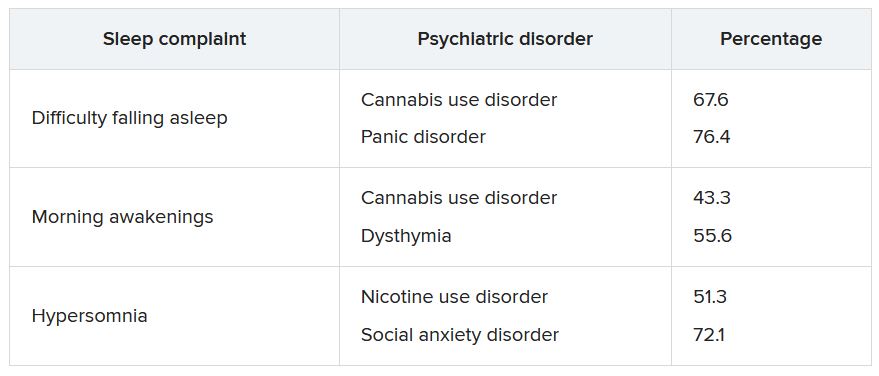
A higher number of sleep complaints was also associated with higher percentages of psychiatric disorders.
Hypersomnia, in particular, significantly increased the odds of having another psychiatric disorder. For patients with MDD who reported hypersomnia, the mean number of sleep disorders was significantly higher than for patients without hypersomnia (2.08 vs. 1.32; P < .001).
“This explains why hypersomnia appears more strongly associated with the incidence of psychiatric disorders,” the investigators write.
After adjusting for sociodemographic and clinical characteristics and antisocial personality disorder, the effects shared across all sleep complaints were “significantly associated with the incident general psychopathology factor, representing mechanisms that may lead to incidence of all psychiatric disorder in the model,” they add.
The researchers note that insomnia and hypersomnia can impair cognitive function, decision-making, problem-solving, and emotion processing networks, thereby increasing the onset of psychiatric disorders in vulnerable individuals.
Shared biological determinants, such as monoamine neurotransmitters that play a major role in depression, anxiety, substance use disorders, and the regulation of sleep stages, may also underlie both sleep disturbances and psychiatric disorders, they speculate.
“These results suggest the importance of systematically assessing insomnia and hypersomnia when evaluating psychiatric disorders and considering these symptoms as nonspecific prodromal or at-risk symptoms, also shared with suicidal behaviors,” the investigators write.
“In addition, since most individuals who developed a psychiatric disorder had at least one sleep complaint, all psychiatric disorders should be carefully screened among individuals with sleep complaints,” they add.
Transdiagnostic phenomenon
In a comment, Roger McIntyre, MD, professor of psychiatry and pharmacology at the University of Toronto, and head of the Mood Disorders Psychopharmacology Unit, noted that the study replicates previous observations that a bidirectional relationship exists between sleep disturbances and mental disorders and that there “seems to be a relationship between sleep disturbance and suicidality that is bidirectional.”
He added that he appreciated the fact that the investigators “took this knowledge one step further; and what they are saying is that within the syndrome of depression, it is the sleep disturbance that is predicting future problems.”
Dr. McIntyre, who is also chairman and executive director of the Brain and Cognitive Discover Foundation in Toronto, was not involved with the study.
The data suggest that, “conceptually, sleep disturbance is a transdiagnostic phenomenon that may also be the nexus when multiple comorbid mental disorders occur,” he said.
“If this is the case, clinically, there is an opportunity here to prevent incident mental disorders in persons with depression and sleep disturbance, prioritizing sleep management in any patient with a mood disorder,” Dr. McIntyre added.
He noted that “the testable hypothesis” is how this is occurring mechanistically.
“I would conjecture that it could be inflammation and/or insulin resistance that is part of sleep disturbance that could predispose and portend other mental illnesses – and likely other medical conditions too, such as obesity and diabetes,” he said.
The study received no specific funding from any funding agency, commercial, or not-for-profit sectors. The investigators’ relevant financial relationships are listed in the original article. Dr. McIntyre has received research grant support from CIHR/GACD/National Natural Science Foundation of China and the Milken Institute; has received speaker/consultation fees from Lundbeck, Janssen, Alkermes,Neumora Therapeutics, Boehringer Ingelheim, Sage, Biogen, Mitsubishi Tanabe, Purdue, Pfizer, Otsuka, Takeda, Neurocrine, Sunovion, Bausch Health, Axsome, Novo Nordisk, Kris, Sanofi, Eisai, Intra-Cellular, NewBridge Pharmaceuticals, Viatris, AbbVie, and Atai Life Sciences; and is a CEO of Braxia Scientific Corp.
A version of this article first appeared on Medscape.com.
FROM THE JOURNAL OF CLINICAL PSYCHIATRY
A remote mountain bike crash forces a doctor to take knife in hand
It started as a mountain biking excursion with two friends. When we drove into the trailhead parking lot, we saw several emergency vehicles. Then a helicopter passed overhead.
Half a mile down the trail, we encountered another police officer. He asked if we would be willing to go back to get an oxygen tank from the ambulance and carry it out to the scene. The three of us turned around, went back to the parking lot and were able to snag a tank of oxygen. We put it in a backpack and biked out again.
We found the scene about a mile down the trail. An adult male was lying on his back in the dirt after a crash. His eyes were closed and he wasn’t moving except for occasional breaths. Six emergency medical personnel huddled around him, one assisting breaths with a bag mask. I didn’t introduce myself initially. I just listened to hear what was happening.
They were debating the dose of medication to give him in order to intubate. I knew the answer to that question, so I introduced myself. They were happy to have somebody else to assist.
They already had an IV in place and quite a lot of supplies. They administered the meds and the paramedic attempted to intubate through the mouth. Within a few seconds, she pulled the intubating blade out and said, “I’m not going to be able to get this. His tongue is too big.”
I took the blade myself and kneeled at the head of the victim. I made three attempts at intubating, and each time couldn’t view the landmarks. I wasn’t sure if his tongue was too large or if there was some traumatic injury. To make it more difficult, a lot of secretions clogged the airway. The paramedics had a portable suction, which was somewhat functional, but I still couldn’t visualize the landmarks.
I started asking about alternative methods of establishing an airway. They had an i-gel, which is a supraglottic device that goes into the back of the mouth. So, we placed it. But when we attached the bag, air still wasn’t getting into the lungs.
We removed it and put the bag mask back on. Now I was worried. We were having difficulty keeping his oxygen above 90%. I examined the chest and abdomen again. I was wondering if perhaps he was having some gastric distention, which can result from prolonged bagging, but that didn’t seem to be the case.
Bagging became progressively more difficult, and the oxygen slowly trended down through the 80s. Then the 70s. Heart rate dropped below 60 beats per minute. The trajectory was obvious.
That’s when I asked if they had the tools for a surgical airway.
No one thought the question was crazy. In fact, they pulled out a scalpel from an equipment bag.
But now I had to actually do it. I knelt next to the patient, trying to palpate the front of the neck to identify the correct location to cut. I had difficulty finding the appropriate landmarks there as well. Frustrating.
I glanced at the monitor. O2 was now in the 60s. Later the paramedic told me the heart rate was down to 30.
One of the medics looked me in the eye and said, “We’ve got to do something. The time is now.” That helped me snap out of it and act. I made my large vertical incision on the front of the victim’s neck, which of course resulted in quite a bit of bleeding.
My two friends, who were watching, later told me this was the moment the intensity of the scene really increased (it was already pretty intense for me, thanks).
Next, I made the horizontal stab incision. Then I probed with my finger, but it seems the incision hadn’t reached the trachea. I had to make the stab much deeper than I would’ve thought.
And then air bubbled out through the blood. A paramedic was ready with the ET tube in hand and she put it through the incision. We attached the bag. We had air movement into the lungs, and within minutes the oxygen came up.
Not long after, the flight paramedics from the helicopter showed up, having jogged a mile through the woods. They seemed rather surprised to find a patient with a cricothyrotomy. We filled them in on the situation. Now we had to get the patient out of the woods (literally and figuratively).
The emergency responders had a really great transport device: A litter with one big wheel underneath in the middle so we could roll the patient down the mountain bike trail over rocks relatively safely. One person’s job was to hold the tube as we went since we didn’t have suture to hold it in place.
We got back to the parking lot and loaded him into the ambulance, which drove another mile to the helicopter, which then had to take him a hundred miles to the hospital.
To be honest, I thought the prognosis was poor. I suspected he had an intercranial bleed slowly squeezing his brain (that later turned out to not be the case). Even though we had established an airway, it took us so long to get him to the ambulance.
The director of the local EMS called me that evening and said the patient had made it to the hospital. I had never been a part of anything with this intensity. I definitely lost sleep over it. Partly just from the uncertainty of not knowing what the outcome would be. But also second-guessing if I had done everything that I could have.
The story doesn’t quite end there, however.
A week later, a friend of the patient called me. He had recovered well and was going to be discharged from the hospital. He’d chosen to share the story with the media, and the local TV station was going to interview him. They had asked if I would agree to be interviewed.
After the local news story ran, it was kind of a media blitz. In came numerous media requests. But honestly, the portrayal of the story made me feel really weird. It was overly dramatized and not entirely accurate. It really didn’t sit well with me.
Friends all over the country saw the story, and here’s what they got from the coverage:
I was biking behind the patient when he crashed.
I had my own tools. Even the patient himself was told I used my own blade to make the incision.
The true story is what I just told you: A half-dozen emergency medical personnel were already there when I arrived. It was a combination of all of us – together – in the right place at the right time.
A month later, the patient and his family drove to the city where I live to take me out to lunch. It was emotional. There were plenty of tears. His wife and daughter were expressing a lot of gratitude and had some gifts for me. I was able to get his version of the story and learned some details. He had facial trauma in the past with some reconstruction. I realized that perhaps those anatomical changes affected my ability to do the intubation.
I hope to never again have to do this outside of the hospital. But I suppose I’m more prepared than ever now. I’ve reviewed my cricothyrotomy technique many times since then.
I was trained as a family doctor and did clinic and hospital medicine for several years. It was only in 2020 that I transitioned to doing emergency medicine work in a rural hospital. So, 2 years earlier, I’m not sure I would’ve been able to do what I did that day. To me, it was almost symbolic of the transition of my practice to emergency medicine.
I’m still in touch with the patient. We’ve talked about biking together. That hasn’t happened yet, but it may very well happen someday.
Jesse Coenen, MD, is an emergency medicine physician at Hayward Area Memorial Hospital in Hayward, Wisc.
A version of this article first appeared on Medscape.com.
Arkansas cardiologist pays $900K to settle false claims allegations
in violation of the False Claims Act.
As part of the settlement, Dr. Tauth will enter into an integrity agreement with the U.S. Department of Health & Human Services, according to a news release from Henry Leventis, U.S. attorney for the Middle District of Tennessee.
“Health care fraud is a top priority of this office. We will aggressively pursue all those who are involved in fraud against government programs,” Mr. Leventis said.
Dr. Tauth formerly treated patients at National Park Medical Center (NPMC) in Hot Springs. The alleged false claims were submitted from September 2013 through August 2019.
The settlement with Dr. Tauth, aged 60, follows a November 2019 voluntary disclosure of the alleged false claims by Brentwood, Tenn.–based Lifepoint Health, which acquired NPMC and Hot Springs Cardiology Associates in November 2018.
NPMC and Hot Springs Cardiology entered into a settlement in October 2020 for the alleged violations and agreed to pay roughly $14.6 million, which includes over $9 million in restitution, according to the news release.
NPMC CEO Scott Smith said NPMC is “committed to maintaining high standards of integrity, legal compliance, and quality care for our patients. We regularly monitor our processes, procedures, and reporting and actively self-report concerns to regulators to ensure we are upholding these standards across our organization.”
“We are proud that our hospital took the appropriate steps to promptly self-report and finalize a settlement with the government for a swift resolution more than 2 years ago,” Mr. Smith said.
Dr. Tauth, however, maintains that the allegations made by NPMC are false.
“I am pleased to have reached a settlement agreement with the Department of Justice regarding allegations brought to them by my former employer, National Park Medical Center,” he said in a statement.
“The settlement agreement specifically states that it is not ‘an admission of liability’ by me, and I remain steadfast in my position that the allegations made by my former employer are false and without merit,” Dr. Tauth added.
He further stated that he has “chosen to enter into the settlement agreement because the legal process initiated by National Park’s allegations has been emotionally and financially damaging to me and my family in the extreme, and a settlement puts an end to the delays, uncertainties, inconveniences, and expenses of protracted litigation. Settlement is in the best interests of my family, my patients, and my medical practice.”
Dr. Tauth said he is “extremely grateful for the support I have received from my patients, medical staff, colleagues, friends, and family during this difficult time, and I look forward to providing high-quality cardiac care in the greater Hot Springs community for many years to come.”
A version of this article first appeared on Medscape.com.
Long COVID comes into focus, showing older patients fare worse
These findings help define long COVID, guiding providers and patients through the recovery process, Barak Mizrahi, MSc, of KI Research Institute, Kfar Malal, Israel, and colleagues reported.
“To provide efficient continuous treatment and prevent adverse events related to potential long term effects and delayed symptoms of COVID-19, determining the magnitude and severity of this phenomenon and distinguishing it from similar clinical manifestations that occur normally or following infections with other pathogens is essential,” the investigators wrote in The BMJ.
To this end, they conducted a retrospective, nationwide cohort study involving 1,913,234 people who took a polymerase chain reaction test for SARS-CoV-2 between March 1, 2020, and Oct. 1, 2021. They compared a range of long-term outcomes at different intervals post infection, and compared these trends across subgroups sorted by age, sex, and variant. Outcomes ranged broadly, including respiratory disorders, cough, arthralgia, weakness, hair loss, and others.
The investigators compared hazard ratios for each of these outcomes among patients who tested positive versus those who tested negative at three intervals after testing: 30-90 days, 30-180 days, and 180-360 days. Statistically significant differences in the risks of these outcomes between infected versus uninfected groups suggested that COVID was playing a role.
“The health outcomes that represent long COVID showed a significant increase in both early and late phases,” the investigators wrote. These outcomes included anosmia and dysgeusia, cognitive impairment, dyspnea, weakness, and palpitations. In contrast, chest pain, myalgia, arthralgia, cough, and dizziness were associated with patients who were in the early phase, but not the late phase of long COVID.
“Vaccinated patients with a breakthrough SARS-CoV-2 infection had a lower risk for dyspnea and similar risk for other outcomes compared with unvaccinated infected patients,” the investigators noted.
For the long COVID outcomes, plots of risk differences over time showed that symptoms tended to get milder or resolve within a few months to a year. Patients 41-60 years were most likely to be impacted by long COVID outcomes, and show least improvement at 1 year, compared with other age groups.
“We believe that these findings will shed light on what is ‘long COVID’, support patients and doctors, and facilitate better and more efficient care,” Mr. Mizrahi and coauthor Maytal Bivas-Benita, PhD said in a joint written comment. “Primary care physicians (and patients) will now more clearly understand what are the symptoms that might be related to COVID and for how long they might linger. This would help physicians monitor the patients efficiently, ease their patients’ concerns and navigate a more efficient disease management.”
They suggested that the findings should hold consistent for future variants, although they could not “rule out the possibility of the emergence of new and more severe variants which will be more virulent and cause a more severe illness.”
One “major limitation” of the study, according to Monica Verduzco-Gutierrez, MD, a physiatrist and professor and chair of rehabilitation medicine at the University of Texas Health Science Center, San Antonio, is the lack of data for fatigue and dysautonomia, which are “the major presentations” that she sees in her long COVID clinic.
“The authors of the article focus on the primary damage being related to the lungs, though we know this is a systemic disease beyond the respiratory system, with endothelial dysfunction and immune dysregulation,” Dr. Verduzco-Gutierrez, who is also director of COVID recovery at the University of Texas Health Science Center, said in an interview.
Although it was reassuring to see that younger adults with long COVID trended toward improvement, she noted that patients 41-60 years “still had pretty significant symptoms” after 12 months.
“That [age group comprises] probably the majority of my patients that I’m seeing in the long COVID clinic,” Dr. Verduzco-Gutierrez said. “If you look at the whole thing, it looks better, but then when you drill down to that age group where you’re seeing patients, then it’s not.”
Dr. Verduzco-Gutierrez is so busy managing patients with long COVID that new appointments in her clinic are now delayed until May 31, so most patients will remain under the care of their primary care providers. She recommended that these physicians follow guidance from the American Academy of Physical Medicine and Rehabilitation, who offer consensus statements based on clinical characteristics, with separate recommendations for pediatric patients.
Our understanding of long COVID will continue to improve, and with it, available recommendations, she predicted, but further advances will require persistent effort.
“I think no matter what this [study] shows us, more research is needed,” Dr. Verduzco-Gutierrez said. “We can’t just forget about it, just because there is a population of people who get better. What about the ones who don’t?”
The investigators and Dr. Verduzco-Gutierrez disclosed no conflicts of interest.
FROM THE BMJ
Does EPA lower CV risk? REDUCE-IT revisited
The prescription product (Vascepa), consisting of a “highly purified” form of the omega-3 acid eicosapentaenoic acid (EPA), was heralded in 2018 (N Engl J Med. 2019;380:11-22) as ushering in “the dawn of a new era” in cardiovascular disease (CVD) prevention that “should definitely change practice going forward,” according to REDUCE-IT’s lead author Deepak L. Bhatt, MD, formerly of Brigham and Women’s Hospital in Boston and now director of the Mount Sinai Heart Center in New York.
However, skeptics questioned why the results differed from most previous trials of fish oil that showed no benefit. Was it caused by the high dose of EPA: 4 g/daily versus 1 g daily in earlier trials with fish oil capsules? Was it the different formulation of purified EPA versus more common combinations of EPA plus docosahexaenoic acid (DHA)? Or, as suggested by Steven Nissen, MD, chief academic officer of Cleveland Clinic’s Heart and Vascular Institute and others, was it caused by the negative effects of the mineral oil placebo, given the significant increases in LDL cholesterol and high-sensitivity C-reactive protein (hsCRP) seen in the control group?
‘Not all omega-3s created equal’
Dr. Bhatt recently said in an interview: “I think there’s confusion in the field. It’s a challenge when just one drug in a class looks good and everything else in that class looks bad. That in itself can breed some skepticism. Also, not everyone always embraces advances. Some people have other reasons to impugn datasets; for example, it could be because they are running competing trials with competing drugs.”
REDUCE-IT enrolled more than 8,000 patients at high CV risk despite statin treatment, and randomly assigned them to 2 g of EPA twice daily or the mineral oil placebo. Although the results showed a 25% reduction in the rate of CV events in the EPA group, there was also an increased risk of atrial fibrillation among those taking EPA after a median of 4.9 years follow-up.
Dr. Bhatt noted that Amarin, which manufactures Vascepa, is essentially a one-drug company, and its stock price is dependent on the product. When the trial results were released, he said, “there were people in the investor world that wanted the stock price to go up or wanted it to go down, and they were alternately hyping or disparaging the data in both cases, sometimes inappropriately and excessively, which created noise around the science.”
The fact is, he said, “not all omega-3 fatty acids are created equal. There are differences between supplements and prescription medicines, and within the prescription medicines, differences between pure EPA and the mixtures of EPA and DHA.”
Dr. Bhatt added that other trials also showed positive results. He pointed to the JELIS trial, published in 2007, which showed a 19% reduction in major adverse CV events with a 1.8-g daily EPA dose.
More recently, RESPECT-EPA was presented at the 2022 annual meeting of the American Heart Association. That study had methodological issues and was underpowered, but it did suggest a possible benefit of EPA in reducing CV events in patients with chronic coronary artery disease who were taking statins. “Looking at the totality of evidence, I think it’s quite clear there’s CV benefit,” Dr. Bhatt said.
Placebo effects?
Concerns about the mineral oil placebo cast doubt on that benefit. Table 4 of the supplement accompanying REDUCE-IT’s publication in the New England Journal of Medicine shows significant increases of non–HDL cholesterol, LDL cholesterol, apolipoprotein B, and hsCRP in the control group.
Jane Armitage, MBBS, a professor of clinical trials and epidemiology, clinical trial service unit at Oxford University (England), said in an interview: “I was surprised by the backlash and at the time felt that it was unlikely that the mineral oil was the problem. But the size of benefit was still out of kilter.”
“Two further pieces of evidence have influenced my thoughts since then,” she said. One is the lack of effect of high doses of fish oils in the STRENGTH trial. STRENGTH tested 4 g of omega-3 oil containing a mixture of EPA and DHA and found no benefit in statin-treated, high-risk patients.
“The amount of EPA [was] substantially less than given in REDUCE-IT,” Armitage said, “but it seems to me that in a similar hypertriglyceridemic population, if the effect were due to the EPA, you would have seen some impact in STRENGTH – and none was seen.”
“The other piece of evidence is in a paper by Paul Ridker, MD, et al. on the changes in biomarkers during REDUCE-IT,” she said. “Several inflammatory biomarkers associated with atherosclerosis rose during the study among those allocated mineral oil, but remained largely unchanged in the EPA group. This is in contrast to what is seen with these biomarkers in other large trials, where no changes were seen in the placebo groups, and once again raises the possibility that the apparent benefits of EPA may be related to hazard from the mineral oil.”
Still room for benefit?
Based largely on the results of REDUCE-IT, Vascepa is currently approved by the Food and Drug Administration as an adjunctive therapy to lower the risk for CV events among adults with elevated triglyceride levels (≥ 150 mg/dL). Patients must also have either established CVD or diabetes and two or more additional CV risk factors and are advised to continue physical activity and maintain a healthy diet.
Dr. Nissen, the principal author of the STRENGTH trial, said in an interview, “REDUCE-IT is an outlier. Other trials of omega-3 fatty acids, some of them very large, showed no benefits, and a meta-analysis of nearly 78,000 patients showed no beneficial effects. In this context,” he said, “the large ‘benefit’ observed in REDUCE-IT doesn’t make any sense.”
Dr. Nissen noted that a secondary analysis of STRENGTH further showed that higher plasma EPA levels did not reduce CV outcomes. He also highlighted the elevated risk of atrial fibrillation with EPA. “We need to see another study comparing EPA to a neutral comparator such as corn oil, which had no significant effect on lipid or inflammatory biomarkers in STRENGTH,” he said. “Without such a trial, the results of REDUCE-IT cannot be accepted as definitive.”
Dr. Ridker, the lead author of the REDUCE-IT substudy that found biomarker changes with the mineral oil placebo, said in an interview: “Is it possible that EPA is an outstanding drug? Absolutely, and I continue to think it useful for our very high-risk, secondary-prevention patients when we are running out of options.”
“But,” said Dr. Ridker, who is a professor at Harvard Medical School, Boston, and director of the Center for Cardiovascular Disease Prevention at Brigham and Women’s, “the reality ... is that ongoing uncertainties need resolution.” Like Dr. Nissen, he thinks the best way to resolve these uncertainties is through a second trial using a fully neutral comparator. “I am hopeful that the U.S. National Institutes of Health will see fit to undertake such an endeavor, perhaps with support from industry partners.”
Although Dr. Armitage is no longer in clinical practice, when asked how she might use EPA, she said it might be reasonable for patients who meet the prescribing criteria and remain high risk after all other risk factors have been addressed. She added that, although EPA is approved in the United Kingdom, she doesn’t think it is being widely prescribed.
Salim S. Virani, MD, PhD, a professor in the Sections of Cardiology and Cardiovascular Research at Baylor College of Medicine who has published articles about REDUCE-IT and on the eligibility and cost of EPA in the Veterans Affairs system, said in an interview: “In my personal opinion, clinicians [should] first optimize diet and lifestyle and work on secondary causes, as they play a very big role in hypertriglyceridemia.” He also recommended optimizing LDL-C levels because of “consistent data showing that LDL [cholesterol] control leads to significant reduction in atherosclerotic CVD events.”
“Once these two steps are taken and triglycerides still remain elevated,” he said, “then adding EPA in patients with established atherosclerotic CVD or those with diabetes plus other CV risk factors may be a reasonable option to further lower residual atherosclerotic CVD risk.”
Clinical inertia?
Dr. Bhatt acknowledged that, despite the benefit of EPA in the context of REDUCE-IT, “a few issues stand in the way of prescribing, particularly in the U.S.”
Vascepa’s manufacturer Amarin lost a patent challenge in the United States, enabling the relatively early introduction of multiple generics. “They’ve lost interest in the U.S. because there are three generics.”
“The sad truth is, if there isn’t a drug rep saying, ‘hey, look at this new data,’ there’s clinical inertia,” said Dr. Bhatt. He believes that the lack of marketing will hurt awareness among physicians and “ultimately hurt patients because they won’t get the drug.”
Cost is also an issue, Dr. Bhatt affirmed. Vascepa has significant out-of-pocket costs for many patients, as do some of the generics. Currently, the branded product costs about $300 per month without insurance, according to drugs.com; prices for generics vary widely, running anywhere from $82 to $200 or more.
Despite these challenges, he noted that many guidelines around the world have already changed to reflect the data, including the American Diabetes Association and the U.S. National Lipid Association.
Will there be another trial of EPA with a neutral placebo? Dr. Bhatt believes it’s not going to happen. “The company that funded REDUCE-IT is struggling just to stay alive, and another investigator-funded trial like RESPECT EPA would probably be underpowered and not move the needle much.”
Dr. Virani agreed that while it would be best to test EPA against a fully inert placebo, “whether there is enough appetite to fund such a large trial remains a big question.”
Meanwhile, Dr. Bhatt said, “EPA is not for everybody, but for the high-risk patients who meet the stringent inclusion criteria of REDUCE-IT, I think clinicians should at least consider use of EPA in a way consistent with the U.S. FDA label, the Canadian label, and the label in parts of Europe where the drug is being introduced.”
A version of this article first appeared on Medscape.com.
Strong support to provide DAA therapy to all patients with HCV
, a large, real-world analysis finds.
Improved outcomes were seen among patients without cirrhosis, those with compensated cirrhosis, and those with existing liver decompensation, the authors noted.
The findings highlight a “substantial need to provide DAA therapy to all patients with HCV, regardless of disease stage or financial status,” wrote Mindie Nguyen, MD, of Stanford University Medical Center, Palo Alto, Calif., and coinvestigators.
“Additional national efforts are needed to reach and treat U.S. population groups that are underinsured or not insured, incarcerated and otherwise marginalized, such as users of illicit drugs, who are also at higher risk of disease complication and reinfection,” they said.
The study was published online in JAMA Internal Medicine.
CHC and its complications are associated with high rates of illness and death. However, large-scale data on long-term liver and nonliver effects of DAA treatment are limited.
For their study, Dr. Nguyen and colleagues analyzed administrative claims data from 2010 to 2021 for 245,596 adults with CHC, of whom 40,654 had received one or more DAA therapies (without interferon) and 204,942 had not received treatment.
DAA-treated patients were slightly older than their untreated peers (mean age, 59.9 years, vs. 58.5 years) and were more likely to be male (62% vs. 58%) and White (59% vs. 57%), and to have diabetes (26% vs. 25%) and cirrhosis (44% vs. 29%).
For liver outcomes, DAA therapy was associated with a lower incidence of decompensation (28.2 vs. 40.8 per 1,000 person-years; P < .001) and hepatocellular carcinoma (HCC) in compensated cirrhosis (20.1 vs. 41.8; P < .001).
For nonliver outcomes, DAA treatment was associated with a lower incidence of diabetes (30.2 vs. 37.2 per 1,000 person-years; P < .001) and chronic kidney disease (31.1 vs. 34.1; P < .001).
The all-cause mortality rate per 1,000 person-years was 36.5 in the DAA-treated group, vs. 64.7 in the untreated group (P < .001).
In multivariable regression analysis, DAA treatment was independently associated with a significant decrease in the risk for HCC (adjusted hazard ratio [aHR], 0.73), decompensation (aHR, 0.36), diabetes (aHR, 0.74), chronic kidney disease (aHR, 0.81), cardiovascular disease (aHR, 0.90), nonliver cancer (aHR, 0.89), and mortality (aHR, 0.43).
The 57% lower mortality rate observed among DAA-treated vs. untreated patients aligns with a large French study of adults with CHC.
“Because HCV treatment with a DAA regimen is well tolerated for nearly all patients, we believe these findings provide further support for universal HCV treatment coverage for all patients affected by HCV,” Dr. Nguyen and colleagues wrote.
The strengths of this study are its large sample of DAA-treated and untreated patients from diverse racial and ethnic groups from across the United States and from diverse practice settings (not just tertiary centers).
One limitation is that the study cohort included only patients covered by private insurance; therefore, the findings may not be generalizable to individuals who are underinsured or not insured. Miscoding and misclassification are also possible with large claims databases.
Support for the study was provided by Stanford University and the Stanford Center for Population Health Sciences. Dr. Nguyen has received institutional grants and advisory board fees from Gilead Sciences outside the submitted work.
A version of this article first appeared on Medscape.com.
FROM JAMA INTERNAL MEDICINE
Picosecond lasers for tattoo removal could benefit from enhancements, expert says
SAN DIEGO – When picosecond lasers hit the market about 10 years ago, they became a game-changer for tattoo removal, boasting the delivery of energy that is about threefold faster than with nanosecond lasers.

However, picosecond lasers are far from perfect even in the hands of the most experienced clinicians, according to Omar A. Ibrahimi, MD, PhD, medical director of the Connecticut Skin Institute, Stamford. “They have been very difficult to build from an engineering perspective,” he said at the annual Masters of Aesthetics Symposium. It took a long time for these lasers to come to the market, and they are still fairly expensive and require a lot of maintenance, he noted. In addition, “they are also not quite as ‘picosecond’ as they need to be. I think there is definitely room to improve, but this is the gold standard.”
Today, . Tattoo ink particles average about 0.1 mcm in size, and the thermal relaxation size works out to be less than 10 nanoseconds, with shorter pulses better at capturing the ink particles that are smaller than average.
Black is the most common tattoo color dermatologists treat. “For that, you can typically use a 1064, which has the highest absorption, but you can also use many of the other wavelengths,” he said. “Other colors are less common, followed by red, for which you would use a 532-nm wavelength.”
Dr. Ibrahimi underscored the importance of setting realistic expectations during consults with patients seeking options for tattoo removal. Even with picosecond laser technology, many treatments are typically required and “a good patient consultation is key to setting proper expectations,” he said. “If you promise someone results in 4 to 5 treatments like many of the device companies will say you can achieve, you’re going to have a large group of patients who are disappointed.”
The clinical endpoint to strive for during tattoo removal is whitening of the ink, which typically fades about 20 minutes after treatment. That whitening corresponds to cavitation, or the production of gas vacuoles in the cells that were holding the ink. This discovery led to a technique intended to enhance tattoo removal. In 2012, R. Rox Anderson, MD, director of the Wellman Center for Photomedicine at Massachusetts General Hospital, and colleagues published results of a study that compared a single Q-switched laser treatment pass with four treatment passes separated by 20 minutes. After treating 18 tattoos in 12 adults, they found that the technique, known as the “R20” method, was more effective than a single-pass treatment (P < .01).
“Subsequent to this, there has been conflicting data on whether this is truly effective or not,” said Dr. Ibrahimi, who is also on the board of directors for the American Society for Dermatologic Surgery and the American Society for Laser Medicine and Surgery. “Most of us agree that one additional pass would be helpful, but when you’re doing this in the private practice setting, it’s often challenging because patients aren’t necessarily willing to pay more for more than just one pass for their tattoo removal.”
Another recent advance is use of a topical square silicone patch infused with perfluorodecalin (PFD) for use during tattoo removal, which has been shown to reduce epidermal whitening. The patch contains a fluorocarbon “that is very good at dissolving gas, and it is already widely used in medicine,” he said. When applied, “it almost instantaneously takes the whitening away; you don’t have to wait the 20 minutes to do your second pass.”
A different technology designed to speed up tattoo removal is the Resonic Rapid Acoustic Pulse device (marketed as Resonic, from Allergan Aesthetics), which is cleared by the FDA for use as an accessory to the 1064 nm Q-switched laser for black tattoo removal in patients with skin types I-III. “This uses acoustic pulses of sound waves; they’re rapid and powerful,” Dr. Ibrahimi said. “They can clear those cavitation bubbles much like the PFD patches do. It’s also thought that they further disperse the tattoo ink particles by supplementing the laser energy as well. It is also purported to alter the body’s healing response, or immune response, which is important in tattoo clearing.”
Dr. Ibrahimi disclosed that he is a member of the Advisory Board for Accure Acne, AbbVie (which owns Allergan), Cutera, Lutronic, Blueberry Therapeutics, Cytrellis, and Quthero. He also holds stock in many device and pharmaceutical companies.
SAN DIEGO – When picosecond lasers hit the market about 10 years ago, they became a game-changer for tattoo removal, boasting the delivery of energy that is about threefold faster than with nanosecond lasers.
However, picosecond lasers are far from perfect even in the hands of the most experienced clinicians, according to Omar A. Ibrahimi, MD, PhD, medical director of the Connecticut Skin Institute, Stamford. “They have been very difficult to build from an engineering perspective,” he said at the annual Masters of Aesthetics Symposium. It took a long time for these lasers to come to the market, and they are still fairly expensive and require a lot of maintenance, he noted. In addition, “they are also not quite as ‘picosecond’ as they need to be. I think there is definitely room to improve, but this is the gold standard.”
Today, . Tattoo ink particles average about 0.1 mcm in size, and the thermal relaxation size works out to be less than 10 nanoseconds, with shorter pulses better at capturing the ink particles that are smaller than average.
Black is the most common tattoo color dermatologists treat. “For that, you can typically use a 1064, which has the highest absorption, but you can also use many of the other wavelengths,” he said. “Other colors are less common, followed by red, for which you would use a 532-nm wavelength.”
Dr. Ibrahimi underscored the importance of setting realistic expectations during consults with patients seeking options for tattoo removal. Even with picosecond laser technology, many treatments are typically required and “a good patient consultation is key to setting proper expectations,” he said. “If you promise someone results in 4 to 5 treatments like many of the device companies will say you can achieve, you’re going to have a large group of patients who are disappointed.”
The clinical endpoint to strive for during tattoo removal is whitening of the ink, which typically fades about 20 minutes after treatment. That whitening corresponds to cavitation, or the production of gas vacuoles in the cells that were holding the ink. This discovery led to a technique intended to enhance tattoo removal. In 2012, R. Rox Anderson, MD, director of the Wellman Center for Photomedicine at Massachusetts General Hospital, and colleagues published results of a study that compared a single Q-switched laser treatment pass with four treatment passes separated by 20 minutes. After treating 18 tattoos in 12 adults, they found that the technique, known as the “R20” method, was more effective than a single-pass treatment (P < .01).
“Subsequent to this, there has been conflicting data on whether this is truly effective or not,” said Dr. Ibrahimi, who is also on the board of directors for the American Society for Dermatologic Surgery and the American Society for Laser Medicine and Surgery. “Most of us agree that one additional pass would be helpful, but when you’re doing this in the private practice setting, it’s often challenging because patients aren’t necessarily willing to pay more for more than just one pass for their tattoo removal.”
Another recent advance is use of a topical square silicone patch infused with perfluorodecalin (PFD) for use during tattoo removal, which has been shown to reduce epidermal whitening. The patch contains a fluorocarbon “that is very good at dissolving gas, and it is already widely used in medicine,” he said. When applied, “it almost instantaneously takes the whitening away; you don’t have to wait the 20 minutes to do your second pass.”
A different technology designed to speed up tattoo removal is the Resonic Rapid Acoustic Pulse device (marketed as Resonic, from Allergan Aesthetics), which is cleared by the FDA for use as an accessory to the 1064 nm Q-switched laser for black tattoo removal in patients with skin types I-III. “This uses acoustic pulses of sound waves; they’re rapid and powerful,” Dr. Ibrahimi said. “They can clear those cavitation bubbles much like the PFD patches do. It’s also thought that they further disperse the tattoo ink particles by supplementing the laser energy as well. It is also purported to alter the body’s healing response, or immune response, which is important in tattoo clearing.”
Dr. Ibrahimi disclosed that he is a member of the Advisory Board for Accure Acne, AbbVie (which owns Allergan), Cutera, Lutronic, Blueberry Therapeutics, Cytrellis, and Quthero. He also holds stock in many device and pharmaceutical companies.
AT MOAS 2022
FDA OKs Tdap shot in pregnancy to protect newborns from pertussis
The Food and Drug Administration has approved another Tdap vaccine option for use during pregnancy to protect newborns from whooping cough.
The agency on Jan. 9 licensed Adacel (Sanofi Pasteur) for immunization during the third trimester to prevent pertussis in infants younger than 2 months old.
The FDA in October approved a different Tdap vaccine, Boostrix (GlaxoSmithKline), for this indication. Boostrix was the first vaccine specifically approved to prevent a disease in newborns whose mothers receive the vaccine while pregnant.
The Centers for Disease Control and Prevention recommend that women receive a dose of Tdap vaccine during each pregnancy, preferably during gestational weeks 27-36 – and ideally toward the earlier end of that window – to help protect babies from whooping cough, the respiratory tract infection caused by Bordetella pertussis.
Providing a Tdap vaccine – tetanus toxoid, reduced diphtheria toxoid, and acellular pertussis vaccine, adsorbed – in the third trimester confers passive immunity to the baby, according to the CDC. It also reduces the likelihood that the mother will get pertussis and pass it on to the infant.
One study found that providing Tdap vaccination during gestational weeks 27-36 was 85% more effective at preventing pertussis in infants younger than 2 months old, compared with providing Tdap vaccination to mothers in the hospital postpartum.
“On average, about 1,000 infants are hospitalized and typically between 5 and 15 infants die each year in the United States due to pertussis,” according to a CDC reference page. “Most of these deaths are among infants who are too young to be protected by the childhood pertussis vaccine series that starts when infants are 2 months old.”
Early retirement and the terrible, horrible, no good, very bad cognitive decline
The ‘scheme’ in the name should have been a clue
Retirement. The shiny reward to a lifetime’s worth of working and saving. We’re all literally working to get there, some of us more to get there early, but current research reveals that early retirement isn’t the relaxing finish line we dream about, cognitively speaking.

Researchers at Binghamton (N.Y.) University set out to examine just how retirement plans affect cognitive performance. They started off with China’s New Rural Pension Scheme (scheme probably has a less negative connotation in Chinese), a plan that financially aids the growing rural retirement-age population in the country. Then they looked at data from the Chinese Health and Retirement Longitudinal Survey, which tests cognition with a focus on episodic memory and parts of intact mental status.
What they found was the opposite of what you would expect out of retirees with nothing but time on their hands.
The pension program, which had been in place for almost a decade, led to delayed recall, especially among women, supporting “the mental retirement hypothesis that decreased mental activity results in worsening cognitive skills,” the investigators said in a written statement.
There also was a drop in social engagement, with lower rates of volunteering and social interaction than people who didn’t receive the pension. Some behaviors, like regular alcohol consumption, did improve over the previous year, as did total health in general, but “the adverse effects of early retirement on mental and social engagement significantly outweigh the program’s protective effect on various health behaviors,” Plamen Nikolov, PhD, said about his research.
So if you’re looking to retire early, don’t skimp on the crosswords and the bingo nights. Stay busy in a good way. Your brain will thank you.
Indiana Jones and the First Smallpox Ancestor
Smallpox was, not that long ago, one of the most devastating diseases known to humanity, killing 300 million people in the 20th century alone. Eradicating it has to be one of medicine’s crowning achievements. Now it can only be found in museums, which is where it belongs.

Here’s the thing with smallpox though: For all it did to us, we know frustratingly little about where it came from. Until very recently, the best available genetic evidence placed its emergence in the 17th century, which clashes with historical data. You know what that means, right? It’s time to dig out the fedora and whip, cue the music, and dig into a recently published study spanning continents in search of the mythical smallpox origin story.
We pick up in 2020, when genetic evidence definitively showed smallpox in a Viking burial site, moving the disease’s emergence a thousand years earlier. Which is all well and good, but there’s solid visual evidence that Egyptian pharaohs were dying of smallpox, as their bodies show the signature scarring. Historians were pretty sure smallpox went back about 4,000 years, but there was no genetic material to prove it.
Since there aren’t any 4,000-year-old smallpox germs laying around, the researchers chose to attack the problem another way – by burning down a Venetian catacomb, er, conducting a analysis of historical smallpox genetics to find the virus’s origin. By analyzing the genomes of various strains at different periods of time, they were able to determine that the variola virus had a definitive common ancestor. Some of the genetic components in the Viking-age sample, for example, persisted until the 18th century.
Armed with this information, the scientists determined that the first smallpox ancestor emerged about 3,800 years ago. That’s very close to the historians’ estimate for the disease’s emergence. Proof at last of smallpox’s truly ancient origin. One might even say the researchers chose wisely.
The only hall of fame that really matters
LOTME loves the holiday season – the food, the gifts, the radio stations that play nothing but Christmas music – but for us the most wonderful time of the year comes just a bit later. No, it’s not our annual Golden Globes slap bet. Nope, not even the “excitement” of the College Football Playoff National Championship. It’s time for the National Inventors Hall of Fame to announce its latest inductees, and we could hardly sleep last night after putting cookies out for Thomas Edison. Fasten your seatbelts!

- Robert G. Bryant is a NASA chemist who developed Langley Research Center-Soluble Imide (yes, that’s the actual name) a polymer used as an insulation material for leads in implantable cardiac resynchronization therapy devices.
- Rory Cooper is a biomedical engineer who was paralyzed in a bicycle accident. His work has improved manual and electric wheelchairs and advanced the health, mobility, and social inclusion of people with disabilities and older adults. He is also the first NIHF inductee named Rory.
- Katalin Karikó, a biochemist, and Drew Weissman, an immunologist, “discovered how to enable messenger ribonucleic acid (mRNA) to enter cells without triggering the body’s immune system,” NIHF said, and that laid the foundation for the mRNA COVID-19 vaccines developed by Pfizer-BioNTech and Moderna. That, of course, led to the antivax movement, which has provided so much LOTME fodder over the years.
- Angela Hartley Brodie was a biochemist who discovered and developed a class of drugs called aromatase inhibitors, which can stop the production of hormones that fuel cancer cell growth and are used to treat breast cancer in 500,000 women worldwide each year.
We can’t mention all of the inductees for 2023 (our editor made that very clear), but we would like to offer a special shout-out to brothers Cyril (the first Cyril in the NIHF, by the way) and Louis Keller, who invented the world’s first compact loader, which eventually became the Bobcat skid-steer loader. Not really medical, you’re probably thinking, but we’re sure that someone, somewhere, at some time, used one to build a hospital, landscape a hospital, or clean up after the demolition of a hospital.
The ‘scheme’ in the name should have been a clue
Retirement. The shiny reward to a lifetime’s worth of working and saving. We’re all literally working to get there, some of us more to get there early, but current research reveals that early retirement isn’t the relaxing finish line we dream about, cognitively speaking.
Researchers at Binghamton (N.Y.) University set out to examine just how retirement plans affect cognitive performance. They started off with China’s New Rural Pension Scheme (scheme probably has a less negative connotation in Chinese), a plan that financially aids the growing rural retirement-age population in the country. Then they looked at data from the Chinese Health and Retirement Longitudinal Survey, which tests cognition with a focus on episodic memory and parts of intact mental status.
What they found was the opposite of what you would expect out of retirees with nothing but time on their hands.
The pension program, which had been in place for almost a decade, led to delayed recall, especially among women, supporting “the mental retirement hypothesis that decreased mental activity results in worsening cognitive skills,” the investigators said in a written statement.
There also was a drop in social engagement, with lower rates of volunteering and social interaction than people who didn’t receive the pension. Some behaviors, like regular alcohol consumption, did improve over the previous year, as did total health in general, but “the adverse effects of early retirement on mental and social engagement significantly outweigh the program’s protective effect on various health behaviors,” Plamen Nikolov, PhD, said about his research.
So if you’re looking to retire early, don’t skimp on the crosswords and the bingo nights. Stay busy in a good way. Your brain will thank you.
Indiana Jones and the First Smallpox Ancestor
Smallpox was, not that long ago, one of the most devastating diseases known to humanity, killing 300 million people in the 20th century alone. Eradicating it has to be one of medicine’s crowning achievements. Now it can only be found in museums, which is where it belongs.
Here’s the thing with smallpox though: For all it did to us, we know frustratingly little about where it came from. Until very recently, the best available genetic evidence placed its emergence in the 17th century, which clashes with historical data. You know what that means, right? It’s time to dig out the fedora and whip, cue the music, and dig into a recently published study spanning continents in search of the mythical smallpox origin story.
We pick up in 2020, when genetic evidence definitively showed smallpox in a Viking burial site, moving the disease’s emergence a thousand years earlier. Which is all well and good, but there’s solid visual evidence that Egyptian pharaohs were dying of smallpox, as their bodies show the signature scarring. Historians were pretty sure smallpox went back about 4,000 years, but there was no genetic material to prove it.
Since there aren’t any 4,000-year-old smallpox germs laying around, the researchers chose to attack the problem another way – by burning down a Venetian catacomb, er, conducting a analysis of historical smallpox genetics to find the virus’s origin. By analyzing the genomes of various strains at different periods of time, they were able to determine that the variola virus had a definitive common ancestor. Some of the genetic components in the Viking-age sample, for example, persisted until the 18th century.
Armed with this information, the scientists determined that the first smallpox ancestor emerged about 3,800 years ago. That’s very close to the historians’ estimate for the disease’s emergence. Proof at last of smallpox’s truly ancient origin. One might even say the researchers chose wisely.
The only hall of fame that really matters
LOTME loves the holiday season – the food, the gifts, the radio stations that play nothing but Christmas music – but for us the most wonderful time of the year comes just a bit later. No, it’s not our annual Golden Globes slap bet. Nope, not even the “excitement” of the College Football Playoff National Championship. It’s time for the National Inventors Hall of Fame to announce its latest inductees, and we could hardly sleep last night after putting cookies out for Thomas Edison. Fasten your seatbelts!
- Robert G. Bryant is a NASA chemist who developed Langley Research Center-Soluble Imide (yes, that’s the actual name) a polymer used as an insulation material for leads in implantable cardiac resynchronization therapy devices.
- Rory Cooper is a biomedical engineer who was paralyzed in a bicycle accident. His work has improved manual and electric wheelchairs and advanced the health, mobility, and social inclusion of people with disabilities and older adults. He is also the first NIHF inductee named Rory.
- Katalin Karikó, a biochemist, and Drew Weissman, an immunologist, “discovered how to enable messenger ribonucleic acid (mRNA) to enter cells without triggering the body’s immune system,” NIHF said, and that laid the foundation for the mRNA COVID-19 vaccines developed by Pfizer-BioNTech and Moderna. That, of course, led to the antivax movement, which has provided so much LOTME fodder over the years.
- Angela Hartley Brodie was a biochemist who discovered and developed a class of drugs called aromatase inhibitors, which can stop the production of hormones that fuel cancer cell growth and are used to treat breast cancer in 500,000 women worldwide each year.
We can’t mention all of the inductees for 2023 (our editor made that very clear), but we would like to offer a special shout-out to brothers Cyril (the first Cyril in the NIHF, by the way) and Louis Keller, who invented the world’s first compact loader, which eventually became the Bobcat skid-steer loader. Not really medical, you’re probably thinking, but we’re sure that someone, somewhere, at some time, used one to build a hospital, landscape a hospital, or clean up after the demolition of a hospital.