User login
Cutis is a peer-reviewed clinical journal for the dermatologist, allergist, and general practitioner published monthly since 1965. Concise clinical articles present the practical side of dermatology, helping physicians to improve patient care. Cutis is referenced in Index Medicus/MEDLINE and is written and edited by industry leaders.
ass lick
assault rifle
balls
ballsac
black jack
bleach
Boko Haram
bondage
causas
cheap
child abuse
cocaine
compulsive behaviors
cost of miracles
cunt
Daech
display network stats
drug paraphernalia
explosion
fart
fda and death
fda AND warn
fda AND warning
fda AND warns
feom
fuck
gambling
gfc
gun
human trafficking
humira AND expensive
illegal
ISIL
ISIS
Islamic caliphate
Islamic state
madvocate
masturbation
mixed martial arts
MMA
molestation
national rifle association
NRA
nsfw
nuccitelli
pedophile
pedophilia
poker
porn
porn
pornography
psychedelic drug
recreational drug
sex slave rings
shit
slot machine
snort
substance abuse
terrorism
terrorist
texarkana
Texas hold 'em
UFC
section[contains(@class, 'nav-hidden')]
section[contains(@class, 'nav-hidden active')
A peer-reviewed, indexed journal for dermatologists with original research, image quizzes, cases and reviews, and columns.
Applications for the CUTIS 2024 Resident Corner Column
The Cutis Editorial Board is now accepting applications for the 2024 Resident Corner column. The Editorial Board will select 2 to 3 residents to serve as the Resident Corner columnists for 1 year. Articles are posted online only at www.mdedge.com/dermatology but will be referenced in Index Medicus. All applicants must be current residents and will be in residency throughout 2024.
For consideration, send your curriculum vitae along with a brief (not to exceed 500 words) statement of why you enjoy Cutis and what you can offer your fellow residents in contributing a monthly column.
A signed letter of recommendation from the Director of the dermatology residency program also should be supplied.
All materials should be submitted via email to Melissa Sears ([email protected]) by November 1. The residents who are selected to write the column for the upcoming year will be notified by November 15.
We look forward to continuing to educate dermatology residents on topics that are most important to them!
The Cutis Editorial Board is now accepting applications for the 2024 Resident Corner column. The Editorial Board will select 2 to 3 residents to serve as the Resident Corner columnists for 1 year. Articles are posted online only at www.mdedge.com/dermatology but will be referenced in Index Medicus. All applicants must be current residents and will be in residency throughout 2024.
For consideration, send your curriculum vitae along with a brief (not to exceed 500 words) statement of why you enjoy Cutis and what you can offer your fellow residents in contributing a monthly column.
A signed letter of recommendation from the Director of the dermatology residency program also should be supplied.
All materials should be submitted via email to Melissa Sears ([email protected]) by November 1. The residents who are selected to write the column for the upcoming year will be notified by November 15.
We look forward to continuing to educate dermatology residents on topics that are most important to them!
The Cutis Editorial Board is now accepting applications for the 2024 Resident Corner column. The Editorial Board will select 2 to 3 residents to serve as the Resident Corner columnists for 1 year. Articles are posted online only at www.mdedge.com/dermatology but will be referenced in Index Medicus. All applicants must be current residents and will be in residency throughout 2024.
For consideration, send your curriculum vitae along with a brief (not to exceed 500 words) statement of why you enjoy Cutis and what you can offer your fellow residents in contributing a monthly column.
A signed letter of recommendation from the Director of the dermatology residency program also should be supplied.
All materials should be submitted via email to Melissa Sears ([email protected]) by November 1. The residents who are selected to write the column for the upcoming year will be notified by November 15.
We look forward to continuing to educate dermatology residents on topics that are most important to them!
Diffuse Annular Plaques in an Infant
The Diagnosis: Neonatal Lupus Erythematosus
A review of the medical records of the patient’s mother from her first pregnancy revealed positive anti-Ro/SSA (Sjögren syndrome A) (>8.0 U [reference range <1.0 U]) and anti-La/SSB (Sjögren syndrome B) antibodies (>8.0 U [reference range <1.0 U]), which were reconfirmed during her pregnancy with our patient (the second child). The patient’s older brother was diagnosed with neonatal lupus erythematosus (NLE) 2 years prior at 1 month of age; therefore, the mother took hydroxychloroquine during the pregnancy with the second child to help prevent heart block if the child was diagnosed with NLE. Given the family history, positive antibodies in the mother, and clinical presentation, our patient was diagnosed with NLE. He was referred to a pediatric cardiologist and pediatrician to continue the workup of systemic manifestations of NLE and to rule out the presence of congenital heart block. The rash resolved 6 months after the initial presentation, and he did not develop any systemic manifestations of NLE.
Neonatal lupus erythematosus is a rare acquired autoimmune disorder caused by the placental transfer of anti-Ro/SSA and anti-La/SSB antibodies and less commonly anti-U1 ribonucleoprotein antinuclear autoantibodies.1,2 Approximately 1% to 2% of mothers with these positive antibodies will have infants affected with NLE.2 The annual prevalence of NLE in the United States is approximately 1 in 20,000 live births. Mothers of children with NLE most commonly have clinical Sjögren syndrome; however, anti-Ro/SSA and anti-LA/SSB antibodies may be present in 0.1% to 1.5% of healthy women, and 25% to 60% of women with autoimmune disease may be asymptomatic.1 As demonstrated in our case, when there is a family history of NLE in an infant from an earlier pregnancy, the risk for NLE increases to 17% to 20% in subsequent pregnancies1,3 and up to 25% in subsequent pregnancies if the initial child was diagnosed with a congenital heart block in the setting of NLE.1
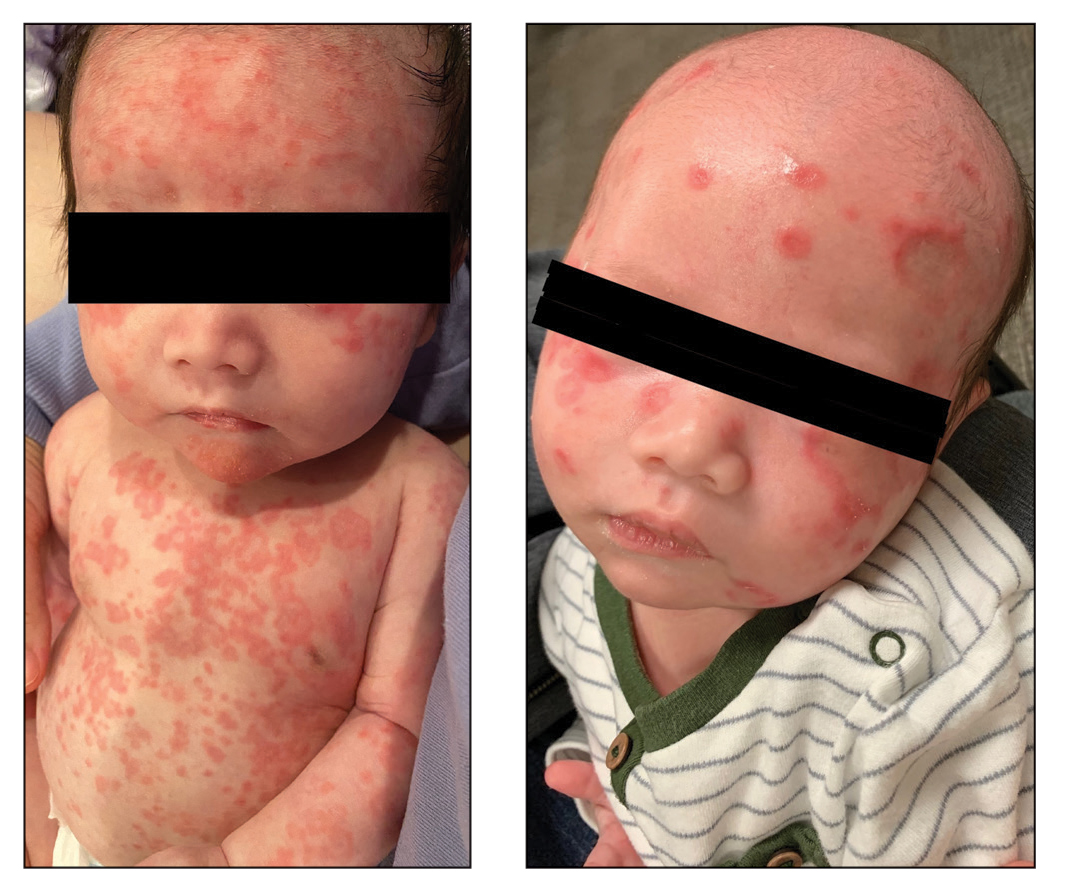
Neonatal lupus erythematosus classically presents as annular erythematous macules and plaques with central scaling, telangictasia, atrophy, and pigmentary changes. It may start on the scalp and face and spread caudally.1,2 Patients may develop these lesions after UV exposure, and 80% of infants may not have dermatologic findings at birth. Importantly, 40% to 60% of mothers may be asymptomatic at the time of presentation of their child’s NLE.1 The diagnosis can be confirmed via antibody testing in the mother and/or infant. If performed, a punch biopsy shows interface dermatitis, vacuolar degeneration, and possible periadnexal lymphocytic infiltrates on histopathology.1,2
Management of cutaneous NLE includes sun protection (eg, application of sunscreen) and topical corticosteroids. Most dermatologic manifestations of NLE are transient, resolving after clearance of maternal IgG antibodies in 6 to 9 months; however, some telangiectasia, dyspigmentation, and atrophic scarring may persist.1-3
Neonatal lupus erythematosus also may have hepatobiliary, cardiac, hematologic, and less commonly neurologic manifestations. Hepatobiliary manifestations usually present as hepatomegaly or asymptomatic elevated transaminases or γ-glutamyl transferase.1,3 Approximately 10% to 20% of infants with NLE may present with transient anemia and thrombocytopenia.1 Cardiac manifestations are permanent and may require pacemaker implantation.1,3 The incidence of a congenital heart block in infants with NLE is 15% to 30%.3 Cardiac NLE most commonly injures the conductive tissue, leading to a congenital atrioventricular block. The development of a congenital heart block develops in the 18th to 24th week of gestation. Manifestations of a more advanced condition can include dilation of the ascending aorta and dilated cardiomyopathy.1 As such, patients need to be followed by a pediatric cardiologist for monitoring and treatment of any cardiac manifestations.
The overall prognosis of infants affected with NLE varies. Cardiac involvement is associated with a poor prognosis, while isolated cutaneous involvement requires little treatment and portends a favorable prognosis. It is critical for dermatologists to recognize NLE to refer patients to appropriate specialists to investigate and further monitor possible extracutaneous manifestations. With an understanding of the increased risk for a congenital heart block and NLE in subsequent pregnancies, mothers with positive anti-Ro/La antibodies should receive timely counseling and screening. In expectant mothers with suspected autoimmune disease, testing for antinuclear antibodies and SSA and SSB antibodies can be considered, as administration of hydroxychloroquine or prenatal systemic corticosteroids has proven to be effective in preventing a congenital heart block.1 Our patient was followed by pediatric cardiology and was not found to have a congenital heart block.
The differential diagnosis includes other causes of annular erythema in infants, as NLE can mimic several conditions. Tinea corporis may present as scaly annular plaques with central clearing; however, it rarely is encountered fulminantly in neonates.4 Erythema multiforme is a mucocutaneous hypersensitivy reaction distinguished by targetoid morphology.5 It is an exceedingly rare diagnosis in neonates; the average pediatric age of onset is 5.6 years.6 Erythema multiforme often is associated with an infection, most commonly herpes simplex virus,5 and mucosal involvement is common.6 Urticaria multiforme (also known as acute annular urticaria) is a benign disease that appears between 2 months to 3 years of age with blanchable urticarial plaques that likely are triggered by viral or bacterial infections, antibiotics, or vaccines.6 Specific lesions usually will resolve within 24 hours. Annular erythema of infancy is a benign and asymptomatic gyrate erythema that presents as annular plaques with palpable borders that spread centrifugally in patients younger than 1 year. Notably, lesions should periodically fade and may reappear cyclically for months to years. Evaluation for underlying disease usually is negative.6
- Derdulska JM, Rudnicka L, Szykut-Badaczewska A, et al. Neonatal lupus erythematosus—practical guidelines. J Perinat Med. 2021;49:529-538. doi:10.1515/jpm-2020-0543
- Wu J, Berk-Krauss J, Glick SA. Neonatal lupus erythematosus. JAMA Dermatol. 2021;157:590. doi:10.1001/jamadermatol.2021.0041
- Hon KL, Leung AK. Neonatal lupus erythematosus. Autoimmune Dis. 2012;2012:301274. doi:10.1155/2012/301274
- Khare AK, Gupta LK, Mittal A, et al. Neonatal tinea corporis. Indian J Dermatol. 2010;55:201. doi:10.4103/0019-5154.6274
- Ang-Tiu CU, Nicolas ME. Erythema multiforme in a 25-day old neonate. Pediatr Dermatol. 2013;30:E118-E120. doi:10.1111 /j.1525-1470.2012.01873.x
- Agnihotri G, Tsoukas MM. Annular skin lesions in infancy [published online February 3, 2022]. Clin Dermatol. 2022;40:505-512. doi:10.1016/j.clindermatol.2021.12.011
The Diagnosis: Neonatal Lupus Erythematosus
A review of the medical records of the patient’s mother from her first pregnancy revealed positive anti-Ro/SSA (Sjögren syndrome A) (>8.0 U [reference range <1.0 U]) and anti-La/SSB (Sjögren syndrome B) antibodies (>8.0 U [reference range <1.0 U]), which were reconfirmed during her pregnancy with our patient (the second child). The patient’s older brother was diagnosed with neonatal lupus erythematosus (NLE) 2 years prior at 1 month of age; therefore, the mother took hydroxychloroquine during the pregnancy with the second child to help prevent heart block if the child was diagnosed with NLE. Given the family history, positive antibodies in the mother, and clinical presentation, our patient was diagnosed with NLE. He was referred to a pediatric cardiologist and pediatrician to continue the workup of systemic manifestations of NLE and to rule out the presence of congenital heart block. The rash resolved 6 months after the initial presentation, and he did not develop any systemic manifestations of NLE.
Neonatal lupus erythematosus is a rare acquired autoimmune disorder caused by the placental transfer of anti-Ro/SSA and anti-La/SSB antibodies and less commonly anti-U1 ribonucleoprotein antinuclear autoantibodies.1,2 Approximately 1% to 2% of mothers with these positive antibodies will have infants affected with NLE.2 The annual prevalence of NLE in the United States is approximately 1 in 20,000 live births. Mothers of children with NLE most commonly have clinical Sjögren syndrome; however, anti-Ro/SSA and anti-LA/SSB antibodies may be present in 0.1% to 1.5% of healthy women, and 25% to 60% of women with autoimmune disease may be asymptomatic.1 As demonstrated in our case, when there is a family history of NLE in an infant from an earlier pregnancy, the risk for NLE increases to 17% to 20% in subsequent pregnancies1,3 and up to 25% in subsequent pregnancies if the initial child was diagnosed with a congenital heart block in the setting of NLE.1
Neonatal lupus erythematosus classically presents as annular erythematous macules and plaques with central scaling, telangictasia, atrophy, and pigmentary changes. It may start on the scalp and face and spread caudally.1,2 Patients may develop these lesions after UV exposure, and 80% of infants may not have dermatologic findings at birth. Importantly, 40% to 60% of mothers may be asymptomatic at the time of presentation of their child’s NLE.1 The diagnosis can be confirmed via antibody testing in the mother and/or infant. If performed, a punch biopsy shows interface dermatitis, vacuolar degeneration, and possible periadnexal lymphocytic infiltrates on histopathology.1,2
Management of cutaneous NLE includes sun protection (eg, application of sunscreen) and topical corticosteroids. Most dermatologic manifestations of NLE are transient, resolving after clearance of maternal IgG antibodies in 6 to 9 months; however, some telangiectasia, dyspigmentation, and atrophic scarring may persist.1-3
Neonatal lupus erythematosus also may have hepatobiliary, cardiac, hematologic, and less commonly neurologic manifestations. Hepatobiliary manifestations usually present as hepatomegaly or asymptomatic elevated transaminases or γ-glutamyl transferase.1,3 Approximately 10% to 20% of infants with NLE may present with transient anemia and thrombocytopenia.1 Cardiac manifestations are permanent and may require pacemaker implantation.1,3 The incidence of a congenital heart block in infants with NLE is 15% to 30%.3 Cardiac NLE most commonly injures the conductive tissue, leading to a congenital atrioventricular block. The development of a congenital heart block develops in the 18th to 24th week of gestation. Manifestations of a more advanced condition can include dilation of the ascending aorta and dilated cardiomyopathy.1 As such, patients need to be followed by a pediatric cardiologist for monitoring and treatment of any cardiac manifestations.
The overall prognosis of infants affected with NLE varies. Cardiac involvement is associated with a poor prognosis, while isolated cutaneous involvement requires little treatment and portends a favorable prognosis. It is critical for dermatologists to recognize NLE to refer patients to appropriate specialists to investigate and further monitor possible extracutaneous manifestations. With an understanding of the increased risk for a congenital heart block and NLE in subsequent pregnancies, mothers with positive anti-Ro/La antibodies should receive timely counseling and screening. In expectant mothers with suspected autoimmune disease, testing for antinuclear antibodies and SSA and SSB antibodies can be considered, as administration of hydroxychloroquine or prenatal systemic corticosteroids has proven to be effective in preventing a congenital heart block.1 Our patient was followed by pediatric cardiology and was not found to have a congenital heart block.
The differential diagnosis includes other causes of annular erythema in infants, as NLE can mimic several conditions. Tinea corporis may present as scaly annular plaques with central clearing; however, it rarely is encountered fulminantly in neonates.4 Erythema multiforme is a mucocutaneous hypersensitivy reaction distinguished by targetoid morphology.5 It is an exceedingly rare diagnosis in neonates; the average pediatric age of onset is 5.6 years.6 Erythema multiforme often is associated with an infection, most commonly herpes simplex virus,5 and mucosal involvement is common.6 Urticaria multiforme (also known as acute annular urticaria) is a benign disease that appears between 2 months to 3 years of age with blanchable urticarial plaques that likely are triggered by viral or bacterial infections, antibiotics, or vaccines.6 Specific lesions usually will resolve within 24 hours. Annular erythema of infancy is a benign and asymptomatic gyrate erythema that presents as annular plaques with palpable borders that spread centrifugally in patients younger than 1 year. Notably, lesions should periodically fade and may reappear cyclically for months to years. Evaluation for underlying disease usually is negative.6
The Diagnosis: Neonatal Lupus Erythematosus
A review of the medical records of the patient’s mother from her first pregnancy revealed positive anti-Ro/SSA (Sjögren syndrome A) (>8.0 U [reference range <1.0 U]) and anti-La/SSB (Sjögren syndrome B) antibodies (>8.0 U [reference range <1.0 U]), which were reconfirmed during her pregnancy with our patient (the second child). The patient’s older brother was diagnosed with neonatal lupus erythematosus (NLE) 2 years prior at 1 month of age; therefore, the mother took hydroxychloroquine during the pregnancy with the second child to help prevent heart block if the child was diagnosed with NLE. Given the family history, positive antibodies in the mother, and clinical presentation, our patient was diagnosed with NLE. He was referred to a pediatric cardiologist and pediatrician to continue the workup of systemic manifestations of NLE and to rule out the presence of congenital heart block. The rash resolved 6 months after the initial presentation, and he did not develop any systemic manifestations of NLE.
Neonatal lupus erythematosus is a rare acquired autoimmune disorder caused by the placental transfer of anti-Ro/SSA and anti-La/SSB antibodies and less commonly anti-U1 ribonucleoprotein antinuclear autoantibodies.1,2 Approximately 1% to 2% of mothers with these positive antibodies will have infants affected with NLE.2 The annual prevalence of NLE in the United States is approximately 1 in 20,000 live births. Mothers of children with NLE most commonly have clinical Sjögren syndrome; however, anti-Ro/SSA and anti-LA/SSB antibodies may be present in 0.1% to 1.5% of healthy women, and 25% to 60% of women with autoimmune disease may be asymptomatic.1 As demonstrated in our case, when there is a family history of NLE in an infant from an earlier pregnancy, the risk for NLE increases to 17% to 20% in subsequent pregnancies1,3 and up to 25% in subsequent pregnancies if the initial child was diagnosed with a congenital heart block in the setting of NLE.1
Neonatal lupus erythematosus classically presents as annular erythematous macules and plaques with central scaling, telangictasia, atrophy, and pigmentary changes. It may start on the scalp and face and spread caudally.1,2 Patients may develop these lesions after UV exposure, and 80% of infants may not have dermatologic findings at birth. Importantly, 40% to 60% of mothers may be asymptomatic at the time of presentation of their child’s NLE.1 The diagnosis can be confirmed via antibody testing in the mother and/or infant. If performed, a punch biopsy shows interface dermatitis, vacuolar degeneration, and possible periadnexal lymphocytic infiltrates on histopathology.1,2
Management of cutaneous NLE includes sun protection (eg, application of sunscreen) and topical corticosteroids. Most dermatologic manifestations of NLE are transient, resolving after clearance of maternal IgG antibodies in 6 to 9 months; however, some telangiectasia, dyspigmentation, and atrophic scarring may persist.1-3
Neonatal lupus erythematosus also may have hepatobiliary, cardiac, hematologic, and less commonly neurologic manifestations. Hepatobiliary manifestations usually present as hepatomegaly or asymptomatic elevated transaminases or γ-glutamyl transferase.1,3 Approximately 10% to 20% of infants with NLE may present with transient anemia and thrombocytopenia.1 Cardiac manifestations are permanent and may require pacemaker implantation.1,3 The incidence of a congenital heart block in infants with NLE is 15% to 30%.3 Cardiac NLE most commonly injures the conductive tissue, leading to a congenital atrioventricular block. The development of a congenital heart block develops in the 18th to 24th week of gestation. Manifestations of a more advanced condition can include dilation of the ascending aorta and dilated cardiomyopathy.1 As such, patients need to be followed by a pediatric cardiologist for monitoring and treatment of any cardiac manifestations.
The overall prognosis of infants affected with NLE varies. Cardiac involvement is associated with a poor prognosis, while isolated cutaneous involvement requires little treatment and portends a favorable prognosis. It is critical for dermatologists to recognize NLE to refer patients to appropriate specialists to investigate and further monitor possible extracutaneous manifestations. With an understanding of the increased risk for a congenital heart block and NLE in subsequent pregnancies, mothers with positive anti-Ro/La antibodies should receive timely counseling and screening. In expectant mothers with suspected autoimmune disease, testing for antinuclear antibodies and SSA and SSB antibodies can be considered, as administration of hydroxychloroquine or prenatal systemic corticosteroids has proven to be effective in preventing a congenital heart block.1 Our patient was followed by pediatric cardiology and was not found to have a congenital heart block.
The differential diagnosis includes other causes of annular erythema in infants, as NLE can mimic several conditions. Tinea corporis may present as scaly annular plaques with central clearing; however, it rarely is encountered fulminantly in neonates.4 Erythema multiforme is a mucocutaneous hypersensitivy reaction distinguished by targetoid morphology.5 It is an exceedingly rare diagnosis in neonates; the average pediatric age of onset is 5.6 years.6 Erythema multiforme often is associated with an infection, most commonly herpes simplex virus,5 and mucosal involvement is common.6 Urticaria multiforme (also known as acute annular urticaria) is a benign disease that appears between 2 months to 3 years of age with blanchable urticarial plaques that likely are triggered by viral or bacterial infections, antibiotics, or vaccines.6 Specific lesions usually will resolve within 24 hours. Annular erythema of infancy is a benign and asymptomatic gyrate erythema that presents as annular plaques with palpable borders that spread centrifugally in patients younger than 1 year. Notably, lesions should periodically fade and may reappear cyclically for months to years. Evaluation for underlying disease usually is negative.6
- Derdulska JM, Rudnicka L, Szykut-Badaczewska A, et al. Neonatal lupus erythematosus—practical guidelines. J Perinat Med. 2021;49:529-538. doi:10.1515/jpm-2020-0543
- Wu J, Berk-Krauss J, Glick SA. Neonatal lupus erythematosus. JAMA Dermatol. 2021;157:590. doi:10.1001/jamadermatol.2021.0041
- Hon KL, Leung AK. Neonatal lupus erythematosus. Autoimmune Dis. 2012;2012:301274. doi:10.1155/2012/301274
- Khare AK, Gupta LK, Mittal A, et al. Neonatal tinea corporis. Indian J Dermatol. 2010;55:201. doi:10.4103/0019-5154.6274
- Ang-Tiu CU, Nicolas ME. Erythema multiforme in a 25-day old neonate. Pediatr Dermatol. 2013;30:E118-E120. doi:10.1111 /j.1525-1470.2012.01873.x
- Agnihotri G, Tsoukas MM. Annular skin lesions in infancy [published online February 3, 2022]. Clin Dermatol. 2022;40:505-512. doi:10.1016/j.clindermatol.2021.12.011
- Derdulska JM, Rudnicka L, Szykut-Badaczewska A, et al. Neonatal lupus erythematosus—practical guidelines. J Perinat Med. 2021;49:529-538. doi:10.1515/jpm-2020-0543
- Wu J, Berk-Krauss J, Glick SA. Neonatal lupus erythematosus. JAMA Dermatol. 2021;157:590. doi:10.1001/jamadermatol.2021.0041
- Hon KL, Leung AK. Neonatal lupus erythematosus. Autoimmune Dis. 2012;2012:301274. doi:10.1155/2012/301274
- Khare AK, Gupta LK, Mittal A, et al. Neonatal tinea corporis. Indian J Dermatol. 2010;55:201. doi:10.4103/0019-5154.6274
- Ang-Tiu CU, Nicolas ME. Erythema multiforme in a 25-day old neonate. Pediatr Dermatol. 2013;30:E118-E120. doi:10.1111 /j.1525-1470.2012.01873.x
- Agnihotri G, Tsoukas MM. Annular skin lesions in infancy [published online February 3, 2022]. Clin Dermatol. 2022;40:505-512. doi:10.1016/j.clindermatol.2021.12.011
A 5-week-old infant boy presented with a rash at birth (left). The pregnancy was full term without complications, and he was otherwise healthy. A family history revealed that his older brother developed a similar rash 2 weeks after birth (right). Physical examination revealed polycyclic annular patches with an erythematous border and central clearing diffusely located on the trunk, extremities, scalp, and face with periorbital edema.
Shiny Indurated Plaques on the Legs
The Diagnosis: Pretibial Myxedema
Histopathology showed superficial and deep mucin deposition with proliferation of fibroblasts and thin wiry collagen bundles that were consistent with a diagnosis of pretibial myxedema. The patient was treated with clobetasol ointment 0.05% twice daily for 3 months, followed by a trial of pentoxifylline 400 mg 3 times daily for 3 months. After this treatment failed, she was started on rituximab infusions of 1 g biweekly for 1 month, followed by 500 mg at 6 months, with marked improvement after the first 2 doses of 1 g.
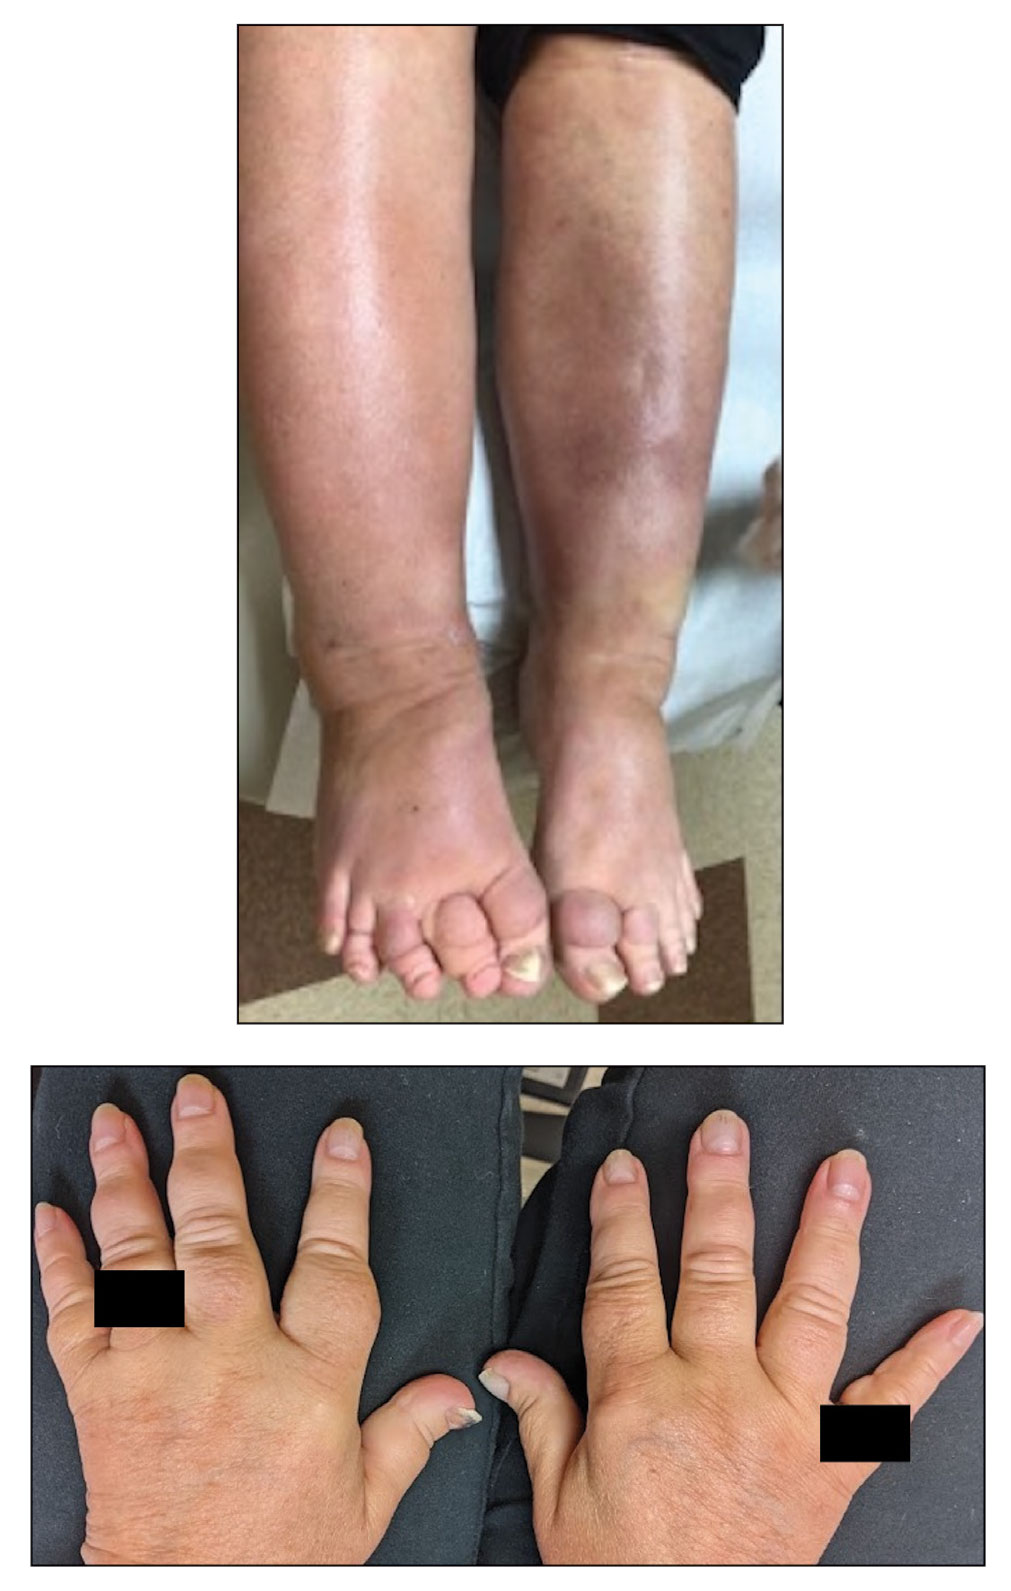
Pretibial myxedema is an uncommon cutaneous manifestation of autoimmune thyroid disease, occurring in 1% to 5% of patients with Graves disease. It usually occurs in older adult women on the pretibial regions and less commonly on the upper extremities, face, and areas of prior trauma.1-3 Although typically asymptomatic, it can be painful and ulcerate.3 The clinical presentation consists of bilateral nonpitting edema with overlying indurated skin as well as flesh-colored, yellow-brown, violaceous, or peau d’orange papules and plaques.2,3 Lesions develop over months and often have been associated with hyperhidrosis and hypertrichosis.2 Many variants have been identified including nodular, plaquelike, diffuse swelling (ie, nonpitting edema), tumor, mixture, polypoid, and elephantiasis; severe cases with acral involvement are termed thyroid acropachy.1-3 Pathogenesis likely involves the activation of thyrotropin receptors on fibroblasts by the circulating thyrotropin autoantibodies found in Graves disease. Activated fibroblasts upregulate glycosaminoglycan production, which osmotically drives the accumulation of dermal and subdermal fluid.1,3
This diagnosis should be considered in any patient with pretibial edema or edema in areas of trauma. Graves disease most commonly is diagnosed 1 to 2 years prior to the development of pretibial myxedema; other extrathyroidal manifestations, most commonly ophthalmopathies, almost always are found in patients with pretibial myxedema. If a diagnosis of Graves disease has not been established, thyroid studies, including thyrotropin receptor antibody serum levels, should be obtained. Histopathology showing increased mucin in the dermis and increased fibroblasts can aid in diagnosis.2,3
The differential diagnosis includes inflammatory dermatoses, such as stasis dermatitis and lipodermatosclerosis. Stasis dermatitis is characterized by lichenified yellowbrown plaques that present on the lower extremities; lipodermatosclerosis then can develop and present as atrophic sclerotic plaques with a champagne bottle–like appearance. Necrobiosis lipoidica demonstrates atrophic, shiny, yellow plaques with telangiectases and ulcerations. Hypertrophic lichen planus presents with hyperkeratotic hyperpigmented plaques on the shins.1,2 Other diseases of cutaneous mucin deposition, namely scleromyxedema, demonstrate similar physical findings but more commonly are located on the trunk, face, and dorsal hands rather than the lower extremities.1-3
Treatment of pretibial myxedema is difficult; normalization of thyroid function, weight reduction, and compression stockings can help reduce edema. Medical therapies aim to decrease glycosaminoglycan production by fibroblasts. First-line treatment includes topical steroids under occlusion, and second-line therapies include intralesional steroids, systemic corticosteroids, pentoxifylline, and octreotide.2,3 Therapies for refractory disease include plasmapheresis, surgical excision, radiotherapy, and intravenous immunoglobulin; more recent studies also endorse the use of isotretinoin, intralesional hyaluronidase, and rituximab.2,4 Success also has been observed with the insulin growth factor 1 receptor inhibitor teprotumumab in active thyroid eye disease, in which insulin growth factor 1 receptor is overexpressed by fibroblasts. Given the similar pathogenesis of thyroid ophthalmopathy with other extrathyroidal manifestations, teprotumumab is a promising option for refractory cases of pretibial myxedema and has led to disease resolution in several patients.4
- Fatourechi V, Pajouhi M, Fransway AF. Dermopathy of Graves disease (pretibial myxedema). review of 150 cases. Medicine (Baltimore). 1994;73:1-7. doi:10.1097/00005792-199401000-00001
- Ai J, Leonhardt JM, Heymann WR. Autoimmune thyroid diseases: etiology, pathogenesis, and dermatologic manifestations. J Am Acad Dermatol. 2003;48:641-662. doi:10.1067/mjd.2003.257
- Schwartz KM, Fatourechi V, Ahmed DDF, et al. Dermopathy of Graves’ disease (pretibial myxedema): long-term outcome. J Clin Endocrinol Metab. 2002;87:438-446. doi:10.1210/jcem.87.2.8220
- Varma A, Rheeman C, Levitt J. Resolution of pretibial myxedema with teprotumumab in a patient with Graves disease. JAAD Case Reports. 2020;6:1281-1282. doi:10.1016/j.jdcr.2020.09.003
The Diagnosis: Pretibial Myxedema
Histopathology showed superficial and deep mucin deposition with proliferation of fibroblasts and thin wiry collagen bundles that were consistent with a diagnosis of pretibial myxedema. The patient was treated with clobetasol ointment 0.05% twice daily for 3 months, followed by a trial of pentoxifylline 400 mg 3 times daily for 3 months. After this treatment failed, she was started on rituximab infusions of 1 g biweekly for 1 month, followed by 500 mg at 6 months, with marked improvement after the first 2 doses of 1 g.
Pretibial myxedema is an uncommon cutaneous manifestation of autoimmune thyroid disease, occurring in 1% to 5% of patients with Graves disease. It usually occurs in older adult women on the pretibial regions and less commonly on the upper extremities, face, and areas of prior trauma.1-3 Although typically asymptomatic, it can be painful and ulcerate.3 The clinical presentation consists of bilateral nonpitting edema with overlying indurated skin as well as flesh-colored, yellow-brown, violaceous, or peau d’orange papules and plaques.2,3 Lesions develop over months and often have been associated with hyperhidrosis and hypertrichosis.2 Many variants have been identified including nodular, plaquelike, diffuse swelling (ie, nonpitting edema), tumor, mixture, polypoid, and elephantiasis; severe cases with acral involvement are termed thyroid acropachy.1-3 Pathogenesis likely involves the activation of thyrotropin receptors on fibroblasts by the circulating thyrotropin autoantibodies found in Graves disease. Activated fibroblasts upregulate glycosaminoglycan production, which osmotically drives the accumulation of dermal and subdermal fluid.1,3
This diagnosis should be considered in any patient with pretibial edema or edema in areas of trauma. Graves disease most commonly is diagnosed 1 to 2 years prior to the development of pretibial myxedema; other extrathyroidal manifestations, most commonly ophthalmopathies, almost always are found in patients with pretibial myxedema. If a diagnosis of Graves disease has not been established, thyroid studies, including thyrotropin receptor antibody serum levels, should be obtained. Histopathology showing increased mucin in the dermis and increased fibroblasts can aid in diagnosis.2,3
The differential diagnosis includes inflammatory dermatoses, such as stasis dermatitis and lipodermatosclerosis. Stasis dermatitis is characterized by lichenified yellowbrown plaques that present on the lower extremities; lipodermatosclerosis then can develop and present as atrophic sclerotic plaques with a champagne bottle–like appearance. Necrobiosis lipoidica demonstrates atrophic, shiny, yellow plaques with telangiectases and ulcerations. Hypertrophic lichen planus presents with hyperkeratotic hyperpigmented plaques on the shins.1,2 Other diseases of cutaneous mucin deposition, namely scleromyxedema, demonstrate similar physical findings but more commonly are located on the trunk, face, and dorsal hands rather than the lower extremities.1-3
Treatment of pretibial myxedema is difficult; normalization of thyroid function, weight reduction, and compression stockings can help reduce edema. Medical therapies aim to decrease glycosaminoglycan production by fibroblasts. First-line treatment includes topical steroids under occlusion, and second-line therapies include intralesional steroids, systemic corticosteroids, pentoxifylline, and octreotide.2,3 Therapies for refractory disease include plasmapheresis, surgical excision, radiotherapy, and intravenous immunoglobulin; more recent studies also endorse the use of isotretinoin, intralesional hyaluronidase, and rituximab.2,4 Success also has been observed with the insulin growth factor 1 receptor inhibitor teprotumumab in active thyroid eye disease, in which insulin growth factor 1 receptor is overexpressed by fibroblasts. Given the similar pathogenesis of thyroid ophthalmopathy with other extrathyroidal manifestations, teprotumumab is a promising option for refractory cases of pretibial myxedema and has led to disease resolution in several patients.4
The Diagnosis: Pretibial Myxedema
Histopathology showed superficial and deep mucin deposition with proliferation of fibroblasts and thin wiry collagen bundles that were consistent with a diagnosis of pretibial myxedema. The patient was treated with clobetasol ointment 0.05% twice daily for 3 months, followed by a trial of pentoxifylline 400 mg 3 times daily for 3 months. After this treatment failed, she was started on rituximab infusions of 1 g biweekly for 1 month, followed by 500 mg at 6 months, with marked improvement after the first 2 doses of 1 g.
Pretibial myxedema is an uncommon cutaneous manifestation of autoimmune thyroid disease, occurring in 1% to 5% of patients with Graves disease. It usually occurs in older adult women on the pretibial regions and less commonly on the upper extremities, face, and areas of prior trauma.1-3 Although typically asymptomatic, it can be painful and ulcerate.3 The clinical presentation consists of bilateral nonpitting edema with overlying indurated skin as well as flesh-colored, yellow-brown, violaceous, or peau d’orange papules and plaques.2,3 Lesions develop over months and often have been associated with hyperhidrosis and hypertrichosis.2 Many variants have been identified including nodular, plaquelike, diffuse swelling (ie, nonpitting edema), tumor, mixture, polypoid, and elephantiasis; severe cases with acral involvement are termed thyroid acropachy.1-3 Pathogenesis likely involves the activation of thyrotropin receptors on fibroblasts by the circulating thyrotropin autoantibodies found in Graves disease. Activated fibroblasts upregulate glycosaminoglycan production, which osmotically drives the accumulation of dermal and subdermal fluid.1,3
This diagnosis should be considered in any patient with pretibial edema or edema in areas of trauma. Graves disease most commonly is diagnosed 1 to 2 years prior to the development of pretibial myxedema; other extrathyroidal manifestations, most commonly ophthalmopathies, almost always are found in patients with pretibial myxedema. If a diagnosis of Graves disease has not been established, thyroid studies, including thyrotropin receptor antibody serum levels, should be obtained. Histopathology showing increased mucin in the dermis and increased fibroblasts can aid in diagnosis.2,3
The differential diagnosis includes inflammatory dermatoses, such as stasis dermatitis and lipodermatosclerosis. Stasis dermatitis is characterized by lichenified yellowbrown plaques that present on the lower extremities; lipodermatosclerosis then can develop and present as atrophic sclerotic plaques with a champagne bottle–like appearance. Necrobiosis lipoidica demonstrates atrophic, shiny, yellow plaques with telangiectases and ulcerations. Hypertrophic lichen planus presents with hyperkeratotic hyperpigmented plaques on the shins.1,2 Other diseases of cutaneous mucin deposition, namely scleromyxedema, demonstrate similar physical findings but more commonly are located on the trunk, face, and dorsal hands rather than the lower extremities.1-3
Treatment of pretibial myxedema is difficult; normalization of thyroid function, weight reduction, and compression stockings can help reduce edema. Medical therapies aim to decrease glycosaminoglycan production by fibroblasts. First-line treatment includes topical steroids under occlusion, and second-line therapies include intralesional steroids, systemic corticosteroids, pentoxifylline, and octreotide.2,3 Therapies for refractory disease include plasmapheresis, surgical excision, radiotherapy, and intravenous immunoglobulin; more recent studies also endorse the use of isotretinoin, intralesional hyaluronidase, and rituximab.2,4 Success also has been observed with the insulin growth factor 1 receptor inhibitor teprotumumab in active thyroid eye disease, in which insulin growth factor 1 receptor is overexpressed by fibroblasts. Given the similar pathogenesis of thyroid ophthalmopathy with other extrathyroidal manifestations, teprotumumab is a promising option for refractory cases of pretibial myxedema and has led to disease resolution in several patients.4
- Fatourechi V, Pajouhi M, Fransway AF. Dermopathy of Graves disease (pretibial myxedema). review of 150 cases. Medicine (Baltimore). 1994;73:1-7. doi:10.1097/00005792-199401000-00001
- Ai J, Leonhardt JM, Heymann WR. Autoimmune thyroid diseases: etiology, pathogenesis, and dermatologic manifestations. J Am Acad Dermatol. 2003;48:641-662. doi:10.1067/mjd.2003.257
- Schwartz KM, Fatourechi V, Ahmed DDF, et al. Dermopathy of Graves’ disease (pretibial myxedema): long-term outcome. J Clin Endocrinol Metab. 2002;87:438-446. doi:10.1210/jcem.87.2.8220
- Varma A, Rheeman C, Levitt J. Resolution of pretibial myxedema with teprotumumab in a patient with Graves disease. JAAD Case Reports. 2020;6:1281-1282. doi:10.1016/j.jdcr.2020.09.003
- Fatourechi V, Pajouhi M, Fransway AF. Dermopathy of Graves disease (pretibial myxedema). review of 150 cases. Medicine (Baltimore). 1994;73:1-7. doi:10.1097/00005792-199401000-00001
- Ai J, Leonhardt JM, Heymann WR. Autoimmune thyroid diseases: etiology, pathogenesis, and dermatologic manifestations. J Am Acad Dermatol. 2003;48:641-662. doi:10.1067/mjd.2003.257
- Schwartz KM, Fatourechi V, Ahmed DDF, et al. Dermopathy of Graves’ disease (pretibial myxedema): long-term outcome. J Clin Endocrinol Metab. 2002;87:438-446. doi:10.1210/jcem.87.2.8220
- Varma A, Rheeman C, Levitt J. Resolution of pretibial myxedema with teprotumumab in a patient with Graves disease. JAAD Case Reports. 2020;6:1281-1282. doi:10.1016/j.jdcr.2020.09.003
A 70-year-old woman presented with pain and swelling in both legs of many years’ duration. She had no history of skin disease. Physical examination revealed shiny indurated plaques on the legs, ankles, and toes with limited range of motion in the ankles (top). Marked thickening of the hands and index fingers also was noted (bottom). A punch biopsy of the distal pretibial region was performed.
Squamous Cell Carcinoma
THE COMPARISON
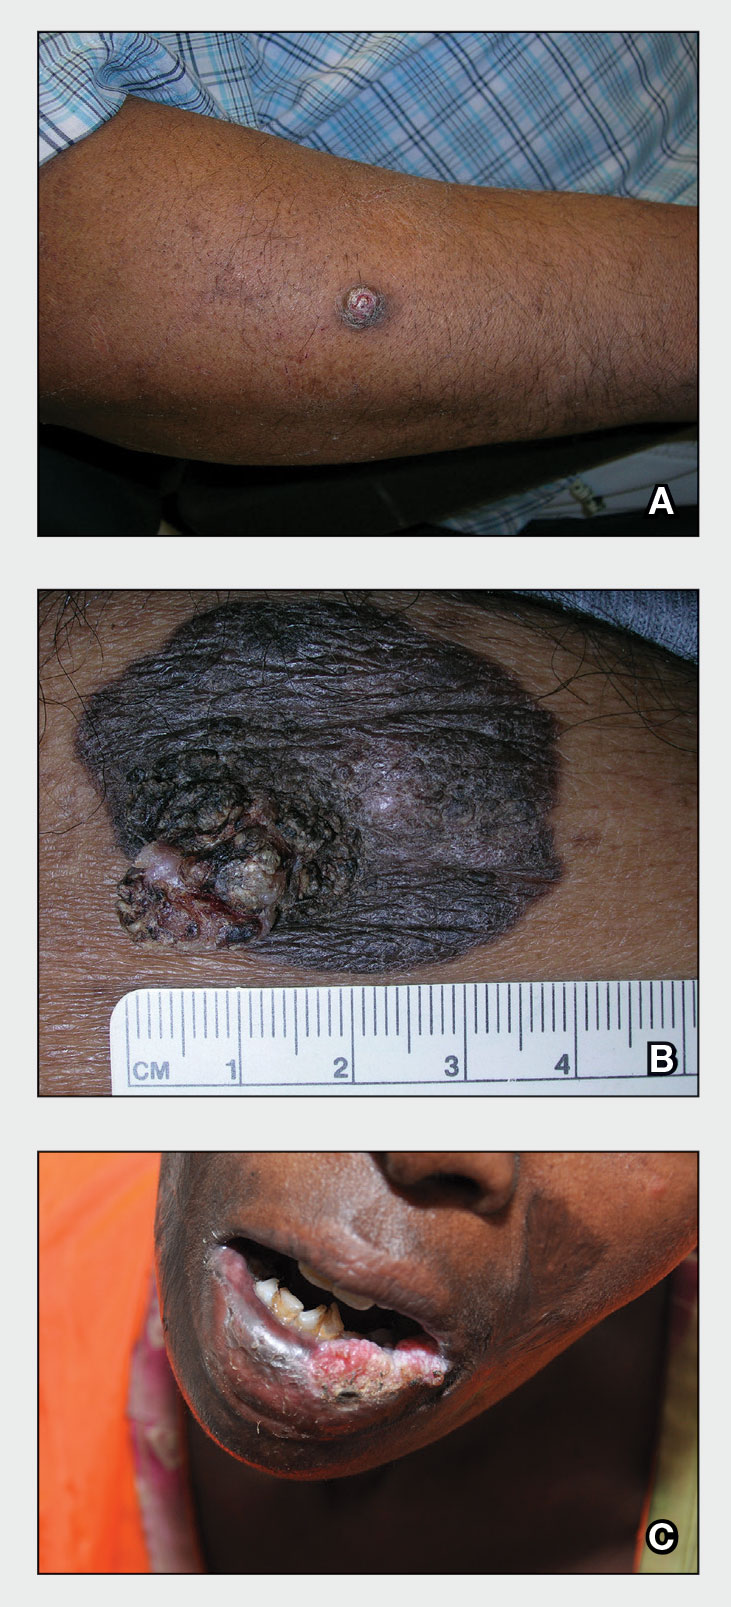
A A 51-year-old Hispanic man with a squamous cell carcinoma (SCC) of the keratoacanthoma type on the arm.
B A 75-year-old Black man with an SCC of the keratoacanthoma type on the abdomen.
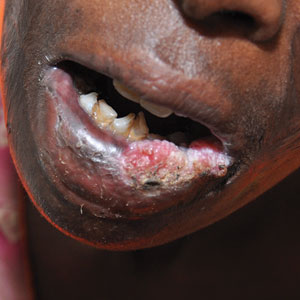
C An African woman with an SCC on the lower lip decades after a large facial burn, which is known as a Marjolin ulcer.
Cutaneous squamous cell carcinoma (SCC) develops from a malignant tumor of the keratinocytes, eccrine glands, or pilosebaceous units that invades the dermis. Risk factors include lighter skin tone, higher cumulative sun exposure, human papillomavirus (HPV) infection, hidradenitis suppurativa (HS), lichen sclerosus, family history of skin cancer,1 and immunosuppression.2 It typically affects sun-exposed areas of the body such as the face, scalp, neck, and extensor surfaces of the arms (Figure, A).3,4 However, in those with darker skin tones, the most common anatomic sites are those that are not exposed to the sun (Figure, B). Squamous cell carcinoma is diagnosed via skin biopsy. Treatment options include surgical excision, destructive methods such as electrodesiccation and curettage, and Mohs micrographic surgery. Cutaneous SCC has a cure rate of more than 95% and a mortality rate of 1.5% to 2% in the United States.3
Epidemiology
Squamous cell carcinoma is the most common skin cancer occurring in Black individuals, manifesting primarily in the fifth decade of life.5-7 It is the second most common skin cancer in White, Hispanic, and Asian individuals and is more common in males.8 In a study of organ transplant recipients (N=413), Pritchett et al9 reported that HPV infection was a major risk factor in Hispanic patients because 66.7% of those with SCC had a history of HPV. However, HPV is a risk factor for SCC in all ethnic groups.10
Key clinical features in people with darker skin tones
Anatomic location
- The lower legs and anogenital areas are the most common sites for SCC in patients with skin of color.4,11
- In Black women, SCC occurs more often on sun-exposed areas such as the arms and legs compared to Black men.7,12-14
- The genitalia, perianal area, ocular mucosa, and oral mucosa are the least likely areas to be routinely examined, even in skin cancer clinics that see high-risk patients, despite the SCC risk in the anogenital area.15,16
- Squamous cell carcinoma of the lips and scalp is more likely to occur in Black women vs Black men.4,7,17 Clinical appearance
- In those with darker skin tones, SCCs may appear hyperpigmented4 or hyperkeratotic with a lack of erythema and an inconsistent appearance.6,7,18
- A nonhealing ulceration of the skin should prompt a biopsy to rule out SCC.3,19
Worth noting
In patients with darker skin tones, the risk for SCC increases in areas with chronic inflammation and scarring of the skin.4,6,7,11,18,20-22 In Black patients, 20% to 40% of cases of SCC occur in the setting of chronic inflammation and scarring.6,7,18 Chronic inflammatory conditions include ulcers, lupus vulgaris, discoid lupus erythematosus, and HPV. In patients with discoid lupus erythematosus, there is an additive effect of sun exposure on the scars, which may play a role in the pathogenesis and metastasis risk for skin cancer in Black patients.4 Other scarring conditions include thermal or chemical burn scars, areas of physical trauma, and prior sites of radiation treatment.14,23 Squamous cell carcinoma arising in a burn scar is called a Marjolin ulcer or malignant degeneration of a scar (Figure, C). It is reported more often in lower-income, underresourced countries, which may suggest the need for early detection in populations with skin of color.24
Squamous cell carcinoma is more aggressive in sites that are not exposed to sun compared to sun-exposed areas.17,25
The risk for SCC is increased in immunocompromised patients,2 especially those with HPV.10
The prevalence of SCC in those with HS is approximately 4.6%. The chronic inflammation and irritation from HS in association with other risk factors such as tobacco use may contribute to the malignant transformation to SCC.26
Health disparity highlight
- The risk for metastasis from SCC is 20% to 40% in Black patients vs 1% to 4% in White patients.4,6,27
- Penile SCC was associated with a lower overall survival rate in patients of African descent.20,21
- The increased morbidity and mortality from SCC in patients with skin of color may be attributed to delays in diagnosis and treatment as well as an incomplete understanding of tumor genetics.4,6,18
Acknowledgment—The authors thank Elyse Gadra (Philadelphia, Pennsylvania) for assistance in the preparation of this manuscript.
- Asgari MM, Warton EM, Whittemore AS. Family history of skin cancer is associated with increased risk of cutaneous squamous cell carcinoma. Dermatol Surg. 2015;41:481-486. doi:10.1097/DSS.0000000000000292
- Harwood CA, Surentheran T, McGregor JM, et al. Human papillomavirus infection and non-melanoma skin cancer in immunosuppressed and immunocompetent individuals. J Med Virol. 2000;61:289-297. doi:10.1002/1096-9071(200007)61:3<289::aid-jmv2>3.0.co;2-z
- Kallini JR, Nouran H, Khachemoune A. Squamous cell carcinoma of the skin: epidemiology, classification, management, and novel trends. Int J Dermatol. 2015;54:130-140. https://doi.org/10.1111/ijd.12553.
- Agbai ON, Buster K, Sanchez M, et al. Skin cancer and photoprotection in people of color: a review and recommendations for physicians and the public [published online January 28, 2014]. J Am Acad Dermatol. 2014;70:748-762. doi:10.1016/j.jaad.2013.11.038
- Bradford PT. Skin cancer in skin of color. Dermatol Nurse. 2009;21:170-177.
- Gloster HM, Neal K. Skin cancer in skin of color. J Am Acad Dermatol. 2006;55:741-760.
- Davis DS, Robinson C, Callender VD. Skin cancer in women of color: epidemiology, pathogenesis and clinical manifestations. Int J Womens Dermatol. 2021;7:127-134. https://doi.org/10.1016/j.ijwd.2021.01.017
- Baum B, Duarte AM. Skin cancer epidemic in American Hispanic and Latino patients. In: Silverberg N, Duran-McKinster C, Tay Y-K, eds. Pediatric Skin of Color. Springer; 2015:453-460.
- Pritchett EN, Doyle A, Shaver CM, et al. Nonmelanoma skin cancer in nonwhite organ transplant recipients. JAMA Dermatol. 2016;152: 1348-1353. doi:10.1001/jamadermatol.2016.3328
- Karagas MR, Nelson HH, Sehr P, et al. Human papillomavirus infection and incidence of squamous cell and basal cell carcinomas of the skin. J Natl Cancer Inst. 2006;98:389-395. doi:10.1093/jnci/djj092
- Gohara M. Skin cancer: an African perspective. Br J Dermatol. 2015;173: 17-21. https://doi.org/10.1111/bjd.13380
- Armstrong BK, Kricker A. The epidemiology of UV induced skin cancer. J Photochem Photobiol B. 2001;63:8-18. doi:10.1016/s1011-1344(01)00198-1
- Halder RM, Bang KM. Skin cancer in African Americans in the United States. Dermatol Clin. 1988;6:397-407.
- Mora RG, Perniciaro C. Cancer of the skin in blacks. I. a review of 163 black patients with cutaneous squamous cell carcinoma. J Am Acad Dermatol. 1981;5:535-543. doi:10.1016/s0190-9622(81)70113-0
- Bajaj S, Wolner ZJ, Dusza SW, et al. Total body skin examination practices: a survey study amongst dermatologists at high-risk skin cancer clinics. Dermatol Pract Concept. 2019;9:132-138. doi:10.5826/dpc.0902a09
- Rieder EA, Mu EW, Wang J, et al. Dermatologist practices during total body skin examinations: a survey study. J Drugs Dermatol. 2018;17:516-520.
- Halder RM, Ara CJ. Skin cancer and photoaging in ethnic skin. Dermatol Clin. 2003;21:725-732, x. doi: 10.1016/s0733-8635(03)00085-8
- Higgins S, Nazemi A, Chow M, et al. Review of nonmelanoma skin cancer in African Americans, Hispanics, and Asians. Dermatol Surg. 2018;44:903-910.
- Sng J, Koh D, Siong WC, et al. Skin cancer trends among Asians living in Singapore from 1968 to 2006. J Am Acad Dermatol. 2009;61:426-432.
- Shao K, Feng H. Racial and ethnic healthcare disparities in skin cancer in the United States: a review of existing inequities, contributing factors, and potential solutions. J Clin Aesthet Dermatol. 2022;15:16-22.
- Shao K, Hooper J, Feng H. Racial and ethnic health disparities in dermatology in the United States. part 2: disease-specific epidemiology, characteristics, management, and outcomes. J Am Acad Dermatol. 2022;87:733-744. https://doi.org/10.1016/j.jaad.2021.12.062
- Zakhem GA, Pulavarty AN, Lester JC, et al. Skin cancer in people of color: a systematic review. Am J Clin Dermatol. 2022;23:137-151. https://doi.org/10.1007/s40257-021-00662-z
- Copcu E, Aktas A, Sis¸man N, et al. Thirty-one cases of Marjolin’s ulcer. Clin Exp Dermatol. 2003;28:138-141. doi:10.1046/j.1365-2230.2003.01210.x
- Abdi MA, Yan M, Hanna TP. Systematic review of modern case series of squamous cell cancer arising in a chronic ulcer (Marjolin’s ulcer) of the skin. JCO Glob Oncol. 2020;6:809-818. doi:10.1200/GO.20.00094
- Hogue L, Harvey VM. Basal cell carcinoma, squamous cell carcinoma, and cutaneous melanoma in skin of color patients. Dermatol Clin. 2019;37:519-526. doi:10.1016/j.det.2019.05.009
- Chapman S, Delgadillo D, Barber C, et al. Cutanteous squamous cell complicating hidradenitis suppurativa: a review of the prevalence, pathogenesis, and treatment of this dreaded complication. Acta Dermatovenerol Al Pannocica Adriat. 2018;27:25-28.
- Kailas A, Botwin AL, Pritchett EN, et al. Assessing the effectiveness of knowledge-based interventions in increasing skin cancer awareness, knowledge, and protective behaviors in skin of color populations. Cutis. 2017;100:235-240.
THE COMPARISON
A A 51-year-old Hispanic man with a squamous cell carcinoma (SCC) of the keratoacanthoma type on the arm.
B A 75-year-old Black man with an SCC of the keratoacanthoma type on the abdomen.
C An African woman with an SCC on the lower lip decades after a large facial burn, which is known as a Marjolin ulcer.
Cutaneous squamous cell carcinoma (SCC) develops from a malignant tumor of the keratinocytes, eccrine glands, or pilosebaceous units that invades the dermis. Risk factors include lighter skin tone, higher cumulative sun exposure, human papillomavirus (HPV) infection, hidradenitis suppurativa (HS), lichen sclerosus, family history of skin cancer,1 and immunosuppression.2 It typically affects sun-exposed areas of the body such as the face, scalp, neck, and extensor surfaces of the arms (Figure, A).3,4 However, in those with darker skin tones, the most common anatomic sites are those that are not exposed to the sun (Figure, B). Squamous cell carcinoma is diagnosed via skin biopsy. Treatment options include surgical excision, destructive methods such as electrodesiccation and curettage, and Mohs micrographic surgery. Cutaneous SCC has a cure rate of more than 95% and a mortality rate of 1.5% to 2% in the United States.3
Epidemiology
Squamous cell carcinoma is the most common skin cancer occurring in Black individuals, manifesting primarily in the fifth decade of life.5-7 It is the second most common skin cancer in White, Hispanic, and Asian individuals and is more common in males.8 In a study of organ transplant recipients (N=413), Pritchett et al9 reported that HPV infection was a major risk factor in Hispanic patients because 66.7% of those with SCC had a history of HPV. However, HPV is a risk factor for SCC in all ethnic groups.10
Key clinical features in people with darker skin tones
Anatomic location
- The lower legs and anogenital areas are the most common sites for SCC in patients with skin of color.4,11
- In Black women, SCC occurs more often on sun-exposed areas such as the arms and legs compared to Black men.7,12-14
- The genitalia, perianal area, ocular mucosa, and oral mucosa are the least likely areas to be routinely examined, even in skin cancer clinics that see high-risk patients, despite the SCC risk in the anogenital area.15,16
- Squamous cell carcinoma of the lips and scalp is more likely to occur in Black women vs Black men.4,7,17 Clinical appearance
- In those with darker skin tones, SCCs may appear hyperpigmented4 or hyperkeratotic with a lack of erythema and an inconsistent appearance.6,7,18
- A nonhealing ulceration of the skin should prompt a biopsy to rule out SCC.3,19
Worth noting
In patients with darker skin tones, the risk for SCC increases in areas with chronic inflammation and scarring of the skin.4,6,7,11,18,20-22 In Black patients, 20% to 40% of cases of SCC occur in the setting of chronic inflammation and scarring.6,7,18 Chronic inflammatory conditions include ulcers, lupus vulgaris, discoid lupus erythematosus, and HPV. In patients with discoid lupus erythematosus, there is an additive effect of sun exposure on the scars, which may play a role in the pathogenesis and metastasis risk for skin cancer in Black patients.4 Other scarring conditions include thermal or chemical burn scars, areas of physical trauma, and prior sites of radiation treatment.14,23 Squamous cell carcinoma arising in a burn scar is called a Marjolin ulcer or malignant degeneration of a scar (Figure, C). It is reported more often in lower-income, underresourced countries, which may suggest the need for early detection in populations with skin of color.24
Squamous cell carcinoma is more aggressive in sites that are not exposed to sun compared to sun-exposed areas.17,25
The risk for SCC is increased in immunocompromised patients,2 especially those with HPV.10
The prevalence of SCC in those with HS is approximately 4.6%. The chronic inflammation and irritation from HS in association with other risk factors such as tobacco use may contribute to the malignant transformation to SCC.26
Health disparity highlight
- The risk for metastasis from SCC is 20% to 40% in Black patients vs 1% to 4% in White patients.4,6,27
- Penile SCC was associated with a lower overall survival rate in patients of African descent.20,21
- The increased morbidity and mortality from SCC in patients with skin of color may be attributed to delays in diagnosis and treatment as well as an incomplete understanding of tumor genetics.4,6,18
Acknowledgment—The authors thank Elyse Gadra (Philadelphia, Pennsylvania) for assistance in the preparation of this manuscript.
THE COMPARISON
A A 51-year-old Hispanic man with a squamous cell carcinoma (SCC) of the keratoacanthoma type on the arm.
B A 75-year-old Black man with an SCC of the keratoacanthoma type on the abdomen.
C An African woman with an SCC on the lower lip decades after a large facial burn, which is known as a Marjolin ulcer.
Cutaneous squamous cell carcinoma (SCC) develops from a malignant tumor of the keratinocytes, eccrine glands, or pilosebaceous units that invades the dermis. Risk factors include lighter skin tone, higher cumulative sun exposure, human papillomavirus (HPV) infection, hidradenitis suppurativa (HS), lichen sclerosus, family history of skin cancer,1 and immunosuppression.2 It typically affects sun-exposed areas of the body such as the face, scalp, neck, and extensor surfaces of the arms (Figure, A).3,4 However, in those with darker skin tones, the most common anatomic sites are those that are not exposed to the sun (Figure, B). Squamous cell carcinoma is diagnosed via skin biopsy. Treatment options include surgical excision, destructive methods such as electrodesiccation and curettage, and Mohs micrographic surgery. Cutaneous SCC has a cure rate of more than 95% and a mortality rate of 1.5% to 2% in the United States.3
Epidemiology
Squamous cell carcinoma is the most common skin cancer occurring in Black individuals, manifesting primarily in the fifth decade of life.5-7 It is the second most common skin cancer in White, Hispanic, and Asian individuals and is more common in males.8 In a study of organ transplant recipients (N=413), Pritchett et al9 reported that HPV infection was a major risk factor in Hispanic patients because 66.7% of those with SCC had a history of HPV. However, HPV is a risk factor for SCC in all ethnic groups.10
Key clinical features in people with darker skin tones
Anatomic location
- The lower legs and anogenital areas are the most common sites for SCC in patients with skin of color.4,11
- In Black women, SCC occurs more often on sun-exposed areas such as the arms and legs compared to Black men.7,12-14
- The genitalia, perianal area, ocular mucosa, and oral mucosa are the least likely areas to be routinely examined, even in skin cancer clinics that see high-risk patients, despite the SCC risk in the anogenital area.15,16
- Squamous cell carcinoma of the lips and scalp is more likely to occur in Black women vs Black men.4,7,17 Clinical appearance
- In those with darker skin tones, SCCs may appear hyperpigmented4 or hyperkeratotic with a lack of erythema and an inconsistent appearance.6,7,18
- A nonhealing ulceration of the skin should prompt a biopsy to rule out SCC.3,19
Worth noting
In patients with darker skin tones, the risk for SCC increases in areas with chronic inflammation and scarring of the skin.4,6,7,11,18,20-22 In Black patients, 20% to 40% of cases of SCC occur in the setting of chronic inflammation and scarring.6,7,18 Chronic inflammatory conditions include ulcers, lupus vulgaris, discoid lupus erythematosus, and HPV. In patients with discoid lupus erythematosus, there is an additive effect of sun exposure on the scars, which may play a role in the pathogenesis and metastasis risk for skin cancer in Black patients.4 Other scarring conditions include thermal or chemical burn scars, areas of physical trauma, and prior sites of radiation treatment.14,23 Squamous cell carcinoma arising in a burn scar is called a Marjolin ulcer or malignant degeneration of a scar (Figure, C). It is reported more often in lower-income, underresourced countries, which may suggest the need for early detection in populations with skin of color.24
Squamous cell carcinoma is more aggressive in sites that are not exposed to sun compared to sun-exposed areas.17,25
The risk for SCC is increased in immunocompromised patients,2 especially those with HPV.10
The prevalence of SCC in those with HS is approximately 4.6%. The chronic inflammation and irritation from HS in association with other risk factors such as tobacco use may contribute to the malignant transformation to SCC.26
Health disparity highlight
- The risk for metastasis from SCC is 20% to 40% in Black patients vs 1% to 4% in White patients.4,6,27
- Penile SCC was associated with a lower overall survival rate in patients of African descent.20,21
- The increased morbidity and mortality from SCC in patients with skin of color may be attributed to delays in diagnosis and treatment as well as an incomplete understanding of tumor genetics.4,6,18
Acknowledgment—The authors thank Elyse Gadra (Philadelphia, Pennsylvania) for assistance in the preparation of this manuscript.
- Asgari MM, Warton EM, Whittemore AS. Family history of skin cancer is associated with increased risk of cutaneous squamous cell carcinoma. Dermatol Surg. 2015;41:481-486. doi:10.1097/DSS.0000000000000292
- Harwood CA, Surentheran T, McGregor JM, et al. Human papillomavirus infection and non-melanoma skin cancer in immunosuppressed and immunocompetent individuals. J Med Virol. 2000;61:289-297. doi:10.1002/1096-9071(200007)61:3<289::aid-jmv2>3.0.co;2-z
- Kallini JR, Nouran H, Khachemoune A. Squamous cell carcinoma of the skin: epidemiology, classification, management, and novel trends. Int J Dermatol. 2015;54:130-140. https://doi.org/10.1111/ijd.12553.
- Agbai ON, Buster K, Sanchez M, et al. Skin cancer and photoprotection in people of color: a review and recommendations for physicians and the public [published online January 28, 2014]. J Am Acad Dermatol. 2014;70:748-762. doi:10.1016/j.jaad.2013.11.038
- Bradford PT. Skin cancer in skin of color. Dermatol Nurse. 2009;21:170-177.
- Gloster HM, Neal K. Skin cancer in skin of color. J Am Acad Dermatol. 2006;55:741-760.
- Davis DS, Robinson C, Callender VD. Skin cancer in women of color: epidemiology, pathogenesis and clinical manifestations. Int J Womens Dermatol. 2021;7:127-134. https://doi.org/10.1016/j.ijwd.2021.01.017
- Baum B, Duarte AM. Skin cancer epidemic in American Hispanic and Latino patients. In: Silverberg N, Duran-McKinster C, Tay Y-K, eds. Pediatric Skin of Color. Springer; 2015:453-460.
- Pritchett EN, Doyle A, Shaver CM, et al. Nonmelanoma skin cancer in nonwhite organ transplant recipients. JAMA Dermatol. 2016;152: 1348-1353. doi:10.1001/jamadermatol.2016.3328
- Karagas MR, Nelson HH, Sehr P, et al. Human papillomavirus infection and incidence of squamous cell and basal cell carcinomas of the skin. J Natl Cancer Inst. 2006;98:389-395. doi:10.1093/jnci/djj092
- Gohara M. Skin cancer: an African perspective. Br J Dermatol. 2015;173: 17-21. https://doi.org/10.1111/bjd.13380
- Armstrong BK, Kricker A. The epidemiology of UV induced skin cancer. J Photochem Photobiol B. 2001;63:8-18. doi:10.1016/s1011-1344(01)00198-1
- Halder RM, Bang KM. Skin cancer in African Americans in the United States. Dermatol Clin. 1988;6:397-407.
- Mora RG, Perniciaro C. Cancer of the skin in blacks. I. a review of 163 black patients with cutaneous squamous cell carcinoma. J Am Acad Dermatol. 1981;5:535-543. doi:10.1016/s0190-9622(81)70113-0
- Bajaj S, Wolner ZJ, Dusza SW, et al. Total body skin examination practices: a survey study amongst dermatologists at high-risk skin cancer clinics. Dermatol Pract Concept. 2019;9:132-138. doi:10.5826/dpc.0902a09
- Rieder EA, Mu EW, Wang J, et al. Dermatologist practices during total body skin examinations: a survey study. J Drugs Dermatol. 2018;17:516-520.
- Halder RM, Ara CJ. Skin cancer and photoaging in ethnic skin. Dermatol Clin. 2003;21:725-732, x. doi: 10.1016/s0733-8635(03)00085-8
- Higgins S, Nazemi A, Chow M, et al. Review of nonmelanoma skin cancer in African Americans, Hispanics, and Asians. Dermatol Surg. 2018;44:903-910.
- Sng J, Koh D, Siong WC, et al. Skin cancer trends among Asians living in Singapore from 1968 to 2006. J Am Acad Dermatol. 2009;61:426-432.
- Shao K, Feng H. Racial and ethnic healthcare disparities in skin cancer in the United States: a review of existing inequities, contributing factors, and potential solutions. J Clin Aesthet Dermatol. 2022;15:16-22.
- Shao K, Hooper J, Feng H. Racial and ethnic health disparities in dermatology in the United States. part 2: disease-specific epidemiology, characteristics, management, and outcomes. J Am Acad Dermatol. 2022;87:733-744. https://doi.org/10.1016/j.jaad.2021.12.062
- Zakhem GA, Pulavarty AN, Lester JC, et al. Skin cancer in people of color: a systematic review. Am J Clin Dermatol. 2022;23:137-151. https://doi.org/10.1007/s40257-021-00662-z
- Copcu E, Aktas A, Sis¸man N, et al. Thirty-one cases of Marjolin’s ulcer. Clin Exp Dermatol. 2003;28:138-141. doi:10.1046/j.1365-2230.2003.01210.x
- Abdi MA, Yan M, Hanna TP. Systematic review of modern case series of squamous cell cancer arising in a chronic ulcer (Marjolin’s ulcer) of the skin. JCO Glob Oncol. 2020;6:809-818. doi:10.1200/GO.20.00094
- Hogue L, Harvey VM. Basal cell carcinoma, squamous cell carcinoma, and cutaneous melanoma in skin of color patients. Dermatol Clin. 2019;37:519-526. doi:10.1016/j.det.2019.05.009
- Chapman S, Delgadillo D, Barber C, et al. Cutanteous squamous cell complicating hidradenitis suppurativa: a review of the prevalence, pathogenesis, and treatment of this dreaded complication. Acta Dermatovenerol Al Pannocica Adriat. 2018;27:25-28.
- Kailas A, Botwin AL, Pritchett EN, et al. Assessing the effectiveness of knowledge-based interventions in increasing skin cancer awareness, knowledge, and protective behaviors in skin of color populations. Cutis. 2017;100:235-240.
- Asgari MM, Warton EM, Whittemore AS. Family history of skin cancer is associated with increased risk of cutaneous squamous cell carcinoma. Dermatol Surg. 2015;41:481-486. doi:10.1097/DSS.0000000000000292
- Harwood CA, Surentheran T, McGregor JM, et al. Human papillomavirus infection and non-melanoma skin cancer in immunosuppressed and immunocompetent individuals. J Med Virol. 2000;61:289-297. doi:10.1002/1096-9071(200007)61:3<289::aid-jmv2>3.0.co;2-z
- Kallini JR, Nouran H, Khachemoune A. Squamous cell carcinoma of the skin: epidemiology, classification, management, and novel trends. Int J Dermatol. 2015;54:130-140. https://doi.org/10.1111/ijd.12553.
- Agbai ON, Buster K, Sanchez M, et al. Skin cancer and photoprotection in people of color: a review and recommendations for physicians and the public [published online January 28, 2014]. J Am Acad Dermatol. 2014;70:748-762. doi:10.1016/j.jaad.2013.11.038
- Bradford PT. Skin cancer in skin of color. Dermatol Nurse. 2009;21:170-177.
- Gloster HM, Neal K. Skin cancer in skin of color. J Am Acad Dermatol. 2006;55:741-760.
- Davis DS, Robinson C, Callender VD. Skin cancer in women of color: epidemiology, pathogenesis and clinical manifestations. Int J Womens Dermatol. 2021;7:127-134. https://doi.org/10.1016/j.ijwd.2021.01.017
- Baum B, Duarte AM. Skin cancer epidemic in American Hispanic and Latino patients. In: Silverberg N, Duran-McKinster C, Tay Y-K, eds. Pediatric Skin of Color. Springer; 2015:453-460.
- Pritchett EN, Doyle A, Shaver CM, et al. Nonmelanoma skin cancer in nonwhite organ transplant recipients. JAMA Dermatol. 2016;152: 1348-1353. doi:10.1001/jamadermatol.2016.3328
- Karagas MR, Nelson HH, Sehr P, et al. Human papillomavirus infection and incidence of squamous cell and basal cell carcinomas of the skin. J Natl Cancer Inst. 2006;98:389-395. doi:10.1093/jnci/djj092
- Gohara M. Skin cancer: an African perspective. Br J Dermatol. 2015;173: 17-21. https://doi.org/10.1111/bjd.13380
- Armstrong BK, Kricker A. The epidemiology of UV induced skin cancer. J Photochem Photobiol B. 2001;63:8-18. doi:10.1016/s1011-1344(01)00198-1
- Halder RM, Bang KM. Skin cancer in African Americans in the United States. Dermatol Clin. 1988;6:397-407.
- Mora RG, Perniciaro C. Cancer of the skin in blacks. I. a review of 163 black patients with cutaneous squamous cell carcinoma. J Am Acad Dermatol. 1981;5:535-543. doi:10.1016/s0190-9622(81)70113-0
- Bajaj S, Wolner ZJ, Dusza SW, et al. Total body skin examination practices: a survey study amongst dermatologists at high-risk skin cancer clinics. Dermatol Pract Concept. 2019;9:132-138. doi:10.5826/dpc.0902a09
- Rieder EA, Mu EW, Wang J, et al. Dermatologist practices during total body skin examinations: a survey study. J Drugs Dermatol. 2018;17:516-520.
- Halder RM, Ara CJ. Skin cancer and photoaging in ethnic skin. Dermatol Clin. 2003;21:725-732, x. doi: 10.1016/s0733-8635(03)00085-8
- Higgins S, Nazemi A, Chow M, et al. Review of nonmelanoma skin cancer in African Americans, Hispanics, and Asians. Dermatol Surg. 2018;44:903-910.
- Sng J, Koh D, Siong WC, et al. Skin cancer trends among Asians living in Singapore from 1968 to 2006. J Am Acad Dermatol. 2009;61:426-432.
- Shao K, Feng H. Racial and ethnic healthcare disparities in skin cancer in the United States: a review of existing inequities, contributing factors, and potential solutions. J Clin Aesthet Dermatol. 2022;15:16-22.
- Shao K, Hooper J, Feng H. Racial and ethnic health disparities in dermatology in the United States. part 2: disease-specific epidemiology, characteristics, management, and outcomes. J Am Acad Dermatol. 2022;87:733-744. https://doi.org/10.1016/j.jaad.2021.12.062
- Zakhem GA, Pulavarty AN, Lester JC, et al. Skin cancer in people of color: a systematic review. Am J Clin Dermatol. 2022;23:137-151. https://doi.org/10.1007/s40257-021-00662-z
- Copcu E, Aktas A, Sis¸man N, et al. Thirty-one cases of Marjolin’s ulcer. Clin Exp Dermatol. 2003;28:138-141. doi:10.1046/j.1365-2230.2003.01210.x
- Abdi MA, Yan M, Hanna TP. Systematic review of modern case series of squamous cell cancer arising in a chronic ulcer (Marjolin’s ulcer) of the skin. JCO Glob Oncol. 2020;6:809-818. doi:10.1200/GO.20.00094
- Hogue L, Harvey VM. Basal cell carcinoma, squamous cell carcinoma, and cutaneous melanoma in skin of color patients. Dermatol Clin. 2019;37:519-526. doi:10.1016/j.det.2019.05.009
- Chapman S, Delgadillo D, Barber C, et al. Cutanteous squamous cell complicating hidradenitis suppurativa: a review of the prevalence, pathogenesis, and treatment of this dreaded complication. Acta Dermatovenerol Al Pannocica Adriat. 2018;27:25-28.
- Kailas A, Botwin AL, Pritchett EN, et al. Assessing the effectiveness of knowledge-based interventions in increasing skin cancer awareness, knowledge, and protective behaviors in skin of color populations. Cutis. 2017;100:235-240.
Lanolin: The 2023 American Contact Dermatitis Society Allergen of the Year
Lanolin was announced as the Allergen of the Year by the American Contact Dermatitis Society in March 2023.1 However, allergic contact dermatitis (ACD) to lanolin remains a matter of fierce debate among dermatologists. Herein, we discuss this important contact allergen, emphasizing the controversy behind its allergenicity and nuances to consider when patch testing.
What is Lanolin?
Lanolin is a greasy, yellow, fatlike substance derived from the sebaceous glands of sheep. It is extracted from wool using an intricate process of scouring with dilute alkali, centrifuging, and refining with hot alkali and bleach.2 It is comprised of a complex mixture of esters, alcohols, sterols, fatty acids, lactose, and hydrocarbons.3
The hydrophobic property of lanolin helps sheep shed water from their coats.3 In humans, this hydrophobicity benefits the skin by retaining moisture already present in the epidermis. Lanolin can hold as much as twice its weight in water and may reduce transepidermal water loss by 20% to 30%.4-6 In addition, lanolin maintains tissue breathability, which supports proper gas exchange, promoting wound healing and protecting against infection.3,7
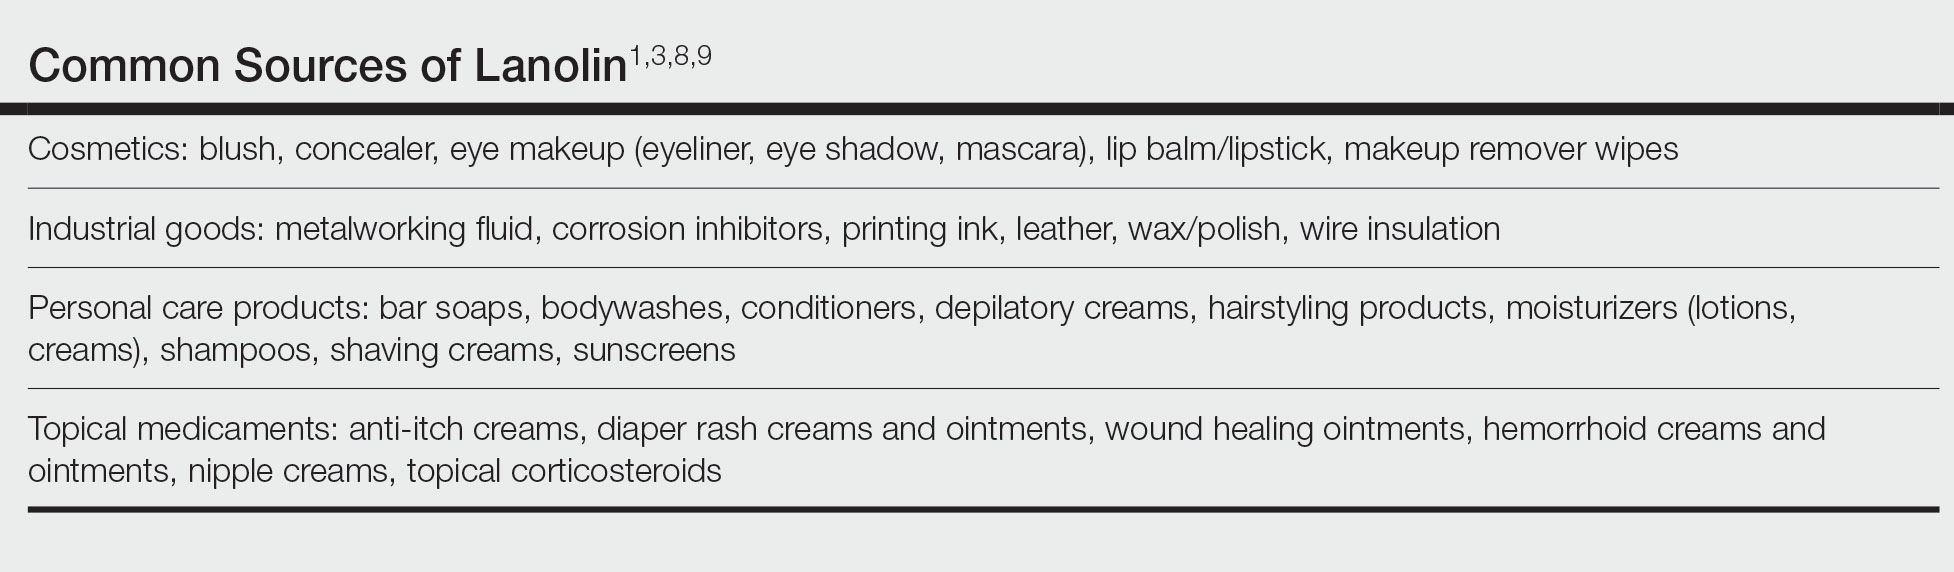
Many personal care products (PCPs), cosmetics, and topical medicaments contain lanolin, particularly products marketed to help restore dry cracked skin. The range of permitted concentrations of lanolin in over-the-counter products in the United States is 12.5% to 50%.3 Lanolin also may be found in industrial goods. The Table provides a comprehensive list of common items that may contain lanolin.1,3,8,9
A Wolf in Sheep’s Clothing?
Despite its benefits, lanolin is a potential source of ACD. The first reported positive patch test (PPT) to lanolin worldwide was in the late 1920s.10 Subsequent cases of ACD to lanolin were described over the next 30 years, reaching a peak of recognition in the latter half of the 20th century with rates of PPT ranging from 0% to 7.4%, though the patient population and lanolin patch-test formulation used differed across studies.9 The North American Contact Dermatitis Group observed that 3.3% (1431/43,691) of patients tested from 2001 to 2018 had a PPT to either lanolin alcohol 30% in petrolatum (pet) or Amerchol L101 (10% lanolin alcohol dissolved in mineral oil) 50% pet.11 Compared to patients referred for patch testing, the prevalence of contact allergy to lanolin is lower in the general population; 0.4% of the general population in Europe (N=3119) tested positive to wool alcohols 1.0 mg/cm2 on the thin-layer rapid use Epicutaneous (TRUE) test.12
Allergic contact dermatitis to lanolin is unrelated to an allergy to wool itself, which probably does not exist, though wool is well known to cause irritant contact dermatitis, particularly in atopic individuals.13
Who Is at Risk for Lanolin Allergy?
In a recent comprehensive review of lanolin allergy, Jenkins and Belsito1 summarized 4 high-risk subgroups of patients for the development of lanolin contact allergy: stasis dermatitis, chronic leg ulcers, atopic dermatitis (AD), and perianal/genital dermatitis. These chronic inflammatory skin conditions may increase the risk for ACD to lanolin via increased exposure in topical therapies and/or increased allergen penetration through an impaired epidermal barrier.14-16 Demographically, older adults and children are at-risk groups, likely secondary to the higher prevalence of stasis dermatitis/leg ulcers in the former group and AD in the latter.1
Lanolin Controversies
The allergenicity of lanolin is far from straightforward. In 1996, Wolf17 first described the “lanolin paradox,” modeled after the earlier “paraben paradox” described by Fisher.18 There are 4 clinical phenomena of the lanolin paradox17:
- Lanolin generally does not cause contact allergy when found in PCPs but may cause ACD when found in topical medicaments.
- Some patients can use lanolin-containing PCPs on healthy skin without issue but will develop ACD when a lanolin-containing topical medicament is applied to inflamed skin. This is because inflamed skin is more easily sensitized.
- False-negative patch test reactions to pure lanolin may occur. Since Wolf’s17 initial description of the paradox, free alcohols of lanolin have been found to be its principal allergen, though it also is possible that oxidation of lanolin could generate additional allergenic substances.1
- Patch testing with wool alcohol 30% can generate both false-negative and false-positive results.
At one extreme, Kligman19 also was concerned about false-positive reactions to lanolin, describing lanolin allergy as a myth attributed to overzealous patch testing and a failure to appreciate the limitations of this diagnostic modality. Indeed, just having a PPT to lanolin (ie, contact allergy) does not automatically translate to a relevant ACD,1 and determining the clinical relevance of a PPT is of utmost importance. In 2001, Wakelin et al20 reported that the majority (71% [92/130]) of positive reactions to Amerchol L101 50% or 100% pet showed current clinical relevance. Data from the North American Contact Dermatitis Group in 2009 and in 2022 were similar, with 83.4% (529/634) of positive reactions to lanolin alcohol 30% pet and 86.5% (1238/1431) of positive reactions to Amerchol L101 50% pet classified as current clinical relevance.11,21 These findings demonstrate that although lanolin may be a weak sensitizer, a PPT usually represents a highly relevant cause of dermatitis.
Considerations for Patch Testing
Considering Wolf’s17 claim that even pure lanolin is not an appropriate formulation to use for patch testing due to the risk for inaccurate results, you might now be wondering which preparation should be used. Mortensen22 popularized another compound, Amerchol L101, in 1979. In this small study of 60 patients with a PPT to lanolin and/or its derivatives, the highest proportion (37% [22/60]) were positive to Amerchol L101 but negative to wool alcohol 30%, suggesting the need to test to more than one preparation simultaneously.22 In a larger study by Miest et al,23 3.9% (11/268) of patients had a PPT to Amerchol L101 50% pet, whereas only 1.1% (3/268) had a PPT to lanolin alcohol 30% pet. This highlighted the importance of including Amerchol L101 when patch testing because it was thought to capture more positive results; however, some studies suggest that Amerchol L101 is not superior at predicting lanolin contact allergy vs lanolin alcohol 30% pet. The risk for an irritant reaction when patch testing with Amerchol L101 should be considered due to its mineral oil component.24
Although there is no universal consensus to date, some investigators suggest patch testing both lanolin alcohol 30% pet and Amerchol L101 50% pet simultaneously.1 The TRUE test utilizes 1000 µg/cm2 of wool alcohols, while the North American 80 Comprehensive Series and the American Contact Dermatitis Society Core 90 Series contain Amerchol L101 50% pet. Patch testing to the most allergenic component of lanolin—the free fatty alcohols (particularly alkane-α,β-diols and alkane-α,ω-diols)—has been suggested,1 though these formulations are not yet commercially available.
When available, the patient’s own lanolin-containing PCPs should be tested.1 Performing a repeat open application test (ROAT) to a lanolin-containing product also may be highly useful to distinguish weak-positive from irritant patch test reactions and to determine if sensitized patients can tolerate lanolin-containing products on intact skin. To complete a ROAT, a patient should apply the suspected leave-on product to a patch of unaffected skin (classically the volar forearm) twice daily for at least 10 days.25 If the application site is clear after 10 days, the patient is unlikely to have ACD to the product in question. Compared to patch testing, ROAT more accurately mimics a true use situation, which is particularly important for lanolin given its tendency to preferentially impact damaged or inflamed skin while sparing healthy skin.
Alternatives to Lanolin
Patients with confirmed ACD to lanolin may use plain petrolatum, a safe and inexpensive substitute with equivalent moisturizing efficacy. It can reduce transepidermal water loss by more than 98%,4 with essentially no risk for ACD. Humectants such as glycerin, sorbitol, and α-hydroxy acids also have moisturizing properties akin to those of lanolin. In addition, some oils may provide benefit to patients with chronic skin conditions. Sunflower seed oil and extra virgin coconut oil have anti-inflammatory, antibacterial, and barrier repair properties.26,27 Allergic contact dermatitis to these oils rarely, if ever, occurs.28
Final Interpretation
Lanolin is a well-known yet controversial contact allergen that is widely used in PCPs, cosmetics, topical medicaments, and industrial goods. Lanolin ACD preferentially impacts patients with stasis dermatitis, chronic leg ulcers, AD, and perianal/genital dermatitis. Patch testing with more than one lanolin formulation, including lanolin alcohol 30% pet and/or Amerchol L101 50% pet, as well as testing the patient’s own products may be necessary to confirm the diagnosis. In cases of ACD to lanolin, an alternative agent, such as plain petrolatum, may be used.
- Jenkins BA, Belsito DV. Lanolin. Dermatitis. 2023;34:4-12. doi:10.1089/derm.2022.0002
- National Center for Biotechnology Information (2023). PubChem Annotation Record for LANOLIN, Source: Hazardous Substances Data Bank (HSDB). Accessed July 21, 2023. https://pubchem.ncbi.nlm.nih.gov/source/hsdb/1817
- National Center for Biotechnology Information. PubChem compound summary lanolin. Accessed July 17, 2023. https://pubchem.ncbi.nlm.nih.gov/compound/Lanolin
- Purnamawati S, Indrastuti N, Danarti R, et al. the role of moisturizers in addressing various kinds of dermatitis: a review. Clin Med Res. 2017;15:75-87. doi:10.3121/cmr.2017.1363
- Sethi A, Kaur T, Malhotra SK, et al. Moisturizers: the slippery road. Indian J Dermatol. 2016;61:279-287. doi:10.4103/0019-5154.182427
- Souto EB, Yoshida CMP, Leonardi GR, et al. Lipid-polymeric films: composition, production and applications in wound healing and skin repair. Pharmaceutics. 2021;13:1199. doi:10.3390/pharmaceutics13081199
- Rüther L, Voss W. Hydrogel or ointment? comparison of five different galenics regarding tissue breathability and transepidermal water loss. Heliyon. 2021;7:E06071. doi:10.1016/j.heliyon.2021.e06071
- Zirwas MJ. Contact alternatives and the internet. Dermatitis. 2012;23:192-194. doi:10.1097/DER.0b013e31826ea0d2
- Lee B, Warshaw E. Lanolin allergy: history, epidemiology, responsible allergens, and management. Dermatitis. 2008;19:63-72.
- Ramirez M, Eller JJ. The patch test in contact dermatitis. Allergy. 1929;1:489-493.
- Silverberg JI, Patel N, Warshaw EM, et al. Lanolin allergic reactions: North American Contact Dermatitis Group experience, 2001 to 2018. Dermatitis. 2022;33:193-199. doi:10.1097/DER.0000000000000871
- Diepgen TL, Ofenloch RF, Bruze M, et al. Prevalence of contact allergy in the general population in different European regions. Br J Dermatol. 2016;174:319-329. doi:10.1111/bjd.14167
- Zallmann M, Smith PK, Tang MLK, et al. Debunking the myth of wool allergy: reviewing the evidence for immune and non-immune cutaneous reactions. Acta Derm Venereol. 2017;97:906-915. doi:10.2340/00015555-2655
- Yosipovitch G, Nedorost ST, Silverberg JI, et al. Stasis dermatitis: an overview of its clinical presentation, pathogenesis, and management. Am J Clin Dermatol. 2023;24:275-286. doi:10.1007/s40257-022-00753-5
- Johnson H, Novack DE, Adler BL, et al. Can atopic dermatitis and allergic contact dermatitis coexist? Cutis. 2022;110:139-142. doi:10.12788/cutis.0599
- Gilissen L, Schollaert I, Huygens S, et al. Iatrogenic allergic contact dermatitis in the (peri)anal and genital area. Contact Dermatitis. 2021;84:431-438. doi:10.1111/cod.13764
- Wolf R. The lanolin paradox. Dermatology. 1996;192:198-202. doi:10.1159/000246365
- Fisher AA. The paraben paradox. Cutis. 1973;12:830-832.
- Kligman AM. The myth of lanolin allergy. Contact Dermatitis. 1998;39:103-107. doi:10.1111/j.1600-0536.1998.tb05856.x
- Wakelin SH, Smith H, White IR, et al. A retrospective analysis of contact allergy to lanolin. Br J Dermatol. 2001;145:28-31. doi:10.1046/j.1365-2133.2001.04277.x
- Warshaw EM, Nelsen DD, Maibach HI, et al. Positive patch test reactions to lanolin: cross-sectional data from the North American Contact Dermatitis group, 1994 to 2006. Dermatitis. 2009;20:79-88.
- Mortensen T. Allergy to lanolin. Contact Dermatitis. 1979;5:137-139. doi:10.1111/j.1600-0536.1979.tb04824.x
- Miest RY, Yiannias JA, Chang YH, et al. Diagnosis and prevalence of lanolin allergy. Dermatitis. 2013;24:119-123. doi:10.1097/DER.0b013e3182937aa4
- Knijp J, Bruynzeel DP, Rustemeyer T. Diagnosing lanolin contact allergy with lanolin alcohol and Amerchol L101. Contact Dermatitis. 2019;80:298-303. doi:10.1111/cod.13210
- Amsler E, Assier H, Soria A, et al. What is the optimal duration for a ROAT? the experience of the French Dermatology and Allergology group (DAG). Contact Dermatitis. 2022;87:170-175. doi:10.1111/cod.14118
- Msika P, De Belilovsky C, Piccardi N, et al. New emollient with topical corticosteroid-sparing effect in treatment of childhood atopic dermatitis: SCORAD and quality of life improvement. Pediatr Dermatol. 2008;25:606-612. doi: 10.1111/j.1525-1470.2008.00783.x
- Lio PA. Alternative therapies in atopic dermatitis care: part 2. Pract Dermatol. July 2011:48-50.
- Karagounis TK, Gittler JK, Rotemberg V, et al. Use of “natural” oils for moisturization: review of olive, coconut, and sunflower seed oil. Pediatr Dermatol. 2019;36:9-15. doi:10.1111/pde.13621
Lanolin was announced as the Allergen of the Year by the American Contact Dermatitis Society in March 2023.1 However, allergic contact dermatitis (ACD) to lanolin remains a matter of fierce debate among dermatologists. Herein, we discuss this important contact allergen, emphasizing the controversy behind its allergenicity and nuances to consider when patch testing.
What is Lanolin?
Lanolin is a greasy, yellow, fatlike substance derived from the sebaceous glands of sheep. It is extracted from wool using an intricate process of scouring with dilute alkali, centrifuging, and refining with hot alkali and bleach.2 It is comprised of a complex mixture of esters, alcohols, sterols, fatty acids, lactose, and hydrocarbons.3
The hydrophobic property of lanolin helps sheep shed water from their coats.3 In humans, this hydrophobicity benefits the skin by retaining moisture already present in the epidermis. Lanolin can hold as much as twice its weight in water and may reduce transepidermal water loss by 20% to 30%.4-6 In addition, lanolin maintains tissue breathability, which supports proper gas exchange, promoting wound healing and protecting against infection.3,7
Many personal care products (PCPs), cosmetics, and topical medicaments contain lanolin, particularly products marketed to help restore dry cracked skin. The range of permitted concentrations of lanolin in over-the-counter products in the United States is 12.5% to 50%.3 Lanolin also may be found in industrial goods. The Table provides a comprehensive list of common items that may contain lanolin.1,3,8,9
A Wolf in Sheep’s Clothing?
Despite its benefits, lanolin is a potential source of ACD. The first reported positive patch test (PPT) to lanolin worldwide was in the late 1920s.10 Subsequent cases of ACD to lanolin were described over the next 30 years, reaching a peak of recognition in the latter half of the 20th century with rates of PPT ranging from 0% to 7.4%, though the patient population and lanolin patch-test formulation used differed across studies.9 The North American Contact Dermatitis Group observed that 3.3% (1431/43,691) of patients tested from 2001 to 2018 had a PPT to either lanolin alcohol 30% in petrolatum (pet) or Amerchol L101 (10% lanolin alcohol dissolved in mineral oil) 50% pet.11 Compared to patients referred for patch testing, the prevalence of contact allergy to lanolin is lower in the general population; 0.4% of the general population in Europe (N=3119) tested positive to wool alcohols 1.0 mg/cm2 on the thin-layer rapid use Epicutaneous (TRUE) test.12
Allergic contact dermatitis to lanolin is unrelated to an allergy to wool itself, which probably does not exist, though wool is well known to cause irritant contact dermatitis, particularly in atopic individuals.13
Who Is at Risk for Lanolin Allergy?
In a recent comprehensive review of lanolin allergy, Jenkins and Belsito1 summarized 4 high-risk subgroups of patients for the development of lanolin contact allergy: stasis dermatitis, chronic leg ulcers, atopic dermatitis (AD), and perianal/genital dermatitis. These chronic inflammatory skin conditions may increase the risk for ACD to lanolin via increased exposure in topical therapies and/or increased allergen penetration through an impaired epidermal barrier.14-16 Demographically, older adults and children are at-risk groups, likely secondary to the higher prevalence of stasis dermatitis/leg ulcers in the former group and AD in the latter.1
Lanolin Controversies
The allergenicity of lanolin is far from straightforward. In 1996, Wolf17 first described the “lanolin paradox,” modeled after the earlier “paraben paradox” described by Fisher.18 There are 4 clinical phenomena of the lanolin paradox17:
- Lanolin generally does not cause contact allergy when found in PCPs but may cause ACD when found in topical medicaments.
- Some patients can use lanolin-containing PCPs on healthy skin without issue but will develop ACD when a lanolin-containing topical medicament is applied to inflamed skin. This is because inflamed skin is more easily sensitized.
- False-negative patch test reactions to pure lanolin may occur. Since Wolf’s17 initial description of the paradox, free alcohols of lanolin have been found to be its principal allergen, though it also is possible that oxidation of lanolin could generate additional allergenic substances.1
- Patch testing with wool alcohol 30% can generate both false-negative and false-positive results.
At one extreme, Kligman19 also was concerned about false-positive reactions to lanolin, describing lanolin allergy as a myth attributed to overzealous patch testing and a failure to appreciate the limitations of this diagnostic modality. Indeed, just having a PPT to lanolin (ie, contact allergy) does not automatically translate to a relevant ACD,1 and determining the clinical relevance of a PPT is of utmost importance. In 2001, Wakelin et al20 reported that the majority (71% [92/130]) of positive reactions to Amerchol L101 50% or 100% pet showed current clinical relevance. Data from the North American Contact Dermatitis Group in 2009 and in 2022 were similar, with 83.4% (529/634) of positive reactions to lanolin alcohol 30% pet and 86.5% (1238/1431) of positive reactions to Amerchol L101 50% pet classified as current clinical relevance.11,21 These findings demonstrate that although lanolin may be a weak sensitizer, a PPT usually represents a highly relevant cause of dermatitis.
Considerations for Patch Testing
Considering Wolf’s17 claim that even pure lanolin is not an appropriate formulation to use for patch testing due to the risk for inaccurate results, you might now be wondering which preparation should be used. Mortensen22 popularized another compound, Amerchol L101, in 1979. In this small study of 60 patients with a PPT to lanolin and/or its derivatives, the highest proportion (37% [22/60]) were positive to Amerchol L101 but negative to wool alcohol 30%, suggesting the need to test to more than one preparation simultaneously.22 In a larger study by Miest et al,23 3.9% (11/268) of patients had a PPT to Amerchol L101 50% pet, whereas only 1.1% (3/268) had a PPT to lanolin alcohol 30% pet. This highlighted the importance of including Amerchol L101 when patch testing because it was thought to capture more positive results; however, some studies suggest that Amerchol L101 is not superior at predicting lanolin contact allergy vs lanolin alcohol 30% pet. The risk for an irritant reaction when patch testing with Amerchol L101 should be considered due to its mineral oil component.24
Although there is no universal consensus to date, some investigators suggest patch testing both lanolin alcohol 30% pet and Amerchol L101 50% pet simultaneously.1 The TRUE test utilizes 1000 µg/cm2 of wool alcohols, while the North American 80 Comprehensive Series and the American Contact Dermatitis Society Core 90 Series contain Amerchol L101 50% pet. Patch testing to the most allergenic component of lanolin—the free fatty alcohols (particularly alkane-α,β-diols and alkane-α,ω-diols)—has been suggested,1 though these formulations are not yet commercially available.
When available, the patient’s own lanolin-containing PCPs should be tested.1 Performing a repeat open application test (ROAT) to a lanolin-containing product also may be highly useful to distinguish weak-positive from irritant patch test reactions and to determine if sensitized patients can tolerate lanolin-containing products on intact skin. To complete a ROAT, a patient should apply the suspected leave-on product to a patch of unaffected skin (classically the volar forearm) twice daily for at least 10 days.25 If the application site is clear after 10 days, the patient is unlikely to have ACD to the product in question. Compared to patch testing, ROAT more accurately mimics a true use situation, which is particularly important for lanolin given its tendency to preferentially impact damaged or inflamed skin while sparing healthy skin.
Alternatives to Lanolin
Patients with confirmed ACD to lanolin may use plain petrolatum, a safe and inexpensive substitute with equivalent moisturizing efficacy. It can reduce transepidermal water loss by more than 98%,4 with essentially no risk for ACD. Humectants such as glycerin, sorbitol, and α-hydroxy acids also have moisturizing properties akin to those of lanolin. In addition, some oils may provide benefit to patients with chronic skin conditions. Sunflower seed oil and extra virgin coconut oil have anti-inflammatory, antibacterial, and barrier repair properties.26,27 Allergic contact dermatitis to these oils rarely, if ever, occurs.28
Final Interpretation
Lanolin is a well-known yet controversial contact allergen that is widely used in PCPs, cosmetics, topical medicaments, and industrial goods. Lanolin ACD preferentially impacts patients with stasis dermatitis, chronic leg ulcers, AD, and perianal/genital dermatitis. Patch testing with more than one lanolin formulation, including lanolin alcohol 30% pet and/or Amerchol L101 50% pet, as well as testing the patient’s own products may be necessary to confirm the diagnosis. In cases of ACD to lanolin, an alternative agent, such as plain petrolatum, may be used.
Lanolin was announced as the Allergen of the Year by the American Contact Dermatitis Society in March 2023.1 However, allergic contact dermatitis (ACD) to lanolin remains a matter of fierce debate among dermatologists. Herein, we discuss this important contact allergen, emphasizing the controversy behind its allergenicity and nuances to consider when patch testing.
What is Lanolin?
Lanolin is a greasy, yellow, fatlike substance derived from the sebaceous glands of sheep. It is extracted from wool using an intricate process of scouring with dilute alkali, centrifuging, and refining with hot alkali and bleach.2 It is comprised of a complex mixture of esters, alcohols, sterols, fatty acids, lactose, and hydrocarbons.3
The hydrophobic property of lanolin helps sheep shed water from their coats.3 In humans, this hydrophobicity benefits the skin by retaining moisture already present in the epidermis. Lanolin can hold as much as twice its weight in water and may reduce transepidermal water loss by 20% to 30%.4-6 In addition, lanolin maintains tissue breathability, which supports proper gas exchange, promoting wound healing and protecting against infection.3,7
Many personal care products (PCPs), cosmetics, and topical medicaments contain lanolin, particularly products marketed to help restore dry cracked skin. The range of permitted concentrations of lanolin in over-the-counter products in the United States is 12.5% to 50%.3 Lanolin also may be found in industrial goods. The Table provides a comprehensive list of common items that may contain lanolin.1,3,8,9
A Wolf in Sheep’s Clothing?
Despite its benefits, lanolin is a potential source of ACD. The first reported positive patch test (PPT) to lanolin worldwide was in the late 1920s.10 Subsequent cases of ACD to lanolin were described over the next 30 years, reaching a peak of recognition in the latter half of the 20th century with rates of PPT ranging from 0% to 7.4%, though the patient population and lanolin patch-test formulation used differed across studies.9 The North American Contact Dermatitis Group observed that 3.3% (1431/43,691) of patients tested from 2001 to 2018 had a PPT to either lanolin alcohol 30% in petrolatum (pet) or Amerchol L101 (10% lanolin alcohol dissolved in mineral oil) 50% pet.11 Compared to patients referred for patch testing, the prevalence of contact allergy to lanolin is lower in the general population; 0.4% of the general population in Europe (N=3119) tested positive to wool alcohols 1.0 mg/cm2 on the thin-layer rapid use Epicutaneous (TRUE) test.12
Allergic contact dermatitis to lanolin is unrelated to an allergy to wool itself, which probably does not exist, though wool is well known to cause irritant contact dermatitis, particularly in atopic individuals.13
Who Is at Risk for Lanolin Allergy?
In a recent comprehensive review of lanolin allergy, Jenkins and Belsito1 summarized 4 high-risk subgroups of patients for the development of lanolin contact allergy: stasis dermatitis, chronic leg ulcers, atopic dermatitis (AD), and perianal/genital dermatitis. These chronic inflammatory skin conditions may increase the risk for ACD to lanolin via increased exposure in topical therapies and/or increased allergen penetration through an impaired epidermal barrier.14-16 Demographically, older adults and children are at-risk groups, likely secondary to the higher prevalence of stasis dermatitis/leg ulcers in the former group and AD in the latter.1
Lanolin Controversies
The allergenicity of lanolin is far from straightforward. In 1996, Wolf17 first described the “lanolin paradox,” modeled after the earlier “paraben paradox” described by Fisher.18 There are 4 clinical phenomena of the lanolin paradox17:
- Lanolin generally does not cause contact allergy when found in PCPs but may cause ACD when found in topical medicaments.
- Some patients can use lanolin-containing PCPs on healthy skin without issue but will develop ACD when a lanolin-containing topical medicament is applied to inflamed skin. This is because inflamed skin is more easily sensitized.
- False-negative patch test reactions to pure lanolin may occur. Since Wolf’s17 initial description of the paradox, free alcohols of lanolin have been found to be its principal allergen, though it also is possible that oxidation of lanolin could generate additional allergenic substances.1
- Patch testing with wool alcohol 30% can generate both false-negative and false-positive results.
At one extreme, Kligman19 also was concerned about false-positive reactions to lanolin, describing lanolin allergy as a myth attributed to overzealous patch testing and a failure to appreciate the limitations of this diagnostic modality. Indeed, just having a PPT to lanolin (ie, contact allergy) does not automatically translate to a relevant ACD,1 and determining the clinical relevance of a PPT is of utmost importance. In 2001, Wakelin et al20 reported that the majority (71% [92/130]) of positive reactions to Amerchol L101 50% or 100% pet showed current clinical relevance. Data from the North American Contact Dermatitis Group in 2009 and in 2022 were similar, with 83.4% (529/634) of positive reactions to lanolin alcohol 30% pet and 86.5% (1238/1431) of positive reactions to Amerchol L101 50% pet classified as current clinical relevance.11,21 These findings demonstrate that although lanolin may be a weak sensitizer, a PPT usually represents a highly relevant cause of dermatitis.
Considerations for Patch Testing
Considering Wolf’s17 claim that even pure lanolin is not an appropriate formulation to use for patch testing due to the risk for inaccurate results, you might now be wondering which preparation should be used. Mortensen22 popularized another compound, Amerchol L101, in 1979. In this small study of 60 patients with a PPT to lanolin and/or its derivatives, the highest proportion (37% [22/60]) were positive to Amerchol L101 but negative to wool alcohol 30%, suggesting the need to test to more than one preparation simultaneously.22 In a larger study by Miest et al,23 3.9% (11/268) of patients had a PPT to Amerchol L101 50% pet, whereas only 1.1% (3/268) had a PPT to lanolin alcohol 30% pet. This highlighted the importance of including Amerchol L101 when patch testing because it was thought to capture more positive results; however, some studies suggest that Amerchol L101 is not superior at predicting lanolin contact allergy vs lanolin alcohol 30% pet. The risk for an irritant reaction when patch testing with Amerchol L101 should be considered due to its mineral oil component.24
Although there is no universal consensus to date, some investigators suggest patch testing both lanolin alcohol 30% pet and Amerchol L101 50% pet simultaneously.1 The TRUE test utilizes 1000 µg/cm2 of wool alcohols, while the North American 80 Comprehensive Series and the American Contact Dermatitis Society Core 90 Series contain Amerchol L101 50% pet. Patch testing to the most allergenic component of lanolin—the free fatty alcohols (particularly alkane-α,β-diols and alkane-α,ω-diols)—has been suggested,1 though these formulations are not yet commercially available.
When available, the patient’s own lanolin-containing PCPs should be tested.1 Performing a repeat open application test (ROAT) to a lanolin-containing product also may be highly useful to distinguish weak-positive from irritant patch test reactions and to determine if sensitized patients can tolerate lanolin-containing products on intact skin. To complete a ROAT, a patient should apply the suspected leave-on product to a patch of unaffected skin (classically the volar forearm) twice daily for at least 10 days.25 If the application site is clear after 10 days, the patient is unlikely to have ACD to the product in question. Compared to patch testing, ROAT more accurately mimics a true use situation, which is particularly important for lanolin given its tendency to preferentially impact damaged or inflamed skin while sparing healthy skin.
Alternatives to Lanolin
Patients with confirmed ACD to lanolin may use plain petrolatum, a safe and inexpensive substitute with equivalent moisturizing efficacy. It can reduce transepidermal water loss by more than 98%,4 with essentially no risk for ACD. Humectants such as glycerin, sorbitol, and α-hydroxy acids also have moisturizing properties akin to those of lanolin. In addition, some oils may provide benefit to patients with chronic skin conditions. Sunflower seed oil and extra virgin coconut oil have anti-inflammatory, antibacterial, and barrier repair properties.26,27 Allergic contact dermatitis to these oils rarely, if ever, occurs.28
Final Interpretation
Lanolin is a well-known yet controversial contact allergen that is widely used in PCPs, cosmetics, topical medicaments, and industrial goods. Lanolin ACD preferentially impacts patients with stasis dermatitis, chronic leg ulcers, AD, and perianal/genital dermatitis. Patch testing with more than one lanolin formulation, including lanolin alcohol 30% pet and/or Amerchol L101 50% pet, as well as testing the patient’s own products may be necessary to confirm the diagnosis. In cases of ACD to lanolin, an alternative agent, such as plain petrolatum, may be used.
- Jenkins BA, Belsito DV. Lanolin. Dermatitis. 2023;34:4-12. doi:10.1089/derm.2022.0002
- National Center for Biotechnology Information (2023). PubChem Annotation Record for LANOLIN, Source: Hazardous Substances Data Bank (HSDB). Accessed July 21, 2023. https://pubchem.ncbi.nlm.nih.gov/source/hsdb/1817
- National Center for Biotechnology Information. PubChem compound summary lanolin. Accessed July 17, 2023. https://pubchem.ncbi.nlm.nih.gov/compound/Lanolin
- Purnamawati S, Indrastuti N, Danarti R, et al. the role of moisturizers in addressing various kinds of dermatitis: a review. Clin Med Res. 2017;15:75-87. doi:10.3121/cmr.2017.1363
- Sethi A, Kaur T, Malhotra SK, et al. Moisturizers: the slippery road. Indian J Dermatol. 2016;61:279-287. doi:10.4103/0019-5154.182427
- Souto EB, Yoshida CMP, Leonardi GR, et al. Lipid-polymeric films: composition, production and applications in wound healing and skin repair. Pharmaceutics. 2021;13:1199. doi:10.3390/pharmaceutics13081199
- Rüther L, Voss W. Hydrogel or ointment? comparison of five different galenics regarding tissue breathability and transepidermal water loss. Heliyon. 2021;7:E06071. doi:10.1016/j.heliyon.2021.e06071
- Zirwas MJ. Contact alternatives and the internet. Dermatitis. 2012;23:192-194. doi:10.1097/DER.0b013e31826ea0d2
- Lee B, Warshaw E. Lanolin allergy: history, epidemiology, responsible allergens, and management. Dermatitis. 2008;19:63-72.
- Ramirez M, Eller JJ. The patch test in contact dermatitis. Allergy. 1929;1:489-493.
- Silverberg JI, Patel N, Warshaw EM, et al. Lanolin allergic reactions: North American Contact Dermatitis Group experience, 2001 to 2018. Dermatitis. 2022;33:193-199. doi:10.1097/DER.0000000000000871
- Diepgen TL, Ofenloch RF, Bruze M, et al. Prevalence of contact allergy in the general population in different European regions. Br J Dermatol. 2016;174:319-329. doi:10.1111/bjd.14167
- Zallmann M, Smith PK, Tang MLK, et al. Debunking the myth of wool allergy: reviewing the evidence for immune and non-immune cutaneous reactions. Acta Derm Venereol. 2017;97:906-915. doi:10.2340/00015555-2655
- Yosipovitch G, Nedorost ST, Silverberg JI, et al. Stasis dermatitis: an overview of its clinical presentation, pathogenesis, and management. Am J Clin Dermatol. 2023;24:275-286. doi:10.1007/s40257-022-00753-5
- Johnson H, Novack DE, Adler BL, et al. Can atopic dermatitis and allergic contact dermatitis coexist? Cutis. 2022;110:139-142. doi:10.12788/cutis.0599
- Gilissen L, Schollaert I, Huygens S, et al. Iatrogenic allergic contact dermatitis in the (peri)anal and genital area. Contact Dermatitis. 2021;84:431-438. doi:10.1111/cod.13764
- Wolf R. The lanolin paradox. Dermatology. 1996;192:198-202. doi:10.1159/000246365
- Fisher AA. The paraben paradox. Cutis. 1973;12:830-832.
- Kligman AM. The myth of lanolin allergy. Contact Dermatitis. 1998;39:103-107. doi:10.1111/j.1600-0536.1998.tb05856.x
- Wakelin SH, Smith H, White IR, et al. A retrospective analysis of contact allergy to lanolin. Br J Dermatol. 2001;145:28-31. doi:10.1046/j.1365-2133.2001.04277.x
- Warshaw EM, Nelsen DD, Maibach HI, et al. Positive patch test reactions to lanolin: cross-sectional data from the North American Contact Dermatitis group, 1994 to 2006. Dermatitis. 2009;20:79-88.
- Mortensen T. Allergy to lanolin. Contact Dermatitis. 1979;5:137-139. doi:10.1111/j.1600-0536.1979.tb04824.x
- Miest RY, Yiannias JA, Chang YH, et al. Diagnosis and prevalence of lanolin allergy. Dermatitis. 2013;24:119-123. doi:10.1097/DER.0b013e3182937aa4
- Knijp J, Bruynzeel DP, Rustemeyer T. Diagnosing lanolin contact allergy with lanolin alcohol and Amerchol L101. Contact Dermatitis. 2019;80:298-303. doi:10.1111/cod.13210
- Amsler E, Assier H, Soria A, et al. What is the optimal duration for a ROAT? the experience of the French Dermatology and Allergology group (DAG). Contact Dermatitis. 2022;87:170-175. doi:10.1111/cod.14118
- Msika P, De Belilovsky C, Piccardi N, et al. New emollient with topical corticosteroid-sparing effect in treatment of childhood atopic dermatitis: SCORAD and quality of life improvement. Pediatr Dermatol. 2008;25:606-612. doi: 10.1111/j.1525-1470.2008.00783.x
- Lio PA. Alternative therapies in atopic dermatitis care: part 2. Pract Dermatol. July 2011:48-50.
- Karagounis TK, Gittler JK, Rotemberg V, et al. Use of “natural” oils for moisturization: review of olive, coconut, and sunflower seed oil. Pediatr Dermatol. 2019;36:9-15. doi:10.1111/pde.13621
- Jenkins BA, Belsito DV. Lanolin. Dermatitis. 2023;34:4-12. doi:10.1089/derm.2022.0002
- National Center for Biotechnology Information (2023). PubChem Annotation Record for LANOLIN, Source: Hazardous Substances Data Bank (HSDB). Accessed July 21, 2023. https://pubchem.ncbi.nlm.nih.gov/source/hsdb/1817
- National Center for Biotechnology Information. PubChem compound summary lanolin. Accessed July 17, 2023. https://pubchem.ncbi.nlm.nih.gov/compound/Lanolin
- Purnamawati S, Indrastuti N, Danarti R, et al. the role of moisturizers in addressing various kinds of dermatitis: a review. Clin Med Res. 2017;15:75-87. doi:10.3121/cmr.2017.1363
- Sethi A, Kaur T, Malhotra SK, et al. Moisturizers: the slippery road. Indian J Dermatol. 2016;61:279-287. doi:10.4103/0019-5154.182427
- Souto EB, Yoshida CMP, Leonardi GR, et al. Lipid-polymeric films: composition, production and applications in wound healing and skin repair. Pharmaceutics. 2021;13:1199. doi:10.3390/pharmaceutics13081199
- Rüther L, Voss W. Hydrogel or ointment? comparison of five different galenics regarding tissue breathability and transepidermal water loss. Heliyon. 2021;7:E06071. doi:10.1016/j.heliyon.2021.e06071
- Zirwas MJ. Contact alternatives and the internet. Dermatitis. 2012;23:192-194. doi:10.1097/DER.0b013e31826ea0d2
- Lee B, Warshaw E. Lanolin allergy: history, epidemiology, responsible allergens, and management. Dermatitis. 2008;19:63-72.
- Ramirez M, Eller JJ. The patch test in contact dermatitis. Allergy. 1929;1:489-493.
- Silverberg JI, Patel N, Warshaw EM, et al. Lanolin allergic reactions: North American Contact Dermatitis Group experience, 2001 to 2018. Dermatitis. 2022;33:193-199. doi:10.1097/DER.0000000000000871
- Diepgen TL, Ofenloch RF, Bruze M, et al. Prevalence of contact allergy in the general population in different European regions. Br J Dermatol. 2016;174:319-329. doi:10.1111/bjd.14167
- Zallmann M, Smith PK, Tang MLK, et al. Debunking the myth of wool allergy: reviewing the evidence for immune and non-immune cutaneous reactions. Acta Derm Venereol. 2017;97:906-915. doi:10.2340/00015555-2655
- Yosipovitch G, Nedorost ST, Silverberg JI, et al. Stasis dermatitis: an overview of its clinical presentation, pathogenesis, and management. Am J Clin Dermatol. 2023;24:275-286. doi:10.1007/s40257-022-00753-5
- Johnson H, Novack DE, Adler BL, et al. Can atopic dermatitis and allergic contact dermatitis coexist? Cutis. 2022;110:139-142. doi:10.12788/cutis.0599
- Gilissen L, Schollaert I, Huygens S, et al. Iatrogenic allergic contact dermatitis in the (peri)anal and genital area. Contact Dermatitis. 2021;84:431-438. doi:10.1111/cod.13764
- Wolf R. The lanolin paradox. Dermatology. 1996;192:198-202. doi:10.1159/000246365
- Fisher AA. The paraben paradox. Cutis. 1973;12:830-832.
- Kligman AM. The myth of lanolin allergy. Contact Dermatitis. 1998;39:103-107. doi:10.1111/j.1600-0536.1998.tb05856.x
- Wakelin SH, Smith H, White IR, et al. A retrospective analysis of contact allergy to lanolin. Br J Dermatol. 2001;145:28-31. doi:10.1046/j.1365-2133.2001.04277.x
- Warshaw EM, Nelsen DD, Maibach HI, et al. Positive patch test reactions to lanolin: cross-sectional data from the North American Contact Dermatitis group, 1994 to 2006. Dermatitis. 2009;20:79-88.
- Mortensen T. Allergy to lanolin. Contact Dermatitis. 1979;5:137-139. doi:10.1111/j.1600-0536.1979.tb04824.x
- Miest RY, Yiannias JA, Chang YH, et al. Diagnosis and prevalence of lanolin allergy. Dermatitis. 2013;24:119-123. doi:10.1097/DER.0b013e3182937aa4
- Knijp J, Bruynzeel DP, Rustemeyer T. Diagnosing lanolin contact allergy with lanolin alcohol and Amerchol L101. Contact Dermatitis. 2019;80:298-303. doi:10.1111/cod.13210
- Amsler E, Assier H, Soria A, et al. What is the optimal duration for a ROAT? the experience of the French Dermatology and Allergology group (DAG). Contact Dermatitis. 2022;87:170-175. doi:10.1111/cod.14118
- Msika P, De Belilovsky C, Piccardi N, et al. New emollient with topical corticosteroid-sparing effect in treatment of childhood atopic dermatitis: SCORAD and quality of life improvement. Pediatr Dermatol. 2008;25:606-612. doi: 10.1111/j.1525-1470.2008.00783.x
- Lio PA. Alternative therapies in atopic dermatitis care: part 2. Pract Dermatol. July 2011:48-50.
- Karagounis TK, Gittler JK, Rotemberg V, et al. Use of “natural” oils for moisturization: review of olive, coconut, and sunflower seed oil. Pediatr Dermatol. 2019;36:9-15. doi:10.1111/pde.13621
Practice Points
- Lanolin is a common ingredient in personal care products (PCPs), cosmetics, topical medicaments, and industrial materials.
- Allergic contact dermatitis to lanolin appears to be most common in patients with stasis dermatitis, chronic leg ulcers, atopic dermatitis, and perianal/genital dermatitis.
- There is no single best lanolin patch test formulation. Patch testing and repeat open application testing to PCPs containing lanolin also may be of benefit.
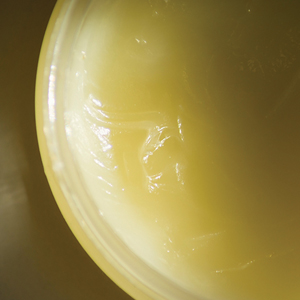
Enlarging Pigmented Lesion on the Thigh
The Diagnosis: Localized Cutaneous Argyria
The differential diagnosis of an enlarging pigmented lesion is broad, including various neoplasms, pigmented deep fungal infections, and cutaneous deposits secondary to systemic or topical medications or other exogenous substances. In our patient, identification of black particulate material on biopsy prompted further questioning. After the sinus tract persisted for 6 months, our patient’s infectious disease physician started applying silver nitrate at 3-week intervals to minimize drainage, exudate, and granulation tissue formation. After 3 months, marked pigmentation of the skin around the sinus tract was noted.
Argyria is a rare skin disorder that results from deposition of silver via localized exposure or systemic ingestion. Discoloration can either be reversible or irreversible, usually dependent on the length of silver exposure.1 Affected individuals exhibit blue-gray pigmentation of the skin that may be localized or diffuse. Photoactivated reduction of silver salts leads to conversion to elemental silver in the skin.2 Although argyria is most common on sun-exposed areas, the mucosae and nails may be involved in systemic cases. The etiology of argyria includes occupational exposure by ingestion of dust or traumatic cutaneous exposure in jewelry manufacturing, mining, or photographic or radiograph manufacturing. Other sources of localized argyria include prolonged contact with topical silver nitrate or silver sulfadiazine for wound care, silver-coated jewelry or piercings, acupuncture, tooth restoration procedures using dental amalgam, silver-containing surgical implants, or other silver-containing medications or wound dressings. Discontinuing contact with the source of silver minimizes further pigmentation, and excision of deposits may be helpful in some instances.3
Histopathologic findings in argyria may be subtle and diverse. Small particulate material may be apparent on careful examination at high magnification only, and the depth of deposition can depend on the etiology of absorption or implantation as well as the length of exposure. Short-term exposure may be associated with deposition of dark, brown-black, coarse granules confined to the stratum corneum.1 Frequently, cases of argyria reveal small, extracellular, brown-black, pigmented granules in a bandlike distribution primarily around vasculature, eccrine glands, perineural tissue, hair follicles, or arrector pili muscles or free in the dermis around collagen bundles. The granules can be highlighted by dark-field microscopy that will display scattered, refractile, white particles, described as a “stars in heaven” pattern.3 Rare ochre-colored collagen bundles have been reported in some cases, described as a pseudo-ochronosis pattern of argyria.4
Given the clinical history in our patient, a melanocytic lesion was considered but was excluded based on the histopathologic findings. Regressed melanoma clinically may resemble cutaneous silver deposition, as tumoral melanosis can be associated with an intense blue-black presentation. Histopathology will reveal an absence of melanocytes with residual coarse melanin in melanophages (Figure 1) rather than the particulate material associated with silver deposition. Although argyria can be associated with increased melanin in the basal epidermal keratinocytes and melanophages in the papillary dermis, silver granules can be distinguished by their uniform appearance and location throughout the skin (dermis, around vasculature/adnexal structures vs melanin in melanophages and basal epidermal keratinocytes).3,5,6
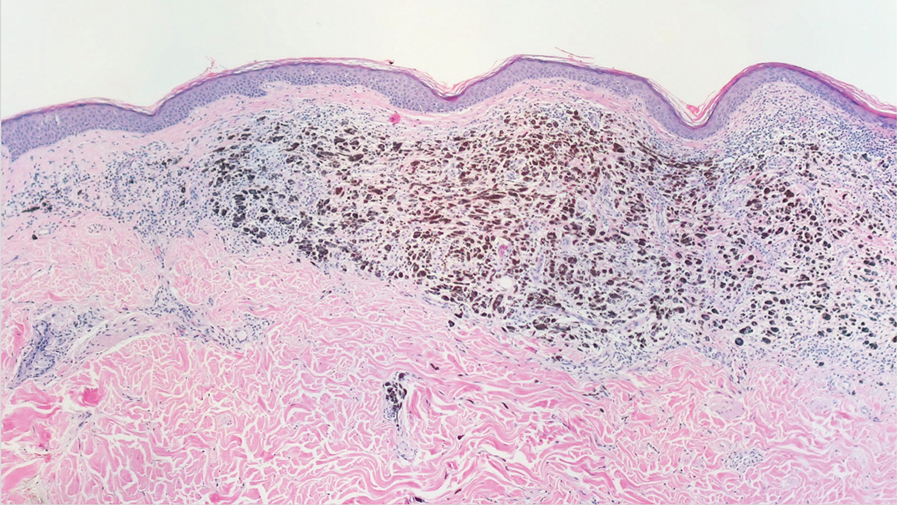
Blue nevi typically present as well-circumscribed, blue to gray or even dark brown lesions most often located on the arms, legs, head, and neck. Histopathology reveals spindle-shaped dendritic melanocytes dissecting through collagen bundles in the dermis with melanophages (Figure 2). Pigmentation may vary from extensive to little or even none. Blue nevi are demarcated and may be associated with dermal sclerosis.7
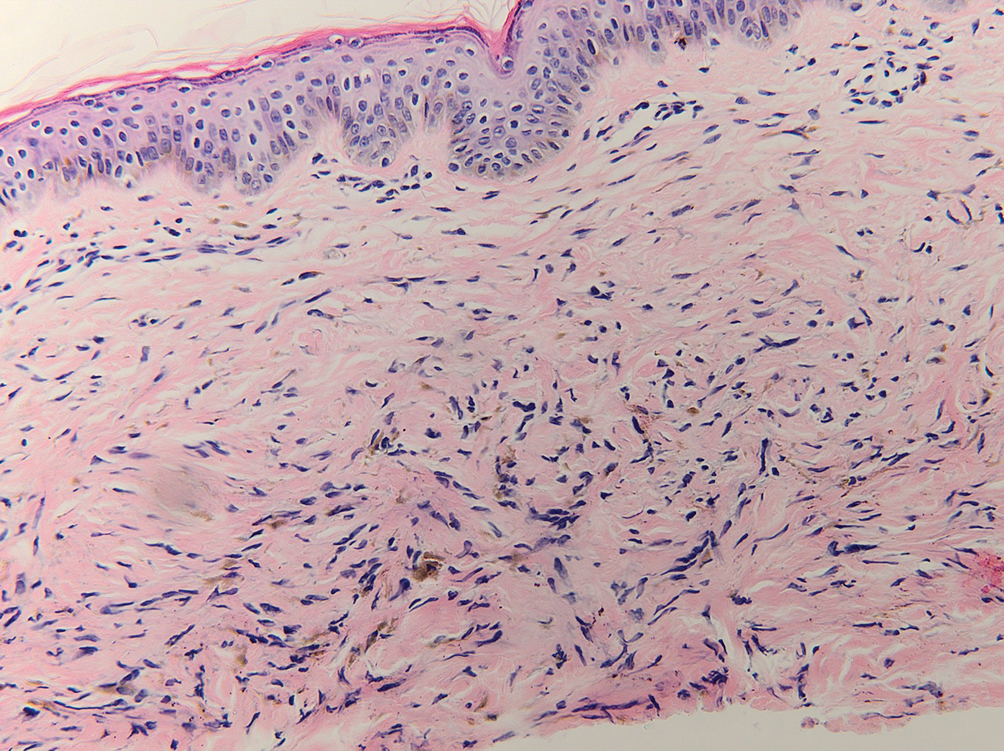
Drug-induced hyperpigmentation has a variable presentation both clinically and histologically depending on the type of drug implicated. Tetracyclines, particularly minocycline, are known culprits of drug-induced pigmentation, which can present as blue-gray to brown discoloration in at least 3 classically described patterns: (1) blue-black pigmentation around scars or prior inflammatory sites, (2) blue-black pigmentation on the shins or upper extremities, or (3) brown pigmentation in photosensitive areas. Histopathology reveals brown-black granules intracellularly in macrophages or fibroblasts or localized around vessels or eccrine glands (Figure 3). Special stains such as Perls Prussian blue or Fontana-Masson may highlight the pigmented granules. Widespread pigmentation in other organs, such as the thyroid, and history of long-standing tetracycline use are helpful clues to distinguish drug-induced pigmentation from other entities.8
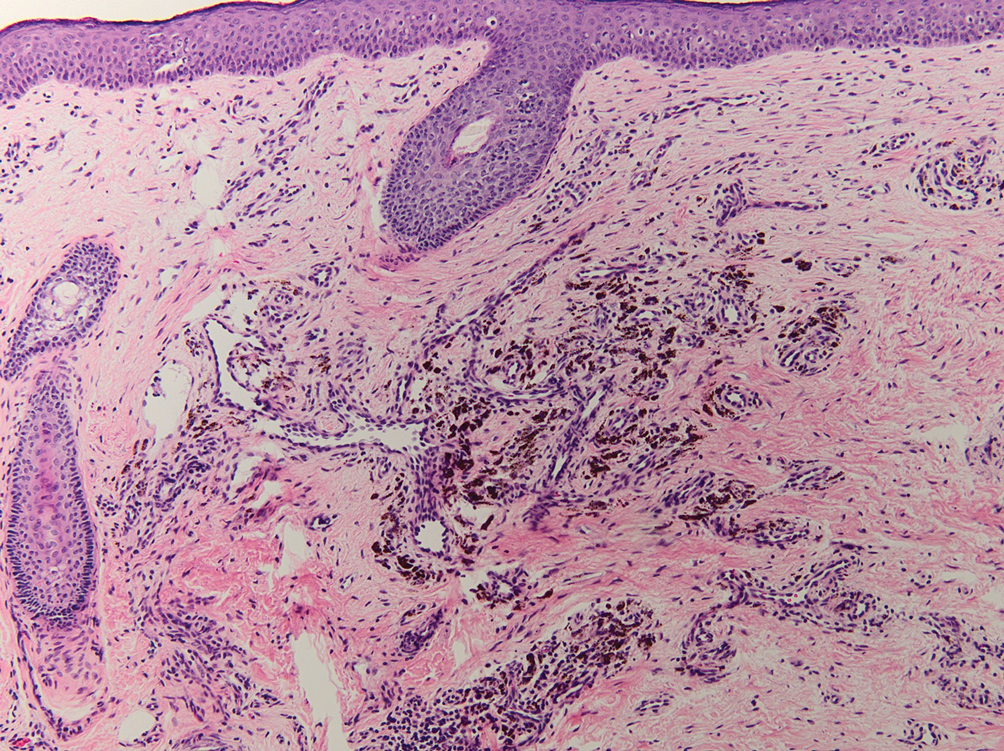
Tattoo ink reaction frequently presents as an irregular pigmented lesion that can have associated features of inflammation including rash, erythema, and swelling. Histopathology reveals small clumped pigment in the dermis localized either extracellularly preferentially around vascular structures and collagen fibers or intracellularly in macrophages or fibroblasts (Figure 4). Considering the pigment is foreign material, a mixed inflammatory infiltrate can be present or more rarely the presence of pigment may induce pseudoepitheliomatous hyperplasia. The inflammatory reaction pattern on histology can vary, but granulomatous and lichenoid patterns frequently have been described. Other helpful clues to suggest tattoo pigment include refractile granules under polarized light and multiple pigmented colors.3
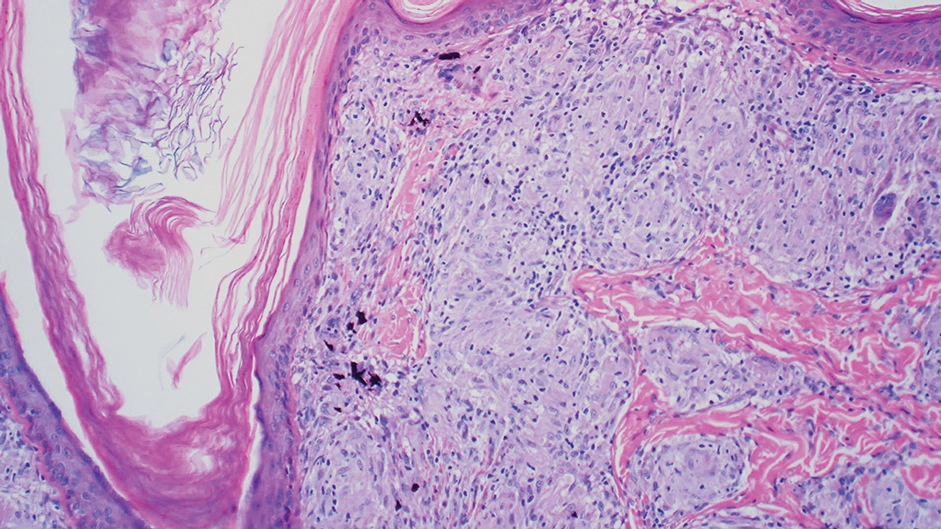
Dermal melanocytosis also may be considered, which consists of blue-gray irregular macules to patches on the skin that are frequently present at birth but may develop later in life. Histopathology reveals pigmented dendritic to spindle-shaped dermal melanocytes and melanophages dissecting between collagen fibers localized to the deep dermis. In addition, some hematologic or vascular disorders, including resolving hemorrhage or cyanosis, may be considered in the clinical differential. Deposition disorders such as chrysiasis and ochronosis could exhibit clinical or histopathologic similarities.3,8
Occasionally, prolonged use of topical silver nitrate may result in a pigmented lesion that mimics a melanocytic neoplasm or other pigmented lesions. However, these conditions can be readily differentiated by their characteristic histopathologic findings along with detailed clinical history.
- Ondrasik RM, Jordan P, Sriharan A. A clinical mimicker of melanoma with distinctive histopathology: topical silver nitrate exposure. J Cutan Pathol. 2020;47:1205-1210.
- Gill P, Richards K, Cho WC, et al. Localized cutaneous argyria: review of a rare clinical mimicker of melanocytic lesions. Ann Diagn Pathol. 2021;54:151776.
- Molina-Ruiz AM, Cerroni L, Kutzner H, et al. Cutaneous deposits. Am J Dermatopathol. 2014;36:1-48.
- Lee J, Korgavkar K, DiMarco C, et al. Localized argyria with pseudoochronosis. J Cutan Pathol. 2020;47:671-674.
- El Sharouni MA, Aivazian K, Witkamp AJ, et al. Association of histologic regression with a favorable outcome in patients with stage 1 and stage 2 cutaneous melanoma. JAMA Dermatol. 2021;157:166-173.
- Staser K, Chen D, Solus J, et al. Extensive tumoral melanosis associated with ipilimumab-treated melanoma. Br J Dermatol. 2016;175:391-393.
- Sugianto JZ, Ralston JS, Metcalf JS, et al. Blue nevus and “malignant blue nevus”: a concise review. Semin Diagn Pathol. 2016;33:219-224.
- Wang RF, Ko D, Friedman BJ, et al. Disorders of hyperpigmentation. part I. pathogenesis and clinical features of common pigmentary disorders. J Am Acad Dermatol. 2023;88:271-288.
The Diagnosis: Localized Cutaneous Argyria
The differential diagnosis of an enlarging pigmented lesion is broad, including various neoplasms, pigmented deep fungal infections, and cutaneous deposits secondary to systemic or topical medications or other exogenous substances. In our patient, identification of black particulate material on biopsy prompted further questioning. After the sinus tract persisted for 6 months, our patient’s infectious disease physician started applying silver nitrate at 3-week intervals to minimize drainage, exudate, and granulation tissue formation. After 3 months, marked pigmentation of the skin around the sinus tract was noted.
Argyria is a rare skin disorder that results from deposition of silver via localized exposure or systemic ingestion. Discoloration can either be reversible or irreversible, usually dependent on the length of silver exposure.1 Affected individuals exhibit blue-gray pigmentation of the skin that may be localized or diffuse. Photoactivated reduction of silver salts leads to conversion to elemental silver in the skin.2 Although argyria is most common on sun-exposed areas, the mucosae and nails may be involved in systemic cases. The etiology of argyria includes occupational exposure by ingestion of dust or traumatic cutaneous exposure in jewelry manufacturing, mining, or photographic or radiograph manufacturing. Other sources of localized argyria include prolonged contact with topical silver nitrate or silver sulfadiazine for wound care, silver-coated jewelry or piercings, acupuncture, tooth restoration procedures using dental amalgam, silver-containing surgical implants, or other silver-containing medications or wound dressings. Discontinuing contact with the source of silver minimizes further pigmentation, and excision of deposits may be helpful in some instances.3
Histopathologic findings in argyria may be subtle and diverse. Small particulate material may be apparent on careful examination at high magnification only, and the depth of deposition can depend on the etiology of absorption or implantation as well as the length of exposure. Short-term exposure may be associated with deposition of dark, brown-black, coarse granules confined to the stratum corneum.1 Frequently, cases of argyria reveal small, extracellular, brown-black, pigmented granules in a bandlike distribution primarily around vasculature, eccrine glands, perineural tissue, hair follicles, or arrector pili muscles or free in the dermis around collagen bundles. The granules can be highlighted by dark-field microscopy that will display scattered, refractile, white particles, described as a “stars in heaven” pattern.3 Rare ochre-colored collagen bundles have been reported in some cases, described as a pseudo-ochronosis pattern of argyria.4
Given the clinical history in our patient, a melanocytic lesion was considered but was excluded based on the histopathologic findings. Regressed melanoma clinically may resemble cutaneous silver deposition, as tumoral melanosis can be associated with an intense blue-black presentation. Histopathology will reveal an absence of melanocytes with residual coarse melanin in melanophages (Figure 1) rather than the particulate material associated with silver deposition. Although argyria can be associated with increased melanin in the basal epidermal keratinocytes and melanophages in the papillary dermis, silver granules can be distinguished by their uniform appearance and location throughout the skin (dermis, around vasculature/adnexal structures vs melanin in melanophages and basal epidermal keratinocytes).3,5,6
Blue nevi typically present as well-circumscribed, blue to gray or even dark brown lesions most often located on the arms, legs, head, and neck. Histopathology reveals spindle-shaped dendritic melanocytes dissecting through collagen bundles in the dermis with melanophages (Figure 2). Pigmentation may vary from extensive to little or even none. Blue nevi are demarcated and may be associated with dermal sclerosis.7
Drug-induced hyperpigmentation has a variable presentation both clinically and histologically depending on the type of drug implicated. Tetracyclines, particularly minocycline, are known culprits of drug-induced pigmentation, which can present as blue-gray to brown discoloration in at least 3 classically described patterns: (1) blue-black pigmentation around scars or prior inflammatory sites, (2) blue-black pigmentation on the shins or upper extremities, or (3) brown pigmentation in photosensitive areas. Histopathology reveals brown-black granules intracellularly in macrophages or fibroblasts or localized around vessels or eccrine glands (Figure 3). Special stains such as Perls Prussian blue or Fontana-Masson may highlight the pigmented granules. Widespread pigmentation in other organs, such as the thyroid, and history of long-standing tetracycline use are helpful clues to distinguish drug-induced pigmentation from other entities.8
Tattoo ink reaction frequently presents as an irregular pigmented lesion that can have associated features of inflammation including rash, erythema, and swelling. Histopathology reveals small clumped pigment in the dermis localized either extracellularly preferentially around vascular structures and collagen fibers or intracellularly in macrophages or fibroblasts (Figure 4). Considering the pigment is foreign material, a mixed inflammatory infiltrate can be present or more rarely the presence of pigment may induce pseudoepitheliomatous hyperplasia. The inflammatory reaction pattern on histology can vary, but granulomatous and lichenoid patterns frequently have been described. Other helpful clues to suggest tattoo pigment include refractile granules under polarized light and multiple pigmented colors.3
Dermal melanocytosis also may be considered, which consists of blue-gray irregular macules to patches on the skin that are frequently present at birth but may develop later in life. Histopathology reveals pigmented dendritic to spindle-shaped dermal melanocytes and melanophages dissecting between collagen fibers localized to the deep dermis. In addition, some hematologic or vascular disorders, including resolving hemorrhage or cyanosis, may be considered in the clinical differential. Deposition disorders such as chrysiasis and ochronosis could exhibit clinical or histopathologic similarities.3,8
Occasionally, prolonged use of topical silver nitrate may result in a pigmented lesion that mimics a melanocytic neoplasm or other pigmented lesions. However, these conditions can be readily differentiated by their characteristic histopathologic findings along with detailed clinical history.
The Diagnosis: Localized Cutaneous Argyria
The differential diagnosis of an enlarging pigmented lesion is broad, including various neoplasms, pigmented deep fungal infections, and cutaneous deposits secondary to systemic or topical medications or other exogenous substances. In our patient, identification of black particulate material on biopsy prompted further questioning. After the sinus tract persisted for 6 months, our patient’s infectious disease physician started applying silver nitrate at 3-week intervals to minimize drainage, exudate, and granulation tissue formation. After 3 months, marked pigmentation of the skin around the sinus tract was noted.
Argyria is a rare skin disorder that results from deposition of silver via localized exposure or systemic ingestion. Discoloration can either be reversible or irreversible, usually dependent on the length of silver exposure.1 Affected individuals exhibit blue-gray pigmentation of the skin that may be localized or diffuse. Photoactivated reduction of silver salts leads to conversion to elemental silver in the skin.2 Although argyria is most common on sun-exposed areas, the mucosae and nails may be involved in systemic cases. The etiology of argyria includes occupational exposure by ingestion of dust or traumatic cutaneous exposure in jewelry manufacturing, mining, or photographic or radiograph manufacturing. Other sources of localized argyria include prolonged contact with topical silver nitrate or silver sulfadiazine for wound care, silver-coated jewelry or piercings, acupuncture, tooth restoration procedures using dental amalgam, silver-containing surgical implants, or other silver-containing medications or wound dressings. Discontinuing contact with the source of silver minimizes further pigmentation, and excision of deposits may be helpful in some instances.3
Histopathologic findings in argyria may be subtle and diverse. Small particulate material may be apparent on careful examination at high magnification only, and the depth of deposition can depend on the etiology of absorption or implantation as well as the length of exposure. Short-term exposure may be associated with deposition of dark, brown-black, coarse granules confined to the stratum corneum.1 Frequently, cases of argyria reveal small, extracellular, brown-black, pigmented granules in a bandlike distribution primarily around vasculature, eccrine glands, perineural tissue, hair follicles, or arrector pili muscles or free in the dermis around collagen bundles. The granules can be highlighted by dark-field microscopy that will display scattered, refractile, white particles, described as a “stars in heaven” pattern.3 Rare ochre-colored collagen bundles have been reported in some cases, described as a pseudo-ochronosis pattern of argyria.4
Given the clinical history in our patient, a melanocytic lesion was considered but was excluded based on the histopathologic findings. Regressed melanoma clinically may resemble cutaneous silver deposition, as tumoral melanosis can be associated with an intense blue-black presentation. Histopathology will reveal an absence of melanocytes with residual coarse melanin in melanophages (Figure 1) rather than the particulate material associated with silver deposition. Although argyria can be associated with increased melanin in the basal epidermal keratinocytes and melanophages in the papillary dermis, silver granules can be distinguished by their uniform appearance and location throughout the skin (dermis, around vasculature/adnexal structures vs melanin in melanophages and basal epidermal keratinocytes).3,5,6
Blue nevi typically present as well-circumscribed, blue to gray or even dark brown lesions most often located on the arms, legs, head, and neck. Histopathology reveals spindle-shaped dendritic melanocytes dissecting through collagen bundles in the dermis with melanophages (Figure 2). Pigmentation may vary from extensive to little or even none. Blue nevi are demarcated and may be associated with dermal sclerosis.7
Drug-induced hyperpigmentation has a variable presentation both clinically and histologically depending on the type of drug implicated. Tetracyclines, particularly minocycline, are known culprits of drug-induced pigmentation, which can present as blue-gray to brown discoloration in at least 3 classically described patterns: (1) blue-black pigmentation around scars or prior inflammatory sites, (2) blue-black pigmentation on the shins or upper extremities, or (3) brown pigmentation in photosensitive areas. Histopathology reveals brown-black granules intracellularly in macrophages or fibroblasts or localized around vessels or eccrine glands (Figure 3). Special stains such as Perls Prussian blue or Fontana-Masson may highlight the pigmented granules. Widespread pigmentation in other organs, such as the thyroid, and history of long-standing tetracycline use are helpful clues to distinguish drug-induced pigmentation from other entities.8
Tattoo ink reaction frequently presents as an irregular pigmented lesion that can have associated features of inflammation including rash, erythema, and swelling. Histopathology reveals small clumped pigment in the dermis localized either extracellularly preferentially around vascular structures and collagen fibers or intracellularly in macrophages or fibroblasts (Figure 4). Considering the pigment is foreign material, a mixed inflammatory infiltrate can be present or more rarely the presence of pigment may induce pseudoepitheliomatous hyperplasia. The inflammatory reaction pattern on histology can vary, but granulomatous and lichenoid patterns frequently have been described. Other helpful clues to suggest tattoo pigment include refractile granules under polarized light and multiple pigmented colors.3
Dermal melanocytosis also may be considered, which consists of blue-gray irregular macules to patches on the skin that are frequently present at birth but may develop later in life. Histopathology reveals pigmented dendritic to spindle-shaped dermal melanocytes and melanophages dissecting between collagen fibers localized to the deep dermis. In addition, some hematologic or vascular disorders, including resolving hemorrhage or cyanosis, may be considered in the clinical differential. Deposition disorders such as chrysiasis and ochronosis could exhibit clinical or histopathologic similarities.3,8
Occasionally, prolonged use of topical silver nitrate may result in a pigmented lesion that mimics a melanocytic neoplasm or other pigmented lesions. However, these conditions can be readily differentiated by their characteristic histopathologic findings along with detailed clinical history.
- Ondrasik RM, Jordan P, Sriharan A. A clinical mimicker of melanoma with distinctive histopathology: topical silver nitrate exposure. J Cutan Pathol. 2020;47:1205-1210.
- Gill P, Richards K, Cho WC, et al. Localized cutaneous argyria: review of a rare clinical mimicker of melanocytic lesions. Ann Diagn Pathol. 2021;54:151776.
- Molina-Ruiz AM, Cerroni L, Kutzner H, et al. Cutaneous deposits. Am J Dermatopathol. 2014;36:1-48.
- Lee J, Korgavkar K, DiMarco C, et al. Localized argyria with pseudoochronosis. J Cutan Pathol. 2020;47:671-674.
- El Sharouni MA, Aivazian K, Witkamp AJ, et al. Association of histologic regression with a favorable outcome in patients with stage 1 and stage 2 cutaneous melanoma. JAMA Dermatol. 2021;157:166-173.
- Staser K, Chen D, Solus J, et al. Extensive tumoral melanosis associated with ipilimumab-treated melanoma. Br J Dermatol. 2016;175:391-393.
- Sugianto JZ, Ralston JS, Metcalf JS, et al. Blue nevus and “malignant blue nevus”: a concise review. Semin Diagn Pathol. 2016;33:219-224.
- Wang RF, Ko D, Friedman BJ, et al. Disorders of hyperpigmentation. part I. pathogenesis and clinical features of common pigmentary disorders. J Am Acad Dermatol. 2023;88:271-288.
- Ondrasik RM, Jordan P, Sriharan A. A clinical mimicker of melanoma with distinctive histopathology: topical silver nitrate exposure. J Cutan Pathol. 2020;47:1205-1210.
- Gill P, Richards K, Cho WC, et al. Localized cutaneous argyria: review of a rare clinical mimicker of melanocytic lesions. Ann Diagn Pathol. 2021;54:151776.
- Molina-Ruiz AM, Cerroni L, Kutzner H, et al. Cutaneous deposits. Am J Dermatopathol. 2014;36:1-48.
- Lee J, Korgavkar K, DiMarco C, et al. Localized argyria with pseudoochronosis. J Cutan Pathol. 2020;47:671-674.
- El Sharouni MA, Aivazian K, Witkamp AJ, et al. Association of histologic regression with a favorable outcome in patients with stage 1 and stage 2 cutaneous melanoma. JAMA Dermatol. 2021;157:166-173.
- Staser K, Chen D, Solus J, et al. Extensive tumoral melanosis associated with ipilimumab-treated melanoma. Br J Dermatol. 2016;175:391-393.
- Sugianto JZ, Ralston JS, Metcalf JS, et al. Blue nevus and “malignant blue nevus”: a concise review. Semin Diagn Pathol. 2016;33:219-224.
- Wang RF, Ko D, Friedman BJ, et al. Disorders of hyperpigmentation. part I. pathogenesis and clinical features of common pigmentary disorders. J Am Acad Dermatol. 2023;88:271-288.
An 80-year-old man presented with a pigmented lesion on the left lateral thigh near the knee that had been gradually enlarging over several weeks (top [inset]). He underwent a left knee replacement surgery for advanced osteoarthritis many months prior that was complicated by postoperative Staphylococcus aureus infection with sinus tract formation that was persistent for 6 months and treated with a topical medication. A pigmented lesion developed near the opening of the sinus tract. His medical history was remarkable for extensive actinic damage as well as multiple actinic keratoses treated with cryotherapy but no history of melanoma. An excisional biopsy was performed (top and bottom).
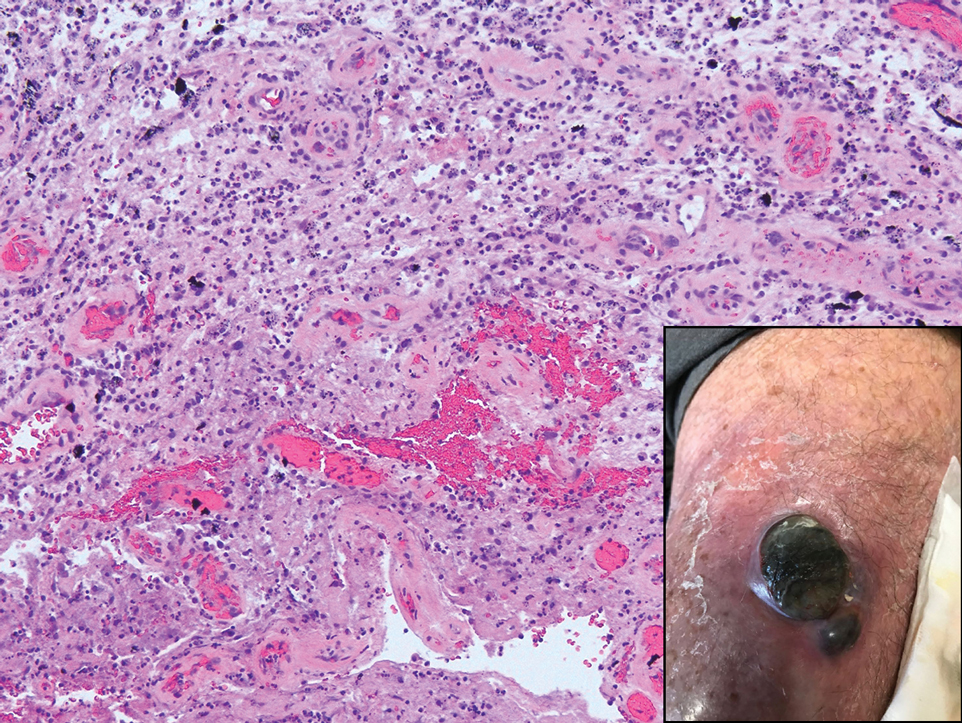
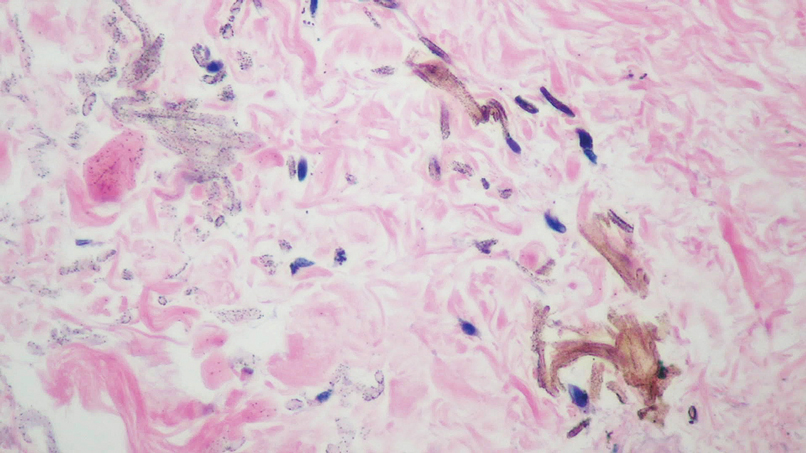
Serum Ferritin Levels: A Clinical Guide in Patients With Hair Loss
Ferritin is an iron storage protein crucial to human iron homeostasis. Because serum ferritin levels are in dynamic equilibrium with the body’s iron stores, ferritin often is measured as a reflection of iron status; however, ferritin also is an acute-phase reactant whose levels may be nonspecifically elevated in a wide range of inflammatory conditions. The various processes that alter serum ferritin levels complicate the clinical interpretation of this laboratory value. In this article, we review the structure and function of ferritin and provide a guide for clinical use.
Overview of Iron
Iron is an essential element of key biologic functions including DNA synthesis and repair, oxygen transport, and oxidative phosphorylation. The body’s iron stores are mainly derived from internal iron recycling following red blood cell breakdown, while 5% to 10% is supplied by dietary intake.1-3 Iron metabolism is of particular importance in cells of the reticuloendothelial system (eg, spleen, liver, bone marrow), where excess iron must be appropriately sequestered and from which iron can be mobilized.4 Sufficient iron stores are necessary for proper cellular function and survival, as iron is a necessary component of hemoglobin for oxygen delivery, iron-sulfur clusters in electron transport, and enzyme cofactors in other cellular processes.
Although labile pools of biologically active free iron exist in limited amounts within cells, excess free iron can generate free radicals that damage cellular proteins, lipids, and nucleic acids.5-7 As such, most intracellular iron is captured within ferritin molecules. The excretion of iron is unregulated and occurs through loss in sweat, menstruation, hair shedding, skin desquamation, and enterocyte turnover.8 The lack of regulated excretion highlights the need for a tightly regulated system of uptake, transportation, storage, and sequestration to maintain iron homeostasis.
Overview of Ferritin Structure and Function
Ferritin is a key regulator of iron homeostasis that also serves as an important clinical indicator of body iron status. Ferritin mainly is found as an intracellular cytosolic iron storage and detoxification protein structured as a hollow 24-subunit polymer shell that can sequester up to 4500 atoms of iron within its core.9,10 The 24-mer is composed of both ferritin L (FTL) and ferritin H (FTH) subunits, with dynamic regulation of the H:L ratio dependent on the context and tissue in which ferritin is found.6
Ferritin H possesses ferroxidase, which facilitates oxidation of ferrous (Fe2+) iron into ferric (Fe3+) iron, which can then be incorporated into the mineral core of the ferritin heteropolymer.11 Ferritin L is more abundant in the spleen and liver, while FTH is found predominantly in the heart and kidneys where the increased ferroxidase activity may confer an increased ability to oxidize Fe2+ and limit oxidative stress.6
Regulation of Ferritin Synthesis and Secretion
Ferritin synthesis is regulated by intracellular nonheme iron levels, governed mainly by an iron response element (IRE) and iron response protein (IRP) translational repression system. Both FTH and FTL messenger RNA (mRNA) contain an IRE that is a regulatory stem-loop structure in the 5´ untranslated region. When the IRE is bound by IRP1 or IRP2, mRNA translation of ferritin subunits is suppressed.6 In low iron conditions, IRPs have greater affinity for IRE, and binding suppresses ferritin translation.12 In high iron conditions, IRPs have a decreased affinity for IRE, and ferritin mRNA synthesis is increased.13 Additionally, inflammatory cytokines such as tumor necrosis factor α and IL-1α transcriptionally induce FTH synthesis, resulting in an increased population of H-rich ferritins.11,14-16 A study using cultured human primary skin fibroblasts demonstrated UV radiation–induced increases in free intracellular iron content.17,18 Pourzand et al18 suggested that UV-mediated damage of lysosomal membranes results in leakage of lysosomal proteases into the cytosol, contributing to degradation of intracellular ferritin and subsequent release of iron within skin fibroblasts. The increased intracellular iron downregulates IRPs and increases ferritin mRNA synthesis,18 consistent with prior findings of increased ferritin synthesis in skin that is induced by UV radiation.19
Molecular analysis of serum ferritin in iron-overloaded mice revealed that extracellular ferritin found in the serum is composed of a greater fraction of FTL and has lower iron content than intracellular ferritin. The low iron content of serum ferritin compared with intracellular ferritin and transferrin suggests that serum ferritin is not a major pathway of systemic iron transport.10 However, locally secreted ferritins may play a greater role in iron transport and release in selected tissues. Additionally, in vitro studies of cell cultures from humans and mice have demonstrated the ability of macrophages to secrete ferritin, suggesting that macrophages are an important cellular source of serum ferritin.10,20 As such, serum ferritin generally may reflect body iron status but more specifically reflects macrophage iron status.10 Although the exact pathways of ferritin release are unknown, it is hypothesized that ferritin secretion occurs through cytosolic autophagy followed by secretion of proteins from the lysosomal compartment.10,18,21
Clinical Utility of Serum Ferritin
Low Ferritin and Iron Deficiency—Although bone marrow biopsy with iron staining remains the gold standard for diagnosis of iron deficiency, serum ferritin is a much more accessible and less invasive tool for evaluation of iron status. A serum ferritin level below 12 μg/L is highly specific for iron depletion,22 with a higher cutoff recommended in clinical practice to improve diagnostic sensitivity.23,24 Conditions independent of iron deficiency that may reduce serum ferritin include hypothyroidism and ascorbate deficiency, though neither condition has been reported to interfere with appropriate diagnosis of iron deficiency.25 Guyatt et al26 conducted a systematic review of laboratory tests used in the diagnosis of iron deficiency anemia and identified 55 studies suitable for inclusion. Based on an area under the receiver operating characteristic curve (AUROC) of 0.95, serum ferritin values were superior to transferrin saturation (AUROC, 0.74), red cell protoporphyrin (AUROC, 0.77), red cell volume distribution width (AUROC, 0.62), and mean cell volume (AUROC, 0.76) for diagnosis of IDA, verified by histologic examination of aspirated bone marrow.26 The likelihood ratio of iron deficiency begins to decrease for serum ferritin values of 40 μg/L or greater. For patients with inflammatory conditions—patients with concomitant chronic renal failure, inflammatory disease, infection, rheumatoid arthritis, liver disease, inflammatory bowel disease, and malignancy—the likelihood of iron deficiency begins to decrease at serum ferritin levels of 70 μg/L or greater.26 Similarly, the World Health Organization recommends that in adults with infection or inflammation, serum ferritin levels lower than 70 μg/L may be used to indicate iron deficiency.24 A serum ferritin level of 41 μg/L or lower was found to have a sensitivity and specificity of 98% for discriminating between iron-deficiency anemia and anemia of chronic disease (diagnosed based on bone marrow biopsy with iron staining), with an AUROC of 0.98.27 As such, we recommend using a serum ferritin level of 40 μg/L or lower in patients who are otherwise healthy as an indicator of iron deficiency.
The threshold for iron supplementation may vary based on age, sex, and race. In women, ferritin levels increase during menopause and peak after menopause; ferritin levels are higher in men than in women.28-30 A multisite longitudinal cohort study of 70 women in the United States found that the mean (SD) ferritin valuewas 69.5 (81.7) μg/L premenopause and 128.8 (125.7) μg/L postmenopause (P<.01).31 A separate longitudinal survey study of 8564 patients in China found that the mean (SE) ferritin value was 201.55 (3.60) μg/L for men and 80.46 (1.64) μg/L for women (P<.0001).32 Analysis of serum ferritin levels of 3554 male patients from the third National Health and Nutrition Examination Survey demonstrated that patients who self-reported as non-Hispanic Black (n=1616) had significantly higher serum ferritin levels than non-Hispanic White patients (n=1938)(serum ferritin difference of 37.1 μg/L)(P<.0001).33 The British Society for Haematology guidelines recommend that the threshold of serum ferritin for diagnosing iron deficiency should take into account age-, sex-, and race-based differences.34 Ferritin and Hair—Cutaneous manifestations of iron deficiency include koilonychia, glossitis, pruritus, angular cheilitis, and telogen effluvium (TE).1 A case-control study of 30 females aged 15 to 45 years demonstrated that the mean (SD) ferritin level was significantly lower in patients with TE than those with no hair loss (16.3 [12.6] ng/mL vs 60.3 [50.1] ng/mL; P<.0001). Using a threshold of 30 μg/L or lower, the investigators found that the odds ratio for TE was 21.0 (95% CI, 4.2-105.0) in patients with low serum ferritin.35
Another retrospective review of 54 patients with diffuse hair loss and 55 controls compared serum vitamin B12, folate, thyroid-stimulating hormone, zinc, ferritin, and 25-hydroxy vitamin D levels between the 2 groups.36 Exclusion criteria were clinical diagnoses of female pattern hair loss (androgenetic alopecia), pregnancy, menopause, metabolic and endocrine disorders, hormone replacement therapy, chemotherapy, immunosuppressive therapy, vitamin and mineral supplementation, scarring alopecia, eating disorders, and restrictive diets. Compared with controls, patients with diffuse nonscarring hair loss were found to have significantly lower ferritin (mean [SD], 14.72 [10.70] ng/mL vs 25.30 [14.41] ng/mL; P<.001) and 25-hydroxy vitamin D levels (mean [SD], 14.03 [8.09] ng/mL vs 17.01 [8.59] ng/mL; P=.01).36
In contrast, a separate case-control study of 381 cases and 76 controls found no increase in the rate of iron deficiency—defined as ferritin ≤15 μg/L or ≤40 μg/L—among women with female pattern hair loss or chronic TE vs controls.37 Taken together, these studies suggest that iron status may play a role in TE, a process that may result from nutritional deficiency, trauma, or physical or psychological stress38; however, there is insufficient evidence to suggest that low iron status impacts androgenetic alopecia, in which its multifactorial pathogenesis implicates genetic and hormonal factors.39 More research is needed to clarify the potential associations between iron deficiency and types of hair loss. Additionally, it is unclear whether iron supplementation improves hair growth parameters such as density and caliber.40
Low serum ferritin (<40 μg/L) with concurrent symptoms of iron deficiency, including fatigue, pallor, dyspnea on exertion, or hair loss, should prompt treatment with supplemental iron.41-43 Generally, ferrous (Fe2+) salts are preferred to ferric (Fe3+) salts, as the former is more readily absorbed through the duodenal mucosa44 and is the more common formulation in commercially available supplements in the United States.45 Oral supplementation with ferrous sulfate 325 mg (65 mg elemental iron) tablets is the first-line therapy for iron deficiency anemia.1 Alternatively, ferrous gluconate 324 mg (38 mg elemental iron) over-the-counter and its liquid form has demonstrated superior absorption compared to ferrous sulfate tablets in a clinical study with peritoneal dialysis patients.1,46 One study suggested that oral iron 40 to 80 mg should be taken every other day to increase absorption.47 Due to improved bioavailability, intravenous iron may be utilized in patients with malabsorption, renal failure, or intolerance to oral iron (including those with gastric ulcers or active inflammatory bowel disease), with the formulation chosen based on underlying comorbidities and potential risks.1,48 The theoretical risk for potentiating bacterial growth by increasing the amount of unbound iron in the blood raises concerns of iron supplementation in patients with infection or sepsis. Although far from definitive, existing data suggest that risk for infection is greater with intravenous iron supplementation and should be carefully considered prior to use.49,50Elevated Ferritin—Elevated ferritin may be difficult to interpret given the multitude of conditions that can cause it.23,51,52 Elevated serum ferritin can be broadly characterized by increased synthesis due to iron overload, increased synthesis due to inflammation, or increased ferritin release from cellular damage.34 Further complicating interpretation is the potential diurnal fluctuations in serum iron levels dependent on dietary intake and timing of laboratory evaluation, choice of assay, differences in reference standards, and variations in calibration procedures that can lead to analytic variability in the measurement of ferritin.23,53,54
Among healthy patients, serum ferritin is directly proportional to iron status.9,51 A study utilizing weekly phlebotomy of 22 healthy participants to measure serum ferritin and calculate mobilizable storage iron found a strong positive correlation between the 2 variables (r=0.83, P<.001), with each 1-μg/L increase of serum ferritin corresponding to approximately an 8-mg increase of storage iron; the initial serum ferritin values ranged from 2 to 83 μg/L in females and 36 to 224 μg/L in males.55 The correlation of ferritin with iron status also was supported by the significant correlation between the number of transfusions received in patients with transfusion-related iron overload and serum ferritin levels (r=0.89, P<.001), with an average increase of 60 μg/L per transfusion.51
Clinical guidelines on the interpretation of serum ferritin levels by Cullis et al34 recommend a normal upper limit of 200 μg/L for healthy females and 300 μg/L for healthy males. Outside of clinical syndromes associated with iron overload, Lee and Means56 found that serum ferritin of 1000 μg/L or higher was a nonspecific marker of disease, including infection and/or neoplastic disorders. We have adapted these guidelines to propose a workflow for evaluation of serum ferritin levels (Figure). In patients with inflammatory conditions or those affected by metabolic syndrome, elevated serum ferritin does not correlate with body iron status.57,58 It is believed that inflammatory cytokines, including tumor necrosis factor α and IL-1α, can upregulate ferritin synthesis independent of cellular iron stores.15,16 Several studies have examined the relationship between insulin resistance and/or metabolic syndrome with serum ferritin levels.31,32 Han et al32 found that elevated serum ferritin was significantly associated with higher risk for metabolic syndrome in men (P<.0001) but not in women.
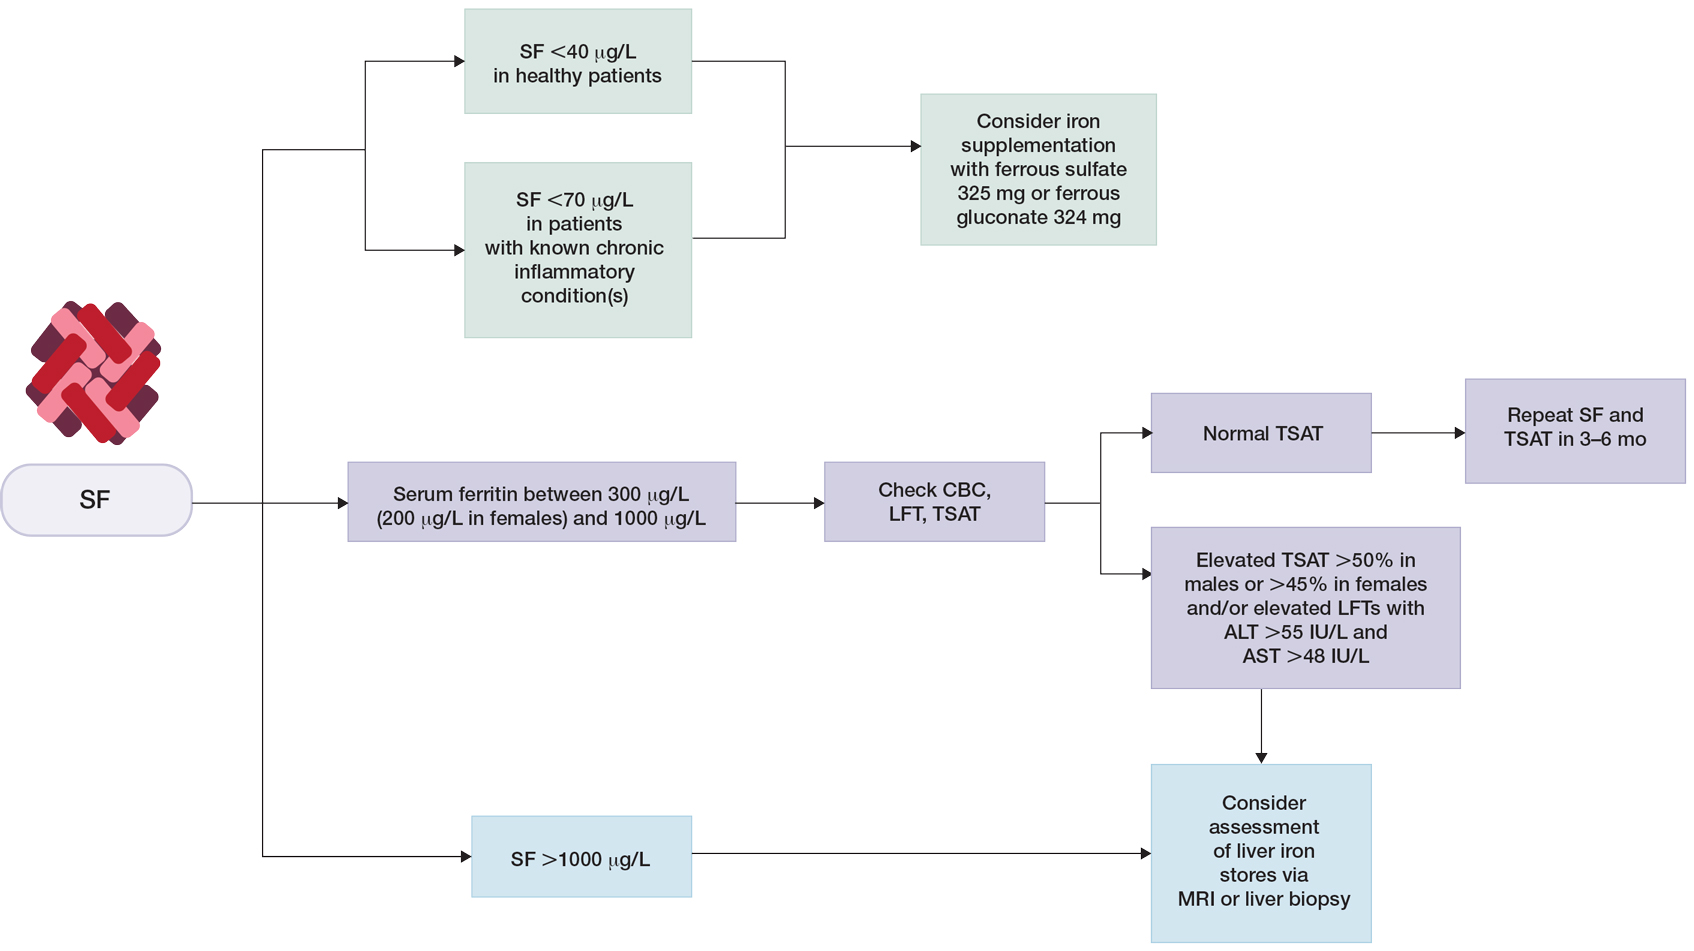
Although cutaneous manifestations of iron overload can be seen as skin hyperpigmentation due to increased iron deposits and increased melanin production,22 the effects of elevated ferritin on the skin and hair are not well known. Iron overload is a known trigger of porphyria cutanea tarda (PCT),59 a condition in which reduced or absent enzymatic activity of uroporphyrinogen decarboxylase (UROD) leads to build up of toxic porphyrins in various organs.60 In the skin, PCT manifests as a blistering photosensitive eruption that may resolve as dyspigmentation, scarring, and milia.61 Phlebotomy is first-line therapy in PCT to reduce serum iron and subsequent formation of UROD inhibitors, with guidelines suggesting discontinuation of phlebotomy when serum ferritin levels reach 20 ng/mL or lower.60 Hyperferritinemia (serum ferritin >500 μg/L) is a common finding in several inflammatory disorders often accompanied by clinically apparent cutaneous symptoms such as adult-onset Still disease,62 hemophagocytic lymphohistiocytosis,63,64 and anti-melanoma differentiation-associated gene 5 dermatomyositis.65 Among these conditions, serum ferritin levels have been reported to correlate with disease activity, raising the question of whether ferritin is a bystander or a driver of the underlying pathology.62,66,67 However, rapid decline of serum ferritin levels with treatment and control of inflammatory cytokines suggest that ferritin is unlikely to contribute to pathology.62,67
Final Thoughts
Many clinical studies have examined the association between hair health and body iron status, the collective findings of which suggest that iron deficiency may be associated with TE. Among commonly measured serum iron parameters, low ferritin is a highly specific and sensitive marker for diagnosing iron deficiency. Serum ferritin may be a clinically useful tool for ruling out underlying iron deficiency in patients presenting with hair loss. Despite advances in our understanding of the molecular mechanisms of ferritin synthesis and regulation, whether ferritin itself contributes to cutaneous pathology is poorly understood.35,36,68-74 For patients who are otherwise healthy with low suspicion for inflammatory disorders, chronic systemic illnesses, or malignancy, serum ferritin can be used as an indicator of body iron status. The workup for slightly elevated serum ferritin should be interpreted in the context of other laboratory findings and should be reassessed over time. Serum ferritin levels above 1000 μg/L warrant further investigation into causes such as iron overload conditions and underlying inflammatory conditions or malignancy.
- Hoffman M, Micheletti RG, Shields BE. Nutritional dermatoses in the hospitalized patient. Cutis. 2020;105:296, 302-308, E1-E5.
- Ganz T. Macrophages and systemic iron homeostasis. J Innate Immun. 2012;4:446-453. doi:10.1159/000336423
- Slusarczyk P, Mandal PK, Zurawska G, et al. Impaired iron recycling from erythrocytes is an early hallmark of aging. eLife. 2023;12:E79196. doi:10.7554/eLife.79196
- Crichton RR. Ferritin: structure, synthesis and function. N Engl J Med. 1971;284:1413-1422. doi:10.1056/nejm197106242842506
- Sandnes M, Ulvik RJ, Vorland M, et al. Hyperferritinemia—a clinical overview. J Clin Med. 2021;10:2008. doi:10.3390/jcm10092008
- Kernan KF, Carcillo JA. Hyperferritinemia and inflammation. Int Immunol. 2017;29:401-409. doi:10.1093/intimm/dxx031
- Wright JA, Richards T, Srai SKS. The role of iron in the skin and cutaneous wound healing. review. Front Pharmacol. 2014;5:156. doi:10.3389/fphar.2014.00156
- Ems T, St Lucia K, Huecker MR. Biochemistry, iron absorption. StatPearls Publishing; 2022.
- Crichton RR. Ferritin: structure, synthesis and function. N Engl J Med. 1971;284:1413-1422. doi:10.1056/nejm197106242842506
- Cohen LA, Gutierrez L, Weiss A, et al. Serum ferritin is derived primarily from macrophages through a nonclassical secretory pathway. Blood. 2010;116:1574-1584. doi:10.1182/blood-2009-11-253815
- Briat JF, Ravet K, Arnaud N, et al. New insights into ferritin synthesis and function highlight a link between iron homeostasis and oxidative stress in plants. Ann Bot. 2010;105:811-822. doi:10.1093/aob/mcp128
- Kato J, Kobune M, Ohkubo S, et al. Iron/IRP-1-dependent regulation of mRNA expression for transferrin receptor, DMT1 and ferritin during human erythroid differentiation. Exp Hematol. 2007;35:879-887. doi:10.1016/j.exphem.2007.03.005
- Gozzelino R, Soares MP. Coupling heme and iron metabolism via ferritin H chain. Antioxid Redox Signal. 2014;20:1754-1769. doi:10.1089/ars.2013.5666
- Torti FM, Torti SV. Regulation of ferritin genes and protein. Blood. 2002;99:3505-3516. doi:10.1182/blood.V99.10.3505
- Torti SV, Kwak EL, Miller SC, et al. The molecular cloning and characterization of murine ferritin heavy chain, a tumor necrosis factor-inducible gene. J Biol Chem. 1988;263:12638-12644.
- Wei Y, Miller SC, Tsuji Y, et al. Interleukin 1 induces ferritin heavy chain in human muscle cells. Biochem Biophys Res Commun. 1990;169:289-296. doi:10.1016/0006-291x(90)91466-6
- Bissett DL, Chatterjee R, Hannon DP. Chronic ultraviolet radiation–induced increase in skin iron and the photoprotective effect of topically applied iron chelators. Photochem Photobiol. 1991;54:215-223. https://doi.org/10.1111/j.1751-1097.1991.tb02009.x
- Pourzand C, Watkin RD, Brown JE, et al. Ultraviolet A radiation induces immediate release of iron in human primary skin fibroblasts: the role of ferritin. Proc Natl Acad Sci U S A. 1999;96:6751-6756. doi:10.1073/pnas.96.12.6751
- Applegate LA, Scaletta C, Panizzon R, et al. Evidence that ferritin is UV inducible in human skin: part of a putative defense mechanism. J Invest Dermatol. 1998;111:159-163. https://doi.org/10.1046/j.1523-1747.1998.00254.x
- Wesselius LJ, Nelson ME, Skikne BS. Increased release of ferritin and iron by iron-loaded alveolar macrophages in cigarette smokers. Am J Respir Crit Care Med. 1994;150:690-695. doi:10.1164/ajrccm.150.3.8087339
- De Domenico I, Ward DM, Kaplan J. Specific iron chelators determine the route of ferritin degradation. Blood. 2009;114:4546-4551. doi:10.1182/blood-2009-05-224188
- Knovich MA, Storey JA, Coffman LG, et al. Ferritin for the clinician. Blood Rev. 2009;23:95-104. doi:10.1016/j.blre.2008.08.001
- Dignass A, Farrag K, Stein J. Limitations of serum ferritin in diagnosing iron deficiency in inflammatory conditions. Int J Chronic Dis. 2018;2018:9394060. doi:10.1155/2018/9394060
- World Health Organization. WHO guideline on use of ferritin concentrations to assess iron status in individuals and populations. Published April 21, 2020. Accessed July 23, 2023. https://www.who.int/publications/i/item/9789240000124
- Finch CA, Bellotti V, Stray S, et al. Plasma ferritin determination as a diagnostic tool. West J Med. 1986;145:657-663.
- Guyatt GH, Oxman AD, Ali M, et al. Laboratory diagnosis of iron-deficiency anemia. J Gen Intern Med. 1992;7:145-153. doi:10.1007/BF02598003
- Punnonen K, Irjala K, Rajamäki A. Serum transferrin receptor and its ratio to serum ferritin in the diagnosis of iron deficiency. Blood. 1997;89:1052-1057. https://doi.org/10.1182/blood.V89.3.1052
- Zacharski LR, Ornstein DL, Woloshin S, et al. Association of age, sex, and race with body iron stores in adults: analysis of NHANES III data. American Heart Journal. 2000;140:98-104. https://doi.org/10.1067/mhj.2000.106646
- Milman N, Kirchhoff M. Iron stores in 1359, 30- to 60-year-old Danish women: evaluation by serum ferritin and hemoglobin. Ann Hematol. 1992;64:22-27. doi:10.1007/bf01811467
- Liu J-M, Hankinson SE, Stampfer MJ, et al. Body iron stores and their determinants in healthy postmenopausal US women. Am J Clin Nutr. 2003;78:1160-1167. doi:10.1093/ajcn/78.6.1160
- Kim C, Nan B, Kong S, et al. Changes in iron measures over menopause and associations with insulin resistance. J Womens Health (Larchmt). 2012;21:872-877. doi:10.1089/jwh.2012.3549
- Han LL, Wang YX, Li J, et al. Gender differences in associations of serum ferritin and diabetes, metabolic syndrome, and obesity in the China Health and Nutrition Survey. Mol Nutr Food Res. 2014;58:2189-2195. doi:10.1002/mnfr.201400088
- Pan Y, Jackson RT. Insights into the ethnic differences in serum ferritin between black and white US adult men. Am J Hum Biol. 2008;20:406-416. https://doi.org/10.1002/ajhb.20745
- Cullis JO, Fitzsimons EJ, Griffiths WJ, et al. Investigation and management of a raised serum ferritin. Br J Haematol. 2018;181:331-340. doi:10.1111/bjh.15166
- Moeinvaziri M, Mansoori P, Holakooee K, et al. Iron status in diffuse telogen hair loss among women. Acta Dermatovenerol Croat. 2009;17:279-284.
- Tamer F, Yuksel ME, Karabag Y. Serum ferritin and vitamin D levels should be evaluated in patients with diffuse hair loss prior to treatment. Postepy Dermatol Alergol. 2020;37:407-411. doi:10.5114/ada.2020.96251
- Olsen EA, Reed KB, Cacchio PB, et al. Iron deficiency in female pattern hair loss, chronic telogen effluvium, and control groups. J Am Acad Dermatol. 2010;63:991-999. doi:10.1016/j.jaad.2009.12.006
- Asghar F, Shamim N, Farooque U, et al. Telogen effluvium: a review of the literature. Cureus. 2020;12:E8320. doi:10.7759/cureus.8320
- Brough KR, Torgerson RR. Hormonal therapy in female pattern hair loss. Int J Womens Dermatol. 2017;3:53-57. doi:10.1016/j.ijwd.2017.01.001
- Klein EJ, Karim M, Li X, et al. Supplementation and hair growth: a retrospective chart review of patients with alopecia and laboratory abnormalities. JAAD Int. 2022;9:69-71. doi:10.1016/j.jdin.2022.08.013
- Goksin S. Retrospective evaluation of clinical profile and comorbidities in patients with alopecia areata. North Clin Istanb. 2022;9:451-458. doi:10.14744/nci.2022.78790
- Beatrix J, Piales C, Berland P, et al. Non-anemic iron deficiency: correlations between symptoms and iron status parameters. Eur J Clin Nutr. 2022;76:835-840. doi:10.1038/s41430-021-01047-5
- Treister-Goltzman Y, Yarza S, Peleg R. Iron deficiency and nonscarring alopecia in women: systematic review and meta-analysis. Skin Appendage Disord. 2022;8:83-92. doi:10.1159/000519952
- Santiago P. Ferrous versus ferric oral iron formulations for the treatment of iron deficiency: a clinical overview. ScientificWorldJournal. 2012;2012:846824. doi:10.1100/2012/846824
- Lo JO, Benson AE, Martens KL, et al. The role of oral iron in the treatment of adults with iron deficiency. Eur J Haematol. 2023;110:123-130. doi:10.1111/ejh.13892
- Lausevic´ M, Jovanovic´ N, Ignjatovic´ S, et al. Resorption and tolerance of the high doses of ferrous sulfate and ferrous gluconate in the patients on peritoneal dialysis. Vojnosanit Pregl. 2006;63:143-147. doi:10.2298/vsp0602143l
- Stoffel NU, Zeder C, Brittenham GM, et al. Iron absorption from supplements is greater with alternate day than with consecutive day dosing in iron-deficient anemic women. Haematologica. 2020;105:1232-1239. doi:10.3324/haematol.2019.220830
- Jimenez KM, Gasche C. Management of iron deficiency anaemia in inflammatory bowel disease. Acta Haematologica. 2019;142:30-36. doi:10.1159/000496728
- Shah AA, Donovan K, Seeley C, et al. Risk of infection associated with administration of intravenous iron: a systematic review and meta-analysis. JAMA Netw Open. 2021;4:E2133935-E2133935. doi:10.1001/jamanetworkopen.2021.33935
- Ganz T, Aronoff GR, Gaillard CAJM, et al. Iron administration, infection, and anemia management in ckd: untangling the effects of intravenous iron therapy on immunity and infection risk. Kidney Med. 2020/05/01/ 2020;2:341-353. doi: 10.1016/j.xkme.2020.01.006
- Lipschitz DA, Cook JD, Finch CA. A clinical evaluation of serum ferritin as an index of iron stores. N Engl J Med. 1974;290:1213-1216. doi:10.1056/nejm197405302902201
- Loveikyte R, Bourgonje AR, van der Reijden JJ, et al. Hepcidin and iron status in patients with inflammatory bowel disease undergoing induction therapy with vedolizumab or infliximab [published online February 7, 2023]. Inflamm Bowel Dis. doi:10.1093/ibd/izad010
- Borel MJ, Smith SM, Derr J, et al. Day-to-day variation in iron-status indices in healthy men and women. Am J Clin Nutr. 1991;54:729-735. doi:10.1093/ajcn/54.4.729
- Ford BA, Coyne DW, Eby CS, et al. Variability of ferritin measurements in chronic kidney disease; implications for iron management. Kidney International. 2009;75:104-110. doi:10.1038/ki.2008.526
- Walters GO, Miller FM, Worwood M. Serum ferritin concentration and iron stores in normal subjects. J Clin Pathol. 1973;26:770-772. doi:10.1136/jcp.26.10.770
- Lee MH, Means RT Jr. Extremely elevated serum ferritin levels in a university hospital: associated diseases and clinical significance. Am J Med. Jun 1995;98:566-571. doi:10.1016/s0002-9343(99)80015-1
- Theil EC. Ferritin: structure, gene regulation, and cellular function in animals, plants, and microorganisms. Annu Rev Biochem. 1987;56:289-315. doi:10.1146/annurev.bi.56.070187.001445
- Chen LY, Chang SD, Sreenivasan GM, et al. Dysmetabolic hyperferritinemia is associated with normal transferrin saturation, mild hepatic iron overload, and elevated hepcidin. Ann Hematol. 2011;90:139-143. doi:10.1007/s00277-010-1050-x
- Sampietro M, Fiorelli G, Fargion S. Iron overload in porphyria cutanea tarda. Haematologica. 1999;84:248-253.
- Singal AK. Porphyria cutanea tarda: recent update. Mol Genet Metab. 2019;128:271-281. doi:10.1016/j.ymgme.2019.01.004
- Frank J, Poblete-Gutiérrez P. Porphyria cutanea tarda—when skin meets liver. Best Pract Res Clin Gastroenterol. 2010;24:735-745. doi:10.1016/j.bpg.2010.07.002
- Mehta B, Efthimiou P. Ferritin in adult-onset Still’s disease: just a useful innocent bystander? Int J Inflam. 2012;2012:298405. doi:10.1155/2012/298405
- Ma AD, Fedoriw YD, Roehrs P. Hyperferritinemia and hemophagocytic lymphohistiocytosis. single institution experience in adult and pediatric patients. Blood. 2012;120:2135-2135. doi:10.1182/blood.V120.21.2135.2135
- Basu S, Maji B, Barman S, et al. Hyperferritinemia in hemophagocytic lymphohistiocytosis: a single institution experience in pediatric patients. Indian J Clin Biochem. 2018;33:108-112. doi:10.1007/s12291-017-0655-4
- Yamada K, Asai K, Okamoto A, et al. Correlation between disease activity and serum ferritin in clinically amyopathic dermatomyositis with rapidly-progressive interstitial lung disease: a case report. BMC Res Notes. 2018;11:34. doi:10.1186/s13104-018-3146-7
- Zohar DN, Seluk L, Yonath H, et al. Anti-MDA5 positive dermatomyositis associated with rapidly progressive interstitial lung disease and correlation between serum ferritin level and treatment response. Mediterr J Rheumatol. 2020;31:75-77. doi:10.31138/mjr.31.1.75
- Lin TF, Ferlic-Stark LL, Allen CE, et al. Rate of decline of ferritin in patients with hemophagocytic lymphohistiocytosis as a prognostic variable for mortality. Pediatr Blood Cancer. 2011;56:154-155. doi:10.1002/pbc.22774
- Bregy A, Trueb RM. No association between serum ferritin levels >10 microg/l and hair loss activity in women. Dermatology. 2008;217:1-6. doi:10.1159/000118505
- de Queiroz M, Vaske TM, Boza JC. Serum ferritin and vitamin D levels in women with non-scarring alopecia. J Cosmet Dermatol. 2022;21:2688-2690. doi:10.1111/jocd.14472
- El-Husseiny R, Alrgig NT, Abdel Fattah NSA. Epidemiological and biochemical factors (serum ferritin and vitamin D) associated with premature hair graying in Egyptian population. J Cosmet Dermatol. 2021;20:1860-1866. doi:10.1111/jocd.13747
- Enitan AO, Olasode OA, Onayemi EO, et al. Serum ferritin levels amongst individuals with androgenetic alopecia in Ile-Ife, Nigeria. West Afr J Med. 2022;39:1026-1031.
- I˙bis¸ S, Aksoy Sarac¸ G, Akdag˘ T. Evaluation of MCV/RDW ratio and correlations with ferritin in telogen effluvium patients. Dermatol Pract Concept. 2022;12:E2022151. doi:10.5826/dpc.1203a151
- Kakpovbia E, Ogbechie-Godec OA, Shapiro J, et al. Laboratory testing in telogen effluvium. J Drugs Dermatol. 2021;20:110-111. doi:10.36849/jdd.5771
- Rasheed H, Mahgoub D, Hegazy R, et al. Serum ferritin and vitamin D in female hair loss: do they play a role? Skin Pharmacol Physiol. 2013;26:101-107. doi:10.1159/000346698
Ferritin is an iron storage protein crucial to human iron homeostasis. Because serum ferritin levels are in dynamic equilibrium with the body’s iron stores, ferritin often is measured as a reflection of iron status; however, ferritin also is an acute-phase reactant whose levels may be nonspecifically elevated in a wide range of inflammatory conditions. The various processes that alter serum ferritin levels complicate the clinical interpretation of this laboratory value. In this article, we review the structure and function of ferritin and provide a guide for clinical use.
Overview of Iron
Iron is an essential element of key biologic functions including DNA synthesis and repair, oxygen transport, and oxidative phosphorylation. The body’s iron stores are mainly derived from internal iron recycling following red blood cell breakdown, while 5% to 10% is supplied by dietary intake.1-3 Iron metabolism is of particular importance in cells of the reticuloendothelial system (eg, spleen, liver, bone marrow), where excess iron must be appropriately sequestered and from which iron can be mobilized.4 Sufficient iron stores are necessary for proper cellular function and survival, as iron is a necessary component of hemoglobin for oxygen delivery, iron-sulfur clusters in electron transport, and enzyme cofactors in other cellular processes.
Although labile pools of biologically active free iron exist in limited amounts within cells, excess free iron can generate free radicals that damage cellular proteins, lipids, and nucleic acids.5-7 As such, most intracellular iron is captured within ferritin molecules. The excretion of iron is unregulated and occurs through loss in sweat, menstruation, hair shedding, skin desquamation, and enterocyte turnover.8 The lack of regulated excretion highlights the need for a tightly regulated system of uptake, transportation, storage, and sequestration to maintain iron homeostasis.
Overview of Ferritin Structure and Function
Ferritin is a key regulator of iron homeostasis that also serves as an important clinical indicator of body iron status. Ferritin mainly is found as an intracellular cytosolic iron storage and detoxification protein structured as a hollow 24-subunit polymer shell that can sequester up to 4500 atoms of iron within its core.9,10 The 24-mer is composed of both ferritin L (FTL) and ferritin H (FTH) subunits, with dynamic regulation of the H:L ratio dependent on the context and tissue in which ferritin is found.6
Ferritin H possesses ferroxidase, which facilitates oxidation of ferrous (Fe2+) iron into ferric (Fe3+) iron, which can then be incorporated into the mineral core of the ferritin heteropolymer.11 Ferritin L is more abundant in the spleen and liver, while FTH is found predominantly in the heart and kidneys where the increased ferroxidase activity may confer an increased ability to oxidize Fe2+ and limit oxidative stress.6
Regulation of Ferritin Synthesis and Secretion
Ferritin synthesis is regulated by intracellular nonheme iron levels, governed mainly by an iron response element (IRE) and iron response protein (IRP) translational repression system. Both FTH and FTL messenger RNA (mRNA) contain an IRE that is a regulatory stem-loop structure in the 5´ untranslated region. When the IRE is bound by IRP1 or IRP2, mRNA translation of ferritin subunits is suppressed.6 In low iron conditions, IRPs have greater affinity for IRE, and binding suppresses ferritin translation.12 In high iron conditions, IRPs have a decreased affinity for IRE, and ferritin mRNA synthesis is increased.13 Additionally, inflammatory cytokines such as tumor necrosis factor α and IL-1α transcriptionally induce FTH synthesis, resulting in an increased population of H-rich ferritins.11,14-16 A study using cultured human primary skin fibroblasts demonstrated UV radiation–induced increases in free intracellular iron content.17,18 Pourzand et al18 suggested that UV-mediated damage of lysosomal membranes results in leakage of lysosomal proteases into the cytosol, contributing to degradation of intracellular ferritin and subsequent release of iron within skin fibroblasts. The increased intracellular iron downregulates IRPs and increases ferritin mRNA synthesis,18 consistent with prior findings of increased ferritin synthesis in skin that is induced by UV radiation.19
Molecular analysis of serum ferritin in iron-overloaded mice revealed that extracellular ferritin found in the serum is composed of a greater fraction of FTL and has lower iron content than intracellular ferritin. The low iron content of serum ferritin compared with intracellular ferritin and transferrin suggests that serum ferritin is not a major pathway of systemic iron transport.10 However, locally secreted ferritins may play a greater role in iron transport and release in selected tissues. Additionally, in vitro studies of cell cultures from humans and mice have demonstrated the ability of macrophages to secrete ferritin, suggesting that macrophages are an important cellular source of serum ferritin.10,20 As such, serum ferritin generally may reflect body iron status but more specifically reflects macrophage iron status.10 Although the exact pathways of ferritin release are unknown, it is hypothesized that ferritin secretion occurs through cytosolic autophagy followed by secretion of proteins from the lysosomal compartment.10,18,21
Clinical Utility of Serum Ferritin
Low Ferritin and Iron Deficiency—Although bone marrow biopsy with iron staining remains the gold standard for diagnosis of iron deficiency, serum ferritin is a much more accessible and less invasive tool for evaluation of iron status. A serum ferritin level below 12 μg/L is highly specific for iron depletion,22 with a higher cutoff recommended in clinical practice to improve diagnostic sensitivity.23,24 Conditions independent of iron deficiency that may reduce serum ferritin include hypothyroidism and ascorbate deficiency, though neither condition has been reported to interfere with appropriate diagnosis of iron deficiency.25 Guyatt et al26 conducted a systematic review of laboratory tests used in the diagnosis of iron deficiency anemia and identified 55 studies suitable for inclusion. Based on an area under the receiver operating characteristic curve (AUROC) of 0.95, serum ferritin values were superior to transferrin saturation (AUROC, 0.74), red cell protoporphyrin (AUROC, 0.77), red cell volume distribution width (AUROC, 0.62), and mean cell volume (AUROC, 0.76) for diagnosis of IDA, verified by histologic examination of aspirated bone marrow.26 The likelihood ratio of iron deficiency begins to decrease for serum ferritin values of 40 μg/L or greater. For patients with inflammatory conditions—patients with concomitant chronic renal failure, inflammatory disease, infection, rheumatoid arthritis, liver disease, inflammatory bowel disease, and malignancy—the likelihood of iron deficiency begins to decrease at serum ferritin levels of 70 μg/L or greater.26 Similarly, the World Health Organization recommends that in adults with infection or inflammation, serum ferritin levels lower than 70 μg/L may be used to indicate iron deficiency.24 A serum ferritin level of 41 μg/L or lower was found to have a sensitivity and specificity of 98% for discriminating between iron-deficiency anemia and anemia of chronic disease (diagnosed based on bone marrow biopsy with iron staining), with an AUROC of 0.98.27 As such, we recommend using a serum ferritin level of 40 μg/L or lower in patients who are otherwise healthy as an indicator of iron deficiency.
The threshold for iron supplementation may vary based on age, sex, and race. In women, ferritin levels increase during menopause and peak after menopause; ferritin levels are higher in men than in women.28-30 A multisite longitudinal cohort study of 70 women in the United States found that the mean (SD) ferritin valuewas 69.5 (81.7) μg/L premenopause and 128.8 (125.7) μg/L postmenopause (P<.01).31 A separate longitudinal survey study of 8564 patients in China found that the mean (SE) ferritin value was 201.55 (3.60) μg/L for men and 80.46 (1.64) μg/L for women (P<.0001).32 Analysis of serum ferritin levels of 3554 male patients from the third National Health and Nutrition Examination Survey demonstrated that patients who self-reported as non-Hispanic Black (n=1616) had significantly higher serum ferritin levels than non-Hispanic White patients (n=1938)(serum ferritin difference of 37.1 μg/L)(P<.0001).33 The British Society for Haematology guidelines recommend that the threshold of serum ferritin for diagnosing iron deficiency should take into account age-, sex-, and race-based differences.34 Ferritin and Hair—Cutaneous manifestations of iron deficiency include koilonychia, glossitis, pruritus, angular cheilitis, and telogen effluvium (TE).1 A case-control study of 30 females aged 15 to 45 years demonstrated that the mean (SD) ferritin level was significantly lower in patients with TE than those with no hair loss (16.3 [12.6] ng/mL vs 60.3 [50.1] ng/mL; P<.0001). Using a threshold of 30 μg/L or lower, the investigators found that the odds ratio for TE was 21.0 (95% CI, 4.2-105.0) in patients with low serum ferritin.35
Another retrospective review of 54 patients with diffuse hair loss and 55 controls compared serum vitamin B12, folate, thyroid-stimulating hormone, zinc, ferritin, and 25-hydroxy vitamin D levels between the 2 groups.36 Exclusion criteria were clinical diagnoses of female pattern hair loss (androgenetic alopecia), pregnancy, menopause, metabolic and endocrine disorders, hormone replacement therapy, chemotherapy, immunosuppressive therapy, vitamin and mineral supplementation, scarring alopecia, eating disorders, and restrictive diets. Compared with controls, patients with diffuse nonscarring hair loss were found to have significantly lower ferritin (mean [SD], 14.72 [10.70] ng/mL vs 25.30 [14.41] ng/mL; P<.001) and 25-hydroxy vitamin D levels (mean [SD], 14.03 [8.09] ng/mL vs 17.01 [8.59] ng/mL; P=.01).36
In contrast, a separate case-control study of 381 cases and 76 controls found no increase in the rate of iron deficiency—defined as ferritin ≤15 μg/L or ≤40 μg/L—among women with female pattern hair loss or chronic TE vs controls.37 Taken together, these studies suggest that iron status may play a role in TE, a process that may result from nutritional deficiency, trauma, or physical or psychological stress38; however, there is insufficient evidence to suggest that low iron status impacts androgenetic alopecia, in which its multifactorial pathogenesis implicates genetic and hormonal factors.39 More research is needed to clarify the potential associations between iron deficiency and types of hair loss. Additionally, it is unclear whether iron supplementation improves hair growth parameters such as density and caliber.40
Low serum ferritin (<40 μg/L) with concurrent symptoms of iron deficiency, including fatigue, pallor, dyspnea on exertion, or hair loss, should prompt treatment with supplemental iron.41-43 Generally, ferrous (Fe2+) salts are preferred to ferric (Fe3+) salts, as the former is more readily absorbed through the duodenal mucosa44 and is the more common formulation in commercially available supplements in the United States.45 Oral supplementation with ferrous sulfate 325 mg (65 mg elemental iron) tablets is the first-line therapy for iron deficiency anemia.1 Alternatively, ferrous gluconate 324 mg (38 mg elemental iron) over-the-counter and its liquid form has demonstrated superior absorption compared to ferrous sulfate tablets in a clinical study with peritoneal dialysis patients.1,46 One study suggested that oral iron 40 to 80 mg should be taken every other day to increase absorption.47 Due to improved bioavailability, intravenous iron may be utilized in patients with malabsorption, renal failure, or intolerance to oral iron (including those with gastric ulcers or active inflammatory bowel disease), with the formulation chosen based on underlying comorbidities and potential risks.1,48 The theoretical risk for potentiating bacterial growth by increasing the amount of unbound iron in the blood raises concerns of iron supplementation in patients with infection or sepsis. Although far from definitive, existing data suggest that risk for infection is greater with intravenous iron supplementation and should be carefully considered prior to use.49,50Elevated Ferritin—Elevated ferritin may be difficult to interpret given the multitude of conditions that can cause it.23,51,52 Elevated serum ferritin can be broadly characterized by increased synthesis due to iron overload, increased synthesis due to inflammation, or increased ferritin release from cellular damage.34 Further complicating interpretation is the potential diurnal fluctuations in serum iron levels dependent on dietary intake and timing of laboratory evaluation, choice of assay, differences in reference standards, and variations in calibration procedures that can lead to analytic variability in the measurement of ferritin.23,53,54
Among healthy patients, serum ferritin is directly proportional to iron status.9,51 A study utilizing weekly phlebotomy of 22 healthy participants to measure serum ferritin and calculate mobilizable storage iron found a strong positive correlation between the 2 variables (r=0.83, P<.001), with each 1-μg/L increase of serum ferritin corresponding to approximately an 8-mg increase of storage iron; the initial serum ferritin values ranged from 2 to 83 μg/L in females and 36 to 224 μg/L in males.55 The correlation of ferritin with iron status also was supported by the significant correlation between the number of transfusions received in patients with transfusion-related iron overload and serum ferritin levels (r=0.89, P<.001), with an average increase of 60 μg/L per transfusion.51
Clinical guidelines on the interpretation of serum ferritin levels by Cullis et al34 recommend a normal upper limit of 200 μg/L for healthy females and 300 μg/L for healthy males. Outside of clinical syndromes associated with iron overload, Lee and Means56 found that serum ferritin of 1000 μg/L or higher was a nonspecific marker of disease, including infection and/or neoplastic disorders. We have adapted these guidelines to propose a workflow for evaluation of serum ferritin levels (Figure). In patients with inflammatory conditions or those affected by metabolic syndrome, elevated serum ferritin does not correlate with body iron status.57,58 It is believed that inflammatory cytokines, including tumor necrosis factor α and IL-1α, can upregulate ferritin synthesis independent of cellular iron stores.15,16 Several studies have examined the relationship between insulin resistance and/or metabolic syndrome with serum ferritin levels.31,32 Han et al32 found that elevated serum ferritin was significantly associated with higher risk for metabolic syndrome in men (P<.0001) but not in women.
Although cutaneous manifestations of iron overload can be seen as skin hyperpigmentation due to increased iron deposits and increased melanin production,22 the effects of elevated ferritin on the skin and hair are not well known. Iron overload is a known trigger of porphyria cutanea tarda (PCT),59 a condition in which reduced or absent enzymatic activity of uroporphyrinogen decarboxylase (UROD) leads to build up of toxic porphyrins in various organs.60 In the skin, PCT manifests as a blistering photosensitive eruption that may resolve as dyspigmentation, scarring, and milia.61 Phlebotomy is first-line therapy in PCT to reduce serum iron and subsequent formation of UROD inhibitors, with guidelines suggesting discontinuation of phlebotomy when serum ferritin levels reach 20 ng/mL or lower.60 Hyperferritinemia (serum ferritin >500 μg/L) is a common finding in several inflammatory disorders often accompanied by clinically apparent cutaneous symptoms such as adult-onset Still disease,62 hemophagocytic lymphohistiocytosis,63,64 and anti-melanoma differentiation-associated gene 5 dermatomyositis.65 Among these conditions, serum ferritin levels have been reported to correlate with disease activity, raising the question of whether ferritin is a bystander or a driver of the underlying pathology.62,66,67 However, rapid decline of serum ferritin levels with treatment and control of inflammatory cytokines suggest that ferritin is unlikely to contribute to pathology.62,67
Final Thoughts
Many clinical studies have examined the association between hair health and body iron status, the collective findings of which suggest that iron deficiency may be associated with TE. Among commonly measured serum iron parameters, low ferritin is a highly specific and sensitive marker for diagnosing iron deficiency. Serum ferritin may be a clinically useful tool for ruling out underlying iron deficiency in patients presenting with hair loss. Despite advances in our understanding of the molecular mechanisms of ferritin synthesis and regulation, whether ferritin itself contributes to cutaneous pathology is poorly understood.35,36,68-74 For patients who are otherwise healthy with low suspicion for inflammatory disorders, chronic systemic illnesses, or malignancy, serum ferritin can be used as an indicator of body iron status. The workup for slightly elevated serum ferritin should be interpreted in the context of other laboratory findings and should be reassessed over time. Serum ferritin levels above 1000 μg/L warrant further investigation into causes such as iron overload conditions and underlying inflammatory conditions or malignancy.
Ferritin is an iron storage protein crucial to human iron homeostasis. Because serum ferritin levels are in dynamic equilibrium with the body’s iron stores, ferritin often is measured as a reflection of iron status; however, ferritin also is an acute-phase reactant whose levels may be nonspecifically elevated in a wide range of inflammatory conditions. The various processes that alter serum ferritin levels complicate the clinical interpretation of this laboratory value. In this article, we review the structure and function of ferritin and provide a guide for clinical use.
Overview of Iron
Iron is an essential element of key biologic functions including DNA synthesis and repair, oxygen transport, and oxidative phosphorylation. The body’s iron stores are mainly derived from internal iron recycling following red blood cell breakdown, while 5% to 10% is supplied by dietary intake.1-3 Iron metabolism is of particular importance in cells of the reticuloendothelial system (eg, spleen, liver, bone marrow), where excess iron must be appropriately sequestered and from which iron can be mobilized.4 Sufficient iron stores are necessary for proper cellular function and survival, as iron is a necessary component of hemoglobin for oxygen delivery, iron-sulfur clusters in electron transport, and enzyme cofactors in other cellular processes.
Although labile pools of biologically active free iron exist in limited amounts within cells, excess free iron can generate free radicals that damage cellular proteins, lipids, and nucleic acids.5-7 As such, most intracellular iron is captured within ferritin molecules. The excretion of iron is unregulated and occurs through loss in sweat, menstruation, hair shedding, skin desquamation, and enterocyte turnover.8 The lack of regulated excretion highlights the need for a tightly regulated system of uptake, transportation, storage, and sequestration to maintain iron homeostasis.
Overview of Ferritin Structure and Function
Ferritin is a key regulator of iron homeostasis that also serves as an important clinical indicator of body iron status. Ferritin mainly is found as an intracellular cytosolic iron storage and detoxification protein structured as a hollow 24-subunit polymer shell that can sequester up to 4500 atoms of iron within its core.9,10 The 24-mer is composed of both ferritin L (FTL) and ferritin H (FTH) subunits, with dynamic regulation of the H:L ratio dependent on the context and tissue in which ferritin is found.6
Ferritin H possesses ferroxidase, which facilitates oxidation of ferrous (Fe2+) iron into ferric (Fe3+) iron, which can then be incorporated into the mineral core of the ferritin heteropolymer.11 Ferritin L is more abundant in the spleen and liver, while FTH is found predominantly in the heart and kidneys where the increased ferroxidase activity may confer an increased ability to oxidize Fe2+ and limit oxidative stress.6
Regulation of Ferritin Synthesis and Secretion
Ferritin synthesis is regulated by intracellular nonheme iron levels, governed mainly by an iron response element (IRE) and iron response protein (IRP) translational repression system. Both FTH and FTL messenger RNA (mRNA) contain an IRE that is a regulatory stem-loop structure in the 5´ untranslated region. When the IRE is bound by IRP1 or IRP2, mRNA translation of ferritin subunits is suppressed.6 In low iron conditions, IRPs have greater affinity for IRE, and binding suppresses ferritin translation.12 In high iron conditions, IRPs have a decreased affinity for IRE, and ferritin mRNA synthesis is increased.13 Additionally, inflammatory cytokines such as tumor necrosis factor α and IL-1α transcriptionally induce FTH synthesis, resulting in an increased population of H-rich ferritins.11,14-16 A study using cultured human primary skin fibroblasts demonstrated UV radiation–induced increases in free intracellular iron content.17,18 Pourzand et al18 suggested that UV-mediated damage of lysosomal membranes results in leakage of lysosomal proteases into the cytosol, contributing to degradation of intracellular ferritin and subsequent release of iron within skin fibroblasts. The increased intracellular iron downregulates IRPs and increases ferritin mRNA synthesis,18 consistent with prior findings of increased ferritin synthesis in skin that is induced by UV radiation.19
Molecular analysis of serum ferritin in iron-overloaded mice revealed that extracellular ferritin found in the serum is composed of a greater fraction of FTL and has lower iron content than intracellular ferritin. The low iron content of serum ferritin compared with intracellular ferritin and transferrin suggests that serum ferritin is not a major pathway of systemic iron transport.10 However, locally secreted ferritins may play a greater role in iron transport and release in selected tissues. Additionally, in vitro studies of cell cultures from humans and mice have demonstrated the ability of macrophages to secrete ferritin, suggesting that macrophages are an important cellular source of serum ferritin.10,20 As such, serum ferritin generally may reflect body iron status but more specifically reflects macrophage iron status.10 Although the exact pathways of ferritin release are unknown, it is hypothesized that ferritin secretion occurs through cytosolic autophagy followed by secretion of proteins from the lysosomal compartment.10,18,21
Clinical Utility of Serum Ferritin
Low Ferritin and Iron Deficiency—Although bone marrow biopsy with iron staining remains the gold standard for diagnosis of iron deficiency, serum ferritin is a much more accessible and less invasive tool for evaluation of iron status. A serum ferritin level below 12 μg/L is highly specific for iron depletion,22 with a higher cutoff recommended in clinical practice to improve diagnostic sensitivity.23,24 Conditions independent of iron deficiency that may reduce serum ferritin include hypothyroidism and ascorbate deficiency, though neither condition has been reported to interfere with appropriate diagnosis of iron deficiency.25 Guyatt et al26 conducted a systematic review of laboratory tests used in the diagnosis of iron deficiency anemia and identified 55 studies suitable for inclusion. Based on an area under the receiver operating characteristic curve (AUROC) of 0.95, serum ferritin values were superior to transferrin saturation (AUROC, 0.74), red cell protoporphyrin (AUROC, 0.77), red cell volume distribution width (AUROC, 0.62), and mean cell volume (AUROC, 0.76) for diagnosis of IDA, verified by histologic examination of aspirated bone marrow.26 The likelihood ratio of iron deficiency begins to decrease for serum ferritin values of 40 μg/L or greater. For patients with inflammatory conditions—patients with concomitant chronic renal failure, inflammatory disease, infection, rheumatoid arthritis, liver disease, inflammatory bowel disease, and malignancy—the likelihood of iron deficiency begins to decrease at serum ferritin levels of 70 μg/L or greater.26 Similarly, the World Health Organization recommends that in adults with infection or inflammation, serum ferritin levels lower than 70 μg/L may be used to indicate iron deficiency.24 A serum ferritin level of 41 μg/L or lower was found to have a sensitivity and specificity of 98% for discriminating between iron-deficiency anemia and anemia of chronic disease (diagnosed based on bone marrow biopsy with iron staining), with an AUROC of 0.98.27 As such, we recommend using a serum ferritin level of 40 μg/L or lower in patients who are otherwise healthy as an indicator of iron deficiency.
The threshold for iron supplementation may vary based on age, sex, and race. In women, ferritin levels increase during menopause and peak after menopause; ferritin levels are higher in men than in women.28-30 A multisite longitudinal cohort study of 70 women in the United States found that the mean (SD) ferritin valuewas 69.5 (81.7) μg/L premenopause and 128.8 (125.7) μg/L postmenopause (P<.01).31 A separate longitudinal survey study of 8564 patients in China found that the mean (SE) ferritin value was 201.55 (3.60) μg/L for men and 80.46 (1.64) μg/L for women (P<.0001).32 Analysis of serum ferritin levels of 3554 male patients from the third National Health and Nutrition Examination Survey demonstrated that patients who self-reported as non-Hispanic Black (n=1616) had significantly higher serum ferritin levels than non-Hispanic White patients (n=1938)(serum ferritin difference of 37.1 μg/L)(P<.0001).33 The British Society for Haematology guidelines recommend that the threshold of serum ferritin for diagnosing iron deficiency should take into account age-, sex-, and race-based differences.34 Ferritin and Hair—Cutaneous manifestations of iron deficiency include koilonychia, glossitis, pruritus, angular cheilitis, and telogen effluvium (TE).1 A case-control study of 30 females aged 15 to 45 years demonstrated that the mean (SD) ferritin level was significantly lower in patients with TE than those with no hair loss (16.3 [12.6] ng/mL vs 60.3 [50.1] ng/mL; P<.0001). Using a threshold of 30 μg/L or lower, the investigators found that the odds ratio for TE was 21.0 (95% CI, 4.2-105.0) in patients with low serum ferritin.35
Another retrospective review of 54 patients with diffuse hair loss and 55 controls compared serum vitamin B12, folate, thyroid-stimulating hormone, zinc, ferritin, and 25-hydroxy vitamin D levels between the 2 groups.36 Exclusion criteria were clinical diagnoses of female pattern hair loss (androgenetic alopecia), pregnancy, menopause, metabolic and endocrine disorders, hormone replacement therapy, chemotherapy, immunosuppressive therapy, vitamin and mineral supplementation, scarring alopecia, eating disorders, and restrictive diets. Compared with controls, patients with diffuse nonscarring hair loss were found to have significantly lower ferritin (mean [SD], 14.72 [10.70] ng/mL vs 25.30 [14.41] ng/mL; P<.001) and 25-hydroxy vitamin D levels (mean [SD], 14.03 [8.09] ng/mL vs 17.01 [8.59] ng/mL; P=.01).36
In contrast, a separate case-control study of 381 cases and 76 controls found no increase in the rate of iron deficiency—defined as ferritin ≤15 μg/L or ≤40 μg/L—among women with female pattern hair loss or chronic TE vs controls.37 Taken together, these studies suggest that iron status may play a role in TE, a process that may result from nutritional deficiency, trauma, or physical or psychological stress38; however, there is insufficient evidence to suggest that low iron status impacts androgenetic alopecia, in which its multifactorial pathogenesis implicates genetic and hormonal factors.39 More research is needed to clarify the potential associations between iron deficiency and types of hair loss. Additionally, it is unclear whether iron supplementation improves hair growth parameters such as density and caliber.40
Low serum ferritin (<40 μg/L) with concurrent symptoms of iron deficiency, including fatigue, pallor, dyspnea on exertion, or hair loss, should prompt treatment with supplemental iron.41-43 Generally, ferrous (Fe2+) salts are preferred to ferric (Fe3+) salts, as the former is more readily absorbed through the duodenal mucosa44 and is the more common formulation in commercially available supplements in the United States.45 Oral supplementation with ferrous sulfate 325 mg (65 mg elemental iron) tablets is the first-line therapy for iron deficiency anemia.1 Alternatively, ferrous gluconate 324 mg (38 mg elemental iron) over-the-counter and its liquid form has demonstrated superior absorption compared to ferrous sulfate tablets in a clinical study with peritoneal dialysis patients.1,46 One study suggested that oral iron 40 to 80 mg should be taken every other day to increase absorption.47 Due to improved bioavailability, intravenous iron may be utilized in patients with malabsorption, renal failure, or intolerance to oral iron (including those with gastric ulcers or active inflammatory bowel disease), with the formulation chosen based on underlying comorbidities and potential risks.1,48 The theoretical risk for potentiating bacterial growth by increasing the amount of unbound iron in the blood raises concerns of iron supplementation in patients with infection or sepsis. Although far from definitive, existing data suggest that risk for infection is greater with intravenous iron supplementation and should be carefully considered prior to use.49,50Elevated Ferritin—Elevated ferritin may be difficult to interpret given the multitude of conditions that can cause it.23,51,52 Elevated serum ferritin can be broadly characterized by increased synthesis due to iron overload, increased synthesis due to inflammation, or increased ferritin release from cellular damage.34 Further complicating interpretation is the potential diurnal fluctuations in serum iron levels dependent on dietary intake and timing of laboratory evaluation, choice of assay, differences in reference standards, and variations in calibration procedures that can lead to analytic variability in the measurement of ferritin.23,53,54
Among healthy patients, serum ferritin is directly proportional to iron status.9,51 A study utilizing weekly phlebotomy of 22 healthy participants to measure serum ferritin and calculate mobilizable storage iron found a strong positive correlation between the 2 variables (r=0.83, P<.001), with each 1-μg/L increase of serum ferritin corresponding to approximately an 8-mg increase of storage iron; the initial serum ferritin values ranged from 2 to 83 μg/L in females and 36 to 224 μg/L in males.55 The correlation of ferritin with iron status also was supported by the significant correlation between the number of transfusions received in patients with transfusion-related iron overload and serum ferritin levels (r=0.89, P<.001), with an average increase of 60 μg/L per transfusion.51
Clinical guidelines on the interpretation of serum ferritin levels by Cullis et al34 recommend a normal upper limit of 200 μg/L for healthy females and 300 μg/L for healthy males. Outside of clinical syndromes associated with iron overload, Lee and Means56 found that serum ferritin of 1000 μg/L or higher was a nonspecific marker of disease, including infection and/or neoplastic disorders. We have adapted these guidelines to propose a workflow for evaluation of serum ferritin levels (Figure). In patients with inflammatory conditions or those affected by metabolic syndrome, elevated serum ferritin does not correlate with body iron status.57,58 It is believed that inflammatory cytokines, including tumor necrosis factor α and IL-1α, can upregulate ferritin synthesis independent of cellular iron stores.15,16 Several studies have examined the relationship between insulin resistance and/or metabolic syndrome with serum ferritin levels.31,32 Han et al32 found that elevated serum ferritin was significantly associated with higher risk for metabolic syndrome in men (P<.0001) but not in women.
Although cutaneous manifestations of iron overload can be seen as skin hyperpigmentation due to increased iron deposits and increased melanin production,22 the effects of elevated ferritin on the skin and hair are not well known. Iron overload is a known trigger of porphyria cutanea tarda (PCT),59 a condition in which reduced or absent enzymatic activity of uroporphyrinogen decarboxylase (UROD) leads to build up of toxic porphyrins in various organs.60 In the skin, PCT manifests as a blistering photosensitive eruption that may resolve as dyspigmentation, scarring, and milia.61 Phlebotomy is first-line therapy in PCT to reduce serum iron and subsequent formation of UROD inhibitors, with guidelines suggesting discontinuation of phlebotomy when serum ferritin levels reach 20 ng/mL or lower.60 Hyperferritinemia (serum ferritin >500 μg/L) is a common finding in several inflammatory disorders often accompanied by clinically apparent cutaneous symptoms such as adult-onset Still disease,62 hemophagocytic lymphohistiocytosis,63,64 and anti-melanoma differentiation-associated gene 5 dermatomyositis.65 Among these conditions, serum ferritin levels have been reported to correlate with disease activity, raising the question of whether ferritin is a bystander or a driver of the underlying pathology.62,66,67 However, rapid decline of serum ferritin levels with treatment and control of inflammatory cytokines suggest that ferritin is unlikely to contribute to pathology.62,67
Final Thoughts
Many clinical studies have examined the association between hair health and body iron status, the collective findings of which suggest that iron deficiency may be associated with TE. Among commonly measured serum iron parameters, low ferritin is a highly specific and sensitive marker for diagnosing iron deficiency. Serum ferritin may be a clinically useful tool for ruling out underlying iron deficiency in patients presenting with hair loss. Despite advances in our understanding of the molecular mechanisms of ferritin synthesis and regulation, whether ferritin itself contributes to cutaneous pathology is poorly understood.35,36,68-74 For patients who are otherwise healthy with low suspicion for inflammatory disorders, chronic systemic illnesses, or malignancy, serum ferritin can be used as an indicator of body iron status. The workup for slightly elevated serum ferritin should be interpreted in the context of other laboratory findings and should be reassessed over time. Serum ferritin levels above 1000 μg/L warrant further investigation into causes such as iron overload conditions and underlying inflammatory conditions or malignancy.
- Hoffman M, Micheletti RG, Shields BE. Nutritional dermatoses in the hospitalized patient. Cutis. 2020;105:296, 302-308, E1-E5.
- Ganz T. Macrophages and systemic iron homeostasis. J Innate Immun. 2012;4:446-453. doi:10.1159/000336423
- Slusarczyk P, Mandal PK, Zurawska G, et al. Impaired iron recycling from erythrocytes is an early hallmark of aging. eLife. 2023;12:E79196. doi:10.7554/eLife.79196
- Crichton RR. Ferritin: structure, synthesis and function. N Engl J Med. 1971;284:1413-1422. doi:10.1056/nejm197106242842506
- Sandnes M, Ulvik RJ, Vorland M, et al. Hyperferritinemia—a clinical overview. J Clin Med. 2021;10:2008. doi:10.3390/jcm10092008
- Kernan KF, Carcillo JA. Hyperferritinemia and inflammation. Int Immunol. 2017;29:401-409. doi:10.1093/intimm/dxx031
- Wright JA, Richards T, Srai SKS. The role of iron in the skin and cutaneous wound healing. review. Front Pharmacol. 2014;5:156. doi:10.3389/fphar.2014.00156
- Ems T, St Lucia K, Huecker MR. Biochemistry, iron absorption. StatPearls Publishing; 2022.
- Crichton RR. Ferritin: structure, synthesis and function. N Engl J Med. 1971;284:1413-1422. doi:10.1056/nejm197106242842506
- Cohen LA, Gutierrez L, Weiss A, et al. Serum ferritin is derived primarily from macrophages through a nonclassical secretory pathway. Blood. 2010;116:1574-1584. doi:10.1182/blood-2009-11-253815
- Briat JF, Ravet K, Arnaud N, et al. New insights into ferritin synthesis and function highlight a link between iron homeostasis and oxidative stress in plants. Ann Bot. 2010;105:811-822. doi:10.1093/aob/mcp128
- Kato J, Kobune M, Ohkubo S, et al. Iron/IRP-1-dependent regulation of mRNA expression for transferrin receptor, DMT1 and ferritin during human erythroid differentiation. Exp Hematol. 2007;35:879-887. doi:10.1016/j.exphem.2007.03.005
- Gozzelino R, Soares MP. Coupling heme and iron metabolism via ferritin H chain. Antioxid Redox Signal. 2014;20:1754-1769. doi:10.1089/ars.2013.5666
- Torti FM, Torti SV. Regulation of ferritin genes and protein. Blood. 2002;99:3505-3516. doi:10.1182/blood.V99.10.3505
- Torti SV, Kwak EL, Miller SC, et al. The molecular cloning and characterization of murine ferritin heavy chain, a tumor necrosis factor-inducible gene. J Biol Chem. 1988;263:12638-12644.
- Wei Y, Miller SC, Tsuji Y, et al. Interleukin 1 induces ferritin heavy chain in human muscle cells. Biochem Biophys Res Commun. 1990;169:289-296. doi:10.1016/0006-291x(90)91466-6
- Bissett DL, Chatterjee R, Hannon DP. Chronic ultraviolet radiation–induced increase in skin iron and the photoprotective effect of topically applied iron chelators. Photochem Photobiol. 1991;54:215-223. https://doi.org/10.1111/j.1751-1097.1991.tb02009.x
- Pourzand C, Watkin RD, Brown JE, et al. Ultraviolet A radiation induces immediate release of iron in human primary skin fibroblasts: the role of ferritin. Proc Natl Acad Sci U S A. 1999;96:6751-6756. doi:10.1073/pnas.96.12.6751
- Applegate LA, Scaletta C, Panizzon R, et al. Evidence that ferritin is UV inducible in human skin: part of a putative defense mechanism. J Invest Dermatol. 1998;111:159-163. https://doi.org/10.1046/j.1523-1747.1998.00254.x
- Wesselius LJ, Nelson ME, Skikne BS. Increased release of ferritin and iron by iron-loaded alveolar macrophages in cigarette smokers. Am J Respir Crit Care Med. 1994;150:690-695. doi:10.1164/ajrccm.150.3.8087339
- De Domenico I, Ward DM, Kaplan J. Specific iron chelators determine the route of ferritin degradation. Blood. 2009;114:4546-4551. doi:10.1182/blood-2009-05-224188
- Knovich MA, Storey JA, Coffman LG, et al. Ferritin for the clinician. Blood Rev. 2009;23:95-104. doi:10.1016/j.blre.2008.08.001
- Dignass A, Farrag K, Stein J. Limitations of serum ferritin in diagnosing iron deficiency in inflammatory conditions. Int J Chronic Dis. 2018;2018:9394060. doi:10.1155/2018/9394060
- World Health Organization. WHO guideline on use of ferritin concentrations to assess iron status in individuals and populations. Published April 21, 2020. Accessed July 23, 2023. https://www.who.int/publications/i/item/9789240000124
- Finch CA, Bellotti V, Stray S, et al. Plasma ferritin determination as a diagnostic tool. West J Med. 1986;145:657-663.
- Guyatt GH, Oxman AD, Ali M, et al. Laboratory diagnosis of iron-deficiency anemia. J Gen Intern Med. 1992;7:145-153. doi:10.1007/BF02598003
- Punnonen K, Irjala K, Rajamäki A. Serum transferrin receptor and its ratio to serum ferritin in the diagnosis of iron deficiency. Blood. 1997;89:1052-1057. https://doi.org/10.1182/blood.V89.3.1052
- Zacharski LR, Ornstein DL, Woloshin S, et al. Association of age, sex, and race with body iron stores in adults: analysis of NHANES III data. American Heart Journal. 2000;140:98-104. https://doi.org/10.1067/mhj.2000.106646
- Milman N, Kirchhoff M. Iron stores in 1359, 30- to 60-year-old Danish women: evaluation by serum ferritin and hemoglobin. Ann Hematol. 1992;64:22-27. doi:10.1007/bf01811467
- Liu J-M, Hankinson SE, Stampfer MJ, et al. Body iron stores and their determinants in healthy postmenopausal US women. Am J Clin Nutr. 2003;78:1160-1167. doi:10.1093/ajcn/78.6.1160
- Kim C, Nan B, Kong S, et al. Changes in iron measures over menopause and associations with insulin resistance. J Womens Health (Larchmt). 2012;21:872-877. doi:10.1089/jwh.2012.3549
- Han LL, Wang YX, Li J, et al. Gender differences in associations of serum ferritin and diabetes, metabolic syndrome, and obesity in the China Health and Nutrition Survey. Mol Nutr Food Res. 2014;58:2189-2195. doi:10.1002/mnfr.201400088
- Pan Y, Jackson RT. Insights into the ethnic differences in serum ferritin between black and white US adult men. Am J Hum Biol. 2008;20:406-416. https://doi.org/10.1002/ajhb.20745
- Cullis JO, Fitzsimons EJ, Griffiths WJ, et al. Investigation and management of a raised serum ferritin. Br J Haematol. 2018;181:331-340. doi:10.1111/bjh.15166
- Moeinvaziri M, Mansoori P, Holakooee K, et al. Iron status in diffuse telogen hair loss among women. Acta Dermatovenerol Croat. 2009;17:279-284.
- Tamer F, Yuksel ME, Karabag Y. Serum ferritin and vitamin D levels should be evaluated in patients with diffuse hair loss prior to treatment. Postepy Dermatol Alergol. 2020;37:407-411. doi:10.5114/ada.2020.96251
- Olsen EA, Reed KB, Cacchio PB, et al. Iron deficiency in female pattern hair loss, chronic telogen effluvium, and control groups. J Am Acad Dermatol. 2010;63:991-999. doi:10.1016/j.jaad.2009.12.006
- Asghar F, Shamim N, Farooque U, et al. Telogen effluvium: a review of the literature. Cureus. 2020;12:E8320. doi:10.7759/cureus.8320
- Brough KR, Torgerson RR. Hormonal therapy in female pattern hair loss. Int J Womens Dermatol. 2017;3:53-57. doi:10.1016/j.ijwd.2017.01.001
- Klein EJ, Karim M, Li X, et al. Supplementation and hair growth: a retrospective chart review of patients with alopecia and laboratory abnormalities. JAAD Int. 2022;9:69-71. doi:10.1016/j.jdin.2022.08.013
- Goksin S. Retrospective evaluation of clinical profile and comorbidities in patients with alopecia areata. North Clin Istanb. 2022;9:451-458. doi:10.14744/nci.2022.78790
- Beatrix J, Piales C, Berland P, et al. Non-anemic iron deficiency: correlations between symptoms and iron status parameters. Eur J Clin Nutr. 2022;76:835-840. doi:10.1038/s41430-021-01047-5
- Treister-Goltzman Y, Yarza S, Peleg R. Iron deficiency and nonscarring alopecia in women: systematic review and meta-analysis. Skin Appendage Disord. 2022;8:83-92. doi:10.1159/000519952
- Santiago P. Ferrous versus ferric oral iron formulations for the treatment of iron deficiency: a clinical overview. ScientificWorldJournal. 2012;2012:846824. doi:10.1100/2012/846824
- Lo JO, Benson AE, Martens KL, et al. The role of oral iron in the treatment of adults with iron deficiency. Eur J Haematol. 2023;110:123-130. doi:10.1111/ejh.13892
- Lausevic´ M, Jovanovic´ N, Ignjatovic´ S, et al. Resorption and tolerance of the high doses of ferrous sulfate and ferrous gluconate in the patients on peritoneal dialysis. Vojnosanit Pregl. 2006;63:143-147. doi:10.2298/vsp0602143l
- Stoffel NU, Zeder C, Brittenham GM, et al. Iron absorption from supplements is greater with alternate day than with consecutive day dosing in iron-deficient anemic women. Haematologica. 2020;105:1232-1239. doi:10.3324/haematol.2019.220830
- Jimenez KM, Gasche C. Management of iron deficiency anaemia in inflammatory bowel disease. Acta Haematologica. 2019;142:30-36. doi:10.1159/000496728
- Shah AA, Donovan K, Seeley C, et al. Risk of infection associated with administration of intravenous iron: a systematic review and meta-analysis. JAMA Netw Open. 2021;4:E2133935-E2133935. doi:10.1001/jamanetworkopen.2021.33935
- Ganz T, Aronoff GR, Gaillard CAJM, et al. Iron administration, infection, and anemia management in ckd: untangling the effects of intravenous iron therapy on immunity and infection risk. Kidney Med. 2020/05/01/ 2020;2:341-353. doi: 10.1016/j.xkme.2020.01.006
- Lipschitz DA, Cook JD, Finch CA. A clinical evaluation of serum ferritin as an index of iron stores. N Engl J Med. 1974;290:1213-1216. doi:10.1056/nejm197405302902201
- Loveikyte R, Bourgonje AR, van der Reijden JJ, et al. Hepcidin and iron status in patients with inflammatory bowel disease undergoing induction therapy with vedolizumab or infliximab [published online February 7, 2023]. Inflamm Bowel Dis. doi:10.1093/ibd/izad010
- Borel MJ, Smith SM, Derr J, et al. Day-to-day variation in iron-status indices in healthy men and women. Am J Clin Nutr. 1991;54:729-735. doi:10.1093/ajcn/54.4.729
- Ford BA, Coyne DW, Eby CS, et al. Variability of ferritin measurements in chronic kidney disease; implications for iron management. Kidney International. 2009;75:104-110. doi:10.1038/ki.2008.526
- Walters GO, Miller FM, Worwood M. Serum ferritin concentration and iron stores in normal subjects. J Clin Pathol. 1973;26:770-772. doi:10.1136/jcp.26.10.770
- Lee MH, Means RT Jr. Extremely elevated serum ferritin levels in a university hospital: associated diseases and clinical significance. Am J Med. Jun 1995;98:566-571. doi:10.1016/s0002-9343(99)80015-1
- Theil EC. Ferritin: structure, gene regulation, and cellular function in animals, plants, and microorganisms. Annu Rev Biochem. 1987;56:289-315. doi:10.1146/annurev.bi.56.070187.001445
- Chen LY, Chang SD, Sreenivasan GM, et al. Dysmetabolic hyperferritinemia is associated with normal transferrin saturation, mild hepatic iron overload, and elevated hepcidin. Ann Hematol. 2011;90:139-143. doi:10.1007/s00277-010-1050-x
- Sampietro M, Fiorelli G, Fargion S. Iron overload in porphyria cutanea tarda. Haematologica. 1999;84:248-253.
- Singal AK. Porphyria cutanea tarda: recent update. Mol Genet Metab. 2019;128:271-281. doi:10.1016/j.ymgme.2019.01.004
- Frank J, Poblete-Gutiérrez P. Porphyria cutanea tarda—when skin meets liver. Best Pract Res Clin Gastroenterol. 2010;24:735-745. doi:10.1016/j.bpg.2010.07.002
- Mehta B, Efthimiou P. Ferritin in adult-onset Still’s disease: just a useful innocent bystander? Int J Inflam. 2012;2012:298405. doi:10.1155/2012/298405
- Ma AD, Fedoriw YD, Roehrs P. Hyperferritinemia and hemophagocytic lymphohistiocytosis. single institution experience in adult and pediatric patients. Blood. 2012;120:2135-2135. doi:10.1182/blood.V120.21.2135.2135
- Basu S, Maji B, Barman S, et al. Hyperferritinemia in hemophagocytic lymphohistiocytosis: a single institution experience in pediatric patients. Indian J Clin Biochem. 2018;33:108-112. doi:10.1007/s12291-017-0655-4
- Yamada K, Asai K, Okamoto A, et al. Correlation between disease activity and serum ferritin in clinically amyopathic dermatomyositis with rapidly-progressive interstitial lung disease: a case report. BMC Res Notes. 2018;11:34. doi:10.1186/s13104-018-3146-7
- Zohar DN, Seluk L, Yonath H, et al. Anti-MDA5 positive dermatomyositis associated with rapidly progressive interstitial lung disease and correlation between serum ferritin level and treatment response. Mediterr J Rheumatol. 2020;31:75-77. doi:10.31138/mjr.31.1.75
- Lin TF, Ferlic-Stark LL, Allen CE, et al. Rate of decline of ferritin in patients with hemophagocytic lymphohistiocytosis as a prognostic variable for mortality. Pediatr Blood Cancer. 2011;56:154-155. doi:10.1002/pbc.22774
- Bregy A, Trueb RM. No association between serum ferritin levels >10 microg/l and hair loss activity in women. Dermatology. 2008;217:1-6. doi:10.1159/000118505
- de Queiroz M, Vaske TM, Boza JC. Serum ferritin and vitamin D levels in women with non-scarring alopecia. J Cosmet Dermatol. 2022;21:2688-2690. doi:10.1111/jocd.14472
- El-Husseiny R, Alrgig NT, Abdel Fattah NSA. Epidemiological and biochemical factors (serum ferritin and vitamin D) associated with premature hair graying in Egyptian population. J Cosmet Dermatol. 2021;20:1860-1866. doi:10.1111/jocd.13747
- Enitan AO, Olasode OA, Onayemi EO, et al. Serum ferritin levels amongst individuals with androgenetic alopecia in Ile-Ife, Nigeria. West Afr J Med. 2022;39:1026-1031.
- I˙bis¸ S, Aksoy Sarac¸ G, Akdag˘ T. Evaluation of MCV/RDW ratio and correlations with ferritin in telogen effluvium patients. Dermatol Pract Concept. 2022;12:E2022151. doi:10.5826/dpc.1203a151
- Kakpovbia E, Ogbechie-Godec OA, Shapiro J, et al. Laboratory testing in telogen effluvium. J Drugs Dermatol. 2021;20:110-111. doi:10.36849/jdd.5771
- Rasheed H, Mahgoub D, Hegazy R, et al. Serum ferritin and vitamin D in female hair loss: do they play a role? Skin Pharmacol Physiol. 2013;26:101-107. doi:10.1159/000346698
- Hoffman M, Micheletti RG, Shields BE. Nutritional dermatoses in the hospitalized patient. Cutis. 2020;105:296, 302-308, E1-E5.
- Ganz T. Macrophages and systemic iron homeostasis. J Innate Immun. 2012;4:446-453. doi:10.1159/000336423
- Slusarczyk P, Mandal PK, Zurawska G, et al. Impaired iron recycling from erythrocytes is an early hallmark of aging. eLife. 2023;12:E79196. doi:10.7554/eLife.79196
- Crichton RR. Ferritin: structure, synthesis and function. N Engl J Med. 1971;284:1413-1422. doi:10.1056/nejm197106242842506
- Sandnes M, Ulvik RJ, Vorland M, et al. Hyperferritinemia—a clinical overview. J Clin Med. 2021;10:2008. doi:10.3390/jcm10092008
- Kernan KF, Carcillo JA. Hyperferritinemia and inflammation. Int Immunol. 2017;29:401-409. doi:10.1093/intimm/dxx031
- Wright JA, Richards T, Srai SKS. The role of iron in the skin and cutaneous wound healing. review. Front Pharmacol. 2014;5:156. doi:10.3389/fphar.2014.00156
- Ems T, St Lucia K, Huecker MR. Biochemistry, iron absorption. StatPearls Publishing; 2022.
- Crichton RR. Ferritin: structure, synthesis and function. N Engl J Med. 1971;284:1413-1422. doi:10.1056/nejm197106242842506
- Cohen LA, Gutierrez L, Weiss A, et al. Serum ferritin is derived primarily from macrophages through a nonclassical secretory pathway. Blood. 2010;116:1574-1584. doi:10.1182/blood-2009-11-253815
- Briat JF, Ravet K, Arnaud N, et al. New insights into ferritin synthesis and function highlight a link between iron homeostasis and oxidative stress in plants. Ann Bot. 2010;105:811-822. doi:10.1093/aob/mcp128
- Kato J, Kobune M, Ohkubo S, et al. Iron/IRP-1-dependent regulation of mRNA expression for transferrin receptor, DMT1 and ferritin during human erythroid differentiation. Exp Hematol. 2007;35:879-887. doi:10.1016/j.exphem.2007.03.005
- Gozzelino R, Soares MP. Coupling heme and iron metabolism via ferritin H chain. Antioxid Redox Signal. 2014;20:1754-1769. doi:10.1089/ars.2013.5666
- Torti FM, Torti SV. Regulation of ferritin genes and protein. Blood. 2002;99:3505-3516. doi:10.1182/blood.V99.10.3505
- Torti SV, Kwak EL, Miller SC, et al. The molecular cloning and characterization of murine ferritin heavy chain, a tumor necrosis factor-inducible gene. J Biol Chem. 1988;263:12638-12644.
- Wei Y, Miller SC, Tsuji Y, et al. Interleukin 1 induces ferritin heavy chain in human muscle cells. Biochem Biophys Res Commun. 1990;169:289-296. doi:10.1016/0006-291x(90)91466-6
- Bissett DL, Chatterjee R, Hannon DP. Chronic ultraviolet radiation–induced increase in skin iron and the photoprotective effect of topically applied iron chelators. Photochem Photobiol. 1991;54:215-223. https://doi.org/10.1111/j.1751-1097.1991.tb02009.x
- Pourzand C, Watkin RD, Brown JE, et al. Ultraviolet A radiation induces immediate release of iron in human primary skin fibroblasts: the role of ferritin. Proc Natl Acad Sci U S A. 1999;96:6751-6756. doi:10.1073/pnas.96.12.6751
- Applegate LA, Scaletta C, Panizzon R, et al. Evidence that ferritin is UV inducible in human skin: part of a putative defense mechanism. J Invest Dermatol. 1998;111:159-163. https://doi.org/10.1046/j.1523-1747.1998.00254.x
- Wesselius LJ, Nelson ME, Skikne BS. Increased release of ferritin and iron by iron-loaded alveolar macrophages in cigarette smokers. Am J Respir Crit Care Med. 1994;150:690-695. doi:10.1164/ajrccm.150.3.8087339
- De Domenico I, Ward DM, Kaplan J. Specific iron chelators determine the route of ferritin degradation. Blood. 2009;114:4546-4551. doi:10.1182/blood-2009-05-224188
- Knovich MA, Storey JA, Coffman LG, et al. Ferritin for the clinician. Blood Rev. 2009;23:95-104. doi:10.1016/j.blre.2008.08.001
- Dignass A, Farrag K, Stein J. Limitations of serum ferritin in diagnosing iron deficiency in inflammatory conditions. Int J Chronic Dis. 2018;2018:9394060. doi:10.1155/2018/9394060
- World Health Organization. WHO guideline on use of ferritin concentrations to assess iron status in individuals and populations. Published April 21, 2020. Accessed July 23, 2023. https://www.who.int/publications/i/item/9789240000124
- Finch CA, Bellotti V, Stray S, et al. Plasma ferritin determination as a diagnostic tool. West J Med. 1986;145:657-663.
- Guyatt GH, Oxman AD, Ali M, et al. Laboratory diagnosis of iron-deficiency anemia. J Gen Intern Med. 1992;7:145-153. doi:10.1007/BF02598003
- Punnonen K, Irjala K, Rajamäki A. Serum transferrin receptor and its ratio to serum ferritin in the diagnosis of iron deficiency. Blood. 1997;89:1052-1057. https://doi.org/10.1182/blood.V89.3.1052
- Zacharski LR, Ornstein DL, Woloshin S, et al. Association of age, sex, and race with body iron stores in adults: analysis of NHANES III data. American Heart Journal. 2000;140:98-104. https://doi.org/10.1067/mhj.2000.106646
- Milman N, Kirchhoff M. Iron stores in 1359, 30- to 60-year-old Danish women: evaluation by serum ferritin and hemoglobin. Ann Hematol. 1992;64:22-27. doi:10.1007/bf01811467
- Liu J-M, Hankinson SE, Stampfer MJ, et al. Body iron stores and their determinants in healthy postmenopausal US women. Am J Clin Nutr. 2003;78:1160-1167. doi:10.1093/ajcn/78.6.1160
- Kim C, Nan B, Kong S, et al. Changes in iron measures over menopause and associations with insulin resistance. J Womens Health (Larchmt). 2012;21:872-877. doi:10.1089/jwh.2012.3549
- Han LL, Wang YX, Li J, et al. Gender differences in associations of serum ferritin and diabetes, metabolic syndrome, and obesity in the China Health and Nutrition Survey. Mol Nutr Food Res. 2014;58:2189-2195. doi:10.1002/mnfr.201400088
- Pan Y, Jackson RT. Insights into the ethnic differences in serum ferritin between black and white US adult men. Am J Hum Biol. 2008;20:406-416. https://doi.org/10.1002/ajhb.20745
- Cullis JO, Fitzsimons EJ, Griffiths WJ, et al. Investigation and management of a raised serum ferritin. Br J Haematol. 2018;181:331-340. doi:10.1111/bjh.15166
- Moeinvaziri M, Mansoori P, Holakooee K, et al. Iron status in diffuse telogen hair loss among women. Acta Dermatovenerol Croat. 2009;17:279-284.
- Tamer F, Yuksel ME, Karabag Y. Serum ferritin and vitamin D levels should be evaluated in patients with diffuse hair loss prior to treatment. Postepy Dermatol Alergol. 2020;37:407-411. doi:10.5114/ada.2020.96251
- Olsen EA, Reed KB, Cacchio PB, et al. Iron deficiency in female pattern hair loss, chronic telogen effluvium, and control groups. J Am Acad Dermatol. 2010;63:991-999. doi:10.1016/j.jaad.2009.12.006
- Asghar F, Shamim N, Farooque U, et al. Telogen effluvium: a review of the literature. Cureus. 2020;12:E8320. doi:10.7759/cureus.8320
- Brough KR, Torgerson RR. Hormonal therapy in female pattern hair loss. Int J Womens Dermatol. 2017;3:53-57. doi:10.1016/j.ijwd.2017.01.001
- Klein EJ, Karim M, Li X, et al. Supplementation and hair growth: a retrospective chart review of patients with alopecia and laboratory abnormalities. JAAD Int. 2022;9:69-71. doi:10.1016/j.jdin.2022.08.013
- Goksin S. Retrospective evaluation of clinical profile and comorbidities in patients with alopecia areata. North Clin Istanb. 2022;9:451-458. doi:10.14744/nci.2022.78790
- Beatrix J, Piales C, Berland P, et al. Non-anemic iron deficiency: correlations between symptoms and iron status parameters. Eur J Clin Nutr. 2022;76:835-840. doi:10.1038/s41430-021-01047-5
- Treister-Goltzman Y, Yarza S, Peleg R. Iron deficiency and nonscarring alopecia in women: systematic review and meta-analysis. Skin Appendage Disord. 2022;8:83-92. doi:10.1159/000519952
- Santiago P. Ferrous versus ferric oral iron formulations for the treatment of iron deficiency: a clinical overview. ScientificWorldJournal. 2012;2012:846824. doi:10.1100/2012/846824
- Lo JO, Benson AE, Martens KL, et al. The role of oral iron in the treatment of adults with iron deficiency. Eur J Haematol. 2023;110:123-130. doi:10.1111/ejh.13892
- Lausevic´ M, Jovanovic´ N, Ignjatovic´ S, et al. Resorption and tolerance of the high doses of ferrous sulfate and ferrous gluconate in the patients on peritoneal dialysis. Vojnosanit Pregl. 2006;63:143-147. doi:10.2298/vsp0602143l
- Stoffel NU, Zeder C, Brittenham GM, et al. Iron absorption from supplements is greater with alternate day than with consecutive day dosing in iron-deficient anemic women. Haematologica. 2020;105:1232-1239. doi:10.3324/haematol.2019.220830
- Jimenez KM, Gasche C. Management of iron deficiency anaemia in inflammatory bowel disease. Acta Haematologica. 2019;142:30-36. doi:10.1159/000496728
- Shah AA, Donovan K, Seeley C, et al. Risk of infection associated with administration of intravenous iron: a systematic review and meta-analysis. JAMA Netw Open. 2021;4:E2133935-E2133935. doi:10.1001/jamanetworkopen.2021.33935
- Ganz T, Aronoff GR, Gaillard CAJM, et al. Iron administration, infection, and anemia management in ckd: untangling the effects of intravenous iron therapy on immunity and infection risk. Kidney Med. 2020/05/01/ 2020;2:341-353. doi: 10.1016/j.xkme.2020.01.006
- Lipschitz DA, Cook JD, Finch CA. A clinical evaluation of serum ferritin as an index of iron stores. N Engl J Med. 1974;290:1213-1216. doi:10.1056/nejm197405302902201
- Loveikyte R, Bourgonje AR, van der Reijden JJ, et al. Hepcidin and iron status in patients with inflammatory bowel disease undergoing induction therapy with vedolizumab or infliximab [published online February 7, 2023]. Inflamm Bowel Dis. doi:10.1093/ibd/izad010
- Borel MJ, Smith SM, Derr J, et al. Day-to-day variation in iron-status indices in healthy men and women. Am J Clin Nutr. 1991;54:729-735. doi:10.1093/ajcn/54.4.729
- Ford BA, Coyne DW, Eby CS, et al. Variability of ferritin measurements in chronic kidney disease; implications for iron management. Kidney International. 2009;75:104-110. doi:10.1038/ki.2008.526
- Walters GO, Miller FM, Worwood M. Serum ferritin concentration and iron stores in normal subjects. J Clin Pathol. 1973;26:770-772. doi:10.1136/jcp.26.10.770
- Lee MH, Means RT Jr. Extremely elevated serum ferritin levels in a university hospital: associated diseases and clinical significance. Am J Med. Jun 1995;98:566-571. doi:10.1016/s0002-9343(99)80015-1
- Theil EC. Ferritin: structure, gene regulation, and cellular function in animals, plants, and microorganisms. Annu Rev Biochem. 1987;56:289-315. doi:10.1146/annurev.bi.56.070187.001445
- Chen LY, Chang SD, Sreenivasan GM, et al. Dysmetabolic hyperferritinemia is associated with normal transferrin saturation, mild hepatic iron overload, and elevated hepcidin. Ann Hematol. 2011;90:139-143. doi:10.1007/s00277-010-1050-x
- Sampietro M, Fiorelli G, Fargion S. Iron overload in porphyria cutanea tarda. Haematologica. 1999;84:248-253.
- Singal AK. Porphyria cutanea tarda: recent update. Mol Genet Metab. 2019;128:271-281. doi:10.1016/j.ymgme.2019.01.004
- Frank J, Poblete-Gutiérrez P. Porphyria cutanea tarda—when skin meets liver. Best Pract Res Clin Gastroenterol. 2010;24:735-745. doi:10.1016/j.bpg.2010.07.002
- Mehta B, Efthimiou P. Ferritin in adult-onset Still’s disease: just a useful innocent bystander? Int J Inflam. 2012;2012:298405. doi:10.1155/2012/298405
- Ma AD, Fedoriw YD, Roehrs P. Hyperferritinemia and hemophagocytic lymphohistiocytosis. single institution experience in adult and pediatric patients. Blood. 2012;120:2135-2135. doi:10.1182/blood.V120.21.2135.2135
- Basu S, Maji B, Barman S, et al. Hyperferritinemia in hemophagocytic lymphohistiocytosis: a single institution experience in pediatric patients. Indian J Clin Biochem. 2018;33:108-112. doi:10.1007/s12291-017-0655-4
- Yamada K, Asai K, Okamoto A, et al. Correlation between disease activity and serum ferritin in clinically amyopathic dermatomyositis with rapidly-progressive interstitial lung disease: a case report. BMC Res Notes. 2018;11:34. doi:10.1186/s13104-018-3146-7
- Zohar DN, Seluk L, Yonath H, et al. Anti-MDA5 positive dermatomyositis associated with rapidly progressive interstitial lung disease and correlation between serum ferritin level and treatment response. Mediterr J Rheumatol. 2020;31:75-77. doi:10.31138/mjr.31.1.75
- Lin TF, Ferlic-Stark LL, Allen CE, et al. Rate of decline of ferritin in patients with hemophagocytic lymphohistiocytosis as a prognostic variable for mortality. Pediatr Blood Cancer. 2011;56:154-155. doi:10.1002/pbc.22774
- Bregy A, Trueb RM. No association between serum ferritin levels >10 microg/l and hair loss activity in women. Dermatology. 2008;217:1-6. doi:10.1159/000118505
- de Queiroz M, Vaske TM, Boza JC. Serum ferritin and vitamin D levels in women with non-scarring alopecia. J Cosmet Dermatol. 2022;21:2688-2690. doi:10.1111/jocd.14472
- El-Husseiny R, Alrgig NT, Abdel Fattah NSA. Epidemiological and biochemical factors (serum ferritin and vitamin D) associated with premature hair graying in Egyptian population. J Cosmet Dermatol. 2021;20:1860-1866. doi:10.1111/jocd.13747
- Enitan AO, Olasode OA, Onayemi EO, et al. Serum ferritin levels amongst individuals with androgenetic alopecia in Ile-Ife, Nigeria. West Afr J Med. 2022;39:1026-1031.
- I˙bis¸ S, Aksoy Sarac¸ G, Akdag˘ T. Evaluation of MCV/RDW ratio and correlations with ferritin in telogen effluvium patients. Dermatol Pract Concept. 2022;12:E2022151. doi:10.5826/dpc.1203a151
- Kakpovbia E, Ogbechie-Godec OA, Shapiro J, et al. Laboratory testing in telogen effluvium. J Drugs Dermatol. 2021;20:110-111. doi:10.36849/jdd.5771
- Rasheed H, Mahgoub D, Hegazy R, et al. Serum ferritin and vitamin D in female hair loss: do they play a role? Skin Pharmacol Physiol. 2013;26:101-107. doi:10.1159/000346698
Practice Points
- In patients who are otherwise healthy without chronic systemic disease, hepatic disease, or inflammatory disorders, serum ferritin levels directly correlate with body iron status.
- Elevated serum ferritin should be interpreted in the context of other indicators of iron status, including transferrin saturation, complete blood cell count, and/or liver function panel.
- Low serum ferritin is a specific marker for iron deficiency, and iron supplementation should be initiated based on age-, sex-, and condition-specific thresholds.
Minimally Invasive Nail Surgery: Techniques to Improve the Patient Experience
Nail surgical procedures including biopsies, correction of onychocryptosis and other deformities, and excision of tumors are essential for diagnosing and treating nail disorders. Nail surgery often is perceived by dermatologists as a difficult-to-perform, high-risk procedure associated with patient anxiety, pain, and permanent scarring, which may limit implementation. Misconceptions about nail surgical techniques, aftercare, and patient outcomes are prevalent, and a paucity of nail surgery randomized clinical trials hinder formulation of standardized guidelines.1 In a survey-based study of 95 dermatology residency programs (240 total respondents), 58% of residents said they performed 10 or fewer nail procedures, 10% performed more than 10 procedures, 25% only observed nail procedures, 4% were exposed by lecture only, and 1% had no exposure; 30% said they felt incompetent performing nail biopsies.2 In a retrospective study of nail biopsies performed from 2012 to 2017 in the Medicare Provider Utilization and Payment Database, only 0.28% and 1.01% of all general dermatologists and Mohs surgeons, respectively, performed nail biopsies annually.3 A minimally invasive nail surgery technique is essential to alleviating dermatologist and patient apprehension, which may lead to greater adoption and improved outcomes.
Reduce Patient Anxiety During Nail Surgery
The prospect of undergoing nail surgery can be psychologically distressing to patients because the nail unit is highly sensitive, intraoperative and postoperative pain are common concerns, patient education materials generally are scarce and inaccurate,4 and procedures are performed under local anesthesia with the patient fully awake. In a prospective study of 48 patients undergoing nail surgery, the median preoperative Spielberger State-Trait Anxiety Inventory level was 42.00 (IQR, 6.50).5 Patient distress may be minimized by providing verbal and written educational materials, discussing expectations, and preoperatively using fast-acting benzodiazepines when necessary.6 Utilizing a sleep mask,7 stress ball,8 music,9 and/or virtual reality10 also may reduce patient anxiety during nail surgery.
Use Proper Anesthetic Techniques
Proper anesthetic technique is crucial to achieve the optimal patient experience during nail surgery. With a wing block, the anesthetic is injected into 3 points: (1) the proximal nail fold, (2) the medial/lateral fold, and (3) the hyponychium. The wing block is the preferred technique by many nail surgeons because the second and third injections are given in skin that is already anesthetized, reducing patient discomfort to a single pinprick11; additionally, there is lower postoperative paresthesia risk with the wing block compared with other digital nerve blocks.12 Ropivacaine, a fast-acting and long-acting anesthetic, is preferred over lidocaine to minimize immediate postoperative pain. Buffering the anesthetic solution to physiologic pH and slow infiltration can reduce pain during infiltration.12 Distraction12 provided by ethyl chloride refrigerant spray, an air-cooling device,13 or vibration also can reduce pain during anesthesia.
Punch Biopsy and Excision Tips
The punch biopsy is a minimally invasive method for diagnosing various neoplastic and inflammatory nail unit conditions, except for pigmented lesions.12 For polydactylous nail conditions requiring biopsy, a digit on the nondominant hand should be selected if possible. The punch is applied directly to the nail plate and twisted with downward pressure until the bone is reached, with the instrument withdrawn slowly to prevent surrounding nail plate detachment. Hemostasis is easily achieved with direct pressure and/or use of epinephrine or ropivacaine during anesthesia, and a digital tourniquet generally is not required. Applying microporous polysaccharide hemospheres powder14 or kaolin-impregnated gauze15 with direct pressure is helpful in managing continued bleeding following nail surgery. Punching through the proximal nail matrix should be avoided to prevent permanent onychodystrophy.
A tangential matrix shave biopsy requires a more practiced technique and is preferred for sampling longitudinal melanonychia. A partial proximal nail plate avulsion adequately exposes the origin of pigment and avoids complete avulsion, which may cause more onychodystrophy.16 For broad erythronychia, a total nail avulsion may be necessary. For narrow, well-defined erythronychia, a less-invasive approach such as trap-door avulsion, longitudinal nail strip, or lateral nail plate curl, depending on the etiology, often is sufficient. Tissue excision should be tailored to the specific etiology, with localized excision sufficient for glomus tumors; onychopapillomas require tangential excision of the distal matrix, entire nail bed, and hyperkeratotic papule at the hyponychium. Pushing the cuticle with an elevator/spatula instead of making 2 tangential incisions on the proximal nail fold has been suggested to decrease postoperative paronychia risk.12 A Teflon-coated blade is used to achieve a smooth cut with minimal drag, enabling collection of specimens less than 1 mm thick, which provides sufficient nail matrix epithelium and dermis for histologic examination.16 After obtaining the specimen, the avulsed nail plate may be sutured back to the nail bed using a rapidly absorbable suture such as polyglactin 910, serving as a temporary biological dressing and splint for the nail unit during healing.12 In a retrospective study of 30 patients with longitudinal melanonychia undergoing tangential matrix excision, 27% (8/30) developed postoperative onychodystrophy.17 Although this technique carries relatively lower risk of permanent onychodystrophy compared to other methods, it still is important to acknowledge during the preoperative consent process.12
The lateral longitudinal excision is a valuable technique for diagnosing nail unit inflammatory conditions. Classically, a longitudinal sample including the proximal nail fold, complete matrix, lateral plate, lateral nail fold, hyponychium, and distal tip skin is obtained, with a 10% narrowing of the nail plate expected. If the lateral horn of the nail matrix is missed, permanent lateral malalignment and spicule formation are potential risks. To minimize narrowing of the nail plate and postoperative paronychia, a longitudinal nail strip—where the proximal nail fold and matrix are left intact—is an alternative technique.18
Pain Management Approaches
Appropriate postoperative pain management is crucial for optimizing patient outcomes. In a prospective study of 20 patients undergoing nail biopsy, the mean pain score 6 to 12 hours postprocedure was 5.7 on a scale of 0 to 10. Patients with presurgery pain vs those without experienced significantly higher pain levels both during anesthesia and after surgery (both P<.05).19 Therefore, a personalized approach to pain management based on presence of presurgical pain is warranted. In a randomized clinical trial of 16 patients anesthetized with lidocaine 2% and intraoperative infiltration with a combination of ropivacaine 0.5 mL and triamcinolone (10 mg/mL [0.5 mL]) vs lidocaine 2% alone, the intraoperative mixture reduced postoperative pain (mean pain score, 2 of 10 at 48 hours postprocedure vs 7.88 of 10 in the control group [P<.001]).20
A Cochrane review of 4 unpublished dental and orthopedic surgery studies showed that gabapentin is superior to placebo in the treatment of acute postoperative pain. Therefore, a single dose of gabapentin (250 mg) may be considered in patients at risk for high postoperative pain.21 In a randomized double-blind trial of 210 Mohs micrographic surgery patients, those receiving acetaminophen and ibuprofen reported lower pain scores at 2, 4, 8, and 12 hours postprocedure compared with patients taking acetaminophen and codeine or acetaminophen alone.22 However, the role of opioids in pain management following nail surgery has not been adequately studied.
Wound Care
An efficient dressing protects the surgical wound, facilitates healing, and provides comfort. In our experience, an initial layer of petrolatum-impregnated gauze followed by a pressure-padded bandage consisting of folded dry gauze secured in place with longitudinally applied tape to avoid a tourniquet effect is effective for nail surgical wounds. As the last step, self-adherent elastic wrap is applied around the digit and extended proximally to prevent a tourniquet effect.23
Final Thoughts
Due to the intricate anatomy of the nail unit, nail surgeries are inherently more invasive than most dermatologic surgical procedures. It is crucial to adopt a minimally invasive approach to reduce tissue damage and potential complications in both the short-term and long-term. Adopting this approach may substantially improve patient outcomes and enhance diagnostic and treatment efficacy.
- Ricardo JW, Lipner SR. Nail surgery myths and truths. J Drugs Dermatol. 2020;19:230-234.
- Lee EH, Nehal KS, Dusza SW, et al. Procedural dermatology training during dermatology residency: a survey of third-year dermatology residents. J Am Acad Dermatol. 2011;64:475-483.E4835. doi:10.1016/j.jaad.2010.05.044
- Wang Y, Lipner SR. Retrospective analysis of nail biopsies performed using the Medicare Provider Utilization and Payment Database 2012 to 2017. Dermatol Ther. 2021;34:E14928. doi:10.1111/dth.14928
- Ishack S, Lipner SR. Evaluating the impact and educational value of YouTube videos on nail biopsy procedures. Cutis. 2020;105:148-149, E1.
- Göktay F, Altan ZM, Talas A, et al. Anxiety among patients undergoing nail surgery and skin punch biopsy: effects of age, gender, educational status, and previous experience. J Cutan Med Surg. 2016;20:35-39. doi:10.1177/1203475415588645
- Lipner SR. Pain-minimizing strategies for nail surgery. Cutis. 2018;101:76-77.
- Ricardo JW, Lipner SR. Utilizing a sleep mask to reduce patient anxiety during nail surgery. Cutis. 2021;108:36. doi:10.12788/cutis.0285
- Ricardo JW, Lipner SR. Utilization of a stress ball to diminish anxiety during nail surgery. Cutis. 2020;105:294.
- Vachiramon V, Sobanko JF, Rattanaumpawan P, et al. Music reduces patient anxiety during Mohs surgery: an open-label randomized controlled trial. Dermatol Surg. 2013;39:298-305. doi:10.1111/dsu.12047
- Higgins S, Feinstein S, Hawkins M, et al. Virtual reality to improve the experience of the Mohs patient—a prospective interventional study. Dermatol Surg. 2019;45:1009-1018. doi:10.1097/DSS.0000000000001854
- Jellinek NJ, Vélez NF. Nail surgery: best way to obtain effective anesthesia. Dermatol Clin. 2015;33:265-271. doi:10.1016/j.det.2014.12.007
- Baltz JO, Jellinek NJ. Nail surgery: six essential techniques. Dermatol Clin. 2021;39:305-318. doi:10.1016/j.det.2020.12.015
- Ricardo JW, Lipner SR. Air cooling for improved analgesia during local anesthetic infiltration for nail surgery. J Am Acad Dermatol. 2021;84:E231-E232. doi:10.1016/j.jaad.2019.11.032
- Ricardo JW, Lipner SR. Microporous polysaccharide hemospheres powder for hemostasis following nail surgery [published online March 26, 2021]. J Am Acad Dermatol. doi:10.1016/j.jaad.2021.03.069
- Ricardo JW, Lipner SR. Kaolin-impregnated gauze for hemostasis following nail surgery. J Am Acad Dermatol. 2021;85:E13-E14. doi:10.1016/j.jaad.2020.02.008
- Jellinek N. Nail matrix biopsy of longitudinal melanonychia: diagnostic algorithm including the matrix shave biopsy. J Am Acad Dermatol. 2007;56:803-810. doi:10.1016/j.jaad.2006.12.001
- Richert B, Theunis A, Norrenberg S, et al. Tangential excision of pigmented nail matrix lesions responsible for longitudinal melanonychia: evaluation of the technique on a series of 30 patients. J Am Acad Dermatol. 2013;69:96-104. doi:10.1016/j.jaad.2013.01.029
- Godse R, Jariwala N, Rubin AI. How we do it: the longitudinal nail strip biopsy for nail unit inflammatory dermatoses. Dermatol Surg. 2023;49:311-313. doi:10.1097/DSS.0000000000003707
- Ricardo JW, Qiu Y, Lipner SR. Longitudinal perioperative pain assessment in nail surgery. J Am Acad Dermatol. 2022;87:874-876. doi:10.1016/j.jaad.2021.11.042
- Di Chiacchio N, Ocampo-Garza J, Villarreal-Villarreal CD, et al. Post-nail procedure analgesia: a randomized control pilot study. J Am Acad Dermatol. 2019;81:860-862. doi:10.1016/j.jaad.2019.05.015
- Straube S, Derry S, Moore RA, et al. Single dose oral gabapentin for established acute postoperative pain in adults [published online May 12, 2010]. Cochrane Database Syst Rev. 2010;2010:CD008183. doi:10.1002/14651858.CD008183.pub2
- Sniezek PJ, Brodland DG, Zitelli JA. A randomized controlled trial comparing acetaminophen, acetaminophen and ibuprofen, and acetaminophen and codeine for postoperative pain relief after Mohs surgery and cutaneous reconstruction. Dermatol Surg. 2011;37:1007-1013. doi:10.1111/j.1524-4725.2011.02022.x
- Ricardo JW, Lipner SR. How we do it: pressure-padded dressing with self-adherent elastic wrap for wound care after nail surgery. Dermatol Surg. 2021;47:442-444. doi:10.1097/DSS.0000000000002371
Nail surgical procedures including biopsies, correction of onychocryptosis and other deformities, and excision of tumors are essential for diagnosing and treating nail disorders. Nail surgery often is perceived by dermatologists as a difficult-to-perform, high-risk procedure associated with patient anxiety, pain, and permanent scarring, which may limit implementation. Misconceptions about nail surgical techniques, aftercare, and patient outcomes are prevalent, and a paucity of nail surgery randomized clinical trials hinder formulation of standardized guidelines.1 In a survey-based study of 95 dermatology residency programs (240 total respondents), 58% of residents said they performed 10 or fewer nail procedures, 10% performed more than 10 procedures, 25% only observed nail procedures, 4% were exposed by lecture only, and 1% had no exposure; 30% said they felt incompetent performing nail biopsies.2 In a retrospective study of nail biopsies performed from 2012 to 2017 in the Medicare Provider Utilization and Payment Database, only 0.28% and 1.01% of all general dermatologists and Mohs surgeons, respectively, performed nail biopsies annually.3 A minimally invasive nail surgery technique is essential to alleviating dermatologist and patient apprehension, which may lead to greater adoption and improved outcomes.
Reduce Patient Anxiety During Nail Surgery
The prospect of undergoing nail surgery can be psychologically distressing to patients because the nail unit is highly sensitive, intraoperative and postoperative pain are common concerns, patient education materials generally are scarce and inaccurate,4 and procedures are performed under local anesthesia with the patient fully awake. In a prospective study of 48 patients undergoing nail surgery, the median preoperative Spielberger State-Trait Anxiety Inventory level was 42.00 (IQR, 6.50).5 Patient distress may be minimized by providing verbal and written educational materials, discussing expectations, and preoperatively using fast-acting benzodiazepines when necessary.6 Utilizing a sleep mask,7 stress ball,8 music,9 and/or virtual reality10 also may reduce patient anxiety during nail surgery.
Use Proper Anesthetic Techniques
Proper anesthetic technique is crucial to achieve the optimal patient experience during nail surgery. With a wing block, the anesthetic is injected into 3 points: (1) the proximal nail fold, (2) the medial/lateral fold, and (3) the hyponychium. The wing block is the preferred technique by many nail surgeons because the second and third injections are given in skin that is already anesthetized, reducing patient discomfort to a single pinprick11; additionally, there is lower postoperative paresthesia risk with the wing block compared with other digital nerve blocks.12 Ropivacaine, a fast-acting and long-acting anesthetic, is preferred over lidocaine to minimize immediate postoperative pain. Buffering the anesthetic solution to physiologic pH and slow infiltration can reduce pain during infiltration.12 Distraction12 provided by ethyl chloride refrigerant spray, an air-cooling device,13 or vibration also can reduce pain during anesthesia.
Punch Biopsy and Excision Tips
The punch biopsy is a minimally invasive method for diagnosing various neoplastic and inflammatory nail unit conditions, except for pigmented lesions.12 For polydactylous nail conditions requiring biopsy, a digit on the nondominant hand should be selected if possible. The punch is applied directly to the nail plate and twisted with downward pressure until the bone is reached, with the instrument withdrawn slowly to prevent surrounding nail plate detachment. Hemostasis is easily achieved with direct pressure and/or use of epinephrine or ropivacaine during anesthesia, and a digital tourniquet generally is not required. Applying microporous polysaccharide hemospheres powder14 or kaolin-impregnated gauze15 with direct pressure is helpful in managing continued bleeding following nail surgery. Punching through the proximal nail matrix should be avoided to prevent permanent onychodystrophy.
A tangential matrix shave biopsy requires a more practiced technique and is preferred for sampling longitudinal melanonychia. A partial proximal nail plate avulsion adequately exposes the origin of pigment and avoids complete avulsion, which may cause more onychodystrophy.16 For broad erythronychia, a total nail avulsion may be necessary. For narrow, well-defined erythronychia, a less-invasive approach such as trap-door avulsion, longitudinal nail strip, or lateral nail plate curl, depending on the etiology, often is sufficient. Tissue excision should be tailored to the specific etiology, with localized excision sufficient for glomus tumors; onychopapillomas require tangential excision of the distal matrix, entire nail bed, and hyperkeratotic papule at the hyponychium. Pushing the cuticle with an elevator/spatula instead of making 2 tangential incisions on the proximal nail fold has been suggested to decrease postoperative paronychia risk.12 A Teflon-coated blade is used to achieve a smooth cut with minimal drag, enabling collection of specimens less than 1 mm thick, which provides sufficient nail matrix epithelium and dermis for histologic examination.16 After obtaining the specimen, the avulsed nail plate may be sutured back to the nail bed using a rapidly absorbable suture such as polyglactin 910, serving as a temporary biological dressing and splint for the nail unit during healing.12 In a retrospective study of 30 patients with longitudinal melanonychia undergoing tangential matrix excision, 27% (8/30) developed postoperative onychodystrophy.17 Although this technique carries relatively lower risk of permanent onychodystrophy compared to other methods, it still is important to acknowledge during the preoperative consent process.12
The lateral longitudinal excision is a valuable technique for diagnosing nail unit inflammatory conditions. Classically, a longitudinal sample including the proximal nail fold, complete matrix, lateral plate, lateral nail fold, hyponychium, and distal tip skin is obtained, with a 10% narrowing of the nail plate expected. If the lateral horn of the nail matrix is missed, permanent lateral malalignment and spicule formation are potential risks. To minimize narrowing of the nail plate and postoperative paronychia, a longitudinal nail strip—where the proximal nail fold and matrix are left intact—is an alternative technique.18
Pain Management Approaches
Appropriate postoperative pain management is crucial for optimizing patient outcomes. In a prospective study of 20 patients undergoing nail biopsy, the mean pain score 6 to 12 hours postprocedure was 5.7 on a scale of 0 to 10. Patients with presurgery pain vs those without experienced significantly higher pain levels both during anesthesia and after surgery (both P<.05).19 Therefore, a personalized approach to pain management based on presence of presurgical pain is warranted. In a randomized clinical trial of 16 patients anesthetized with lidocaine 2% and intraoperative infiltration with a combination of ropivacaine 0.5 mL and triamcinolone (10 mg/mL [0.5 mL]) vs lidocaine 2% alone, the intraoperative mixture reduced postoperative pain (mean pain score, 2 of 10 at 48 hours postprocedure vs 7.88 of 10 in the control group [P<.001]).20
A Cochrane review of 4 unpublished dental and orthopedic surgery studies showed that gabapentin is superior to placebo in the treatment of acute postoperative pain. Therefore, a single dose of gabapentin (250 mg) may be considered in patients at risk for high postoperative pain.21 In a randomized double-blind trial of 210 Mohs micrographic surgery patients, those receiving acetaminophen and ibuprofen reported lower pain scores at 2, 4, 8, and 12 hours postprocedure compared with patients taking acetaminophen and codeine or acetaminophen alone.22 However, the role of opioids in pain management following nail surgery has not been adequately studied.
Wound Care
An efficient dressing protects the surgical wound, facilitates healing, and provides comfort. In our experience, an initial layer of petrolatum-impregnated gauze followed by a pressure-padded bandage consisting of folded dry gauze secured in place with longitudinally applied tape to avoid a tourniquet effect is effective for nail surgical wounds. As the last step, self-adherent elastic wrap is applied around the digit and extended proximally to prevent a tourniquet effect.23
Final Thoughts
Due to the intricate anatomy of the nail unit, nail surgeries are inherently more invasive than most dermatologic surgical procedures. It is crucial to adopt a minimally invasive approach to reduce tissue damage and potential complications in both the short-term and long-term. Adopting this approach may substantially improve patient outcomes and enhance diagnostic and treatment efficacy.
Nail surgical procedures including biopsies, correction of onychocryptosis and other deformities, and excision of tumors are essential for diagnosing and treating nail disorders. Nail surgery often is perceived by dermatologists as a difficult-to-perform, high-risk procedure associated with patient anxiety, pain, and permanent scarring, which may limit implementation. Misconceptions about nail surgical techniques, aftercare, and patient outcomes are prevalent, and a paucity of nail surgery randomized clinical trials hinder formulation of standardized guidelines.1 In a survey-based study of 95 dermatology residency programs (240 total respondents), 58% of residents said they performed 10 or fewer nail procedures, 10% performed more than 10 procedures, 25% only observed nail procedures, 4% were exposed by lecture only, and 1% had no exposure; 30% said they felt incompetent performing nail biopsies.2 In a retrospective study of nail biopsies performed from 2012 to 2017 in the Medicare Provider Utilization and Payment Database, only 0.28% and 1.01% of all general dermatologists and Mohs surgeons, respectively, performed nail biopsies annually.3 A minimally invasive nail surgery technique is essential to alleviating dermatologist and patient apprehension, which may lead to greater adoption and improved outcomes.
Reduce Patient Anxiety During Nail Surgery
The prospect of undergoing nail surgery can be psychologically distressing to patients because the nail unit is highly sensitive, intraoperative and postoperative pain are common concerns, patient education materials generally are scarce and inaccurate,4 and procedures are performed under local anesthesia with the patient fully awake. In a prospective study of 48 patients undergoing nail surgery, the median preoperative Spielberger State-Trait Anxiety Inventory level was 42.00 (IQR, 6.50).5 Patient distress may be minimized by providing verbal and written educational materials, discussing expectations, and preoperatively using fast-acting benzodiazepines when necessary.6 Utilizing a sleep mask,7 stress ball,8 music,9 and/or virtual reality10 also may reduce patient anxiety during nail surgery.
Use Proper Anesthetic Techniques
Proper anesthetic technique is crucial to achieve the optimal patient experience during nail surgery. With a wing block, the anesthetic is injected into 3 points: (1) the proximal nail fold, (2) the medial/lateral fold, and (3) the hyponychium. The wing block is the preferred technique by many nail surgeons because the second and third injections are given in skin that is already anesthetized, reducing patient discomfort to a single pinprick11; additionally, there is lower postoperative paresthesia risk with the wing block compared with other digital nerve blocks.12 Ropivacaine, a fast-acting and long-acting anesthetic, is preferred over lidocaine to minimize immediate postoperative pain. Buffering the anesthetic solution to physiologic pH and slow infiltration can reduce pain during infiltration.12 Distraction12 provided by ethyl chloride refrigerant spray, an air-cooling device,13 or vibration also can reduce pain during anesthesia.
Punch Biopsy and Excision Tips
The punch biopsy is a minimally invasive method for diagnosing various neoplastic and inflammatory nail unit conditions, except for pigmented lesions.12 For polydactylous nail conditions requiring biopsy, a digit on the nondominant hand should be selected if possible. The punch is applied directly to the nail plate and twisted with downward pressure until the bone is reached, with the instrument withdrawn slowly to prevent surrounding nail plate detachment. Hemostasis is easily achieved with direct pressure and/or use of epinephrine or ropivacaine during anesthesia, and a digital tourniquet generally is not required. Applying microporous polysaccharide hemospheres powder14 or kaolin-impregnated gauze15 with direct pressure is helpful in managing continued bleeding following nail surgery. Punching through the proximal nail matrix should be avoided to prevent permanent onychodystrophy.
A tangential matrix shave biopsy requires a more practiced technique and is preferred for sampling longitudinal melanonychia. A partial proximal nail plate avulsion adequately exposes the origin of pigment and avoids complete avulsion, which may cause more onychodystrophy.16 For broad erythronychia, a total nail avulsion may be necessary. For narrow, well-defined erythronychia, a less-invasive approach such as trap-door avulsion, longitudinal nail strip, or lateral nail plate curl, depending on the etiology, often is sufficient. Tissue excision should be tailored to the specific etiology, with localized excision sufficient for glomus tumors; onychopapillomas require tangential excision of the distal matrix, entire nail bed, and hyperkeratotic papule at the hyponychium. Pushing the cuticle with an elevator/spatula instead of making 2 tangential incisions on the proximal nail fold has been suggested to decrease postoperative paronychia risk.12 A Teflon-coated blade is used to achieve a smooth cut with minimal drag, enabling collection of specimens less than 1 mm thick, which provides sufficient nail matrix epithelium and dermis for histologic examination.16 After obtaining the specimen, the avulsed nail plate may be sutured back to the nail bed using a rapidly absorbable suture such as polyglactin 910, serving as a temporary biological dressing and splint for the nail unit during healing.12 In a retrospective study of 30 patients with longitudinal melanonychia undergoing tangential matrix excision, 27% (8/30) developed postoperative onychodystrophy.17 Although this technique carries relatively lower risk of permanent onychodystrophy compared to other methods, it still is important to acknowledge during the preoperative consent process.12
The lateral longitudinal excision is a valuable technique for diagnosing nail unit inflammatory conditions. Classically, a longitudinal sample including the proximal nail fold, complete matrix, lateral plate, lateral nail fold, hyponychium, and distal tip skin is obtained, with a 10% narrowing of the nail plate expected. If the lateral horn of the nail matrix is missed, permanent lateral malalignment and spicule formation are potential risks. To minimize narrowing of the nail plate and postoperative paronychia, a longitudinal nail strip—where the proximal nail fold and matrix are left intact—is an alternative technique.18
Pain Management Approaches
Appropriate postoperative pain management is crucial for optimizing patient outcomes. In a prospective study of 20 patients undergoing nail biopsy, the mean pain score 6 to 12 hours postprocedure was 5.7 on a scale of 0 to 10. Patients with presurgery pain vs those without experienced significantly higher pain levels both during anesthesia and after surgery (both P<.05).19 Therefore, a personalized approach to pain management based on presence of presurgical pain is warranted. In a randomized clinical trial of 16 patients anesthetized with lidocaine 2% and intraoperative infiltration with a combination of ropivacaine 0.5 mL and triamcinolone (10 mg/mL [0.5 mL]) vs lidocaine 2% alone, the intraoperative mixture reduced postoperative pain (mean pain score, 2 of 10 at 48 hours postprocedure vs 7.88 of 10 in the control group [P<.001]).20
A Cochrane review of 4 unpublished dental and orthopedic surgery studies showed that gabapentin is superior to placebo in the treatment of acute postoperative pain. Therefore, a single dose of gabapentin (250 mg) may be considered in patients at risk for high postoperative pain.21 In a randomized double-blind trial of 210 Mohs micrographic surgery patients, those receiving acetaminophen and ibuprofen reported lower pain scores at 2, 4, 8, and 12 hours postprocedure compared with patients taking acetaminophen and codeine or acetaminophen alone.22 However, the role of opioids in pain management following nail surgery has not been adequately studied.
Wound Care
An efficient dressing protects the surgical wound, facilitates healing, and provides comfort. In our experience, an initial layer of petrolatum-impregnated gauze followed by a pressure-padded bandage consisting of folded dry gauze secured in place with longitudinally applied tape to avoid a tourniquet effect is effective for nail surgical wounds. As the last step, self-adherent elastic wrap is applied around the digit and extended proximally to prevent a tourniquet effect.23
Final Thoughts
Due to the intricate anatomy of the nail unit, nail surgeries are inherently more invasive than most dermatologic surgical procedures. It is crucial to adopt a minimally invasive approach to reduce tissue damage and potential complications in both the short-term and long-term. Adopting this approach may substantially improve patient outcomes and enhance diagnostic and treatment efficacy.
- Ricardo JW, Lipner SR. Nail surgery myths and truths. J Drugs Dermatol. 2020;19:230-234.
- Lee EH, Nehal KS, Dusza SW, et al. Procedural dermatology training during dermatology residency: a survey of third-year dermatology residents. J Am Acad Dermatol. 2011;64:475-483.E4835. doi:10.1016/j.jaad.2010.05.044
- Wang Y, Lipner SR. Retrospective analysis of nail biopsies performed using the Medicare Provider Utilization and Payment Database 2012 to 2017. Dermatol Ther. 2021;34:E14928. doi:10.1111/dth.14928
- Ishack S, Lipner SR. Evaluating the impact and educational value of YouTube videos on nail biopsy procedures. Cutis. 2020;105:148-149, E1.
- Göktay F, Altan ZM, Talas A, et al. Anxiety among patients undergoing nail surgery and skin punch biopsy: effects of age, gender, educational status, and previous experience. J Cutan Med Surg. 2016;20:35-39. doi:10.1177/1203475415588645
- Lipner SR. Pain-minimizing strategies for nail surgery. Cutis. 2018;101:76-77.
- Ricardo JW, Lipner SR. Utilizing a sleep mask to reduce patient anxiety during nail surgery. Cutis. 2021;108:36. doi:10.12788/cutis.0285
- Ricardo JW, Lipner SR. Utilization of a stress ball to diminish anxiety during nail surgery. Cutis. 2020;105:294.
- Vachiramon V, Sobanko JF, Rattanaumpawan P, et al. Music reduces patient anxiety during Mohs surgery: an open-label randomized controlled trial. Dermatol Surg. 2013;39:298-305. doi:10.1111/dsu.12047
- Higgins S, Feinstein S, Hawkins M, et al. Virtual reality to improve the experience of the Mohs patient—a prospective interventional study. Dermatol Surg. 2019;45:1009-1018. doi:10.1097/DSS.0000000000001854
- Jellinek NJ, Vélez NF. Nail surgery: best way to obtain effective anesthesia. Dermatol Clin. 2015;33:265-271. doi:10.1016/j.det.2014.12.007
- Baltz JO, Jellinek NJ. Nail surgery: six essential techniques. Dermatol Clin. 2021;39:305-318. doi:10.1016/j.det.2020.12.015
- Ricardo JW, Lipner SR. Air cooling for improved analgesia during local anesthetic infiltration for nail surgery. J Am Acad Dermatol. 2021;84:E231-E232. doi:10.1016/j.jaad.2019.11.032
- Ricardo JW, Lipner SR. Microporous polysaccharide hemospheres powder for hemostasis following nail surgery [published online March 26, 2021]. J Am Acad Dermatol. doi:10.1016/j.jaad.2021.03.069
- Ricardo JW, Lipner SR. Kaolin-impregnated gauze for hemostasis following nail surgery. J Am Acad Dermatol. 2021;85:E13-E14. doi:10.1016/j.jaad.2020.02.008
- Jellinek N. Nail matrix biopsy of longitudinal melanonychia: diagnostic algorithm including the matrix shave biopsy. J Am Acad Dermatol. 2007;56:803-810. doi:10.1016/j.jaad.2006.12.001
- Richert B, Theunis A, Norrenberg S, et al. Tangential excision of pigmented nail matrix lesions responsible for longitudinal melanonychia: evaluation of the technique on a series of 30 patients. J Am Acad Dermatol. 2013;69:96-104. doi:10.1016/j.jaad.2013.01.029
- Godse R, Jariwala N, Rubin AI. How we do it: the longitudinal nail strip biopsy for nail unit inflammatory dermatoses. Dermatol Surg. 2023;49:311-313. doi:10.1097/DSS.0000000000003707
- Ricardo JW, Qiu Y, Lipner SR. Longitudinal perioperative pain assessment in nail surgery. J Am Acad Dermatol. 2022;87:874-876. doi:10.1016/j.jaad.2021.11.042
- Di Chiacchio N, Ocampo-Garza J, Villarreal-Villarreal CD, et al. Post-nail procedure analgesia: a randomized control pilot study. J Am Acad Dermatol. 2019;81:860-862. doi:10.1016/j.jaad.2019.05.015
- Straube S, Derry S, Moore RA, et al. Single dose oral gabapentin for established acute postoperative pain in adults [published online May 12, 2010]. Cochrane Database Syst Rev. 2010;2010:CD008183. doi:10.1002/14651858.CD008183.pub2
- Sniezek PJ, Brodland DG, Zitelli JA. A randomized controlled trial comparing acetaminophen, acetaminophen and ibuprofen, and acetaminophen and codeine for postoperative pain relief after Mohs surgery and cutaneous reconstruction. Dermatol Surg. 2011;37:1007-1013. doi:10.1111/j.1524-4725.2011.02022.x
- Ricardo JW, Lipner SR. How we do it: pressure-padded dressing with self-adherent elastic wrap for wound care after nail surgery. Dermatol Surg. 2021;47:442-444. doi:10.1097/DSS.0000000000002371
- Ricardo JW, Lipner SR. Nail surgery myths and truths. J Drugs Dermatol. 2020;19:230-234.
- Lee EH, Nehal KS, Dusza SW, et al. Procedural dermatology training during dermatology residency: a survey of third-year dermatology residents. J Am Acad Dermatol. 2011;64:475-483.E4835. doi:10.1016/j.jaad.2010.05.044
- Wang Y, Lipner SR. Retrospective analysis of nail biopsies performed using the Medicare Provider Utilization and Payment Database 2012 to 2017. Dermatol Ther. 2021;34:E14928. doi:10.1111/dth.14928
- Ishack S, Lipner SR. Evaluating the impact and educational value of YouTube videos on nail biopsy procedures. Cutis. 2020;105:148-149, E1.
- Göktay F, Altan ZM, Talas A, et al. Anxiety among patients undergoing nail surgery and skin punch biopsy: effects of age, gender, educational status, and previous experience. J Cutan Med Surg. 2016;20:35-39. doi:10.1177/1203475415588645
- Lipner SR. Pain-minimizing strategies for nail surgery. Cutis. 2018;101:76-77.
- Ricardo JW, Lipner SR. Utilizing a sleep mask to reduce patient anxiety during nail surgery. Cutis. 2021;108:36. doi:10.12788/cutis.0285
- Ricardo JW, Lipner SR. Utilization of a stress ball to diminish anxiety during nail surgery. Cutis. 2020;105:294.
- Vachiramon V, Sobanko JF, Rattanaumpawan P, et al. Music reduces patient anxiety during Mohs surgery: an open-label randomized controlled trial. Dermatol Surg. 2013;39:298-305. doi:10.1111/dsu.12047
- Higgins S, Feinstein S, Hawkins M, et al. Virtual reality to improve the experience of the Mohs patient—a prospective interventional study. Dermatol Surg. 2019;45:1009-1018. doi:10.1097/DSS.0000000000001854
- Jellinek NJ, Vélez NF. Nail surgery: best way to obtain effective anesthesia. Dermatol Clin. 2015;33:265-271. doi:10.1016/j.det.2014.12.007
- Baltz JO, Jellinek NJ. Nail surgery: six essential techniques. Dermatol Clin. 2021;39:305-318. doi:10.1016/j.det.2020.12.015
- Ricardo JW, Lipner SR. Air cooling for improved analgesia during local anesthetic infiltration for nail surgery. J Am Acad Dermatol. 2021;84:E231-E232. doi:10.1016/j.jaad.2019.11.032
- Ricardo JW, Lipner SR. Microporous polysaccharide hemospheres powder for hemostasis following nail surgery [published online March 26, 2021]. J Am Acad Dermatol. doi:10.1016/j.jaad.2021.03.069
- Ricardo JW, Lipner SR. Kaolin-impregnated gauze for hemostasis following nail surgery. J Am Acad Dermatol. 2021;85:E13-E14. doi:10.1016/j.jaad.2020.02.008
- Jellinek N. Nail matrix biopsy of longitudinal melanonychia: diagnostic algorithm including the matrix shave biopsy. J Am Acad Dermatol. 2007;56:803-810. doi:10.1016/j.jaad.2006.12.001
- Richert B, Theunis A, Norrenberg S, et al. Tangential excision of pigmented nail matrix lesions responsible for longitudinal melanonychia: evaluation of the technique on a series of 30 patients. J Am Acad Dermatol. 2013;69:96-104. doi:10.1016/j.jaad.2013.01.029
- Godse R, Jariwala N, Rubin AI. How we do it: the longitudinal nail strip biopsy for nail unit inflammatory dermatoses. Dermatol Surg. 2023;49:311-313. doi:10.1097/DSS.0000000000003707
- Ricardo JW, Qiu Y, Lipner SR. Longitudinal perioperative pain assessment in nail surgery. J Am Acad Dermatol. 2022;87:874-876. doi:10.1016/j.jaad.2021.11.042
- Di Chiacchio N, Ocampo-Garza J, Villarreal-Villarreal CD, et al. Post-nail procedure analgesia: a randomized control pilot study. J Am Acad Dermatol. 2019;81:860-862. doi:10.1016/j.jaad.2019.05.015
- Straube S, Derry S, Moore RA, et al. Single dose oral gabapentin for established acute postoperative pain in adults [published online May 12, 2010]. Cochrane Database Syst Rev. 2010;2010:CD008183. doi:10.1002/14651858.CD008183.pub2
- Sniezek PJ, Brodland DG, Zitelli JA. A randomized controlled trial comparing acetaminophen, acetaminophen and ibuprofen, and acetaminophen and codeine for postoperative pain relief after Mohs surgery and cutaneous reconstruction. Dermatol Surg. 2011;37:1007-1013. doi:10.1111/j.1524-4725.2011.02022.x
- Ricardo JW, Lipner SR. How we do it: pressure-padded dressing with self-adherent elastic wrap for wound care after nail surgery. Dermatol Surg. 2021;47:442-444. doi:10.1097/DSS.0000000000002371
Evaluation of Micrographic Surgery and Dermatologic Oncology Fellowship Program Websites
To the Editor:
Micrographic surgery and dermatologic oncology (MSDO) is a highly competitive subspecialty fellowship in dermatology. Prospective applicants often depend on the Internet to obtain pertinent information about fellowship programs to navigate the application process. An up-to-date and comprehensive fellowship website has the potential to be advantageous for both applicants and programs—applicants can more readily identify programs that align with their goals and values, and programs can effectively attract compatible applicants. These advantages are increasingly relevant with the virtual application process that has become essential considering the COVID-19 pandemic. At the height of the COVID-19 pandemic in 2020, we sought to evaluate the comprehensiveness of the content of Accreditation Council for Graduate Medical Education (ACGME) MSDO fellowship program websites to identify possible areas for improvement.
We obtained a list of all ACGME MSDO fellowships from the ACGME website (https://www.acgme.org/) and verified it against the list of MSDO programs in FREIDA, the American Medical Association residency and fellowship database (https://freida.ama-assn.org/). All programs without a website were excluded from further analysis. All data collection from currently accessible fellowship websites and evaluation occurred in April 2020.
The remaining MSDO fellowship program websites were evaluated using 25 criteria distributed among 5 domains: education/research, clinical training, program information, application process, and incentives. These criteria were determined based on earlier studies that similarly evaluated the website content of fellowship programs with inclusion of information that was considered valuable in the appraisal of fellowship programs.1,2 Criteria were further refined by direct consideration of relevance and importance to MSDO fellowship applicants (eg, inclusion of case volume, exclusion of call schedule).
Each criterion was independently assessed by 2 investigators (J.Y.C. and S.J.E.S.). A third investigator (J.R.P.) then independently evaluated those 2 assessments for agreement. Where disagreement was discovered, the third evaluator (J.R.P.) provided a final appraisal. Cohen’s kappa (κ) was conducted to evaluate for concordance between the 2 primary website evaluators. We found there to be substantial agreement between the reviewers within the education/research (κ [SD]=0.772 [0.077]), clinical training (κ [SD]=0.740 [0.051]), application process (κ [SD]=0.726 [0.103]), and incentives domains (κ [SD]=0.730 [0.110]). There was moderate agreement (κ [SD]=0.603 [0.128]) between the reviewers within the program information domain.
We identified 77 active MSDO fellowship programs. Sixty of those 77 programs (77.9%) had a dedicated fellowship website that was readily accessible. Most programs that had a dedicated fellowship website had a core or affiliated residency program (49/60 [81.7%]).
Websites that we evaluated fulfilled a mean (SD) of 9.37 (4.17) of the 25 identified criteria. Only 13 of 60 (21.7%) websites fulfilled more than 50% of evaluated criteria.
There was no statistical difference in the number of criteria fulfilled based on whether the fellowship program had a core or affiliated residency program.
Upon reviewing website accessibility directly from FREIDA, only 5 of 60 programs (8.3%) provided applicants with a link directly to their fellowship page (Table). Most programs (41 [68.3%]) provided a link to the dermatology department website, not to the specific fellowship program page, thus requiring a multistep process to find the fellowship-specific page. The remaining programs had an inaccessible (4 [6.7%]) or absent (10 [16.7%]) link on FREIDA, though a fellowship website could be identified by an Internet search of the program name.
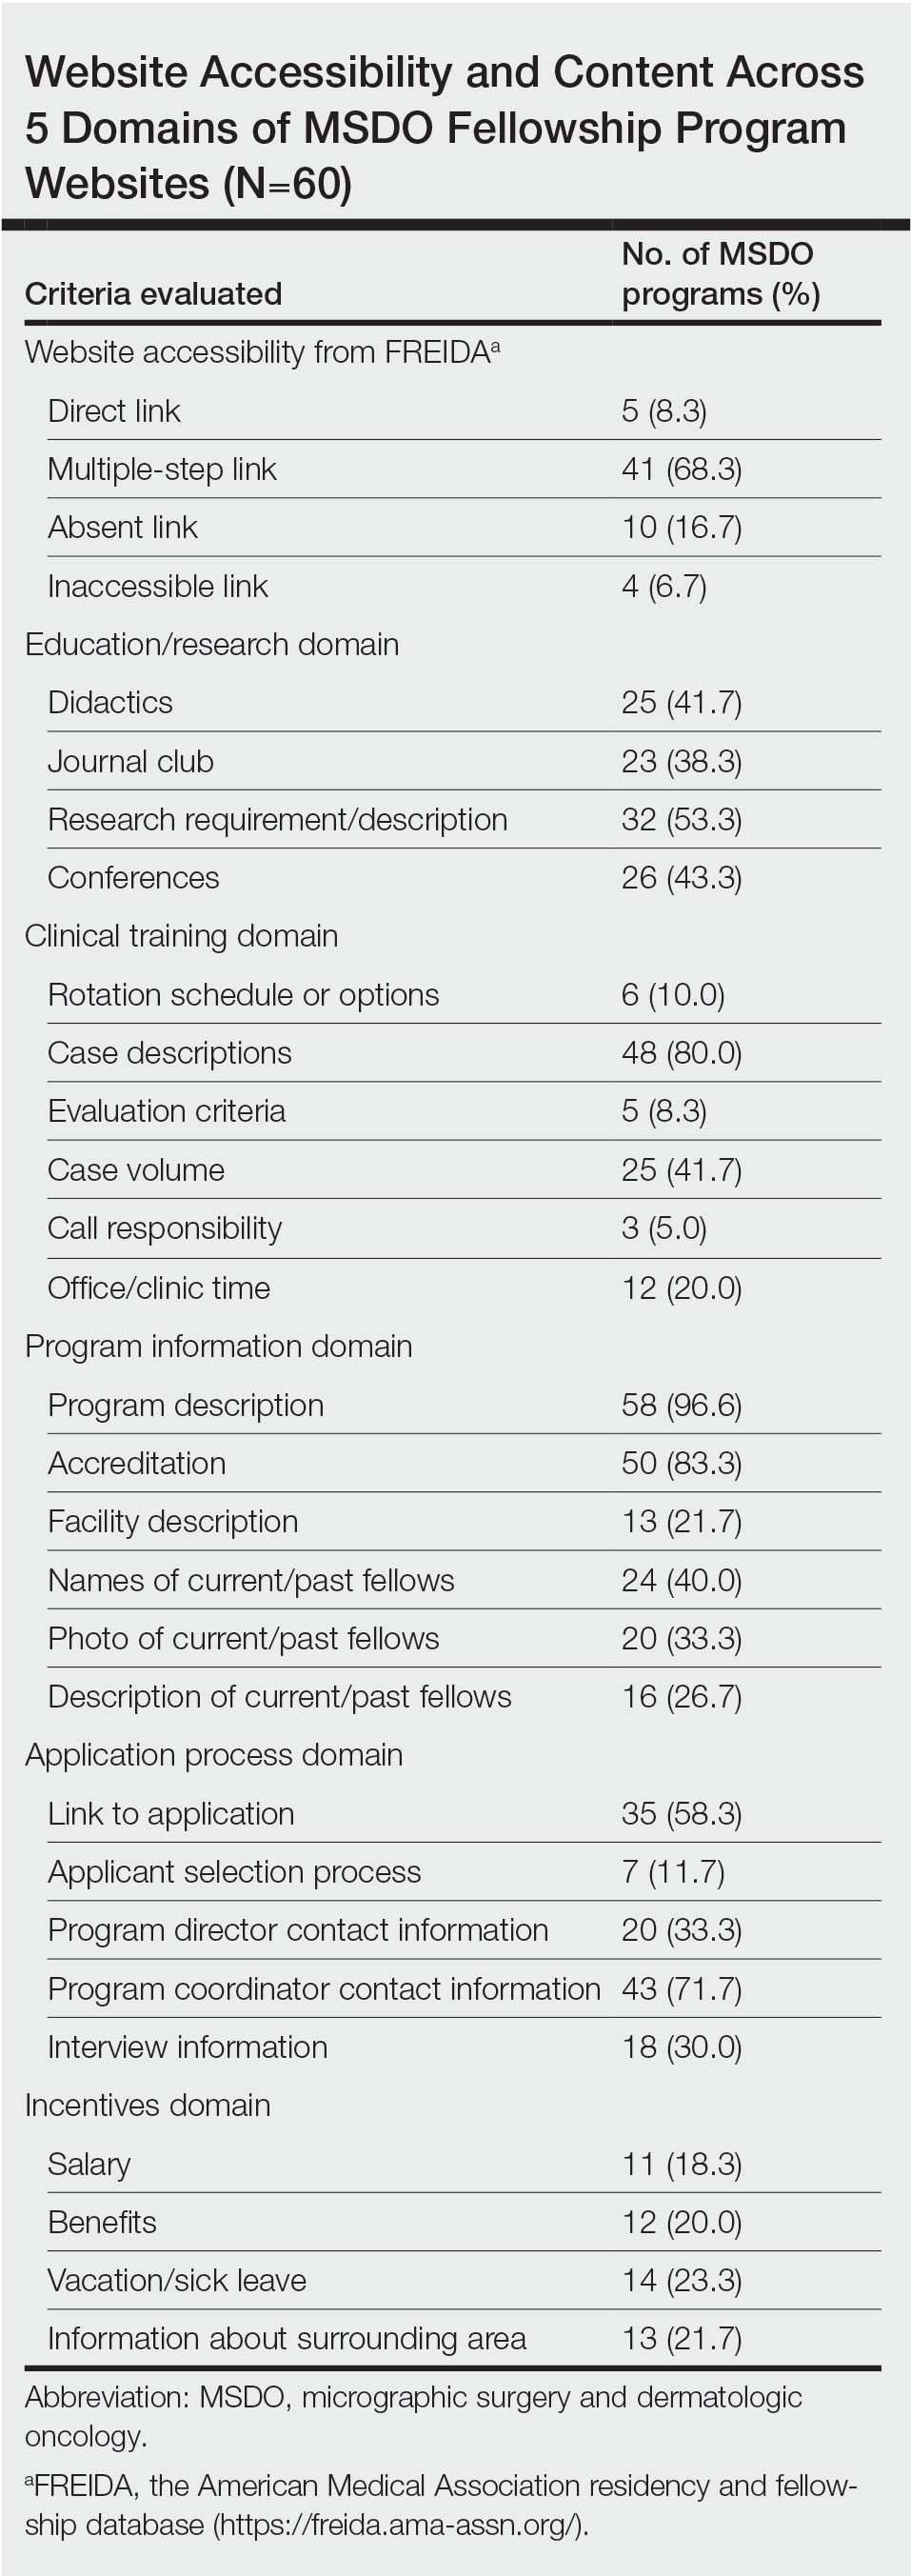
The domain most fulfilled was program information with an average of 51.1% of programs satisfying the criteria, whereas the incentives domain was least fulfilled with an average of only 20.8% of programs satisfying the criteria. Across the various criteria, websites more often included a description of the program (58 [96.6%]), mentioned accreditation (53 [88.3%]), and provided case descriptions (48 [80.0%]). They less often reported information regarding a fellow’s call responsibility (3 [5%]); evaluation criteria (5 [8.3%]); and rotation schedule or options (6 [10.0%]).
The highest number of criteria fulfilled by a single program was 19 (76%). The lowest number of criteria met was 2 (8%). These findings suggest a large variation in comprehensiveness across fellowship websites.
Our research suggests that many current MSDO fellowship programs have room to maximize the information provided to applicants through their websites, which is particularly relevant following the COVID-19 pandemic, as the value of providing comprehensive and transparent information through an online platform is greater than ever. Given the ongoing desire to limit travel, virtual methods for navigating the application process have been readily used, including online videoconferencing for interviews and virtual program visits. This scenario has placed applicants in a challenging situation—their ability to directly evaluate their compatibility with a given program has been limited.3
Earlier studies that analyzed rheumatology fellowship recruitment during the COVID-19 pandemic found that programs may have more difficulty highlighting the strengths of their institution (eg, clinical facilities, professional opportunities, educational environment).4 An updated and comprehensive fellowship website was recommended4 as a key part in facing these new challenges. On the other hand, given the large number of applicants each year for fellowship positions in any given program, we acknowledge the potential benefit programs may obtain from limiting electronic information that is readily accessible to all applicants, as doing so may encourage applicants to communicate directly with a program and allow programs to identify candidates who are more interested.
In light of the movement to a more virtual-friendly and technology-driven fellowship application process, we identified 25 content areas that fellowships may want to include on their websites so that potential applicants can be well informed about the program before submitting an application and scheduling an interview. Efforts to improve accessibility and maximize the content of these websites may help programs attract compatible candidates, improve transparency, and guide applicants throughout the application process.
- Lu F, Vijayasarathi A, Murray N, et al. Evaluation of pediatric radiology fellowship website content in USA and Canada. Curr Prob Diagn Radiol. 2021;50:151-155. doi:10.1067/j.cpradiol.2020.01.007
- Cantrell CK, Bergstresser SL, Schuh AC, et al. Accessibility and content of abdominal transplant fellowship program websites in the United States. J Surg Res. 2018;232:271-274. doi:10.1016/j.jss.2018.06.052
- Nesemeier BR, Lebo NL, Schmalbach CE, et al. Impact of the COVID-19 global pandemic on the otolaryngology fellowship application process. Otolaryngol Head Neck Surg. 2020;163:712-713. doi:10.1177/0194599820934370
- Kilian A, Dua AB, Bolster MB, et al. Rheumatology fellowship recruitment in 2020: benefits, challenges, and adaptations. Arthritis Care Res (Hoboken). 2021;73:459-461. doi:10.1002/acr.24445
To the Editor:
Micrographic surgery and dermatologic oncology (MSDO) is a highly competitive subspecialty fellowship in dermatology. Prospective applicants often depend on the Internet to obtain pertinent information about fellowship programs to navigate the application process. An up-to-date and comprehensive fellowship website has the potential to be advantageous for both applicants and programs—applicants can more readily identify programs that align with their goals and values, and programs can effectively attract compatible applicants. These advantages are increasingly relevant with the virtual application process that has become essential considering the COVID-19 pandemic. At the height of the COVID-19 pandemic in 2020, we sought to evaluate the comprehensiveness of the content of Accreditation Council for Graduate Medical Education (ACGME) MSDO fellowship program websites to identify possible areas for improvement.
We obtained a list of all ACGME MSDO fellowships from the ACGME website (https://www.acgme.org/) and verified it against the list of MSDO programs in FREIDA, the American Medical Association residency and fellowship database (https://freida.ama-assn.org/). All programs without a website were excluded from further analysis. All data collection from currently accessible fellowship websites and evaluation occurred in April 2020.
The remaining MSDO fellowship program websites were evaluated using 25 criteria distributed among 5 domains: education/research, clinical training, program information, application process, and incentives. These criteria were determined based on earlier studies that similarly evaluated the website content of fellowship programs with inclusion of information that was considered valuable in the appraisal of fellowship programs.1,2 Criteria were further refined by direct consideration of relevance and importance to MSDO fellowship applicants (eg, inclusion of case volume, exclusion of call schedule).
Each criterion was independently assessed by 2 investigators (J.Y.C. and S.J.E.S.). A third investigator (J.R.P.) then independently evaluated those 2 assessments for agreement. Where disagreement was discovered, the third evaluator (J.R.P.) provided a final appraisal. Cohen’s kappa (κ) was conducted to evaluate for concordance between the 2 primary website evaluators. We found there to be substantial agreement between the reviewers within the education/research (κ [SD]=0.772 [0.077]), clinical training (κ [SD]=0.740 [0.051]), application process (κ [SD]=0.726 [0.103]), and incentives domains (κ [SD]=0.730 [0.110]). There was moderate agreement (κ [SD]=0.603 [0.128]) between the reviewers within the program information domain.
We identified 77 active MSDO fellowship programs. Sixty of those 77 programs (77.9%) had a dedicated fellowship website that was readily accessible. Most programs that had a dedicated fellowship website had a core or affiliated residency program (49/60 [81.7%]).
Websites that we evaluated fulfilled a mean (SD) of 9.37 (4.17) of the 25 identified criteria. Only 13 of 60 (21.7%) websites fulfilled more than 50% of evaluated criteria.
There was no statistical difference in the number of criteria fulfilled based on whether the fellowship program had a core or affiliated residency program.
Upon reviewing website accessibility directly from FREIDA, only 5 of 60 programs (8.3%) provided applicants with a link directly to their fellowship page (Table). Most programs (41 [68.3%]) provided a link to the dermatology department website, not to the specific fellowship program page, thus requiring a multistep process to find the fellowship-specific page. The remaining programs had an inaccessible (4 [6.7%]) or absent (10 [16.7%]) link on FREIDA, though a fellowship website could be identified by an Internet search of the program name.
The domain most fulfilled was program information with an average of 51.1% of programs satisfying the criteria, whereas the incentives domain was least fulfilled with an average of only 20.8% of programs satisfying the criteria. Across the various criteria, websites more often included a description of the program (58 [96.6%]), mentioned accreditation (53 [88.3%]), and provided case descriptions (48 [80.0%]). They less often reported information regarding a fellow’s call responsibility (3 [5%]); evaluation criteria (5 [8.3%]); and rotation schedule or options (6 [10.0%]).
The highest number of criteria fulfilled by a single program was 19 (76%). The lowest number of criteria met was 2 (8%). These findings suggest a large variation in comprehensiveness across fellowship websites.
Our research suggests that many current MSDO fellowship programs have room to maximize the information provided to applicants through their websites, which is particularly relevant following the COVID-19 pandemic, as the value of providing comprehensive and transparent information through an online platform is greater than ever. Given the ongoing desire to limit travel, virtual methods for navigating the application process have been readily used, including online videoconferencing for interviews and virtual program visits. This scenario has placed applicants in a challenging situation—their ability to directly evaluate their compatibility with a given program has been limited.3
Earlier studies that analyzed rheumatology fellowship recruitment during the COVID-19 pandemic found that programs may have more difficulty highlighting the strengths of their institution (eg, clinical facilities, professional opportunities, educational environment).4 An updated and comprehensive fellowship website was recommended4 as a key part in facing these new challenges. On the other hand, given the large number of applicants each year for fellowship positions in any given program, we acknowledge the potential benefit programs may obtain from limiting electronic information that is readily accessible to all applicants, as doing so may encourage applicants to communicate directly with a program and allow programs to identify candidates who are more interested.
In light of the movement to a more virtual-friendly and technology-driven fellowship application process, we identified 25 content areas that fellowships may want to include on their websites so that potential applicants can be well informed about the program before submitting an application and scheduling an interview. Efforts to improve accessibility and maximize the content of these websites may help programs attract compatible candidates, improve transparency, and guide applicants throughout the application process.
To the Editor:
Micrographic surgery and dermatologic oncology (MSDO) is a highly competitive subspecialty fellowship in dermatology. Prospective applicants often depend on the Internet to obtain pertinent information about fellowship programs to navigate the application process. An up-to-date and comprehensive fellowship website has the potential to be advantageous for both applicants and programs—applicants can more readily identify programs that align with their goals and values, and programs can effectively attract compatible applicants. These advantages are increasingly relevant with the virtual application process that has become essential considering the COVID-19 pandemic. At the height of the COVID-19 pandemic in 2020, we sought to evaluate the comprehensiveness of the content of Accreditation Council for Graduate Medical Education (ACGME) MSDO fellowship program websites to identify possible areas for improvement.
We obtained a list of all ACGME MSDO fellowships from the ACGME website (https://www.acgme.org/) and verified it against the list of MSDO programs in FREIDA, the American Medical Association residency and fellowship database (https://freida.ama-assn.org/). All programs without a website were excluded from further analysis. All data collection from currently accessible fellowship websites and evaluation occurred in April 2020.
The remaining MSDO fellowship program websites were evaluated using 25 criteria distributed among 5 domains: education/research, clinical training, program information, application process, and incentives. These criteria were determined based on earlier studies that similarly evaluated the website content of fellowship programs with inclusion of information that was considered valuable in the appraisal of fellowship programs.1,2 Criteria were further refined by direct consideration of relevance and importance to MSDO fellowship applicants (eg, inclusion of case volume, exclusion of call schedule).
Each criterion was independently assessed by 2 investigators (J.Y.C. and S.J.E.S.). A third investigator (J.R.P.) then independently evaluated those 2 assessments for agreement. Where disagreement was discovered, the third evaluator (J.R.P.) provided a final appraisal. Cohen’s kappa (κ) was conducted to evaluate for concordance between the 2 primary website evaluators. We found there to be substantial agreement between the reviewers within the education/research (κ [SD]=0.772 [0.077]), clinical training (κ [SD]=0.740 [0.051]), application process (κ [SD]=0.726 [0.103]), and incentives domains (κ [SD]=0.730 [0.110]). There was moderate agreement (κ [SD]=0.603 [0.128]) between the reviewers within the program information domain.
We identified 77 active MSDO fellowship programs. Sixty of those 77 programs (77.9%) had a dedicated fellowship website that was readily accessible. Most programs that had a dedicated fellowship website had a core or affiliated residency program (49/60 [81.7%]).
Websites that we evaluated fulfilled a mean (SD) of 9.37 (4.17) of the 25 identified criteria. Only 13 of 60 (21.7%) websites fulfilled more than 50% of evaluated criteria.
There was no statistical difference in the number of criteria fulfilled based on whether the fellowship program had a core or affiliated residency program.
Upon reviewing website accessibility directly from FREIDA, only 5 of 60 programs (8.3%) provided applicants with a link directly to their fellowship page (Table). Most programs (41 [68.3%]) provided a link to the dermatology department website, not to the specific fellowship program page, thus requiring a multistep process to find the fellowship-specific page. The remaining programs had an inaccessible (4 [6.7%]) or absent (10 [16.7%]) link on FREIDA, though a fellowship website could be identified by an Internet search of the program name.
The domain most fulfilled was program information with an average of 51.1% of programs satisfying the criteria, whereas the incentives domain was least fulfilled with an average of only 20.8% of programs satisfying the criteria. Across the various criteria, websites more often included a description of the program (58 [96.6%]), mentioned accreditation (53 [88.3%]), and provided case descriptions (48 [80.0%]). They less often reported information regarding a fellow’s call responsibility (3 [5%]); evaluation criteria (5 [8.3%]); and rotation schedule or options (6 [10.0%]).
The highest number of criteria fulfilled by a single program was 19 (76%). The lowest number of criteria met was 2 (8%). These findings suggest a large variation in comprehensiveness across fellowship websites.
Our research suggests that many current MSDO fellowship programs have room to maximize the information provided to applicants through their websites, which is particularly relevant following the COVID-19 pandemic, as the value of providing comprehensive and transparent information through an online platform is greater than ever. Given the ongoing desire to limit travel, virtual methods for navigating the application process have been readily used, including online videoconferencing for interviews and virtual program visits. This scenario has placed applicants in a challenging situation—their ability to directly evaluate their compatibility with a given program has been limited.3
Earlier studies that analyzed rheumatology fellowship recruitment during the COVID-19 pandemic found that programs may have more difficulty highlighting the strengths of their institution (eg, clinical facilities, professional opportunities, educational environment).4 An updated and comprehensive fellowship website was recommended4 as a key part in facing these new challenges. On the other hand, given the large number of applicants each year for fellowship positions in any given program, we acknowledge the potential benefit programs may obtain from limiting electronic information that is readily accessible to all applicants, as doing so may encourage applicants to communicate directly with a program and allow programs to identify candidates who are more interested.
In light of the movement to a more virtual-friendly and technology-driven fellowship application process, we identified 25 content areas that fellowships may want to include on their websites so that potential applicants can be well informed about the program before submitting an application and scheduling an interview. Efforts to improve accessibility and maximize the content of these websites may help programs attract compatible candidates, improve transparency, and guide applicants throughout the application process.
- Lu F, Vijayasarathi A, Murray N, et al. Evaluation of pediatric radiology fellowship website content in USA and Canada. Curr Prob Diagn Radiol. 2021;50:151-155. doi:10.1067/j.cpradiol.2020.01.007
- Cantrell CK, Bergstresser SL, Schuh AC, et al. Accessibility and content of abdominal transplant fellowship program websites in the United States. J Surg Res. 2018;232:271-274. doi:10.1016/j.jss.2018.06.052
- Nesemeier BR, Lebo NL, Schmalbach CE, et al. Impact of the COVID-19 global pandemic on the otolaryngology fellowship application process. Otolaryngol Head Neck Surg. 2020;163:712-713. doi:10.1177/0194599820934370
- Kilian A, Dua AB, Bolster MB, et al. Rheumatology fellowship recruitment in 2020: benefits, challenges, and adaptations. Arthritis Care Res (Hoboken). 2021;73:459-461. doi:10.1002/acr.24445
- Lu F, Vijayasarathi A, Murray N, et al. Evaluation of pediatric radiology fellowship website content in USA and Canada. Curr Prob Diagn Radiol. 2021;50:151-155. doi:10.1067/j.cpradiol.2020.01.007
- Cantrell CK, Bergstresser SL, Schuh AC, et al. Accessibility and content of abdominal transplant fellowship program websites in the United States. J Surg Res. 2018;232:271-274. doi:10.1016/j.jss.2018.06.052
- Nesemeier BR, Lebo NL, Schmalbach CE, et al. Impact of the COVID-19 global pandemic on the otolaryngology fellowship application process. Otolaryngol Head Neck Surg. 2020;163:712-713. doi:10.1177/0194599820934370
- Kilian A, Dua AB, Bolster MB, et al. Rheumatology fellowship recruitment in 2020: benefits, challenges, and adaptations. Arthritis Care Res (Hoboken). 2021;73:459-461. doi:10.1002/acr.24445
Practice Points
- With the COVID-19 pandemic and the movement to a virtual fellowship application process, fellowship program websites that are comprehensive and accessible may help programs attract compatible candidates, improve transparency, and guide applicants through the application process.
- There is variation in the content of current micrographic surgery and dermatologic oncology fellowship program websites and areas upon which programs may seek to augment their website content to better reflect program strengths while attracting competitive candidates best suited for their program.
Economic Burden and Quality of Life of Patients With Moderate to Severe Atopic Dermatitis in a Tertiary Care Hospital in Helsinki, Finland: A Survey-Based Study
Atopic dermatitis (AD) is a common inflammatory skin disease that may severely decrease quality of life (QOL) and lead to psychiatric comorbidities.1-3 Prior studies have indicated that AD causes a substantial economic burden, and disease severity has been proportionally linked to medical costs.4,5 Results of a multicenter cost-of-illness study from Germany estimated that a relapse of AD costs approximately €123 (US $136). The authors calculated the average annual cost of AD per patient to be €1425 (US $1580), whereas it is €956 (US $1060) in moderate disease and €2068 (US $2293) in severe disease (direct and indirect medical costs included).6 An observational cohort study from the Netherlands found that total direct cost per patient-year (PPY) was €4401 (US $4879) for patients with controlled AD vs €6993 (US $7756) for patients with uncontrolled AD.7
In a retrospective survey-based study, it was estimated that the annual cost of AD in Canada was approximately CAD $1.4 billion. The cost per patient varied from CAD $282 to CAD $1242 depending on disease severity.8 In another retrospective cohort study from the Netherlands, the average direct medical cost per patient with AD seeing a general practitioner was US $71 during follow-up in primary care. If the patient needed specialist consultation, the cost increased to an average of US $186.9
We aimed to assess the direct and indirect medical costs in adult patients with moderate to severe AD who attended a tertiary health care center in Finland. In addition, we evaluated the impact of AD on QOL in this patient cohort.
Methods
Study Design—Patients with AD who were treated at the Department of Dermatology and Allergology, Helsinki University Hospital, Finland, between February 2018 and December 2019 were randomly selected to participate in our survey study. All participants provided written informed consent. In Finland, patients with mild AD generally are treated in primary health care centers, and only patients with moderate to severe AD are referred to specialists and tertiary care centers. Patients were excluded if they were younger than 18 years, had AD confined to the hands, or reported the presence of other concomitant skin diseases that were being treated with topical or systemic therapies. The protocol for the study was approved by the local ethics committee of the University of Helsinki.
Questionnaire and Analysis of Disease Severity—The survey included the medical history, signs of atopy, former treatment(s) for AD, skin infections, visits to dermatologists or general practitioners, questions on mental health and hospitalization, and absence from work due to AD in the last 12 months. Disease severity was evaluated using the patient-oriented Rajka & Langeland eczema severity score and Patient Oriented Eczema Measure (POEM).10,11 The impact on QOL was evaluated by the Dermatology Life Quality Index (DLQI).12
Medication Costs—The cost of prescription drugs was based on data from the Finnish national electronic prescription center. In Finland, all prescriptions are made electronically in the database. We analyzed all topical medications (eg, topical corticosteroids [TCSs], topical calcineurin inhibitors [TCIs], and emollients) and systemic medicaments (eg, antibiotics, antihistamines, cyclosporine, methotrexate, and corticosteroids) prescribed for the treatment of AD. In Finland, dupilumab was introduced for the treatment of severe AD in early 2019, and patients receiving dupilumab were excluded from the study. Over-the-counter medications were not included. The costs for laboratory testing were estimations based on the standard monitoring protocols of the Helsinki University Hospital. All costs were based on the Finnish price level standard for the year 2019.
Inpatient/Outpatient Visits and Sick Leave Due to AD—The number of inpatient and outpatient visits due to AD in the last 12 months was evaluated. Outpatient specialist consultations or nurse appointments at Helsinki University Hospital were verified from electronic patient records. In addition, inpatient treatment and phototherapy sessions were calculated from the database.
We assessed the number of sick leave days from work or educational activities during the last year. All costs of transportation for doctors’ appointments, laboratory monitoring, and phototherapy treatments were summed together to estimate the total transportation cost. Visits to nurse and inpatient visits were not included in the total transportation cost because patients often were hospitalized directly after consultation visits, and nurse appointments often were combined with inpatient and outpatient visits. To calculate the total transportation cost, we used a rate of €0.43 per kilometer measured from the patients’ home addresses, which was the official compensation rate of the Finnish Tax Administration for 2019.13
Statistical Analysis—Statistical analyses were performed using SPSS Statistics 25 (IBM). Descriptive analyses were used to describe baseline characteristics and to evaluate the mean costs of AD. The patients were divided into 2 groups according to POEM: (1) controlled AD (patients with clear skin or only mild AD; POEM score 0–7) and (2) uncontrolled AD (patients with moderate to very severe AD; POEM score 8–28). The Mann-Whitney U statistic was used to evaluate differences between the study groups.
Results
Patient Characteristics—One hundred sixty-seven patients answered the survey, of which 69 (41.3%) were males and 98 (58.7%) were females. There were 16 patients with controlled AD and 148 patients with uncontrolled AD. Three patients did not answer to POEM and were excluded. The baseline characteristics are presented in Table 1 and include self-reported symptoms related to atopy.
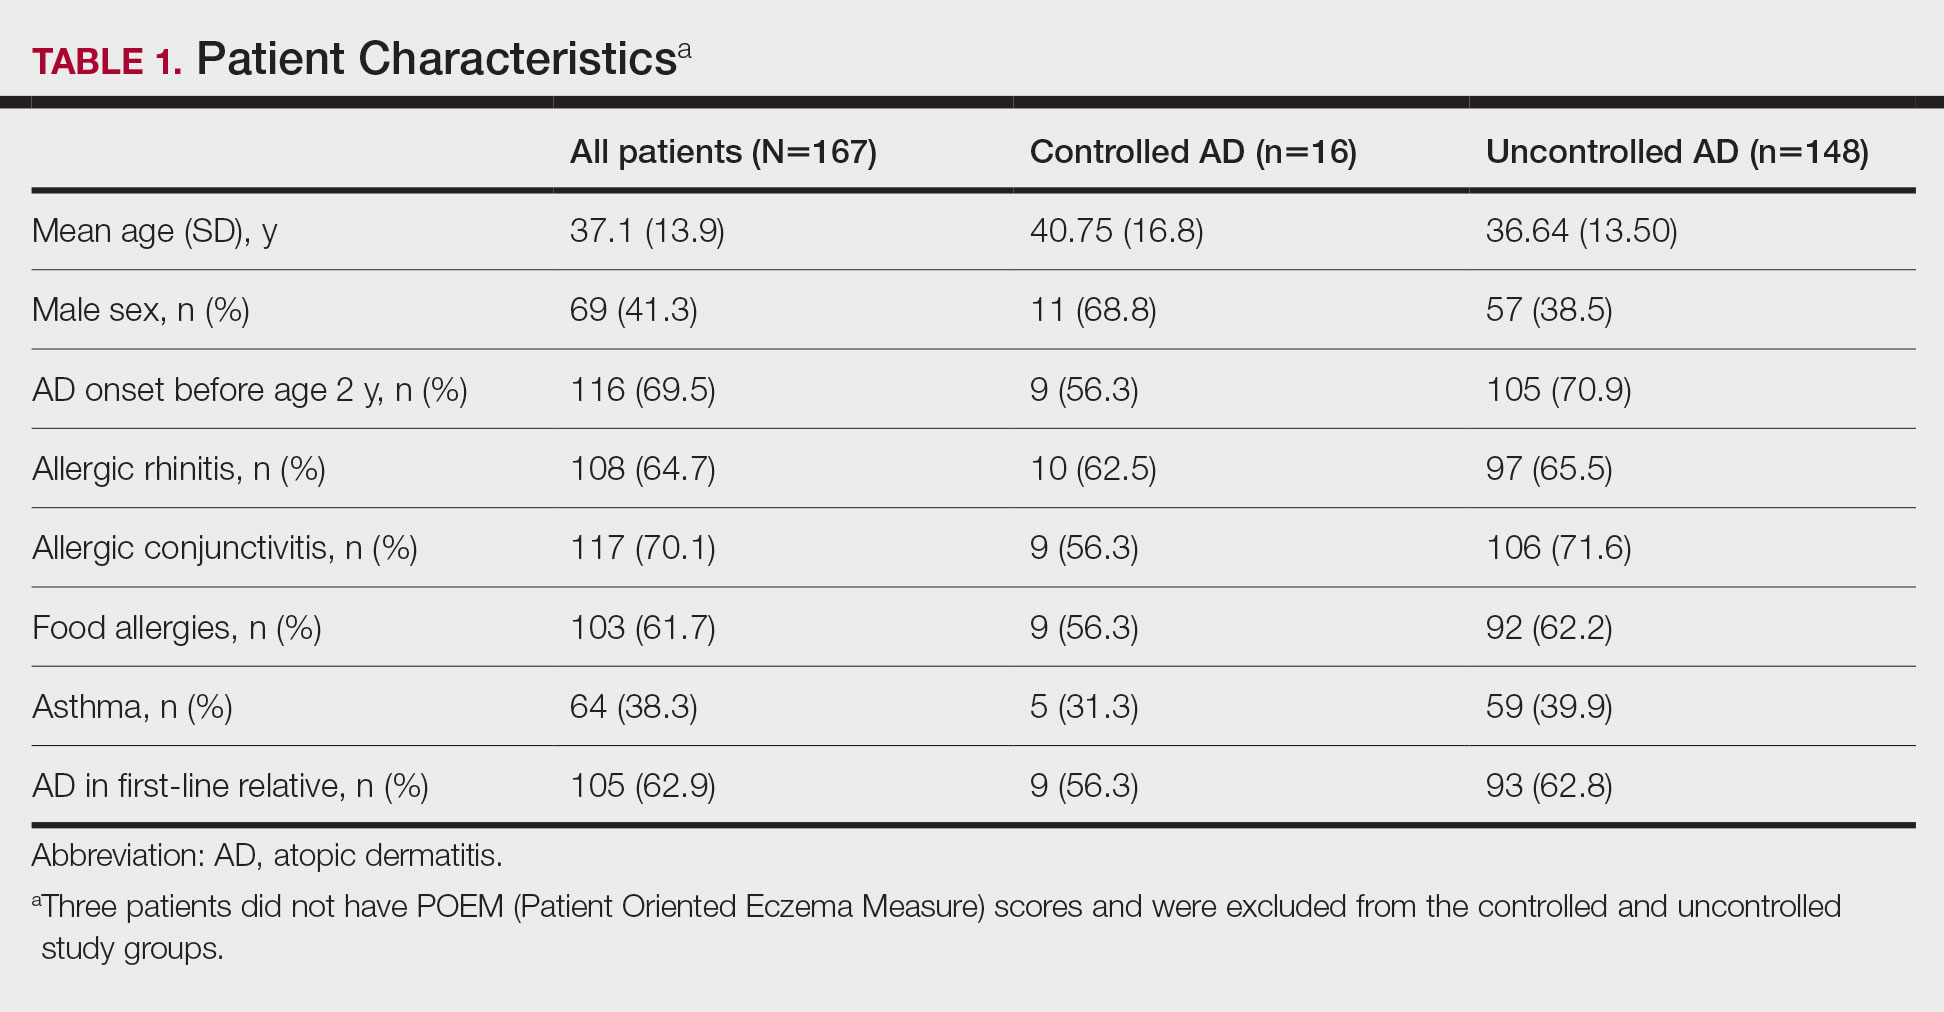
The most-used topical treatments were TCSs (n=155; 92.8%) and emollients (n=166; 99.4%). One hundred sixteen (69.5%) patients had used TCIs. The median amount of TCSs used was 300 g/y vs 30 g/y for TCIs (range, 0-5160 g/y) and 1200 g/y for emollients.
Fifteen (9.0%) patients had been hospitalized for AD in the last year. The mean (SD) length of hospitalization was 6.5 (2.8) days. Thirty-four (20.4%) patients received UVB phototherapy. Thirty-four (20.4%) patients were treated with at least 1 antibiotic course for secondary AD infection. Thirty-six (21.6%) patients needed at least 1 oral corticosteroid course for the treatment of an AD flare.
Fifteen (9.0%) patients reported a diagnosed psychiatric illness, and 17 (10.2%) patients were using prescription drugs for psychiatric illness. Forty-nine (29.3%) patients reported anxiety or depression often or very often, 54 (32.3%) patients reported sometimes, 33 (19.8%) patients reported rarely, and only 30 (18.0%) patients reported none.
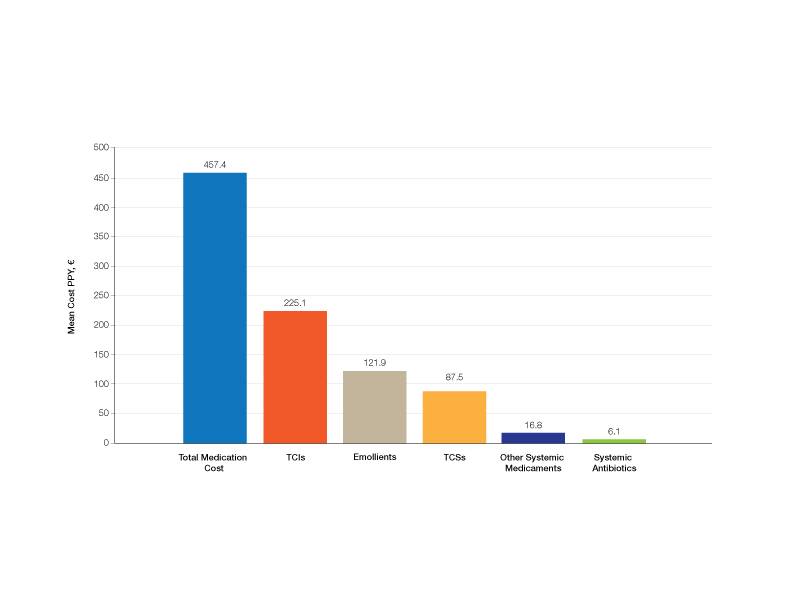
Medication Costs—Mean medication cost PPY was €457.40 (US $507.34)(Figure 1 and Table 2). On average, one patient spent €87.50 (US $97.05) for TCSs, €121.90 (US $135.21) for emollients, and €225.10 (US $249.68) for TCIs. The average cost PPY for antibiotics was €6.10 (US $6.77). Other systemic treatments, including (US $18.65). Seventeen patients (10.2%) were on methotrexate therapy for AD in the last year, and 1 patient also used cyclosporine. The costs for laboratory monitoring in these patients were included in the direct cost calculations. The mean cost PPY of laboratory monitoring in the whole study cohort was €6.60 (US $7.32). In patients with systemic immunosuppressive therapy, the mean cost PPY for laboratory monitoring was €65.00 (US $72.09). Five patients had been tested for contact dermatitis; the costs of patch tests or other diagnostic tests were not included.
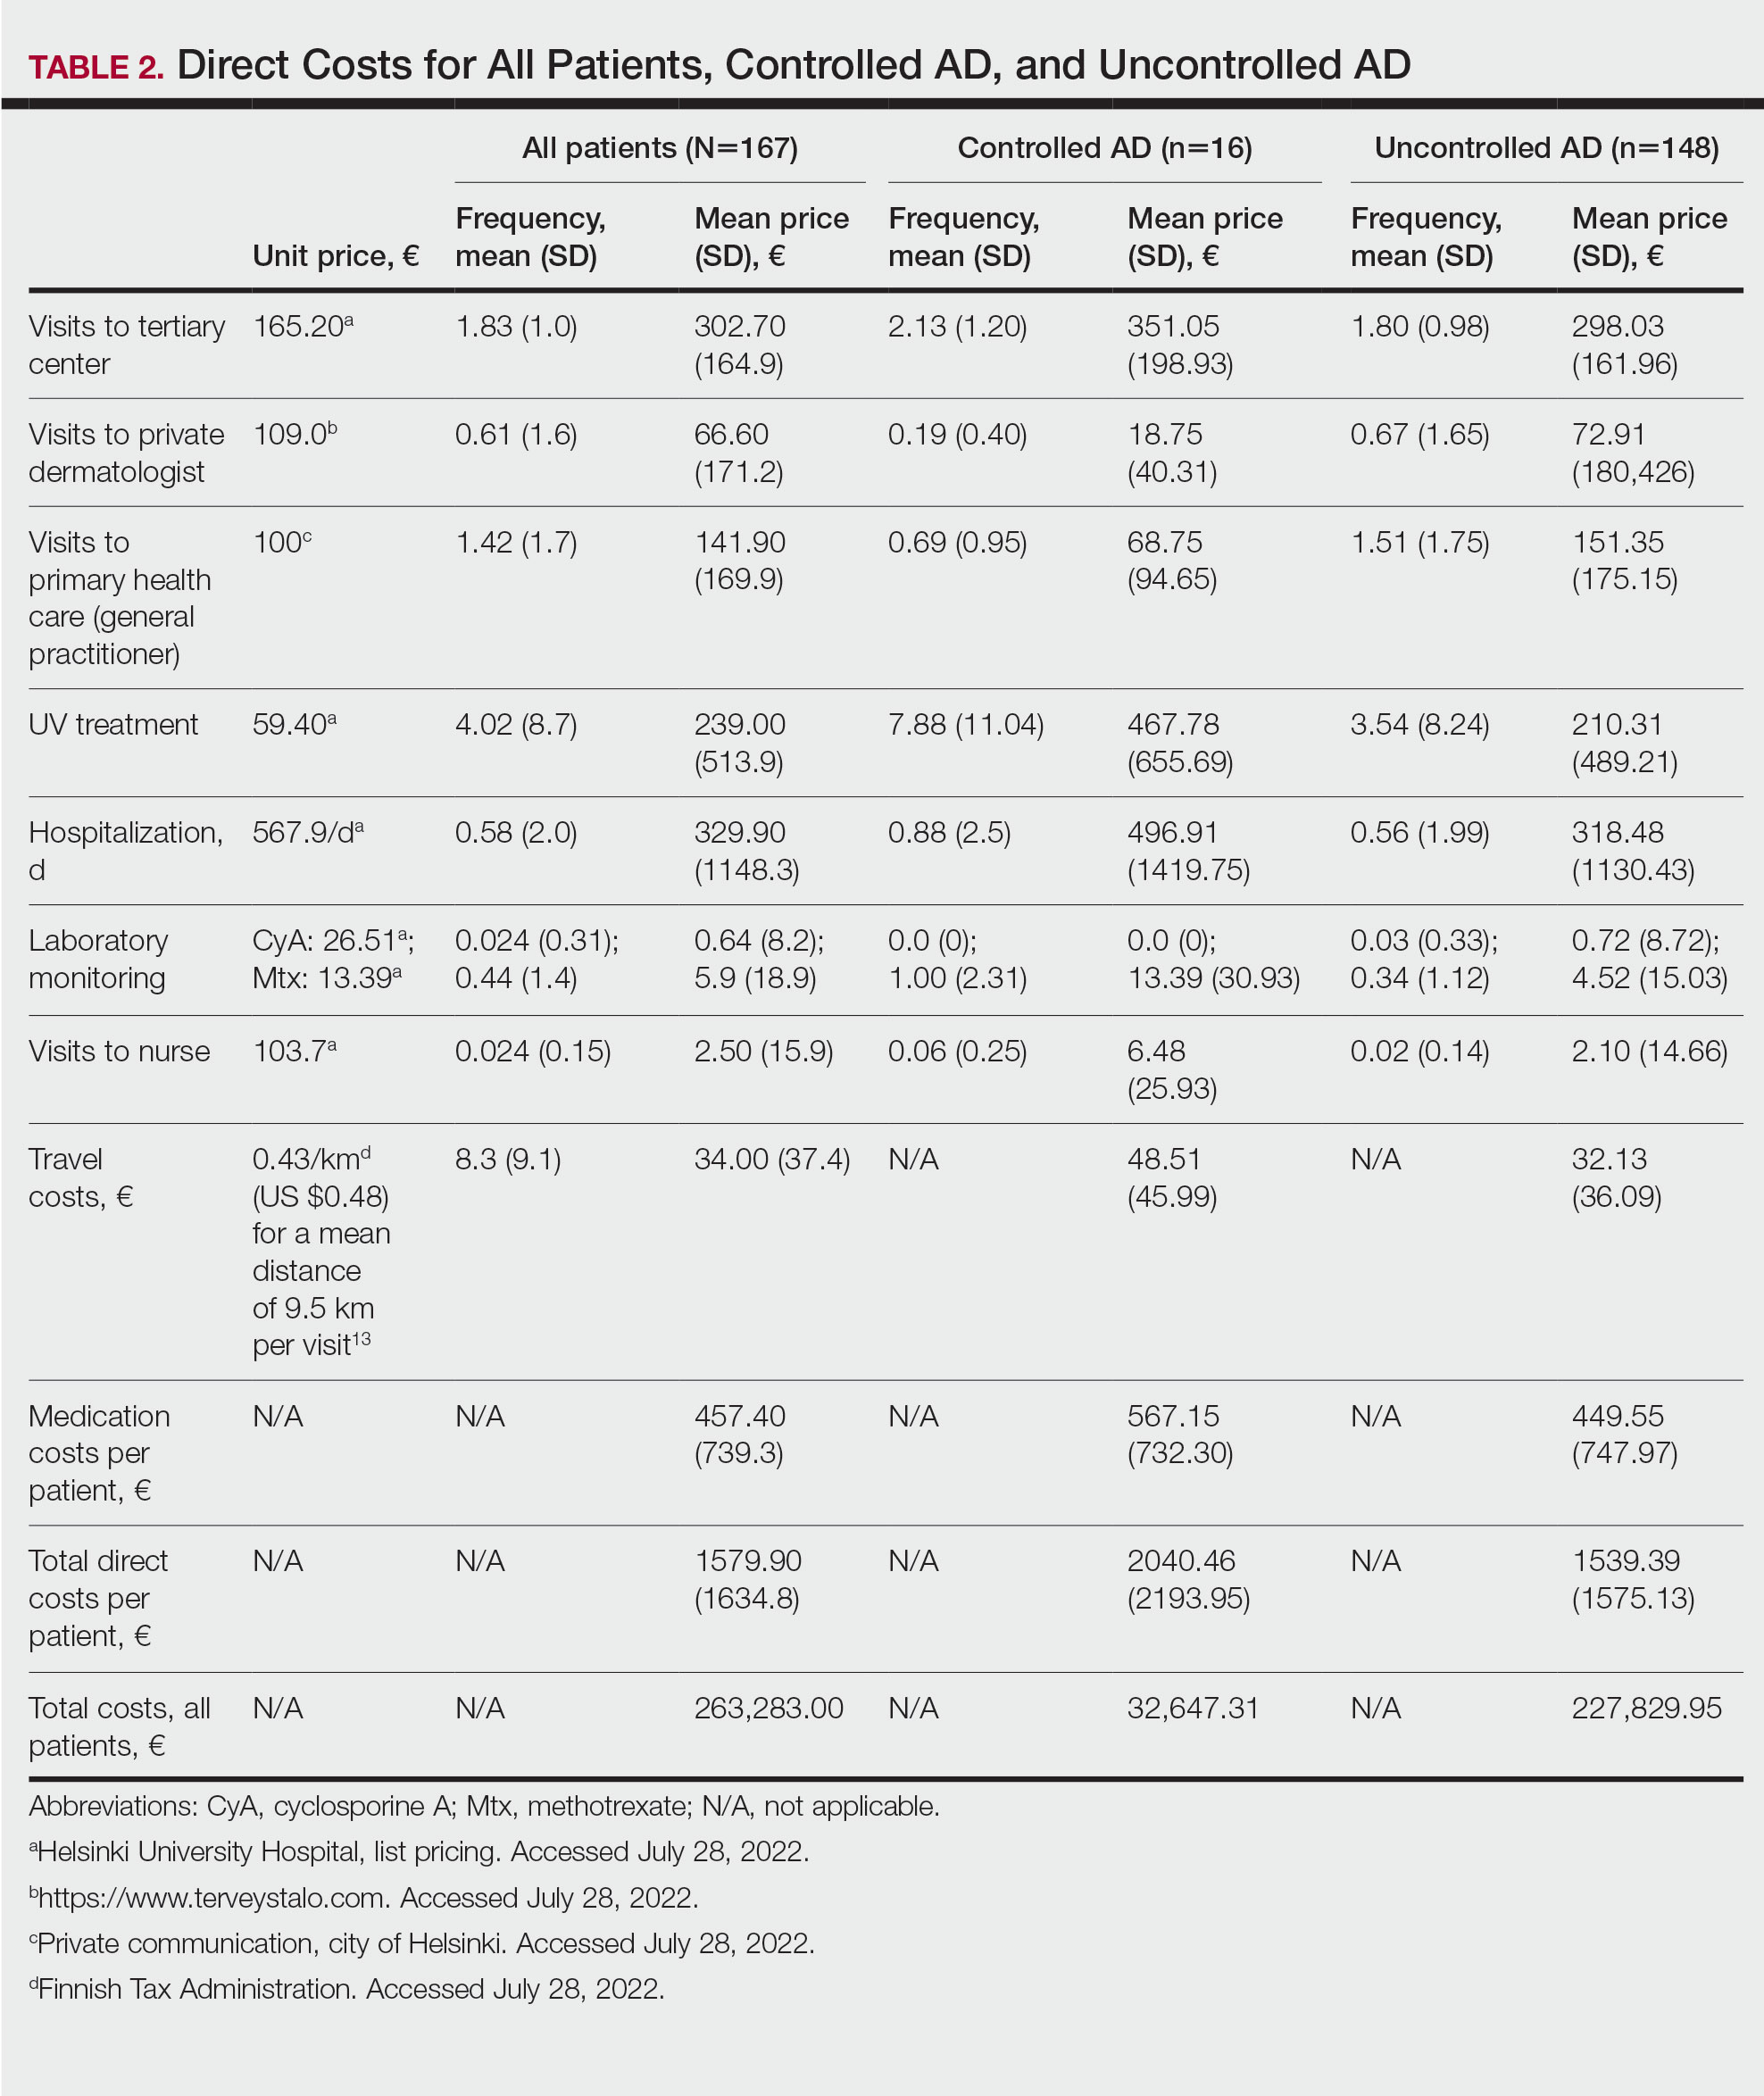
Visits to Health Care Providers—In the last year, patients had an average of 1.83 dermatologist consultations in the tertiary center (Table 2). In addition, the mean number of visits to private dermatologists was 0.61 and 1.42 visits to general practitioners. The mean cost of physician visits was €302.70 (US $335.75) in the tertiary center, €66.60 (US $73.87) in the private sector, and €141.90 (US $157.39) in primary health care. In total, the average cost of doctors’ appointments PPY was €506.30 (US $561.57). The mean estimated distance traveled per visit was 9.5 km.
The mean cost PPY of inpatient treatments was €329.90 (US $365.92) and €239.00 (US $265.09) for UV phototherapy. Only 4 patients had visited a nurse in the last year, with an average cost PPY of €2.50 (US $2.78).
In total, the cost PPY for health care provider visits was €1084.20, which included specialist consultations in a tertiary center and private sector, visits in primary health care, inpatient treatments, UV phototherapy sessions, nurse appointments in a tertiary center, and laboratory monitoring. The average transportation cost PPY was €34.00 (US $37.71). The mean number of visits to health care providers was 8.3 per year. Altogether, the direct cost PPY in the study cohort was €1580.60 (US $1752.39)(Table 2 and Figure 2).

Comparison of Medical Costs in Controlled vs Uncontrolled AD—In the controlled AD group (POEM score <8), the mean medication cost PPY was €567.15 (US $629.13), and the mean total direct cost PPY was €2040.46 (US $2263.24). In the uncontrolled AD group (POEM score ≥8), the mean medication cost PPY was €449.55 (US $498.63), and the mean total direct cost PPY was €1539.39 (US $1707.36)(Table 2). The comparisons of the study groups—controlled vs uncontrolled AD—showed no significant differences regarding medication costs PPY (P=.305, Mann-Whitney U statistic) and total direct costs PPY (P=.361, Mann-Whitney U statistic)(Figure 3). Thus, the distribution of medical costs was similar across all categories of the POEM score.
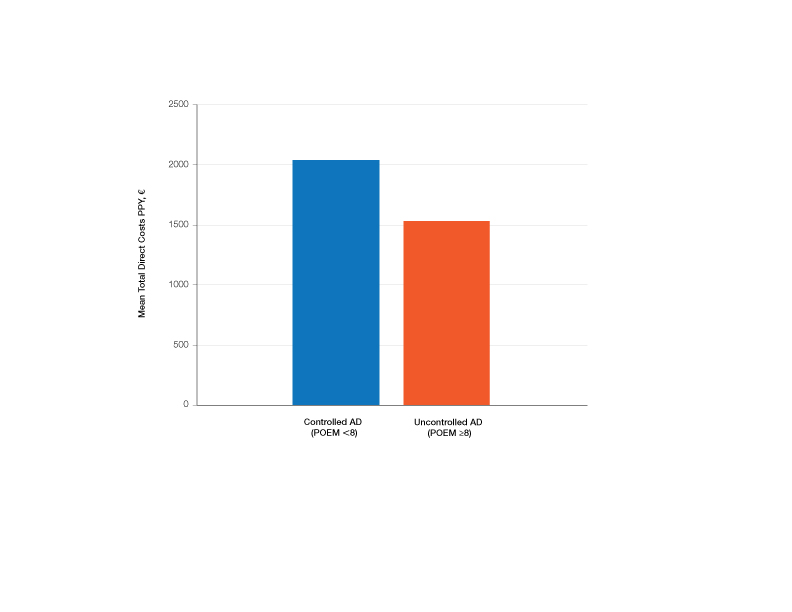
AD Severity and QOL—The mean (SD) POEM score in the study cohort was 17.9 (6.9). Sixteen (9.6%) patients had clear to almost clear skin or mild AD (POEM score 0–7). Forty-two (25.1%) patients had moderate AD (POEM score 8–16). Most of the patients (106; 63.5%) had severe or very severe AD (POEM score 17–28). According to the Rajka & Langeland score, 5 (3.0%) patients had mild disease (score 34), 81 (48.5%) patients had moderate disease (score 5–7), and 81 (48.5%) patients had severe disease (score 8–9). Eighty-one (48.5%) patients answered that AD affects their lives greatly, and 58 (34.7%) patients answered that it affects their lives extremely. Twenty-five (15.0%) patients answered that AD affects their everyday life to some extent, and only 2 (1.2%) patients answered that AD had little or no effect.
The mean (SD) DLQI was 13 (7.2). Based on the DLQI, 31 (18.6%) patients answered that AD had no effect or only a small effect on QOL (DLQI 0–5). In 36 (21.6%) patients, AD had a moderate effect on QOL (DLQI 6–10). The QOL impact was large (DLQI 11–20) and very large (DLQI 21–30) in 67 (40.1%) and 33 (19.8%) patients, respectively.
There was no significant difference in the impact of disease severity (POEM score) on the decrease of QOL (severe or very severe disease; P=.305, Mann-Whitney U statistic).
Absence From Work or Studies—At the study inclusion, 12 (7.2%) patients were not working or studying. Of the remaining 155 patients, 73 (47.1%) reported absence from work or educational activities due to AD in the last 12 months. The mean (SD) length of absence was 11.6 (10.2) days.
Comment
In this survey-based study of Finnish patients with moderate to severe AD, we observed that AD creates a substantial economic burden14 and negative impact on everyday life and QOL. According to DLQI, AD had a large or very large effect on most of the patients’ (59.9%) lives, and 90.2% of the included patients had self-reported moderate to very severe symptoms (POEM score 8–28). Our observations can partly be explained by characteristics of the Finnish health care system, in which patients with moderate to severe AD mainly are referred to specialist consultation. In the investigated cohort, many patients had used antibiotics (20.4%) and/or oral corticosteroids (21.6%) in the last year for the treatment of AD, which might indicate inadequate treatment of AD in the Finnish health care system.
Motivating patients to remain compliant is one of the main challenges in AD therapy.15 Fear of adverse effects from TCSs is common among patients and may cause poor treatment adherence.16 In a prospective study from the United Kingdom, the use of emollients in moderate to severe AD was considerably lower than AD guidelines recommend—approximately 10 g/d on average in adult patients. The median use of TCSs was between 35 and 38 g/mo.17 In our Finnish patient cohort, the amount of topical treatments was even lower, with a median use of emollients of 3.3 g/d and median use of TCSs of 25 g/mo. In another study from Denmark (N=322), 31% of patients with AD did not redeem their topical prescription medicaments, indicating poor adherence to topical treatment.18
It has been demonstrated that most of the patients’ habituation (tachyphylaxis) to TCSs is due to poor adherence instead of physiologic changes in tissue corticosteroid receptors.19,20 Treatment adherence may be increased by scheduling early follow-up visits and providing adequate therapeutic patient education,21 which requires major efforts by the health care system and a financial investment.
Inadequate treatment will lead to more frequent disease flares and subsequently increase the medical costs for the patients and the health care system.22 In our Finnish patient cohort, a large part of direct treatment costs was due to inpatient treatment (Figure 2) even though only a small proportion of patients had been hospitalized. The patients were frequently young and otherwise in good general health, and they did not necessarily need continuous inpatient treatment and monitoring. In Finland, it will be necessary to develop more cost-effective treatment regimens for patients with AD with severe and frequent flares. Many patients would benefit from subsequent and regular sessions of topical treatment in an outpatient setting. In addition, the prevention of flares in moderate to severe AD will decrease medical costs.23
The mean medication cost PPY was €457.40 (US $507.34), and mean total direct cost PPY was €1579.90 (US $1752.40), which indicates that AD causes a major economic burden to Finnish patients and to the Finnish health care system (Figures 1 and 2).24 We did not observe significant differences between controlled and uncontrolled AD medical costs in our patient cohort (Figure 3), which may have been due to the relatively small sample size of only 16 patients in the controlled AD group. All patients attending the tertiary care hospital had moderate to severe AD, so it is likely that the patients with lower POEM scores had better-controlled disease. The POEM score estimates the grade of AD in the last 7 days, but based on the relapsing course of the disease, the grading score may differ substantially during the year in the same patient depending on the timing.25,26
Topical calcineurin inhibitors comprised almost half of the medication costs (Figure 1), which may be caused by their higher prices compared with TCSs in Finland. In the beginning of 2019, a 50% less expensive biosimilar of tacrolimus ointment 0.1% was introduced to the Finnish market, which might decrease future treatment costs of TCIs. However, availability problems in both topical tacrolimus products were seen throughout 2019, which also may have affected the results in our study cohort. The median use of TCIs was unexpectedly low (only 30 g/y), which may be explained by different application habits. The use of large TCI amounts in some patients may have elevated mean costs.27
In the Finnish public health care system, 40% of the cost for prescription medication and emollients is reimbursed after an initial deductible of €50. Emollients are reimbursed up to an amount of 1500 g/mo. Therefore, patients mostly acquired emollients as prescription medicine and not over-the-counter. Nonprescription medicaments were not included in our study, so the actual costs of topical treatment may have been higher.28
In our cohort, 61.7% of the patients reported food allergies, and 70.1% reported allergic conjunctivitis. However, the study included only questionnaire-based data, and many of these patients probably had symptoms not associated with IgE-mediated allergies. The high prevalence indicates a substantial concomitant burden of more than skin symptoms in patients with AD.29 Nine percent of patients reported a diagnosed psychiatric disorder, and 29.3% had self-reported anxiety or depression often or very often in the last year. Based on these findings, there may be high percentages of undiagnosed psychiatric comorbidities such as depression and anxiety disorders in patients with moderate to severe AD in Finland.30 An important limitation of our study was that the patient data were based on a voluntary and anonymous survey and that depression and anxiety were addressed solely by a single question. In addition, the response rate cannot be analyzed correctly, and the demographics of the survey responders likely will differ substantially from all patients with AD at the university hospital.
Atopic dermatitis had a substantial effect on QOL in our patient cohort. Inadequate treatment of AD is known to negatively affect patient QOL and may lead to hospitalization or frequent oral corticosteroid courses.31,32 In most cases, structured patient education and early follow-up visits may improve patient adherence to treatment and should be considered as an integral part of AD treatment.33 In the investigated Finnish tertiary care hospital, a structured patient education system unfortunately was still lacking, though it has been proven effective elsewhere.34 In addition, patient-centred educational programs are recommended in European guidelines for the treatment of AD.35
Medical costs of AD may increase in the future as new treatments with higher direct costs, such as dupilumab, are introduced. Eichenfeld et al36 analyzed electronic health plan claims in patients with AD with newly introduced systemic therapies and phototherapies after the availability of dupilumab in the United States (March 2017). Mean annualized total cost in all patients was $20,722; the highest in the dupilumab group with $36,505. Compared to our data, the total costs are much higher, but these are likely to rise in Finland in the future if a substantial amount (eg, 1%–5%) of patients will be on advanced therapies, including dupilumab. If advanced therapies will be introduced more broadly in Finland (eg, in the treatment of moderate AD [10%–20% of patients]), they will represent a major direct cost to the health care system. Zimmermann et al37 showed in a cost-utility analysis that dupilumab improves health outcomes but with additional direct costs, and it is likely more cost-effective in patients with severe AD. Conversely, more efficient treatments may improve severe AD, reduce the need for hospitalization and recurrent doctors’ appointments as well as absence from work, and improve patient QOL,38 consequently decreasing indirect medical costs and disease burden. Ariëns et al39 showed in a recent registry-based study that dupilumab treatment induces a notable rise in work productivity and reduction of associated costs in patients with difficult-to-treat AD.
Conclusion
We aimed to analyze the economic burden of AD in Finland before the introduction of dupilumab. It will be interesting to see what the introduction of dupilumab and other novel systemic therapies have on total economic burden and medical costs. Most patients with AD in Finland can achieve disease control with topical treatments, but it is important to efficiently manage the patients who require additional supportive measures and specialist consultations, which may be challenging in the primary health care system because of the relapsing and remitting nature of the disease.
- Nutten S. Atopic dermatitis: global epidemiology and risk factors. Ann Nutr Metab. 2015;66(suppl 1):8-16.
- Eichenfield LF, Tom WL, Chamlin SL, et al. Guidelines of care for the management of atopic dermatitis: section 1. diagnosis and assessment of atopic dermatitis. J Am Acad Dermatol. 2014;70:338-351.
- Yang EJ, Beck KM, Sekhon S, et al. The impact of pediatric atopic dermatitis on families: a review. Pediatr Dermatol. 2019;36:66-71.
- Eckert L, Gupta S, Amand C, et al. Impact of atopic dermatitis on health-related quality of life and productivity in adults in the United States: an analysis using the National Health and Wellness Survey. J Am Acad Dermatol. 2017;77:274-279.
- Drucker AM, Wang AR, Li WQ, et al. The burden of atopic dermatitis: summary of a report for the National Eczema Association. J Invest Dermatol. 2017;137:26-30.
- Ehlken B, Möhrenschlager M, Kugland B, et al. Cost-of-illness study in patients suffering from atopic eczema in Germany. Der Hautarzt. 2006;56:1144-1151.
- Ariëns LFM, van Nimwegen KJM, Shams M, et al. Economic burden of adult patients with moderate to severe atopic dermatitis indicated for systemic treatment. Acta Derm Venereol. 2019;99:762-768.
- Barbeau M, Bpharm HL. Burden of atopic dermatitis in Canada. Int J Dermatol. 2006;45:31-36.
- Verboom P, Hakkaart‐Van Roijen L, Sturkenboom M, et al. The cost of atopic dermatitis in the Netherlands: an international comparison. Br J Dermatol. 2002;147:716-724.
- Gånemo A, Svensson Å, Svedman C, et al. Usefulness of Rajka & Langeland eczema severity score in clinical practice. Acta Derm Venereol. 2016;96:521-524.
- Charman CR, Venn AJ, Williams HC. The Patient-Oriented Eczema Measure: development and initial validation of a new tool for measuring atopic eczema severity from the patients’ perspective. Arch Dermatol. 2004;140:1513-1519.
- Finlay AY, Khan GK. Dermatology Life Quality Index (DLQI): a simple practical measure for routine clinical use. Clin Exp Dermatol. 1994;19:210-216.
- Rehunen A, Reissell E, Honkatukia J, et al. Social and health services: regional changes in need, use and production and future options. Accessed July 20, 2023. http://urn.fi/URN:ISBN:978-952-287-294-4
- Reed B, Blaiss MS. The burden of atopic dermatitis. Allergy Asthma Proc. 2018;39:406-410.
- Koszorú K, Borza J, Gulácsi L, et al. Quality of life in patients with atopic dermatitis. Cutis. 2019;104:174-177.
- Li AW, Yin ES, Antaya RJ. Topical corticosteroid phobia in atopic dermatitis: a systematic review. JAMA Dermatol. 2017;153:1036-1042.
- Choi J, Dawe R, Ibbotson S, et al. Quantitative analysis of topical treatments in atopic dermatitis: unexpectedly low use of emollients and strong correlation of topical corticosteroid use both with depression and concurrent asthma. Br J Dermatol. 2020;182:1017-1025.
- Storm A, Andersen SE, Benfeldt E, et al. One in 3 prescriptions are never redeemed: primary nonadherence in an outpatient clinic. J Am Acad Dermatol. 2008;59:27-33.
- Okwundu N, Cardwell LA, Cline A, et al. Topical corticosteroids for treatment-resistant atopic dermatitis. Cutis. 2018;102:205-209.
- Eicher L, Knop M, Aszodi N, et al. A systematic review of factors influencing treatment adherence in chronic inflammatory skin disease—strategies for optimizing treatment outcome. J Eur Acad Dermatol Venereol. 2019;33:2253-2263.
- Heratizadeh A, Werfel T, Wollenberg A, et al; Arbeitsgemeinschaft Neurodermitisschulung für Erwachsene (ARNE) Study Group. Effects of structured patient education in adults with atopic dermatitis: multicenter randomized controlled trial. J Allergy Clin Immunol. 2017;140:845-853.
- Dierick BJH, van der Molen T, Flokstra-de Blok BMJ, et al. Burden and socioeconomics of asthma, allergic rhinitis, atopic dermatitis and food allergy. Expert Rev Pharmacoecon Outcomes Res. 2020;20:437-453.
- Olsson M, Bajpai R, Yew YW, et al. Associations between health-related quality of life and health care costs among children with atopic dermatitis and their caregivers: a cross-sectional study. Pediatr Dermatol. 2020;37:284-293.
- Bruin-Weller M, Pink AE, Patrizi A, et al. Disease burden and treatment history among adults with atopic dermatitis receiving systemic therapy: baseline characteristics of participants on the EUROSTAD prospective observational study. J Dermatolog Treat. 2021;32:164-173.
- Silverberg JI, Lei D, Yousaf M, et al. Comparison of Patient-Oriented Eczema Measure and Patient-Oriented Scoring Atopic Dermatitis vs Eczema Area and Severity Index and other measures of atopic dermatitis: a validation study. Ann Allergy Asthma Immunol. 2020;125:78-83.
- Kido-Nakahara M, Nakahara T, Yasukochi Y, et al. Patient-oriented eczema measure score: a useful tool for web-based surveys in patients with atopic dermatitis. Acta Derm Venereol. 2020;47:924-925.
- Komura Y, Kogure T, Kawahara K, et al. Economic assessment of actual prescription of drugs for treatment of atopic dermatitis: differences between dermatology and pediatrics in large-scale receipt data. J Dermatol. 2018;45:165-174.
- Thompson AM, Chan A, Torabi M, et al. Eczema moisturizers: allergenic potential, marketing claims, and costs. Dermatol Ther. 2020;33:E14228.
- Egeberg A, Andersen YM, Gislason GH, et al. Prevalence of comorbidity and associated risk factors in adults with atopic dermatitis. Allergy. 2017;72:783-791.
- Kauppi S, Jokelainen J, Timonen M, et al. Adult patients with atopic eczema have a high burden of psychiatric disease: a Finnish nationwide registry study. Acta Derm Venereol. 2019;99:647-651.
- Ali F, Vyas J, Finlay AY. Counting the burden: atopic dermatitis and health-related quality of life. Acta Derm Venereol. 2020;100:adv00161.
- Birdi G, Cooke R, Knibb RC. Impact of atopic dermatitis on quality of life in adults: a systematic review and meta-analysis. Int J Dermatol. 2020;59:E75-E91.
- Gabes M, Tischer C, Apfelbacher C; quality of life working group of the Harmonising Outcome Measures for Eczema (HOME) initiative. Measurement properties of quality-of-life outcome measures for children and adults with eczema: an updated systematic review. Pediatr Allergy Immunol. 2020;31:66-77.
- Staab D, Diepgen TL, Fartasch M, et al. Age related, structured educational programmes for the management of atopic dermatitis in children and adolescents: multicentre, randomised controlled trial. BMJ. 2006;332:933-938.
- Wollenberg A, Barbarot S, Bieber T, et al; European Dermatology Forum (EDF), the European Academy of Dermatology and Venereology (EADV), the European Academy of Allergy and Clinical Immunology (EAACI), the European Task Force on Atopic Dermatitis (ETFAD), European Federation of Allergy and Airways Diseases Patients’ Associations (EFA), the European Society for Dermatology and Psychiatry (ESDaP), the European Society of Pediatric Dermatology (ESPD), Global Allergy and Asthma European Network (GA2LEN) and the European Union of Medical Specialists (UEMS). Consensus-based European guidelines for treatment of atopic eczema (atopic dermatitis) in adults and children: part II. J Eur Acad Dermatol Venereol. 2018;32:850-878.
- Eichenfield LF, DiBonaventura M, Xenakis J, et al. Costs and treatment patterns among patients with atopic dermatitis using advanced therapies in the United States: analysis of a retrospective claims database. Dermatol Ther (Heidelb). 2020;10:791-806.
- Zimmermann M, Rind D, Chapman R, et al. Economic evaluation of dupilumab for moderate-to-severe atopic dermatitis: a cost-utility analysis. J Drugs Dermatol. 2018;17:750-756.
- Mata E, Loh TY, Ludwig C, et al. Pharmacy costs of systemic and topical medications for atopic dermatitis. J Dermatolog Treat. 2019;12:1-3.
- Ariëns LFM, Bakker DS, Spekhorst LS, et al. Rapid and sustained effect of dupilumab on work productivity in patients with difficult-to-treat atopic dermatitis: results from the Dutch BioDay Registry. Acta Derm Venereol. 2021;19;101:adv00573.
Atopic dermatitis (AD) is a common inflammatory skin disease that may severely decrease quality of life (QOL) and lead to psychiatric comorbidities.1-3 Prior studies have indicated that AD causes a substantial economic burden, and disease severity has been proportionally linked to medical costs.4,5 Results of a multicenter cost-of-illness study from Germany estimated that a relapse of AD costs approximately €123 (US $136). The authors calculated the average annual cost of AD per patient to be €1425 (US $1580), whereas it is €956 (US $1060) in moderate disease and €2068 (US $2293) in severe disease (direct and indirect medical costs included).6 An observational cohort study from the Netherlands found that total direct cost per patient-year (PPY) was €4401 (US $4879) for patients with controlled AD vs €6993 (US $7756) for patients with uncontrolled AD.7
In a retrospective survey-based study, it was estimated that the annual cost of AD in Canada was approximately CAD $1.4 billion. The cost per patient varied from CAD $282 to CAD $1242 depending on disease severity.8 In another retrospective cohort study from the Netherlands, the average direct medical cost per patient with AD seeing a general practitioner was US $71 during follow-up in primary care. If the patient needed specialist consultation, the cost increased to an average of US $186.9
We aimed to assess the direct and indirect medical costs in adult patients with moderate to severe AD who attended a tertiary health care center in Finland. In addition, we evaluated the impact of AD on QOL in this patient cohort.
Methods
Study Design—Patients with AD who were treated at the Department of Dermatology and Allergology, Helsinki University Hospital, Finland, between February 2018 and December 2019 were randomly selected to participate in our survey study. All participants provided written informed consent. In Finland, patients with mild AD generally are treated in primary health care centers, and only patients with moderate to severe AD are referred to specialists and tertiary care centers. Patients were excluded if they were younger than 18 years, had AD confined to the hands, or reported the presence of other concomitant skin diseases that were being treated with topical or systemic therapies. The protocol for the study was approved by the local ethics committee of the University of Helsinki.
Questionnaire and Analysis of Disease Severity—The survey included the medical history, signs of atopy, former treatment(s) for AD, skin infections, visits to dermatologists or general practitioners, questions on mental health and hospitalization, and absence from work due to AD in the last 12 months. Disease severity was evaluated using the patient-oriented Rajka & Langeland eczema severity score and Patient Oriented Eczema Measure (POEM).10,11 The impact on QOL was evaluated by the Dermatology Life Quality Index (DLQI).12
Medication Costs—The cost of prescription drugs was based on data from the Finnish national electronic prescription center. In Finland, all prescriptions are made electronically in the database. We analyzed all topical medications (eg, topical corticosteroids [TCSs], topical calcineurin inhibitors [TCIs], and emollients) and systemic medicaments (eg, antibiotics, antihistamines, cyclosporine, methotrexate, and corticosteroids) prescribed for the treatment of AD. In Finland, dupilumab was introduced for the treatment of severe AD in early 2019, and patients receiving dupilumab were excluded from the study. Over-the-counter medications were not included. The costs for laboratory testing were estimations based on the standard monitoring protocols of the Helsinki University Hospital. All costs were based on the Finnish price level standard for the year 2019.
Inpatient/Outpatient Visits and Sick Leave Due to AD—The number of inpatient and outpatient visits due to AD in the last 12 months was evaluated. Outpatient specialist consultations or nurse appointments at Helsinki University Hospital were verified from electronic patient records. In addition, inpatient treatment and phototherapy sessions were calculated from the database.
We assessed the number of sick leave days from work or educational activities during the last year. All costs of transportation for doctors’ appointments, laboratory monitoring, and phototherapy treatments were summed together to estimate the total transportation cost. Visits to nurse and inpatient visits were not included in the total transportation cost because patients often were hospitalized directly after consultation visits, and nurse appointments often were combined with inpatient and outpatient visits. To calculate the total transportation cost, we used a rate of €0.43 per kilometer measured from the patients’ home addresses, which was the official compensation rate of the Finnish Tax Administration for 2019.13
Statistical Analysis—Statistical analyses were performed using SPSS Statistics 25 (IBM). Descriptive analyses were used to describe baseline characteristics and to evaluate the mean costs of AD. The patients were divided into 2 groups according to POEM: (1) controlled AD (patients with clear skin or only mild AD; POEM score 0–7) and (2) uncontrolled AD (patients with moderate to very severe AD; POEM score 8–28). The Mann-Whitney U statistic was used to evaluate differences between the study groups.
Results
Patient Characteristics—One hundred sixty-seven patients answered the survey, of which 69 (41.3%) were males and 98 (58.7%) were females. There were 16 patients with controlled AD and 148 patients with uncontrolled AD. Three patients did not answer to POEM and were excluded. The baseline characteristics are presented in Table 1 and include self-reported symptoms related to atopy.
The most-used topical treatments were TCSs (n=155; 92.8%) and emollients (n=166; 99.4%). One hundred sixteen (69.5%) patients had used TCIs. The median amount of TCSs used was 300 g/y vs 30 g/y for TCIs (range, 0-5160 g/y) and 1200 g/y for emollients.
Fifteen (9.0%) patients had been hospitalized for AD in the last year. The mean (SD) length of hospitalization was 6.5 (2.8) days. Thirty-four (20.4%) patients received UVB phototherapy. Thirty-four (20.4%) patients were treated with at least 1 antibiotic course for secondary AD infection. Thirty-six (21.6%) patients needed at least 1 oral corticosteroid course for the treatment of an AD flare.
Fifteen (9.0%) patients reported a diagnosed psychiatric illness, and 17 (10.2%) patients were using prescription drugs for psychiatric illness. Forty-nine (29.3%) patients reported anxiety or depression often or very often, 54 (32.3%) patients reported sometimes, 33 (19.8%) patients reported rarely, and only 30 (18.0%) patients reported none.
Medication Costs—Mean medication cost PPY was €457.40 (US $507.34)(Figure 1 and Table 2). On average, one patient spent €87.50 (US $97.05) for TCSs, €121.90 (US $135.21) for emollients, and €225.10 (US $249.68) for TCIs. The average cost PPY for antibiotics was €6.10 (US $6.77). Other systemic treatments, including (US $18.65). Seventeen patients (10.2%) were on methotrexate therapy for AD in the last year, and 1 patient also used cyclosporine. The costs for laboratory monitoring in these patients were included in the direct cost calculations. The mean cost PPY of laboratory monitoring in the whole study cohort was €6.60 (US $7.32). In patients with systemic immunosuppressive therapy, the mean cost PPY for laboratory monitoring was €65.00 (US $72.09). Five patients had been tested for contact dermatitis; the costs of patch tests or other diagnostic tests were not included.
Visits to Health Care Providers—In the last year, patients had an average of 1.83 dermatologist consultations in the tertiary center (Table 2). In addition, the mean number of visits to private dermatologists was 0.61 and 1.42 visits to general practitioners. The mean cost of physician visits was €302.70 (US $335.75) in the tertiary center, €66.60 (US $73.87) in the private sector, and €141.90 (US $157.39) in primary health care. In total, the average cost of doctors’ appointments PPY was €506.30 (US $561.57). The mean estimated distance traveled per visit was 9.5 km.
The mean cost PPY of inpatient treatments was €329.90 (US $365.92) and €239.00 (US $265.09) for UV phototherapy. Only 4 patients had visited a nurse in the last year, with an average cost PPY of €2.50 (US $2.78).
In total, the cost PPY for health care provider visits was €1084.20, which included specialist consultations in a tertiary center and private sector, visits in primary health care, inpatient treatments, UV phototherapy sessions, nurse appointments in a tertiary center, and laboratory monitoring. The average transportation cost PPY was €34.00 (US $37.71). The mean number of visits to health care providers was 8.3 per year. Altogether, the direct cost PPY in the study cohort was €1580.60 (US $1752.39)(Table 2 and Figure 2).
Comparison of Medical Costs in Controlled vs Uncontrolled AD—In the controlled AD group (POEM score <8), the mean medication cost PPY was €567.15 (US $629.13), and the mean total direct cost PPY was €2040.46 (US $2263.24). In the uncontrolled AD group (POEM score ≥8), the mean medication cost PPY was €449.55 (US $498.63), and the mean total direct cost PPY was €1539.39 (US $1707.36)(Table 2). The comparisons of the study groups—controlled vs uncontrolled AD—showed no significant differences regarding medication costs PPY (P=.305, Mann-Whitney U statistic) and total direct costs PPY (P=.361, Mann-Whitney U statistic)(Figure 3). Thus, the distribution of medical costs was similar across all categories of the POEM score.
AD Severity and QOL—The mean (SD) POEM score in the study cohort was 17.9 (6.9). Sixteen (9.6%) patients had clear to almost clear skin or mild AD (POEM score 0–7). Forty-two (25.1%) patients had moderate AD (POEM score 8–16). Most of the patients (106; 63.5%) had severe or very severe AD (POEM score 17–28). According to the Rajka & Langeland score, 5 (3.0%) patients had mild disease (score 34), 81 (48.5%) patients had moderate disease (score 5–7), and 81 (48.5%) patients had severe disease (score 8–9). Eighty-one (48.5%) patients answered that AD affects their lives greatly, and 58 (34.7%) patients answered that it affects their lives extremely. Twenty-five (15.0%) patients answered that AD affects their everyday life to some extent, and only 2 (1.2%) patients answered that AD had little or no effect.
The mean (SD) DLQI was 13 (7.2). Based on the DLQI, 31 (18.6%) patients answered that AD had no effect or only a small effect on QOL (DLQI 0–5). In 36 (21.6%) patients, AD had a moderate effect on QOL (DLQI 6–10). The QOL impact was large (DLQI 11–20) and very large (DLQI 21–30) in 67 (40.1%) and 33 (19.8%) patients, respectively.
There was no significant difference in the impact of disease severity (POEM score) on the decrease of QOL (severe or very severe disease; P=.305, Mann-Whitney U statistic).
Absence From Work or Studies—At the study inclusion, 12 (7.2%) patients were not working or studying. Of the remaining 155 patients, 73 (47.1%) reported absence from work or educational activities due to AD in the last 12 months. The mean (SD) length of absence was 11.6 (10.2) days.
Comment
In this survey-based study of Finnish patients with moderate to severe AD, we observed that AD creates a substantial economic burden14 and negative impact on everyday life and QOL. According to DLQI, AD had a large or very large effect on most of the patients’ (59.9%) lives, and 90.2% of the included patients had self-reported moderate to very severe symptoms (POEM score 8–28). Our observations can partly be explained by characteristics of the Finnish health care system, in which patients with moderate to severe AD mainly are referred to specialist consultation. In the investigated cohort, many patients had used antibiotics (20.4%) and/or oral corticosteroids (21.6%) in the last year for the treatment of AD, which might indicate inadequate treatment of AD in the Finnish health care system.
Motivating patients to remain compliant is one of the main challenges in AD therapy.15 Fear of adverse effects from TCSs is common among patients and may cause poor treatment adherence.16 In a prospective study from the United Kingdom, the use of emollients in moderate to severe AD was considerably lower than AD guidelines recommend—approximately 10 g/d on average in adult patients. The median use of TCSs was between 35 and 38 g/mo.17 In our Finnish patient cohort, the amount of topical treatments was even lower, with a median use of emollients of 3.3 g/d and median use of TCSs of 25 g/mo. In another study from Denmark (N=322), 31% of patients with AD did not redeem their topical prescription medicaments, indicating poor adherence to topical treatment.18
It has been demonstrated that most of the patients’ habituation (tachyphylaxis) to TCSs is due to poor adherence instead of physiologic changes in tissue corticosteroid receptors.19,20 Treatment adherence may be increased by scheduling early follow-up visits and providing adequate therapeutic patient education,21 which requires major efforts by the health care system and a financial investment.
Inadequate treatment will lead to more frequent disease flares and subsequently increase the medical costs for the patients and the health care system.22 In our Finnish patient cohort, a large part of direct treatment costs was due to inpatient treatment (Figure 2) even though only a small proportion of patients had been hospitalized. The patients were frequently young and otherwise in good general health, and they did not necessarily need continuous inpatient treatment and monitoring. In Finland, it will be necessary to develop more cost-effective treatment regimens for patients with AD with severe and frequent flares. Many patients would benefit from subsequent and regular sessions of topical treatment in an outpatient setting. In addition, the prevention of flares in moderate to severe AD will decrease medical costs.23
The mean medication cost PPY was €457.40 (US $507.34), and mean total direct cost PPY was €1579.90 (US $1752.40), which indicates that AD causes a major economic burden to Finnish patients and to the Finnish health care system (Figures 1 and 2).24 We did not observe significant differences between controlled and uncontrolled AD medical costs in our patient cohort (Figure 3), which may have been due to the relatively small sample size of only 16 patients in the controlled AD group. All patients attending the tertiary care hospital had moderate to severe AD, so it is likely that the patients with lower POEM scores had better-controlled disease. The POEM score estimates the grade of AD in the last 7 days, but based on the relapsing course of the disease, the grading score may differ substantially during the year in the same patient depending on the timing.25,26
Topical calcineurin inhibitors comprised almost half of the medication costs (Figure 1), which may be caused by their higher prices compared with TCSs in Finland. In the beginning of 2019, a 50% less expensive biosimilar of tacrolimus ointment 0.1% was introduced to the Finnish market, which might decrease future treatment costs of TCIs. However, availability problems in both topical tacrolimus products were seen throughout 2019, which also may have affected the results in our study cohort. The median use of TCIs was unexpectedly low (only 30 g/y), which may be explained by different application habits. The use of large TCI amounts in some patients may have elevated mean costs.27
In the Finnish public health care system, 40% of the cost for prescription medication and emollients is reimbursed after an initial deductible of €50. Emollients are reimbursed up to an amount of 1500 g/mo. Therefore, patients mostly acquired emollients as prescription medicine and not over-the-counter. Nonprescription medicaments were not included in our study, so the actual costs of topical treatment may have been higher.28
In our cohort, 61.7% of the patients reported food allergies, and 70.1% reported allergic conjunctivitis. However, the study included only questionnaire-based data, and many of these patients probably had symptoms not associated with IgE-mediated allergies. The high prevalence indicates a substantial concomitant burden of more than skin symptoms in patients with AD.29 Nine percent of patients reported a diagnosed psychiatric disorder, and 29.3% had self-reported anxiety or depression often or very often in the last year. Based on these findings, there may be high percentages of undiagnosed psychiatric comorbidities such as depression and anxiety disorders in patients with moderate to severe AD in Finland.30 An important limitation of our study was that the patient data were based on a voluntary and anonymous survey and that depression and anxiety were addressed solely by a single question. In addition, the response rate cannot be analyzed correctly, and the demographics of the survey responders likely will differ substantially from all patients with AD at the university hospital.
Atopic dermatitis had a substantial effect on QOL in our patient cohort. Inadequate treatment of AD is known to negatively affect patient QOL and may lead to hospitalization or frequent oral corticosteroid courses.31,32 In most cases, structured patient education and early follow-up visits may improve patient adherence to treatment and should be considered as an integral part of AD treatment.33 In the investigated Finnish tertiary care hospital, a structured patient education system unfortunately was still lacking, though it has been proven effective elsewhere.34 In addition, patient-centred educational programs are recommended in European guidelines for the treatment of AD.35
Medical costs of AD may increase in the future as new treatments with higher direct costs, such as dupilumab, are introduced. Eichenfeld et al36 analyzed electronic health plan claims in patients with AD with newly introduced systemic therapies and phototherapies after the availability of dupilumab in the United States (March 2017). Mean annualized total cost in all patients was $20,722; the highest in the dupilumab group with $36,505. Compared to our data, the total costs are much higher, but these are likely to rise in Finland in the future if a substantial amount (eg, 1%–5%) of patients will be on advanced therapies, including dupilumab. If advanced therapies will be introduced more broadly in Finland (eg, in the treatment of moderate AD [10%–20% of patients]), they will represent a major direct cost to the health care system. Zimmermann et al37 showed in a cost-utility analysis that dupilumab improves health outcomes but with additional direct costs, and it is likely more cost-effective in patients with severe AD. Conversely, more efficient treatments may improve severe AD, reduce the need for hospitalization and recurrent doctors’ appointments as well as absence from work, and improve patient QOL,38 consequently decreasing indirect medical costs and disease burden. Ariëns et al39 showed in a recent registry-based study that dupilumab treatment induces a notable rise in work productivity and reduction of associated costs in patients with difficult-to-treat AD.
Conclusion
We aimed to analyze the economic burden of AD in Finland before the introduction of dupilumab. It will be interesting to see what the introduction of dupilumab and other novel systemic therapies have on total economic burden and medical costs. Most patients with AD in Finland can achieve disease control with topical treatments, but it is important to efficiently manage the patients who require additional supportive measures and specialist consultations, which may be challenging in the primary health care system because of the relapsing and remitting nature of the disease.
Atopic dermatitis (AD) is a common inflammatory skin disease that may severely decrease quality of life (QOL) and lead to psychiatric comorbidities.1-3 Prior studies have indicated that AD causes a substantial economic burden, and disease severity has been proportionally linked to medical costs.4,5 Results of a multicenter cost-of-illness study from Germany estimated that a relapse of AD costs approximately €123 (US $136). The authors calculated the average annual cost of AD per patient to be €1425 (US $1580), whereas it is €956 (US $1060) in moderate disease and €2068 (US $2293) in severe disease (direct and indirect medical costs included).6 An observational cohort study from the Netherlands found that total direct cost per patient-year (PPY) was €4401 (US $4879) for patients with controlled AD vs €6993 (US $7756) for patients with uncontrolled AD.7
In a retrospective survey-based study, it was estimated that the annual cost of AD in Canada was approximately CAD $1.4 billion. The cost per patient varied from CAD $282 to CAD $1242 depending on disease severity.8 In another retrospective cohort study from the Netherlands, the average direct medical cost per patient with AD seeing a general practitioner was US $71 during follow-up in primary care. If the patient needed specialist consultation, the cost increased to an average of US $186.9
We aimed to assess the direct and indirect medical costs in adult patients with moderate to severe AD who attended a tertiary health care center in Finland. In addition, we evaluated the impact of AD on QOL in this patient cohort.
Methods
Study Design—Patients with AD who were treated at the Department of Dermatology and Allergology, Helsinki University Hospital, Finland, between February 2018 and December 2019 were randomly selected to participate in our survey study. All participants provided written informed consent. In Finland, patients with mild AD generally are treated in primary health care centers, and only patients with moderate to severe AD are referred to specialists and tertiary care centers. Patients were excluded if they were younger than 18 years, had AD confined to the hands, or reported the presence of other concomitant skin diseases that were being treated with topical or systemic therapies. The protocol for the study was approved by the local ethics committee of the University of Helsinki.
Questionnaire and Analysis of Disease Severity—The survey included the medical history, signs of atopy, former treatment(s) for AD, skin infections, visits to dermatologists or general practitioners, questions on mental health and hospitalization, and absence from work due to AD in the last 12 months. Disease severity was evaluated using the patient-oriented Rajka & Langeland eczema severity score and Patient Oriented Eczema Measure (POEM).10,11 The impact on QOL was evaluated by the Dermatology Life Quality Index (DLQI).12
Medication Costs—The cost of prescription drugs was based on data from the Finnish national electronic prescription center. In Finland, all prescriptions are made electronically in the database. We analyzed all topical medications (eg, topical corticosteroids [TCSs], topical calcineurin inhibitors [TCIs], and emollients) and systemic medicaments (eg, antibiotics, antihistamines, cyclosporine, methotrexate, and corticosteroids) prescribed for the treatment of AD. In Finland, dupilumab was introduced for the treatment of severe AD in early 2019, and patients receiving dupilumab were excluded from the study. Over-the-counter medications were not included. The costs for laboratory testing were estimations based on the standard monitoring protocols of the Helsinki University Hospital. All costs were based on the Finnish price level standard for the year 2019.
Inpatient/Outpatient Visits and Sick Leave Due to AD—The number of inpatient and outpatient visits due to AD in the last 12 months was evaluated. Outpatient specialist consultations or nurse appointments at Helsinki University Hospital were verified from electronic patient records. In addition, inpatient treatment and phototherapy sessions were calculated from the database.
We assessed the number of sick leave days from work or educational activities during the last year. All costs of transportation for doctors’ appointments, laboratory monitoring, and phototherapy treatments were summed together to estimate the total transportation cost. Visits to nurse and inpatient visits were not included in the total transportation cost because patients often were hospitalized directly after consultation visits, and nurse appointments often were combined with inpatient and outpatient visits. To calculate the total transportation cost, we used a rate of €0.43 per kilometer measured from the patients’ home addresses, which was the official compensation rate of the Finnish Tax Administration for 2019.13
Statistical Analysis—Statistical analyses were performed using SPSS Statistics 25 (IBM). Descriptive analyses were used to describe baseline characteristics and to evaluate the mean costs of AD. The patients were divided into 2 groups according to POEM: (1) controlled AD (patients with clear skin or only mild AD; POEM score 0–7) and (2) uncontrolled AD (patients with moderate to very severe AD; POEM score 8–28). The Mann-Whitney U statistic was used to evaluate differences between the study groups.
Results
Patient Characteristics—One hundred sixty-seven patients answered the survey, of which 69 (41.3%) were males and 98 (58.7%) were females. There were 16 patients with controlled AD and 148 patients with uncontrolled AD. Three patients did not answer to POEM and were excluded. The baseline characteristics are presented in Table 1 and include self-reported symptoms related to atopy.
The most-used topical treatments were TCSs (n=155; 92.8%) and emollients (n=166; 99.4%). One hundred sixteen (69.5%) patients had used TCIs. The median amount of TCSs used was 300 g/y vs 30 g/y for TCIs (range, 0-5160 g/y) and 1200 g/y for emollients.
Fifteen (9.0%) patients had been hospitalized for AD in the last year. The mean (SD) length of hospitalization was 6.5 (2.8) days. Thirty-four (20.4%) patients received UVB phototherapy. Thirty-four (20.4%) patients were treated with at least 1 antibiotic course for secondary AD infection. Thirty-six (21.6%) patients needed at least 1 oral corticosteroid course for the treatment of an AD flare.
Fifteen (9.0%) patients reported a diagnosed psychiatric illness, and 17 (10.2%) patients were using prescription drugs for psychiatric illness. Forty-nine (29.3%) patients reported anxiety or depression often or very often, 54 (32.3%) patients reported sometimes, 33 (19.8%) patients reported rarely, and only 30 (18.0%) patients reported none.
Medication Costs—Mean medication cost PPY was €457.40 (US $507.34)(Figure 1 and Table 2). On average, one patient spent €87.50 (US $97.05) for TCSs, €121.90 (US $135.21) for emollients, and €225.10 (US $249.68) for TCIs. The average cost PPY for antibiotics was €6.10 (US $6.77). Other systemic treatments, including (US $18.65). Seventeen patients (10.2%) were on methotrexate therapy for AD in the last year, and 1 patient also used cyclosporine. The costs for laboratory monitoring in these patients were included in the direct cost calculations. The mean cost PPY of laboratory monitoring in the whole study cohort was €6.60 (US $7.32). In patients with systemic immunosuppressive therapy, the mean cost PPY for laboratory monitoring was €65.00 (US $72.09). Five patients had been tested for contact dermatitis; the costs of patch tests or other diagnostic tests were not included.
Visits to Health Care Providers—In the last year, patients had an average of 1.83 dermatologist consultations in the tertiary center (Table 2). In addition, the mean number of visits to private dermatologists was 0.61 and 1.42 visits to general practitioners. The mean cost of physician visits was €302.70 (US $335.75) in the tertiary center, €66.60 (US $73.87) in the private sector, and €141.90 (US $157.39) in primary health care. In total, the average cost of doctors’ appointments PPY was €506.30 (US $561.57). The mean estimated distance traveled per visit was 9.5 km.
The mean cost PPY of inpatient treatments was €329.90 (US $365.92) and €239.00 (US $265.09) for UV phototherapy. Only 4 patients had visited a nurse in the last year, with an average cost PPY of €2.50 (US $2.78).
In total, the cost PPY for health care provider visits was €1084.20, which included specialist consultations in a tertiary center and private sector, visits in primary health care, inpatient treatments, UV phototherapy sessions, nurse appointments in a tertiary center, and laboratory monitoring. The average transportation cost PPY was €34.00 (US $37.71). The mean number of visits to health care providers was 8.3 per year. Altogether, the direct cost PPY in the study cohort was €1580.60 (US $1752.39)(Table 2 and Figure 2).
Comparison of Medical Costs in Controlled vs Uncontrolled AD—In the controlled AD group (POEM score <8), the mean medication cost PPY was €567.15 (US $629.13), and the mean total direct cost PPY was €2040.46 (US $2263.24). In the uncontrolled AD group (POEM score ≥8), the mean medication cost PPY was €449.55 (US $498.63), and the mean total direct cost PPY was €1539.39 (US $1707.36)(Table 2). The comparisons of the study groups—controlled vs uncontrolled AD—showed no significant differences regarding medication costs PPY (P=.305, Mann-Whitney U statistic) and total direct costs PPY (P=.361, Mann-Whitney U statistic)(Figure 3). Thus, the distribution of medical costs was similar across all categories of the POEM score.
AD Severity and QOL—The mean (SD) POEM score in the study cohort was 17.9 (6.9). Sixteen (9.6%) patients had clear to almost clear skin or mild AD (POEM score 0–7). Forty-two (25.1%) patients had moderate AD (POEM score 8–16). Most of the patients (106; 63.5%) had severe or very severe AD (POEM score 17–28). According to the Rajka & Langeland score, 5 (3.0%) patients had mild disease (score 34), 81 (48.5%) patients had moderate disease (score 5–7), and 81 (48.5%) patients had severe disease (score 8–9). Eighty-one (48.5%) patients answered that AD affects their lives greatly, and 58 (34.7%) patients answered that it affects their lives extremely. Twenty-five (15.0%) patients answered that AD affects their everyday life to some extent, and only 2 (1.2%) patients answered that AD had little or no effect.
The mean (SD) DLQI was 13 (7.2). Based on the DLQI, 31 (18.6%) patients answered that AD had no effect or only a small effect on QOL (DLQI 0–5). In 36 (21.6%) patients, AD had a moderate effect on QOL (DLQI 6–10). The QOL impact was large (DLQI 11–20) and very large (DLQI 21–30) in 67 (40.1%) and 33 (19.8%) patients, respectively.
There was no significant difference in the impact of disease severity (POEM score) on the decrease of QOL (severe or very severe disease; P=.305, Mann-Whitney U statistic).
Absence From Work or Studies—At the study inclusion, 12 (7.2%) patients were not working or studying. Of the remaining 155 patients, 73 (47.1%) reported absence from work or educational activities due to AD in the last 12 months. The mean (SD) length of absence was 11.6 (10.2) days.
Comment
In this survey-based study of Finnish patients with moderate to severe AD, we observed that AD creates a substantial economic burden14 and negative impact on everyday life and QOL. According to DLQI, AD had a large or very large effect on most of the patients’ (59.9%) lives, and 90.2% of the included patients had self-reported moderate to very severe symptoms (POEM score 8–28). Our observations can partly be explained by characteristics of the Finnish health care system, in which patients with moderate to severe AD mainly are referred to specialist consultation. In the investigated cohort, many patients had used antibiotics (20.4%) and/or oral corticosteroids (21.6%) in the last year for the treatment of AD, which might indicate inadequate treatment of AD in the Finnish health care system.
Motivating patients to remain compliant is one of the main challenges in AD therapy.15 Fear of adverse effects from TCSs is common among patients and may cause poor treatment adherence.16 In a prospective study from the United Kingdom, the use of emollients in moderate to severe AD was considerably lower than AD guidelines recommend—approximately 10 g/d on average in adult patients. The median use of TCSs was between 35 and 38 g/mo.17 In our Finnish patient cohort, the amount of topical treatments was even lower, with a median use of emollients of 3.3 g/d and median use of TCSs of 25 g/mo. In another study from Denmark (N=322), 31% of patients with AD did not redeem their topical prescription medicaments, indicating poor adherence to topical treatment.18
It has been demonstrated that most of the patients’ habituation (tachyphylaxis) to TCSs is due to poor adherence instead of physiologic changes in tissue corticosteroid receptors.19,20 Treatment adherence may be increased by scheduling early follow-up visits and providing adequate therapeutic patient education,21 which requires major efforts by the health care system and a financial investment.
Inadequate treatment will lead to more frequent disease flares and subsequently increase the medical costs for the patients and the health care system.22 In our Finnish patient cohort, a large part of direct treatment costs was due to inpatient treatment (Figure 2) even though only a small proportion of patients had been hospitalized. The patients were frequently young and otherwise in good general health, and they did not necessarily need continuous inpatient treatment and monitoring. In Finland, it will be necessary to develop more cost-effective treatment regimens for patients with AD with severe and frequent flares. Many patients would benefit from subsequent and regular sessions of topical treatment in an outpatient setting. In addition, the prevention of flares in moderate to severe AD will decrease medical costs.23
The mean medication cost PPY was €457.40 (US $507.34), and mean total direct cost PPY was €1579.90 (US $1752.40), which indicates that AD causes a major economic burden to Finnish patients and to the Finnish health care system (Figures 1 and 2).24 We did not observe significant differences between controlled and uncontrolled AD medical costs in our patient cohort (Figure 3), which may have been due to the relatively small sample size of only 16 patients in the controlled AD group. All patients attending the tertiary care hospital had moderate to severe AD, so it is likely that the patients with lower POEM scores had better-controlled disease. The POEM score estimates the grade of AD in the last 7 days, but based on the relapsing course of the disease, the grading score may differ substantially during the year in the same patient depending on the timing.25,26
Topical calcineurin inhibitors comprised almost half of the medication costs (Figure 1), which may be caused by their higher prices compared with TCSs in Finland. In the beginning of 2019, a 50% less expensive biosimilar of tacrolimus ointment 0.1% was introduced to the Finnish market, which might decrease future treatment costs of TCIs. However, availability problems in both topical tacrolimus products were seen throughout 2019, which also may have affected the results in our study cohort. The median use of TCIs was unexpectedly low (only 30 g/y), which may be explained by different application habits. The use of large TCI amounts in some patients may have elevated mean costs.27
In the Finnish public health care system, 40% of the cost for prescription medication and emollients is reimbursed after an initial deductible of €50. Emollients are reimbursed up to an amount of 1500 g/mo. Therefore, patients mostly acquired emollients as prescription medicine and not over-the-counter. Nonprescription medicaments were not included in our study, so the actual costs of topical treatment may have been higher.28
In our cohort, 61.7% of the patients reported food allergies, and 70.1% reported allergic conjunctivitis. However, the study included only questionnaire-based data, and many of these patients probably had symptoms not associated with IgE-mediated allergies. The high prevalence indicates a substantial concomitant burden of more than skin symptoms in patients with AD.29 Nine percent of patients reported a diagnosed psychiatric disorder, and 29.3% had self-reported anxiety or depression often or very often in the last year. Based on these findings, there may be high percentages of undiagnosed psychiatric comorbidities such as depression and anxiety disorders in patients with moderate to severe AD in Finland.30 An important limitation of our study was that the patient data were based on a voluntary and anonymous survey and that depression and anxiety were addressed solely by a single question. In addition, the response rate cannot be analyzed correctly, and the demographics of the survey responders likely will differ substantially from all patients with AD at the university hospital.
Atopic dermatitis had a substantial effect on QOL in our patient cohort. Inadequate treatment of AD is known to negatively affect patient QOL and may lead to hospitalization or frequent oral corticosteroid courses.31,32 In most cases, structured patient education and early follow-up visits may improve patient adherence to treatment and should be considered as an integral part of AD treatment.33 In the investigated Finnish tertiary care hospital, a structured patient education system unfortunately was still lacking, though it has been proven effective elsewhere.34 In addition, patient-centred educational programs are recommended in European guidelines for the treatment of AD.35
Medical costs of AD may increase in the future as new treatments with higher direct costs, such as dupilumab, are introduced. Eichenfeld et al36 analyzed electronic health plan claims in patients with AD with newly introduced systemic therapies and phototherapies after the availability of dupilumab in the United States (March 2017). Mean annualized total cost in all patients was $20,722; the highest in the dupilumab group with $36,505. Compared to our data, the total costs are much higher, but these are likely to rise in Finland in the future if a substantial amount (eg, 1%–5%) of patients will be on advanced therapies, including dupilumab. If advanced therapies will be introduced more broadly in Finland (eg, in the treatment of moderate AD [10%–20% of patients]), they will represent a major direct cost to the health care system. Zimmermann et al37 showed in a cost-utility analysis that dupilumab improves health outcomes but with additional direct costs, and it is likely more cost-effective in patients with severe AD. Conversely, more efficient treatments may improve severe AD, reduce the need for hospitalization and recurrent doctors’ appointments as well as absence from work, and improve patient QOL,38 consequently decreasing indirect medical costs and disease burden. Ariëns et al39 showed in a recent registry-based study that dupilumab treatment induces a notable rise in work productivity and reduction of associated costs in patients with difficult-to-treat AD.
Conclusion
We aimed to analyze the economic burden of AD in Finland before the introduction of dupilumab. It will be interesting to see what the introduction of dupilumab and other novel systemic therapies have on total economic burden and medical costs. Most patients with AD in Finland can achieve disease control with topical treatments, but it is important to efficiently manage the patients who require additional supportive measures and specialist consultations, which may be challenging in the primary health care system because of the relapsing and remitting nature of the disease.
- Nutten S. Atopic dermatitis: global epidemiology and risk factors. Ann Nutr Metab. 2015;66(suppl 1):8-16.
- Eichenfield LF, Tom WL, Chamlin SL, et al. Guidelines of care for the management of atopic dermatitis: section 1. diagnosis and assessment of atopic dermatitis. J Am Acad Dermatol. 2014;70:338-351.
- Yang EJ, Beck KM, Sekhon S, et al. The impact of pediatric atopic dermatitis on families: a review. Pediatr Dermatol. 2019;36:66-71.
- Eckert L, Gupta S, Amand C, et al. Impact of atopic dermatitis on health-related quality of life and productivity in adults in the United States: an analysis using the National Health and Wellness Survey. J Am Acad Dermatol. 2017;77:274-279.
- Drucker AM, Wang AR, Li WQ, et al. The burden of atopic dermatitis: summary of a report for the National Eczema Association. J Invest Dermatol. 2017;137:26-30.
- Ehlken B, Möhrenschlager M, Kugland B, et al. Cost-of-illness study in patients suffering from atopic eczema in Germany. Der Hautarzt. 2006;56:1144-1151.
- Ariëns LFM, van Nimwegen KJM, Shams M, et al. Economic burden of adult patients with moderate to severe atopic dermatitis indicated for systemic treatment. Acta Derm Venereol. 2019;99:762-768.
- Barbeau M, Bpharm HL. Burden of atopic dermatitis in Canada. Int J Dermatol. 2006;45:31-36.
- Verboom P, Hakkaart‐Van Roijen L, Sturkenboom M, et al. The cost of atopic dermatitis in the Netherlands: an international comparison. Br J Dermatol. 2002;147:716-724.
- Gånemo A, Svensson Å, Svedman C, et al. Usefulness of Rajka & Langeland eczema severity score in clinical practice. Acta Derm Venereol. 2016;96:521-524.
- Charman CR, Venn AJ, Williams HC. The Patient-Oriented Eczema Measure: development and initial validation of a new tool for measuring atopic eczema severity from the patients’ perspective. Arch Dermatol. 2004;140:1513-1519.
- Finlay AY, Khan GK. Dermatology Life Quality Index (DLQI): a simple practical measure for routine clinical use. Clin Exp Dermatol. 1994;19:210-216.
- Rehunen A, Reissell E, Honkatukia J, et al. Social and health services: regional changes in need, use and production and future options. Accessed July 20, 2023. http://urn.fi/URN:ISBN:978-952-287-294-4
- Reed B, Blaiss MS. The burden of atopic dermatitis. Allergy Asthma Proc. 2018;39:406-410.
- Koszorú K, Borza J, Gulácsi L, et al. Quality of life in patients with atopic dermatitis. Cutis. 2019;104:174-177.
- Li AW, Yin ES, Antaya RJ. Topical corticosteroid phobia in atopic dermatitis: a systematic review. JAMA Dermatol. 2017;153:1036-1042.
- Choi J, Dawe R, Ibbotson S, et al. Quantitative analysis of topical treatments in atopic dermatitis: unexpectedly low use of emollients and strong correlation of topical corticosteroid use both with depression and concurrent asthma. Br J Dermatol. 2020;182:1017-1025.
- Storm A, Andersen SE, Benfeldt E, et al. One in 3 prescriptions are never redeemed: primary nonadherence in an outpatient clinic. J Am Acad Dermatol. 2008;59:27-33.
- Okwundu N, Cardwell LA, Cline A, et al. Topical corticosteroids for treatment-resistant atopic dermatitis. Cutis. 2018;102:205-209.
- Eicher L, Knop M, Aszodi N, et al. A systematic review of factors influencing treatment adherence in chronic inflammatory skin disease—strategies for optimizing treatment outcome. J Eur Acad Dermatol Venereol. 2019;33:2253-2263.
- Heratizadeh A, Werfel T, Wollenberg A, et al; Arbeitsgemeinschaft Neurodermitisschulung für Erwachsene (ARNE) Study Group. Effects of structured patient education in adults with atopic dermatitis: multicenter randomized controlled trial. J Allergy Clin Immunol. 2017;140:845-853.
- Dierick BJH, van der Molen T, Flokstra-de Blok BMJ, et al. Burden and socioeconomics of asthma, allergic rhinitis, atopic dermatitis and food allergy. Expert Rev Pharmacoecon Outcomes Res. 2020;20:437-453.
- Olsson M, Bajpai R, Yew YW, et al. Associations between health-related quality of life and health care costs among children with atopic dermatitis and their caregivers: a cross-sectional study. Pediatr Dermatol. 2020;37:284-293.
- Bruin-Weller M, Pink AE, Patrizi A, et al. Disease burden and treatment history among adults with atopic dermatitis receiving systemic therapy: baseline characteristics of participants on the EUROSTAD prospective observational study. J Dermatolog Treat. 2021;32:164-173.
- Silverberg JI, Lei D, Yousaf M, et al. Comparison of Patient-Oriented Eczema Measure and Patient-Oriented Scoring Atopic Dermatitis vs Eczema Area and Severity Index and other measures of atopic dermatitis: a validation study. Ann Allergy Asthma Immunol. 2020;125:78-83.
- Kido-Nakahara M, Nakahara T, Yasukochi Y, et al. Patient-oriented eczema measure score: a useful tool for web-based surveys in patients with atopic dermatitis. Acta Derm Venereol. 2020;47:924-925.
- Komura Y, Kogure T, Kawahara K, et al. Economic assessment of actual prescription of drugs for treatment of atopic dermatitis: differences between dermatology and pediatrics in large-scale receipt data. J Dermatol. 2018;45:165-174.
- Thompson AM, Chan A, Torabi M, et al. Eczema moisturizers: allergenic potential, marketing claims, and costs. Dermatol Ther. 2020;33:E14228.
- Egeberg A, Andersen YM, Gislason GH, et al. Prevalence of comorbidity and associated risk factors in adults with atopic dermatitis. Allergy. 2017;72:783-791.
- Kauppi S, Jokelainen J, Timonen M, et al. Adult patients with atopic eczema have a high burden of psychiatric disease: a Finnish nationwide registry study. Acta Derm Venereol. 2019;99:647-651.
- Ali F, Vyas J, Finlay AY. Counting the burden: atopic dermatitis and health-related quality of life. Acta Derm Venereol. 2020;100:adv00161.
- Birdi G, Cooke R, Knibb RC. Impact of atopic dermatitis on quality of life in adults: a systematic review and meta-analysis. Int J Dermatol. 2020;59:E75-E91.
- Gabes M, Tischer C, Apfelbacher C; quality of life working group of the Harmonising Outcome Measures for Eczema (HOME) initiative. Measurement properties of quality-of-life outcome measures for children and adults with eczema: an updated systematic review. Pediatr Allergy Immunol. 2020;31:66-77.
- Staab D, Diepgen TL, Fartasch M, et al. Age related, structured educational programmes for the management of atopic dermatitis in children and adolescents: multicentre, randomised controlled trial. BMJ. 2006;332:933-938.
- Wollenberg A, Barbarot S, Bieber T, et al; European Dermatology Forum (EDF), the European Academy of Dermatology and Venereology (EADV), the European Academy of Allergy and Clinical Immunology (EAACI), the European Task Force on Atopic Dermatitis (ETFAD), European Federation of Allergy and Airways Diseases Patients’ Associations (EFA), the European Society for Dermatology and Psychiatry (ESDaP), the European Society of Pediatric Dermatology (ESPD), Global Allergy and Asthma European Network (GA2LEN) and the European Union of Medical Specialists (UEMS). Consensus-based European guidelines for treatment of atopic eczema (atopic dermatitis) in adults and children: part II. J Eur Acad Dermatol Venereol. 2018;32:850-878.
- Eichenfield LF, DiBonaventura M, Xenakis J, et al. Costs and treatment patterns among patients with atopic dermatitis using advanced therapies in the United States: analysis of a retrospective claims database. Dermatol Ther (Heidelb). 2020;10:791-806.
- Zimmermann M, Rind D, Chapman R, et al. Economic evaluation of dupilumab for moderate-to-severe atopic dermatitis: a cost-utility analysis. J Drugs Dermatol. 2018;17:750-756.
- Mata E, Loh TY, Ludwig C, et al. Pharmacy costs of systemic and topical medications for atopic dermatitis. J Dermatolog Treat. 2019;12:1-3.
- Ariëns LFM, Bakker DS, Spekhorst LS, et al. Rapid and sustained effect of dupilumab on work productivity in patients with difficult-to-treat atopic dermatitis: results from the Dutch BioDay Registry. Acta Derm Venereol. 2021;19;101:adv00573.
- Nutten S. Atopic dermatitis: global epidemiology and risk factors. Ann Nutr Metab. 2015;66(suppl 1):8-16.
- Eichenfield LF, Tom WL, Chamlin SL, et al. Guidelines of care for the management of atopic dermatitis: section 1. diagnosis and assessment of atopic dermatitis. J Am Acad Dermatol. 2014;70:338-351.
- Yang EJ, Beck KM, Sekhon S, et al. The impact of pediatric atopic dermatitis on families: a review. Pediatr Dermatol. 2019;36:66-71.
- Eckert L, Gupta S, Amand C, et al. Impact of atopic dermatitis on health-related quality of life and productivity in adults in the United States: an analysis using the National Health and Wellness Survey. J Am Acad Dermatol. 2017;77:274-279.
- Drucker AM, Wang AR, Li WQ, et al. The burden of atopic dermatitis: summary of a report for the National Eczema Association. J Invest Dermatol. 2017;137:26-30.
- Ehlken B, Möhrenschlager M, Kugland B, et al. Cost-of-illness study in patients suffering from atopic eczema in Germany. Der Hautarzt. 2006;56:1144-1151.
- Ariëns LFM, van Nimwegen KJM, Shams M, et al. Economic burden of adult patients with moderate to severe atopic dermatitis indicated for systemic treatment. Acta Derm Venereol. 2019;99:762-768.
- Barbeau M, Bpharm HL. Burden of atopic dermatitis in Canada. Int J Dermatol. 2006;45:31-36.
- Verboom P, Hakkaart‐Van Roijen L, Sturkenboom M, et al. The cost of atopic dermatitis in the Netherlands: an international comparison. Br J Dermatol. 2002;147:716-724.
- Gånemo A, Svensson Å, Svedman C, et al. Usefulness of Rajka & Langeland eczema severity score in clinical practice. Acta Derm Venereol. 2016;96:521-524.
- Charman CR, Venn AJ, Williams HC. The Patient-Oriented Eczema Measure: development and initial validation of a new tool for measuring atopic eczema severity from the patients’ perspective. Arch Dermatol. 2004;140:1513-1519.
- Finlay AY, Khan GK. Dermatology Life Quality Index (DLQI): a simple practical measure for routine clinical use. Clin Exp Dermatol. 1994;19:210-216.
- Rehunen A, Reissell E, Honkatukia J, et al. Social and health services: regional changes in need, use and production and future options. Accessed July 20, 2023. http://urn.fi/URN:ISBN:978-952-287-294-4
- Reed B, Blaiss MS. The burden of atopic dermatitis. Allergy Asthma Proc. 2018;39:406-410.
- Koszorú K, Borza J, Gulácsi L, et al. Quality of life in patients with atopic dermatitis. Cutis. 2019;104:174-177.
- Li AW, Yin ES, Antaya RJ. Topical corticosteroid phobia in atopic dermatitis: a systematic review. JAMA Dermatol. 2017;153:1036-1042.
- Choi J, Dawe R, Ibbotson S, et al. Quantitative analysis of topical treatments in atopic dermatitis: unexpectedly low use of emollients and strong correlation of topical corticosteroid use both with depression and concurrent asthma. Br J Dermatol. 2020;182:1017-1025.
- Storm A, Andersen SE, Benfeldt E, et al. One in 3 prescriptions are never redeemed: primary nonadherence in an outpatient clinic. J Am Acad Dermatol. 2008;59:27-33.
- Okwundu N, Cardwell LA, Cline A, et al. Topical corticosteroids for treatment-resistant atopic dermatitis. Cutis. 2018;102:205-209.
- Eicher L, Knop M, Aszodi N, et al. A systematic review of factors influencing treatment adherence in chronic inflammatory skin disease—strategies for optimizing treatment outcome. J Eur Acad Dermatol Venereol. 2019;33:2253-2263.
- Heratizadeh A, Werfel T, Wollenberg A, et al; Arbeitsgemeinschaft Neurodermitisschulung für Erwachsene (ARNE) Study Group. Effects of structured patient education in adults with atopic dermatitis: multicenter randomized controlled trial. J Allergy Clin Immunol. 2017;140:845-853.
- Dierick BJH, van der Molen T, Flokstra-de Blok BMJ, et al. Burden and socioeconomics of asthma, allergic rhinitis, atopic dermatitis and food allergy. Expert Rev Pharmacoecon Outcomes Res. 2020;20:437-453.
- Olsson M, Bajpai R, Yew YW, et al. Associations between health-related quality of life and health care costs among children with atopic dermatitis and their caregivers: a cross-sectional study. Pediatr Dermatol. 2020;37:284-293.
- Bruin-Weller M, Pink AE, Patrizi A, et al. Disease burden and treatment history among adults with atopic dermatitis receiving systemic therapy: baseline characteristics of participants on the EUROSTAD prospective observational study. J Dermatolog Treat. 2021;32:164-173.
- Silverberg JI, Lei D, Yousaf M, et al. Comparison of Patient-Oriented Eczema Measure and Patient-Oriented Scoring Atopic Dermatitis vs Eczema Area and Severity Index and other measures of atopic dermatitis: a validation study. Ann Allergy Asthma Immunol. 2020;125:78-83.
- Kido-Nakahara M, Nakahara T, Yasukochi Y, et al. Patient-oriented eczema measure score: a useful tool for web-based surveys in patients with atopic dermatitis. Acta Derm Venereol. 2020;47:924-925.
- Komura Y, Kogure T, Kawahara K, et al. Economic assessment of actual prescription of drugs for treatment of atopic dermatitis: differences between dermatology and pediatrics in large-scale receipt data. J Dermatol. 2018;45:165-174.
- Thompson AM, Chan A, Torabi M, et al. Eczema moisturizers: allergenic potential, marketing claims, and costs. Dermatol Ther. 2020;33:E14228.
- Egeberg A, Andersen YM, Gislason GH, et al. Prevalence of comorbidity and associated risk factors in adults with atopic dermatitis. Allergy. 2017;72:783-791.
- Kauppi S, Jokelainen J, Timonen M, et al. Adult patients with atopic eczema have a high burden of psychiatric disease: a Finnish nationwide registry study. Acta Derm Venereol. 2019;99:647-651.
- Ali F, Vyas J, Finlay AY. Counting the burden: atopic dermatitis and health-related quality of life. Acta Derm Venereol. 2020;100:adv00161.
- Birdi G, Cooke R, Knibb RC. Impact of atopic dermatitis on quality of life in adults: a systematic review and meta-analysis. Int J Dermatol. 2020;59:E75-E91.
- Gabes M, Tischer C, Apfelbacher C; quality of life working group of the Harmonising Outcome Measures for Eczema (HOME) initiative. Measurement properties of quality-of-life outcome measures for children and adults with eczema: an updated systematic review. Pediatr Allergy Immunol. 2020;31:66-77.
- Staab D, Diepgen TL, Fartasch M, et al. Age related, structured educational programmes for the management of atopic dermatitis in children and adolescents: multicentre, randomised controlled trial. BMJ. 2006;332:933-938.
- Wollenberg A, Barbarot S, Bieber T, et al; European Dermatology Forum (EDF), the European Academy of Dermatology and Venereology (EADV), the European Academy of Allergy and Clinical Immunology (EAACI), the European Task Force on Atopic Dermatitis (ETFAD), European Federation of Allergy and Airways Diseases Patients’ Associations (EFA), the European Society for Dermatology and Psychiatry (ESDaP), the European Society of Pediatric Dermatology (ESPD), Global Allergy and Asthma European Network (GA2LEN) and the European Union of Medical Specialists (UEMS). Consensus-based European guidelines for treatment of atopic eczema (atopic dermatitis) in adults and children: part II. J Eur Acad Dermatol Venereol. 2018;32:850-878.
- Eichenfield LF, DiBonaventura M, Xenakis J, et al. Costs and treatment patterns among patients with atopic dermatitis using advanced therapies in the United States: analysis of a retrospective claims database. Dermatol Ther (Heidelb). 2020;10:791-806.
- Zimmermann M, Rind D, Chapman R, et al. Economic evaluation of dupilumab for moderate-to-severe atopic dermatitis: a cost-utility analysis. J Drugs Dermatol. 2018;17:750-756.
- Mata E, Loh TY, Ludwig C, et al. Pharmacy costs of systemic and topical medications for atopic dermatitis. J Dermatolog Treat. 2019;12:1-3.
- Ariëns LFM, Bakker DS, Spekhorst LS, et al. Rapid and sustained effect of dupilumab on work productivity in patients with difficult-to-treat atopic dermatitis: results from the Dutch BioDay Registry. Acta Derm Venereol. 2021;19;101:adv00573.
Practice Points
- Atopic dermatitis (AD) causes a substantial economic burden.
- Atopic dermatitis profoundly affects quality of life and is associated with psychiatric comorbidities. With effective treatments, AD-associated comorbidities may be decreased and the economic burden for the patient and health care system reduced.