User login
Richard Franki is the associate editor who writes and creates graphs. He started with the company in 1987, when it was known as the International Medical News Group. In his years as a journalist, Richard has worked for Cap Cities/ABC, Disney, Harcourt, Elsevier, Quadrant, Frontline, and Internet Brands. In the 1990s, he was a contributor to the ill-fated Indications column, predecessor of Livin' on the MDedge.
General surgeons each generate $2.17 million for hospitals
General surgeons are generating 16.6% more revenue for hospitals in 2015 than they did in 2012, according to a survey by physician recruitment firm Merritt Hawkins.
In 2015, general surgeons generated an average of $2.17 million in net revenue for their affiliated hospitals, compared with $1.86 million in 2012, when Merritt Hawkins last conducted its survey of hospital chief financial officers.
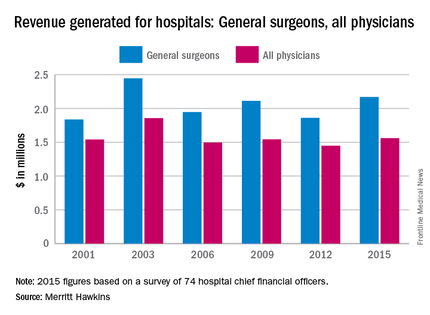
Of the 18 specialties included in the survey, only orthopedic surgeons ($2.75 million), invasive cardiologists ($2.448 million), and neurosurgeons ($2.446 million), produced more revenue than did general surgeons. Net revenue generated by physicians in all 18 specialties averaged $1.56 million in 2015, which was up 7.7% over the $1.45 million generated in 2012. Average revenue for specialists was up 12.8%, going from $1.42 million in 2012 to $1.61 million in 2015, the survey showed.
The survey (available for download here) was completed by 74 hospital chief financial officers. Despite the small number, Merritt Hawkins said that the “results are reliable and accurate, in large part because the overall number for average annual revenue generated by all physician specialties for their affiliated hospitals has remained virtually unchanged” over the course of six surveys spanning 14 years.
General surgeons are generating 16.6% more revenue for hospitals in 2015 than they did in 2012, according to a survey by physician recruitment firm Merritt Hawkins.
In 2015, general surgeons generated an average of $2.17 million in net revenue for their affiliated hospitals, compared with $1.86 million in 2012, when Merritt Hawkins last conducted its survey of hospital chief financial officers.
Of the 18 specialties included in the survey, only orthopedic surgeons ($2.75 million), invasive cardiologists ($2.448 million), and neurosurgeons ($2.446 million), produced more revenue than did general surgeons. Net revenue generated by physicians in all 18 specialties averaged $1.56 million in 2015, which was up 7.7% over the $1.45 million generated in 2012. Average revenue for specialists was up 12.8%, going from $1.42 million in 2012 to $1.61 million in 2015, the survey showed.
The survey (available for download here) was completed by 74 hospital chief financial officers. Despite the small number, Merritt Hawkins said that the “results are reliable and accurate, in large part because the overall number for average annual revenue generated by all physician specialties for their affiliated hospitals has remained virtually unchanged” over the course of six surveys spanning 14 years.

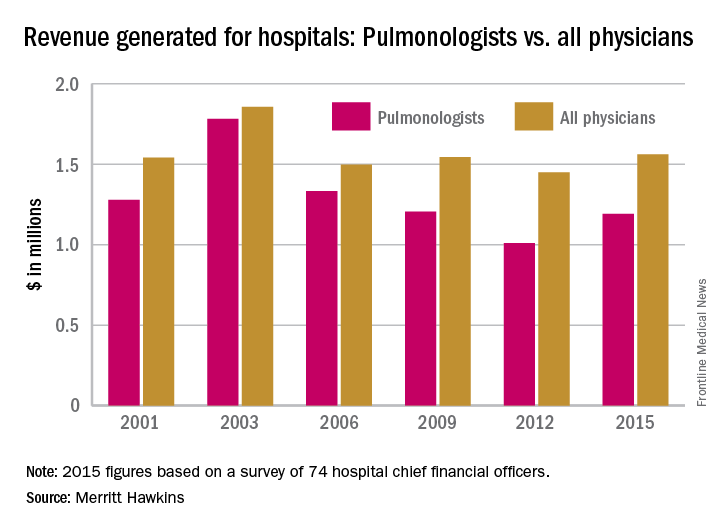
Pulmonologists’ hospital revenue up almost 18% since 2012
Pulmonologists generated 17.9% more revenue for hospitals in 2015 than they did in 2012, according to a survey by physician recruitment firm Merritt Hawkins.
In 2015, pulmonologists generated $1.19 million in average net revenue for their affiliated hospitals, compared with $1.01 million in 2012, when Merritt Hawkins last conducted its survey of hospital chief financial officers.
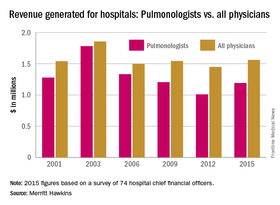
Net revenue generated by physicians in all 18 specialties included in the survey averaged $1.56 million in 2015, which was up 7.7% over the $1.45 million generated in 2012. Average revenue for specialists was up 12.8% – going from $1.42 million in 2012 to $1.61 million in 2015 – while revenue generated by primary care physicians dropped 10.5% from $1.56 million in 2012 to $1.4 million in 2015, the survey showed.
Since specialists’ net revenue is at least partly influenced by patient demographics, those who see more patients over age 65 years, including pulmonologists, may “generate a disproportionate number of medical procedures and tests,” and with “over 10,000 Baby Boomers turning 65 every day,” the demand for those specialists is likely to increase, the report noted.
The survey (available for download here) was completed by 74 hospital chief financial officers. Despite the small number, Merritt Hawkins said that the “results are reliable and accurate, in large part because the overall number for average annual revenue generated by all physician specialties for their affiliated hospitals has remained virtually unchanged” over the course of six surveys spanning 14 years.
Pulmonologists generated 17.9% more revenue for hospitals in 2015 than they did in 2012, according to a survey by physician recruitment firm Merritt Hawkins.
In 2015, pulmonologists generated $1.19 million in average net revenue for their affiliated hospitals, compared with $1.01 million in 2012, when Merritt Hawkins last conducted its survey of hospital chief financial officers.
Net revenue generated by physicians in all 18 specialties included in the survey averaged $1.56 million in 2015, which was up 7.7% over the $1.45 million generated in 2012. Average revenue for specialists was up 12.8% – going from $1.42 million in 2012 to $1.61 million in 2015 – while revenue generated by primary care physicians dropped 10.5% from $1.56 million in 2012 to $1.4 million in 2015, the survey showed.
Since specialists’ net revenue is at least partly influenced by patient demographics, those who see more patients over age 65 years, including pulmonologists, may “generate a disproportionate number of medical procedures and tests,” and with “over 10,000 Baby Boomers turning 65 every day,” the demand for those specialists is likely to increase, the report noted.
The survey (available for download here) was completed by 74 hospital chief financial officers. Despite the small number, Merritt Hawkins said that the “results are reliable and accurate, in large part because the overall number for average annual revenue generated by all physician specialties for their affiliated hospitals has remained virtually unchanged” over the course of six surveys spanning 14 years.
Psychiatrists’ hospital revenue down since 2012
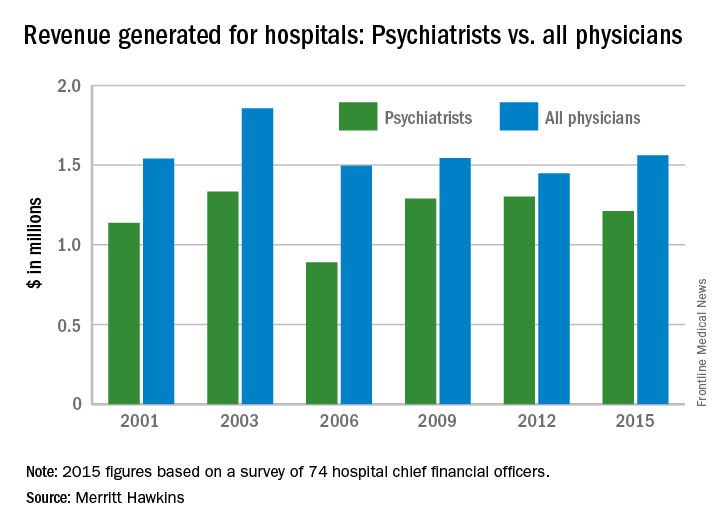
Psychiatrists generated 7.1% less revenue for hospitals in 2015 than they did in 2012, according to a survey by physician recruitment firm Merritt Hawkins.
In 2015, psychiatrists generated $1.21 million in average net revenue for their affiliated hospitals, compared with $1.3 million in 2012, when Merritt Hawkins last conducted its survey of hospital chief financial officers.

Net revenue generated by physicians in all 18 specialties included in the survey averaged $1.56 million in 2015, which was up 7.6% over the $1.45 million generated in 2012. Average net revenue for specialists was up 13.4% – going from $1.42 million in 2012 to $1.61 million in 2015 – while average net revenue generated by primary care physicians dropped 10.2%, from $1.56 million in 2012 to $1.4 million in 2015, the survey showed.
The survey (available for download here) was completed by 74 hospital chief financial officers. Despite the small number, Merritt Hawkins said the “results are reliable and accurate, in large part because the overall number for average annual revenue generated by all physician specialties for their affiliated hospitals has remained virtually unchanged” over the course of six surveys spanning 14 years.
Psychiatrists generated 7.1% less revenue for hospitals in 2015 than they did in 2012, according to a survey by physician recruitment firm Merritt Hawkins.
In 2015, psychiatrists generated $1.21 million in average net revenue for their affiliated hospitals, compared with $1.3 million in 2012, when Merritt Hawkins last conducted its survey of hospital chief financial officers.
Net revenue generated by physicians in all 18 specialties included in the survey averaged $1.56 million in 2015, which was up 7.6% over the $1.45 million generated in 2012. Average net revenue for specialists was up 13.4% – going from $1.42 million in 2012 to $1.61 million in 2015 – while average net revenue generated by primary care physicians dropped 10.2%, from $1.56 million in 2012 to $1.4 million in 2015, the survey showed.
The survey (available for download here) was completed by 74 hospital chief financial officers. Despite the small number, Merritt Hawkins said the “results are reliable and accurate, in large part because the overall number for average annual revenue generated by all physician specialties for their affiliated hospitals has remained virtually unchanged” over the course of six surveys spanning 14 years.
Ob.gyns.’ hospital revenue up 10% since 2012
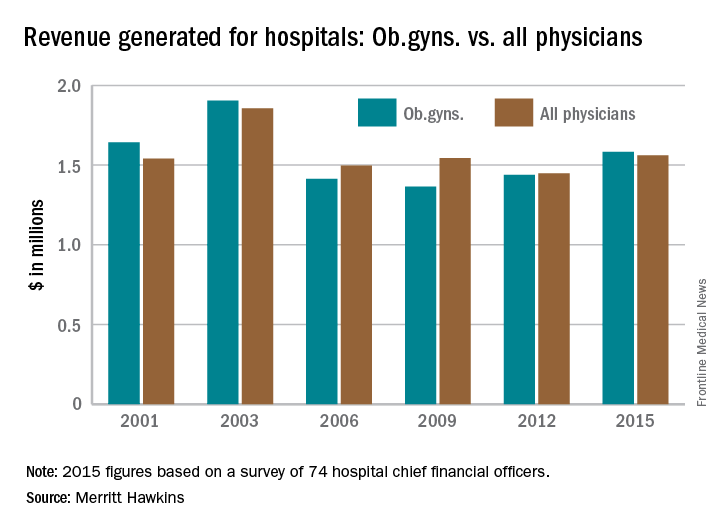
Obstetrician-gynecologists generated 10% more revenue for hospitals in 2015 than they did in 2012, according to a survey by physician recruitment firm Merritt Hawkins.
In 2015, ob.gyns. generated $1.58 million in average net revenue for their affiliated hospitals, compared with $1.44 million in 2012. Meanwhile, average net hospital revenue generated by all 18 specialties included in the survey increased 7.7% – going from $1.45 million to $1.56 million, according to Merritt Hawkins’ most recent survey of hospital chief financial officers.

Average net revenue for specialists, by comparison, was up 12.8%, climbing from $1.4 million in 2012 to $1.6 million in 2015. For primary care physicians, the 2015 figure was $1.4 million, compared with $1.56 million in 2012 – a drop of 10.5%, Merritt Hawkins reported.
The survey (available for download here) was completed by 74 hospital chief financial officers. Despite the small number, Merritt Hawkins said that the “results are reliable and accurate, in large part because the overall number for average annual revenue generated by all physician specialties for their affiliated hospitals has remained virtually unchanged” over the course of six surveys spanning 14 years.
Obstetrician-gynecologists generated 10% more revenue for hospitals in 2015 than they did in 2012, according to a survey by physician recruitment firm Merritt Hawkins.
In 2015, ob.gyns. generated $1.58 million in average net revenue for their affiliated hospitals, compared with $1.44 million in 2012. Meanwhile, average net hospital revenue generated by all 18 specialties included in the survey increased 7.7% – going from $1.45 million to $1.56 million, according to Merritt Hawkins’ most recent survey of hospital chief financial officers.
Average net revenue for specialists, by comparison, was up 12.8%, climbing from $1.4 million in 2012 to $1.6 million in 2015. For primary care physicians, the 2015 figure was $1.4 million, compared with $1.56 million in 2012 – a drop of 10.5%, Merritt Hawkins reported.
The survey (available for download here) was completed by 74 hospital chief financial officers. Despite the small number, Merritt Hawkins said that the “results are reliable and accurate, in large part because the overall number for average annual revenue generated by all physician specialties for their affiliated hospitals has remained virtually unchanged” over the course of six surveys spanning 14 years.
Oncologists/hematologists’ hospital revenue down slightly since 2012
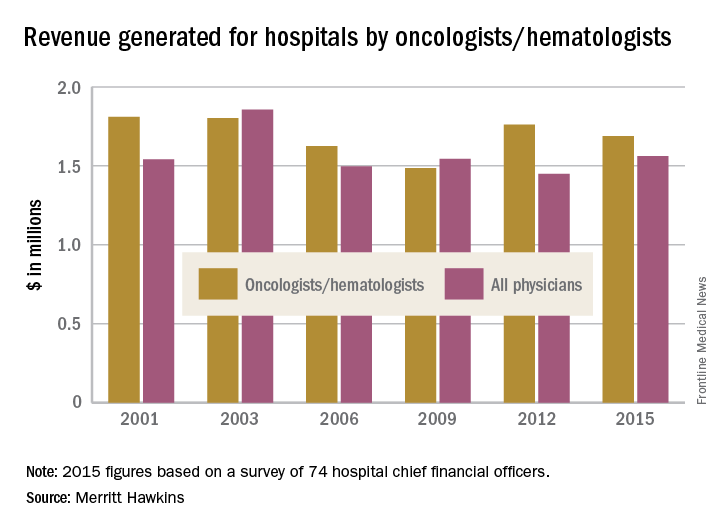
Oncologists and hematologists are generating 4.1% less revenue for hospitals than they did in 2012, according to a survey by physician recruitment firm Merritt Hawkins.
In 2015, oncologists/hematologists generated $1.69 million in net revenue for their affiliated hospitals, compared with $1.76 million in 2012, when Merritt Hawkins last conducted its survey of hospital chief financial officers.

Net revenue generated by physicians in all 18 specialties included in the survey averaged $1.56 million in 2015, which was up 7.7% over the $1.45 million generated in 2012. Average revenue for specialists was up 12.8%, going from $1.42 million in 2012 to $1.61 million in 2015, the survey showed.
The survey was completed by 74 hospital chief financial officers. Despite the small number, Merritt Hawkins noted that the “results are reliable and accurate, in large part because the overall number for average annual revenue generated by all physician specialties for their affiliated hospitals has remained virtually unchanged” over the course of six surveys spanning 14 years.
Oncologists and hematologists are generating 4.1% less revenue for hospitals than they did in 2012, according to a survey by physician recruitment firm Merritt Hawkins.
In 2015, oncologists/hematologists generated $1.69 million in net revenue for their affiliated hospitals, compared with $1.76 million in 2012, when Merritt Hawkins last conducted its survey of hospital chief financial officers.
Net revenue generated by physicians in all 18 specialties included in the survey averaged $1.56 million in 2015, which was up 7.7% over the $1.45 million generated in 2012. Average revenue for specialists was up 12.8%, going from $1.42 million in 2012 to $1.61 million in 2015, the survey showed.
The survey was completed by 74 hospital chief financial officers. Despite the small number, Merritt Hawkins noted that the “results are reliable and accurate, in large part because the overall number for average annual revenue generated by all physician specialties for their affiliated hospitals has remained virtually unchanged” over the course of six surveys spanning 14 years.
Neurologists’ hospital revenue up almost 50% since 2012
Neurologists generated 48% more revenue for hospitals in 2015 than they did in 2012, according to a survey by physician recruitment firm Merritt Hawkins.
In 2015, neurologists generated $1.03 million in net revenue for their affiliated hospitals, compared with $691,000 in 2012. Meanwhile, hospital revenue generated by all physicians increased 7.7% – going from $1.45 million to $1.56 million, according to Merritt Hawkins’ most recent survey of hospital chief financial officers.
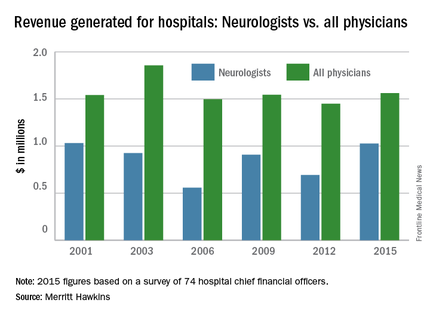
Average revenue for specialists, by comparison, was up 12.8%, going from $1.4 million in 2012 to $1.6 million in 2015. For primary care physicians, the 2015 figure was $1.4 million, compared with $1.56 million in 2012 – a drop of 10.5%, Merritt Hawkins reported.
Since specialists’ net revenue is at least partly influenced by patient demographics, those who see more patients over age 65 years, including neurologists, may “generate a disproportionate number of medical procedures and tests,” and with “over 10,000 Baby Boomers turning 65 every day,” the demand for those specialists is likely to increase, the report noted.
The survey (available for download here) was completed by 74 hospital chief financial officers. Despite the small number, Merritt Hawkins said that the “results are reliable and accurate, in large part because the overall number for average annual revenue generated by all physician specialties for their affiliated hospitals has remained virtually unchanged” over the course of six surveys spanning 14 years.
Neurologists generated 48% more revenue for hospitals in 2015 than they did in 2012, according to a survey by physician recruitment firm Merritt Hawkins.
In 2015, neurologists generated $1.03 million in net revenue for their affiliated hospitals, compared with $691,000 in 2012. Meanwhile, hospital revenue generated by all physicians increased 7.7% – going from $1.45 million to $1.56 million, according to Merritt Hawkins’ most recent survey of hospital chief financial officers.
Average revenue for specialists, by comparison, was up 12.8%, going from $1.4 million in 2012 to $1.6 million in 2015. For primary care physicians, the 2015 figure was $1.4 million, compared with $1.56 million in 2012 – a drop of 10.5%, Merritt Hawkins reported.
Since specialists’ net revenue is at least partly influenced by patient demographics, those who see more patients over age 65 years, including neurologists, may “generate a disproportionate number of medical procedures and tests,” and with “over 10,000 Baby Boomers turning 65 every day,” the demand for those specialists is likely to increase, the report noted.
The survey (available for download here) was completed by 74 hospital chief financial officers. Despite the small number, Merritt Hawkins said that the “results are reliable and accurate, in large part because the overall number for average annual revenue generated by all physician specialties for their affiliated hospitals has remained virtually unchanged” over the course of six surveys spanning 14 years.

Hepatocellular carcinoma risk quantified in PBC patients
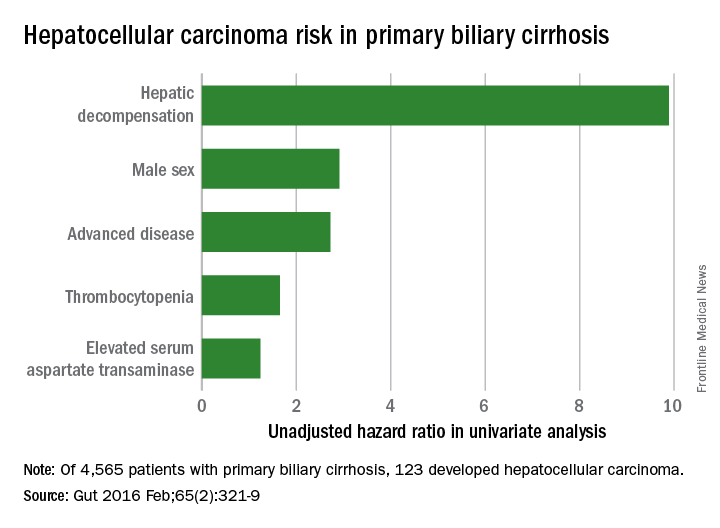
Biochemical nonresponse was the most significant predictor of future risk for developing hepatocellular carcinoma among an international cohort of patients with primary biliary cirrhosis (PBC).
In a multivariable analysis, nonresponse to treatment of PBC after 12 months had a hazard ratio of 3.44 (P less than .0001) for development of hepatocellular carcinoma (HCC) in the multicenter study involving 4,565 patients and an observation period of more than 40 years, said Dr. Palak J. Trivedi of the Centre for Liver Research at the University of Birmingham (England) and his associates (Gut. 2016 Feb;65[2]:321-9).
A total of 123 study patients developed HCC, for an incidence of 3.4 cases per 1,000 patient-years. In a univariate analysis, factors at diagnosis of PBC that were associated with future HCC were hepatic decompensation (HR, 9.89), male sex (HR, 2.91), advanced disease (HR, 2.72), thrombocytopenia (HR, 1.65), and elevated serum aspartate transaminase (HR, 1.24).
Nontreatment with ursodeoxycholic acid was not associated with HCC development, but biochemical nonresponse was predictive in both early-stage and advanced disease, and when only male patients were considered, Dr. Trivedi and his associates noted.

PBC patients who do not respond to ursodeoxycholic acid (UDCA) therapy might have high plasma concentrations of bile acids – in particular, chenodeoxycholic acid – because there is incomplete replacement by UDCA, or UDCA is not completely conjugated with taurine. This in turn could also contribute to both the null response and the induction of carcinogenesis via intrahepatic accumulation of bile acids.
Dr. Alejandra Altamirano-Barrera of the liver research unit at Medica Sur Clinic and Foundation, Mexico City, and associates commented on Dr. Trivedi’s study in Annals of Hepatology (2016;15[3]:453-4).
Biochemical nonresponse was the most significant predictor of future risk for developing hepatocellular carcinoma among an international cohort of patients with primary biliary cirrhosis (PBC).
In a multivariable analysis, nonresponse to treatment of PBC after 12 months had a hazard ratio of 3.44 (P less than .0001) for development of hepatocellular carcinoma (HCC) in the multicenter study involving 4,565 patients and an observation period of more than 40 years, said Dr. Palak J. Trivedi of the Centre for Liver Research at the University of Birmingham (England) and his associates (Gut. 2016 Feb;65[2]:321-9).
A total of 123 study patients developed HCC, for an incidence of 3.4 cases per 1,000 patient-years. In a univariate analysis, factors at diagnosis of PBC that were associated with future HCC were hepatic decompensation (HR, 9.89), male sex (HR, 2.91), advanced disease (HR, 2.72), thrombocytopenia (HR, 1.65), and elevated serum aspartate transaminase (HR, 1.24).
Nontreatment with ursodeoxycholic acid was not associated with HCC development, but biochemical nonresponse was predictive in both early-stage and advanced disease, and when only male patients were considered, Dr. Trivedi and his associates noted.
FROM GUT
Seasonal flu holding strong in New Jersey
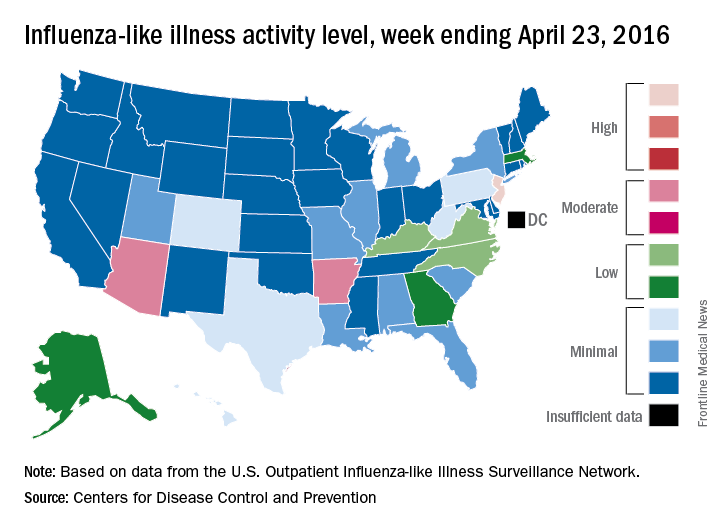
The 2015-2016 seasonal influenza virus has gotten hold of New Jersey and just won’t let go, according to the latest data from the Centers for Disease Control and Prevention.
For the week ending April 23, 2016, influenza-like illness (ILI) activity in the United States remained at level 10 on the CDC’s 1-10 scale for the 11th consecutive week, even as the country’s overall proportion of outpatient visits for ILI dropped to 2.0%, which is below the national baseline of 2.1%, the CDC reported.

Two other states – Arizona and Arkansas – joined New Jersey in bucking the trend of decreasing ILI activity, as both moved up to level 7 and the high end of the “moderate” range. Arizona had been at level 5 the week before, while Arkansas was at level 4. No other state was above level 5 for the most recent week, and 27 states were at level 1, data from the CDC’s Influenza-like Illness Surveillance Network (ILINet) show.
Four flu-related pediatric deaths were reported during the week ending April 23, only one of which occurred that week. The total number of pediatric deaths rose to 60 for the 2015-2016 season, with 27 states and Puerto Rico reporting deaths so far, the CDC noted.
The CDC also reported a cumulative influenza-associated hospitalization rate for the season of 29.8 such hospitalizations per 100,000 population. This data was based on 8,239 laboratory-confirmed influenza-associated hospitalizations reported between October 1, 2015 and April 23, 2016. The highest rate of hospitalization was among adults aged 65 years or older (79.6 per 100,000 population), followed by adults aged 50-64 (43.1 per 100,000 population) and children aged 0-4 years (40.5 per 100,000 population). Among all hospitalizations, 6,254 (75.9%) were associated with influenza A, 1,905 (23.1%) with influenza B, 41 (0.5%) with influenza A and B co-infection, and 39 (0.5%) had no virus type information.
The 2015-2016 seasonal influenza virus has gotten hold of New Jersey and just won’t let go, according to the latest data from the Centers for Disease Control and Prevention.
For the week ending April 23, 2016, influenza-like illness (ILI) activity in the United States remained at level 10 on the CDC’s 1-10 scale for the 11th consecutive week, even as the country’s overall proportion of outpatient visits for ILI dropped to 2.0%, which is below the national baseline of 2.1%, the CDC reported.
Two other states – Arizona and Arkansas – joined New Jersey in bucking the trend of decreasing ILI activity, as both moved up to level 7 and the high end of the “moderate” range. Arizona had been at level 5 the week before, while Arkansas was at level 4. No other state was above level 5 for the most recent week, and 27 states were at level 1, data from the CDC’s Influenza-like Illness Surveillance Network (ILINet) show.
Four flu-related pediatric deaths were reported during the week ending April 23, only one of which occurred that week. The total number of pediatric deaths rose to 60 for the 2015-2016 season, with 27 states and Puerto Rico reporting deaths so far, the CDC noted.
The CDC also reported a cumulative influenza-associated hospitalization rate for the season of 29.8 such hospitalizations per 100,000 population. This data was based on 8,239 laboratory-confirmed influenza-associated hospitalizations reported between October 1, 2015 and April 23, 2016. The highest rate of hospitalization was among adults aged 65 years or older (79.6 per 100,000 population), followed by adults aged 50-64 (43.1 per 100,000 population) and children aged 0-4 years (40.5 per 100,000 population). Among all hospitalizations, 6,254 (75.9%) were associated with influenza A, 1,905 (23.1%) with influenza B, 41 (0.5%) with influenza A and B co-infection, and 39 (0.5%) had no virus type information.
PBC: Female predominance lower than expected
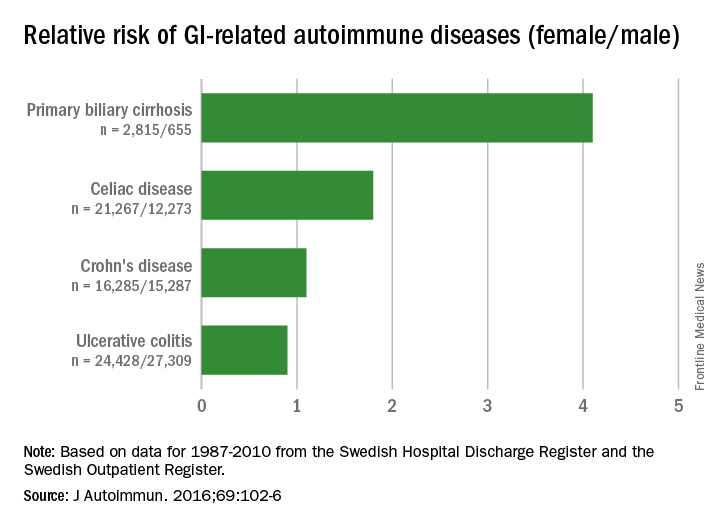
The female-to-male predominance of primary biliary cholangitis (PBC), formerly cirrhosis, is much lower than previously believed, according to data from Swedish national registers.
Looking at a number of diseases thought to have at least some basis in autoimmunity, researchers found that the relative risk of PBC for women, compared with men, was 4.1, suggesting that, although it remains a disease predominantly affecting women, its prevalence in men might actually be higher than previously thought.
Of the three other gastrointestinal conditions among the 32 autoimmune diseases examined, one showed a female predominance, one showed no difference, and one had a male predominance, reported Dr. Jianguang Ji and his associates at Lund (Sweden) University (J Autoimmune. 2016;69:102-6).
Celiac disease had a slight female predominance, with a relative risk for women of 1.8, compared with men. There was no difference for Crohn’s disease (RR, 1.1), and ulcerative colitis had a slight male predominance (RR, 0.9), the investigators reported.

The situation was similar for the larger group of conditions: Eighteen showed a female predominance, 7 had no difference, and 7 showed a male predominance, they noted.
“Most review papers claim that the vast majority of autoimmune diseases have a striking female predominance, and most of them cited that more than 80% of cases affected are women. In this population-based study of 32 specific autoimmune diseases with more than 20 years of follow-up, we found that the incidence in women was only 60% higher as compared to that in men,” Dr. Ji and his associates wrote.
The investigators searched the Swedish Hospital Discharge Register and the Swedish Outpatient Register and found data on 403,757 individuals who had been diagnosed with one or more of the 32 autoimmune diseases between 1987 and 2010. About 62% of the subjects were female.
Dr. Ji and his associates had no conflicts of interest to report. The study was supported by the Swedish Research Council and Region Skåne.
The female-to-male predominance of primary biliary cholangitis (PBC), formerly cirrhosis, is much lower than previously believed, according to data from Swedish national registers.
Looking at a number of diseases thought to have at least some basis in autoimmunity, researchers found that the relative risk of PBC for women, compared with men, was 4.1, suggesting that, although it remains a disease predominantly affecting women, its prevalence in men might actually be higher than previously thought.
Of the three other gastrointestinal conditions among the 32 autoimmune diseases examined, one showed a female predominance, one showed no difference, and one had a male predominance, reported Dr. Jianguang Ji and his associates at Lund (Sweden) University (J Autoimmune. 2016;69:102-6).
Celiac disease had a slight female predominance, with a relative risk for women of 1.8, compared with men. There was no difference for Crohn’s disease (RR, 1.1), and ulcerative colitis had a slight male predominance (RR, 0.9), the investigators reported.
The situation was similar for the larger group of conditions: Eighteen showed a female predominance, 7 had no difference, and 7 showed a male predominance, they noted.
“Most review papers claim that the vast majority of autoimmune diseases have a striking female predominance, and most of them cited that more than 80% of cases affected are women. In this population-based study of 32 specific autoimmune diseases with more than 20 years of follow-up, we found that the incidence in women was only 60% higher as compared to that in men,” Dr. Ji and his associates wrote.
The investigators searched the Swedish Hospital Discharge Register and the Swedish Outpatient Register and found data on 403,757 individuals who had been diagnosed with one or more of the 32 autoimmune diseases between 1987 and 2010. About 62% of the subjects were female.
Dr. Ji and his associates had no conflicts of interest to report. The study was supported by the Swedish Research Council and Region Skåne.
FROM THE JOURNAL OF AUTOIMMUNITY
U.S. flu activity down again, except in New Jersey
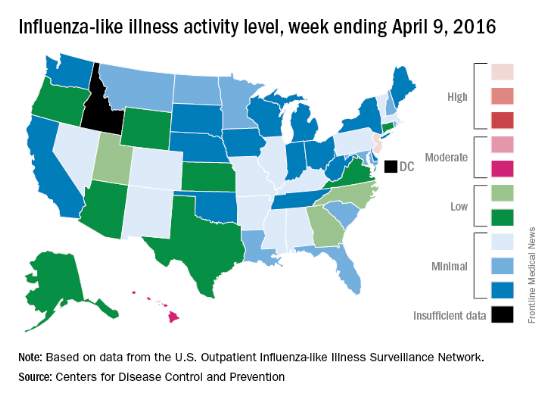
Overall activity of influenza-like illness (ILI) in the United States continued to fall, but New Jersey took a turn for the worse during the week ending April 9, 2016, according to the Centers for Disease Control and Prevention.
New Jersey’s ILI activity level went from 8 the previous week to 10 on the CDC’s 1-10 scale. For the week ending April 9, it was the only U.S. state in the “high” range, with Hawaii the next highest at level 6 – the only state in the “moderate” range, the CDC reported.

Nationwide, the proportion of outpatient visits for ILI was 2.1%, which is at the national baseline of 2.1% and down from 2.5% the week before. That number has now dropped for 4 consecutive weeks since hitting a season high of 3.7% for the week ending March 12. The CDC also reported a cumulative rate of 26.6 influenza-associated hospitalizations per 100,000 population.
Ten flu-related pediatric deaths were reported during the week, of which only one occurred during the week. A total of 50 flu-related pediatric deaths have been reported during the 2015-2016 season, the CDC said. The overall proportion of deaths attributed to pneumonia and influenza was below the system-specific threshold in the National Center for Health Statistics Mortality Surveillance System, but above the system-specific threshold in the 122 Cities Mortality Reporting System.
Overall activity of influenza-like illness (ILI) in the United States continued to fall, but New Jersey took a turn for the worse during the week ending April 9, 2016, according to the Centers for Disease Control and Prevention.
New Jersey’s ILI activity level went from 8 the previous week to 10 on the CDC’s 1-10 scale. For the week ending April 9, it was the only U.S. state in the “high” range, with Hawaii the next highest at level 6 – the only state in the “moderate” range, the CDC reported.
Nationwide, the proportion of outpatient visits for ILI was 2.1%, which is at the national baseline of 2.1% and down from 2.5% the week before. That number has now dropped for 4 consecutive weeks since hitting a season high of 3.7% for the week ending March 12. The CDC also reported a cumulative rate of 26.6 influenza-associated hospitalizations per 100,000 population.
Ten flu-related pediatric deaths were reported during the week, of which only one occurred during the week. A total of 50 flu-related pediatric deaths have been reported during the 2015-2016 season, the CDC said. The overall proportion of deaths attributed to pneumonia and influenza was below the system-specific threshold in the National Center for Health Statistics Mortality Surveillance System, but above the system-specific threshold in the 122 Cities Mortality Reporting System.