User login
Richard Franki is the associate editor who writes and creates graphs. He started with the company in 1987, when it was known as the International Medical News Group. In his years as a journalist, Richard has worked for Cap Cities/ABC, Disney, Harcourt, Elsevier, Quadrant, Frontline, and Internet Brands. In the 1990s, he was a contributor to the ill-fated Indications column, predecessor of Livin' on the MDedge.
OnabotulinumtoxinA most popular cosmetic procedure in 2015
OnabotulinumtoxinA injection continued as the most popular minimally invasive cosmetic procedure in 2015, but its 1% increase in the number of procedures from the previous year was the smallest since 2009, when there was a 4% drop from the year before, according to the American Society of Plastic Surgeons.
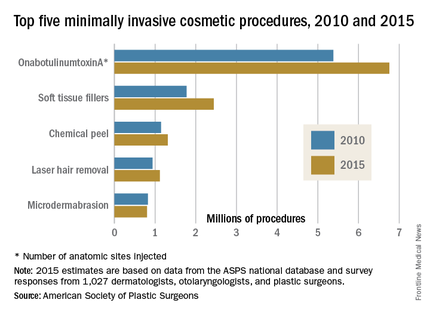
There was a total of 14.2 million minimally invasive cosmetic procedures performed in the United States in 2015, a 2% increase over 2014, the ASPS projected from a survey of 1,027 dermatologists, plastic surgeons, and otolaryngologists combined with its Tracking Operations and Outcomes for Plastic Surgeons database.
Of the 2015 total, an estimated 6.8 million were onabotulinumtoxinA procedures, with each injection of an anatomic site counting as a separate procedure. Soft tissue fillers were second in popularity among cosmetic patients, with over 2.4 million procedures performed, followed by chemical peel (1.3 million procedures), laser hair removal (1.1 million), and microdermabrasion (800,000), the ASPS reported.
Since 2010, soft tissue fillers have seen the most growth, increasing by 37.6%, followed by onabotulinumtoxinA (25.6%), laser hair removal (19.1%), and chemical peel (14.4%), according to ASPS data. The use of microdermabrasion dropped in that time period (–3%).
OnabotulinumtoxinA injection continued as the most popular minimally invasive cosmetic procedure in 2015, but its 1% increase in the number of procedures from the previous year was the smallest since 2009, when there was a 4% drop from the year before, according to the American Society of Plastic Surgeons.
There was a total of 14.2 million minimally invasive cosmetic procedures performed in the United States in 2015, a 2% increase over 2014, the ASPS projected from a survey of 1,027 dermatologists, plastic surgeons, and otolaryngologists combined with its Tracking Operations and Outcomes for Plastic Surgeons database.
Of the 2015 total, an estimated 6.8 million were onabotulinumtoxinA procedures, with each injection of an anatomic site counting as a separate procedure. Soft tissue fillers were second in popularity among cosmetic patients, with over 2.4 million procedures performed, followed by chemical peel (1.3 million procedures), laser hair removal (1.1 million), and microdermabrasion (800,000), the ASPS reported.
Since 2010, soft tissue fillers have seen the most growth, increasing by 37.6%, followed by onabotulinumtoxinA (25.6%), laser hair removal (19.1%), and chemical peel (14.4%), according to ASPS data. The use of microdermabrasion dropped in that time period (–3%).

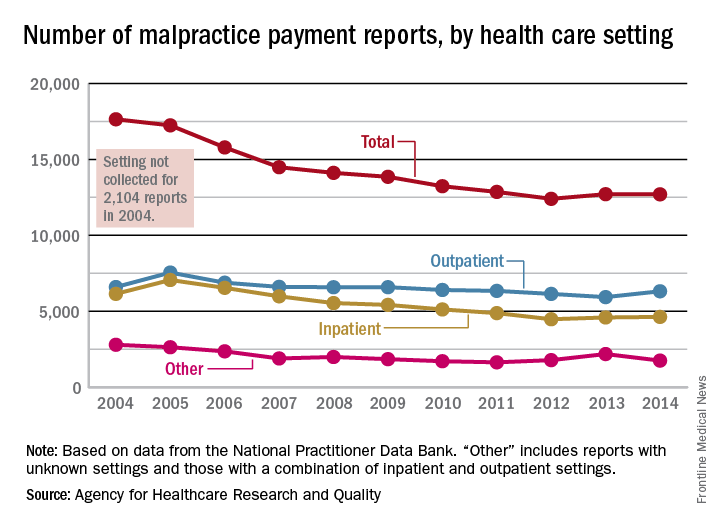
Number of malpractice payments down 28% since 2004
The annual number of medical malpractice payment reports fell 28% from 2004 to 2014, according to the Agency for Healthcare Research and Quality.
The total number of medical malpractice payment reports (MMPRs) for 2014 was 12,699, a decrease of 28% since 2004, when there were 17,641. The total had gone down every year until a slight increase in 2013, but the number held steady in 2014, the AHRQ reported in the Chartbook on Patient Safety.
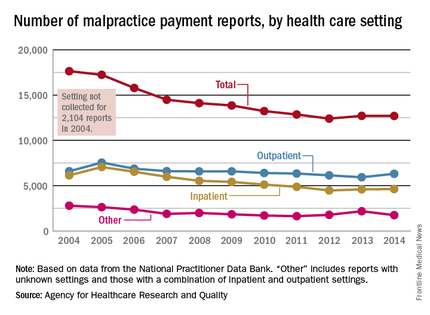
Since 2004, MMPRs related to inpatient settings have been dropping slightly faster than outpatient-related MMPRs, with the exception, again, of 2013, when the number of inpatient MMPRs went up while the outpatient total dropped. Both types went up in 2014, but the category of “other” – reports related to unknown settings and those from a combination of the two – dropped in 2014 to keep the overall number from going up again, data from the National Practitioner Data Bank show.
Looking at the types of allegation leading to MMPRs, treatment was highest, accounting for 27.4% of the total from 2004 to 2014, with diagnosis right behind at 27.1%, followed by surgery at 23.5% and obstetrics at 6.7%. Medication-related cases represented 5.3% of all MMPRs over that period, the AHRQ noted.
The annual number of medical malpractice payment reports fell 28% from 2004 to 2014, according to the Agency for Healthcare Research and Quality.
The total number of medical malpractice payment reports (MMPRs) for 2014 was 12,699, a decrease of 28% since 2004, when there were 17,641. The total had gone down every year until a slight increase in 2013, but the number held steady in 2014, the AHRQ reported in the Chartbook on Patient Safety.
Since 2004, MMPRs related to inpatient settings have been dropping slightly faster than outpatient-related MMPRs, with the exception, again, of 2013, when the number of inpatient MMPRs went up while the outpatient total dropped. Both types went up in 2014, but the category of “other” – reports related to unknown settings and those from a combination of the two – dropped in 2014 to keep the overall number from going up again, data from the National Practitioner Data Bank show.
Looking at the types of allegation leading to MMPRs, treatment was highest, accounting for 27.4% of the total from 2004 to 2014, with diagnosis right behind at 27.1%, followed by surgery at 23.5% and obstetrics at 6.7%. Medication-related cases represented 5.3% of all MMPRs over that period, the AHRQ noted.
Number of malpractice payments down 28% since 2004
The annual number of medical malpractice payment reports fell 28% from 2004 to 2014, according to the Agency for Healthcare Research and Quality.
The total number of medical malpractice payment reports (MMPRs) for 2014 was 12,699, a decrease of 28% since 2004, when there were 17,641. The total had gone down every year until a slight increase in 2013, but the number held steady in 2014, the AHRQ reported in the Chartbook on Patient Safety.
Since 2004, MMPRs related to inpatient settings have been dropping slightly faster than outpatient-related MMPRs, with the exception, again, of 2013, when the number of inpatient MMPRs went up while the outpatient total dropped. Both types went up in 2014, but the category of “other” – reports related to unknown settings and those from a combination of the two – dropped in 2014 to keep the overall number from going up again, data from the National Practitioner Data Bank show.
Looking at the types of allegation leading to MMPRs, treatment was highest, accounting for 27.4% of the total from 2004 to 2014, with diagnosis right behind at 27.1%, followed by surgery at 23.5% and obstetrics at 6.7%. Medication-related cases represented 5.3% of all MMPRs over that period, the AHRQ noted.

U.S. flu activity continues to drop, but still widespread
A third straight week of reduced influenza-like illness (ILI) left the U.S. with no states at the highest level of ILI activity for the first time since early February, according to the Centers for Disease Control and Prevention.
The states with the highest activity for the week ending April 2, 2016, were New Jersey and New Mexico, and both were at level 8 on the CDC’s 1-10 scale, putting them on the low end of the “high” range. States in the “moderate” range were Georgia and North Carolina at level 7 and Alabama, Alaska, Arkansas, Missouri, and Virginia at level 6, according to a report from the CDC’s Influenza-like Illness Surveillance Network (ILINet).
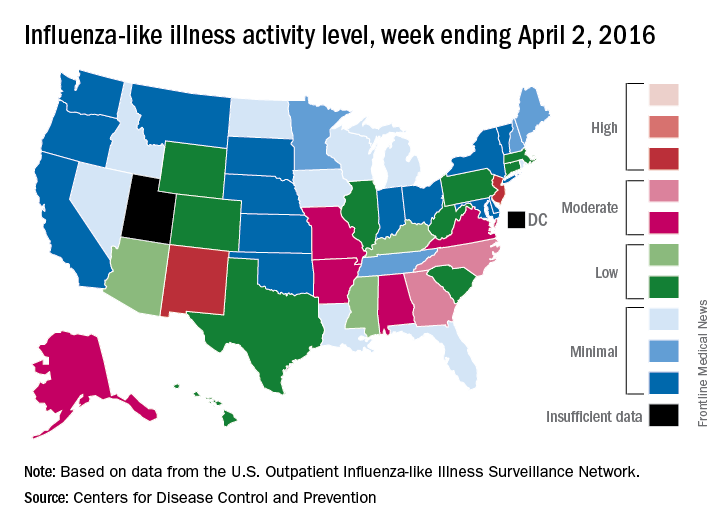
The proportion of outpatient visits for ILI was 2.4% for the week, down from 2.9% the week before but still above the national baseline of 2.1%, the CDC said. The CDC also reported a cumulative rate of 24.4 laboratory-confirmed influenza-associated hospitalizations per 100,000 population for the 2015-16 flu season.
There were seven flu-related pediatric deaths reported – all of them occurring during earlier weeks. So far, 40 flu-related pediatric deaths have been reported during the 2015-2016 season, with California having the highest number (9). The CDC said 7.4% of all deaths reported through the 122 Cities Mortality Reporting System were due to pneumonia and influenza. This percentage was above the epidemic threshold of 7.1% for week 13 of the flu season.
A third straight week of reduced influenza-like illness (ILI) left the U.S. with no states at the highest level of ILI activity for the first time since early February, according to the Centers for Disease Control and Prevention.
The states with the highest activity for the week ending April 2, 2016, were New Jersey and New Mexico, and both were at level 8 on the CDC’s 1-10 scale, putting them on the low end of the “high” range. States in the “moderate” range were Georgia and North Carolina at level 7 and Alabama, Alaska, Arkansas, Missouri, and Virginia at level 6, according to a report from the CDC’s Influenza-like Illness Surveillance Network (ILINet).
The proportion of outpatient visits for ILI was 2.4% for the week, down from 2.9% the week before but still above the national baseline of 2.1%, the CDC said. The CDC also reported a cumulative rate of 24.4 laboratory-confirmed influenza-associated hospitalizations per 100,000 population for the 2015-16 flu season.
There were seven flu-related pediatric deaths reported – all of them occurring during earlier weeks. So far, 40 flu-related pediatric deaths have been reported during the 2015-2016 season, with California having the highest number (9). The CDC said 7.4% of all deaths reported through the 122 Cities Mortality Reporting System were due to pneumonia and influenza. This percentage was above the epidemic threshold of 7.1% for week 13 of the flu season.

Study Describes Women’s Autoimmune Disease Burden
Autoimmune diseases are widely thought to be much more prevalent in women, but data from Swedish national registers tell a somewhat different story.
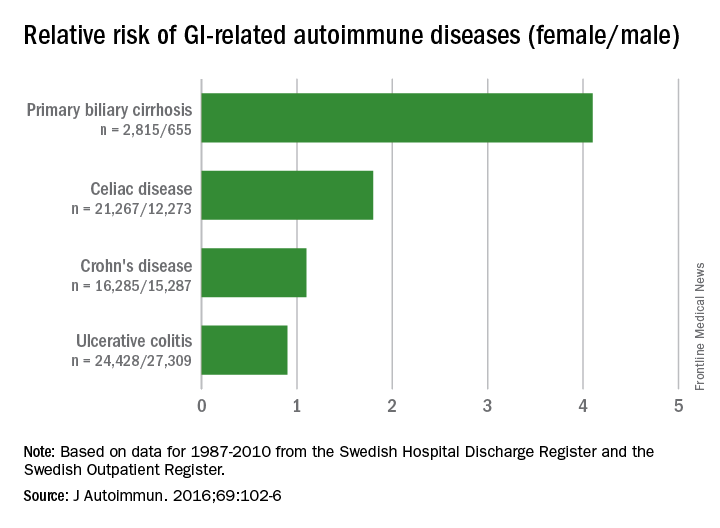
Of the four gastrointestinal conditions among the 32 autoimmune diseases examined, two showed a female predominance, one showed no difference, and one had a male predominance, reported Dr. Jianguang Ji and his associates at Lund (Sweden) University (J Autoimmune. 2016;69:102-6).
Primary biliary cirrhosis had the greater female predominance, with a relative risk for women of 4.1, compared with men, with celiac disease showing a female-to-male ratio of 1.8. There was no difference for Crohn’s disease (RR, 1.1), and ulcerative colitis had a slight male predominance (RR, 0.9), the investigators reported.

The situation was similar for the larger group of conditions: 18 showed a female predominance, 7 had no difference, and 7 showed a male predominance, they noted.
“Most review papers claim that the vast majority of autoimmune diseases have a striking female predominance, and most of them cited that more than 80% of cases affected are women. In this population-based study of 32 specific autoimmune diseases with more than 20 years of follow-up, we found that the incidence in women was only 60% higher as compared to that in men,” Dr. Ji and his associates wrote.
The investigators searched the Swedish Hospital Discharge Register and the Swedish Outpatient Register and found data on 403,757 individuals who had been diagnosed with one or more of the 32 autoimmune diseases between 1987 and 2010. About 62% of the subjects were female.
Dr. Ji and his associates had no conflicts of interest to report. The study was supported by the Swedish Research Council and Region Skåne.
Autoimmune diseases are widely thought to be much more prevalent in women, but data from Swedish national registers tell a somewhat different story.
Of the four gastrointestinal conditions among the 32 autoimmune diseases examined, two showed a female predominance, one showed no difference, and one had a male predominance, reported Dr. Jianguang Ji and his associates at Lund (Sweden) University (J Autoimmune. 2016;69:102-6).
Primary biliary cirrhosis had the greater female predominance, with a relative risk for women of 4.1, compared with men, with celiac disease showing a female-to-male ratio of 1.8. There was no difference for Crohn’s disease (RR, 1.1), and ulcerative colitis had a slight male predominance (RR, 0.9), the investigators reported.
The situation was similar for the larger group of conditions: 18 showed a female predominance, 7 had no difference, and 7 showed a male predominance, they noted.
“Most review papers claim that the vast majority of autoimmune diseases have a striking female predominance, and most of them cited that more than 80% of cases affected are women. In this population-based study of 32 specific autoimmune diseases with more than 20 years of follow-up, we found that the incidence in women was only 60% higher as compared to that in men,” Dr. Ji and his associates wrote.
The investigators searched the Swedish Hospital Discharge Register and the Swedish Outpatient Register and found data on 403,757 individuals who had been diagnosed with one or more of the 32 autoimmune diseases between 1987 and 2010. About 62% of the subjects were female.
Dr. Ji and his associates had no conflicts of interest to report. The study was supported by the Swedish Research Council and Region Skåne.
FROM THE JOURNAL OF AUTOIMMUNITY
Study describes women’s autoimmune disease burden
Autoimmune diseases are widely thought to be much more prevalent in women, but data from Swedish national registers tell a somewhat different story.
Of the four gastrointestinal conditions among the 32 autoimmune diseases examined, two showed a female predominance, one showed no difference, and one had a male predominance, reported Dr. Jianguang Ji and his associates at Lund (Sweden) University (J Autoimmune. 2016;69:102-6).
Primary biliary cirrhosis had the greater female predominance, with a relative risk for women of 4.1, compared with men, with celiac disease showing a female-to-male ratio of 1.8. There was no difference for Crohn’s disease (RR, 1.1), and ulcerative colitis had a slight male predominance (RR, 0.9), the investigators reported.

The situation was similar for the larger group of conditions: 18 showed a female predominance, 7 had no difference, and 7 showed a male predominance, they noted.
“Most review papers claim that the vast majority of autoimmune diseases have a striking female predominance, and most of them cited that more than 80% of cases affected are women. In this population-based study of 32 specific autoimmune diseases with more than 20 years of follow-up, we found that the incidence in women was only 60% higher as compared to that in men,” Dr. Ji and his associates wrote.
The investigators searched the Swedish Hospital Discharge Register and the Swedish Outpatient Register and found data on 403,757 individuals who had been diagnosed with one or more of the 32 autoimmune diseases between 1987 and 2010. About 62% of the subjects were female.
Dr. Ji and his associates had no conflicts of interest to report. The study was supported by the Swedish Research Council and Region Skåne.
Autoimmune diseases are widely thought to be much more prevalent in women, but data from Swedish national registers tell a somewhat different story.
Of the four gastrointestinal conditions among the 32 autoimmune diseases examined, two showed a female predominance, one showed no difference, and one had a male predominance, reported Dr. Jianguang Ji and his associates at Lund (Sweden) University (J Autoimmune. 2016;69:102-6).
Primary biliary cirrhosis had the greater female predominance, with a relative risk for women of 4.1, compared with men, with celiac disease showing a female-to-male ratio of 1.8. There was no difference for Crohn’s disease (RR, 1.1), and ulcerative colitis had a slight male predominance (RR, 0.9), the investigators reported.
The situation was similar for the larger group of conditions: 18 showed a female predominance, 7 had no difference, and 7 showed a male predominance, they noted.
“Most review papers claim that the vast majority of autoimmune diseases have a striking female predominance, and most of them cited that more than 80% of cases affected are women. In this population-based study of 32 specific autoimmune diseases with more than 20 years of follow-up, we found that the incidence in women was only 60% higher as compared to that in men,” Dr. Ji and his associates wrote.
The investigators searched the Swedish Hospital Discharge Register and the Swedish Outpatient Register and found data on 403,757 individuals who had been diagnosed with one or more of the 32 autoimmune diseases between 1987 and 2010. About 62% of the subjects were female.
Dr. Ji and his associates had no conflicts of interest to report. The study was supported by the Swedish Research Council and Region Skåne.
FROM THE JOURNAL OF AUTOIMMUNITY

U.S. flu activity continues downward trend
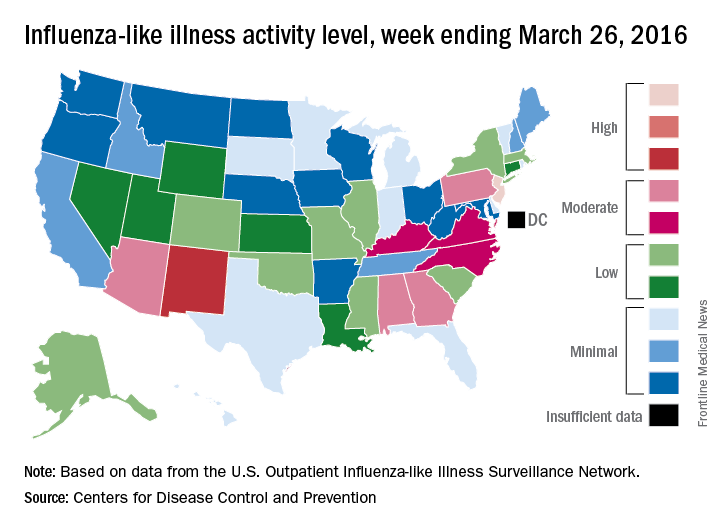
Influenza-like illness (ILI) activity in the United States continued to drop during the week ending March 26, 2016, with only one state still at the highest level, according to the Centers for Disease Control and Prevention.
That one state was New Jersey, which was at level 10 on the CDC’s 1-10 scale of ILI activity. One state at level 10 was down from three states the week before and seven states 2 weeks earlier. Also down for a second consecutive week was the proportion of outpatient visits for ILI, which was 2.9% for the most recent week, compared with 3.2% the previous week and a season high of 3.7% for the week ending March 12, the CDC’s Influenza-like Illness Surveillance Network (ILINet) reported.
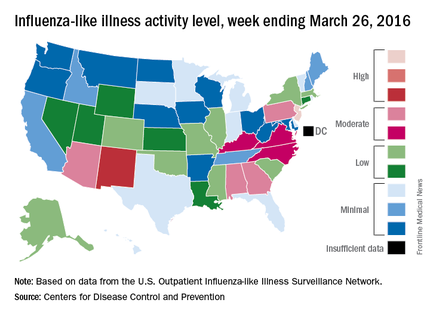
The only other state in the “high” range for the week ending March 26 was New Mexico at level 8. States in the “moderate” range were Alabama, Arizona, Georgia, and Pennsylvania at level 7 and Kentucky, North Carolina, and Virginia at level 6, according to data from ILINet.
Three flu-related pediatric deaths were reported to CDC during the week, but two occurred the previous week and one occurred in February. That brings the total of flu-related pediatric deaths to 33 for the 2015-2016 influenza season, the CDC said. However, 7.7% of all deaths reported through the 122 Cities Mortality Reporting System were due to pneumonia and influenza. This percentage was above the epidemic threshold of 7.2%.
The CDC also reported a cumulative rate for the season of 21.4 laboratory-confirmed influenza-associated hospitalizations per 100,000 population. The highest rate of hospitalization was among adults aged 65 years or older (54.5 per 100,000 population), followed by adults aged 50-64 (31.4 per 100,000 population) and children aged 0-4 years (29.3 per 100,000 population).
Influenza-like illness (ILI) activity in the United States continued to drop during the week ending March 26, 2016, with only one state still at the highest level, according to the Centers for Disease Control and Prevention.
That one state was New Jersey, which was at level 10 on the CDC’s 1-10 scale of ILI activity. One state at level 10 was down from three states the week before and seven states 2 weeks earlier. Also down for a second consecutive week was the proportion of outpatient visits for ILI, which was 2.9% for the most recent week, compared with 3.2% the previous week and a season high of 3.7% for the week ending March 12, the CDC’s Influenza-like Illness Surveillance Network (ILINet) reported.
The only other state in the “high” range for the week ending March 26 was New Mexico at level 8. States in the “moderate” range were Alabama, Arizona, Georgia, and Pennsylvania at level 7 and Kentucky, North Carolina, and Virginia at level 6, according to data from ILINet.
Three flu-related pediatric deaths were reported to CDC during the week, but two occurred the previous week and one occurred in February. That brings the total of flu-related pediatric deaths to 33 for the 2015-2016 influenza season, the CDC said. However, 7.7% of all deaths reported through the 122 Cities Mortality Reporting System were due to pneumonia and influenza. This percentage was above the epidemic threshold of 7.2%.
The CDC also reported a cumulative rate for the season of 21.4 laboratory-confirmed influenza-associated hospitalizations per 100,000 population. The highest rate of hospitalization was among adults aged 65 years or older (54.5 per 100,000 population), followed by adults aged 50-64 (31.4 per 100,000 population) and children aged 0-4 years (29.3 per 100,000 population).
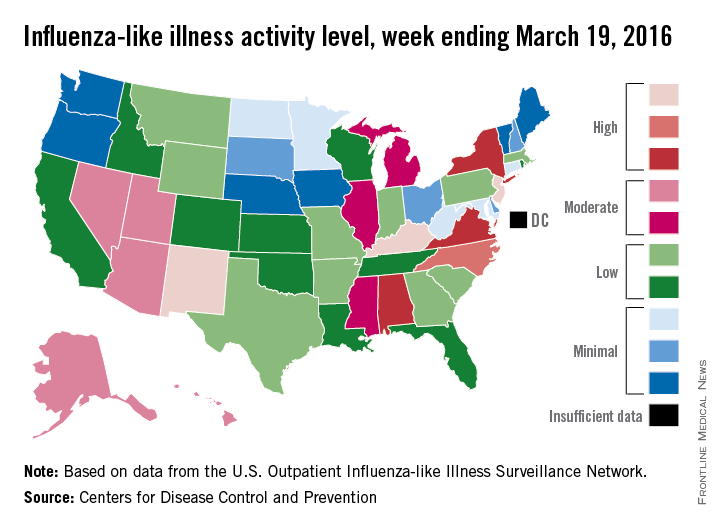
U.S. flu activity may be waning
The 2015-2016 U.S. flu season may have reached its peak. The proportion of outpatient visits for influenza-like illness (ILI) dropped to 3.2% for the week ending March 19, according to the Centers for Disease Control and Prevention.
The drop came after 9 consecutive weeks without a decrease, as the proportion of outpatient visits for ILI topped out at 3.7%, the CDC reported. The national baseline is 2.1%.
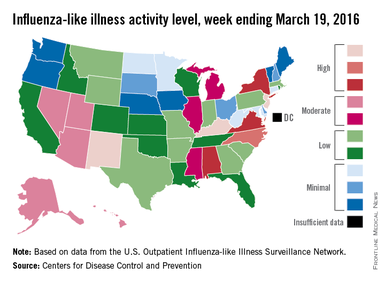
For the week ending March 19, three states – Kentucky, New Jersey, and New Mexico – were at level 10 on the CDC’s 1-10 scale of ILI activity, compared with seven the week before. Other states in the “high” range for the week were North Carolina at level 9 and Alabama, New York, and Virginia at level 8, according to data from the CDC’s Influenza-like Illness Surveillance Network (ILINet).
The CDC also reported a cumulative rate of 18.2 laboratory-confirmed influenza-associated hospitalizations per 100,000 population for the 2015-2016 flu season.
Two flu-related pediatric deaths were reported during the most recent week, one of which occurred during the week ending March 5. That brings the total to 30 reported for the 2015-2016 season. For the three previous flu seasons, the pediatric death totals were 148 (2014-2015), 111 (2013-2014), and 171 (2012-2013), according to the CDC report.
The 2015-2016 U.S. flu season may have reached its peak. The proportion of outpatient visits for influenza-like illness (ILI) dropped to 3.2% for the week ending March 19, according to the Centers for Disease Control and Prevention.
The drop came after 9 consecutive weeks without a decrease, as the proportion of outpatient visits for ILI topped out at 3.7%, the CDC reported. The national baseline is 2.1%.
For the week ending March 19, three states – Kentucky, New Jersey, and New Mexico – were at level 10 on the CDC’s 1-10 scale of ILI activity, compared with seven the week before. Other states in the “high” range for the week were North Carolina at level 9 and Alabama, New York, and Virginia at level 8, according to data from the CDC’s Influenza-like Illness Surveillance Network (ILINet).
The CDC also reported a cumulative rate of 18.2 laboratory-confirmed influenza-associated hospitalizations per 100,000 population for the 2015-2016 flu season.
Two flu-related pediatric deaths were reported during the most recent week, one of which occurred during the week ending March 5. That brings the total to 30 reported for the 2015-2016 season. For the three previous flu seasons, the pediatric death totals were 148 (2014-2015), 111 (2013-2014), and 171 (2012-2013), according to the CDC report.
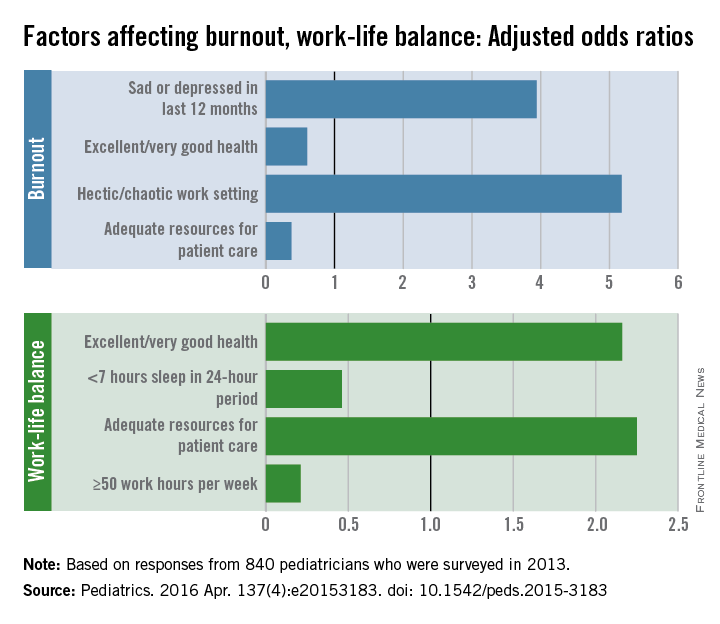
Burnout, work-life struggles common early in pediatricians’ careers
Feelings of burnout and struggles with work-life balance are common among pediatricians in their first decade of practice, but the majority are satisfied with their careers and lives overall, according to a survey of 840 pediatricians who graduated residency between 2002 and 2004.
The survey, conducted in 2013, showed that 83% of early-career pediatricians are satisfied with their careers as physicians and 71% with their lives overall. On the negative side of the equation, however, 30% feel burned out and only 43% said the balance between their work and personal lives “was about right,” reported Dr. Amy J. Starmer of Boston Children’s Hospital and her associates (Pediatrics. 2016 Apr. 137[4]:e20153183. doi: 10.1542/peds.2015-3183).

Several personal and work factors were associated with burnout and work-life balance. Those who reported being sad or depressed in the last 12 months were significantly more likely (adjusted odds ratio, 3.94) to have feelings of burnout, but those with excellent or very good health were significantly less likely (AOR, 0.6). Among work-related factors, a hectic or chaotic work setting had an AOR of 5.18, while having adequate resources for patient care came in with an AOR of 0.37, the investigators said.
Excellent or good health was a personal factor positively and significantly associated with a balanced work and personal life (AOR, 2.16), while getting fewer than 7 hours of sleep in a 24-hour period had an AOR of 0.46. Adequate resources for patient care turned up again as a positive factor for work-life balance (AOR, 2.25), with 50 or more work hours per week showing the greatest negative association (AOR, 0.21), Dr. Starmer and her associates said.
The study was supported by the American Academy of Pediatrics, and the authors indicated that they have no potential conflicts of interest.
Feelings of burnout and struggles with work-life balance are common among pediatricians in their first decade of practice, but the majority are satisfied with their careers and lives overall, according to a survey of 840 pediatricians who graduated residency between 2002 and 2004.
The survey, conducted in 2013, showed that 83% of early-career pediatricians are satisfied with their careers as physicians and 71% with their lives overall. On the negative side of the equation, however, 30% feel burned out and only 43% said the balance between their work and personal lives “was about right,” reported Dr. Amy J. Starmer of Boston Children’s Hospital and her associates (Pediatrics. 2016 Apr. 137[4]:e20153183. doi: 10.1542/peds.2015-3183).
Several personal and work factors were associated with burnout and work-life balance. Those who reported being sad or depressed in the last 12 months were significantly more likely (adjusted odds ratio, 3.94) to have feelings of burnout, but those with excellent or very good health were significantly less likely (AOR, 0.6). Among work-related factors, a hectic or chaotic work setting had an AOR of 5.18, while having adequate resources for patient care came in with an AOR of 0.37, the investigators said.
Excellent or good health was a personal factor positively and significantly associated with a balanced work and personal life (AOR, 2.16), while getting fewer than 7 hours of sleep in a 24-hour period had an AOR of 0.46. Adequate resources for patient care turned up again as a positive factor for work-life balance (AOR, 2.25), with 50 or more work hours per week showing the greatest negative association (AOR, 0.21), Dr. Starmer and her associates said.
The study was supported by the American Academy of Pediatrics, and the authors indicated that they have no potential conflicts of interest.
FROM PEDIATRICS
US Flu Activity: Another Week, Another Increase
Influenza-like illness (ILI) activity in the U.S. showed no signs of slowing down during the week ending March 12, 2016, as the number of states at the highest level increased to seven, compared with four the previous week, according to the Centers for Disease Control and Prevention.
The seven states at level 10 on the CDC’s 1-10 scale of ILI activity were Alabama, Arizona, Arkansas, Indiana, Kentucky, New Jersey, and North Carolina. Other states in the “high” range for the week were Mississippi, New Mexico, and Virginia at level 9 and Georgia, Hawaii, Illinois, and Oregon at level 8, the CDC’s Influenza-like Illness Surveillance Network (ILINet) reported.
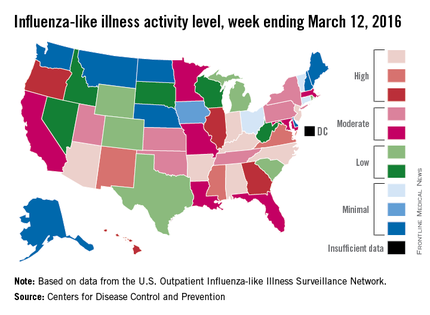
The proportion of outpatient visits for ILI was 3.7% for the week, up from 3.5% the previous week and another new high for the season. The national baseline is 2.1%. The geographic spread of influenza in 40 states and Puerto Rico was reported as widespread, the CDC said.
There were eight flu-related pediatric deaths reported to the CDC, of which only one occurred during the week ending March 12. For the season so far, a total of 28 flu-related pediatric deaths have been reported in 14 states and Puerto Rico.
Since Oct. 1, 2015, 4,006 laboratory-confirmed flu-associated hospitalizations have been reported to the CDC’s Influenza Hospitalization Surveillance Network, which covers more than 70 counties in a group of 10 Emerging Infections Program states plus four additional states. The overall hospitalization rate for the season is 14.5 per 100,000 population, with the highest rate occurring in adults aged 65 years and older (37.2 per 100,000), followed by adults aged 50-64 (21.3) and children aged 0-4 years (20.9), the CDC report noted.
Influenza-like illness (ILI) activity in the U.S. showed no signs of slowing down during the week ending March 12, 2016, as the number of states at the highest level increased to seven, compared with four the previous week, according to the Centers for Disease Control and Prevention.
The seven states at level 10 on the CDC’s 1-10 scale of ILI activity were Alabama, Arizona, Arkansas, Indiana, Kentucky, New Jersey, and North Carolina. Other states in the “high” range for the week were Mississippi, New Mexico, and Virginia at level 9 and Georgia, Hawaii, Illinois, and Oregon at level 8, the CDC’s Influenza-like Illness Surveillance Network (ILINet) reported.
The proportion of outpatient visits for ILI was 3.7% for the week, up from 3.5% the previous week and another new high for the season. The national baseline is 2.1%. The geographic spread of influenza in 40 states and Puerto Rico was reported as widespread, the CDC said.
There were eight flu-related pediatric deaths reported to the CDC, of which only one occurred during the week ending March 12. For the season so far, a total of 28 flu-related pediatric deaths have been reported in 14 states and Puerto Rico.
Since Oct. 1, 2015, 4,006 laboratory-confirmed flu-associated hospitalizations have been reported to the CDC’s Influenza Hospitalization Surveillance Network, which covers more than 70 counties in a group of 10 Emerging Infections Program states plus four additional states. The overall hospitalization rate for the season is 14.5 per 100,000 population, with the highest rate occurring in adults aged 65 years and older (37.2 per 100,000), followed by adults aged 50-64 (21.3) and children aged 0-4 years (20.9), the CDC report noted.
