User login
Richard Franki is the associate editor who writes and creates graphs. He started with the company in 1987, when it was known as the International Medical News Group. In his years as a journalist, Richard has worked for Cap Cities/ABC, Disney, Harcourt, Elsevier, Quadrant, Frontline, and Internet Brands. In the 1990s, he was a contributor to the ill-fated Indications column, predecessor of Livin' on the MDedge.
U.S. flu activity: Another week, another increase
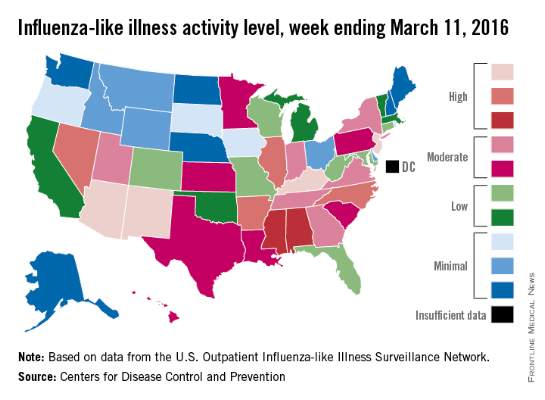
Influenza-like illness (ILI) activity in the U.S. showed no signs of slowing down during the week ending March 12, 2016, as the number of states at the highest level increased to seven, compared with four the previous week, according to the Centers for Disease Control and Prevention.
The seven states at level 10 on the CDC’s 1-10 scale of ILI activity were Alabama, Arizona, Arkansas, Indiana, Kentucky, New Jersey, and North Carolina. Other states in the “high” range for the week were Mississippi, New Mexico, and Virginia at level 9 and Georgia, Hawaii, Illinois, and Oregon at level 8, the CDC’s Influenza-like Illness Surveillance Network (ILINet) reported.
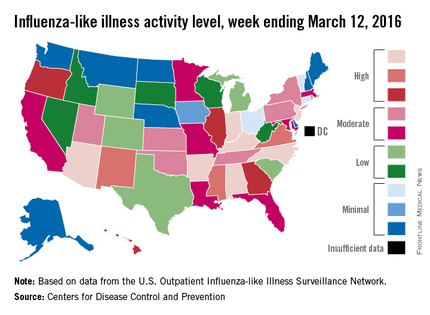
The proportion of outpatient visits for ILI was 3.7% for the week, up from 3.5% the previous week and another new high for the season. The national baseline is 2.1%. The geographic spread of influenza in 40 states and Puerto Rico was reported as widespread, the CDC said.
There were eight flu-related pediatric deaths reported to the CDC, of which only one occurred during the week ending March 12. For the season so far, a total of 28 flu-related pediatric deaths have been reported in 14 states and Puerto Rico.
Since Oct. 1, 2015, 4,006 laboratory-confirmed flu-associated hospitalizations have been reported to the CDC’s Influenza Hospitalization Surveillance Network, which covers more than 70 counties in a group of 10 Emerging Infections Program states plus four additional states. The overall hospitalization rate for the season is 14.5 per 100,000 population, with the highest rate occurring in adults aged 65 years and older (37.2 per 100,000), followed by adults aged 50-64 (21.3) and children aged 0-4 years (20.9), the CDC report noted.
Influenza-like illness (ILI) activity in the U.S. showed no signs of slowing down during the week ending March 12, 2016, as the number of states at the highest level increased to seven, compared with four the previous week, according to the Centers for Disease Control and Prevention.
The seven states at level 10 on the CDC’s 1-10 scale of ILI activity were Alabama, Arizona, Arkansas, Indiana, Kentucky, New Jersey, and North Carolina. Other states in the “high” range for the week were Mississippi, New Mexico, and Virginia at level 9 and Georgia, Hawaii, Illinois, and Oregon at level 8, the CDC’s Influenza-like Illness Surveillance Network (ILINet) reported.
The proportion of outpatient visits for ILI was 3.7% for the week, up from 3.5% the previous week and another new high for the season. The national baseline is 2.1%. The geographic spread of influenza in 40 states and Puerto Rico was reported as widespread, the CDC said.
There were eight flu-related pediatric deaths reported to the CDC, of which only one occurred during the week ending March 12. For the season so far, a total of 28 flu-related pediatric deaths have been reported in 14 states and Puerto Rico.
Since Oct. 1, 2015, 4,006 laboratory-confirmed flu-associated hospitalizations have been reported to the CDC’s Influenza Hospitalization Surveillance Network, which covers more than 70 counties in a group of 10 Emerging Infections Program states plus four additional states. The overall hospitalization rate for the season is 14.5 per 100,000 population, with the highest rate occurring in adults aged 65 years and older (37.2 per 100,000), followed by adults aged 50-64 (21.3) and children aged 0-4 years (20.9), the CDC report noted.

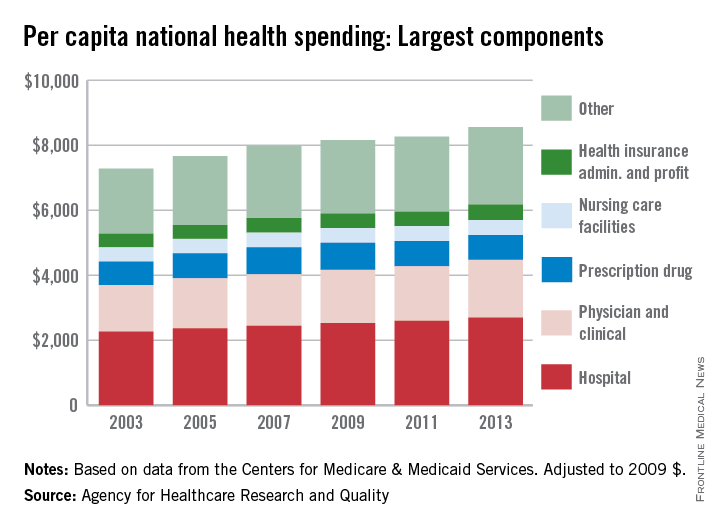
Spending on physicians rising faster than health expenditures overall
Spending on physicians rose by 2.4% per year from 2003 to 2013 – the largest increase among the major components of national health expenditures, according to the Agency for Healthcare Research and Quality (AHRQ).
Per capita spending for the physician and clinical sector went from $1,432 in 2003 to $1,775 in 2013 when adjusted to 2009 dollars, for a total increase of almost 24%. Total per capita health expenditures were $7,284 in 2003 and $8,555 in 2013, which represents an annual increase of 1.75%, the AHRQ reported.
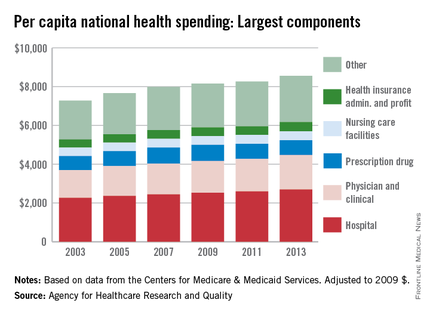
The largest portion of national health expenditures, hospital spending, increased from $2,264 (in 2009 dollars) per capita in 2003 to $2,700 in 2013 – just under 2% per year. Physician and clinical costs were the second-largest component of health expenditures, followed by prescription drugs, health insurance administration and profit, and nursing care facilities in 2013, the AHRQ noted.
Overall per capita spending on prescription drugs was up just 0.5% from 2003 to 2013, giving it the smallest increase among the five sectors. Spending on nursing home facilities rose slightly more, 0.7% a year, while the cost of insurance company administration and profit increased by 1.4% a year over that time, according to data from the Centers for Medicare & Medicaid Services.
Spending on physicians rose by 2.4% per year from 2003 to 2013 – the largest increase among the major components of national health expenditures, according to the Agency for Healthcare Research and Quality (AHRQ).
Per capita spending for the physician and clinical sector went from $1,432 in 2003 to $1,775 in 2013 when adjusted to 2009 dollars, for a total increase of almost 24%. Total per capita health expenditures were $7,284 in 2003 and $8,555 in 2013, which represents an annual increase of 1.75%, the AHRQ reported.
The largest portion of national health expenditures, hospital spending, increased from $2,264 (in 2009 dollars) per capita in 2003 to $2,700 in 2013 – just under 2% per year. Physician and clinical costs were the second-largest component of health expenditures, followed by prescription drugs, health insurance administration and profit, and nursing care facilities in 2013, the AHRQ noted.
Overall per capita spending on prescription drugs was up just 0.5% from 2003 to 2013, giving it the smallest increase among the five sectors. Spending on nursing home facilities rose slightly more, 0.7% a year, while the cost of insurance company administration and profit increased by 1.4% a year over that time, according to data from the Centers for Medicare & Medicaid Services.
Medicare patients give high marks to personal doctors
Among the beneficiaries of various federal health plans, those covered by Medicare gave their personal physicians the highest rating in 2015, according to the Agency for Healthcare Research and Quality (AHRQ).
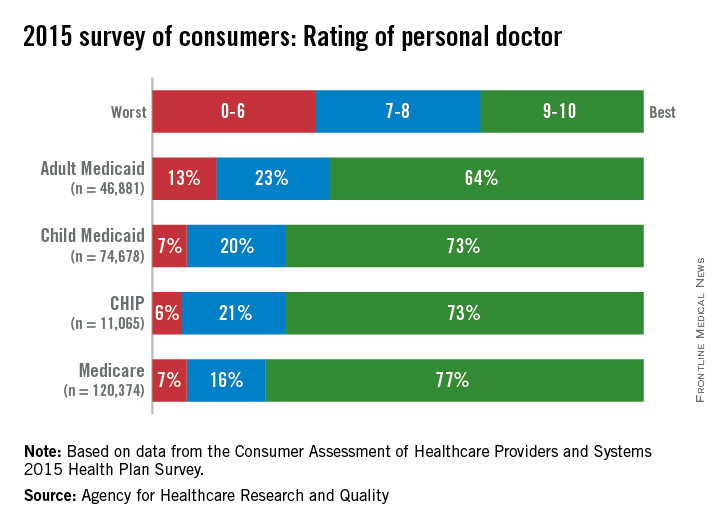
In the 2015 edition of the Consumer Assessment of Healthcare Providers and Systems (CAHPS) Health Plan Survey, 77% of Medicare recipients gave their personal physicians a rating of 9 or 10 on a 1-10 scale, compared with 73% for Children’s Health Insurance Program (CHIP) beneficiaries, 73% for children on Medicaid, and 64% for adults on Medicaid, the AHRQ reported.
The ratings for personal physicians were the highest overall of the four areas rated in the survey. Patients’ ratings of specialists were similar but slightly lower: 72% gave the highest rating (9 or 10) for Medicare, 70% for CHIP and child Medicaid, and 64% for adult Medicaid, the CAHPS data show.
The rating of all health care was the lowest overall score among the four areas rated for the Medicaid (65% child/52% adult) and CHIP (66%) populations, and the rating of the health plan was the lowest score of the four for Medicare (60%), the AHRQ noted.
Among the beneficiaries of various federal health plans, those covered by Medicare gave their personal physicians the highest rating in 2015, according to the Agency for Healthcare Research and Quality (AHRQ).
In the 2015 edition of the Consumer Assessment of Healthcare Providers and Systems (CAHPS) Health Plan Survey, 77% of Medicare recipients gave their personal physicians a rating of 9 or 10 on a 1-10 scale, compared with 73% for Children’s Health Insurance Program (CHIP) beneficiaries, 73% for children on Medicaid, and 64% for adults on Medicaid, the AHRQ reported.
The ratings for personal physicians were the highest overall of the four areas rated in the survey. Patients’ ratings of specialists were similar but slightly lower: 72% gave the highest rating (9 or 10) for Medicare, 70% for CHIP and child Medicaid, and 64% for adult Medicaid, the CAHPS data show.
The rating of all health care was the lowest overall score among the four areas rated for the Medicaid (65% child/52% adult) and CHIP (66%) populations, and the rating of the health plan was the lowest score of the four for Medicare (60%), the AHRQ noted.

Flu activity reaches another new season high
There were four states at the highest level of influenza-like illness (ILI) activity for the week, more than any other week of the 2015-2016 flu season, according to the Centers for Disease Control and Prevention.
Arizona, Kentucky, New Jersey, and New Mexico, along with Puerto Rico, were all at level 10 on the CDC’s 1-10 scale of ILI activity for the week ending March 5, 2016. Other states in the “high” range were Arkansas, Illinois, Nevada, and North Carolina at level 9 and Alabama and Mississippi at level 8, the CDC reported.

The proportion of outpatient visits for ILI was 3.5% for the week, the highest of the season so far and well above the national baseline of 2.1%. In addition to the 10 states and Puerto Rico with ILI levels in the high range, there were 13 states in the “moderate” range (6 or 7 on the 1-10 scale) and 12 states in the “low” range (4 or 5), with a total of 44 states at level 2 or higher, data from the CDC’s Outpatient Influenza-like Illness Surveillance Network (ILINet) show.
Two flu-related pediatric deaths were reported during week 21 of the flu season, although both occurred earlier: one during the week ending Feb. 13 and one during the week ending Feb. 27. There have been a total of 20 pediatric deaths reported for the 2015-2016 season, with Florida (four deaths), California, (three), Arizona (two), and Nevada (two) the only states reporting more than one, the CDC report noted.
The continued rise in ILI activity is somewhat unusual. The only season out of the previous 10 with a peak later than the current one was 2011-2012, which peaked at only 2.4% on the week ending March 17, 2012. The earliest of the bunch came during the 2009-2010 season, which peaked at 7.7% during the week ending Oct. 24, 2009, according to ILINet data.
There were four states at the highest level of influenza-like illness (ILI) activity for the week, more than any other week of the 2015-2016 flu season, according to the Centers for Disease Control and Prevention.
Arizona, Kentucky, New Jersey, and New Mexico, along with Puerto Rico, were all at level 10 on the CDC’s 1-10 scale of ILI activity for the week ending March 5, 2016. Other states in the “high” range were Arkansas, Illinois, Nevada, and North Carolina at level 9 and Alabama and Mississippi at level 8, the CDC reported.
The proportion of outpatient visits for ILI was 3.5% for the week, the highest of the season so far and well above the national baseline of 2.1%. In addition to the 10 states and Puerto Rico with ILI levels in the high range, there were 13 states in the “moderate” range (6 or 7 on the 1-10 scale) and 12 states in the “low” range (4 or 5), with a total of 44 states at level 2 or higher, data from the CDC’s Outpatient Influenza-like Illness Surveillance Network (ILINet) show.
Two flu-related pediatric deaths were reported during week 21 of the flu season, although both occurred earlier: one during the week ending Feb. 13 and one during the week ending Feb. 27. There have been a total of 20 pediatric deaths reported for the 2015-2016 season, with Florida (four deaths), California, (three), Arizona (two), and Nevada (two) the only states reporting more than one, the CDC report noted.
The continued rise in ILI activity is somewhat unusual. The only season out of the previous 10 with a peak later than the current one was 2011-2012, which peaked at only 2.4% on the week ending March 17, 2012. The earliest of the bunch came during the 2009-2010 season, which peaked at 7.7% during the week ending Oct. 24, 2009, according to ILINet data.
Diabetes Hospitalizations Down, but Disparities Persist
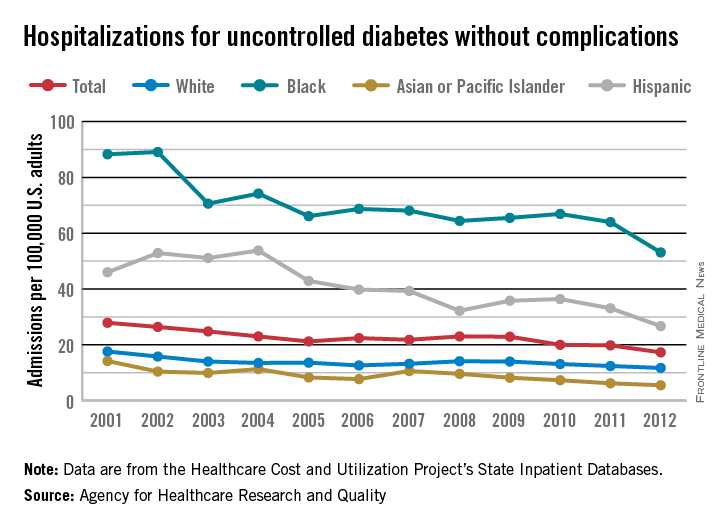
The overall adult hospitalization rate for uncontrolled diabetes without complications dropped by 38% from 2001 to 2012, but considerable racial and ethnic disparities remained, according to the Agency for Healthcare Research and Quality (AHRQ).
That 38% represents a decrease from 27.9 per 100,000 U.S. adults in 2001 to 17.3 per 100,000 in 2012. The admission rate among blacks dropped by a slightly higher 40% over that period, but it started at a much-higher 88.3 per 100,000 adults before going down to 53.1 per 100,000 – still three times higher than the overall rate. The rate for Hispanics fell 42%, but it also was much higher than the overall rate to begin with: 46 per 100,000. The 2012 rate for Hispanic adults was 26.7 per 100,000, about 54% higher than the overall admission rate, the AHRQ reported.

Much closer to reaching the 2008 achievable benchmark of 5 admissions per 100,000 adults were Asians or Pacific Islanders, who went from a rate of 14.2 per 100,000 to 5.5 per 100,000, and whites, who went from 17.6 per 100,000 to 11.7 between 2001 and 2012, according to data from the AHRQ Healthcare Cost and Utilization Project’s State Inpatient Databases.
The report noted that, “at the current rate, the [2008 achievable] benchmark could not be met for the total population for approximately 17 years.” Asians or Pacific Islanders could meet that goal in 2 years, the AHRQ added, compared with 10 years for Hispanics, 20 years for blacks, and 22 years for whites.
The overall adult hospitalization rate for uncontrolled diabetes without complications dropped by 38% from 2001 to 2012, but considerable racial and ethnic disparities remained, according to the Agency for Healthcare Research and Quality (AHRQ).
That 38% represents a decrease from 27.9 per 100,000 U.S. adults in 2001 to 17.3 per 100,000 in 2012. The admission rate among blacks dropped by a slightly higher 40% over that period, but it started at a much-higher 88.3 per 100,000 adults before going down to 53.1 per 100,000 – still three times higher than the overall rate. The rate for Hispanics fell 42%, but it also was much higher than the overall rate to begin with: 46 per 100,000. The 2012 rate for Hispanic adults was 26.7 per 100,000, about 54% higher than the overall admission rate, the AHRQ reported.
Much closer to reaching the 2008 achievable benchmark of 5 admissions per 100,000 adults were Asians or Pacific Islanders, who went from a rate of 14.2 per 100,000 to 5.5 per 100,000, and whites, who went from 17.6 per 100,000 to 11.7 between 2001 and 2012, according to data from the AHRQ Healthcare Cost and Utilization Project’s State Inpatient Databases.
The report noted that, “at the current rate, the [2008 achievable] benchmark could not be met for the total population for approximately 17 years.” Asians or Pacific Islanders could meet that goal in 2 years, the AHRQ added, compared with 10 years for Hispanics, 20 years for blacks, and 22 years for whites.
Diabetes hospitalizations down, but disparities persist
The overall adult hospitalization rate for uncontrolled diabetes without complications dropped by 38% from 2001 to 2012, but considerable racial and ethnic disparities remained, according to the Agency for Healthcare Research and Quality (AHRQ).
That 38% represents a decrease from 27.9 per 100,000 U.S. adults in 2001 to 17.3 per 100,000 in 2012. The admission rate among blacks dropped by a slightly higher 40% over that period, but it started at a much-higher 88.3 per 100,000 adults before going down to 53.1 per 100,000 – still three times higher than the overall rate. The rate for Hispanics fell 42%, but it also was much higher than the overall rate to begin with: 46 per 100,000. The 2012 rate for Hispanic adults was 26.7 per 100,000, about 54% higher than the overall admission rate, the AHRQ reported.

Much closer to reaching the 2008 achievable benchmark of 5 admissions per 100,000 adults were Asians or Pacific Islanders, who went from a rate of 14.2 per 100,000 to 5.5 per 100,000, and whites, who went from 17.6 per 100,000 to 11.7 between 2001 and 2012, according to data from the AHRQ Healthcare Cost and Utilization Project’s State Inpatient Databases.
The report noted that, “at the current rate, the [2008 achievable] benchmark could not be met for the total population for approximately 17 years.” Asians or Pacific Islanders could meet that goal in 2 years, the AHRQ added, compared with 10 years for Hispanics, 20 years for blacks, and 22 years for whites.
The overall adult hospitalization rate for uncontrolled diabetes without complications dropped by 38% from 2001 to 2012, but considerable racial and ethnic disparities remained, according to the Agency for Healthcare Research and Quality (AHRQ).
That 38% represents a decrease from 27.9 per 100,000 U.S. adults in 2001 to 17.3 per 100,000 in 2012. The admission rate among blacks dropped by a slightly higher 40% over that period, but it started at a much-higher 88.3 per 100,000 adults before going down to 53.1 per 100,000 – still three times higher than the overall rate. The rate for Hispanics fell 42%, but it also was much higher than the overall rate to begin with: 46 per 100,000. The 2012 rate for Hispanic adults was 26.7 per 100,000, about 54% higher than the overall admission rate, the AHRQ reported.
Much closer to reaching the 2008 achievable benchmark of 5 admissions per 100,000 adults were Asians or Pacific Islanders, who went from a rate of 14.2 per 100,000 to 5.5 per 100,000, and whites, who went from 17.6 per 100,000 to 11.7 between 2001 and 2012, according to data from the AHRQ Healthcare Cost and Utilization Project’s State Inpatient Databases.
The report noted that, “at the current rate, the [2008 achievable] benchmark could not be met for the total population for approximately 17 years.” Asians or Pacific Islanders could meet that goal in 2 years, the AHRQ added, compared with 10 years for Hispanics, 20 years for blacks, and 22 years for whites.

Medicaid recipients much more likely to visit the ED
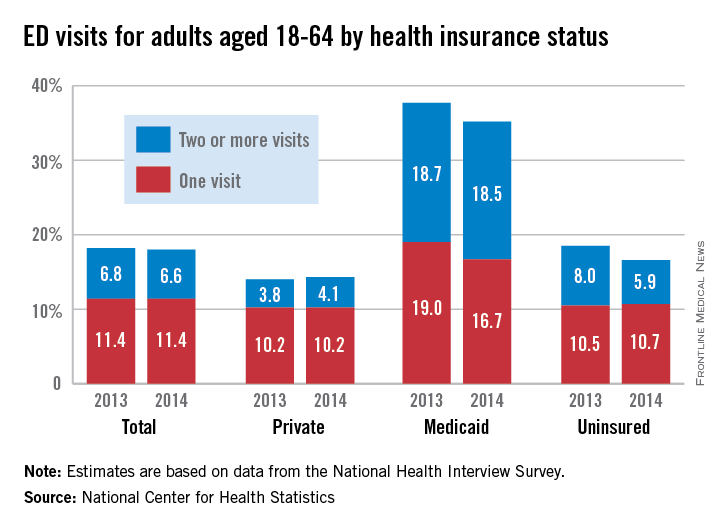
Adults aged 18-64 with Medicaid coverage were almost twice as likely as all adults to visit the emergency department in 2014, according to the National Center for Health Statistics (NCHS).
In 2014, an estimated 35.2% of Medicaid recipients aged 18-64 years visited the emergency department at least once, with more than half of those (18.5%) being people who made two or more visits for the year. Among all adults aged 18-64, 18.0% made at least one ED visit, while 6.6% of all adults made two or more. In 2014, 14.3% of adults 18-64 with private insurance made one or more ED visits, as did 16.6% of those who were uninsured, the NCHS reported.

Compared with 2013, adults with ED visits were down slightly for all adults (18.2% to 18.0%), up slightly for those with private insurance (14.0% to 14.3%), and down for those with Medicaid (37.7% to 35.2%) and the uninsured (18.5% to 16.6%), the report showed.
There was a significant decrease for uninsured adults with two or more visits from 8.0% in 2013 to 5.9% in 2014 (P less than .05), and the drop among Medicaid recipients with one ED visit from 19% in 2013 to 16.7% in 2014 was significant at P less than .1, the NCHS noted.
The highest rates of ED use among adults have consistently been associated “with public health coverage such as Medicaid, relative to adults who were uninsured or had private health insurance. This higher rate of use may be related to more serious medical needs in the Medicaid population,” the NCHS investigators said.
Younger individuals (ages 18-29) were more likely to visit the ED, with 20.2% having at least one visit in 2014, compared with 16.8% of those aged 30-44 years and 17.5% of those aged 45-64. There also were differences by race and ethnicity, as 26.5% of non-Hispanic blacks made one or more ED visits in 2014, compared with 17.5% of non-Hispanic whites and 15.7% of Hispanics, according to the report, which was based on data from the National Health Interview Survey (n = 26,825 for 2013 and 28,053 for 2014).
Adults aged 18-64 with Medicaid coverage were almost twice as likely as all adults to visit the emergency department in 2014, according to the National Center for Health Statistics (NCHS).
In 2014, an estimated 35.2% of Medicaid recipients aged 18-64 years visited the emergency department at least once, with more than half of those (18.5%) being people who made two or more visits for the year. Among all adults aged 18-64, 18.0% made at least one ED visit, while 6.6% of all adults made two or more. In 2014, 14.3% of adults 18-64 with private insurance made one or more ED visits, as did 16.6% of those who were uninsured, the NCHS reported.
Compared with 2013, adults with ED visits were down slightly for all adults (18.2% to 18.0%), up slightly for those with private insurance (14.0% to 14.3%), and down for those with Medicaid (37.7% to 35.2%) and the uninsured (18.5% to 16.6%), the report showed.
There was a significant decrease for uninsured adults with two or more visits from 8.0% in 2013 to 5.9% in 2014 (P less than .05), and the drop among Medicaid recipients with one ED visit from 19% in 2013 to 16.7% in 2014 was significant at P less than .1, the NCHS noted.
The highest rates of ED use among adults have consistently been associated “with public health coverage such as Medicaid, relative to adults who were uninsured or had private health insurance. This higher rate of use may be related to more serious medical needs in the Medicaid population,” the NCHS investigators said.
Younger individuals (ages 18-29) were more likely to visit the ED, with 20.2% having at least one visit in 2014, compared with 16.8% of those aged 30-44 years and 17.5% of those aged 45-64. There also were differences by race and ethnicity, as 26.5% of non-Hispanic blacks made one or more ED visits in 2014, compared with 17.5% of non-Hispanic whites and 15.7% of Hispanics, according to the report, which was based on data from the National Health Interview Survey (n = 26,825 for 2013 and 28,053 for 2014).
U.S. flu activity falls for first time since early January
Influenza-like illness (ILI) activity in the 2015-2016 U.S. flu season declined for the first time since early January, according to the Centers for Disease Control and Prevention.
The proportion of outpatient visits for ILI was reported at 3.2% for the week ending Feb. 20, but the CDC has adjusted that figure to 3.3%, which makes the 3.2% reported for this most recent week (week 20 of the season, ending Feb. 27, 2016) a decrease from the week before.
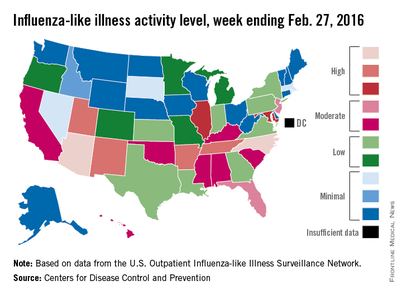
Despite that drop, two states were at level 10 on the CDC’s 1-10 scale of ILI activity for the first time this season. Arizona had already reached level 10, and joining it there last week was North Carolina, moving up from level 8 the week before. Other states in the “high” range of activity were Arkansas, New Mexico, Tennessee, and Utah at level 9, and Illinois and Maryland at level 8, the CDC reported March 4. Puerto Rico, which had been at level 10 for several weeks, moved down to level 8.
States in the “moderate” range of activity for the week ending Feb. 27 were Florida and New Jersey at level 7 and Alabama, California, Hawaii, Kentucky, Mississippi, Oklahoma, and South Carolina at level 6. Altogether, there were 35 states at level 2 or higher, according to data from the CDC’s Outpatient Influenza-like Illness Surveillance Network.
Four pediatric ILI-related deaths were reported to the CDC during week 20, but three actually occurred during week 19. There have been 18 ILI-related deaths so far during the 2015-2016 season, the CDC said.
Influenza-like illness (ILI) activity in the 2015-2016 U.S. flu season declined for the first time since early January, according to the Centers for Disease Control and Prevention.
The proportion of outpatient visits for ILI was reported at 3.2% for the week ending Feb. 20, but the CDC has adjusted that figure to 3.3%, which makes the 3.2% reported for this most recent week (week 20 of the season, ending Feb. 27, 2016) a decrease from the week before.
Despite that drop, two states were at level 10 on the CDC’s 1-10 scale of ILI activity for the first time this season. Arizona had already reached level 10, and joining it there last week was North Carolina, moving up from level 8 the week before. Other states in the “high” range of activity were Arkansas, New Mexico, Tennessee, and Utah at level 9, and Illinois and Maryland at level 8, the CDC reported March 4. Puerto Rico, which had been at level 10 for several weeks, moved down to level 8.
States in the “moderate” range of activity for the week ending Feb. 27 were Florida and New Jersey at level 7 and Alabama, California, Hawaii, Kentucky, Mississippi, Oklahoma, and South Carolina at level 6. Altogether, there were 35 states at level 2 or higher, according to data from the CDC’s Outpatient Influenza-like Illness Surveillance Network.
Four pediatric ILI-related deaths were reported to the CDC during week 20, but three actually occurred during week 19. There have been 18 ILI-related deaths so far during the 2015-2016 season, the CDC said.

Health spending less concentrated among highest-cost population
Good news for the Occupy movement: The 99% have gained some ground.
The 1% of the U.S. population with the highest health care expenses accounted for 21.5% of all health care expenditures in 2013. That may be a lot, but it’s down from 28% in 1996, according to the Agency for Healthcare Research and Quality.
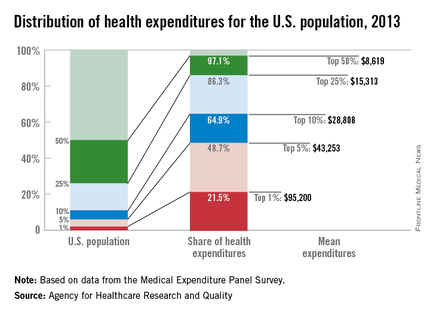
What’s more, the top 5% of the population ranked by their health care expenses dropped to 48.7% of total spending in 2013, after accounting for more than half in 1996, the AHRQ reported.
Health care expenditures for the U.S. civilian noninstitutionalized population totaled $1.4 trillion in 2013, with mean spending of $4,436 per person. The top 1%, by comparison, had mean spending of $95,200 each, and for the top 5% the figure was $43,253 per person. The top 50% of the population had mean per-person spending of $8,619 and accounted for 97.1% of all health care expenditures, leaving just 2.9% of the total to the lower-cost 50% of the population, the AHRQ said.
Looking at the distribution by race and ethnicity, the top 5% of whites accounted for 45.3% of all spending incurred by whites, compared with 50.8% of all Asian spending for the top 5% of Asians, with corresponding numbers of 56.3% for blacks and 57.3% for Hispanics. Mean spending per person was somewhat reversed, however, at $26,491 for Asian five-percenters, $28,868 for Hispanics, $45,574 for blacks, and $46,809 for whites, according to data from the Medical Expenditure Panel Survey.
Good news for the Occupy movement: The 99% have gained some ground.
The 1% of the U.S. population with the highest health care expenses accounted for 21.5% of all health care expenditures in 2013. That may be a lot, but it’s down from 28% in 1996, according to the Agency for Healthcare Research and Quality.
What’s more, the top 5% of the population ranked by their health care expenses dropped to 48.7% of total spending in 2013, after accounting for more than half in 1996, the AHRQ reported.
Health care expenditures for the U.S. civilian noninstitutionalized population totaled $1.4 trillion in 2013, with mean spending of $4,436 per person. The top 1%, by comparison, had mean spending of $95,200 each, and for the top 5% the figure was $43,253 per person. The top 50% of the population had mean per-person spending of $8,619 and accounted for 97.1% of all health care expenditures, leaving just 2.9% of the total to the lower-cost 50% of the population, the AHRQ said.
Looking at the distribution by race and ethnicity, the top 5% of whites accounted for 45.3% of all spending incurred by whites, compared with 50.8% of all Asian spending for the top 5% of Asians, with corresponding numbers of 56.3% for blacks and 57.3% for Hispanics. Mean spending per person was somewhat reversed, however, at $26,491 for Asian five-percenters, $28,868 for Hispanics, $45,574 for blacks, and $46,809 for whites, according to data from the Medical Expenditure Panel Survey.

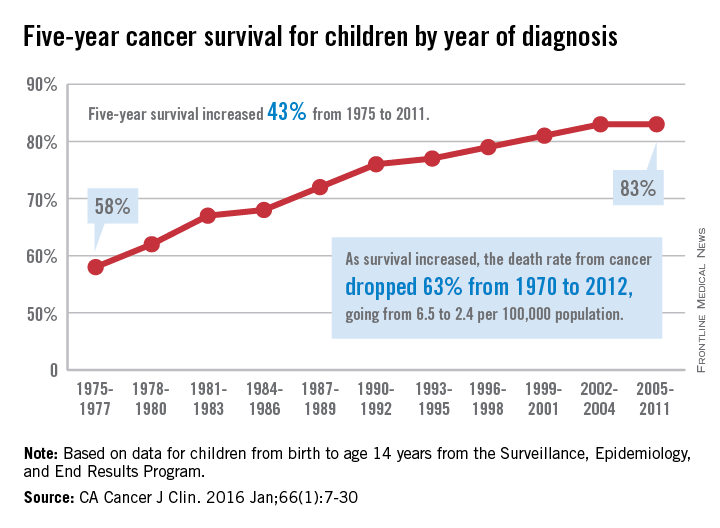
Children’s cancer survival steadily increasing
The 5-year cancer survival rate for children younger than 15 years old is up by 43% since 1975, according to investigators from the American Cancer Society.
The 5-year survival rate for all cancers showed a statistically significant rise from 58% in 1975 to 83% in 2011, said Rebecca L. Siegel and her associates at the ACS (CA Cancer J Clin. 2016 Jan;66[1]:7-30).
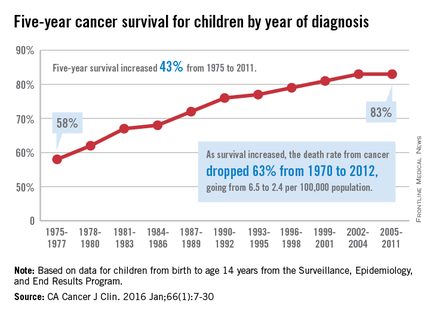
“The substantial progress for all of the major childhood cancers reflects both improvements in treatment and high levels of participation in clinical trials,” they wrote.
Survival for cancers of the brain and nervous system – now the leading cause of cancer death for those younger than 20 years old – increased from 57% in 1975 to 74% in 2011. The next-most-common cause of cancer death in children and adolescents is leukemia, and 5-year survival for acute myeloid leukemia went from 19% in 1975 to 67% in 2011, while 5-year survival for acute lymphocytic leukemia rose from 57% to 91% over that time period, the investigators reported.
The authors reported no conflicts of interest.
The 5-year cancer survival rate for children younger than 15 years old is up by 43% since 1975, according to investigators from the American Cancer Society.
The 5-year survival rate for all cancers showed a statistically significant rise from 58% in 1975 to 83% in 2011, said Rebecca L. Siegel and her associates at the ACS (CA Cancer J Clin. 2016 Jan;66[1]:7-30).
“The substantial progress for all of the major childhood cancers reflects both improvements in treatment and high levels of participation in clinical trials,” they wrote.
Survival for cancers of the brain and nervous system – now the leading cause of cancer death for those younger than 20 years old – increased from 57% in 1975 to 74% in 2011. The next-most-common cause of cancer death in children and adolescents is leukemia, and 5-year survival for acute myeloid leukemia went from 19% in 1975 to 67% in 2011, while 5-year survival for acute lymphocytic leukemia rose from 57% to 91% over that time period, the investigators reported.
The authors reported no conflicts of interest.
FROM CA: A CANCER JOURNAL FOR CLINICIANS