User login
Richard Franki is the associate editor who writes and creates graphs. He started with the company in 1987, when it was known as the International Medical News Group. In his years as a journalist, Richard has worked for Cap Cities/ABC, Disney, Harcourt, Elsevier, Quadrant, Frontline, and Internet Brands. In the 1990s, he was a contributor to the ill-fated Indications column, predecessor of Livin' on the MDedge.
U.S. flu activity continues steady climb
Influenza-like illness (ILI) activity reached a new national high for the 2015-2016 flu season during the week ending Feb. 20, according to the Centers for Disease Control and Prevention.
Nationwide, the proportion of outpatient visits for ILI was 3.2%, up from 3.1% the week before and well over the national baseline of 2.1%. Arizona and Puerto Rico were still at level 10 on the CDC’s 1-10 scale for ILI activity, and they were joined in the “high” range of activity by California, New Mexico, North Carolina, Texas, and Utah, which were all at level 8, the CDC reported Feb. 26.
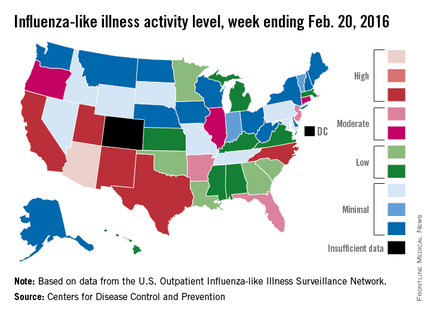
States in the “moderate” range of activity for week 19 of the 2015-2016 flu season (week 7 of calendar year 2016) were Arkansas, Florida, and New Jersey at level 7 and Connecticut, Illinois, and Oregon at level 6. There were 13 states in the “low” range of activity – five at level 5 and eight states at level 4 – and 24 states in the “minimal” range, of which 13 were at level 1. Colorado and the District of Columbia had insufficient data to determine activity level, according to data from the CDC’s Outpatient Influenza-like Illness Surveillance Network.
For the week, one flu-related pediatric death, associated with an influenza B virus, was reported to the CDC, bringing the total to 14 for the season. The only states reporting more that one death are California (two) and Florida (three), the CDC said. The average number of deaths for the three previous flu seasons is over 143.
During week 19, a total of 18,844 respiratory specimens were tested, 13.8% of which were positive: 76.1% for influenza A and 23.9% for influenza B. Since Oct. 1, 2015, 4.2% of specimens have tested positive for influenza, with a 70% to 30% split between influenza A and B, the CDC report showed.
Influenza-like illness (ILI) activity reached a new national high for the 2015-2016 flu season during the week ending Feb. 20, according to the Centers for Disease Control and Prevention.
Nationwide, the proportion of outpatient visits for ILI was 3.2%, up from 3.1% the week before and well over the national baseline of 2.1%. Arizona and Puerto Rico were still at level 10 on the CDC’s 1-10 scale for ILI activity, and they were joined in the “high” range of activity by California, New Mexico, North Carolina, Texas, and Utah, which were all at level 8, the CDC reported Feb. 26.
States in the “moderate” range of activity for week 19 of the 2015-2016 flu season (week 7 of calendar year 2016) were Arkansas, Florida, and New Jersey at level 7 and Connecticut, Illinois, and Oregon at level 6. There were 13 states in the “low” range of activity – five at level 5 and eight states at level 4 – and 24 states in the “minimal” range, of which 13 were at level 1. Colorado and the District of Columbia had insufficient data to determine activity level, according to data from the CDC’s Outpatient Influenza-like Illness Surveillance Network.
For the week, one flu-related pediatric death, associated with an influenza B virus, was reported to the CDC, bringing the total to 14 for the season. The only states reporting more that one death are California (two) and Florida (three), the CDC said. The average number of deaths for the three previous flu seasons is over 143.
During week 19, a total of 18,844 respiratory specimens were tested, 13.8% of which were positive: 76.1% for influenza A and 23.9% for influenza B. Since Oct. 1, 2015, 4.2% of specimens have tested positive for influenza, with a 70% to 30% split between influenza A and B, the CDC report showed.

Prevention driving increase in mastectomies
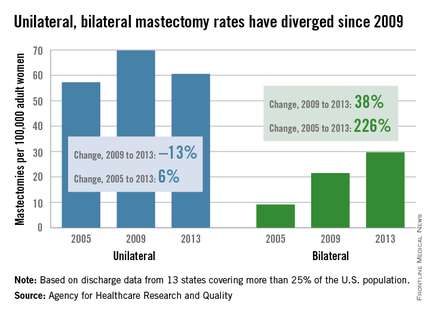
The overall mastectomy rate rose 36% from 2005 to 2013, even though “the incidence of breast cancer overall remained stable,” according to the Agency for Healthcare Research and Quality (AHRQ).
The rate of bilateral mastectomies jumped 226% over that time period, going from 9.1 per 100,000 adult women in 2005 to 29.7 per 100,000 in 2013. The unilateral mastectomy rate, starting at 57.3 per 100,000 women in 2005, rose to 69.8 in 2009 and then fell to 60.6 in 2013, for an increase of 6% overall, the AHRQ reported.
The rate of bilateral mastectomies without any cancer diagnosis increased from 2.0 to 4.4 per 100,000 from 2005 to 2013, and the unilateral rate rose from 2.7 to 3.7 per 100,000, the report noted.
Both unilateral and bilateral mastectomies are increasingly performed as outpatient procedures. The rate done in hospital-based ambulatory surgery settings nearly doubled from 16.1 to 31 per 100,000 women, and the overall proportion performed in ambulatory settings reached 45% in 2013, the AHRQ said.
The analysis shows that “more women are opting for mastectomies, particularly preventive double mastectomies, and more of those surgeries are being done as outpatient procedures,” AHRQ Director Rick Kronick, Ph.D., said in a written statement. These “changing patterns of care for breast cancer [highlight] the need for further evidence about the effects of choices women are making on their health, well-being, and safety.”
The analysis of the State Inpatient Databases and the State Ambulatory Surgery and Services Databases involved data from 13 states that had cases in both databases and used coding that allowed identification of unilateral versus bilateral mastectomies. Those 13 states represent more than 25% of the U.S. population.

Marijuana tourists also visiting Colorado EDs
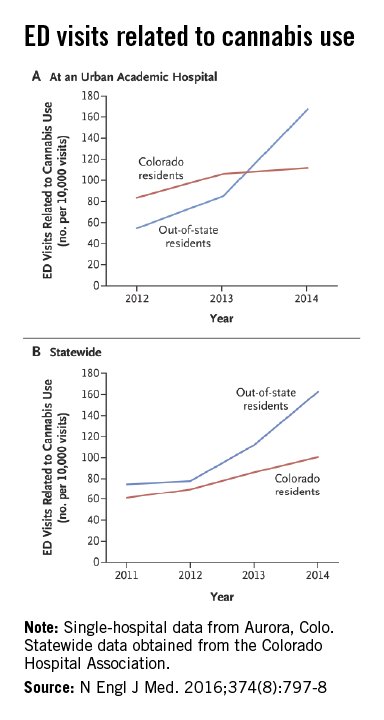
Out-of-state residents appear to be driving the recent increases in marijuana-related emergency department visits in Colorado, Dr. Howard S. Kim and his associates reported online Feb. 24 in the New England Journal of Medicine.
Using statewide data from the Colorado Hospital Association, they found that ED visits related to cannabis by out-of-state residents rose from 78 per 10,000 ED visits in 2012 to 163 per 10,000 in 2014, an increase of 109%. For Colorado residents, cannabis-related ED admissions over that same time period went up 44% – from 70 per 10,000 to 101, said Dr. Kim of Northwestern University, Chicago, and his associates (N Engl J Med. 2016 Feb 24;374[8]:797-8. doi:10.1056/NEJMc1515009).

The investigators also looked at a single urban academic hospital in Aurora, Colo., and found that cannabis-related ED visits there for out-of-state residents went from 85 per 10,000 visits in 2013 to 168 per 10,000 in 2014, compared with respective rates of 106 and 112 for Colorado residents.
“The flattening of the rates of ED visits possibly related to cannabis use among Colorado residents in an urban hospital may represent a learning curve during the period when marijuana was potentially available to Colorado residents for medical use (medical marijuana period) but was largely inaccessible to out-of-state residents,” they suggested.
Out-of-state residents appear to be driving the recent increases in marijuana-related emergency department visits in Colorado, Dr. Howard S. Kim and his associates reported online Feb. 24 in the New England Journal of Medicine.
Using statewide data from the Colorado Hospital Association, they found that ED visits related to cannabis by out-of-state residents rose from 78 per 10,000 ED visits in 2012 to 163 per 10,000 in 2014, an increase of 109%. For Colorado residents, cannabis-related ED admissions over that same time period went up 44% – from 70 per 10,000 to 101, said Dr. Kim of Northwestern University, Chicago, and his associates (N Engl J Med. 2016 Feb 24;374[8]:797-8. doi:10.1056/NEJMc1515009).
The investigators also looked at a single urban academic hospital in Aurora, Colo., and found that cannabis-related ED visits there for out-of-state residents went from 85 per 10,000 visits in 2013 to 168 per 10,000 in 2014, compared with respective rates of 106 and 112 for Colorado residents.
“The flattening of the rates of ED visits possibly related to cannabis use among Colorado residents in an urban hospital may represent a learning curve during the period when marijuana was potentially available to Colorado residents for medical use (medical marijuana period) but was largely inaccessible to out-of-state residents,” they suggested.
FROM THE NEW ENGLAND JOURNAL OF MEDICINE
Medicare part B wellness visits up 1 million in 2015
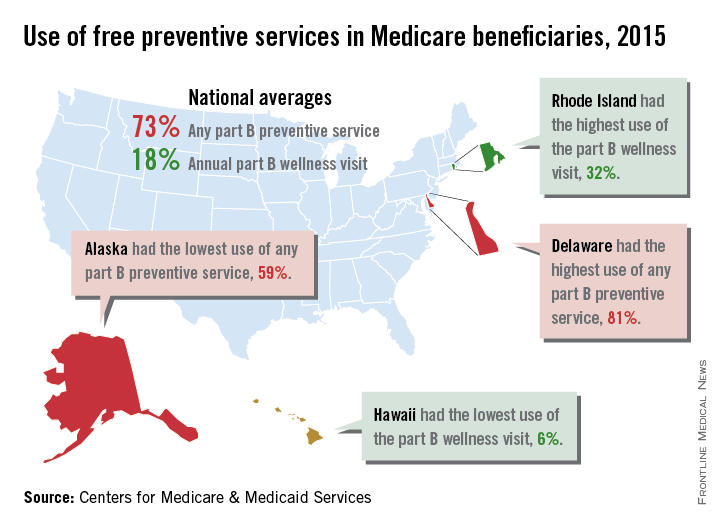
About 1 million more Medicare part B beneficiaries used their free annual wellness visit in 2015 than in 2014, the Centers for Medicare & Medicaid Services reported.
Almost 5.9 million (18%) part B beneficiaries took advantage of an annual wellness visit in 2015, compared with nearly 4.8 million in 2014. Analysis of last year’s claims also showed that 73% of the nation’s 36 million part B enrollees took advantage of at least one free preventive service made available by the Affordable Care Act with no copays or deductibles.

“Medicare consumers are now more engaged and empowered in their own health thanks to the Affordable Care Act,” Andy Slavitt, CMS acting administrator, said in a statement. “Millions are now able to access more affordable prescription medicine for their chronic conditions and millions more are staying healthier by accessing preventive services, especially vital for people living with disabilities or growing older.”
Use of these services varied by state, however. Delaware had the highest use of any preventive service at 81%, while Alaska was lowest at 59%. Use of the wellness visit was highest in Rhode Island (32%) and lowest in Hawaii (6%), the CMS said.
Preventive services available for free include bone density measurement, colorectal and lung cancer screening, and influenza and hepatitis B vaccinations, according to Medicare.gov.
About 1 million more Medicare part B beneficiaries used their free annual wellness visit in 2015 than in 2014, the Centers for Medicare & Medicaid Services reported.
Almost 5.9 million (18%) part B beneficiaries took advantage of an annual wellness visit in 2015, compared with nearly 4.8 million in 2014. Analysis of last year’s claims also showed that 73% of the nation’s 36 million part B enrollees took advantage of at least one free preventive service made available by the Affordable Care Act with no copays or deductibles.
“Medicare consumers are now more engaged and empowered in their own health thanks to the Affordable Care Act,” Andy Slavitt, CMS acting administrator, said in a statement. “Millions are now able to access more affordable prescription medicine for their chronic conditions and millions more are staying healthier by accessing preventive services, especially vital for people living with disabilities or growing older.”
Use of these services varied by state, however. Delaware had the highest use of any preventive service at 81%, while Alaska was lowest at 59%. Use of the wellness visit was highest in Rhode Island (32%) and lowest in Hawaii (6%), the CMS said.
Preventive services available for free include bone density measurement, colorectal and lung cancer screening, and influenza and hepatitis B vaccinations, according to Medicare.gov.
U.S. flu activity at its highest level yet
Activity of influenza-like illness (ILI) was at its highest level so far for week 18 of the 2015-2016 flu season, according to the Centers for Disease Control and Prevention.
That increased activity put Arizona and Puerto Rico at level 10 on the CDC’s 1-10 scale of ILI activity for the week ending Feb. 13. Joining them in the “high” range of activity was Oklahoma at level 8, the CDC reported Feb. 19.
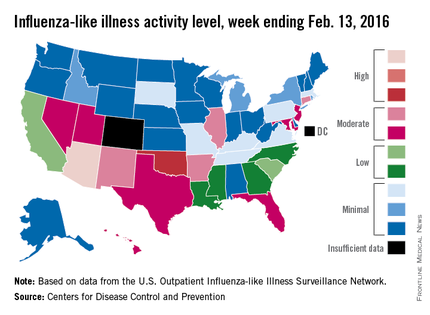
The percentage of visits for ILI in week 18 was 3.1%, higher than the national baseline of 2.1% and the highest level of the flu season. For the week, 30 states were at level 2 or higher on the CDC’s 1-10 scale, which is the highest number for the season. States in the “moderate” range were Arkansas, Connecticut, Illinois, and New Mexico at level 7 and Florida, Hawaii, Maryland, Nevada, New Jersey, Texas, and Utah at level 6. California and South Carolina (level 5) and Georgia, Louisiana, Mississippi, and North Carolina (level 4) took their place in the “low” range, data from the CDC’s Outpatient Influenza-like Illness Surveillance Network show.
Two ILI-related pediatric deaths were reported for the week – one of which occurred during the week ending Jan. 16 – bringing the total to 13 for the season. Three of those deaths occurred in Florida and two in California, with Arizona, Illinois, Louisiana, Michigan, Nevada, Puerto Rico, Tennessee, and Washington each reporting one death, the CDC said.
Since Oct. 1, 2015, the overall ILI-related hospitalization rate is 4.1 per 100,000 population, with 1,147 laboratory-confirmed flu hospitalizations reported. Among all hospitalizations, 71.1% were associated with influenza A, 26.4% with influenza B, 1.7% with influenza A and B coinfection, and 0.8% had no virus type information. Hospitalization data come from the Influenza Hospitalization Surveillance Network, which covers more than 70 counties in 10 states as well as 3 additional states.
Activity of influenza-like illness (ILI) was at its highest level so far for week 18 of the 2015-2016 flu season, according to the Centers for Disease Control and Prevention.
That increased activity put Arizona and Puerto Rico at level 10 on the CDC’s 1-10 scale of ILI activity for the week ending Feb. 13. Joining them in the “high” range of activity was Oklahoma at level 8, the CDC reported Feb. 19.
The percentage of visits for ILI in week 18 was 3.1%, higher than the national baseline of 2.1% and the highest level of the flu season. For the week, 30 states were at level 2 or higher on the CDC’s 1-10 scale, which is the highest number for the season. States in the “moderate” range were Arkansas, Connecticut, Illinois, and New Mexico at level 7 and Florida, Hawaii, Maryland, Nevada, New Jersey, Texas, and Utah at level 6. California and South Carolina (level 5) and Georgia, Louisiana, Mississippi, and North Carolina (level 4) took their place in the “low” range, data from the CDC’s Outpatient Influenza-like Illness Surveillance Network show.
Two ILI-related pediatric deaths were reported for the week – one of which occurred during the week ending Jan. 16 – bringing the total to 13 for the season. Three of those deaths occurred in Florida and two in California, with Arizona, Illinois, Louisiana, Michigan, Nevada, Puerto Rico, Tennessee, and Washington each reporting one death, the CDC said.
Since Oct. 1, 2015, the overall ILI-related hospitalization rate is 4.1 per 100,000 population, with 1,147 laboratory-confirmed flu hospitalizations reported. Among all hospitalizations, 71.1% were associated with influenza A, 26.4% with influenza B, 1.7% with influenza A and B coinfection, and 0.8% had no virus type information. Hospitalization data come from the Influenza Hospitalization Surveillance Network, which covers more than 70 counties in 10 states as well as 3 additional states.

AMA spending tops health-sector lobbying
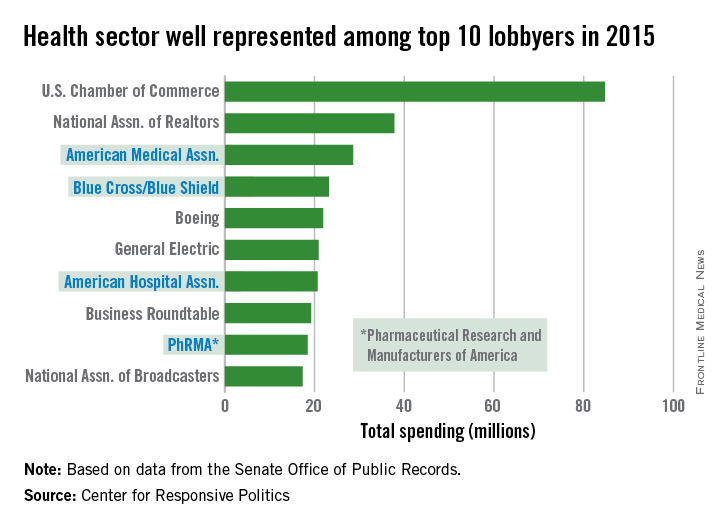
The health sector let itself be heard in Washington in 2015, as the American Medical Association and three other organizations spent their way into the lobbying top 10, according to the Center for Responsive Politics.
The AMA spent $28.6 million on lobbying last year – tops among the health sector and third among all lobbyers. The other health sector entities among the top 10 in spending were Blue Cross/Blue Shield at $23.2 million (fourth overall), the American Hospital Association at $20.7 million (seventh), and the Pharmaceutical Research and Manufacturers of America at $18.4 million (ninth), the center reported.
That’s definitely nothing to sneeze at, but it would have taken the combined spending of all four, about $90.9 million, to surpass the U.S. Chamber of Commerce, which led all lobbyers at $84.7 million.
Total spending on lobbying for the health sector was $507 million in 2015, which was second to “miscellaneous business” (including the Chamber of Commerce) among the center’s 13 ranked sectors. Total spending on lobbying for all sectors was $3.2 billion for the year, according to the center’s calculations, which were based on data from the Senate Office of Public Records.
Cancer death rates show wide geographic variation
Over 595,000 cancer deaths – an average of about 1,600 each day – are expected in the United States in 2016, but those deaths are not evenly distributed among the states, according to investigators from the American Cancer Society.
Estimates from the ACS show that, in 2016, Utah will have a cancer death rate of 99 per 100,000 population, the lowest in the country. Those same estimates predict that West Virginia will have a highest-in-the-country death rate of 258.2 per 100,000 – 2.6 times higher than Utah’s. Other states with high estimated death rates include Maine, Kentucky, Arkansas, and Pennsylvania, noted Rebecca L. Siegel and her associates at the ACS (CA Cancer J Clin. 2016 Jan;66[1]:7-30).
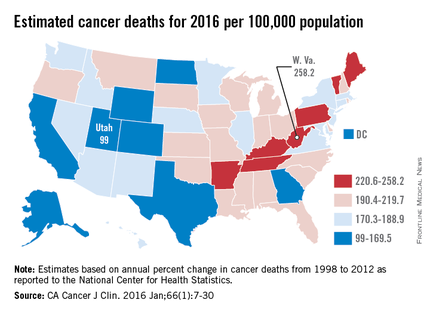
Besides Utah, the states with the lowest estimated cancer death rates in 2016 are Colorado, Texas, and Alaska, along with the District of Columbia. The national death rate for cancer has dropped 23% since 1991, the investigators said, but cancer is now the leading cause of death in 21 states. This good news/bad news situation comes about mainly as a result of “exceptionally large reductions in death from heart disease,” they added.
Ms. Siegel and her associates calculated the expected number of cancer deaths “based on the annual percent change in reported numbers of cancer deaths from 1998 through 2012 at the state and national levels as reported to the [National Center for Health Statistics].” Death rates were calculated here using estimated populations for 2015 from the U.S. Census Bureau.
Over 595,000 cancer deaths – an average of about 1,600 each day – are expected in the United States in 2016, but those deaths are not evenly distributed among the states, according to investigators from the American Cancer Society.
Estimates from the ACS show that, in 2016, Utah will have a cancer death rate of 99 per 100,000 population, the lowest in the country. Those same estimates predict that West Virginia will have a highest-in-the-country death rate of 258.2 per 100,000 – 2.6 times higher than Utah’s. Other states with high estimated death rates include Maine, Kentucky, Arkansas, and Pennsylvania, noted Rebecca L. Siegel and her associates at the ACS (CA Cancer J Clin. 2016 Jan;66[1]:7-30).
Besides Utah, the states with the lowest estimated cancer death rates in 2016 are Colorado, Texas, and Alaska, along with the District of Columbia. The national death rate for cancer has dropped 23% since 1991, the investigators said, but cancer is now the leading cause of death in 21 states. This good news/bad news situation comes about mainly as a result of “exceptionally large reductions in death from heart disease,” they added.
Ms. Siegel and her associates calculated the expected number of cancer deaths “based on the annual percent change in reported numbers of cancer deaths from 1998 through 2012 at the state and national levels as reported to the [National Center for Health Statistics].” Death rates were calculated here using estimated populations for 2015 from the U.S. Census Bureau.

COPD + asthma more expensive than COPD alone
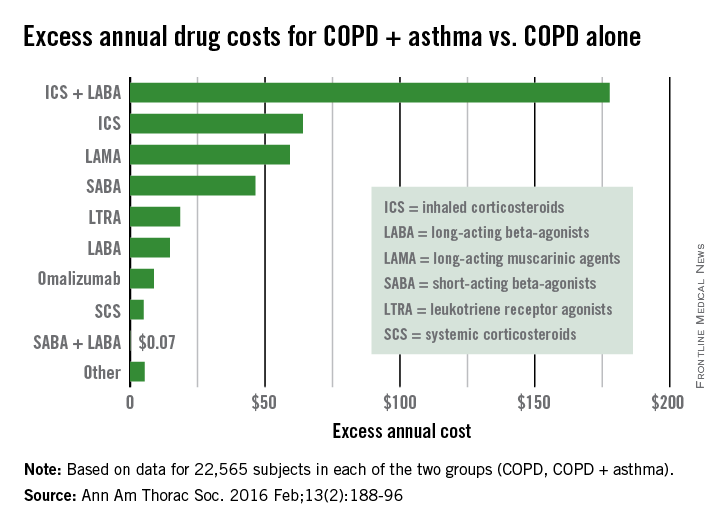
Health care costs almost $400 more per year for patients with chronic obstructive pulmonary disease who have a history of asthma, compared with those without asthma, according to a study using the health care and demographic records of over 45,000 adults in British Columbia.
From 1997 to 2012, the average annual health care cost for patients with COPD + asthma (n = 22,565) was $391 higher than for COPD patients who had no history of diagnosed asthma (n = 22,565), reported Dr. Mohsen Sadatsafavi of the University of British Columbia, Vancouver, and his associates (Ann Am Thorac Soc. 2016 Feb;13[2]:188-96).

The largest component of that excess was medication costs, which were $476 higher for patients with COPD + asthma, with outpatient services ($92) and community care ($19) making smaller contributions. These excesses were somewhat offset by hospitalization costs, which were $196 less per year for the COPD + asthma group, the investigators said. (All costs in the study were given in Canadian dollars and have been converted here to U.S. dollars.)
Among the respiratory medications, the drug class with the largest difference was inhaled corticosteroids/long-acting beta-agonists, which cost almost $178 more per year for the COPD + asthma patients. Inhaled corticosteroids were next, with a cost excess of $64 annually, followed by long-acting muscarinic agents ($59), short-acting beta-agonists ($46) and leukotriene receptor agonists ($19), Dr. Sadatsafavi and his associates said.
All subjects were aged 40 years or older (average, 67.8 years for COPD only and 68 years for COPD + asthma), and 57% of each group was female. Individuals were excluded if their date of first asthma-related resource use was less than 2 years before their first date of COPD-related resource use, they noted.
Health care costs almost $400 more per year for patients with chronic obstructive pulmonary disease who have a history of asthma, compared with those without asthma, according to a study using the health care and demographic records of over 45,000 adults in British Columbia.
From 1997 to 2012, the average annual health care cost for patients with COPD + asthma (n = 22,565) was $391 higher than for COPD patients who had no history of diagnosed asthma (n = 22,565), reported Dr. Mohsen Sadatsafavi of the University of British Columbia, Vancouver, and his associates (Ann Am Thorac Soc. 2016 Feb;13[2]:188-96).
The largest component of that excess was medication costs, which were $476 higher for patients with COPD + asthma, with outpatient services ($92) and community care ($19) making smaller contributions. These excesses were somewhat offset by hospitalization costs, which were $196 less per year for the COPD + asthma group, the investigators said. (All costs in the study were given in Canadian dollars and have been converted here to U.S. dollars.)
Among the respiratory medications, the drug class with the largest difference was inhaled corticosteroids/long-acting beta-agonists, which cost almost $178 more per year for the COPD + asthma patients. Inhaled corticosteroids were next, with a cost excess of $64 annually, followed by long-acting muscarinic agents ($59), short-acting beta-agonists ($46) and leukotriene receptor agonists ($19), Dr. Sadatsafavi and his associates said.
All subjects were aged 40 years or older (average, 67.8 years for COPD only and 68 years for COPD + asthma), and 57% of each group was female. Individuals were excluded if their date of first asthma-related resource use was less than 2 years before their first date of COPD-related resource use, they noted.
FROM ANNALS OF THE AMERICAN THORACIC SOCIETY
U.S. flu activity steady in late January
Overall influenza-like illness (ILI) activity underwent a small increase in the United States during week 16 of the 2015-2016 flu season, but Puerto Rico took a significant turn for the worse as activity there rose to the highest possible level, the Centers for Disease Control and Prevention reported Feb. 5.
Puerto Rico, which had been at level 8 on the CDC’s 1-10 scale of flu activity for the previous 3 weeks, jumped up to level 10 for the week ending Jan. 30, 2016. Meanwhile, the main measure for national flu activity, the proportion of outpatient visits for ILI, was 2.2% for the second week in a row, just above the national baseline of 2.1%, the CDC said.
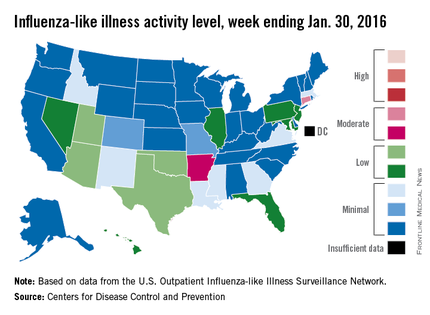
The state with the highest level of flu activity (level 7) for the week was Connecticut, with Arkansas the only other state in the “moderate” range at level 6. States in the “low” range were Florida, Hawaii, Illinois, Maryland, Nevada, New Jersey, and Pennsylvania at level 4 and Georgia, Idaho, Louisiana, Massachusetts, Mississippi, New Mexico, and Virginia at level 3. All told, there were 22 states with activity above level 1, according to data from the CDC’s Outpatient Influenza-like Illness Surveillance Network.
There were two influenza-associated pediatric deaths reported during week 16, although one death actually occurred during the week ending Jan. 16. There have been nine flu-associated pediatric deaths reported so far during the 2015-2016 season.
The hospitalization rate for the season so far is 2.6/100,000 population, up from 2.1/100,000 last week. Adults aged 65 years and older had the highest rate at 8.5/100,000, with children aged 0-4 years next at 3.8/100,000.
Overall influenza-like illness (ILI) activity underwent a small increase in the United States during week 16 of the 2015-2016 flu season, but Puerto Rico took a significant turn for the worse as activity there rose to the highest possible level, the Centers for Disease Control and Prevention reported Feb. 5.
Puerto Rico, which had been at level 8 on the CDC’s 1-10 scale of flu activity for the previous 3 weeks, jumped up to level 10 for the week ending Jan. 30, 2016. Meanwhile, the main measure for national flu activity, the proportion of outpatient visits for ILI, was 2.2% for the second week in a row, just above the national baseline of 2.1%, the CDC said.
The state with the highest level of flu activity (level 7) for the week was Connecticut, with Arkansas the only other state in the “moderate” range at level 6. States in the “low” range were Florida, Hawaii, Illinois, Maryland, Nevada, New Jersey, and Pennsylvania at level 4 and Georgia, Idaho, Louisiana, Massachusetts, Mississippi, New Mexico, and Virginia at level 3. All told, there were 22 states with activity above level 1, according to data from the CDC’s Outpatient Influenza-like Illness Surveillance Network.
There were two influenza-associated pediatric deaths reported during week 16, although one death actually occurred during the week ending Jan. 16. There have been nine flu-associated pediatric deaths reported so far during the 2015-2016 season.
The hospitalization rate for the season so far is 2.6/100,000 population, up from 2.1/100,000 last week. Adults aged 65 years and older had the highest rate at 8.5/100,000, with children aged 0-4 years next at 3.8/100,000.

Sovaldi topped Medicare part D spending in 2014
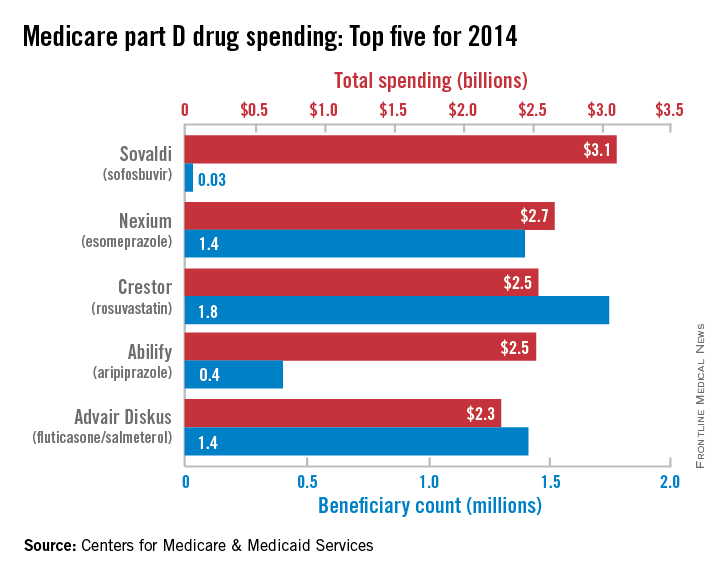
In its first year on the market, the hepatitis C virus drug Sovaldi soared to the top of the Medicare part D spending list, the Centers for Medicare & Medicaid Services reported.
With innovative oral HCV drugs getting at least partial credit for a big jump in U.S. health expenditures in 2014, total part D spending for Sovaldi (sofosbuvir) was more than $3.1 billion, close to half a billion more than second-place Nexium (esomeprazole), which had almost $2.7 billion in spending for the year. Next on the list was Crestor (rosuvastatin) at $2.54 billion, followed by Abilify (aripiprazole) at $2.53 billion and Advair Diskus (fluticasone/salmeterol) at $2.3 billion, according to the Medicare drug spending dashboard.
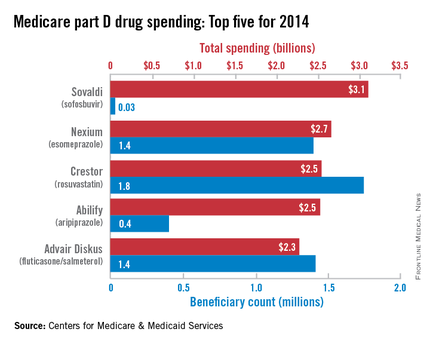
Sovaldi’s spot at the top, however, was not a result of its popularity. Compared with the other top five drugs, it was used by the fewest people (33,000) and had the highest average per-unit cost ($1,017). Crestor was most commonly prescribed among the five, with 1.7 million users in 2014. Advair Diskus was used by 1.42 million part D beneficiaries, putting it just ahead of Nexium, which had 1.4 million users. Abilify was well behind those three with 405,000 users, but it did have the second-highest per-unit cost, $28.65. The per-unit costs were similar for Crestor ($6.07), Advair Diskus ($4.94), and Nexium ($7.82), the CMS data show.
In 2014 overall, 3,761 different prescription drug products were covered by Medicare part D, with total program spending of $121.5 billion. There were 115 drugs with spending over $250 million for the year, and combined spending for those 115 drugs was $76.7 billion, or 63% of the part D total, the CMS said.
In its first year on the market, the hepatitis C virus drug Sovaldi soared to the top of the Medicare part D spending list, the Centers for Medicare & Medicaid Services reported.
With innovative oral HCV drugs getting at least partial credit for a big jump in U.S. health expenditures in 2014, total part D spending for Sovaldi (sofosbuvir) was more than $3.1 billion, close to half a billion more than second-place Nexium (esomeprazole), which had almost $2.7 billion in spending for the year. Next on the list was Crestor (rosuvastatin) at $2.54 billion, followed by Abilify (aripiprazole) at $2.53 billion and Advair Diskus (fluticasone/salmeterol) at $2.3 billion, according to the Medicare drug spending dashboard.
Sovaldi’s spot at the top, however, was not a result of its popularity. Compared with the other top five drugs, it was used by the fewest people (33,000) and had the highest average per-unit cost ($1,017). Crestor was most commonly prescribed among the five, with 1.7 million users in 2014. Advair Diskus was used by 1.42 million part D beneficiaries, putting it just ahead of Nexium, which had 1.4 million users. Abilify was well behind those three with 405,000 users, but it did have the second-highest per-unit cost, $28.65. The per-unit costs were similar for Crestor ($6.07), Advair Diskus ($4.94), and Nexium ($7.82), the CMS data show.
In 2014 overall, 3,761 different prescription drug products were covered by Medicare part D, with total program spending of $121.5 billion. There were 115 drugs with spending over $250 million for the year, and combined spending for those 115 drugs was $76.7 billion, or 63% of the part D total, the CMS said.