User login
Richard Franki is the associate editor who writes and creates graphs. He started with the company in 1987, when it was known as the International Medical News Group. In his years as a journalist, Richard has worked for Cap Cities/ABC, Disney, Harcourt, Elsevier, Quadrant, Frontline, and Internet Brands. In the 1990s, he was a contributor to the ill-fated Indications column, predecessor of Livin' on the MDedge.
Septicemia cost U.S. hospitals $23.7 billion in 2013
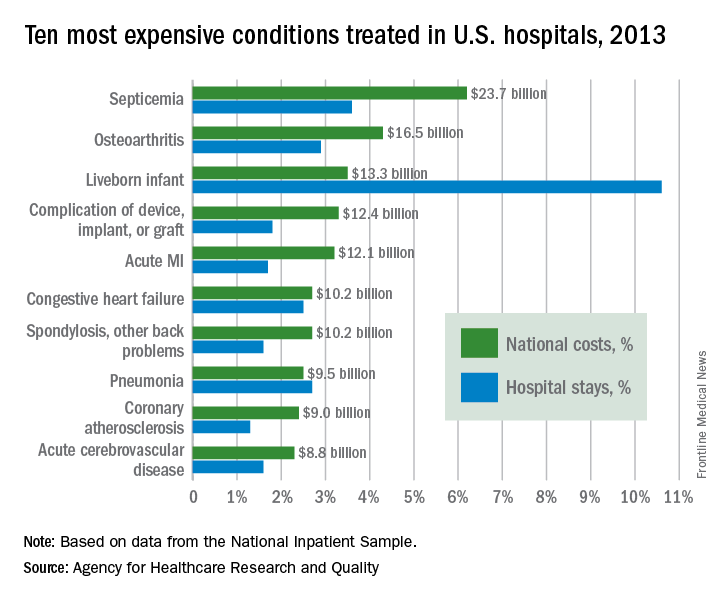
Septicemia is the most expensive condition treated in U.S. hospitals, accounting for $23.7 billion in aggregate hospital costs in 2013, according to the Agency for Healthcare Research and Quality.

Spending on septicemia represented 6.2% of the total cost for all hospitalizations in 2013. The rest of the five most expensive conditions were osteoarthritis ($16.5 billion); liveborn infants ($13.3 billion); complications of devices, implants, or grafts ($12.4 billion); and acute MI ($12.1 billion). These five conditions accounted for 20.5% of all U.S. hospital costs and 20.6% of all admissions, the AHRQ report noted.
Total hospital costs for the 35.6 million overall stays in 2013 were more than $381 billion. That figure represents hospitals’ cost to produce the services, not the amount covered by payers, and it does not include physician fees associated with hospitalizations, the agency said.
Septicemia is the most expensive condition treated in U.S. hospitals, accounting for $23.7 billion in aggregate hospital costs in 2013, according to the Agency for Healthcare Research and Quality.
Spending on septicemia represented 6.2% of the total cost for all hospitalizations in 2013. The rest of the five most expensive conditions were osteoarthritis ($16.5 billion); liveborn infants ($13.3 billion); complications of devices, implants, or grafts ($12.4 billion); and acute MI ($12.1 billion). These five conditions accounted for 20.5% of all U.S. hospital costs and 20.6% of all admissions, the AHRQ report noted.
Total hospital costs for the 35.6 million overall stays in 2013 were more than $381 billion. That figure represents hospitals’ cost to produce the services, not the amount covered by payers, and it does not include physician fees associated with hospitalizations, the agency said.
Continuing demand for family physicians drives up salaries
The average starting salary for family physicians was up 13% in the last year, with the increase putting it over $200,000 for the first time, according to physician recruitment firm Merritt Hawkins.
The average starting salary was $225,000 among family physicians recruited by the company in the 12 months from April 1, 2015, to March 31, 2016, compared with $198,000 the previous year. Of the 3,342 recruiting searches conducted in that year, family physicians were the subject of 627, tops among the 19 medical specialties tracked in the company’s 2016 Review of Physician and Advanced Practitioner Recruiting Incentives.
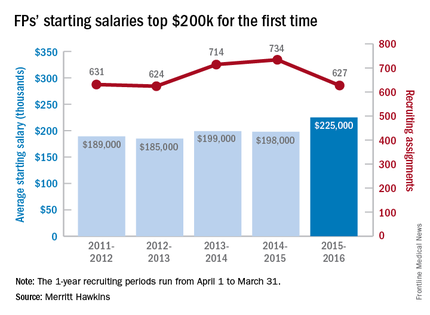
The number of searches was down from the previous year, but it was still more than twice as many as psychiatry, which was second with 250 searches, and it was the 10th consecutive year that family physicians were the most recruited specialty, the report noted.
Starting salaries were up for 18 of the 19 specialties, with only emergency medicine showing a decease. “Demand for physicians is as intense as we have seen it in our 29-year history,” Travis Singleton, senior vice president of Merritt Hawkins, said in a separate statement. “The expansion of health insurance coverage, population growth, population aging, expanded care sites such as urgent care centers and other factors are driving demand for doctors through the roof, and salaries are spiking as a consequence.”
The average starting salary for family physicians was up 13% in the last year, with the increase putting it over $200,000 for the first time, according to physician recruitment firm Merritt Hawkins.
The average starting salary was $225,000 among family physicians recruited by the company in the 12 months from April 1, 2015, to March 31, 2016, compared with $198,000 the previous year. Of the 3,342 recruiting searches conducted in that year, family physicians were the subject of 627, tops among the 19 medical specialties tracked in the company’s 2016 Review of Physician and Advanced Practitioner Recruiting Incentives.
The number of searches was down from the previous year, but it was still more than twice as many as psychiatry, which was second with 250 searches, and it was the 10th consecutive year that family physicians were the most recruited specialty, the report noted.
Starting salaries were up for 18 of the 19 specialties, with only emergency medicine showing a decease. “Demand for physicians is as intense as we have seen it in our 29-year history,” Travis Singleton, senior vice president of Merritt Hawkins, said in a separate statement. “The expansion of health insurance coverage, population growth, population aging, expanded care sites such as urgent care centers and other factors are driving demand for doctors through the roof, and salaries are spiking as a consequence.”

FPs generating less revenue for hospitals
Family physicians generated less revenue for hospitals in 2015 than in 2012, as did primary care physicians in general, while physicians overall increased the revenue generated over that time, according to physician recruitment firm Merritt Hawkins.
Family physicians generated average net revenue of almost $1.5 million in 2015, down by 38% from $2.1 million in 2012, when Merritt Hawkins last conducted its survey of hospital chief financial officers. For primary care physicians, the 2015 figure was $1.4 million, compared with $1.57 million in 2012 – a drop of 10.5%.
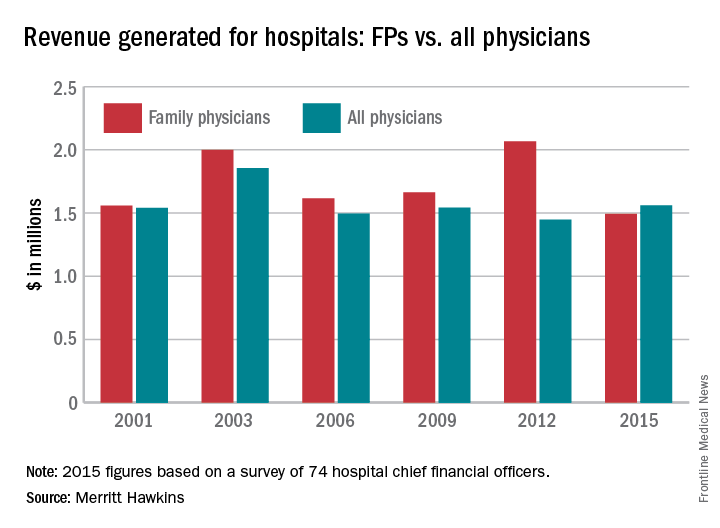
“Declining revenues generated by family physicians … may be a result of risk-bearing reimbursement models, where primary care physicians and their employers are penalized for exceeding budgets,” the report suggested. Another factor in the decline may be decreased productivity among physicians employed by hospitals. A survey of over 20,000 physicians conducted in 2014 by Merritt Hawkins indicated that employed physicians saw 8.5% fewer patients per day than did independent physicians.
Net revenue generated by physicians in all 18 specialties measured averaged $1.56 million in 2015, which was up 7.7% over the $1.45 million generated in 2012. Average revenue for specialists was up 12.8%, going from $1.42 million in 2012 to $1.61 million in 2015.
The survey (available for download here) was completed by 74 hospital chief financial officers, but despite the small number, Merritt Hawkins said that the “results are reliable and accurate, in large part because the overall number for average annual revenue generated by all physician specialties for their affiliated hospitals has remained virtually unchanged” over the course of six surveys spanning 14 years.
Family physicians generated less revenue for hospitals in 2015 than in 2012, as did primary care physicians in general, while physicians overall increased the revenue generated over that time, according to physician recruitment firm Merritt Hawkins.
Family physicians generated average net revenue of almost $1.5 million in 2015, down by 38% from $2.1 million in 2012, when Merritt Hawkins last conducted its survey of hospital chief financial officers. For primary care physicians, the 2015 figure was $1.4 million, compared with $1.57 million in 2012 – a drop of 10.5%.
“Declining revenues generated by family physicians … may be a result of risk-bearing reimbursement models, where primary care physicians and their employers are penalized for exceeding budgets,” the report suggested. Another factor in the decline may be decreased productivity among physicians employed by hospitals. A survey of over 20,000 physicians conducted in 2014 by Merritt Hawkins indicated that employed physicians saw 8.5% fewer patients per day than did independent physicians.
Net revenue generated by physicians in all 18 specialties measured averaged $1.56 million in 2015, which was up 7.7% over the $1.45 million generated in 2012. Average revenue for specialists was up 12.8%, going from $1.42 million in 2012 to $1.61 million in 2015.
The survey (available for download here) was completed by 74 hospital chief financial officers, but despite the small number, Merritt Hawkins said that the “results are reliable and accurate, in large part because the overall number for average annual revenue generated by all physician specialties for their affiliated hospitals has remained virtually unchanged” over the course of six surveys spanning 14 years.

Over 20% of Americans skipped needed mental health care
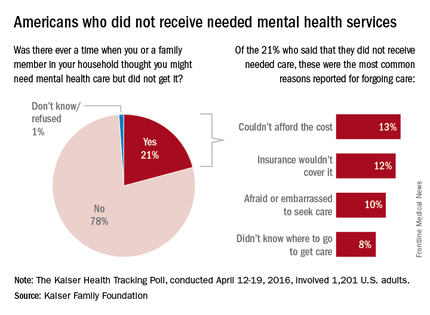
About one in five Americans report that there was a time when they or a family member in their household thought they needed mental health care but did not receive it for various reasons, according to a poll conducted by the Kaiser Family Foundation.
Among the 21% of Americans who did not get such care, the most common reason was “couldn’t afford the cost” (13%), which was closely followed by “insurance wouldn’t cover it” at 12%. “Afraid or embarrassed to seek care” was cited by 10% of those who had forgone mental health care, and 8% said that the reason was “didn’t know where to go to get care,” the Kaiser report said.
The Kaiser Health Tracking Poll was conducted April 12-19, 2016, among a nationally representative sample of 1,201 adults aged 18 years and older.

Mental Health Disorders the Leading Cause of Disease Burden for Females
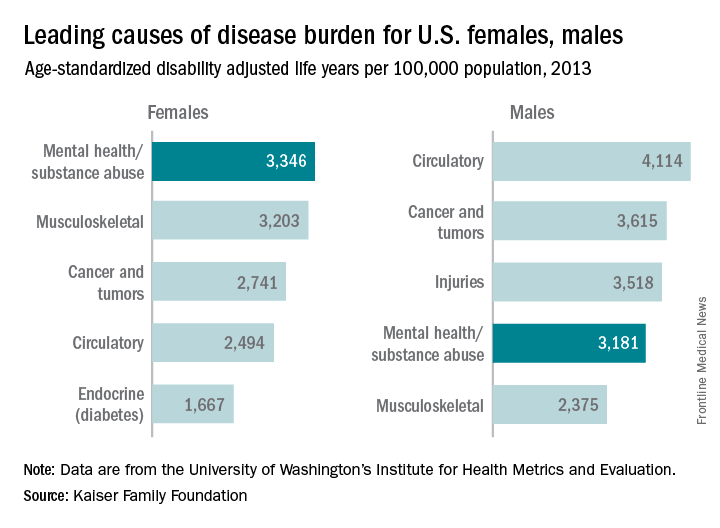
Mental health and substance abuse disorders are the leading cause of disease burden among U.S. females and the fourth-leading cause for males, according to the Kaiser Family Foundation.
Mental health/substance abuse conditions caused 3,346 age-standardized disability adjusted life years (DALYs) per 100,000 population for females in 2013, putting those conditions ahead of musculoskeletal conditions (3,203 DALYs per 100,000), cancer and tumors (2,741 DALYs), circulatory conditions (2,494 DALYs), and diabetes and other endocrine conditions (1,667 DALYs), Kaiser reported.

Among males, the disease burden resulting from mental health/substance abuse – 3,181 DALYs per 100,000 population – was less than that from circulatory conditions (4,114 DALYs per 100,000), cancer and tumors (3,615 DALYs), and injuries (3,518 DALYs). Musculoskeletal disorders were fifth at 2,375 DALYs, according to data from the Institute for Health Metrics and Evaluation’s Global Burden of Disease Study 2013.
The World Health Organization defines DALYs as “the sum of years of potential life lost due to premature mortality and the years of productive life lost due to disability.”
Mental health and substance abuse disorders are the leading cause of disease burden among U.S. females and the fourth-leading cause for males, according to the Kaiser Family Foundation.
Mental health/substance abuse conditions caused 3,346 age-standardized disability adjusted life years (DALYs) per 100,000 population for females in 2013, putting those conditions ahead of musculoskeletal conditions (3,203 DALYs per 100,000), cancer and tumors (2,741 DALYs), circulatory conditions (2,494 DALYs), and diabetes and other endocrine conditions (1,667 DALYs), Kaiser reported.
Among males, the disease burden resulting from mental health/substance abuse – 3,181 DALYs per 100,000 population – was less than that from circulatory conditions (4,114 DALYs per 100,000), cancer and tumors (3,615 DALYs), and injuries (3,518 DALYs). Musculoskeletal disorders were fifth at 2,375 DALYs, according to data from the Institute for Health Metrics and Evaluation’s Global Burden of Disease Study 2013.
The World Health Organization defines DALYs as “the sum of years of potential life lost due to premature mortality and the years of productive life lost due to disability.”

Mental health disorders the leading cause of disease burden for females
Mental health and substance abuse disorders are the leading cause of disease burden among U.S. females and the fourth-leading cause for males, according to the Kaiser Family Foundation.
Mental health/substance abuse conditions caused 3,346 age-standardized disability adjusted life years (DALYs) per 100,000 population for females in 2013, putting those conditions ahead of musculoskeletal conditions (3,203 DALYs per 100,000), cancer and tumors (2,741 DALYs), circulatory conditions (2,494 DALYs), and diabetes and other endocrine conditions (1,667 DALYs), Kaiser reported.
Among males, the disease burden resulting from mental health/substance abuse – 3,181 DALYs per 100,000 population – was less than that from circulatory conditions (4,114 DALYs per 100,000), cancer and tumors (3,615 DALYs), and injuries (3,518 DALYs). Musculoskeletal disorders were fifth at 2,375 DALYs, according to data from the Institute for Health Metrics and Evaluation’s Global Burden of Disease Study 2013.
The World Health Organization defines DALYs as “the sum of years of potential life lost due to premature mortality and the years of productive life lost due to disability.”

Internists’ hospital revenue steady as primary care drops
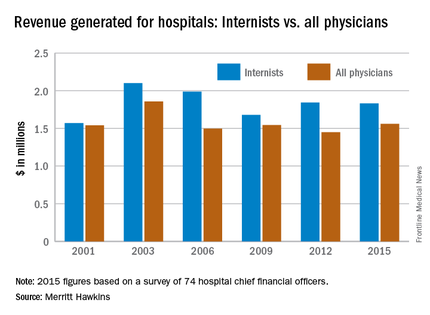
The average net revenue internists generated for hospitals held steady from 2012 to 2015, unlike that of primary care physicians in general, according to a survey by physician recruitment firm Merritt Hawkins.
Internists generated average net revenue of almost $1.83 million for their affiliated hospitals in 2015, down by less than 1% from the $1.84 million generated in 2012, when Merritt Hawkins last conducted its Physician Inpatient/Outpatient Revenue Survey of hospital chief financial officers. For primary care physicians more broadly – defined as family physicians, general internal medicine physicians, and pediatricians – the 2015 figure was $1.40 million, compared with $1.56 million in 2012 – a drop of 10.5%.
“Declining revenues generated by family physicians (and flat revenues generated by general internists) may be a result of risk-bearing reimbursement models, where primary care physicians and their employers are penalized for exceeding budgets,” the report suggested. Another factor in the decline among primary care physicians may be decreased productivity among physicians employed by hospitals. A survey of over 20,000 physicians conducted in 2014 by Merritt Hawkins indicated that employed physicians saw 8.5% fewer patients per day than did independent physicians.
Average net revenue generated by physicians in all 18 specialties measured almost $1.56 million in 2015, which was up 7.7% over the $1.45 million generated in 2012. Average net revenue for specialists was up 12.8%, going from $1.42 million in 2012 to $1.61 million in 2015.
The survey (available for download here) was completed by 74 hospital chief financial officers. Despite the small number, Merritt Hawkins said that the “results are reliable and accurate, in large part because the overall number for average annual revenue generated by all physician specialties for their affiliated hospitals has remained virtually unchanged” over the course of six surveys spanning 14 years.

Fewer adults with psychological distress getting mental health care
The percentage of adults with psychological distress who saw or spoke with a mental health professional has gone down every year since 2012, according to the National Center for Heath Statistics.
In 2012, almost 42% of adults aged 18-64 years who reported experiencing serious psychological distress in the previous 30 days had seen or spoken with a mental health professional in the previous 12 months. By 2015 (January through September), the percentage was down to 34.2%, and it dropped each of the 2 years between, with the trend significant at P less than .05, the NCHS reported.
For adults without psychological distress, contacts with mental health professionals were consistently around 7% for all 4 years, the NCHS noted.
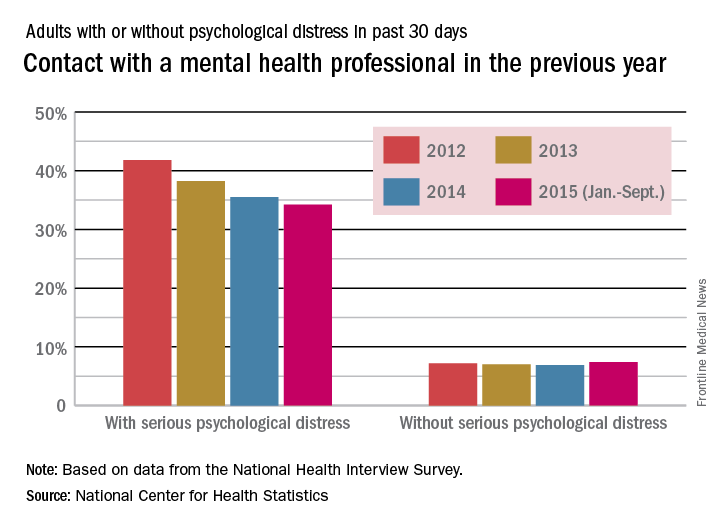
In the first 9 months of 2015, 3.8% of all adults aged 18-64 years experienced serious psychological distress, compared with 3.4% in 2014, 4% in 2013, and 3.2% in 2012, according to data from the National Health Interview Survey.
The percentage of adults with psychological distress who saw or spoke with a mental health professional has gone down every year since 2012, according to the National Center for Heath Statistics.
In 2012, almost 42% of adults aged 18-64 years who reported experiencing serious psychological distress in the previous 30 days had seen or spoken with a mental health professional in the previous 12 months. By 2015 (January through September), the percentage was down to 34.2%, and it dropped each of the 2 years between, with the trend significant at P less than .05, the NCHS reported.
For adults without psychological distress, contacts with mental health professionals were consistently around 7% for all 4 years, the NCHS noted.
In the first 9 months of 2015, 3.8% of all adults aged 18-64 years experienced serious psychological distress, compared with 3.4% in 2014, 4% in 2013, and 3.2% in 2012, according to data from the National Health Interview Survey.

Health care system could be short 33,000 surgeons by 2025
The number of surgeon specialists is expected to decrease as the segment of the population over age 65 years continues to grow, resulting in a projected shortage of 25,200-33,000 surgeons by the year 2025, according to the Association of American Medical Colleges.
Those numbers are up from the shortage of 23,100-31,600 surgeons the AAMC estimated just last year for 2025. “Based on current trends, the supply of several larger surgical specialties (e.g., ophthalmology and urology) will fall, as future attrition is likely to exceed the number of new entrants. In other words, there will be fewer surgical specialists in 2025 than are practicing today,” the AAMC said in its 2016 report on physician supply and demand.

The analysis involved several different supply and demand scenarios that resulted in a wide range of estimates for physician shortages. The AAMC then narrowed down that range by reporting the 25th percentile (25,200) and the 75th percentile (33,000) of the projections.
The number of surgeon specialists is expected to decrease as the segment of the population over age 65 years continues to grow, resulting in a projected shortage of 25,200-33,000 surgeons by the year 2025, according to the Association of American Medical Colleges.
Those numbers are up from the shortage of 23,100-31,600 surgeons the AAMC estimated just last year for 2025. “Based on current trends, the supply of several larger surgical specialties (e.g., ophthalmology and urology) will fall, as future attrition is likely to exceed the number of new entrants. In other words, there will be fewer surgical specialists in 2025 than are practicing today,” the AAMC said in its 2016 report on physician supply and demand.
The analysis involved several different supply and demand scenarios that resulted in a wide range of estimates for physician shortages. The AAMC then narrowed down that range by reporting the 25th percentile (25,200) and the 75th percentile (33,000) of the projections.

Pediatricians generating less revenue for hospitals
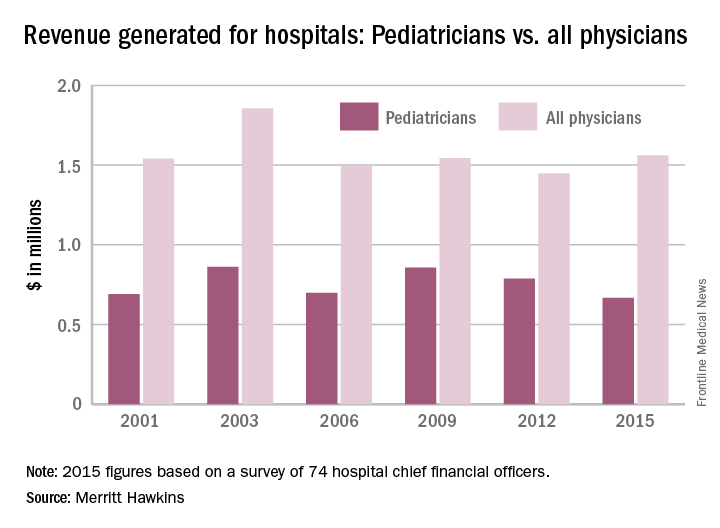
Pediatricians generated less revenue for hospitals in 2015 than in 2012, as did primary care physicians in general, while physicians overall increased the revenue generated over that time, according to physician recruitment firm Merritt Hawkins.
Pediatricians generated average net revenue of $666,000 in 2015, down by 15.5% from $788,000 in 2012, when Merritt Hawkins last conducted its survey of hospital chief financial officers. For primary care physicians, the 2015 figure was $1.4 million, compared with $1.56 million in 2012 – a drop of 10.5%.

Those declines “may be a result of risk-bearing reimbursement models, where primary care physicians and their employers are penalized for exceeding budgets,” the report suggested. Another factor in the decline may be decreased productivity among physicians employed by hospitals. A survey of over 20,000 physicians conducted in 2014 by Merritt Hawkins indicated that employed physicians saw 8.5% fewer patients per day than did independent physicians.
Net revenue generated by physicians in all 18 specialties measured averaged almost $1.6 million in 2015, which was up 7.7% over the $1.5 million generated in 2012. Average revenue for specialists was up 12.8%, going from $1.4 million in 2012 to $1.6 million in 2015.
The survey (available for download here) was completed by 74 hospital chief financial officers. Despite the small number, Merritt Hawkins said that the “results are reliable and accurate, in large part because the overall number for average annual revenue generated by all physician specialties for their affiliated hospitals has remained virtually unchanged” over the course of six surveys spanning 14 years.
Pediatricians generated less revenue for hospitals in 2015 than in 2012, as did primary care physicians in general, while physicians overall increased the revenue generated over that time, according to physician recruitment firm Merritt Hawkins.
Pediatricians generated average net revenue of $666,000 in 2015, down by 15.5% from $788,000 in 2012, when Merritt Hawkins last conducted its survey of hospital chief financial officers. For primary care physicians, the 2015 figure was $1.4 million, compared with $1.56 million in 2012 – a drop of 10.5%.
Those declines “may be a result of risk-bearing reimbursement models, where primary care physicians and their employers are penalized for exceeding budgets,” the report suggested. Another factor in the decline may be decreased productivity among physicians employed by hospitals. A survey of over 20,000 physicians conducted in 2014 by Merritt Hawkins indicated that employed physicians saw 8.5% fewer patients per day than did independent physicians.
Net revenue generated by physicians in all 18 specialties measured averaged almost $1.6 million in 2015, which was up 7.7% over the $1.5 million generated in 2012. Average revenue for specialists was up 12.8%, going from $1.4 million in 2012 to $1.6 million in 2015.
The survey (available for download here) was completed by 74 hospital chief financial officers. Despite the small number, Merritt Hawkins said that the “results are reliable and accurate, in large part because the overall number for average annual revenue generated by all physician specialties for their affiliated hospitals has remained virtually unchanged” over the course of six surveys spanning 14 years.