User login
Richard Franki is the associate editor who writes and creates graphs. He started with the company in 1987, when it was known as the International Medical News Group. In his years as a journalist, Richard has worked for Cap Cities/ABC, Disney, Harcourt, Elsevier, Quadrant, Frontline, and Internet Brands. In the 1990s, he was a contributor to the ill-fated Indications column, predecessor of Livin' on the MDedge.
Hospital costs higher for patients discharged to postacute care
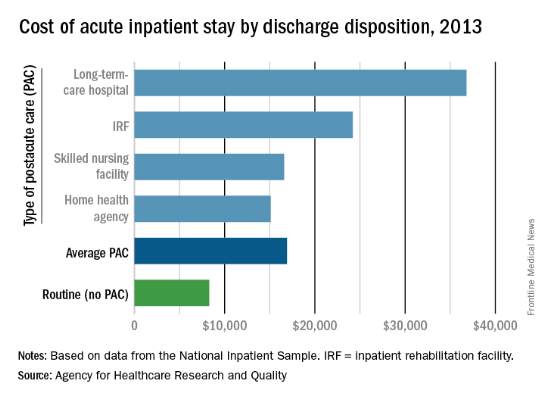
The average cost of U.S. hospital stays for injury or illness in patients discharged to postacute care is more than double that of visits with routine discharges, according to the Agency for Healthcare Research and Quality.
For patients who were discharged from hospitals to PAC, the average cost of an inpatient visit in 2013 was $16,900, compared with $8,300 for patients with routine discharges. The inpatient visits with PAC were almost twice as long as those with routine discharge – 7.0 days vs. 3.6 days – and patients with PAC-discharge visits were much older – 69.5% were aged 65 years or older, compared with 22.4% of visits with routine discharges, the AHRQ reported.

The AHRQ used data from the 2013 National Inpatient Sample (NIS) to estimates discharges to PAC for all types of payers and describe these discharges from the perspective of payers, patients, hospitals, conditions/procedures, and geographic regions.
The cost of stays varied considerably among the various PAC settings in 2013. Inpatient stays with discharge to home health agencies had the lowest average cost at $15,100, with skilled nursing facilities next at $16,600, followed by inpatient rehabilitation facilities at $24,200 and long-term-care hospitals at $36,800. Length of stays by PAC setting showed the same trend: those with discharge to home health agencies were shortest (6.2 days) and those with discharge to long-term-care hospitals were longest (13.5 days), the AHRQ said in the report.
Inpatient stays with discharge to PAC made up 22.3% of all hospital discharges in 2013, with the bulk being discharges to home health agencies (50.1%) and skilled nursing facilities (40.5%). Discharges to inpatient rehabilitation facilities made up 7.2% of all PAC visits, while those to long-term-care hospitals were just 2.2%, the data from the NIS show.
The average cost of U.S. hospital stays for injury or illness in patients discharged to postacute care is more than double that of visits with routine discharges, according to the Agency for Healthcare Research and Quality.
For patients who were discharged from hospitals to PAC, the average cost of an inpatient visit in 2013 was $16,900, compared with $8,300 for patients with routine discharges. The inpatient visits with PAC were almost twice as long as those with routine discharge – 7.0 days vs. 3.6 days – and patients with PAC-discharge visits were much older – 69.5% were aged 65 years or older, compared with 22.4% of visits with routine discharges, the AHRQ reported.
The AHRQ used data from the 2013 National Inpatient Sample (NIS) to estimates discharges to PAC for all types of payers and describe these discharges from the perspective of payers, patients, hospitals, conditions/procedures, and geographic regions.
The cost of stays varied considerably among the various PAC settings in 2013. Inpatient stays with discharge to home health agencies had the lowest average cost at $15,100, with skilled nursing facilities next at $16,600, followed by inpatient rehabilitation facilities at $24,200 and long-term-care hospitals at $36,800. Length of stays by PAC setting showed the same trend: those with discharge to home health agencies were shortest (6.2 days) and those with discharge to long-term-care hospitals were longest (13.5 days), the AHRQ said in the report.
Inpatient stays with discharge to PAC made up 22.3% of all hospital discharges in 2013, with the bulk being discharges to home health agencies (50.1%) and skilled nursing facilities (40.5%). Discharges to inpatient rehabilitation facilities made up 7.2% of all PAC visits, while those to long-term-care hospitals were just 2.2%, the data from the NIS show.
Children’s lead levels in Flint, Mich., fluctuate as water supply switched
In Flint, Mich., the prevalence of elevated blood lead levels rose among children under age 6 years after the switch in the city’s water source, dropped after an advisory was issued, and then dropped below original levels after the city switched back to its original water source, according to the Centers for Disease Control and Prevention.
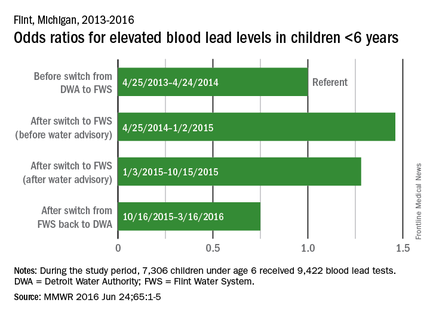
In the year before the switch (April 25, 2013, to April 24, 2014), 3.1% of blood lead levels (BLLs) in children under age 6 years were 5 mcg/dL or higher, which the CDC considers to be elevated. After the switch from the Detroit Water Authority (DWA) to the Flint Water System (FWS) but before the water advisory was issued (April 25, 2014, to Jan. 2, 2015), elevated BLLs increased to 5.0%, for an adjusted odds ratio of 1.46 (MMWR 2016 Jun 24;65:1-5).
For the period after the water advisory but before the water supply was switched back to the DWA (Jan. 3, 2015, to Oct. 15, 2015), 3.9% of BLLs were elevated (aOR, 1.28). For the 5 months after the switch back to the DWA, the percentage of elevated BLLs dropped to 1.4% (aOR, 0.75).
The analysis involved the results of 9,422 tests received by 7,306 children, all of whom lived in the area served by the FWS. The Environmental Protection Agency recently advised that it is safe for Flint residents to drink filtered tap water and that unfiltered tap water can be used for bathing and showering, the CDC report noted.
In Flint, Mich., the prevalence of elevated blood lead levels rose among children under age 6 years after the switch in the city’s water source, dropped after an advisory was issued, and then dropped below original levels after the city switched back to its original water source, according to the Centers for Disease Control and Prevention.
In the year before the switch (April 25, 2013, to April 24, 2014), 3.1% of blood lead levels (BLLs) in children under age 6 years were 5 mcg/dL or higher, which the CDC considers to be elevated. After the switch from the Detroit Water Authority (DWA) to the Flint Water System (FWS) but before the water advisory was issued (April 25, 2014, to Jan. 2, 2015), elevated BLLs increased to 5.0%, for an adjusted odds ratio of 1.46 (MMWR 2016 Jun 24;65:1-5).
For the period after the water advisory but before the water supply was switched back to the DWA (Jan. 3, 2015, to Oct. 15, 2015), 3.9% of BLLs were elevated (aOR, 1.28). For the 5 months after the switch back to the DWA, the percentage of elevated BLLs dropped to 1.4% (aOR, 0.75).
The analysis involved the results of 9,422 tests received by 7,306 children, all of whom lived in the area served by the FWS. The Environmental Protection Agency recently advised that it is safe for Flint residents to drink filtered tap water and that unfiltered tap water can be used for bathing and showering, the CDC report noted.
FROM MMWR

Number of US Zika Cases in Pregnant Women up to 537
During the week ending June 23, 2016, there were three infants born with birth defects and one pregnancy loss among U.S. women who had been infected with Zika virus, according to the Centers for Disease Control and Prevention.
The pregnancy-outcomes data, which were posted June 30, show that a total of seven infants have been born in the United States with Zika-related birth defects and that there have been five pregnancy losses with probable Zika-related birth defects, the CDC reported.

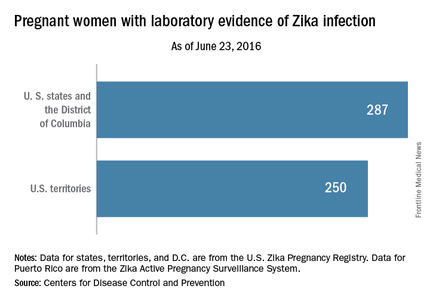
For that same week, there were reports of an additional 22 pregnant women with Zika virus infection in the 50 states and the District of Columbia, bringing the total to 287. Among U.S. territories – American Samoa, Guam, Northern Marianas, Puerto Rico, and the U.S. Virgin Islands – 34 more pregnant women were reported, bringing the territorial number up to 250 and giving the country a total of 537 cases, the CDC said. The CDC is not reporting state- or territorial-level data to protect the privacy of affected women and children.
The figures for states, territories, and the District of Columbia reflect reporting to the U.S. Zika Pregnancy Registry; data for Puerto Rico are reported to the U.S. Zika Active Pregnancy Surveillance System. These are not real-time data and reflect only pregnancy outcomes for women with any laboratory evidence of possible Zika virus infection, although it is not known if Zika virus was the cause of the poor outcomes.
Zika-related birth defects recorded by the CDC could include microcephaly, calcium deposits in the brain indicating possible brain damage, excess fluid in the brain cavities and surrounding the brain, absent or poorly formed brain structures, abnormal eye development, or other problems resulting from brain damage that affect nerves, muscles, and bones. The pregnancy losses encompass any miscarriage, stillbirth, and termination with evidence of birth defects.
During the week ending June 23, 2016, there were three infants born with birth defects and one pregnancy loss among U.S. women who had been infected with Zika virus, according to the Centers for Disease Control and Prevention.
The pregnancy-outcomes data, which were posted June 30, show that a total of seven infants have been born in the United States with Zika-related birth defects and that there have been five pregnancy losses with probable Zika-related birth defects, the CDC reported.
For that same week, there were reports of an additional 22 pregnant women with Zika virus infection in the 50 states and the District of Columbia, bringing the total to 287. Among U.S. territories – American Samoa, Guam, Northern Marianas, Puerto Rico, and the U.S. Virgin Islands – 34 more pregnant women were reported, bringing the territorial number up to 250 and giving the country a total of 537 cases, the CDC said. The CDC is not reporting state- or territorial-level data to protect the privacy of affected women and children.
The figures for states, territories, and the District of Columbia reflect reporting to the U.S. Zika Pregnancy Registry; data for Puerto Rico are reported to the U.S. Zika Active Pregnancy Surveillance System. These are not real-time data and reflect only pregnancy outcomes for women with any laboratory evidence of possible Zika virus infection, although it is not known if Zika virus was the cause of the poor outcomes.
Zika-related birth defects recorded by the CDC could include microcephaly, calcium deposits in the brain indicating possible brain damage, excess fluid in the brain cavities and surrounding the brain, absent or poorly formed brain structures, abnormal eye development, or other problems resulting from brain damage that affect nerves, muscles, and bones. The pregnancy losses encompass any miscarriage, stillbirth, and termination with evidence of birth defects.

Number of U.S. Zika cases in pregnant women up to 537
During the week ending June 23, 2016, there were three infants born with birth defects and one pregnancy loss among U.S. women who had been infected with Zika virus, according to the Centers for Disease Control and Prevention.
The pregnancy-outcomes data, which were posted June 30, show that a total of seven infants have been born in the United States with Zika-related birth defects and that there have been five pregnancy losses with probable Zika-related birth defects, the CDC reported.
For that same week, there were reports of an additional 22 pregnant women with Zika virus infection in the 50 states and the District of Columbia, bringing the total to 287. Among U.S. territories – American Samoa, Guam, Northern Marianas, Puerto Rico, and the U.S. Virgin Islands – 34 more pregnant women were reported, bringing the territorial number up to 250 and giving the country a total of 537 cases, the CDC said. The CDC is not reporting state- or territorial-level data to protect the privacy of affected women and children.
The figures for states, territories, and the District of Columbia reflect reporting to the U.S. Zika Pregnancy Registry; data for Puerto Rico are reported to the U.S. Zika Active Pregnancy Surveillance System. These are not real-time data and reflect only pregnancy outcomes for women with any laboratory evidence of possible Zika virus infection, although it is not known if Zika virus was the cause of the poor outcomes.
Zika-related birth defects recorded by the CDC could include microcephaly, calcium deposits in the brain indicating possible brain damage, excess fluid in the brain cavities and surrounding the brain, absent or poorly formed brain structures, abnormal eye development, or other problems resulting from brain damage that affect nerves, muscles, and bones. The pregnancy losses encompass any miscarriage, stillbirth, and termination with evidence of birth defects.

Invasive cardiologists each generate $2.45 million for hospitals
Both invasive and noninvasive cardiologists increased the revenue generated for their affiliated hospitals from 2012 to 2015, but the gap between the two continued to widen, physician recruitment firm Merritt Hawkins reported.
The net annual revenue generated by invasive cardiologists rose from $2.17 million in 2012 to $2.45 million in 2015, or 12.8%, while noninvasive cardiologists had a more modest 2.3% increase as revenue went from $1.23 million to $1.26 million, according to Merritt Hawkins’ most recent survey of hospital chief financial officers.
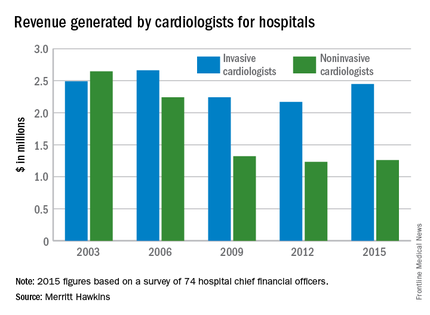
The noninvasive cardiologists produced more revenue for hospitals in 2003 – the first year that cardiologists were included in the survey – but the positions were switched by the next survey in 2006 and the gap has widened from $420,000 that year to almost $1.2 million in 2015.
Net revenue generated by physicians in all 18 specialties measured averaged almost $1.6 million in 2015, up 7.7% over the $1.5 million generated in 2012. Average revenue for specialists was up 12.8%, going from $1.4 million in 2012 to $1.6 million in 2015. Among the 18 specialties, invasive cardiologists’ revenue in 2015 was second behind orthopedic surgeons, who brought in almost $2.75 million each for their hospitals.
The survey was completed by 74 hospital chief financial officers, but despite the small number Merritt Hawkins said that the “results are reliable and accurate, in large part because the overall number for average annual revenue generated by all physician specialties for their affiliated hospitals has remained virtually unchanged” over the course of five surveys spanning 12 years.
Both invasive and noninvasive cardiologists increased the revenue generated for their affiliated hospitals from 2012 to 2015, but the gap between the two continued to widen, physician recruitment firm Merritt Hawkins reported.
The net annual revenue generated by invasive cardiologists rose from $2.17 million in 2012 to $2.45 million in 2015, or 12.8%, while noninvasive cardiologists had a more modest 2.3% increase as revenue went from $1.23 million to $1.26 million, according to Merritt Hawkins’ most recent survey of hospital chief financial officers.
The noninvasive cardiologists produced more revenue for hospitals in 2003 – the first year that cardiologists were included in the survey – but the positions were switched by the next survey in 2006 and the gap has widened from $420,000 that year to almost $1.2 million in 2015.
Net revenue generated by physicians in all 18 specialties measured averaged almost $1.6 million in 2015, up 7.7% over the $1.5 million generated in 2012. Average revenue for specialists was up 12.8%, going from $1.4 million in 2012 to $1.6 million in 2015. Among the 18 specialties, invasive cardiologists’ revenue in 2015 was second behind orthopedic surgeons, who brought in almost $2.75 million each for their hospitals.
The survey was completed by 74 hospital chief financial officers, but despite the small number Merritt Hawkins said that the “results are reliable and accurate, in large part because the overall number for average annual revenue generated by all physician specialties for their affiliated hospitals has remained virtually unchanged” over the course of five surveys spanning 12 years.

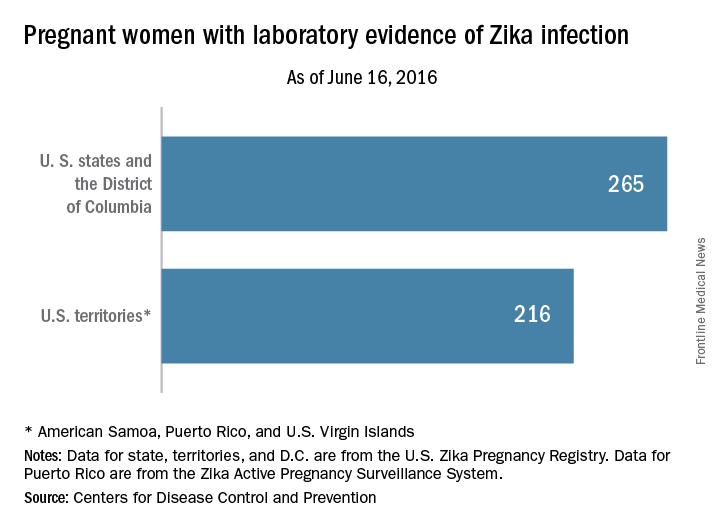
Cases of Zika among pregnant women in U.S. states rise to 265
There was one infant born with birth defects and two pregnancy losses as a result of likely maternal Zika virus infection among U.S. women during the week ending June 16, 2016, according to figures released by the Centers for Disease Control and Prevention.
That brings the Zika-related totals to four infants born with birth defects and five pregnancy losses in the United States, with one of the most recent pregnancy losses occurring in a U.S. territory or Puerto Rico, the CDC reported. The CDC is not reporting state- or territorial-level data to protect the privacy of affected women and children.
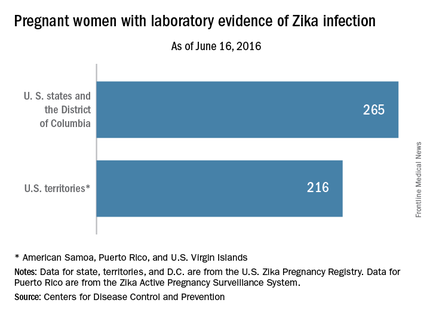
The CDC also said that it has received reports of 265 pregnant women in U.S. states and the District of Columbia and 216 pregnant women in U.S. territories and Puerto Rico who had any laboratory evidence of possible Zika virus infection. This includes women “in whom viral particles have been detected and those with evidence of an immune reaction to a recent virus that is likely to be Zika,” the CDC noted.
The figures for states, territories, and the District of Columbia reflect reporting to the U.S. Zika Pregnancy Registry; data for Puerto Rico are reported to the U.S. Zika Active Pregnancy Surveillance System. These are not real-time data and reflect only pregnancy outcomes for women with any laboratory evidence of possible Zika virus infection, although it is not known if Zika virus was the cause of the poor outcomes. The numbers also do not reflect outcomes among ongoing pregnancies.
Zika-related birth defects recorded by the CDC could include microcephaly, calcium deposits in the brain indicating possible brain damage, excess fluid in the brain cavities and surrounding the brain, absent or poorly formed brain structures, abnormal eye development, or other problems resulting from brain damage that affect nerves, muscles, and bones. The pregnancy losses encompass any miscarriage, stillbirth, and termination with evidence of birth defects.
CDC officials plan to update the pregnancy outcome data every Thursday at www.cdc.gov/zika/geo/pregnancy-outcomes.html.
There was one infant born with birth defects and two pregnancy losses as a result of likely maternal Zika virus infection among U.S. women during the week ending June 16, 2016, according to figures released by the Centers for Disease Control and Prevention.
That brings the Zika-related totals to four infants born with birth defects and five pregnancy losses in the United States, with one of the most recent pregnancy losses occurring in a U.S. territory or Puerto Rico, the CDC reported. The CDC is not reporting state- or territorial-level data to protect the privacy of affected women and children.
The CDC also said that it has received reports of 265 pregnant women in U.S. states and the District of Columbia and 216 pregnant women in U.S. territories and Puerto Rico who had any laboratory evidence of possible Zika virus infection. This includes women “in whom viral particles have been detected and those with evidence of an immune reaction to a recent virus that is likely to be Zika,” the CDC noted.
The figures for states, territories, and the District of Columbia reflect reporting to the U.S. Zika Pregnancy Registry; data for Puerto Rico are reported to the U.S. Zika Active Pregnancy Surveillance System. These are not real-time data and reflect only pregnancy outcomes for women with any laboratory evidence of possible Zika virus infection, although it is not known if Zika virus was the cause of the poor outcomes. The numbers also do not reflect outcomes among ongoing pregnancies.
Zika-related birth defects recorded by the CDC could include microcephaly, calcium deposits in the brain indicating possible brain damage, excess fluid in the brain cavities and surrounding the brain, absent or poorly formed brain structures, abnormal eye development, or other problems resulting from brain damage that affect nerves, muscles, and bones. The pregnancy losses encompass any miscarriage, stillbirth, and termination with evidence of birth defects.
CDC officials plan to update the pregnancy outcome data every Thursday at www.cdc.gov/zika/geo/pregnancy-outcomes.html.
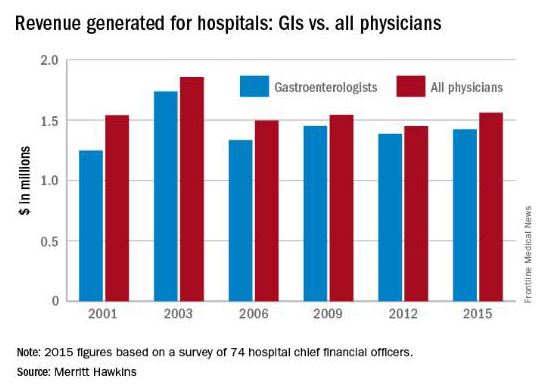
Gastroenterologists’ hospital revenue up slightly since 2012
Gastroenterologists generated slightly more revenue for hospitals in 2015 than in 2012, but they remained below the average for all physicians, according to a survey by physician recruitment firm Merritt Hawkins.
In 2015, gastroenterologists generated over $1.42 million in net revenue for their affiliated hospitals, compared with $1.39 million in 2012 – an increase of 2.7%. Meanwhile, hospital revenue generated by all physicians increased 7.7% – going from $1.45 million to $1.56 million, according to the survey of hospital chief financial officers.

Average revenue for specialists, by comparison, was up 12.8%, going from $1.4 million in 2012 to $1.6 million in 2015. For primary care physicians, the 2015 figure was $1.4 million, compared with $1.56 million in 2012 – a drop of 10.5%, Merritt Hawkins reported.
The survey was completed by 74 hospital chief financial officers, but despite the small number, Merritt Hawkins said that the results are “reliable and accurate, in large part because the overall number for average annual revenue generated by all physician specialties for their affiliated hospitals has remained virtually unchanged” over the course of six surveys spanning 14 years.
Gastroenterologists generated slightly more revenue for hospitals in 2015 than in 2012, but they remained below the average for all physicians, according to a survey by physician recruitment firm Merritt Hawkins.
In 2015, gastroenterologists generated over $1.42 million in net revenue for their affiliated hospitals, compared with $1.39 million in 2012 – an increase of 2.7%. Meanwhile, hospital revenue generated by all physicians increased 7.7% – going from $1.45 million to $1.56 million, according to the survey of hospital chief financial officers.
Average revenue for specialists, by comparison, was up 12.8%, going from $1.4 million in 2012 to $1.6 million in 2015. For primary care physicians, the 2015 figure was $1.4 million, compared with $1.56 million in 2012 – a drop of 10.5%, Merritt Hawkins reported.
The survey was completed by 74 hospital chief financial officers, but despite the small number, Merritt Hawkins said that the results are “reliable and accurate, in large part because the overall number for average annual revenue generated by all physician specialties for their affiliated hospitals has remained virtually unchanged” over the course of six surveys spanning 14 years.
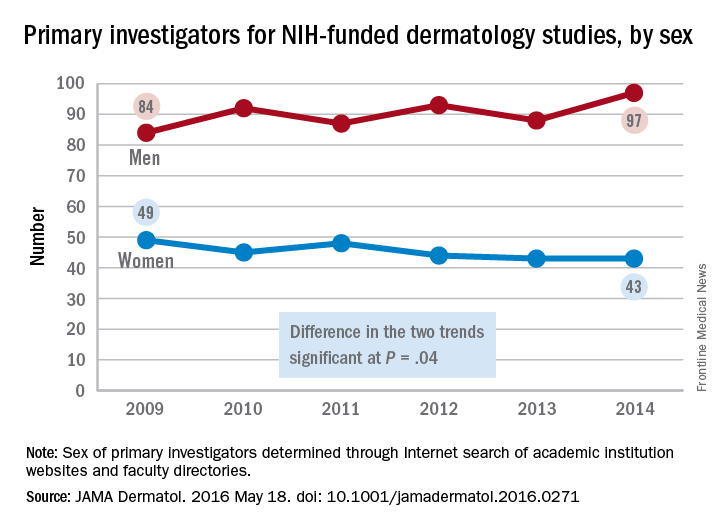
NIH Funding Fewer Women Doing Dermatology Research
The number of women receiving awards for dermatology research from the National Institutes of Health declined significantly from 2009 to 2014, while the number of men getting such funding increased, according to a retrospective analysis published in JAMA Dermatology.

The number of female primary investigators for dermatology studies funded by the NIH dropped from 49 in 2009 to 43 in 2014. Over the same period, the number of men leading NIH-funded dermatology studies rose from 84 to 97, with the difference between the two trends showing statistical significance (P = .04), Dr. Michelle Y. Cheng and her associates reported (JAMA Dermatol. 2016 May 18. doi: 10.1001/jamadermatol.2016.0271).
The most likely cause for “women’s less prominent role in the NIH funding arena” is lack of support from academic institutions, said Dr. Cheng of the University of California, Davis, and her associates. Since such awards have an important a role in career advancement, “if women in dermatology continue to lose their NIH-funded research, the current gender gap in leadership in academic dermatology is not likely to improve,” they added.
To conduct the analysis, the investigators determined the sexes of the primary investigators for all 1,292 dermatology studies funded by the NIH from 2009 to 2014, using institutions’ websites and faculty directories to obtain photographic evidence or identification through online biographies.
The number of women receiving awards for dermatology research from the National Institutes of Health declined significantly from 2009 to 2014, while the number of men getting such funding increased, according to a retrospective analysis published in JAMA Dermatology.
The number of female primary investigators for dermatology studies funded by the NIH dropped from 49 in 2009 to 43 in 2014. Over the same period, the number of men leading NIH-funded dermatology studies rose from 84 to 97, with the difference between the two trends showing statistical significance (P = .04), Dr. Michelle Y. Cheng and her associates reported (JAMA Dermatol. 2016 May 18. doi: 10.1001/jamadermatol.2016.0271).
The most likely cause for “women’s less prominent role in the NIH funding arena” is lack of support from academic institutions, said Dr. Cheng of the University of California, Davis, and her associates. Since such awards have an important a role in career advancement, “if women in dermatology continue to lose their NIH-funded research, the current gender gap in leadership in academic dermatology is not likely to improve,” they added.
To conduct the analysis, the investigators determined the sexes of the primary investigators for all 1,292 dermatology studies funded by the NIH from 2009 to 2014, using institutions’ websites and faculty directories to obtain photographic evidence or identification through online biographies.
FROM JAMA DERMATOLOGY

NIH funding fewer women doing dermatology research
The number of women receiving awards for dermatology research from the National Institutes of Health declined significantly from 2009 to 2014, while the number of men getting such funding increased, according to a retrospective analysis published in JAMA Dermatology.

The number of female primary investigators for dermatology studies funded by the NIH dropped from 49 in 2009 to 43 in 2014. Over the same period, the number of men leading NIH-funded dermatology studies rose from 84 to 97, with the difference between the two trends showing statistical significance (P = .04), Dr. Michelle Y. Cheng and her associates reported (JAMA Dermatol. 2016 May 18. doi: 10.1001/jamadermatol.2016.0271).
The most likely cause for “women’s less prominent role in the NIH funding arena” is lack of support from academic institutions, said Dr. Cheng of the University of California, Davis, and her associates. Since such awards have an important a role in career advancement, “if women in dermatology continue to lose their NIH-funded research, the current gender gap in leadership in academic dermatology is not likely to improve,” they added.
To conduct the analysis, the investigators determined the sexes of the primary investigators for all 1,292 dermatology studies funded by the NIH from 2009 to 2014, using institutions’ websites and faculty directories to obtain photographic evidence or identification through online biographies.
The number of women receiving awards for dermatology research from the National Institutes of Health declined significantly from 2009 to 2014, while the number of men getting such funding increased, according to a retrospective analysis published in JAMA Dermatology.
The number of female primary investigators for dermatology studies funded by the NIH dropped from 49 in 2009 to 43 in 2014. Over the same period, the number of men leading NIH-funded dermatology studies rose from 84 to 97, with the difference between the two trends showing statistical significance (P = .04), Dr. Michelle Y. Cheng and her associates reported (JAMA Dermatol. 2016 May 18. doi: 10.1001/jamadermatol.2016.0271).
The most likely cause for “women’s less prominent role in the NIH funding arena” is lack of support from academic institutions, said Dr. Cheng of the University of California, Davis, and her associates. Since such awards have an important a role in career advancement, “if women in dermatology continue to lose their NIH-funded research, the current gender gap in leadership in academic dermatology is not likely to improve,” they added.
To conduct the analysis, the investigators determined the sexes of the primary investigators for all 1,292 dermatology studies funded by the NIH from 2009 to 2014, using institutions’ websites and faculty directories to obtain photographic evidence or identification through online biographies.
FROM JAMA DERMATOLOGY
Increased demand drives up psychiatrists’ starting salaries
The average starting salary for psychiatrists was up 11% over the last year, with growing physician shortages leading to increased demand, according to physician recruitment firm Merritt Hawkins.
The average starting salary was $250,000 among psychiatrists recruited by the company in the 12 months from April 1, 2015 to March 31, 2016, compared with $226,000 the previous year. Of the 3,342 recruiting searches conducted in that year, 250 involved psychiatry, second highest behind family medicine among the 19 medical specialties tracked in the company’s 2016 Review of Physician and Advanced Practitioner Recruiting Incentives.
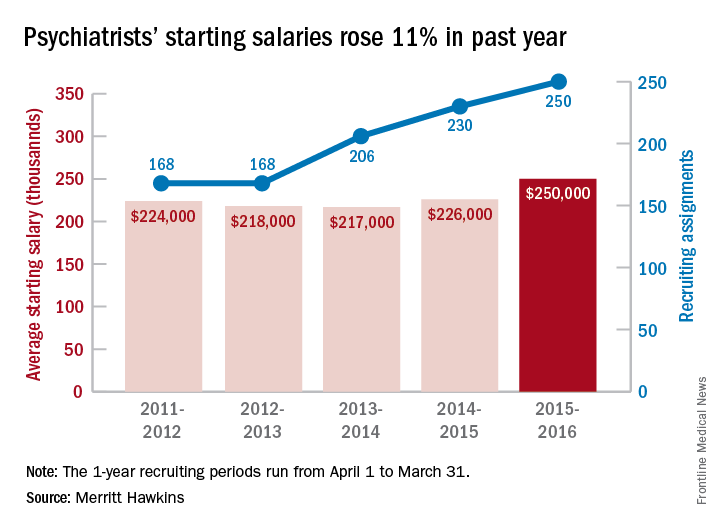
This is the first time in the 23 years of the review that psychiatry has been as high as second on the list of most requested recruiting assignments, although it was third last year and fourth the year before. “This is a clear reflection of the focus health care providers are putting on addressing mental health challenges in the United States,” the report noted.
Starting salaries were up for 18 of the 19 specialties, with only emergency medicine showing a decease. “Demand for physicians is as intense as we have seen it in our 29-year history,” Travis Singleton, senior vice president of Merritt Hawkins, said in a separate statement. “The expansion of health insurance coverage, population growth, population aging, expanded care sites such as urgent care centers, and other factors are driving demand for doctors through the roof, and salaries are spiking as a consequence.”
The average starting salary for psychiatrists was up 11% over the last year, with growing physician shortages leading to increased demand, according to physician recruitment firm Merritt Hawkins.
The average starting salary was $250,000 among psychiatrists recruited by the company in the 12 months from April 1, 2015 to March 31, 2016, compared with $226,000 the previous year. Of the 3,342 recruiting searches conducted in that year, 250 involved psychiatry, second highest behind family medicine among the 19 medical specialties tracked in the company’s 2016 Review of Physician and Advanced Practitioner Recruiting Incentives.
This is the first time in the 23 years of the review that psychiatry has been as high as second on the list of most requested recruiting assignments, although it was third last year and fourth the year before. “This is a clear reflection of the focus health care providers are putting on addressing mental health challenges in the United States,” the report noted.
Starting salaries were up for 18 of the 19 specialties, with only emergency medicine showing a decease. “Demand for physicians is as intense as we have seen it in our 29-year history,” Travis Singleton, senior vice president of Merritt Hawkins, said in a separate statement. “The expansion of health insurance coverage, population growth, population aging, expanded care sites such as urgent care centers, and other factors are driving demand for doctors through the roof, and salaries are spiking as a consequence.”
