User login
Richard Franki is the associate editor who writes and creates graphs. He started with the company in 1987, when it was known as the International Medical News Group. In his years as a journalist, Richard has worked for Cap Cities/ABC, Disney, Harcourt, Elsevier, Quadrant, Frontline, and Internet Brands. In the 1990s, he was a contributor to the ill-fated Indications column, predecessor of Livin' on the MDedge.
Hemophilia drugs top Medicaid spending per prescription
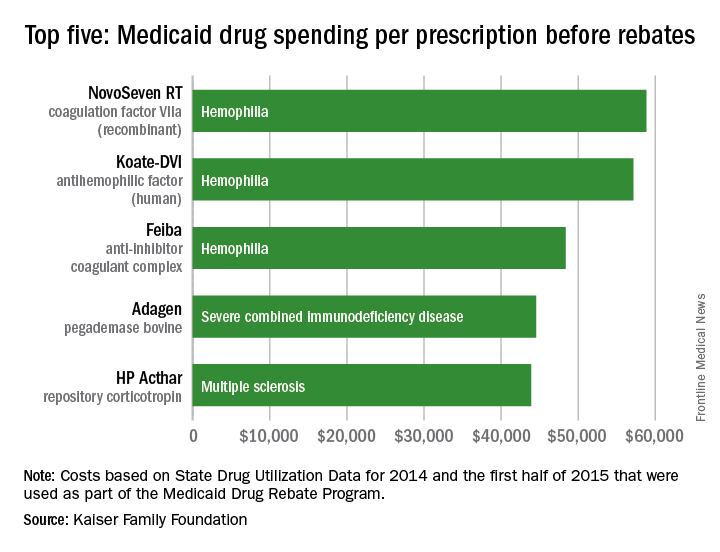
Medicaid’s three most expensive drugs by spending per prescription were for treatment of hemophilia, with the cost leader coming in at almost $59,000, according to an analysis by the Kaiser Family Foundation covering 2014 and the first half of 2015.
The trio of hemophilia drugs was topped by NovoSeven RT (coagulation factor VIIa [recombinant]), with Koate-DVI (antihemophilic factor [human]) second at $57,000 per prescription and Feiba (anti-inhibitor coagulant complex) third at $48,000 for each prescription.
None of the Medicaid costs include rebates since those data are unavailable to the public, Kaiser noted.
The fourth and fifth most expensive drugs were Adagen (pegademase bovine), which is used in the treatment of severe combined immunodeficiency disease associated with a deficiency of adenosine deaminase and cost Medicaid $45,000 per prescription, and the multiple sclerosis drug HP Acthar (repository corticotropin), which went for almost $44,000 a prescription, Kaiser said in its analysis, which used State Drug Utilization Data that are part of the Medicaid Drug Rebate Program.
CDC reports three new cases of Zika-related birth defects
Three new cases of infants born with Zika virus–related birth defects were reported in the United States for the week ending July 14, 2016, along with 129 new infections in pregnant women, according to the Centers for Disease Control and Prevention.
The three infants were born in the 50 states and the District of Columbia, with no new pregnancy losses reported in the states or U.S. territories. Totals for the year are 12 infants with birth defects, all in the states, and seven pregnancy losses, of which six occurred in the states, the CDC reported July 21. State- or territorial-level data are not being reported to protect the privacy of affected women and children.
Of the 129 new infections in pregnant women for the week, 54 occurred in the states and 75 occurred in the U.S. territories. Those new cases bring the U.S. total to 778 for the year: 400 in the states and 378 in territories, the CDC also reported on July 21.
The figures for states, territories, and the District of Columbia reflect reporting to the U.S. Zika Pregnancy Registry; data for Puerto Rico are reported to the U.S. Zika Active Pregnancy Surveillance System.
Zika-related birth defects recorded by the CDC could include microcephaly, calcium deposits in the brain indicating possible brain damage, excess fluid in the brain cavities and surrounding the brain, absent or poorly formed brain structures, abnormal eye development, or other problems resulting from brain damage that affect nerves, muscles, and bones. The pregnancy losses encompass any miscarriage, stillbirth, and termination with evidence of birth defects.

Cost of end-of-life care peaks at age 73 years
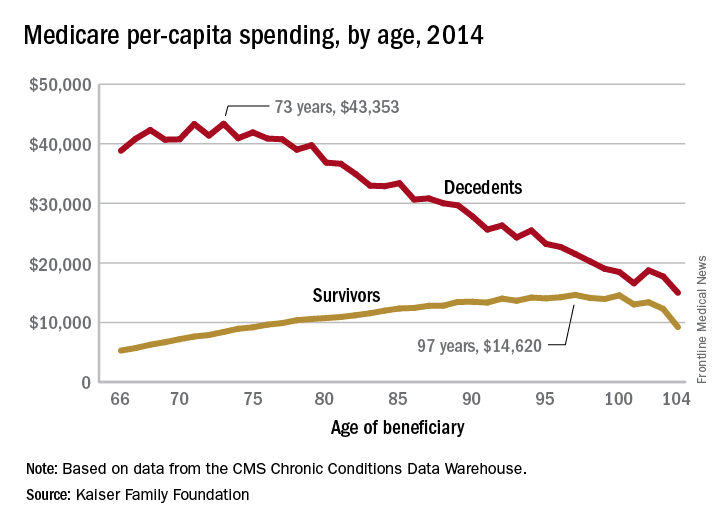
The cost of end-of-life care for Americans on traditional Medicare is higher for those in their early 70s than for beneficiaries in their 80s or 90s, according to the Kaiser Family Foundation.
In 2014, the per-capita cost of care peaked at $43,353 for those who died at age 73, compared with $36,841 who died at age 80 and $27,779 for 90-year-old decedents, Kaiser found in its analysis of claims data from the Centers for Medicare & Medicaid Services Chronic Conditions Data Warehouse.

“This is a pattern we weren’t really expecting to see,” Juliette Cubanski, associate director of the program on Medicare policy for Kaiser, said in an article on the findings distributed by Kaiser Health News. “It kind of goes against the notion that doctors are throwing everything including the kitchen sink at people at the end of life regardless of how old they are,” she added.
The trend was quite different, and much less costly, for those who lived through the entire year. Their per-capita cost of care started at $5,271 for 66-year-olds and peaked at $14,620 for those aged 97. Medicare per capita spending for all decedents was nearly four times higher, at $34,529, than the $9,121 spent for each beneficiary who survived the year, the Kaiser report showed.
The largest share of that difference came from inpatient hospital care, which was 51% of decedents’ per-capita cost but only 27% for survivors. The cost for each group: $17,574 for decedents and $2,497 for survivors, according to Kaiser, which pointed out that its analysis covered only traditional Medicare beneficiaries during the calendar year in which they died and did not include spending in the full 12 months before their deaths.
The gap between decedents and survivors has narrowed in recent years. The growth rate from 2000 – when spending was $19,130 – to 2014 was 4.3% a year for decedents, while spending for survivors rose 5.5% annually from its $4,322 starting level at the turn of the century, the report noted.
The cost of end-of-life care for Americans on traditional Medicare is higher for those in their early 70s than for beneficiaries in their 80s or 90s, according to the Kaiser Family Foundation.
In 2014, the per-capita cost of care peaked at $43,353 for those who died at age 73, compared with $36,841 who died at age 80 and $27,779 for 90-year-old decedents, Kaiser found in its analysis of claims data from the Centers for Medicare & Medicaid Services Chronic Conditions Data Warehouse.
“This is a pattern we weren’t really expecting to see,” Juliette Cubanski, associate director of the program on Medicare policy for Kaiser, said in an article on the findings distributed by Kaiser Health News. “It kind of goes against the notion that doctors are throwing everything including the kitchen sink at people at the end of life regardless of how old they are,” she added.
The trend was quite different, and much less costly, for those who lived through the entire year. Their per-capita cost of care started at $5,271 for 66-year-olds and peaked at $14,620 for those aged 97. Medicare per capita spending for all decedents was nearly four times higher, at $34,529, than the $9,121 spent for each beneficiary who survived the year, the Kaiser report showed.
The largest share of that difference came from inpatient hospital care, which was 51% of decedents’ per-capita cost but only 27% for survivors. The cost for each group: $17,574 for decedents and $2,497 for survivors, according to Kaiser, which pointed out that its analysis covered only traditional Medicare beneficiaries during the calendar year in which they died and did not include spending in the full 12 months before their deaths.
The gap between decedents and survivors has narrowed in recent years. The growth rate from 2000 – when spending was $19,130 – to 2014 was 4.3% a year for decedents, while spending for survivors rose 5.5% annually from its $4,322 starting level at the turn of the century, the report noted.
Number of U.S. Zika-related poor pregnancy outcomes rise to 16
One pregnancy loss with birth defects related to Zika virus was reported in the week ending July 7, 2016, along with two liveborn infants with Zika-related birth defects, according to the Centers for Disease Control and Prevention.
That brings the total number of Zika-related poor birth outcomes in the United States to seven pregnancy losses and nine liveborn infants with birth defects, the CDC reported July 14.

All three of the latest Zika-related poor outcomes occurred in the 50 states and the District of Columbia. Of the 16 total poor outcomes so far, 15 have occurred in the 50 states and D.C.; one pregnancy loss has been reported in the U.S. territories. State- or territorial-level data are not being reported to protect the privacy of affected women and children, the CDC said.
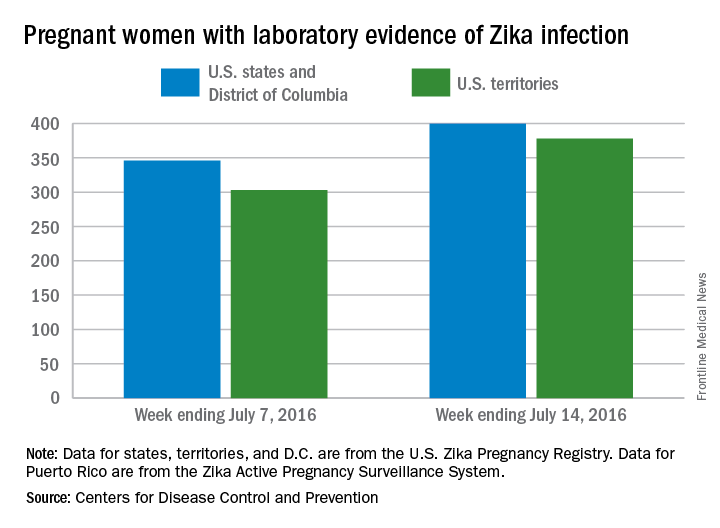
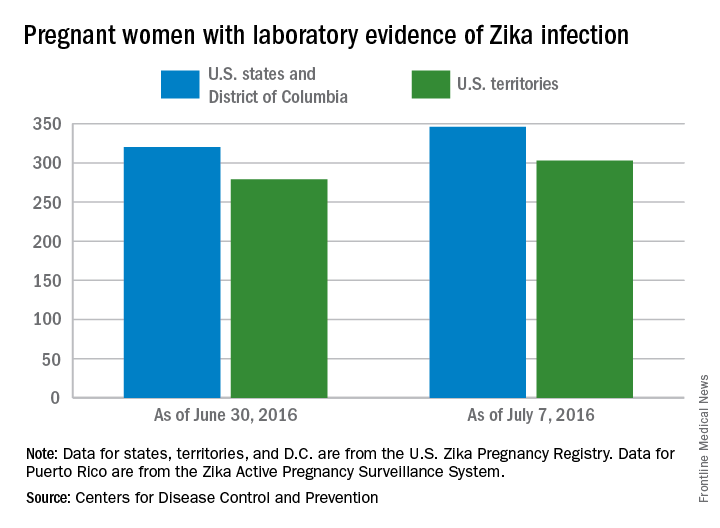
The CDC also reported that 346 pregnant women in the 50 states and D.C. and 303 women in U.S. territories have had laboratory evidence of Zika virus infection, for a total of 649 nationwide as of July 7.
The figures for states, territories, and the District of Columbia reflect reporting to the U.S. Zika Pregnancy Registry; data for Puerto Rico are reported to the U.S. Zika Active Pregnancy Surveillance System.
Zika-related birth defects recorded by the CDC could include microcephaly, calcium deposits in the brain indicating possible brain damage, excess fluid in the brain cavities and surrounding the brain, absent or poorly formed brain structures, abnormal eye development, or other problems resulting from brain damage that affect nerves, muscles, and bones. The pregnancy losses encompass any miscarriage, stillbirth, and termination with evidence of birth defects.
One pregnancy loss with birth defects related to Zika virus was reported in the week ending July 7, 2016, along with two liveborn infants with Zika-related birth defects, according to the Centers for Disease Control and Prevention.
That brings the total number of Zika-related poor birth outcomes in the United States to seven pregnancy losses and nine liveborn infants with birth defects, the CDC reported July 14.
All three of the latest Zika-related poor outcomes occurred in the 50 states and the District of Columbia. Of the 16 total poor outcomes so far, 15 have occurred in the 50 states and D.C.; one pregnancy loss has been reported in the U.S. territories. State- or territorial-level data are not being reported to protect the privacy of affected women and children, the CDC said.
The CDC also reported that 346 pregnant women in the 50 states and D.C. and 303 women in U.S. territories have had laboratory evidence of Zika virus infection, for a total of 649 nationwide as of July 7.
The figures for states, territories, and the District of Columbia reflect reporting to the U.S. Zika Pregnancy Registry; data for Puerto Rico are reported to the U.S. Zika Active Pregnancy Surveillance System.
Zika-related birth defects recorded by the CDC could include microcephaly, calcium deposits in the brain indicating possible brain damage, excess fluid in the brain cavities and surrounding the brain, absent or poorly formed brain structures, abnormal eye development, or other problems resulting from brain damage that affect nerves, muscles, and bones. The pregnancy losses encompass any miscarriage, stillbirth, and termination with evidence of birth defects.
40% of top-rated sunscreens fall short of AAD guidelines
Customer satisfaction ratings of sunscreens do not always reflect the products’ effectiveness, as 40% of the 65 top-rated sunscreens available on Amazon.com did not adhere to all three of the American Academy of Dermatology’s recommended criteria.
The AAD recommends the following for all sunscreens: sun protection factor (SPF) of 30 more, broad-spectrum protection, and water and/or sweat resistance. Of those criteria, water/sweat resistance was missing in 19 (29%), compared with SPF less than 30 in 7 (11%) products and lack of broad-spectrum protection in 4 (6%). Some products missed more than one criterion, said Shuai Xu, MD, of Northwestern University, Chicago, and his associates (JAMA Dermatolol. 2016 Jul 6. doi: 10.1001/jamadermatol.2016.2344).

Of the qualities besides performance that were analyzed, “cosmetic elegance,” which the investigators “defined as any feature associated with skin sensation on application, color, or scent,” was the positive feature most often mentioned in the customer reviews. On the other hand, they noted, “dermatologist recommendations were not a significantly cited positive feature.”
The sunscreens in the analysis represented the top 1 percentile by customer rating of the 6,500 products categorized as sunscreens on Amazon as of December 2015. The 65 products included in the study had more than 24,400 customer reviews and a median rating of 4.5 out of 5 stars, Dr. Xu and his associates said.
The investigators did not report any conflicts of interest.
Customer satisfaction ratings of sunscreens do not always reflect the products’ effectiveness, as 40% of the 65 top-rated sunscreens available on Amazon.com did not adhere to all three of the American Academy of Dermatology’s recommended criteria.
The AAD recommends the following for all sunscreens: sun protection factor (SPF) of 30 more, broad-spectrum protection, and water and/or sweat resistance. Of those criteria, water/sweat resistance was missing in 19 (29%), compared with SPF less than 30 in 7 (11%) products and lack of broad-spectrum protection in 4 (6%). Some products missed more than one criterion, said Shuai Xu, MD, of Northwestern University, Chicago, and his associates (JAMA Dermatolol. 2016 Jul 6. doi: 10.1001/jamadermatol.2016.2344).
Of the qualities besides performance that were analyzed, “cosmetic elegance,” which the investigators “defined as any feature associated with skin sensation on application, color, or scent,” was the positive feature most often mentioned in the customer reviews. On the other hand, they noted, “dermatologist recommendations were not a significantly cited positive feature.”
The sunscreens in the analysis represented the top 1 percentile by customer rating of the 6,500 products categorized as sunscreens on Amazon as of December 2015. The 65 products included in the study had more than 24,400 customer reviews and a median rating of 4.5 out of 5 stars, Dr. Xu and his associates said.
The investigators did not report any conflicts of interest.
FROM JAMA DERMATOLOGY

Medicaid expansion linked to lower uninsured rates
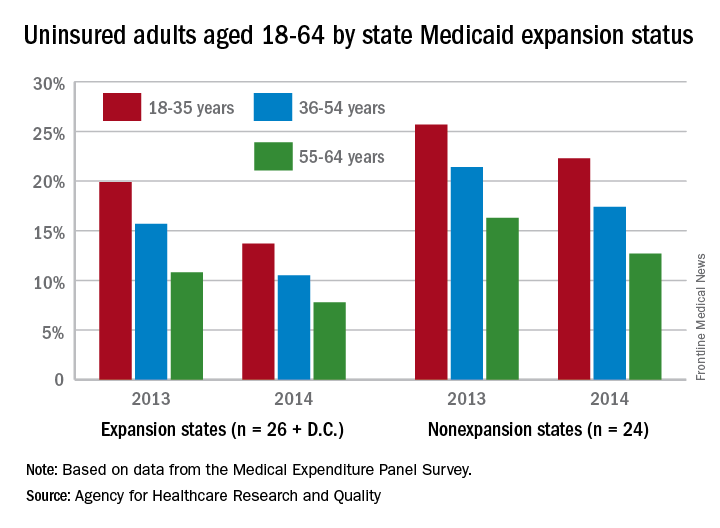
The overall uninsured rate for nonelderly adults took a significant drop from 18.8% in 2013 to 14.4% in 2014, with rates by age lower and declines generally larger among states that expanded Medicaid coverage, according to the Agency for Healthcare Research and Quality.
Among adults aged 18-35 years, states (and the District of Columbia) that expanded Medicaid had a larger drop in the percentage who were uninsured for the entire calendar year, going from 19.9% in 2013 to 13.7% in 2014 (6.2 percentage points), than did states that did not expand Medicaid, which dropped from 25.7% to 22.3% (3.4 percentage points), the AHRQ reported.
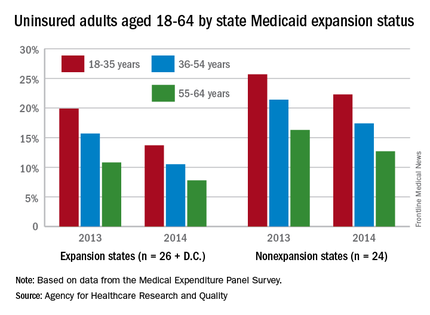
For adults aged 36-54 years, the situation was similar: The uninsured rate in states that expanded Medicaid went from 15.7% in 2013 to 10.5% in 2014, or 5.2 percentage points, while the rate dropped from 21.4% to 17.4%, or 4 percentage points, in states that did not expand Medicaid, the report noted.
Uninsured rates were lower among adults aged 56-64 in states that did expand Medicaid, but the absolute decrease was actually larger among states that did not expand it. The rate in nonexpanding states decreased by 3.6 percentage points, 16.3% to 12.7%, while expanding states saw a drop from 10.8% to 7.8%, 3 percentage points, according to data from the Medical Expenditure Panel Survey.
The overall uninsured rate for nonelderly adults took a significant drop from 18.8% in 2013 to 14.4% in 2014, with rates by age lower and declines generally larger among states that expanded Medicaid coverage, according to the Agency for Healthcare Research and Quality.
Among adults aged 18-35 years, states (and the District of Columbia) that expanded Medicaid had a larger drop in the percentage who were uninsured for the entire calendar year, going from 19.9% in 2013 to 13.7% in 2014 (6.2 percentage points), than did states that did not expand Medicaid, which dropped from 25.7% to 22.3% (3.4 percentage points), the AHRQ reported.
For adults aged 36-54 years, the situation was similar: The uninsured rate in states that expanded Medicaid went from 15.7% in 2013 to 10.5% in 2014, or 5.2 percentage points, while the rate dropped from 21.4% to 17.4%, or 4 percentage points, in states that did not expand Medicaid, the report noted.
Uninsured rates were lower among adults aged 56-64 in states that did expand Medicaid, but the absolute decrease was actually larger among states that did not expand it. The rate in nonexpanding states decreased by 3.6 percentage points, 16.3% to 12.7%, while expanding states saw a drop from 10.8% to 7.8%, 3 percentage points, according to data from the Medical Expenditure Panel Survey.
Continuing demand for internists drives up salaries
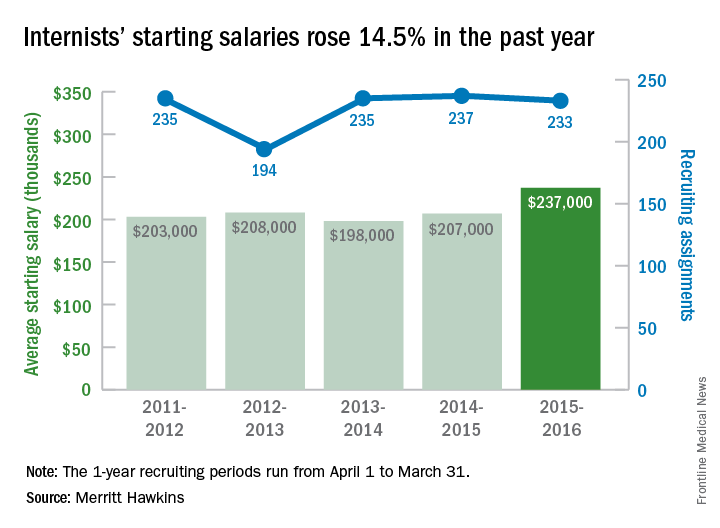
The average starting salary for general internists was up 14.5% in the last year, with growing physician shortages leading to increased demand, according to physician recruitment firm Merritt Hawkins.
The average starting salary was $237,000 among general internists recruited by the company in the 12 months from April 1, 2015, to March 31, 2016, compared with $207,000 the previous year. Of the 3,342 recruiting searches conducted in that year, 233 involved general internal medicine, third highest behind family medicine and psychiatry among the 19 medical specialties tracked in the company’s 2016 Review of Physician and Advanced Practitioner Recruiting Incentives.

Internal medicine had been second on the list of the most requested recruiting assignments for 9 consecutive years. The number of searches for 2015-2016 was down just slightly from the previous year, however, suggesting that the increased “focus health care providers are putting on addressing mental health challenges” does not represent a turn away from internal medicine, the report noted.
It is, possibly, “the migration of many general internists into hospitalist roles [that] has limited the supply of physicians willing to practice traditional internal medicine and increased salary offers to those who are willing to do so,” Merritt Hawkins said.
Starting salaries were up for 18 of the 19 specialties, with only emergency medicine showing a decease. “Demand for physicians is as intense as we have seen it in our 29-year history,” Travis Singleton, senior vice president of Merritt Hawkins, said in a separate statement. “The expansion of health insurance coverage, population growth, population aging, expanded care sites such as urgent care centers and other factors are driving demand for doctors through the roof, and salaries are spiking as a consequence.”
The average starting salary for general internists was up 14.5% in the last year, with growing physician shortages leading to increased demand, according to physician recruitment firm Merritt Hawkins.
The average starting salary was $237,000 among general internists recruited by the company in the 12 months from April 1, 2015, to March 31, 2016, compared with $207,000 the previous year. Of the 3,342 recruiting searches conducted in that year, 233 involved general internal medicine, third highest behind family medicine and psychiatry among the 19 medical specialties tracked in the company’s 2016 Review of Physician and Advanced Practitioner Recruiting Incentives.
Internal medicine had been second on the list of the most requested recruiting assignments for 9 consecutive years. The number of searches for 2015-2016 was down just slightly from the previous year, however, suggesting that the increased “focus health care providers are putting on addressing mental health challenges” does not represent a turn away from internal medicine, the report noted.
It is, possibly, “the migration of many general internists into hospitalist roles [that] has limited the supply of physicians willing to practice traditional internal medicine and increased salary offers to those who are willing to do so,” Merritt Hawkins said.
Starting salaries were up for 18 of the 19 specialties, with only emergency medicine showing a decease. “Demand for physicians is as intense as we have seen it in our 29-year history,” Travis Singleton, senior vice president of Merritt Hawkins, said in a separate statement. “The expansion of health insurance coverage, population growth, population aging, expanded care sites such as urgent care centers and other factors are driving demand for doctors through the roof, and salaries are spiking as a consequence.”
Retiring Baby Boomers leave fewer workers to pay for Medicare
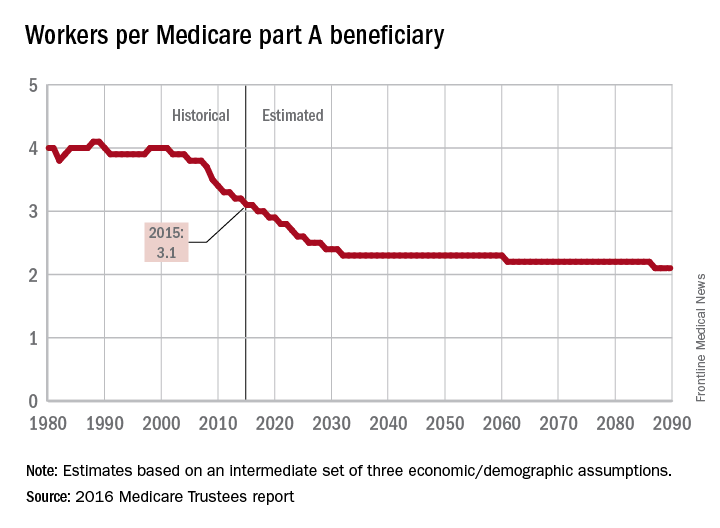
The influx of aging Baby Boomers into the ranks of the retired will reduce the ratio of workers available to pay for each Medicare part A beneficiary by 40% from 2000 to 2030, according to the 2016 report of the Medicare Trustees.
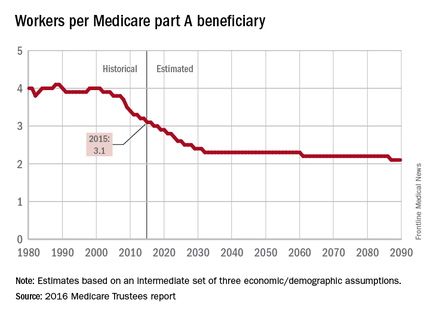
In 2015, there were 3.1 workers for each part A beneficiary, putting the United States in the middle of a projected drop from 4.0 workers per beneficiary in 2000 down to 2.4 in 2030. The Boomer-induced drop will largely be over by then, but the decline will continue until there are about 2.1 workers for each part A beneficiary by 2090, the report said.
“This reduction implies an increase in the [Medicare part A] cost rate of about 50% by 2090, relative to its current level, solely due to this demographic factor,” the trustees noted.
The projections are done using three sets – low-cost, intermediate, and high-cost – of economic and demographic assumptions. The figures presented here are from the intermediate assumption.
The influx of aging Baby Boomers into the ranks of the retired will reduce the ratio of workers available to pay for each Medicare part A beneficiary by 40% from 2000 to 2030, according to the 2016 report of the Medicare Trustees.
In 2015, there were 3.1 workers for each part A beneficiary, putting the United States in the middle of a projected drop from 4.0 workers per beneficiary in 2000 down to 2.4 in 2030. The Boomer-induced drop will largely be over by then, but the decline will continue until there are about 2.1 workers for each part A beneficiary by 2090, the report said.
“This reduction implies an increase in the [Medicare part A] cost rate of about 50% by 2090, relative to its current level, solely due to this demographic factor,” the trustees noted.
The projections are done using three sets – low-cost, intermediate, and high-cost – of economic and demographic assumptions. The figures presented here are from the intermediate assumption.
Number of U.S. Zika cases in pregnant women nears 600
There was one Zika-related pregnancy loss in the United States during the week ending June 30, 2016, bringing the total to six pregnancy losses and seven infants born with birth defects that may be related to maternal Zika virus infection, according to the Centers for Disease Control and Prevention.
The one pregnancy loss for the week occurred in 1 of the 50 states or the District of Columbia. Of the 13 adverse events so far, 12 occurred in the 50 states or D.C., and 1 occurred in a U.S. territory, the CDC reported on July 7. State- or territorial-level data are not being reported to protect the privacy of affected women and children.
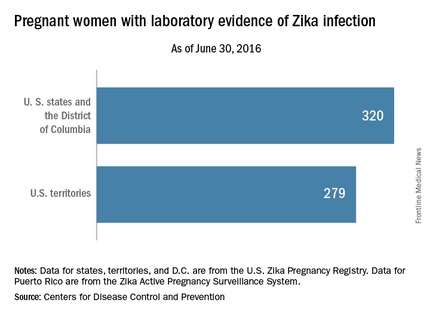
For the week ending June 30, there were 33 new reports of pregnant women with any laboratory evidence of Zika virus infection in the 50 states and D.C., for a total of 320 for the year. Among U.S. territories, including Puerto Rico, there were 29 new reports, bringing the total to 279 for the territories and 599 for the entire country, the CDC said.
The figures for states, territories, and the District of Columbia reflect reporting to the U.S. Zika Pregnancy Registry; data for Puerto Rico are reported to the U.S. Zika Active Pregnancy Surveillance System.
These are not real time data and reflect only pregnancy outcomes for women with any laboratory evidence of possible Zika virus infection, although it is not known if Zika virus was the cause of the poor outcomes.
Zika-related birth defects recorded by the CDC could include microcephaly, calcium deposits in the brain indicating possible brain damage, excess fluid in the brain cavities and surrounding the brain, absent or poorly formed brain structures, abnormal eye development, or other problems resulting from brain damage that affect nerves, muscles, and bones. The pregnancy losses encompass any miscarriage, stillbirth, and termination with evidence of birth defects.
There was one Zika-related pregnancy loss in the United States during the week ending June 30, 2016, bringing the total to six pregnancy losses and seven infants born with birth defects that may be related to maternal Zika virus infection, according to the Centers for Disease Control and Prevention.
The one pregnancy loss for the week occurred in 1 of the 50 states or the District of Columbia. Of the 13 adverse events so far, 12 occurred in the 50 states or D.C., and 1 occurred in a U.S. territory, the CDC reported on July 7. State- or territorial-level data are not being reported to protect the privacy of affected women and children.
For the week ending June 30, there were 33 new reports of pregnant women with any laboratory evidence of Zika virus infection in the 50 states and D.C., for a total of 320 for the year. Among U.S. territories, including Puerto Rico, there were 29 new reports, bringing the total to 279 for the territories and 599 for the entire country, the CDC said.
The figures for states, territories, and the District of Columbia reflect reporting to the U.S. Zika Pregnancy Registry; data for Puerto Rico are reported to the U.S. Zika Active Pregnancy Surveillance System.
These are not real time data and reflect only pregnancy outcomes for women with any laboratory evidence of possible Zika virus infection, although it is not known if Zika virus was the cause of the poor outcomes.
Zika-related birth defects recorded by the CDC could include microcephaly, calcium deposits in the brain indicating possible brain damage, excess fluid in the brain cavities and surrounding the brain, absent or poorly formed brain structures, abnormal eye development, or other problems resulting from brain damage that affect nerves, muscles, and bones. The pregnancy losses encompass any miscarriage, stillbirth, and termination with evidence of birth defects.

Hospital costs higher for patients discharged to postacute care
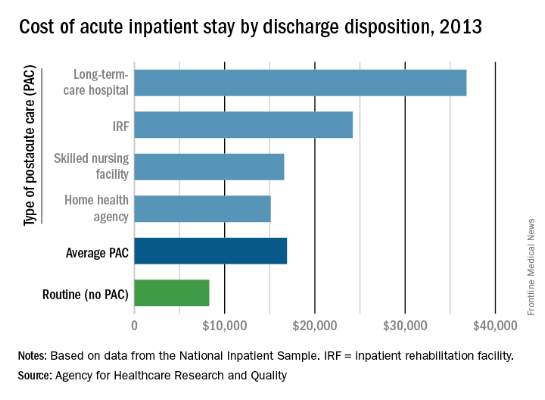
The average cost of U.S. hospital stays for injury or illness in patients discharged to postacute care is more than double that of visits with routine discharges, according to the Agency for Healthcare Research and Quality.
For patients who were discharged from hospitals to PAC, the average cost of an inpatient visit in 2013 was $16,900, compared with $8,300 for patients with routine discharges. The inpatient visits with PAC were almost twice as long as those with routine discharge – 7.0 days vs. 3.6 days – and patients with PAC-discharge visits were much older – 69.5% were aged 65 years or older, compared with 22.4% of visits with routine discharges, the AHRQ reported.

The AHRQ used data from the 2013 National Inpatient Sample (NIS) to estimates discharges to PAC for all types of payers and describe these discharges from the perspective of payers, patients, hospitals, conditions/procedures, and geographic regions.
The cost of stays varied considerably among the various PAC settings in 2013. Inpatient stays with discharge to home health agencies had the lowest average cost at $15,100, with skilled nursing facilities next at $16,600, followed by inpatient rehabilitation facilities at $24,200 and long-term-care hospitals at $36,800. Length of stays by PAC setting showed the same trend: those with discharge to home health agencies were shortest (6.2 days) and those with discharge to long-term-care hospitals were longest (13.5 days), the AHRQ said in the report.
Inpatient stays with discharge to PAC made up 22.3% of all hospital discharges in 2013, with the bulk being discharges to home health agencies (50.1%) and skilled nursing facilities (40.5%). Discharges to inpatient rehabilitation facilities made up 7.2% of all PAC visits, while those to long-term-care hospitals were just 2.2%, the data from the NIS show.
The average cost of U.S. hospital stays for injury or illness in patients discharged to postacute care is more than double that of visits with routine discharges, according to the Agency for Healthcare Research and Quality.
For patients who were discharged from hospitals to PAC, the average cost of an inpatient visit in 2013 was $16,900, compared with $8,300 for patients with routine discharges. The inpatient visits with PAC were almost twice as long as those with routine discharge – 7.0 days vs. 3.6 days – and patients with PAC-discharge visits were much older – 69.5% were aged 65 years or older, compared with 22.4% of visits with routine discharges, the AHRQ reported.
The AHRQ used data from the 2013 National Inpatient Sample (NIS) to estimates discharges to PAC for all types of payers and describe these discharges from the perspective of payers, patients, hospitals, conditions/procedures, and geographic regions.
The cost of stays varied considerably among the various PAC settings in 2013. Inpatient stays with discharge to home health agencies had the lowest average cost at $15,100, with skilled nursing facilities next at $16,600, followed by inpatient rehabilitation facilities at $24,200 and long-term-care hospitals at $36,800. Length of stays by PAC setting showed the same trend: those with discharge to home health agencies were shortest (6.2 days) and those with discharge to long-term-care hospitals were longest (13.5 days), the AHRQ said in the report.
Inpatient stays with discharge to PAC made up 22.3% of all hospital discharges in 2013, with the bulk being discharges to home health agencies (50.1%) and skilled nursing facilities (40.5%). Discharges to inpatient rehabilitation facilities made up 7.2% of all PAC visits, while those to long-term-care hospitals were just 2.2%, the data from the NIS show.