User login
Richard Franki is the associate editor who writes and creates graphs. He started with the company in 1987, when it was known as the International Medical News Group. In his years as a journalist, Richard has worked for Cap Cities/ABC, Disney, Harcourt, Elsevier, Quadrant, Frontline, and Internet Brands. In the 1990s, he was a contributor to the ill-fated Indications column, predecessor of Livin' on the MDedge.
New York declares end to 2018 measles outbreak
New York State has reported the end of all active measles cases related to the initial outbreak in 2018, but the state is now responding to new, unrelated cases in four counties, according to the Centers for Disease Control and Prevention.
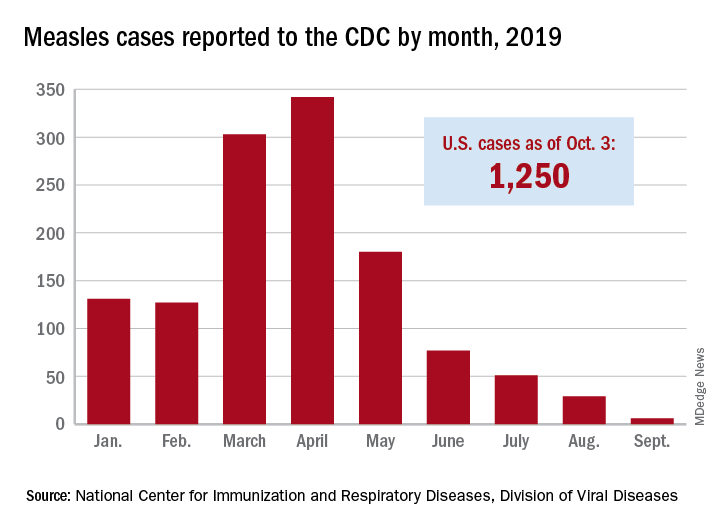
The new cases – two in Nassau County and one each in Monroe, Putnam, and Rockland counties – are “related to measles exposures from international travel but not affiliated with the 2018 outbreak,” the New York State Department of Health said in a written statement. Officials in Rockland County had declared its 2018 measles outbreak, which involved 312 cases in 2018 and 2019, over on Sept. 25.
. Of those cases, 1,163 (93%) were associated with 22 outbreaks, with the two largest occurring in New York City and Rockland County. “These two almost year-long outbreaks placed the United States at risk for losing measles elimination status,” the CDC said in a separate report, but “robust responses … ended transmission before the 1-year mark.”
New York State has reported the end of all active measles cases related to the initial outbreak in 2018, but the state is now responding to new, unrelated cases in four counties, according to the Centers for Disease Control and Prevention.
The new cases – two in Nassau County and one each in Monroe, Putnam, and Rockland counties – are “related to measles exposures from international travel but not affiliated with the 2018 outbreak,” the New York State Department of Health said in a written statement. Officials in Rockland County had declared its 2018 measles outbreak, which involved 312 cases in 2018 and 2019, over on Sept. 25.
. Of those cases, 1,163 (93%) were associated with 22 outbreaks, with the two largest occurring in New York City and Rockland County. “These two almost year-long outbreaks placed the United States at risk for losing measles elimination status,” the CDC said in a separate report, but “robust responses … ended transmission before the 1-year mark.”
Twin births down among women 30 and older
according to the National Center for Health Statistics.
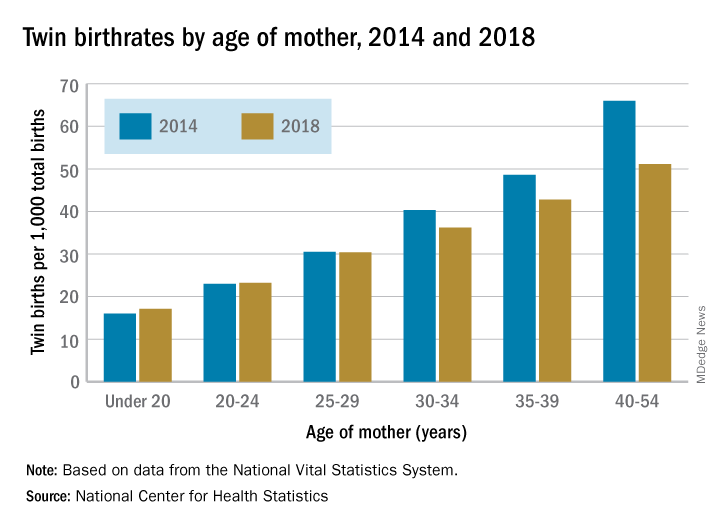
The twin birthrate, which had increased by 79% during 1980-2014, fell by 4% during 2014-2018, but that decline was “not universal across maternal age and race and Hispanic-origin groups,” the NCHS investigators said.
Twin birthrates fell by at least 10% for mothers aged 30 years and older from 2014 to 2018 but held steady for women in their twenties. Over that same period, the twin birthrate fell by a significant 7% among non-Hispanic white women (36.7 to 34.3 per 1,000 total births) but increased just slightly for non-Hispanic black women (40.0 to 40.5 per 1,000) and Hispanic women (24.1 to 24.4), the investigators reported.
For women 30 years and older, the drops in twin births got larger as age increased and were significant for each age group. The rate for women aged 30-34 years fell 10% as it went from 40.3 per 1,000 total births in 2014 to 36.2 per 1,000. The decrease was 12% (from 48.6 per 1,000 to 42.8) for women aged 35-39 and 23% (from 66.0 to 51.1) for those aged 40 years and older, they said based on data from the National Vital Statistics System.
The rates were basically unchanged for women in their 20s, from 23.0 to 23.2 in 20- to 24-year-olds and 30.5 to 30.4 in 25- to 29-year-olds – but there was a significant increase for the youngest group with rates among those younger than 20 years going from 16.0 to 17.1 per 1,000, the report showed.
according to the National Center for Health Statistics.
The twin birthrate, which had increased by 79% during 1980-2014, fell by 4% during 2014-2018, but that decline was “not universal across maternal age and race and Hispanic-origin groups,” the NCHS investigators said.
Twin birthrates fell by at least 10% for mothers aged 30 years and older from 2014 to 2018 but held steady for women in their twenties. Over that same period, the twin birthrate fell by a significant 7% among non-Hispanic white women (36.7 to 34.3 per 1,000 total births) but increased just slightly for non-Hispanic black women (40.0 to 40.5 per 1,000) and Hispanic women (24.1 to 24.4), the investigators reported.
For women 30 years and older, the drops in twin births got larger as age increased and were significant for each age group. The rate for women aged 30-34 years fell 10% as it went from 40.3 per 1,000 total births in 2014 to 36.2 per 1,000. The decrease was 12% (from 48.6 per 1,000 to 42.8) for women aged 35-39 and 23% (from 66.0 to 51.1) for those aged 40 years and older, they said based on data from the National Vital Statistics System.
The rates were basically unchanged for women in their 20s, from 23.0 to 23.2 in 20- to 24-year-olds and 30.5 to 30.4 in 25- to 29-year-olds – but there was a significant increase for the youngest group with rates among those younger than 20 years going from 16.0 to 17.1 per 1,000, the report showed.
Massachusetts tops state vaccination rankings
according to a new analysis from personal finance website WalletHub.
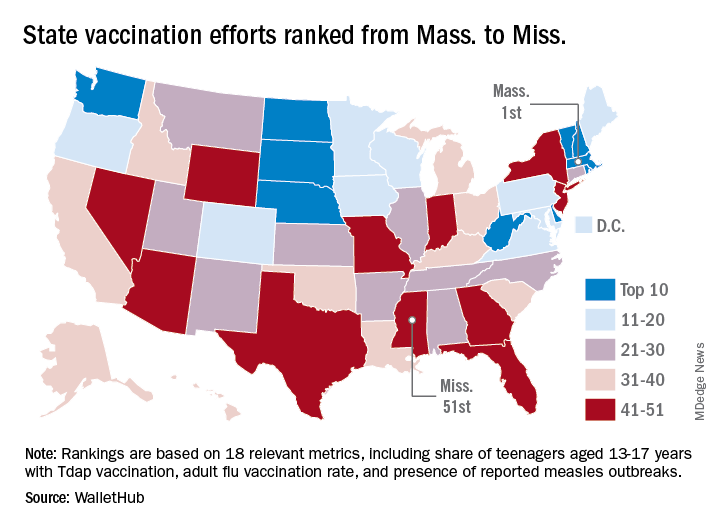
The Bay State’s top finish in the “children and teenagers immunization rates” category moved it ahead of Vermont in the overall rankings, which had the highest score in each of the other two broad categories – “adult and elderly vaccination rates” and “immunization uptake disparities and influencing factors” – but only finished 15th in child/teen immunization, Wallethub reported.
The state that ranked 51st in child/teen immunization – Mississippi – also finished 51st overall, behind every other state and Washington, D.C. The rest of the bottom five consisted of Texas (50th); Florida (49th), which ranked last in the adult/elderly category; Georgia (48th); and Indiana (47th). New Mexico, however, managed to show that last is not always least by earning a mid-pack overall rank of 30 despite its last-place showing in the disparities/influencing factors category, the WalletHub analysis showed.
Scores for the three broad categories were determined using 18 relevant metrics, including influenza vaccination rate in children aged 6 months to 17 years (1st, Rhode Island; 51st, Wyoming), share of adults aged 60 years and older with zoster vaccination (1st, Vermont; 51st, Mississippi), and share of population without health insurance coverage (1st, Massachusetts; 51st, Texas), WalletHub said.
“Each state should tailor its vaccines policy to its need, with an understanding that those needs may change,” Dorit Rubinstein Reiss of the University of California Hastings College of the Law, San Francisco, told WalletHub. When parents refuse to have their children vaccinated, it’s important to remember that “the state is not denying these children schooling. It is requiring that they be protected from disease first.”
according to a new analysis from personal finance website WalletHub.
The Bay State’s top finish in the “children and teenagers immunization rates” category moved it ahead of Vermont in the overall rankings, which had the highest score in each of the other two broad categories – “adult and elderly vaccination rates” and “immunization uptake disparities and influencing factors” – but only finished 15th in child/teen immunization, Wallethub reported.
The state that ranked 51st in child/teen immunization – Mississippi – also finished 51st overall, behind every other state and Washington, D.C. The rest of the bottom five consisted of Texas (50th); Florida (49th), which ranked last in the adult/elderly category; Georgia (48th); and Indiana (47th). New Mexico, however, managed to show that last is not always least by earning a mid-pack overall rank of 30 despite its last-place showing in the disparities/influencing factors category, the WalletHub analysis showed.
Scores for the three broad categories were determined using 18 relevant metrics, including influenza vaccination rate in children aged 6 months to 17 years (1st, Rhode Island; 51st, Wyoming), share of adults aged 60 years and older with zoster vaccination (1st, Vermont; 51st, Mississippi), and share of population without health insurance coverage (1st, Massachusetts; 51st, Texas), WalletHub said.
“Each state should tailor its vaccines policy to its need, with an understanding that those needs may change,” Dorit Rubinstein Reiss of the University of California Hastings College of the Law, San Francisco, told WalletHub. When parents refuse to have their children vaccinated, it’s important to remember that “the state is not denying these children schooling. It is requiring that they be protected from disease first.”
Neanderthal otitis media and why you can’t chillax
Dude, just chill out and relax ... or not

It’s been a tough week. You’ve struggled to get all your work done on time, you’ve had to put in long hours, you’re exhausted and stressed out, and you know that next week will be just as tough. But for now, it’s the weekend. Time to relax, right?
According to research from Penn State University published in the Journal of Affective Disorders, if you have anxiety disorder, not only will you have difficulty relaxing (hence the anxiety disorder), you may actually actively resist it, experiencing something called “relaxation-induced anxiety.”
The researchers recruited a group of students, some with anxiety disorder, some with major depressive disorder, and a control group, and administered a series of relaxation exercises both before and after watching a series of potentially upsetting videos. The people with anxiety disorders were more likely to experience spikes of negative emotion after the second relaxation exercise than the other two groups; these spikes were linked to a feeling of anxiety during relaxation exercise.
The researchers theorized that people with anxiety disorder were attempting to avoid large jumps in their stress level by remaining stressed at all times. But the investigators also noted that experiencing a range of emotions is natural and far healthier.
So, as annoying as it is to suffer through constant “stop worrying, just live in the moment” speeches from that one dudebro acquaintance who spends all his free time partying, he does have a point. We don’t recommend participating in the Edward Fortyhands game, though. Leave that to your “friend.” He’s used to it.
A salty surgeon general’s warning

Grab a pack of Marlboro Reds at the corner convenience store, and you’ll find the iconic red and white box adorned with dire warnings from the surgeon general.
Grab a salt shaker at the corner diner, and you’ll find ... salt. In a shaker. Perhaps adorned with the red residue from a prior diner’s ketchup addiction.
The World Hypertension League would like to make that salt shaker look a lot more like those Marlboros.
In a position statement in the Journal of Clinical Hypertension, the league outlined the case for giving sodium chloride the cancer-stick treatment. Exhibit A: “Unhealthy diets are a leading cause of death globally, and excess salt consumption is the biggest culprit, estimated to cause over 3 million deaths globally in 2017.”
Despite that tobacco-rivaling body count, the league says no country has demanded that salt containers wear warning labels.
But isn’t it enough to list sodium levels on food labels? Well, when’s the last time you studied the salty facts before binging on that entire party-size bag of Cheetos, Chester? (You’ll be hotboxing 4,500 mg of sodium, by the way.) The league rests its case.
What’s needed is a message that stops you mid fistful. It’s time to add warning labels to all salt packaging, implores the league. Even to that communal salt shaker. Helpfully, the league’s offering suggested wording for that harbinger-of-doom missive: “Excess sodium can cause high blood pressure and promote stomach cancer. Limit your use.”
Catchy, right? But we at the Bureau of LOTME believe a picture is worth a thousand words of warning. Which is why we’ve taped a simple biohazard logo to our office Cheetos stash. Because of the sodium, you ask? Hardly. But just imagine that much optic-orange food coloring finding its way into the groundwater.
The anatomy of extinction

Barely a day goes by without a new theory about What Killed the Dinosaurs. A meteor killed the dinosaurs. Volcanoes killed the dinosaurs. Donald Trump asked the Ukrainians to kill the dinosaurs. Hilary Clinton’s emails killed the dinosaurs. Donald Trump asked the Australians to say that Robert Mueller killed the dinosaurs. The liberal media are covering up the existence of dinosaurs.
Enough already. What about the primates? We humans are still around – at least for the time being. But when was the last time you heard a good theory about what killed the Neanderthals?
Well, hang on to your earmuffs, because here comes one now.
Researchers have reconstructed the Neanderthal Eustachian tubes and determined that those early rivals of Homo sapiens were done in by … chronic ear infections.
The Neanderthal Eustachian tubes were very similar to those of human infants, and “middle ear infections are nearly ubiquitous among infants because the flat angle of an infant’s Eustachian tubes is prone to retain the otitis media bacteria that cause these infections – the same flat angle we found in Neanderthals,” coauthor Samuel Márquez, PhD, of the State University of New York said in a statement.
Unlike modern humans, however, the Neanderthal eustachian tube did not change with age, so middle ear infections were a lifelong threat.
“It’s not just the threat of dying of an infection,” said Dr. Márquez. “If you are constantly ill, you would not be as fit and effective in competing with your Homo sapiens cousins for food and other resources. In a world of survival of the fittest, it is no wonder that modern man, not Neanderthal, prevailed.”
In other words, it wasn’t brains that beat the big, bad Neanderthals; it was their own baby ears.
H. sapiens, raise a glass: Ears to you, Charles Darwin.

Dude, just chill out and relax ... or not
It’s been a tough week. You’ve struggled to get all your work done on time, you’ve had to put in long hours, you’re exhausted and stressed out, and you know that next week will be just as tough. But for now, it’s the weekend. Time to relax, right?
According to research from Penn State University published in the Journal of Affective Disorders, if you have anxiety disorder, not only will you have difficulty relaxing (hence the anxiety disorder), you may actually actively resist it, experiencing something called “relaxation-induced anxiety.”
The researchers recruited a group of students, some with anxiety disorder, some with major depressive disorder, and a control group, and administered a series of relaxation exercises both before and after watching a series of potentially upsetting videos. The people with anxiety disorders were more likely to experience spikes of negative emotion after the second relaxation exercise than the other two groups; these spikes were linked to a feeling of anxiety during relaxation exercise.
The researchers theorized that people with anxiety disorder were attempting to avoid large jumps in their stress level by remaining stressed at all times. But the investigators also noted that experiencing a range of emotions is natural and far healthier.
So, as annoying as it is to suffer through constant “stop worrying, just live in the moment” speeches from that one dudebro acquaintance who spends all his free time partying, he does have a point. We don’t recommend participating in the Edward Fortyhands game, though. Leave that to your “friend.” He’s used to it.
A salty surgeon general’s warning
Grab a pack of Marlboro Reds at the corner convenience store, and you’ll find the iconic red and white box adorned with dire warnings from the surgeon general.
Grab a salt shaker at the corner diner, and you’ll find ... salt. In a shaker. Perhaps adorned with the red residue from a prior diner’s ketchup addiction.
The World Hypertension League would like to make that salt shaker look a lot more like those Marlboros.
In a position statement in the Journal of Clinical Hypertension, the league outlined the case for giving sodium chloride the cancer-stick treatment. Exhibit A: “Unhealthy diets are a leading cause of death globally, and excess salt consumption is the biggest culprit, estimated to cause over 3 million deaths globally in 2017.”
Despite that tobacco-rivaling body count, the league says no country has demanded that salt containers wear warning labels.
But isn’t it enough to list sodium levels on food labels? Well, when’s the last time you studied the salty facts before binging on that entire party-size bag of Cheetos, Chester? (You’ll be hotboxing 4,500 mg of sodium, by the way.) The league rests its case.
What’s needed is a message that stops you mid fistful. It’s time to add warning labels to all salt packaging, implores the league. Even to that communal salt shaker. Helpfully, the league’s offering suggested wording for that harbinger-of-doom missive: “Excess sodium can cause high blood pressure and promote stomach cancer. Limit your use.”
Catchy, right? But we at the Bureau of LOTME believe a picture is worth a thousand words of warning. Which is why we’ve taped a simple biohazard logo to our office Cheetos stash. Because of the sodium, you ask? Hardly. But just imagine that much optic-orange food coloring finding its way into the groundwater.
The anatomy of extinction
Barely a day goes by without a new theory about What Killed the Dinosaurs. A meteor killed the dinosaurs. Volcanoes killed the dinosaurs. Donald Trump asked the Ukrainians to kill the dinosaurs. Hilary Clinton’s emails killed the dinosaurs. Donald Trump asked the Australians to say that Robert Mueller killed the dinosaurs. The liberal media are covering up the existence of dinosaurs.
Enough already. What about the primates? We humans are still around – at least for the time being. But when was the last time you heard a good theory about what killed the Neanderthals?
Well, hang on to your earmuffs, because here comes one now.
Researchers have reconstructed the Neanderthal Eustachian tubes and determined that those early rivals of Homo sapiens were done in by … chronic ear infections.
The Neanderthal Eustachian tubes were very similar to those of human infants, and “middle ear infections are nearly ubiquitous among infants because the flat angle of an infant’s Eustachian tubes is prone to retain the otitis media bacteria that cause these infections – the same flat angle we found in Neanderthals,” coauthor Samuel Márquez, PhD, of the State University of New York said in a statement.
Unlike modern humans, however, the Neanderthal eustachian tube did not change with age, so middle ear infections were a lifelong threat.
“It’s not just the threat of dying of an infection,” said Dr. Márquez. “If you are constantly ill, you would not be as fit and effective in competing with your Homo sapiens cousins for food and other resources. In a world of survival of the fittest, it is no wonder that modern man, not Neanderthal, prevailed.”
In other words, it wasn’t brains that beat the big, bad Neanderthals; it was their own baby ears.
H. sapiens, raise a glass: Ears to you, Charles Darwin.
NICUs admitting more normal-weight newborns
Almost half of the newborns admitted to U.S. neonatal intensive care units in 2017 were of normal birth weight, according to a new report from the Dartmouth Institute for Health Policy & Clinical Practice.
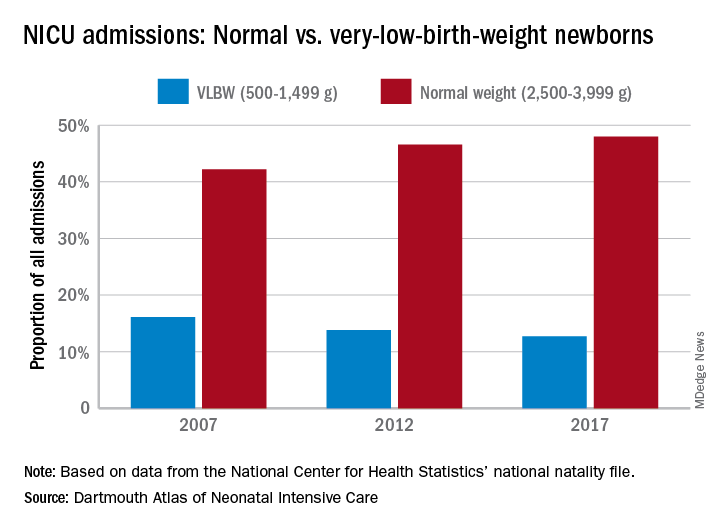
The proportion of NICU admissions involving normal-weight (2,500-3,999 g) newborns increased from 42% in 2007 to 48% in 2017, investigators said in the Dartmouth Atlas of Neonatal Intensive Care. Over that same period, admissions of very-low-birth-weight (500-1,499 g) babies dropped from 16% to 13% of the total.
Those changes were part of a larger, longer-term trend. “The expansion of NICUs and beds in recent decades has been associated with changes in the newborn population receiving NICU care,” the investigators said in the report.
The number of NICU beds increased by 65% from 1995 to 2013, and the number of neonatologists rose by 75% from 1996 to 2013. “At the same time, ” they said in a written statement.
The increases in NICU and neonatologist supply, however, did not always follow the need for such care. Areas of the country with high rates of newborn prematurity, or of risk factors such as low maternal education levels or high cesarean section rates, do not have higher supplies of NICU beds or neonatologists, the researchers noted.
“We should not spare a dollar in providing the best care for newborns. But spending more doesn’t help infants if they could receive the care they need in a maternity unit or home with their mothers. It is very troubling that such a valuable and expensive health care resource is not distributed where it is needed,” said principal author David C. Goodman, MD, of the Dartmouth Institute for Health Policy & Clinical Practice in Lebanon, N.H.
Almost half of the newborns admitted to U.S. neonatal intensive care units in 2017 were of normal birth weight, according to a new report from the Dartmouth Institute for Health Policy & Clinical Practice.
The proportion of NICU admissions involving normal-weight (2,500-3,999 g) newborns increased from 42% in 2007 to 48% in 2017, investigators said in the Dartmouth Atlas of Neonatal Intensive Care. Over that same period, admissions of very-low-birth-weight (500-1,499 g) babies dropped from 16% to 13% of the total.
Those changes were part of a larger, longer-term trend. “The expansion of NICUs and beds in recent decades has been associated with changes in the newborn population receiving NICU care,” the investigators said in the report.
The number of NICU beds increased by 65% from 1995 to 2013, and the number of neonatologists rose by 75% from 1996 to 2013. “At the same time, ” they said in a written statement.
The increases in NICU and neonatologist supply, however, did not always follow the need for such care. Areas of the country with high rates of newborn prematurity, or of risk factors such as low maternal education levels or high cesarean section rates, do not have higher supplies of NICU beds or neonatologists, the researchers noted.
“We should not spare a dollar in providing the best care for newborns. But spending more doesn’t help infants if they could receive the care they need in a maternity unit or home with their mothers. It is very troubling that such a valuable and expensive health care resource is not distributed where it is needed,” said principal author David C. Goodman, MD, of the Dartmouth Institute for Health Policy & Clinical Practice in Lebanon, N.H.
Palliative care programs continue growth in U.S. hospitals
Growth continues among palliative care programs in the United States, although access often depends “more upon accidents of geography than it does upon the needs of patients,” according to the Center to Advance Palliative Care and the National Palliative Care Research Center.
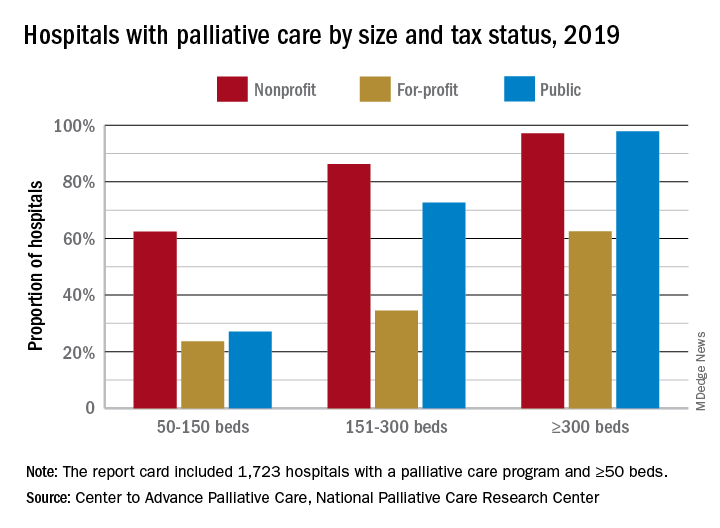
“As is true for many aspects of health care, geography is destiny. Where you live determines your access to the best quality of life and highest quality of care during a serious illness,” said Diane E. Meier, MD, director of the Center to Advance Palliative Care, in a written statement.
the two organizations said in their 2019 report card on palliative care access. What hasn’t changed since 2015, however, is the country’s overall grade, which remains a B.
Delaware, New Hampshire, Rhode Island, and Vermont have a palliative care program in all of their hospitals with 50 or more beds and each earned a grade of A (palliative care rate of greater than 80%), along with 17 other states. The lowest-performing states – Alabama, Mississippi, New Mexico, Oklahoma, and Wyoming – all received Ds for having a rate below 40%, the CAPC said.
The urban/rural divide also is prominent in palliative care: “90% of hospitals with palliative care are in urban areas. Only 17% of rural hospitals with fifty or more beds report palliative care programs,” the report said.
Hospital type is another source of disparity. Small, nonprofit hospitals are much more likely to offer access to palliative care than either for-profit or public facilities of the same size, but the gap closes as size increases, at least between nonprofit and public hospitals. For the largest institutions, the public hospitals pull into the lead, 98% versus 97%, over the nonprofits, with the for-profit facilities well behind at 63%.
“High quality palliative care has been shown to improve patient and family quality of life, improve patients’ and families’ health care experiences, and in certain diseases, prolong life. Palliative care has also been shown to improve hospital efficiency and reduce unnecessary spending,” said R. Sean Morrison, MD, director of the National Palliative Care Research Center.
The report card is based on data from the American Hospital Association’s Annual Survey Database, with additional data from the National Palliative Care Registry and Center to Advance Palliative Care’s Mapping Community Palliative Care initiative. The final sample included 2,409 hospitals with 50 or more beds.
Growth continues among palliative care programs in the United States, although access often depends “more upon accidents of geography than it does upon the needs of patients,” according to the Center to Advance Palliative Care and the National Palliative Care Research Center.
“As is true for many aspects of health care, geography is destiny. Where you live determines your access to the best quality of life and highest quality of care during a serious illness,” said Diane E. Meier, MD, director of the Center to Advance Palliative Care, in a written statement.
the two organizations said in their 2019 report card on palliative care access. What hasn’t changed since 2015, however, is the country’s overall grade, which remains a B.
Delaware, New Hampshire, Rhode Island, and Vermont have a palliative care program in all of their hospitals with 50 or more beds and each earned a grade of A (palliative care rate of greater than 80%), along with 17 other states. The lowest-performing states – Alabama, Mississippi, New Mexico, Oklahoma, and Wyoming – all received Ds for having a rate below 40%, the CAPC said.
The urban/rural divide also is prominent in palliative care: “90% of hospitals with palliative care are in urban areas. Only 17% of rural hospitals with fifty or more beds report palliative care programs,” the report said.
Hospital type is another source of disparity. Small, nonprofit hospitals are much more likely to offer access to palliative care than either for-profit or public facilities of the same size, but the gap closes as size increases, at least between nonprofit and public hospitals. For the largest institutions, the public hospitals pull into the lead, 98% versus 97%, over the nonprofits, with the for-profit facilities well behind at 63%.
“High quality palliative care has been shown to improve patient and family quality of life, improve patients’ and families’ health care experiences, and in certain diseases, prolong life. Palliative care has also been shown to improve hospital efficiency and reduce unnecessary spending,” said R. Sean Morrison, MD, director of the National Palliative Care Research Center.
The report card is based on data from the American Hospital Association’s Annual Survey Database, with additional data from the National Palliative Care Registry and Center to Advance Palliative Care’s Mapping Community Palliative Care initiative. The final sample included 2,409 hospitals with 50 or more beds.
Prevalence of developmental disabilities up significantly since 2009
The significant increase in developmental disability prevalence in U.S. children from 2009 to 2017 may have been driven by factors such as better identification and availability of services, according to analysis of National Health Interview Survey (NHIS) data.
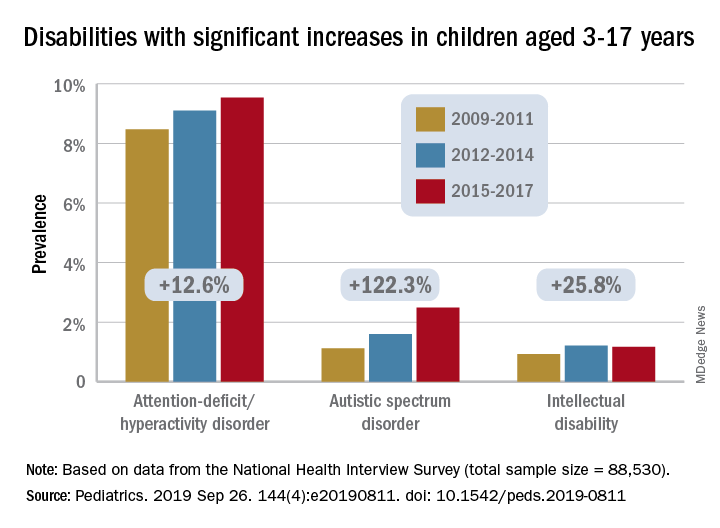
The prevalence of any developmental disability rose from 16% in 2009 to 18% in 2017 in children aged 3-17 years, for an increase of 9.5%, Benjamin Zablotsky, PhD, of the National Center for Health Statistics, Hyattsville, Md., and associates reported in Pediatrics.
Changes among the various conditions were not uniform, however, and most of the increase came from ADHD, autism spectrum disorder (ASD), and intellectual disability, which were up by 12.6%, 122.3%, and 25.8%, respectively, they said, based on data for 88,530 children from the NHIS.
Because other studies have shown that the “prevalence of ADHD symptoms and impairment has remained steady over time,” the increase according to NHIS data “could be driven by better identification of children who meet criteria for ADHD, as current estimates of diagnosed prevalence are in line with community-based studies,” Dr. Zablotsky and associates wrote.
Improved identification, “related to increasing parental awareness and changing provider practices” also may account for much of the rise in ASD prevalence, they said.
It also may be related to changes in the survey itself, as “an increase of about 80% was seen in the 2014 NHIS following changes to the wording and ordering of the question capturing ASD.”
The investigators offered a similar explanation for the increase in intellectual disability prevalence, which increased by 72% from 2011 to 2013 when the phrasing of the NHIS question was changed from “mental retardation” to “intellectual disability, also known as mental retardation.”
The other specific conditions – blindness, cerebral palsy, hearing loss, learning disability, seizures, and stuttering/stammering – all saw nonsignificant changes during the study period, with one exception. “Other developmental delay” dropped by a significant 13%. “It is possible that parents have become less likely to select this category because their children have increasingly been diagnosed with another specified condition on the survey,” Dr. Zablotsky and associates said.
“These findings have major implications for pediatric training and workforce needs and more broadly for public health policies and resources to meet the complex medical and educational needs of the rising number of children with disabilities and their families,” Maureen S. Durkin, PhD, DrPH, said in an accompanying editorial.
The trends reported by Dr. Zablotsky and associates, which have been seen in other countries, are the result of improved survival among children, so, “in this sense, a rise in the prevalence of developmental disabilities may be seen as a global indicator of progress in children’s health and pediatric care,” said Dr. Durkin, a epidemiologist in Madison, Wis.
Dr. Zablotsky and coauthors said that there was no external funding for the study and that they had no relevant financial relationships to disclose. Dr. Durkin said that she had no potential conflicts of interest.
SOURCES: Zablotsky B et al. Pediatrics. 2019 Sep 26. 144(4):e20190811. doi: 10.1542/peds.2019-0811; Durkin MS. Pediatrics. 2019 Sep 26. 144[4]:e20192005. doi: 10.1542/peds.2019-2005.
The significant increase in developmental disability prevalence in U.S. children from 2009 to 2017 may have been driven by factors such as better identification and availability of services, according to analysis of National Health Interview Survey (NHIS) data.
The prevalence of any developmental disability rose from 16% in 2009 to 18% in 2017 in children aged 3-17 years, for an increase of 9.5%, Benjamin Zablotsky, PhD, of the National Center for Health Statistics, Hyattsville, Md., and associates reported in Pediatrics.
Changes among the various conditions were not uniform, however, and most of the increase came from ADHD, autism spectrum disorder (ASD), and intellectual disability, which were up by 12.6%, 122.3%, and 25.8%, respectively, they said, based on data for 88,530 children from the NHIS.
Because other studies have shown that the “prevalence of ADHD symptoms and impairment has remained steady over time,” the increase according to NHIS data “could be driven by better identification of children who meet criteria for ADHD, as current estimates of diagnosed prevalence are in line with community-based studies,” Dr. Zablotsky and associates wrote.
Improved identification, “related to increasing parental awareness and changing provider practices” also may account for much of the rise in ASD prevalence, they said.
It also may be related to changes in the survey itself, as “an increase of about 80% was seen in the 2014 NHIS following changes to the wording and ordering of the question capturing ASD.”
The investigators offered a similar explanation for the increase in intellectual disability prevalence, which increased by 72% from 2011 to 2013 when the phrasing of the NHIS question was changed from “mental retardation” to “intellectual disability, also known as mental retardation.”
The other specific conditions – blindness, cerebral palsy, hearing loss, learning disability, seizures, and stuttering/stammering – all saw nonsignificant changes during the study period, with one exception. “Other developmental delay” dropped by a significant 13%. “It is possible that parents have become less likely to select this category because their children have increasingly been diagnosed with another specified condition on the survey,” Dr. Zablotsky and associates said.
“These findings have major implications for pediatric training and workforce needs and more broadly for public health policies and resources to meet the complex medical and educational needs of the rising number of children with disabilities and their families,” Maureen S. Durkin, PhD, DrPH, said in an accompanying editorial.
The trends reported by Dr. Zablotsky and associates, which have been seen in other countries, are the result of improved survival among children, so, “in this sense, a rise in the prevalence of developmental disabilities may be seen as a global indicator of progress in children’s health and pediatric care,” said Dr. Durkin, a epidemiologist in Madison, Wis.
Dr. Zablotsky and coauthors said that there was no external funding for the study and that they had no relevant financial relationships to disclose. Dr. Durkin said that she had no potential conflicts of interest.
SOURCES: Zablotsky B et al. Pediatrics. 2019 Sep 26. 144(4):e20190811. doi: 10.1542/peds.2019-0811; Durkin MS. Pediatrics. 2019 Sep 26. 144[4]:e20192005. doi: 10.1542/peds.2019-2005.
FROM PEDIATRICS
Key clinical point:
Major finding: Among U.S. children aged 3-17 years, prevalence of developmental disabilities increased by 9.5% from 2009 to 2017.
Study details: The sample from the National Health Interview Survey included 88,530 children.
Disclosures: The investigators said that there was no external funding for the study and that they had no relevant financial relationships to disclose.
Source: Zablotsky B et al. Pediatrics. 2019 Sep 26. 144(4):e20190811. doi: 10.1542/peds.2019-0811.
Auto-brewery syndrome and hangovers as ‘illnesses’
Food for thought/fermentation
The earliest known alcoholic beverage in the world was a fermented drink of rice, honey, and hawthorn fruit and/or grape that was brewed about 9,000 years ago in China’s Yellow River Valley.

Now there’s another candidate. Meet Klebsiella pneumonia, a common type of gut bacteria that just happens to make its own alcohol and appears to be the cause of a rare condition known as auto-brewery syndrome, which causes those affected to become drunk after eating alcohol-free and high-sugar food.
A group of Chinese investigators had a patient with auto-brewery syndrome and nonalcoholic fatty liver disease (NAFLD) and found he had several strains of K. pneumonia in his gut that produced high levels of alcohol. Then they sampled the gut microbiota from 43 NAFLD patients and 48 healthy people: 60% of the NAFLD patients had high- and medium-alcohol–producing K. pneumonia in their gut, compared with 6% of the controls.
When the team gave mice with NAFLD that had the alcohol-producing bacteria an antibiotic that killed K. pneumonia, their condition was reversed.
“These bacteria damage your liver just like alcohol, except you don’t have a choice,” lead author Jing Yuan said in a written statement.
That got us wondering: What if you do have a choice? Would a diet high in Cabernet and Merlot grapes give K. pneumonia the makings of Château Lafite Rothschild? Would you get Grey Goose if you ate enough French wheat? Would consumption of Optic or Belgravia malts give you Glenfiddich?
Why Ah-nold is more pumped than you
If you’ve watched “Pumping Iron” or “The Terminator,” you know the star of those films, Arnold Schwarzenegger, is driven to achieve his goals. Such as remorselessly squeezing the bodybuilding dreams of fellow “Pumping Iron” star Lou Ferrigno like a tube of toothpaste. Or finding Sarah Connor.

Given that quality, it probably shouldn’t be surprising that the seven-time Mr. Olympia with the 50-pound Austrian accent would somehow become California’s governator.
But why? Because Ah-nold is clearly a human bursting at his cyborglike biceps with “planfulness.”
Planfulness is the personality trait possessed by those who develop a clear plan when they have a goal that’s important to them. To find out how planfulness interacts with achieving long-term goals, University of Oregon researchers looked at the gym attendance of 282 people looking to get pumped up at a campus rec center.
Using a Planfulness Scale, the investigators tracked their study participants’ progress toward pumpitude. The ones who rated themselves as strong on planfulness were more likely to hit the gym consistently than were those with scrawny scores. In fact, a one-point increase on the five-point Planfulness Scale meant more than 14 extra gym visits over the course of two semesters.
Perhaps Ms. Connor should blame Hollywood’s planfulness for box-office profit, not Ah-nold’s, for the relentless pursuit of her in multiple “Terminator” movies.
A six-pack of illness juice, please
College students, rejoice: Your flimsy excuse to your professor that you’re sick and can’t go to class (when in reality you were out drinking – fruit juice for those with auto-brewery syndrome – all night and have a raging hangover) just got a lot stronger. That hangover is now classified as an illness.

Well, in Germany at least.
A court in Frankfurt has recently ruled against the manufacturer of a supposed “antihangover” cure, a product that contained antioxidants, electrolytes, and vitamins meant to combat the headaches, nausea, and tiredness associated with hangovers.
According to the German court, this is false advertising. Hangovers, by their definition, represent a small (clearly they’ve never dealt with a big hangover headache) and temporary change to the body’s normal state that is cured over time, which falls under the classification of an illness. And, in Germany, it is illegal for food and drink products to claim that they can cure illnesses.
Of course, the Germans have nailed the timing of this groundbreaking decision perfectly, as Oktoberfest is underway in Munich.
We still doubt your professor will believe your “Oh, I’m very sick today, I can’t come in” email, but at least you’ll be technically correct. And that’s the best sort of correct.
Food for thought/fermentation
The earliest known alcoholic beverage in the world was a fermented drink of rice, honey, and hawthorn fruit and/or grape that was brewed about 9,000 years ago in China’s Yellow River Valley.
Now there’s another candidate. Meet Klebsiella pneumonia, a common type of gut bacteria that just happens to make its own alcohol and appears to be the cause of a rare condition known as auto-brewery syndrome, which causes those affected to become drunk after eating alcohol-free and high-sugar food.
A group of Chinese investigators had a patient with auto-brewery syndrome and nonalcoholic fatty liver disease (NAFLD) and found he had several strains of K. pneumonia in his gut that produced high levels of alcohol. Then they sampled the gut microbiota from 43 NAFLD patients and 48 healthy people: 60% of the NAFLD patients had high- and medium-alcohol–producing K. pneumonia in their gut, compared with 6% of the controls.
When the team gave mice with NAFLD that had the alcohol-producing bacteria an antibiotic that killed K. pneumonia, their condition was reversed.
“These bacteria damage your liver just like alcohol, except you don’t have a choice,” lead author Jing Yuan said in a written statement.
That got us wondering: What if you do have a choice? Would a diet high in Cabernet and Merlot grapes give K. pneumonia the makings of Château Lafite Rothschild? Would you get Grey Goose if you ate enough French wheat? Would consumption of Optic or Belgravia malts give you Glenfiddich?
Why Ah-nold is more pumped than you
If you’ve watched “Pumping Iron” or “The Terminator,” you know the star of those films, Arnold Schwarzenegger, is driven to achieve his goals. Such as remorselessly squeezing the bodybuilding dreams of fellow “Pumping Iron” star Lou Ferrigno like a tube of toothpaste. Or finding Sarah Connor.
Given that quality, it probably shouldn’t be surprising that the seven-time Mr. Olympia with the 50-pound Austrian accent would somehow become California’s governator.
But why? Because Ah-nold is clearly a human bursting at his cyborglike biceps with “planfulness.”
Planfulness is the personality trait possessed by those who develop a clear plan when they have a goal that’s important to them. To find out how planfulness interacts with achieving long-term goals, University of Oregon researchers looked at the gym attendance of 282 people looking to get pumped up at a campus rec center.
Using a Planfulness Scale, the investigators tracked their study participants’ progress toward pumpitude. The ones who rated themselves as strong on planfulness were more likely to hit the gym consistently than were those with scrawny scores. In fact, a one-point increase on the five-point Planfulness Scale meant more than 14 extra gym visits over the course of two semesters.
Perhaps Ms. Connor should blame Hollywood’s planfulness for box-office profit, not Ah-nold’s, for the relentless pursuit of her in multiple “Terminator” movies.
A six-pack of illness juice, please
College students, rejoice: Your flimsy excuse to your professor that you’re sick and can’t go to class (when in reality you were out drinking – fruit juice for those with auto-brewery syndrome – all night and have a raging hangover) just got a lot stronger. That hangover is now classified as an illness.
Well, in Germany at least.
A court in Frankfurt has recently ruled against the manufacturer of a supposed “antihangover” cure, a product that contained antioxidants, electrolytes, and vitamins meant to combat the headaches, nausea, and tiredness associated with hangovers.
According to the German court, this is false advertising. Hangovers, by their definition, represent a small (clearly they’ve never dealt with a big hangover headache) and temporary change to the body’s normal state that is cured over time, which falls under the classification of an illness. And, in Germany, it is illegal for food and drink products to claim that they can cure illnesses.
Of course, the Germans have nailed the timing of this groundbreaking decision perfectly, as Oktoberfest is underway in Munich.
We still doubt your professor will believe your “Oh, I’m very sick today, I can’t come in” email, but at least you’ll be technically correct. And that’s the best sort of correct.
Women’s residency and subspecialty choices diverging
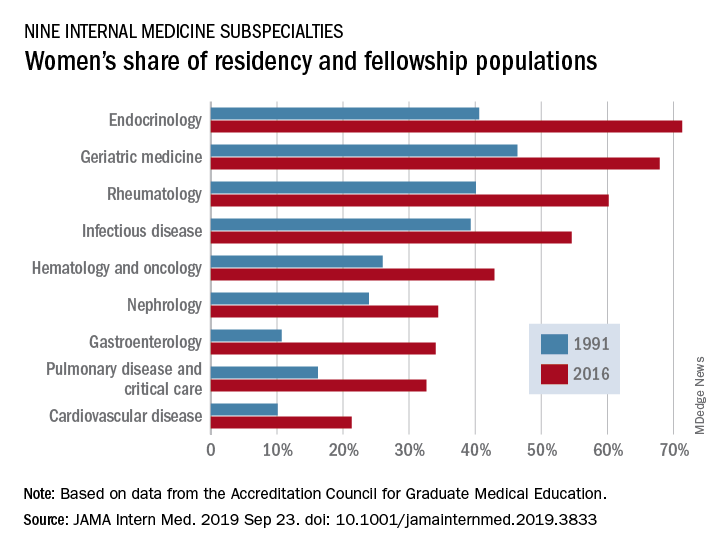
Women made up 43.2% of the internal medicine resident population in 2016, compared with 30.2% in 1991. Over that same time, however, the percentage of women in subspecialty fellowships dropped from 33.3% to 23.6%, Anna T. Stone, MD, and associates wrote in a research letter published in JAMA Internal Medicine.
“Many factors are associated with the decisions of medical students in choosing an internal medicine residency, including their sex, educational experience, views of patient care, and lifestyle perceptions. Similar considerations apply to subspecialty training,” wrote Dr. Stone of the department of cardiology at St. Vincent Hospital and Heart Center, Indianapolis, and associates.
When the investigators focused on a subset of nine internal medicine subspecialties, they saw growth: “The percentage of women entering each of the fields [residents plus fellows] increased over time, with variations between specialty and some year-to-year variations within a specialty.”
Although none of the nine subspecialties had been majority women in 1991, by 2016 women made up more than half of the residents and fellows in four: endocrinology (71.3%), geriatric medicine (67.9%), rheumatology (60.2%), and infectious disease (54.6%), according to data from the Accreditation Council for Graduate Medical Education.
And then there’s cardiology. Its low rate of participation among women – the only one of the nine subspecialties under 35% – “is an important issue that the cardiology profession should continue to address,” they wrote.
In a survey of internal medicine residents conducted by other researchers, women were more likely than men to report that they had never considered cardiology as a career choice, Dr. Stone and associates noted, and women in the survey “had different perceptions of cardiology than men.”
SOURCE: Stone AT et al. JAMA Intern Med. 2019 Sep 23. doi: 10.1001/jamainternmed.2019.3833.
FROM JAMA INTERNAL MEDICINE
Growing vaping habit may lead to nicotine addiction in adolescents
and in 2019 almost 12% of high school seniors reported that they were vaping every day, according to data from the Monitoring the Future surveys.
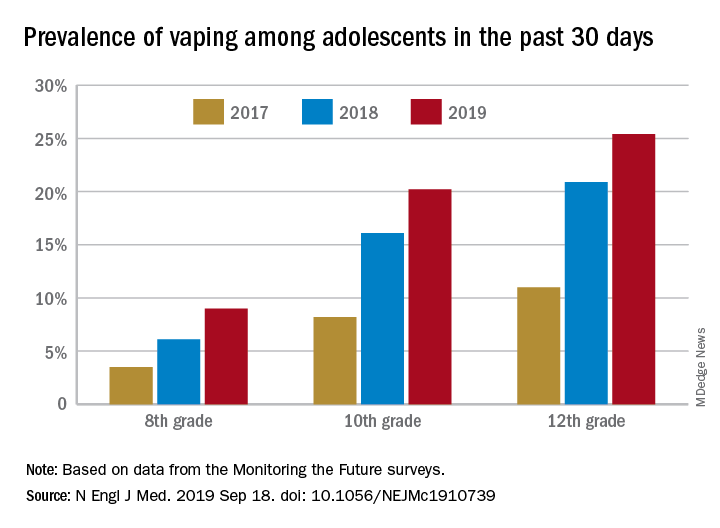
Daily use – defined as vaping on 20 or more of the previous 30 days – was reported by 6.9% of 10th-grade and 1.9% of 8th-grade respondents in the 2019 survey, which was the first time use in these age groups was assessed. “The substantial levels of daily vaping suggest the development of nicotine addiction,” Richard Miech, PhD, and associates said Sept. 18 in the New England Journal of Medicine.
From 2017 to 2019, e-cigarette use over the previous 30 days increased from 11.0% to 25.4% among 12th graders, from 8.2% to 20.2% in 10th graders, and from 3.5% to 9.0% of 8th graders, suggesting that “current efforts by the vaping industry, government agencies, and schools have thus far proved insufficient to stop the rapid spread of nicotine vaping among adolescents,” the investigators wrote.
By 2019, over 40% of 12th-grade students reported ever using e-cigarettes, along with more than 36% of 10th graders and almost 21% of 8th graders. Corresponding figures for past 12-month use were 35.1%, 31.1%, and 16.1%, they reported.
“New efforts are needed to protect youth from using nicotine during adolescence, when the developing brain is particularly susceptible to permanent changes from nicotine use and when almost all nicotine addiction is established,” the investigators wrote.
The analysis was funded by a grant from the National Institute on Drug Abuse to Dr. Miech.
SOURCE: Miech R et al. N Engl J Med. 2019 Sep 18. doi: 10.1056/NEJMc1910739.
and in 2019 almost 12% of high school seniors reported that they were vaping every day, according to data from the Monitoring the Future surveys.
Daily use – defined as vaping on 20 or more of the previous 30 days – was reported by 6.9% of 10th-grade and 1.9% of 8th-grade respondents in the 2019 survey, which was the first time use in these age groups was assessed. “The substantial levels of daily vaping suggest the development of nicotine addiction,” Richard Miech, PhD, and associates said Sept. 18 in the New England Journal of Medicine.
From 2017 to 2019, e-cigarette use over the previous 30 days increased from 11.0% to 25.4% among 12th graders, from 8.2% to 20.2% in 10th graders, and from 3.5% to 9.0% of 8th graders, suggesting that “current efforts by the vaping industry, government agencies, and schools have thus far proved insufficient to stop the rapid spread of nicotine vaping among adolescents,” the investigators wrote.
By 2019, over 40% of 12th-grade students reported ever using e-cigarettes, along with more than 36% of 10th graders and almost 21% of 8th graders. Corresponding figures for past 12-month use were 35.1%, 31.1%, and 16.1%, they reported.
“New efforts are needed to protect youth from using nicotine during adolescence, when the developing brain is particularly susceptible to permanent changes from nicotine use and when almost all nicotine addiction is established,” the investigators wrote.
The analysis was funded by a grant from the National Institute on Drug Abuse to Dr. Miech.
SOURCE: Miech R et al. N Engl J Med. 2019 Sep 18. doi: 10.1056/NEJMc1910739.
FROM THE NEW ENGLAND JOURNAL OF MEDICINE
Key clinical point: Adolescents who use e-cigarettes every day may be developing nicotine addiction.
Major finding: In 2019, almost 12% of high school seniors were vaping every day.
Study details: Monitoring the Future surveys nationally representative samples of 8th-, 10th-, and 12th-grade students each year.
Disclosures: The analysis was funded by a grant from the National Institute on Drug Abuse to Dr. Miech.
Source: Miech R et al. N Engl J Med. 2019 Sep 18. doi: 10.1056/NEJMc1910739.