User login
Richard Franki is the associate editor who writes and creates graphs. He started with the company in 1987, when it was known as the International Medical News Group. In his years as a journalist, Richard has worked for Cap Cities/ABC, Disney, Harcourt, Elsevier, Quadrant, Frontline, and Internet Brands. In the 1990s, he was a contributor to the ill-fated Indications column, predecessor of Livin' on the MDedge.
Electrified pathogens and urbanized mosquitoes
Microbes won’t believe this shocking truth!
Pathogens can be tough little critters. Always getting into places they don’t belong, and when they get there, they can be difficult to get rid of, what with their ability to quickly evolve resistance to our best medications. If only there was some shocking new way to tackle those nasty and annoying infections.

Thanks to some engineers and researchers from the University of Pittsburgh, if you’ve got an infection centered on a metal implant, that shocking new treatment won’t be just a figure of speech. They ran a weak electrical current through metal dental implants infected with recurring Candida albicans infection, which damaged the cell membranes of the offending fungal pathogens but left the healthy tissue around the infection alone. That damage increased the pathogen's permeability, making it more susceptible to antimicrobial treatment.
The treatment, also known as electrochemical therapy, is great if you’ve got a recurrent infection. The dormant pathogens responsible for the recurrence, not normally susceptible to treatment, are affected by antifungals or antibiotics after the shock wakes them up. Even bacteria that have evolved drug resistance become vulnerable again after a session with Dr. Electricity.
Unfortunately, while the therapy could certainly be expanded beyond dental implants, shocking yourself when you’ve got a regular old infection probably won’t work. We know – Watt a disappointment.
Blast from the brewing past
What separates a rich Belgian ale from its paler, mass-produced American competitors? Is it the sudsy je ne sais quoi produced by squabbling Walloons and Flemings debating the fine points of the brewing arts over open tanks? Perhaps it’s the signature warm-fermented ways of Trappist monks? Is it possible les Belges have hired the unemployed Artesians who once made Olympia Beer a household name across the American West?

Wrong, wrong, and faux. In fact, Belgium’s finest brews are driven by hybrids. Yeast hybrids. Specifically, rare and unusual forms of hybrid yeasts.
Or, as Belgian researcher and world beer hero Dr. Jan Steensels of VIB-KU Leuven Center for Microbiology explains, “Think of lions and tigers making a super-baby.”
Fearlessly, Dr. Steensels and his intrepid colleagues went hunting for these exotic creatures. They found that the yeasts behind many of Belgium’s finest brews combine the DNA of the traditional, domesticated ale yeast, Saccharomyces cerevisiae, with genetic material from wild yeasts such as Saccharomyces kudriavzevii.
The result? The mighty fermentation strengths of normal beer yeasts are paired with the stress resistance and alluring aromas of feral yeasts that survived mankind’s Medieval brewing endeavors and somehow stumbled into the modern brewery for a drink.
Dr. Steensels’ team is now using its knowledge to craft more yeasty lion-tiger super-babies. We at the Bureau of LOTME look forward to hoisting a pint of this “liger” elixir. We’re certain the brew will bear the name of ligers’ greatest cinematic fan, Napoleon Dynamite, and feature the subtle undertones of tater tots.
How can mosquitoes be even more fun?
If you’re anything like the gang at LOTME, you’ve spent quite a bit of time wondering which cliché is the best fit for a less-affluent Baltimore neighborhood.
The answer? When it rains, it pours.
We’ll explain. By definition, a less-affluent neighborhood is, well, less affluent, and that lack of affluence has many health consequences for the people who live in those neighborhoods. Today we’re focusing on everyone’s favorite winged disease vector, the mosquito.
It was already known that low-income urban neighborhoods have more mosquitoes than other neighborhoods, and now the Journal of Medical Entomology has published a survey of 13 residential blocks in Baltimore that shows low-income neighborhoods have larger mosquitoes as well.
Trapping took place in five socioeconomically diverse Baltimore neighborhoods during June and July of 2015-2017. (In case you were wondering, the researchers used BG-Sentinel traps baited with CO2 and a 2.0-mL Octenol Lure, which would have been our choice, too). It confirmed that lower affluence correlated with larger mosquito wing size. Wing size, the investigators said in a written statement, “is an accurate proxy for body size in mosquitoes, and body size influences traits that are important to disease transmission.”
So, it seems that larger mosquitoes are more efficient at transmitting diseases, which means more dengue fever, more Zika, more chikungunya, more eastern equine encephalitis, and more West Nile virus. To extend the original cliché a bit, when it rains in Baltimore, the poor neighborhoods get the wettest.
* Correction, 10/24/19: An earlier version of this story misstated the fungal target of the electrical therapy experiment.

Microbes won’t believe this shocking truth!
Pathogens can be tough little critters. Always getting into places they don’t belong, and when they get there, they can be difficult to get rid of, what with their ability to quickly evolve resistance to our best medications. If only there was some shocking new way to tackle those nasty and annoying infections.
Thanks to some engineers and researchers from the University of Pittsburgh, if you’ve got an infection centered on a metal implant, that shocking new treatment won’t be just a figure of speech. They ran a weak electrical current through metal dental implants infected with recurring Candida albicans infection, which damaged the cell membranes of the offending fungal pathogens but left the healthy tissue around the infection alone. That damage increased the pathogen's permeability, making it more susceptible to antimicrobial treatment.
The treatment, also known as electrochemical therapy, is great if you’ve got a recurrent infection. The dormant pathogens responsible for the recurrence, not normally susceptible to treatment, are affected by antifungals or antibiotics after the shock wakes them up. Even bacteria that have evolved drug resistance become vulnerable again after a session with Dr. Electricity.
Unfortunately, while the therapy could certainly be expanded beyond dental implants, shocking yourself when you’ve got a regular old infection probably won’t work. We know – Watt a disappointment.
Blast from the brewing past
What separates a rich Belgian ale from its paler, mass-produced American competitors? Is it the sudsy je ne sais quoi produced by squabbling Walloons and Flemings debating the fine points of the brewing arts over open tanks? Perhaps it’s the signature warm-fermented ways of Trappist monks? Is it possible les Belges have hired the unemployed Artesians who once made Olympia Beer a household name across the American West?
Wrong, wrong, and faux. In fact, Belgium’s finest brews are driven by hybrids. Yeast hybrids. Specifically, rare and unusual forms of hybrid yeasts.
Or, as Belgian researcher and world beer hero Dr. Jan Steensels of VIB-KU Leuven Center for Microbiology explains, “Think of lions and tigers making a super-baby.”
Fearlessly, Dr. Steensels and his intrepid colleagues went hunting for these exotic creatures. They found that the yeasts behind many of Belgium’s finest brews combine the DNA of the traditional, domesticated ale yeast, Saccharomyces cerevisiae, with genetic material from wild yeasts such as Saccharomyces kudriavzevii.
The result? The mighty fermentation strengths of normal beer yeasts are paired with the stress resistance and alluring aromas of feral yeasts that survived mankind’s Medieval brewing endeavors and somehow stumbled into the modern brewery for a drink.
Dr. Steensels’ team is now using its knowledge to craft more yeasty lion-tiger super-babies. We at the Bureau of LOTME look forward to hoisting a pint of this “liger” elixir. We’re certain the brew will bear the name of ligers’ greatest cinematic fan, Napoleon Dynamite, and feature the subtle undertones of tater tots.
How can mosquitoes be even more fun?
If you’re anything like the gang at LOTME, you’ve spent quite a bit of time wondering which cliché is the best fit for a less-affluent Baltimore neighborhood.
The answer? When it rains, it pours.
We’ll explain. By definition, a less-affluent neighborhood is, well, less affluent, and that lack of affluence has many health consequences for the people who live in those neighborhoods. Today we’re focusing on everyone’s favorite winged disease vector, the mosquito.
It was already known that low-income urban neighborhoods have more mosquitoes than other neighborhoods, and now the Journal of Medical Entomology has published a survey of 13 residential blocks in Baltimore that shows low-income neighborhoods have larger mosquitoes as well.
Trapping took place in five socioeconomically diverse Baltimore neighborhoods during June and July of 2015-2017. (In case you were wondering, the researchers used BG-Sentinel traps baited with CO2 and a 2.0-mL Octenol Lure, which would have been our choice, too). It confirmed that lower affluence correlated with larger mosquito wing size. Wing size, the investigators said in a written statement, “is an accurate proxy for body size in mosquitoes, and body size influences traits that are important to disease transmission.”
So, it seems that larger mosquitoes are more efficient at transmitting diseases, which means more dengue fever, more Zika, more chikungunya, more eastern equine encephalitis, and more West Nile virus. To extend the original cliché a bit, when it rains in Baltimore, the poor neighborhoods get the wettest.
* Correction, 10/24/19: An earlier version of this story misstated the fungal target of the electrical therapy experiment.
Online resources influencing cosmetic treatment choices
Online resources are affecting most consumers’ selections of cosmetic providers, and social media are now a top-three influence on cosmetic procedure choices and skin care purchases, according to a new survey from the American Society for Dermatologic Surgery.
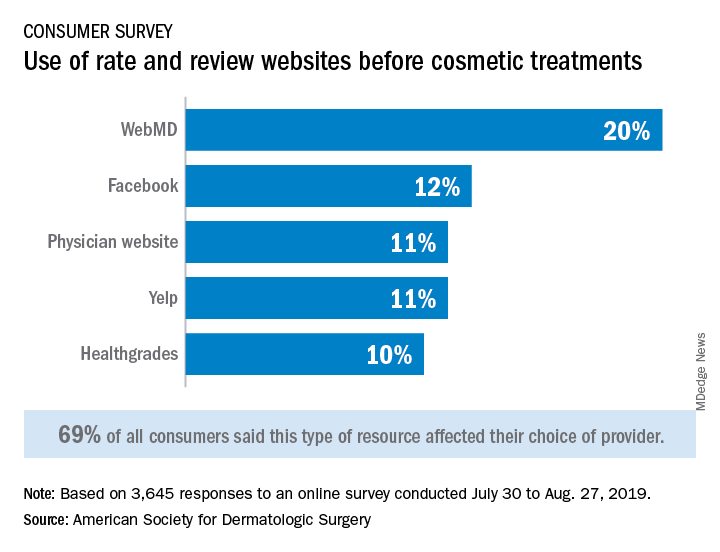
Almost 70% of respondents said that their use of rate and review websites had an impact on the choice of provider for cosmetic procedures: WebMD was the site most often visited, followed by Facebook, physician websites, and Yelp, the ASDS said based on its annual consumer survey.
For 43% of consumers, the decision to schedule an appointment was influenced by a provider’s social media presence, and 41% of patients said that they follow their current or potential provider on social media, the ASDS said.
“Online resources and social media platforms are clearly influencing consumers’ behavior and perception of skin health,” ASDS President Murad Alam, MD, MBA, chief of cutaneous and aesthetic surgery in the department of dermatology at Northwestern University, Chicago, said in a written statement.
Dermatologists, however, remain the leading influence on the decision to have a cosmetic procedure – named as a resource by 34% of respondents, who could select more than one possibility from a list of 15 – but social media moved ahead of primary care physicians into third place (24%), just behind friends (30%), the survey showed. Dermatologists, on the other hand, had polled at 50%-55% for the previous 5 years.
The dermatologists’ lead remained stronger as the top influencer for skin care purchases, selected by 45% of respondents, compared with 32% for friends and 28% for social media. In this category there were 14 factors from which respondents could choose. As for the cost of those skin care products, 48% of consumers spent $1-$50 a month, 31% said that they spent $51-$100 a month, and 12% reported spending $101-$150 a month, the ASDS said.
The society received 3,645 responses to the 2019 Consumer Survey on Cosmetic Dermatologic Procedures, which was conducted online from July 30 to Aug. 27 by Survata.
Online resources are affecting most consumers’ selections of cosmetic providers, and social media are now a top-three influence on cosmetic procedure choices and skin care purchases, according to a new survey from the American Society for Dermatologic Surgery.
Almost 70% of respondents said that their use of rate and review websites had an impact on the choice of provider for cosmetic procedures: WebMD was the site most often visited, followed by Facebook, physician websites, and Yelp, the ASDS said based on its annual consumer survey.
For 43% of consumers, the decision to schedule an appointment was influenced by a provider’s social media presence, and 41% of patients said that they follow their current or potential provider on social media, the ASDS said.
“Online resources and social media platforms are clearly influencing consumers’ behavior and perception of skin health,” ASDS President Murad Alam, MD, MBA, chief of cutaneous and aesthetic surgery in the department of dermatology at Northwestern University, Chicago, said in a written statement.
Dermatologists, however, remain the leading influence on the decision to have a cosmetic procedure – named as a resource by 34% of respondents, who could select more than one possibility from a list of 15 – but social media moved ahead of primary care physicians into third place (24%), just behind friends (30%), the survey showed. Dermatologists, on the other hand, had polled at 50%-55% for the previous 5 years.
The dermatologists’ lead remained stronger as the top influencer for skin care purchases, selected by 45% of respondents, compared with 32% for friends and 28% for social media. In this category there were 14 factors from which respondents could choose. As for the cost of those skin care products, 48% of consumers spent $1-$50 a month, 31% said that they spent $51-$100 a month, and 12% reported spending $101-$150 a month, the ASDS said.
The society received 3,645 responses to the 2019 Consumer Survey on Cosmetic Dermatologic Procedures, which was conducted online from July 30 to Aug. 27 by Survata.
Drug crisis continues to evolve beyond opioids
Almost three-quarters of primary care physicians believe that their patients will take their controlled medications as prescribed, but more than half of drug-monitoring lab tests show signs of misuse, according to a new report from Quest Diagnostics.
“ and may miss some of the drug misuse risks affecting their patients,” report coauthor Harvey W. Kaufman, MD, Quest’s senior medical director, said in a written statement.
Analysis of more than 4.4 million drug-monitoring tests showed that 51% involved an inconsistent result, such as detection of a nonprescribed drug or nondetection of a drug that was prescribed. The report also included a survey of 500 primary care physicians, of whom 72% said they trusted their patents to properly use opioids and other controlled substances.
“The intersection of these two data sets reveals, for the first time, the contrast between physician expectations about patient drug use and the evolution of the drug epidemic and actual patient behavior, as revealed by objective lab data, amid a national drug crisis that claimed an estimated 68,500 lives last year,” the report said.
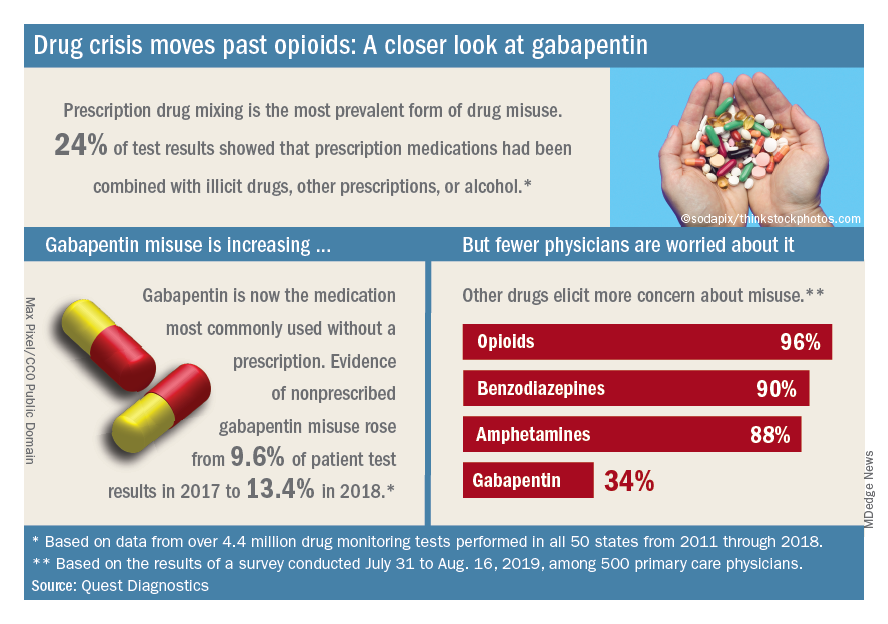
A majority (62%) of the physicians surveyed also said that the opioid crisis will evolve into a new prescription drug crisis, and even more (72%) think that patients with chronic pain will use illicit drugs if they cannot get prescription opioids. Evidence from the drug test dataset suggests that “misuse of nonprescribed fentanyl and nonprescribed gabapentin warrant[s] a closer look,” the report said. In the survey, 78% of respondents reported prescribing gabapentin as an alternative to opioids for patients with chronic pain.
Those two drugs, along with alcohol, are the only three drug groups for which misuse increased from 2017 to 2018, and both are frequently involved in drug mixing, which is the most common form of misuse. Gabapentin went from 9.6% of all nonprescribed misuse in 2017 to 13.4% in 2018, an increase of 40%. Nonprescribed fentanyl was found in 64% of test results that were positive for heroin and 24% that were positive for cocaine, the Quest data showed.
The survey results, however, suggest that gabapentin is not on physicians’ radar, as only 34% said that they were concerned about its misuse, compared with 96% for opioids and 90% for benzodiazepines, according to the report.
“While gabapentin may not have opioids’ addictive potential, it can exaggerate euphoric effects when combined with opioids or anxiety medications. This drug mixing is dangerous,” said report coauthor Jeffrey Gudin, MD, senior medical advisor, prescription drug monitoring, for Quest Diagnostics.
The survey was conducted online among family physicians, general practitioners, and internists from July 31 to Aug. 16, 2019, by the Harris Poll on behalf of Quest and Center for Addiction. The test result data were collected in all 50 states and Washington, D.C., from 2011 to 2018, and results from drug rehabilitation clinics and addiction specialists were excluded from the analysis, so actual misuse rates are probably higher than reported.
Almost three-quarters of primary care physicians believe that their patients will take their controlled medications as prescribed, but more than half of drug-monitoring lab tests show signs of misuse, according to a new report from Quest Diagnostics.
“ and may miss some of the drug misuse risks affecting their patients,” report coauthor Harvey W. Kaufman, MD, Quest’s senior medical director, said in a written statement.
Analysis of more than 4.4 million drug-monitoring tests showed that 51% involved an inconsistent result, such as detection of a nonprescribed drug or nondetection of a drug that was prescribed. The report also included a survey of 500 primary care physicians, of whom 72% said they trusted their patents to properly use opioids and other controlled substances.
“The intersection of these two data sets reveals, for the first time, the contrast between physician expectations about patient drug use and the evolution of the drug epidemic and actual patient behavior, as revealed by objective lab data, amid a national drug crisis that claimed an estimated 68,500 lives last year,” the report said.
A majority (62%) of the physicians surveyed also said that the opioid crisis will evolve into a new prescription drug crisis, and even more (72%) think that patients with chronic pain will use illicit drugs if they cannot get prescription opioids. Evidence from the drug test dataset suggests that “misuse of nonprescribed fentanyl and nonprescribed gabapentin warrant[s] a closer look,” the report said. In the survey, 78% of respondents reported prescribing gabapentin as an alternative to opioids for patients with chronic pain.
Those two drugs, along with alcohol, are the only three drug groups for which misuse increased from 2017 to 2018, and both are frequently involved in drug mixing, which is the most common form of misuse. Gabapentin went from 9.6% of all nonprescribed misuse in 2017 to 13.4% in 2018, an increase of 40%. Nonprescribed fentanyl was found in 64% of test results that were positive for heroin and 24% that were positive for cocaine, the Quest data showed.
The survey results, however, suggest that gabapentin is not on physicians’ radar, as only 34% said that they were concerned about its misuse, compared with 96% for opioids and 90% for benzodiazepines, according to the report.
“While gabapentin may not have opioids’ addictive potential, it can exaggerate euphoric effects when combined with opioids or anxiety medications. This drug mixing is dangerous,” said report coauthor Jeffrey Gudin, MD, senior medical advisor, prescription drug monitoring, for Quest Diagnostics.
The survey was conducted online among family physicians, general practitioners, and internists from July 31 to Aug. 16, 2019, by the Harris Poll on behalf of Quest and Center for Addiction. The test result data were collected in all 50 states and Washington, D.C., from 2011 to 2018, and results from drug rehabilitation clinics and addiction specialists were excluded from the analysis, so actual misuse rates are probably higher than reported.
America’s peas problem and freshly grated tattoos
Hold the peas, pass the spiders
There’s an old saying – and by “old,” we mean that we just made it up – in the medical-humor business: When in doubt, find a survey.

Some group is always surveying somebody about something and coming up with a wacky assumption or misguided opinion held by a minority of the respondents. It’s a classic go-to move for the desperate writer.
And look, here’s one now. According to a recent survey conducted by OnePoll for VeggieTracker.com, 83% of Americans like – and this makes us feel oogie just thinking about it – peas. Blecch. Even more amazing? About a quarter of the 2,000 respondents said that they had never even eaten a vegetable. That might explain a good bit of the country’s obesity problem.
And then there’s the survey that OnePoll did for Mattress Advisor, which questioned 2,000 Americans about sleep science and myth. Among the results: 23% believe that an hour of sleep before midnight is worth more than two after, 25% think that sleeping on your left side helps digestion, and 15% said that circadian rhythm was the proper term for the body’s blood flow.
Our favorite, though, was the myth that you swallow eight spiders a year while you sleep. We’ve never heard that one, but 20% of respondents thought it was true.
We’re glad that it’s just a myth, but even spiders would be better than peas.
The politics of pretty
It’s an age-old political question: Did a majority of U.S. voters back Martin Van Buren in the 1836 presidential election because he pushed the popular policies of his boss, fellow Democrat Andrew Jackson? Or was it the suave sideburns of Jackson’s stylish vice president that trumped (see what we did there?) the clean-shaven Whig William Henry Harrison?

The evidence-backed answer: Probably both.
Researchers at the University of Freiburg in Germany conducted two style-or-substance studies to determine how much political advantage a pretty face confers. The first study examined the impact attractive looks and the ability to appear competent riding atop an Abrams tank (ooooh, sorry, Dukakis fans), er, the ability to look competent in photos had in Germany’s 2017 Bundestag elections.
The study’s precise answer: 3.8 percentage points. That’s the polling advantage candidates gained by being judged more attractive than their competitors. Admittedly, the researchers also found it helped to be more than just a pretty face – the unaesthetic quality of relative competence also played a positive role.
The second study took the same approach to U.S. House of Representatives races. In that research beauty contest, America’s aesthetically attuned voters delivered up to an 11-point advantage to the prettiest person.
Now, as anyone will tell you who’s watched congressional TMZ – a.k.a. C-SPAN – beauty in politics is a relative matter. As one of our colleagues noted after visiting the Bureau of LOTME’s Washington hometown and seeing several political stars up close and personal: “Washington is Hollywood for the not so good lookin’.”
Grate idea, or greatest idea?
Tattoo removal is a big part of business for quite a few dermatologists out there. In 2011, more than 100,000 tattoo removal procedures were performed, according to the American Society for Dermatologic Surgery.

But dermatologists beware, because an Argentinian man may have found a far cheaper method for getting rid of unwanted tattoos, one that would make all those fancy lasers obsolete.
And it all hinges on a humble kitchen utensil: the cheese grater.
The story began when our intrepid hero found out that he wouldn’t be able to work as airport police with a visible tattoo. Simultaneously, he decided that the detail on the week-old tattoo was not up to his standard. So, the man took to the Internet, searching for a cheap way to remove the offending mark. He tried a pumice stone but had no luck. So, next came the cheese grater.
And credit where credit’s due – he did get rid of the tattoo. He washed the wound, applied disinfectant, and everything was good.
Okay, he MAY have required a trip to his local emergency department because he needed a tetanus shot. And while the man isn’t sorry that he did what he did, he wouldn’t recommend the procedure to anyone else.
But consider yourselves on notice, dermatologists. There are always new ways to innovate.

Hold the peas, pass the spiders
There’s an old saying – and by “old,” we mean that we just made it up – in the medical-humor business: When in doubt, find a survey.
Some group is always surveying somebody about something and coming up with a wacky assumption or misguided opinion held by a minority of the respondents. It’s a classic go-to move for the desperate writer.
And look, here’s one now. According to a recent survey conducted by OnePoll for VeggieTracker.com, 83% of Americans like – and this makes us feel oogie just thinking about it – peas. Blecch. Even more amazing? About a quarter of the 2,000 respondents said that they had never even eaten a vegetable. That might explain a good bit of the country’s obesity problem.
And then there’s the survey that OnePoll did for Mattress Advisor, which questioned 2,000 Americans about sleep science and myth. Among the results: 23% believe that an hour of sleep before midnight is worth more than two after, 25% think that sleeping on your left side helps digestion, and 15% said that circadian rhythm was the proper term for the body’s blood flow.
Our favorite, though, was the myth that you swallow eight spiders a year while you sleep. We’ve never heard that one, but 20% of respondents thought it was true.
We’re glad that it’s just a myth, but even spiders would be better than peas.
The politics of pretty
It’s an age-old political question: Did a majority of U.S. voters back Martin Van Buren in the 1836 presidential election because he pushed the popular policies of his boss, fellow Democrat Andrew Jackson? Or was it the suave sideburns of Jackson’s stylish vice president that trumped (see what we did there?) the clean-shaven Whig William Henry Harrison?
The evidence-backed answer: Probably both.
Researchers at the University of Freiburg in Germany conducted two style-or-substance studies to determine how much political advantage a pretty face confers. The first study examined the impact attractive looks and the ability to appear competent riding atop an Abrams tank (ooooh, sorry, Dukakis fans), er, the ability to look competent in photos had in Germany’s 2017 Bundestag elections.
The study’s precise answer: 3.8 percentage points. That’s the polling advantage candidates gained by being judged more attractive than their competitors. Admittedly, the researchers also found it helped to be more than just a pretty face – the unaesthetic quality of relative competence also played a positive role.
The second study took the same approach to U.S. House of Representatives races. In that research beauty contest, America’s aesthetically attuned voters delivered up to an 11-point advantage to the prettiest person.
Now, as anyone will tell you who’s watched congressional TMZ – a.k.a. C-SPAN – beauty in politics is a relative matter. As one of our colleagues noted after visiting the Bureau of LOTME’s Washington hometown and seeing several political stars up close and personal: “Washington is Hollywood for the not so good lookin’.”
Grate idea, or greatest idea?
Tattoo removal is a big part of business for quite a few dermatologists out there. In 2011, more than 100,000 tattoo removal procedures were performed, according to the American Society for Dermatologic Surgery.
But dermatologists beware, because an Argentinian man may have found a far cheaper method for getting rid of unwanted tattoos, one that would make all those fancy lasers obsolete.
And it all hinges on a humble kitchen utensil: the cheese grater.
The story began when our intrepid hero found out that he wouldn’t be able to work as airport police with a visible tattoo. Simultaneously, he decided that the detail on the week-old tattoo was not up to his standard. So, the man took to the Internet, searching for a cheap way to remove the offending mark. He tried a pumice stone but had no luck. So, next came the cheese grater.
And credit where credit’s due – he did get rid of the tattoo. He washed the wound, applied disinfectant, and everything was good.
Okay, he MAY have required a trip to his local emergency department because he needed a tetanus shot. And while the man isn’t sorry that he did what he did, he wouldn’t recommend the procedure to anyone else.
But consider yourselves on notice, dermatologists. There are always new ways to innovate.
Uninsured population is big in Texas
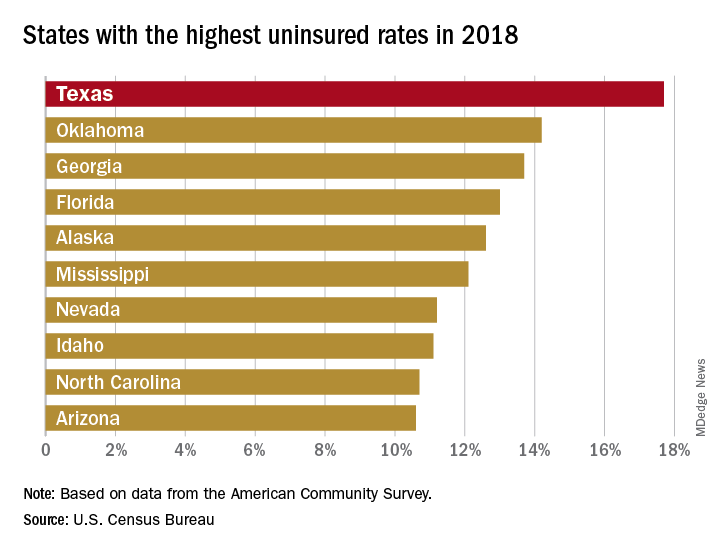
There were just over 5 million uninsured people in the Lone Star State last year, representing an increase from 17.3% of the total population in 2017 to 17.7%, and that works out to an additional 186,000 residents with no health care coverage, the Census Bureau said in a recent report.
That 17.7% rate for 2018 gave Texas the highest proportion of uninsured population, putting it ahead of Oklahoma (14.2%), Georgia (13.7%), Florida (13.0%), Alaska (12.6%), and Mississippi (12.1%). Oklahoma had basically no change from 2017, while the other three each had a small but nonsignificant increase. Nationally, the rate of uninsured population went from 7.9% in 2017 to 8.5% in 2018, the Census Bureau investigators said.
On the other end of the coverage spectrum was Massachusetts, where only 2.8% of the population, or about 189,000 people, lacked health insurance in 2018. Washington, D.C., was next with an uninsured rate of 3.2%, followed by Vermont (4.0%), Hawaii (4.1%), Rhode Island (4.1%), and Minnesota (4.4%), they said, based on data from the American Community Survey.
A separate analysis of Census Bureau data by the personal finance website WalletHub showed that states that expanded Medicaid along with their Affordable Care Act implementation had an average uninsured rate of 7.0% in 2018, compared with 11.1% for states that did not expand eligibility.
All 50 states were in negative territory when changes in uninsured rates were calculated over a longer time period, 2010-2018, as the national rate fell by 6.6%. The largest drops among the states came in Nevada (–11.4%), California (–11.3%), Oregon (–10.1%), and New Mexico (–10.1%), while Massachusetts (–1.7%), Maine (–2.1%), and North Dakota (–2.5%) had the smallest declines, WalletHub reported.
Readmission burden high for those with sickle cell disease
, according to the Agency for Healthcare Research and Quality.
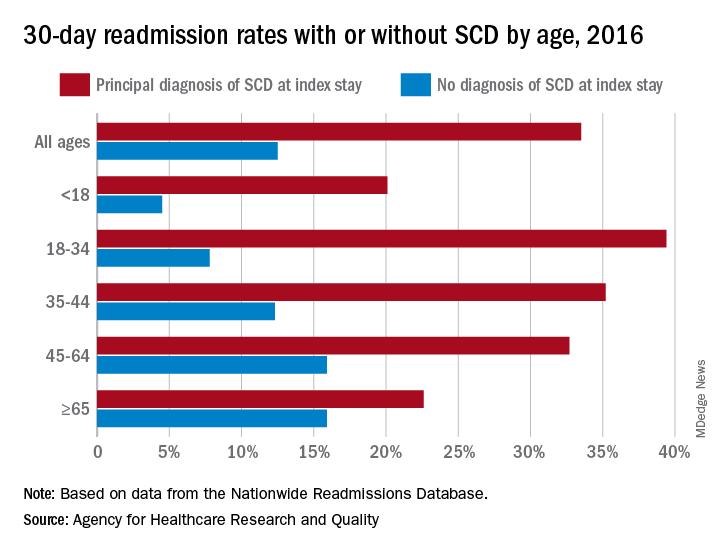
The 30-day all-cause readmission rate for index stays with a principal diagnosis of SCD was 33.5% in 2016, compared with 12.5% for non-SCD hospital stays. Patients with a secondary diagnosis of SCD had readmission rates of 32.9% with a pain crisis and 21.0% without one, and the overall readmission rate for an index stay with any SCD diagnosis was 31.1%, Kathryn R. Fingar, PhD, MPH, of IBM Watson Health, Sacramento, Calif., and associates wrote in an AHRQ statistical brief.
When age is factored in, the readmission gap between a principal SCD diagnosis and non-SCD becomes even greater – and smaller. The difference was greatest for patients aged 18-34 years – 39.4% with a principal diagnosis of SCD versus 7.8% without any SCD – and then narrowed as patients got older. For those aged 65 years and older, the rates were 22.6% with a principal diagnosis of SCD and 15.9% without, the investigators reported.
The approximately 100,000 Americans with SCD accounted for 134,000 admissions in 2016, and more than three-quarters of those stays involved a pain crisis. A principal diagnosis of SCD was recorded for almost 96,000 of those visits, and nearly all (96%) of those stays involved a pain crisis. For those with a secondary diagnosis of SCD, the most common reasons for hospitalization were diseases of the respiratory system (14.3% of those stays) and infectious and parasitic diseases (13.2%).
Patients with SCD were more likely than non-SCD patients to be admitted from the ED (79.6% vs. 51.3%), and they were more likely to discharged against medical advice (4.1% vs. 1.2%). Among those who left the hospital against medical advice, patients with SCD were much more likely to be readmitted than those without SCD (46.6% vs. 26.5%), based on data from the AHRQ’s Nationwide Readmissions Database.
Improved treatment of complications has “reduced mortality rates so that nearly 95% of individuals born with SCD in the United States reach 18 years of age [but] limited knowledge of SCD treatment guidelines among healthcare professionals continues to pose a barrier to effective patient-provider relationships, and this barrier contributes to lower quality of life,” Dr. Fingar and associates wrote.
, according to the Agency for Healthcare Research and Quality.
The 30-day all-cause readmission rate for index stays with a principal diagnosis of SCD was 33.5% in 2016, compared with 12.5% for non-SCD hospital stays. Patients with a secondary diagnosis of SCD had readmission rates of 32.9% with a pain crisis and 21.0% without one, and the overall readmission rate for an index stay with any SCD diagnosis was 31.1%, Kathryn R. Fingar, PhD, MPH, of IBM Watson Health, Sacramento, Calif., and associates wrote in an AHRQ statistical brief.
When age is factored in, the readmission gap between a principal SCD diagnosis and non-SCD becomes even greater – and smaller. The difference was greatest for patients aged 18-34 years – 39.4% with a principal diagnosis of SCD versus 7.8% without any SCD – and then narrowed as patients got older. For those aged 65 years and older, the rates were 22.6% with a principal diagnosis of SCD and 15.9% without, the investigators reported.
The approximately 100,000 Americans with SCD accounted for 134,000 admissions in 2016, and more than three-quarters of those stays involved a pain crisis. A principal diagnosis of SCD was recorded for almost 96,000 of those visits, and nearly all (96%) of those stays involved a pain crisis. For those with a secondary diagnosis of SCD, the most common reasons for hospitalization were diseases of the respiratory system (14.3% of those stays) and infectious and parasitic diseases (13.2%).
Patients with SCD were more likely than non-SCD patients to be admitted from the ED (79.6% vs. 51.3%), and they were more likely to discharged against medical advice (4.1% vs. 1.2%). Among those who left the hospital against medical advice, patients with SCD were much more likely to be readmitted than those without SCD (46.6% vs. 26.5%), based on data from the AHRQ’s Nationwide Readmissions Database.
Improved treatment of complications has “reduced mortality rates so that nearly 95% of individuals born with SCD in the United States reach 18 years of age [but] limited knowledge of SCD treatment guidelines among healthcare professionals continues to pose a barrier to effective patient-provider relationships, and this barrier contributes to lower quality of life,” Dr. Fingar and associates wrote.
BP screening nearly universal among Medicare enrollees
and just under 90% saw a physician during the year, according to new data released by the Centers for Medicare & Medicaid Services.

The latest edition of Medicare Beneficiaries at a Glance takes a look at some of the services provided in 2017, and BP checks were high on the list, with 96% of enrollees getting screened. BP was also prominent on another list featured in the Medicare snapshot for 2017, as hypertension was the most common chronic condition among beneficiaries with a prevalence of 58%, the CMS said.
A second glance at the report shows that 41% of enrollees had high cholesterol that year, making it the next-most common chronic condition, with arthritis third at 33%, the CMS said. Diabetes was fourth and heart disease was fifth, but rounding gives them the same prevalence of 27%.
and just under 90% saw a physician during the year, according to new data released by the Centers for Medicare & Medicaid Services.
The latest edition of Medicare Beneficiaries at a Glance takes a look at some of the services provided in 2017, and BP checks were high on the list, with 96% of enrollees getting screened. BP was also prominent on another list featured in the Medicare snapshot for 2017, as hypertension was the most common chronic condition among beneficiaries with a prevalence of 58%, the CMS said.
A second glance at the report shows that 41% of enrollees had high cholesterol that year, making it the next-most common chronic condition, with arthritis third at 33%, the CMS said. Diabetes was fourth and heart disease was fifth, but rounding gives them the same prevalence of 27%.
Influenza: U.S. activity was low this summer
Influenza activity in the United States was typically low over the summer months, with influenza A(H3N2) viruses predominating, according to the Centers for Disease Control and Prevention.
From May 19 to Sept. 28, 2019, weekly flu activity – measured by the percentage of outpatient visits to health care professionals for influenza-like illness (ILI) – was below the national baseline of 2.2%, ranging from 0.7% to 1.4%. Since mid-August, however, when the rate was last 0.7%, it has been climbing slowly but steadily and was up to 1.3% for the week ending Sept. 28, CDC data show.
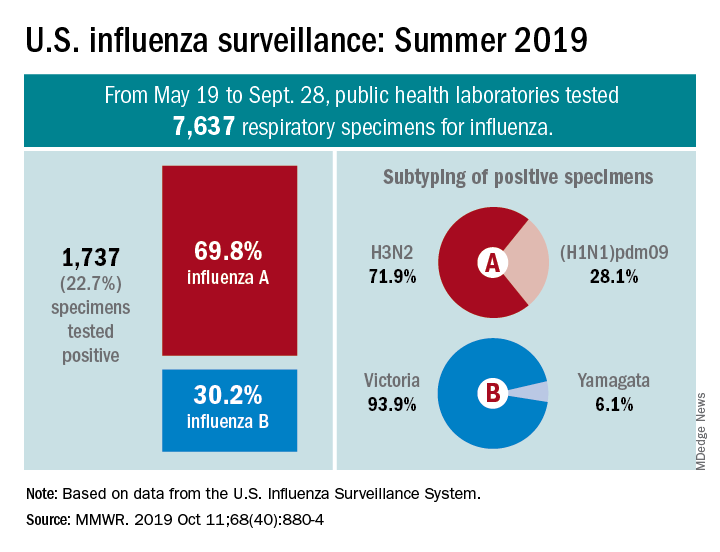
The various public health laboratories of the U.S. Influenza Surveillance System tested over 7,600 respiratory samples from May 19 to Sept. 28, and 22.7% were positive for influenza viruses, Scott Epperson, DVM, and associates at the CDC’s influenza division said Oct. 10 in the MMWR.
Of the 1,737 samples found to be positive, 69.8% were influenza A and 30.2% were influenza B. The subtype split among specimens positive for Influenza A was 71.9% A(H3N2) and 28.1% A(H1N1)pdm09, while the samples positive for influenza B went 93.9% B/Victoria and 6.1% B/Yamagata, they reported.
Over the same time period in the Southern Hemisphere, “seasonal influenza viruses circulated widely, with influenza A(H3) predominating in many regions; however, influenza A(H1N1)pdm09 and influenza B viruses were predominant in some countries,” the CDC investigators noted.
They also reported the World Health Organization recommendations for the Southern Hemisphere’s 2020 flu vaccines. Components of the egg-based trivalent vaccine are an A/Brisbane/02/2018(H1N1)pdm09-like virus, an A/South Australia/34/2019(H3N2)-like virus, and a B/Washington/02/2019-like virus(B/Victoria lineage). The recommended quadrivalent vaccine adds a B/Phuket/3073/2013-like virus(B/Yamagata lineage), they wrote.
“It is too early in the season to know which viruses will circulate in the United States later this fall and winter or how severe the season might be; however, regardless of what is circulating, the best protection against influenza is an influenza vaccination,” Dr. Epperson and associates wrote.
SOURCE: Epperson S et al. MMWR. 2019 Oct 11;68(40):880-4.
Influenza activity in the United States was typically low over the summer months, with influenza A(H3N2) viruses predominating, according to the Centers for Disease Control and Prevention.
From May 19 to Sept. 28, 2019, weekly flu activity – measured by the percentage of outpatient visits to health care professionals for influenza-like illness (ILI) – was below the national baseline of 2.2%, ranging from 0.7% to 1.4%. Since mid-August, however, when the rate was last 0.7%, it has been climbing slowly but steadily and was up to 1.3% for the week ending Sept. 28, CDC data show.
The various public health laboratories of the U.S. Influenza Surveillance System tested over 7,600 respiratory samples from May 19 to Sept. 28, and 22.7% were positive for influenza viruses, Scott Epperson, DVM, and associates at the CDC’s influenza division said Oct. 10 in the MMWR.
Of the 1,737 samples found to be positive, 69.8% were influenza A and 30.2% were influenza B. The subtype split among specimens positive for Influenza A was 71.9% A(H3N2) and 28.1% A(H1N1)pdm09, while the samples positive for influenza B went 93.9% B/Victoria and 6.1% B/Yamagata, they reported.
Over the same time period in the Southern Hemisphere, “seasonal influenza viruses circulated widely, with influenza A(H3) predominating in many regions; however, influenza A(H1N1)pdm09 and influenza B viruses were predominant in some countries,” the CDC investigators noted.
They also reported the World Health Organization recommendations for the Southern Hemisphere’s 2020 flu vaccines. Components of the egg-based trivalent vaccine are an A/Brisbane/02/2018(H1N1)pdm09-like virus, an A/South Australia/34/2019(H3N2)-like virus, and a B/Washington/02/2019-like virus(B/Victoria lineage). The recommended quadrivalent vaccine adds a B/Phuket/3073/2013-like virus(B/Yamagata lineage), they wrote.
“It is too early in the season to know which viruses will circulate in the United States later this fall and winter or how severe the season might be; however, regardless of what is circulating, the best protection against influenza is an influenza vaccination,” Dr. Epperson and associates wrote.
SOURCE: Epperson S et al. MMWR. 2019 Oct 11;68(40):880-4.
FROM MMWR
Printed meat in space and diesel-pattern baldness
If at first you don’t succeed …
![]()
Dozens of new drugs are approved every year, but for every promising new medication, there are far more that fail to get past the clinical trial stage. The causes can vary: The drug didn’t do enough, it caused too many adverse events, and so on.
DNA topoisomerase inhibitors have been extensively researched as an anticancer agent, but many examples failed their clinical trials. These molecules are flat and made up of neatly stacked columns of electrically conductive rings, and operate by inserting themselves into DNA to stop replication.
That molecular structure is what interested a team of researchers from the University of Illinois at Urbana-Champaign. In research published in Nature Communications, the researchers noted that DNA topoisomerase inhibitors are structured much like organic semiconductors, but with a bonus. Those columns that make up the molecule are linked by hydrogen bonds, which allow bridges to form across the entire molecule, transforming the entire thing into a semiconductor.
That property, along with their easy printability and their high-specificity interactions with biological material, make the inhibitors an excellent candidate for use in biosensors or biotransistors.
A word to the manufacturer of those topoisomerase inhibitors, though, now that we’ve gotten you all excited again: We doubt you’ll be able to charge as much for the molecule. Semiconductors are hardly as glamorous as treating cancer.
Houston, we have a cultivated meat product

The Delmonico brothers didn’t do it. Ronald McDonald didn’t do it. Neil Armstrong never even tried. Same goes for Julia Child.
None of these culinary giants or astronauts ever grew beef in space. That honor belongs to Aleph Farms of Rehovot, Israel. The company, a self-proclaimed “global leader in the cultivated meat industry,” collaborated with 3D Bioprinting Solutions of Moscow and others to produce slaughter-free beef in the Russian segment of the International Space Station in September.
The actual process of growing a steak mimics natural “muscle-tissue regeneration occurring inside the cow’s body” and somehow uses a 3-D bioprinter to assemble “a small-scale muscle tissue.” We don’t really understand it, but the scientists and engineers here at LOTME Co. assure us it makes sense.
But why, you may ask, did they do it on the space station? Think of it as a stand-in for New York City. You know … if you can make it there, you can make it anywhere. We’ll let Didier Toubia, cofounder and CEO of Aleph Farms, explain: “In space, we don’t have 10,000 or 15,000 liter (3962.58 gallon) of water available to produce 1 kilogram (2.205 pounds) of beef.” It’s all about sustainable food production.
The next phase of the project, we think, is going to be even more interesting. For a proper fine dining experience in space, they’re going to grow a snooty French waiter to serve cultivated steak to the astronauts.
Pollution Hair Club for Men

By now, most people are well aware that air pollution is linked with cancer. And chronic obstructive pulmonary disease. And asthma. And cardiovascular disease. And Germanic automotive emissions system cheating. Yawn.
But there’s a newly revealed association sure to make even the most jaded health news consumer’s hair stand on end: Exposure to pollution’s particulate matter is linked to ... hair loss.
Researchers from the Future Science Research Center in South Korea exposed cells from the base of human hair follicles to assorted concentrations of diesel and dust particulates. After 24 hours, the pollutants had suppressed production of beta-catenin, the primary protein crucial to the maintenance of George Clooney’s luxurious mane. And three other proteins supporting hair growth and hair retention also went AWOL in the presence of pollutants. Plus more particulate matter meant fewer hair-restoring proteins.
Diesel particulates and baldness? It all makes so much more sense now. Given the pollutant-rich Big Apple air in which lollipop-loving TV detective Theo Kojak’s smooth pate was steeped, is it any wonder he was famously so follicularly challenged? The Clean Air Act – who loves ya, baby?
If at first you don’t succeed …
![]()
Dozens of new drugs are approved every year, but for every promising new medication, there are far more that fail to get past the clinical trial stage. The causes can vary: The drug didn’t do enough, it caused too many adverse events, and so on.
DNA topoisomerase inhibitors have been extensively researched as an anticancer agent, but many examples failed their clinical trials. These molecules are flat and made up of neatly stacked columns of electrically conductive rings, and operate by inserting themselves into DNA to stop replication.
That molecular structure is what interested a team of researchers from the University of Illinois at Urbana-Champaign. In research published in Nature Communications, the researchers noted that DNA topoisomerase inhibitors are structured much like organic semiconductors, but with a bonus. Those columns that make up the molecule are linked by hydrogen bonds, which allow bridges to form across the entire molecule, transforming the entire thing into a semiconductor.
That property, along with their easy printability and their high-specificity interactions with biological material, make the inhibitors an excellent candidate for use in biosensors or biotransistors.
A word to the manufacturer of those topoisomerase inhibitors, though, now that we’ve gotten you all excited again: We doubt you’ll be able to charge as much for the molecule. Semiconductors are hardly as glamorous as treating cancer.
Houston, we have a cultivated meat product
The Delmonico brothers didn’t do it. Ronald McDonald didn’t do it. Neil Armstrong never even tried. Same goes for Julia Child.
None of these culinary giants or astronauts ever grew beef in space. That honor belongs to Aleph Farms of Rehovot, Israel. The company, a self-proclaimed “global leader in the cultivated meat industry,” collaborated with 3D Bioprinting Solutions of Moscow and others to produce slaughter-free beef in the Russian segment of the International Space Station in September.
The actual process of growing a steak mimics natural “muscle-tissue regeneration occurring inside the cow’s body” and somehow uses a 3-D bioprinter to assemble “a small-scale muscle tissue.” We don’t really understand it, but the scientists and engineers here at LOTME Co. assure us it makes sense.
But why, you may ask, did they do it on the space station? Think of it as a stand-in for New York City. You know … if you can make it there, you can make it anywhere. We’ll let Didier Toubia, cofounder and CEO of Aleph Farms, explain: “In space, we don’t have 10,000 or 15,000 liter (3962.58 gallon) of water available to produce 1 kilogram (2.205 pounds) of beef.” It’s all about sustainable food production.
The next phase of the project, we think, is going to be even more interesting. For a proper fine dining experience in space, they’re going to grow a snooty French waiter to serve cultivated steak to the astronauts.
Pollution Hair Club for Men
By now, most people are well aware that air pollution is linked with cancer. And chronic obstructive pulmonary disease. And asthma. And cardiovascular disease. And Germanic automotive emissions system cheating. Yawn.
But there’s a newly revealed association sure to make even the most jaded health news consumer’s hair stand on end: Exposure to pollution’s particulate matter is linked to ... hair loss.
Researchers from the Future Science Research Center in South Korea exposed cells from the base of human hair follicles to assorted concentrations of diesel and dust particulates. After 24 hours, the pollutants had suppressed production of beta-catenin, the primary protein crucial to the maintenance of George Clooney’s luxurious mane. And three other proteins supporting hair growth and hair retention also went AWOL in the presence of pollutants. Plus more particulate matter meant fewer hair-restoring proteins.
Diesel particulates and baldness? It all makes so much more sense now. Given the pollutant-rich Big Apple air in which lollipop-loving TV detective Theo Kojak’s smooth pate was steeped, is it any wonder he was famously so follicularly challenged? The Clean Air Act – who loves ya, baby?
Firearm-related deaths show recent increase
After years of relative stability, firearm-related mortality in the United States rose sharply starting in 2015, according to analysis of a national mortality database.

U.S. firearm mortality was 10.4 per 100,000 person-years during 1999-2014, with the high in that period occurring in 2012 and dropping each of the next 2 years – compared with 11.8 per 100,000 during 2015-2017, an increase of 13.8%, Jason E. Goldstick, PhD, and associates wrote Oct. 8 in Health Affairs.
The majority of the 612,310 firearm deaths over the entire study period were suicides, with the proportion rising slightly from 58.6% in 1999-2014 to 60.0% in 2015-2017. Homicides made up 38.5% of deaths in 1999-2014 and 37.9% in 2015-2017, while the combined share of unintentional and undetermined deaths dropped from 2.9% to 2.1%, the investigators reported.
Dr. Goldstick of the University of Michigan, Ann Arbor, said in a separate written statement.
The geographic broadness can be seen when the change in mortality from 1999-2014 to 2015-2017 was calculated for each locale: 29 states had an increase of more than 20% and only 3 states (California, New York, and Rhode Island) and the District of Columbia had a decrease of at least 12.5%, they said. The data came from the Centers for Disease Control and Prevention’s Wide-ranging Online Data for Epidemiologic Research tool.
The different trends among states and subpopulations make it difficult to offer policy-based interventions. “The epidemiology of firearm violence is complex and varies based on the mechanism of death, demographic group under study, and regionally specific culture, making a one-size-fits-all solution inappropriate,” Dr. Goldstick and associates wrote.
The study was funded mainly by a grant from the National Institute of Child Health and Human Development. The investigators did not provide any information on conflicts of interest.
SOURCE: Goldstick JE et al. Health Aff. 2019;38(10):1646-52.
After years of relative stability, firearm-related mortality in the United States rose sharply starting in 2015, according to analysis of a national mortality database.
U.S. firearm mortality was 10.4 per 100,000 person-years during 1999-2014, with the high in that period occurring in 2012 and dropping each of the next 2 years – compared with 11.8 per 100,000 during 2015-2017, an increase of 13.8%, Jason E. Goldstick, PhD, and associates wrote Oct. 8 in Health Affairs.
The majority of the 612,310 firearm deaths over the entire study period were suicides, with the proportion rising slightly from 58.6% in 1999-2014 to 60.0% in 2015-2017. Homicides made up 38.5% of deaths in 1999-2014 and 37.9% in 2015-2017, while the combined share of unintentional and undetermined deaths dropped from 2.9% to 2.1%, the investigators reported.
Dr. Goldstick of the University of Michigan, Ann Arbor, said in a separate written statement.
The geographic broadness can be seen when the change in mortality from 1999-2014 to 2015-2017 was calculated for each locale: 29 states had an increase of more than 20% and only 3 states (California, New York, and Rhode Island) and the District of Columbia had a decrease of at least 12.5%, they said. The data came from the Centers for Disease Control and Prevention’s Wide-ranging Online Data for Epidemiologic Research tool.
The different trends among states and subpopulations make it difficult to offer policy-based interventions. “The epidemiology of firearm violence is complex and varies based on the mechanism of death, demographic group under study, and regionally specific culture, making a one-size-fits-all solution inappropriate,” Dr. Goldstick and associates wrote.
The study was funded mainly by a grant from the National Institute of Child Health and Human Development. The investigators did not provide any information on conflicts of interest.
SOURCE: Goldstick JE et al. Health Aff. 2019;38(10):1646-52.
FROM HEALTH AFFAIRS