User login
Richard Franki is the associate editor who writes and creates graphs. He started with the company in 1987, when it was known as the International Medical News Group. In his years as a journalist, Richard has worked for Cap Cities/ABC, Disney, Harcourt, Elsevier, Quadrant, Frontline, and Internet Brands. In the 1990s, he was a contributor to the ill-fated Indications column, predecessor of Livin' on the MDedge.
U.S. Measles Cases Reached Postelimination High in 2014
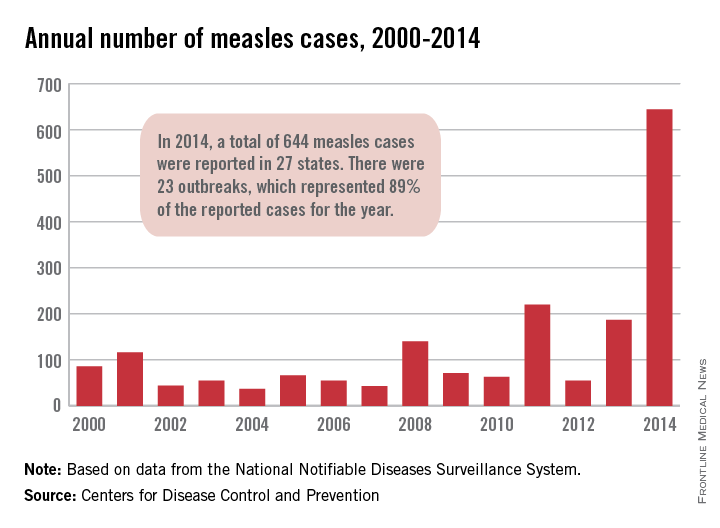
In 2014, the number of measles cases in the United States reached its highest level since the disease was declared eliminated in 2000, the Centers for Disease Control and Prevention reported.
Provisional data show that 644 cases of measles from 27 states in 23 outbreaks were reported to the CDC’s National Center for Immunization and Respiratory Diseases in 2014. The previous postelimination high came in 2011, when 220 cases were reported. The CDC reported that most people that contracted measles were unvaccinated and that travelers with measles continue to bring the infectious disease to the United States.
Meanwhile, 2015 seems to have started off with a bang as California officials have confirmed 59 cases of measles in the state since the end of 2014. Of those cases, “42 have been linked to an initial exposure in December at Disneyland or Disney California Adventure Park in Anaheim,” the California Department of Public Health said in a statement. Measles cases with epidemiologic links to those in Disney include ones in Arizona, Colorado, Mexico, Nebraska, Oregon, Utah, and Washington.
U.S. measles cases reached postelimination high in 2014
In 2014, the number of measles cases in the United States reached its highest level since the disease was declared eliminated in 2000, the Centers for Disease Control and Prevention reported.
Provisional data show that 644 cases of measles from 27 states in 23 outbreaks were reported to the CDC’s National Center for Immunization and Respiratory Diseases in 2014. The previous postelimination high came in 2011, when 220 cases were reported. The CDC reported that most people that contracted measles were unvaccinated and that travelers with measles continue to bring the infectious disease to the United States.
Meanwhile, 2015 seems to have started off with a bang as California officials have confirmed 59 cases of measles in the state since the end of 2014. Of those cases, “42 have been linked to an initial exposure in December at Disneyland or Disney California Adventure Park in Anaheim,” the California Department of Public Health said in a statement. Measles cases with epidemiologic links to those in Disney include ones in Arizona, Colorado, Mexico, Nebraska, Oregon, Utah, and Washington.

Residents looking to work in larger cities
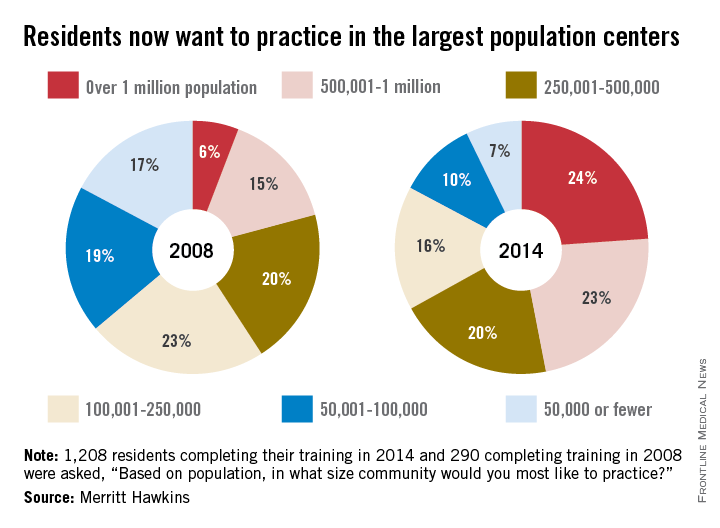
Since 2008, residents’ preference for their future practice location has shifted from smaller cities and rural areas to large population centers, according to findings reported by physician recruitment firm Merritt Hawkins.
In a survey of residents who completed their training in 2014, 24% said that they wanted to practice in a community with a population of more than 1 million, compared with 6% in 2008, while 23% of residents chose the next-highest level of population – 500,001 to 1 million – compared with 15% in 2008, according to Merritt Hawkins.

As for the smaller communities, residents who wanted to practice in a area of 50,000 or fewer dropped from 17% in 2008 to 7% in 2014. Support for communities of 50,001-100,000 fell from 19% in 2008 to 10% in 2014, the company said. Only 1% of residents wanted to practice in a community of 10,000 people or fewer in 2014.
Residents’ reservations about practicing in rural areas more often are related to their “concerns about being on a clinical ‘island’ without specialty support, information technology, and other resources than they may be about the amenities of rural communities,” Merritt Hawkins said in its analysis of the 1,208 survey responses.
Since 2008, residents’ preference for their future practice location has shifted from smaller cities and rural areas to large population centers, according to findings reported by physician recruitment firm Merritt Hawkins.
In a survey of residents who completed their training in 2014, 24% said that they wanted to practice in a community with a population of more than 1 million, compared with 6% in 2008, while 23% of residents chose the next-highest level of population – 500,001 to 1 million – compared with 15% in 2008, according to Merritt Hawkins.
As for the smaller communities, residents who wanted to practice in a area of 50,000 or fewer dropped from 17% in 2008 to 7% in 2014. Support for communities of 50,001-100,000 fell from 19% in 2008 to 10% in 2014, the company said. Only 1% of residents wanted to practice in a community of 10,000 people or fewer in 2014.
Residents’ reservations about practicing in rural areas more often are related to their “concerns about being on a clinical ‘island’ without specialty support, information technology, and other resources than they may be about the amenities of rural communities,” Merritt Hawkins said in its analysis of the 1,208 survey responses.
Annual Costs of Psoriasis Top $112 Billion
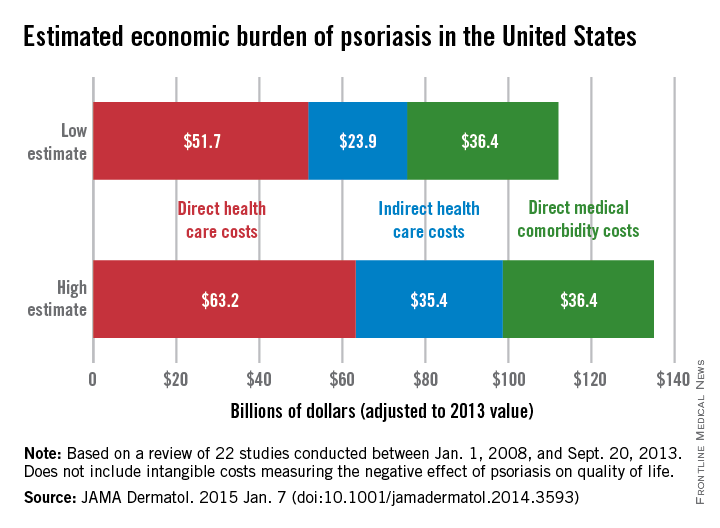
The total economic burden of psoriasis in the United States is at least $112 billion per year, and possibly as high as $135 billion, investigators estimated in a study published Jan. 7 in JAMA Dermatology.
Dr. Elizabeth A. Brezinski of the University of California, Davis, in Sacramento, and her associates, reviewed 22 studies conducted between Jan. 1, 2008, and Sept. 20, 2013, adjusting the results to 2013 dollars.

Estimates for the direct medical cost of psoriasis care ranged from $51.7 billion to $63.2 billion per year. Indirect costs from absenteeism or working while sick contributed another $23.9-$35.4 billion, with comorbidity costs estimated at $36.4 billion annually (JAMA Dermatol. 2014 Jan. 7 [doi:10.1001/jamadermatol.2014.3593]).
Intangible costs on quality of life, which were not included in the annual figures, were estimated to be $85.1 billion over the lifetimes of the psoriasis patient population (7.4 million as of 2013), they said.
“Defining the economic burden of psoriasis from a societal perspective is the foundation for innovating and providing access to cost-effective therapies that will result in improved patient outcomes,” Dr. Brezinski and her coauthors wrote.
One of the researchers reported serving as an investigator for, or consultant to, AbbVie, Amgen, Celgene, Janssen, Lilly, Merck, Pfizer, and UCB. No other disclosures were reported.
The total economic burden of psoriasis in the United States is at least $112 billion per year, and possibly as high as $135 billion, investigators estimated in a study published Jan. 7 in JAMA Dermatology.
Dr. Elizabeth A. Brezinski of the University of California, Davis, in Sacramento, and her associates, reviewed 22 studies conducted between Jan. 1, 2008, and Sept. 20, 2013, adjusting the results to 2013 dollars.
Estimates for the direct medical cost of psoriasis care ranged from $51.7 billion to $63.2 billion per year. Indirect costs from absenteeism or working while sick contributed another $23.9-$35.4 billion, with comorbidity costs estimated at $36.4 billion annually (JAMA Dermatol. 2014 Jan. 7 [doi:10.1001/jamadermatol.2014.3593]).
Intangible costs on quality of life, which were not included in the annual figures, were estimated to be $85.1 billion over the lifetimes of the psoriasis patient population (7.4 million as of 2013), they said.
“Defining the economic burden of psoriasis from a societal perspective is the foundation for innovating and providing access to cost-effective therapies that will result in improved patient outcomes,” Dr. Brezinski and her coauthors wrote.
One of the researchers reported serving as an investigator for, or consultant to, AbbVie, Amgen, Celgene, Janssen, Lilly, Merck, Pfizer, and UCB. No other disclosures were reported.
FROM JAMA DERMATOLOGY
Annual costs of psoriasis costs top $112 billion
The total economic burden of psoriasis in the United States is at least $112 billion per year, and possibly as high as $135 billion, investigators estimated in a study published Jan. 7 in JAMA Dermatology.
Dr. Elizabeth A. Brezinski of the University of California, Davis, in Sacramento, and her associates, reviewed 22 studies conducted between Jan. 1, 2008, and Sept. 20, 2013, adjusting the results to 2013 dollars.

Estimates for the direct medical cost of psoriasis care ranged from $51.7 billion to $63.2 billion per year. Indirect costs from absenteeism or working while sick contributed another $23.9-$35.4 billion, with comorbidity costs estimated at $36.4 billion annually (JAMA Dermatol. 2014 Jan. 7 [doi:10.1001/jamadermatol.2014.3593]).
Intangible costs on quality of life, which were not included in the annual figures, were estimated to be $85.1 billion over the lifetimes of the psoriasis patient population (7.4 million as of 2013), they said.
“Defining the economic burden of psoriasis from a societal perspective is the foundation for innovating and providing access to cost-effective therapies that will result in improved patient outcomes,” Dr. Brezinski and her coauthors wrote.
One of the researchers reported serving as an investigator for, or consultant to, AbbVie, Amgen, Celgene, Janssen, Lilly, Merck, Pfizer, and UCB. No other disclosures were reported.
The total economic burden of psoriasis in the United States is at least $112 billion per year, and possibly as high as $135 billion, investigators estimated in a study published Jan. 7 in JAMA Dermatology.
Dr. Elizabeth A. Brezinski of the University of California, Davis, in Sacramento, and her associates, reviewed 22 studies conducted between Jan. 1, 2008, and Sept. 20, 2013, adjusting the results to 2013 dollars.
Estimates for the direct medical cost of psoriasis care ranged from $51.7 billion to $63.2 billion per year. Indirect costs from absenteeism or working while sick contributed another $23.9-$35.4 billion, with comorbidity costs estimated at $36.4 billion annually (JAMA Dermatol. 2014 Jan. 7 [doi:10.1001/jamadermatol.2014.3593]).
Intangible costs on quality of life, which were not included in the annual figures, were estimated to be $85.1 billion over the lifetimes of the psoriasis patient population (7.4 million as of 2013), they said.
“Defining the economic burden of psoriasis from a societal perspective is the foundation for innovating and providing access to cost-effective therapies that will result in improved patient outcomes,” Dr. Brezinski and her coauthors wrote.
One of the researchers reported serving as an investigator for, or consultant to, AbbVie, Amgen, Celgene, Janssen, Lilly, Merck, Pfizer, and UCB. No other disclosures were reported.
FROM JAMA DERMATOLOGY

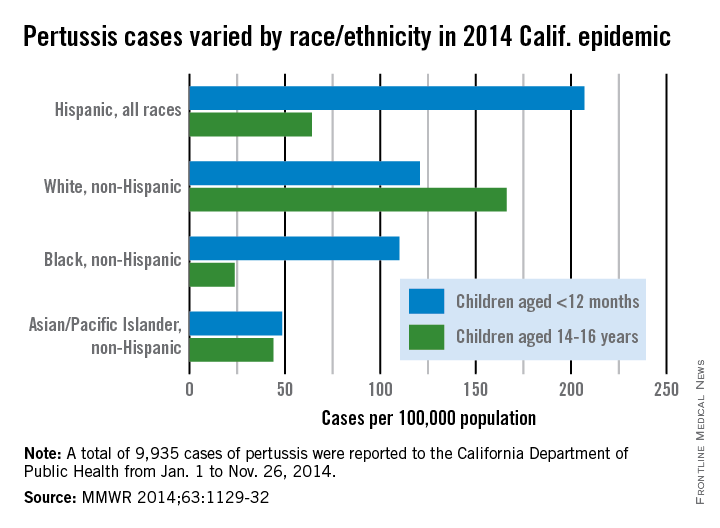
Hispanic infants hit hardest in 2014 pertussis epidemic
In the 2014 pertussis epidemic in California, the burden of disease was highest for Hispanic infants and non-Hispanic white teenagers aged 14-16 years, researchers from the California Department of Public Health reported.
Pertussis incidence was 207 per 100,000 population for Hispanic infants less than 12 months old and 166.2 cases per 100,000 in white 14- to 16-year-olds, compared with an overall incidence of 26 cases per 100,000 for the period from Jan. 1 to Nov. 26, 2014. White, non-Hispanic infants and black infants also had rates over 100 per 100,000, noted Kathleen Winter and her associates of the California Department of Public Health (MMWR 2014;63:1129-32).
|
“The peak age of disease incidence beyond infancy increased to age 14-16 years in 2014, compared with the peak among children aged 10 years during” an earlier pertussis epidemic in 2010, they wrote. “Children and teenagers born in the United State since 1997 have only received acellular pertussis vaccine, and the upper age of this cohort correlates with the peak age in incidence during both epidemic years.”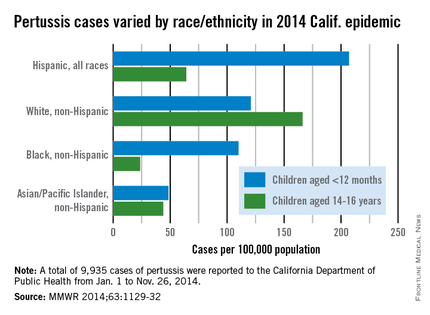
FROM MORBIDITY AND MORTALITY WEEKLY REPORT
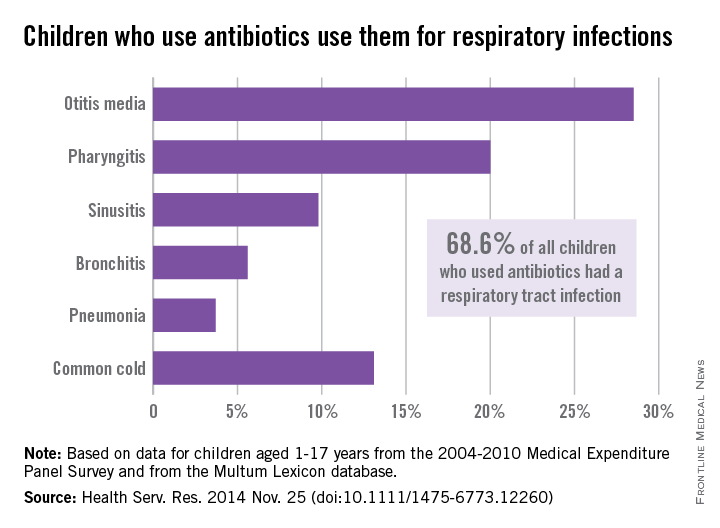
Antibiotic prescribing leaves room for improvement
Despite all efforts to curtail the use of antibiotics, an average of 27.3% of children used an antibiotic each year from 2004 to 2010, according to a study from the Agency for Healthcare Research and Quality.
The most popular indication for antibiotic use – comprising an average of 68.6% annually of all children aged 1-17 years who used an antibiotic – was common respiratory tract infection (RTI), reported Eric M. Sarpong, Ph.D., and G. Edward Miller, Ph.D., who are both with the AHRQ in Rockville, Md.
Among the various RTIs, children who got an antibiotic were most likely to have otitis media (28.5%), followed by pharyngitis (20%). “Furthermore, significant proportions of children used antibiotics to treat three conditions – bronchitis (5.6%), sinusitis (9.8%), and the common cold (13.1%) – for which antibiotics are rarely, or never, indicated,” the investigators wrote (Health Serv. Res. 2014 Nov. 25 [doi:10.1111/1475-6773.12260]).
After controlling for a range of factors, including race/ethnicity, age, insurance status, and location, the findings suggest that “an opportunity, as well as a need, exists for further improvement in the judicious and appropriate prescribing of antibiotics for children,” Dr. Sarpong and Dr. Miller noted.
The analysis used data from the Medical Expenditure Panel Survey Household Component, which was linked to the Multum Lexicon database to assess acquisition of antibiotics.
The investigators said that they had no conflicts of interest regarding the study.
FROM HEALTH SERVICES RESEARCH
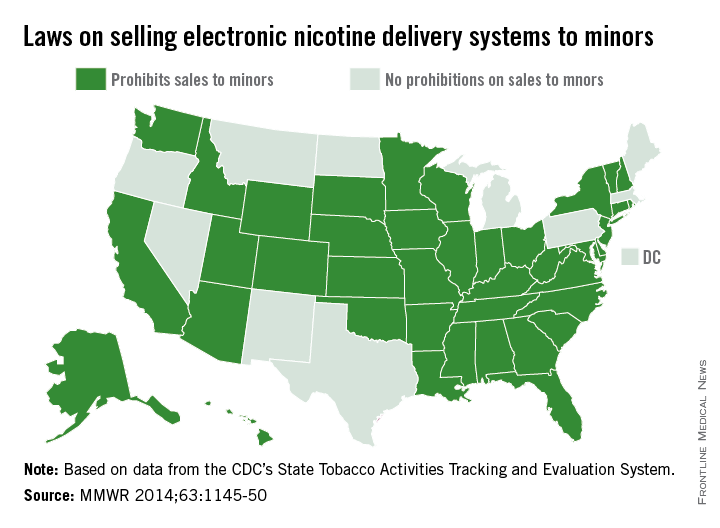
40 states ban e-cigarette sales to minors
Forty states have prohibited the sales of electronic nicotine delivery systems to minors, leaving 16 million children legally able to purchase e-cigarettes and other devices, the Centers for Disease Control and Prevention reported Dec. 12.
Texas, Pennsylvania, and Michigan are the largest of the 11 states (including the District of Columbia) that allow minors to purchase electronic nicotine delivery systems (ENDS), which include – in addition to e-cigarettes – electronic hookahs, electronic cigars, and vape pens, according to the CDC (MMWR 2014;63:1145-50). ENDS are battery-powered devices that deliver aerosolized nicotine and additives to the user, and “use in public indoor areas might passively expose bystanders” to same.
Of the 40 states with laws preventing sales to minors, only two (New Jersey and Utah) have laws prohibiting indoors ENDS use in private work sites, restaurants, and bars. One state, North Dakota, prohibits ENDS use indoors but does not restrict sales to minors, data from the CDC’s State Tobacco Activities Tracking and Evaluation System show.
“The relatively rapid adoption of laws prohibiting ENDS sales to minors, compared with the slow adoption of laws prohibiting ENDS use in public indoor spaces, might be attributable, in part, to the tobacco industry, which has actively advocated for state legislation to prevent minors from purchasing ENDS,” the CDC report noted.
FROM MMWR
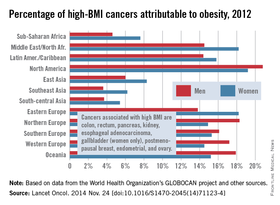
North America has highest rate of obesity-related cancers
For those cancers in which risk is associated with high body mass index, North America has the highest percentage of cancer incidence attributable to obesity, according to a population-based study in the Lancet Oncology.
The investigators considered “only cancers reported by the World Cancer Research Fund as having sufficient evidence to be associated with high BMI”: colon, rectum, pancreas, kidney, esophageal adenocarcinoma, postmenopausal breast, endometrial, ovary, and gallbladder (women only) (Lancet Oncol. 2014 Nov. 26 [doi:10.1016/S1470-2045(14)71123-4]).
The study took into account the time lag between the exposure (high BMI) and outcomes (cancer incidence) by estimating the global population attributable fraction (PAF) of cancer incidence in 2012 attributable to high BMI in 2002. The investigators calculated PAFs using a formula and approach suggested by the Comparative Risk Assessment Collaborative Group.
Of all new cancer cases diagnosed worldwide in 2012, 3.6% or 481,000 of the cases were attributable to obesity, reported Melina Arnold, Ph.D., of the International Agency for Research on Cancer, Lyon, France, and her associates. In North America, 20.8% of high-BMI cancers in men and 19.2% in women were attributable to obesity, Dr. Arnold and her associates estimated. The next-highest of the 12 regions in the study were Northern Europe for men (18.3%) and Eastern Europe and the Middle East/North Africa for women (both 18.2%),
The regions with the lowest estimated rates were Southeast Asia and South-central Asia for both men (3.6% and 3.7%, respectively) and women (6.2% and 5.4%, respectively), according to calculations based on data from the World Health Organization’s GLOBOCAN project and several other sources.
The investigators said that they had no conflicts of interest. The study was funded by the World Cancer Research Fund International.
FROM THE LANCET ONCOLOGY

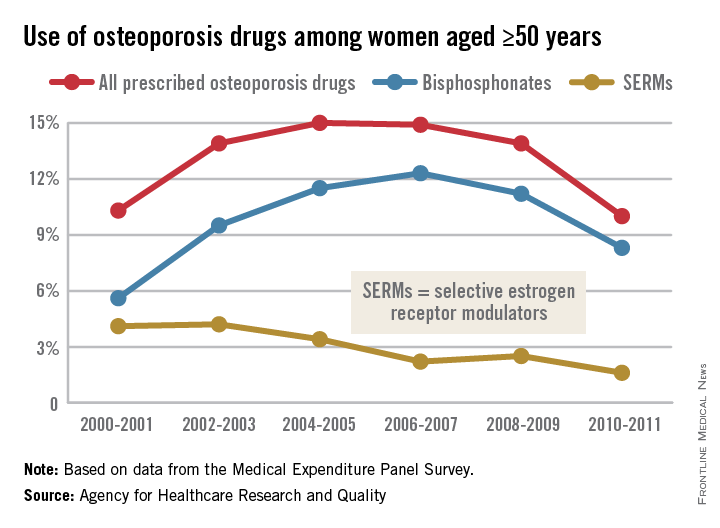
Osteoporosis medication use down in older women
Even as the number of women aged 50 years and older continues to rise, the percentage who are taking osteoporosis medications has fallen by one-third since 2004-2005, the Agency for Healthcare Research and Quality reported.
In 2004-2005, 15% of all women aged 50 years and over were using some form of prescribed osteoporosis drug, but that number had dropped to 10% by 2010-2011, according to data from the Medical Expenditure Panel Survey. The total number of women aged 50 and older increased from 47.8 million to 55.2 million over that same time period.

In 2010-2011, 8.3% of all women aged at least 50 years were using bisphosphonates, down from a high of 12.3% in 2006-2007 but up from 5.6% in 2000-2001. Use of the next most popular form of osteoporosis medication, the selective estrogen receptor modulators (SERMS), declined from 4.2% of all older women in 2002-2003 to 1.6% in 2010-2011, the AHRQ said.
Data for denosumab (Prolia), a fully human monoclonal antibody drug approved for the treatment of osteoporosis, were not available in the MEPS during the analysis period.
Even as the number of women aged 50 years and older continues to rise, the percentage who are taking osteoporosis medications has fallen by one-third since 2004-2005, the Agency for Healthcare Research and Quality reported.
In 2004-2005, 15% of all women aged 50 years and over were using some form of prescribed osteoporosis drug, but that number had dropped to 10% by 2010-2011, according to data from the Medical Expenditure Panel Survey. The total number of women aged 50 and older increased from 47.8 million to 55.2 million over that same time period.
In 2010-2011, 8.3% of all women aged at least 50 years were using bisphosphonates, down from a high of 12.3% in 2006-2007 but up from 5.6% in 2000-2001. Use of the next most popular form of osteoporosis medication, the selective estrogen receptor modulators (SERMS), declined from 4.2% of all older women in 2002-2003 to 1.6% in 2010-2011, the AHRQ said.
Data for denosumab (Prolia), a fully human monoclonal antibody drug approved for the treatment of osteoporosis, were not available in the MEPS during the analysis period.