User login
Richard Franki is the associate editor who writes and creates graphs. He started with the company in 1987, when it was known as the International Medical News Group. In his years as a journalist, Richard has worked for Cap Cities/ABC, Disney, Harcourt, Elsevier, Quadrant, Frontline, and Internet Brands. In the 1990s, he was a contributor to the ill-fated Indications column, predecessor of Livin' on the MDedge.
Future physician shortages could be smaller than originally forecast
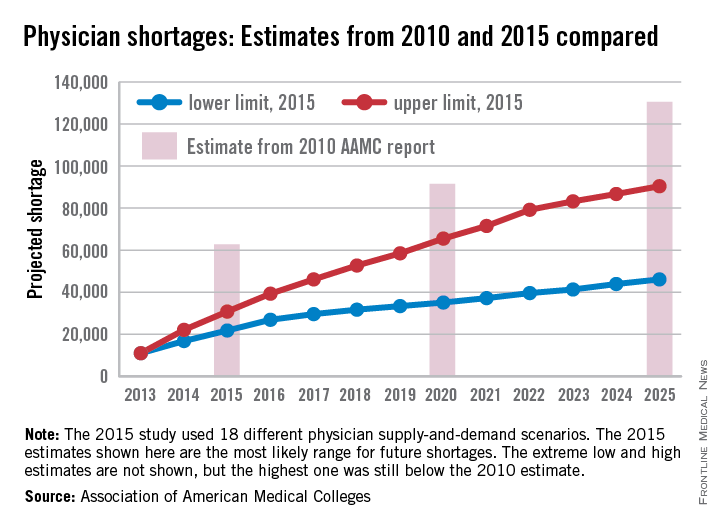
The Association of American Medical Colleges, after taking another look into its crystal ball of supply and demand, reported that the future will have smaller shortages of physicians than it forecast in 2010.
All of the scenarios analyzed in the new AAMC study suggest “that demand for physicians in 2025 will exceed supply by 46,100 to 90,400.” In a 2010 study, the AAMC projected a shortage of 130,600 physicians by 2025.
The differences between the estimates are the result of several factors: the Census Bureau reduced its population projections for 2025 by 10.2 million people, the number of medical school graduates has risen from 27,000 to 29,000 a year, the number of physician extenders is increasing, and new assumptions were made involving the current shortage of psychiatrists that affected future levels of care delivery, the AAMC said.
The new study also included a scenario featuring full implementation of the Affordable Care Act, which is expected to account for 2% of the projected increase in physician demand. That effect will be most noticeable in the surgical specialties, which could see a 3.2% increase in demand as a result of ACA implementation, the report said.

Locum tenens use reached new high in 2014
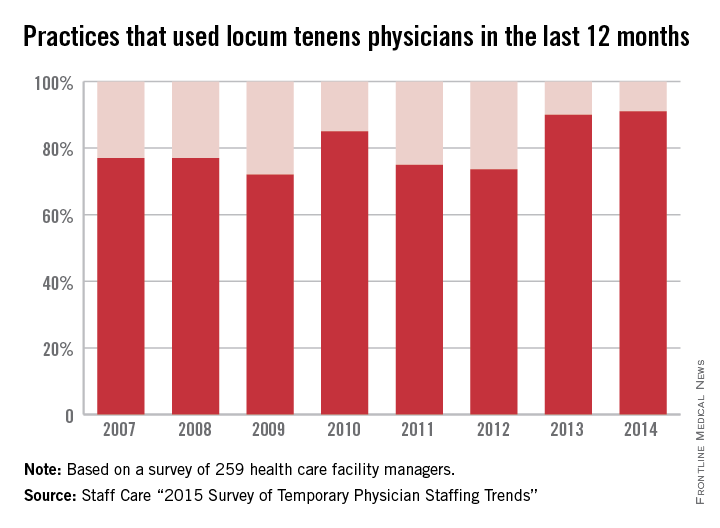
Use of locum tenens physicians reached a new high for the second year in a row in 2014, according to a annual survey by Staff Care, a health care staffing company.
Last year, 91% of the 259 health care facility managers surveyed reported that they used locum tenens physicians in the 12 months before the survey, surpassing the 90% rate for 2013, which had been the previous high. The current survey is the 12th the company has conducted.

The increase appears to be driven by the shortage of physicians and by the move from independent practice to employment, the report noted.
Medical practices were most likely to be looking for primary care physicians to fill their temporary positions, followed by psychiatrists and other mental health specialists and by hospitalists, Staff Care said.
In a separate survey of 2,087 physicians who do locum tenens, Staff Care found that 21% of those physicians went directly to temporary work after completing their residencies, up from 16% in 2013 and 14.3% in 2012.
“Newly trained doctors are seeking alternatives to traditional private practice, and locum tenens offers them an avenue to explore these alternatives,” Sean Ebner, president of Staff Care, said in a written statement. “It’s a way to ‘test drive’ a practice before they buy.”
Use of locum tenens physicians reached a new high for the second year in a row in 2014, according to a annual survey by Staff Care, a health care staffing company.
Last year, 91% of the 259 health care facility managers surveyed reported that they used locum tenens physicians in the 12 months before the survey, surpassing the 90% rate for 2013, which had been the previous high. The current survey is the 12th the company has conducted.
The increase appears to be driven by the shortage of physicians and by the move from independent practice to employment, the report noted.
Medical practices were most likely to be looking for primary care physicians to fill their temporary positions, followed by psychiatrists and other mental health specialists and by hospitalists, Staff Care said.
In a separate survey of 2,087 physicians who do locum tenens, Staff Care found that 21% of those physicians went directly to temporary work after completing their residencies, up from 16% in 2013 and 14.3% in 2012.
“Newly trained doctors are seeking alternatives to traditional private practice, and locum tenens offers them an avenue to explore these alternatives,” Sean Ebner, president of Staff Care, said in a written statement. “It’s a way to ‘test drive’ a practice before they buy.”
Cost of cholesterol test lowest in Tennessee
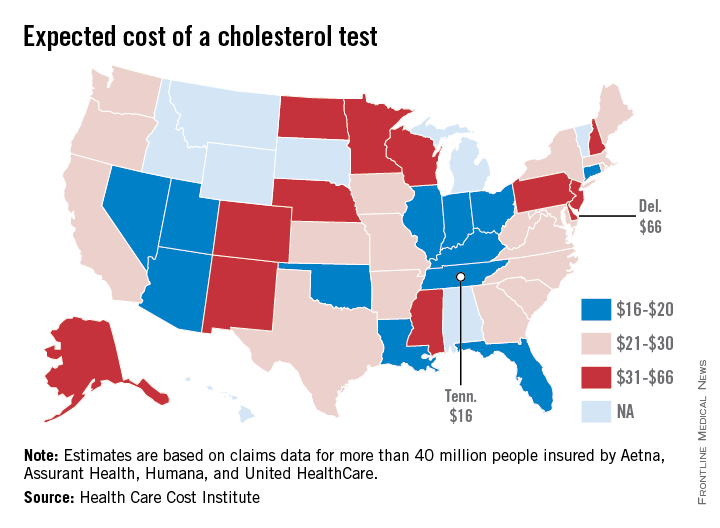
The expected cost for a cholesterol test ranges from a low of $16 in Tennessee to a high of $66 in Delaware, according to data from the Health Care Cost Institute, a nonprofit organization involving several national health insurance companies.

The data on HCCI’s Guroo.com website show that Indiana has the second-lowest expected cost at $17, with Arizona and Oklahoma at $18 for a standard lipid panel. Alaska and Wisconsin had the second-highest average at $59, with New Jersey next at $52, according to analysis of claims data from 40 million persons insured by Aetna, Assurant Health, Humana, and UnitedHealthcare. The national average is $24.
The estimated costs may vary according to a person’s health status, insurance plan, and where the service is provided, the website notes. Cost estimates were not available for eight states.
The expected cost for a cholesterol test ranges from a low of $16 in Tennessee to a high of $66 in Delaware, according to data from the Health Care Cost Institute, a nonprofit organization involving several national health insurance companies.
The data on HCCI’s Guroo.com website show that Indiana has the second-lowest expected cost at $17, with Arizona and Oklahoma at $18 for a standard lipid panel. Alaska and Wisconsin had the second-highest average at $59, with New Jersey next at $52, according to analysis of claims data from 40 million persons insured by Aetna, Assurant Health, Humana, and UnitedHealthcare. The national average is $24.
The estimated costs may vary according to a person’s health status, insurance plan, and where the service is provided, the website notes. Cost estimates were not available for eight states.
Death Rates Rising for Liver Cancer, Falling for Colorectal Cancer
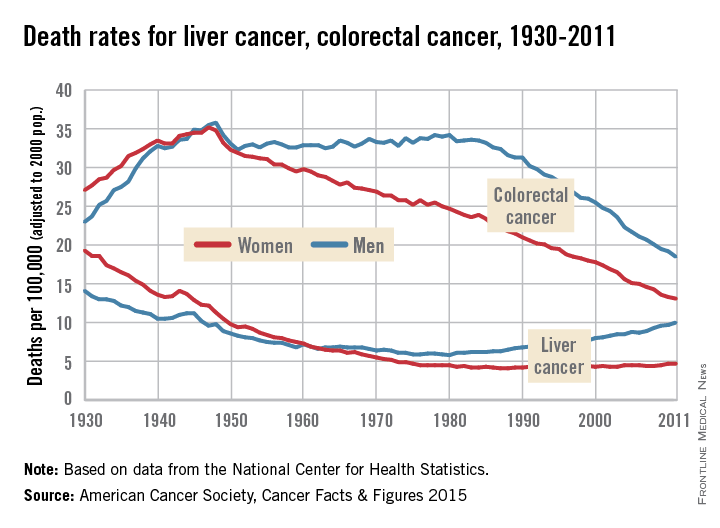
Death rates for liver cancer have been rising for some time among both men and women, while rates of colon and rectal cancer continue to decline from historic highs in the 1940s, the American Cancer Society reported.
In 2011, the death rate for liver cancer was 10/100,000 population (age-adjusted to the 2000 U.S. standard population) for men and 4.7/100,000 for women. The death rate for men reached its all-time low in 1980, when it was 5.8; for women, the low was 4.1 in 1987-1988. From 2007 to 2011, the overall death rate rose by 2.5% per year, according to the ACS.
“Screening for liver cancer has not been shown to reduce mortality,” the report said. “Nonetheless, many doctors in the U.S. screen individuals at high risk for the disease (e.g., those with cirrhosis) with ultrasound or blood tests.”
Death rates for colorectal cancer went the opposite way over that recent 4-year period – dropping by 2.5% a year overall from 2007 to 2011. The longer-term trend has seen rates for women declining since reaching a high of 35.2/100,000 in 1947, while the rate for men has been dropping since 1980, when it was 34.2. In 2011, the death rates for colorectal cancer were 13.1 in women and 18.5 in men, the ACS reported.
“This trend reflects declining incidence rates and improvements in early detection and treatment,” the ACS said in its report, which used data from the National Center for Health Statistics.
PQRS participation varies by specialty
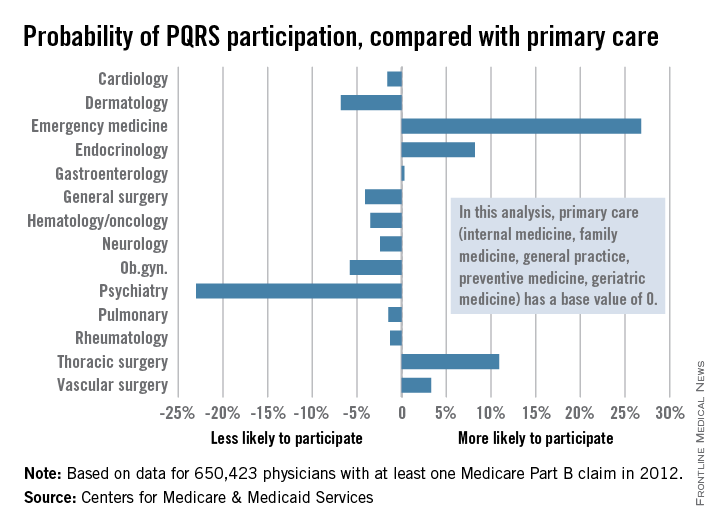
Participation in the Physician Quality Reporting System (PQRS) varies considerably by specialty, according to an new analysis of 2012 data using primary care physicians as the base, the Centers for Medicare & Medicaid Services reported.

Emergency medicine physicians were almost 27% more likely to participate in PQRS than were physicians in primary care (internal medicine, family medicine, general practice, preventive medicine, and geriatrics). On the other end of the scale were psychiatrists, who were 23% less likely than were primary care physicians to participate in PQRS, according to the CMS.
Among surgical specialties, general surgeons were 4% less likely to participate in PQRS, but thoracic surgeons and vascular surgeons were 11% and 3%, respectively, more likely to participate, compared with primary care physicians.
The PQRS participation rate in 2012 was 41.3% overall for the 650,423 MDs/DOs who submitted at least one Medicare Part B claim that year. Other health care professionals – including podiatrists, chiropractors, nurse practitioners, psychologists, and physical therapists – are eligible for PQRS but were not included in this analysis, the CMS said.
Participation in the Physician Quality Reporting System (PQRS) varies considerably by specialty, according to an new analysis of 2012 data using primary care physicians as the base, the Centers for Medicare & Medicaid Services reported.
Emergency medicine physicians were almost 27% more likely to participate in PQRS than were physicians in primary care (internal medicine, family medicine, general practice, preventive medicine, and geriatrics). On the other end of the scale were psychiatrists, who were 23% less likely than were primary care physicians to participate in PQRS, according to the CMS.
Among surgical specialties, general surgeons were 4% less likely to participate in PQRS, but thoracic surgeons and vascular surgeons were 11% and 3%, respectively, more likely to participate, compared with primary care physicians.
The PQRS participation rate in 2012 was 41.3% overall for the 650,423 MDs/DOs who submitted at least one Medicare Part B claim that year. Other health care professionals – including podiatrists, chiropractors, nurse practitioners, psychologists, and physical therapists – are eligible for PQRS but were not included in this analysis, the CMS said.
Death rates rising for liver cancer, falling for colorectal cancer
Death rates for liver cancer have been rising for some time among both men and women, while rates of colon and rectal cancer continue to decline from historic highs in the 1940s, the American Cancer Society reported.
In 2011, the death rate for liver cancer was 10/100,000 population (age-adjusted to the 2000 U.S. standard population) for men and 4.7/100,000 for women. The death rate for men reached its all-time low in 1980, when it was 5.8; for women, the low was 4.1 in 1987-1988. From 2007 to 2011, the overall death rate rose by 2.5% per year, according to the ACS.
“Screening for liver cancer has not been shown to reduce mortality,” the report said. “Nonetheless, many doctors in the U.S. screen individuals at high risk for the disease (e.g., those with cirrhosis) with ultrasound or blood tests.”
Death rates for colorectal cancer went the opposite way over that recent 4-year period – dropping by 2.5% a year overall from 2007 to 2011. The longer-term trend has seen rates for women declining since reaching a high of 35.2/100,000 in 1947, while the rate for men has been dropping since 1980, when it was 34.2. In 2011, the death rates for colorectal cancer were 13.1 in women and 18.5 in men, the ACS reported.
“This trend reflects declining incidence rates and improvements in early detection and treatment,” the ACS said in its report, which used data from the National Center for Health Statistics.
Melanoma Incidence Highest in Oregon, Lowest in Texas in 2015
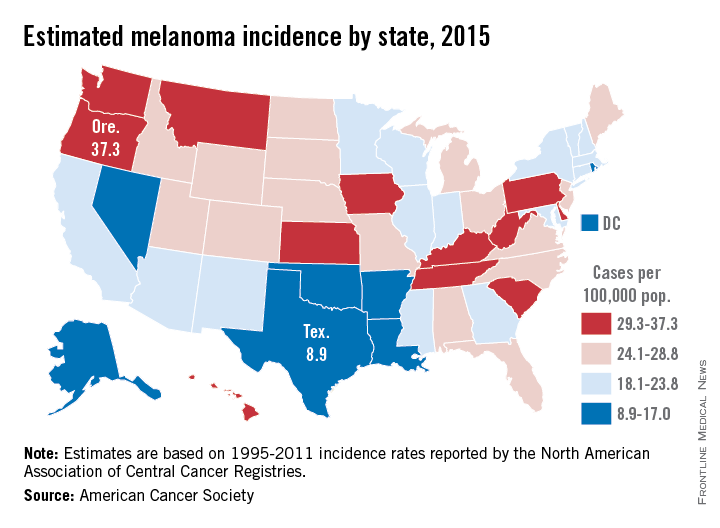
Projections for the number of new melanoma cases in 2015 give Texas the lowest estimated incidence and Oregon the highest, according to a report from the American Cancer Society.
Texas is expected to have 2,410 new cases of melanoma this year, for an incidence of 8.9 cases per 100,000 people. Oregon’s projected 1,480 melanoma cases for 2015 results in an incidence of 37.3 cases per 100,000 population. (The ACS projected the number of new cases, so incidences here are calculated via recent Census Bureau population estimates.)
After Texas, Louisiana should have the lowest melanoma rate at 11.6 per 100,000, followed by Arkansas and the District of Columbia, both at 12.1 per 100,000. On the upper end of the scale, Oregon will likely be followed by Washington, where the incidence for 2015 is expected to be 34.8 per 100,000, the ACS data show.
Using incidences (1995-2011) reported by the North American Association of Central Cancer Registries, the ACS projected that 73,870 new cases of melanoma will be diagnosed in the United States this year – meaning an overall incidence of 23.2 per 100,000, based on the same Census Bureau figures.
The ACS estimated that there will be 9,940 deaths from melanoma in 2015 – an incidence of 3.1 per 100,000 population – as well as 3,400 deaths from other forms of skin cancer, not including basal cell and squamous cell carcinomas.
Melanoma incidence highest in Oregon, lowest in Texas in 2015
Projections for the number of new melanoma cases in 2015 give Texas the lowest estimated incidence and Oregon the highest, according to a report from the American Cancer Society.
Texas is expected to have 2,410 new cases of melanoma this year, for an incidence of 8.9 cases per 100,000 people. Oregon’s projected 1,480 melanoma cases for 2015 results in an incidence of 37.3 cases per 100,000 population. (The ACS projected the number of new cases, so incidences here are calculated via recent Census Bureau population estimates.)
After Texas, Louisiana should have the lowest melanoma rate at 11.6 per 100,000, followed by Arkansas and the District of Columbia, both at 12.1 per 100,000. On the upper end of the scale, Oregon will likely be followed by Washington, where the incidence for 2015 is expected to be 34.8 per 100,000, the ACS data show.
Using incidences (1995-2011) reported by the North American Association of Central Cancer Registries, the ACS projected that 73,870 new cases of melanoma will be diagnosed in the United States this year – meaning an overall incidence of 23.2 per 100,000, based on the same Census Bureau figures.
The ACS estimated that there will be 9,940 deaths from melanoma in 2015 – an incidence of 3.1 per 100,000 population – as well as 3,400 deaths from other forms of skin cancer, not including basal cell and squamous cell carcinomas.

Medicaid’s share of state budgets was nearly 26% in 2014
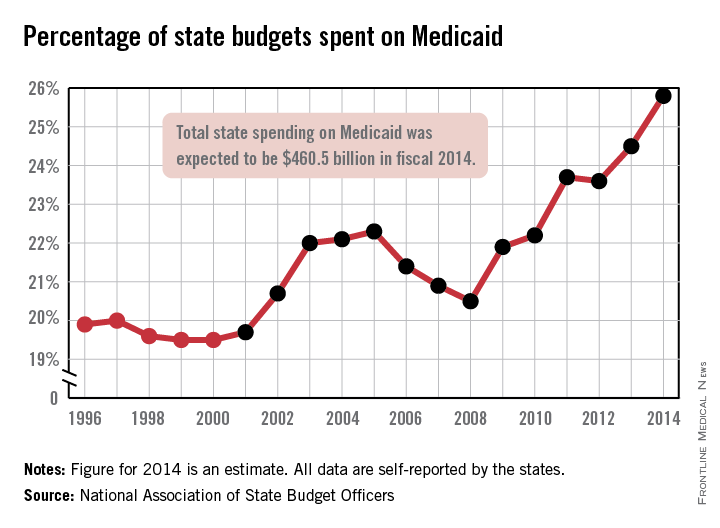
States spent more than a quarter of their budgets on Medicaid for the first time in 2014, with the total share estimated at 25.8% by the National Association of State Budget Officers.
That 25.8% represents expenditures of $460.5 billion, excluding administration costs – an increase of 11.3% over 2013. Medicaid was the single largest component of total state spending last year, NASBO noted in its annual State Expenditure Report, and has been every year since 2009.
State funding for Medicaid increased by 2.7% in 2014, while the federal share of funding went up by an estimated 17.8%, compared with 2013. Medicaid enrollment was projected to increase by 8.3% across all states in 2014 after going up 1.5% in 2013; it is expected to increase by 13.2% in fiscal 2015, NASBO said.
“Implementation of the Affordable Care Act has greatly increased the number of individuals served in the Medicaid program in 2014 and thereafter,” the report noted, adding that the ACA’s Medicaid eligibility expansion option is expected to “add approximately 18.3 million individuals by 2021.”

Most cost-effective psoriasis treatment: methotrexate
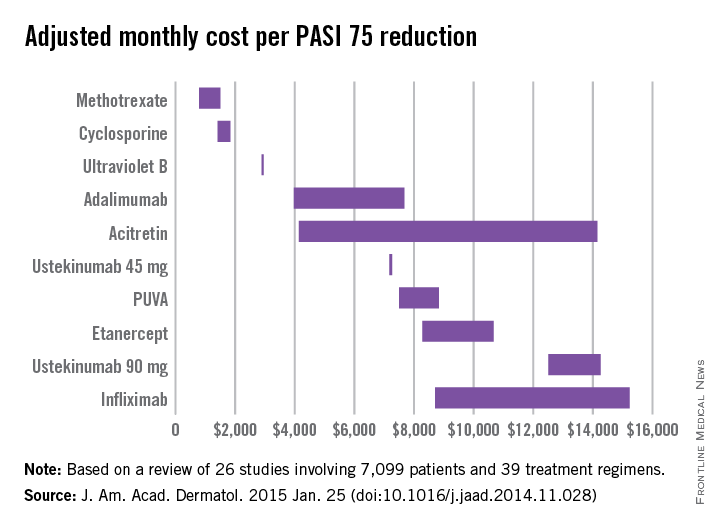
Methotrexate is the most cost-effective systemic treatment for psoriasis in terms of the number of patients needed to treat to achieve a PASI 75, according to a literature review in the Journal of the American Academy of Dermatology.
Methotrexate (2.5-mg tablet) cost an adjusted $794-$1,503 a month per number needed to treat (NNT) for a 75% reduction in Psoriasis Area and Severity Index (PASI 75) score, Dr. Logan S. D’Souza and Dr. Michael J. Payette of the department of dermatology at the University of Connecticut in Farmington reported (J. Am. Acad. Dermatol. 2015 Jan. 25 [doi:10.1016/j.jaad.2014.11.028]).
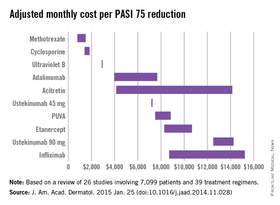
Coming in second was cyclosporine (25- and 100-mg tablets) at $1,410-$1,844 in monthly cost per PASI 75, followed by narrow-band ultraviolet B light phototherapy at $2,925 and adalimumab (40-mg subcutaneous injection) at $3,975-$7,679, the investigators said.
The most expensive of the 10 Food and Drug Administration–approved treatments included in the study was infliximab (100-mg vial) at $8,705-$15,236 per month. The next most expensive treatment was ustekinumab (90-mg subcutaneous injection), which cost $12,505-$14,257 per month.
“While our data indicate that methotrexate and cyclosporine are more cost efficacious in reaching PASI 75 than other medications approved by the FDA, their potential toxicities may limit their long-term use,” Dr. D’Souza and Dr. Payette noted. “Our study is not meant to dictate treatments based solely on costs; rather, our analysis should help both clinicians and patients in choosing between potential treatments,” they added.
For this analysis, 26 studies involving 7,099 patients and 39 treatment regimens met the investigators’ search criteria.
Dr. D’Souza declared no conflicts of interest. Dr. Payette has been an adviser to Amgen.
Methotrexate is the most cost-effective systemic treatment for psoriasis in terms of the number of patients needed to treat to achieve a PASI 75, according to a literature review in the Journal of the American Academy of Dermatology.
Methotrexate (2.5-mg tablet) cost an adjusted $794-$1,503 a month per number needed to treat (NNT) for a 75% reduction in Psoriasis Area and Severity Index (PASI 75) score, Dr. Logan S. D’Souza and Dr. Michael J. Payette of the department of dermatology at the University of Connecticut in Farmington reported (J. Am. Acad. Dermatol. 2015 Jan. 25 [doi:10.1016/j.jaad.2014.11.028]).
Coming in second was cyclosporine (25- and 100-mg tablets) at $1,410-$1,844 in monthly cost per PASI 75, followed by narrow-band ultraviolet B light phototherapy at $2,925 and adalimumab (40-mg subcutaneous injection) at $3,975-$7,679, the investigators said.
The most expensive of the 10 Food and Drug Administration–approved treatments included in the study was infliximab (100-mg vial) at $8,705-$15,236 per month. The next most expensive treatment was ustekinumab (90-mg subcutaneous injection), which cost $12,505-$14,257 per month.
“While our data indicate that methotrexate and cyclosporine are more cost efficacious in reaching PASI 75 than other medications approved by the FDA, their potential toxicities may limit their long-term use,” Dr. D’Souza and Dr. Payette noted. “Our study is not meant to dictate treatments based solely on costs; rather, our analysis should help both clinicians and patients in choosing between potential treatments,” they added.
For this analysis, 26 studies involving 7,099 patients and 39 treatment regimens met the investigators’ search criteria.
Dr. D’Souza declared no conflicts of interest. Dr. Payette has been an adviser to Amgen.
FROM THE JOURNAL OF THE AMERICAN ACADEMY OF DERMATOLOGY