User login
Richard Franki is the associate editor who writes and creates graphs. He started with the company in 1987, when it was known as the International Medical News Group. In his years as a journalist, Richard has worked for Cap Cities/ABC, Disney, Harcourt, Elsevier, Quadrant, Frontline, and Internet Brands. In the 1990s, he was a contributor to the ill-fated Indications column, predecessor of Livin' on the MDedge.
Which specialties are sitting at residents’ popular table?
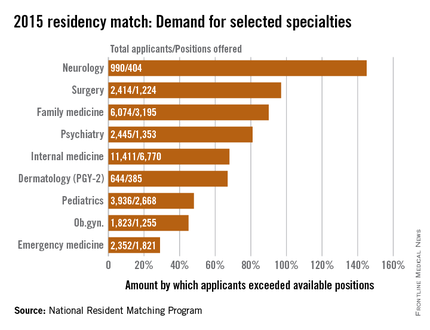
Demand for residency positions exceeded supply for all 47 specialties included in the 2015 residency match, but some specialties were more in demand than others.
Sheer weight of numbers gives the largest specialty, internal medicine, the largest demand – 11,411 total applicants – and the biggest difference between that demand and the number of PGY-1 positions offered: 6,770 slots, leaving 4,641 new doctors to settle for another specialty, according to data from the National Resident Matching Program (NRMP).
There is, however, more than one way to look at Match supply and demand. By doing a little math to take specialty size out of the equation, neurology gets a lot more popular. With 990 residents vying for just 404 positions, the total number of neurology applicants exceeded successful ones by 145%, compared with 68% for internal medicine. Also moving ahead of IM were surgery (97%), family medicine (90%), and psychiatry (81%).
Among the smallest subspecialties – those with less than 100 positions to fill – the demand becomes even more impressive. Radiation oncology had a rate of 600%, while pediatrics-primary put up a rate of 978%. The top of the demand heap, however, is occupied by medicine–preventive medicine, which had 94 applicants for just 7 available slots, according to the NRMP, which means that the number of applicants topped the number accepted by 1,243%.
The total PGY-1 numbers for 2015 look like this: 52,860 applicants filled 27,293 residency positions, so the number of total applicants exceeded those accepted by 94%. Think of it this way: For every residency applicant who matched in 2015, there was nearly one complete applicant who didn’t.

Where are the really big malpractice awards?
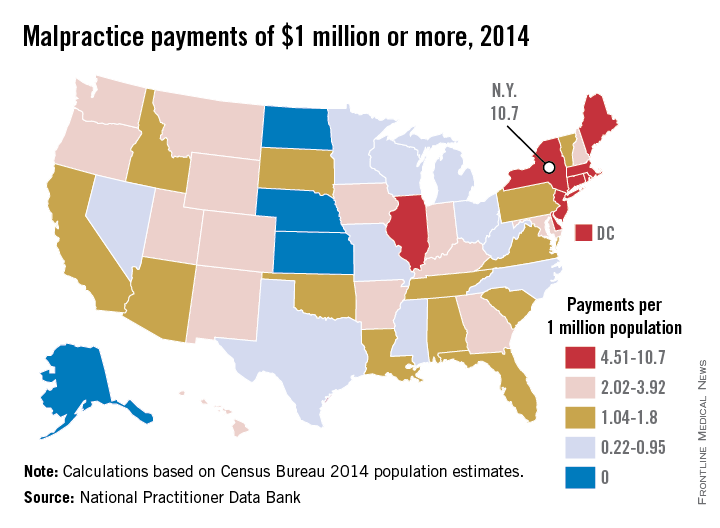
Everything may be bigger in Texas, but New York is the biggest in at least one area: large medical malpractice payments. New York had more than three times as many $1 million–plus malpractice awards as any other state in 2014, according to data from the National Practitioner Data Bank.
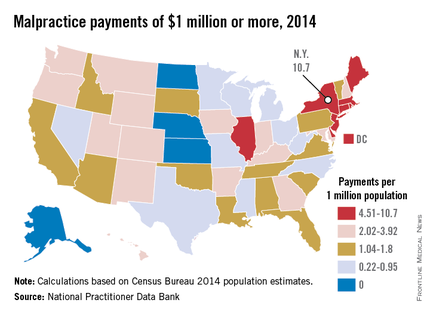
New York physicians had 210 malpractice payments of $1 million or more reported to the NPDB last year, compared with 61 for Illinois, the next-highest state. Rounding out the top five were Massachusetts with 49, followed by California with 43 and New Jersey with 41, the NPDB data show.
After taking population into account, New York was still the leader with 10.66 large awards per million residents. Next in this category was the New England trio of Rhode Island, which had 9.42 such payments per 1 million population; Massachusetts (7.26); and Connecticut (6.39).
In 2014, there were four states that had no malpractice payments of at least $1 million reported to the NPDB: Alaska, Kansas, North Dakota, and Nebraska, with Kansas having the largest population. In states with at least one $1 million–plus malpractice payment, Texas physicians had the lowest rate per million population, 0.22 – just 6 awards from a population of 27 million.
Everything may be bigger in Texas, but New York is the biggest in at least one area: large medical malpractice payments. New York had more than three times as many $1 million–plus malpractice awards as any other state in 2014, according to data from the National Practitioner Data Bank.
New York physicians had 210 malpractice payments of $1 million or more reported to the NPDB last year, compared with 61 for Illinois, the next-highest state. Rounding out the top five were Massachusetts with 49, followed by California with 43 and New Jersey with 41, the NPDB data show.
After taking population into account, New York was still the leader with 10.66 large awards per million residents. Next in this category was the New England trio of Rhode Island, which had 9.42 such payments per 1 million population; Massachusetts (7.26); and Connecticut (6.39).
In 2014, there were four states that had no malpractice payments of at least $1 million reported to the NPDB: Alaska, Kansas, North Dakota, and Nebraska, with Kansas having the largest population. In states with at least one $1 million–plus malpractice payment, Texas physicians had the lowest rate per million population, 0.22 – just 6 awards from a population of 27 million.
AMA: Most physicians still work in small practices
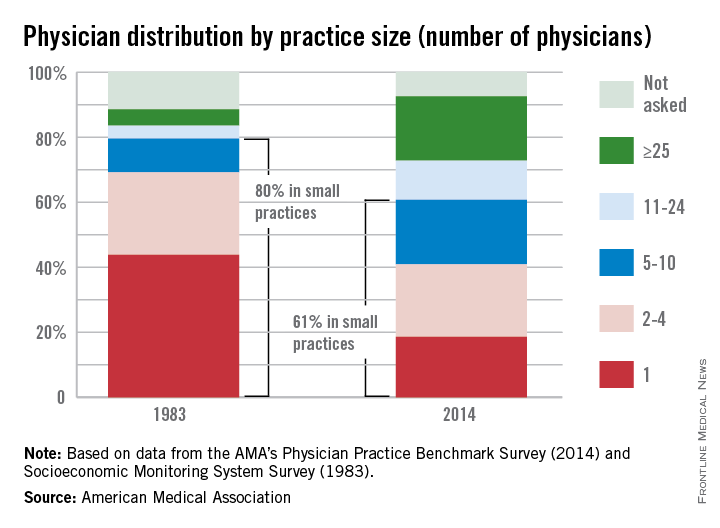
While medical practice arrangements seem to have changed dramatically over the last 30 years, the majority of physicians still work in small practices, the American Medical Association reported.
In a 2014 AMA survey, almost 61% of respondents worked in practices of 10 or fewer physicians. That’s down from the 80% reported by the AMA in 1983, but it still qualifies as majority. Over that same period, the proportion of physicians working in practices of 25 or more increased from 5% to 20%.
These changes in practice size were related to changes in practice ownership, the AMA noted. In 1983, the percentage of physicians who were the owners of their practices was 76%. In 2014, that number was 51%.
Looking at short-term data comparing the 2014 survey with one from 2012, the AMA found that the “share of physicians who worked directly for a hospital or in practices that were at least partially owned by a hospital increased from 29% in 2012 to 32.8% in 2014. Over that 2-year period, the share of physicians who were directly employed by a hospital increased from 5.6% to 7.2%, while the percentage of physicians who were in solo practice decreased from 18.4% to 17.1%, the AMA said.
Vermont leads the way in marketplace enrollment
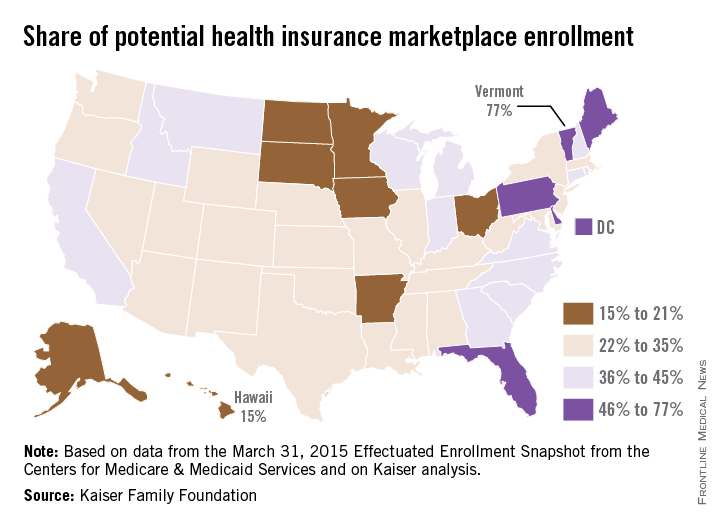
Vermont enrolled the highest percentage of potential enrollees for the Health Insurance Marketplace in 2015, while Hawaii enrolled the lowest percentage, according to an analysis from the Kaiser Family Foundation.
Enrollment in Vermont’s state-based marketplace as of March 31 was 34,923 – which works out to 77% of the estimated potential population of 45,000. The state with the next-highest enrollment was Florida, with 57% of the potential population, then Maine at 55%, Pennsylvania at 48%, and Delaware at 47%, Kaiser reported.
Hawaii had a marketplace enrollment of 8,200 out of an estimated potential population of 55,000, or 15%, as of March 31. Just ahead of Hawaii were Iowa (17%), Minnesota (19%), South Dakota (19%), and Ohio (20%).
Vermont, Hawaii, and Minnesota have state-based marketplaces, while those in Florida, Maine, Pennsylvania, South Dakota, and Ohio are federally facilitated. Delaware and Iowa have state-partnership marketplaces.
Number-crunching reveals that the 14 state-based marketplaces have the highest average enrollment at 35.6%, followed by the 27 federally facilitated marketplaces at 34.1%, the 7 state partnerships at 33%, and the 3 states with federally supported marketplaces at 28.3%, according to the Kaiser data, which come from the March 31, 2015 Effectuated Enrollment Snapshot from the Centers for Medicare & Medicaid Services and analysis based on 2014 Medicaid eligibility levels and the 2014 Current Population Survey.

Weight in America: Abnormal is the new normal
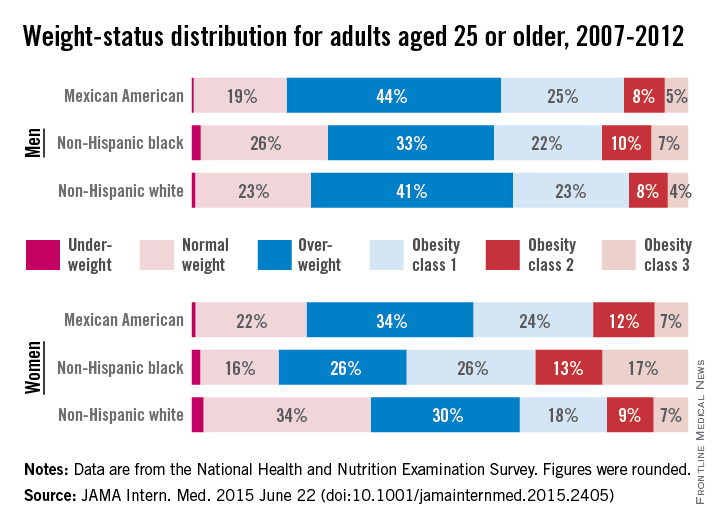
Three-quarters of men and two-thirds of women aged 25 years or older in the United States are either overweight or obese, according to a study published online June 22 in JAMA Internal Medicine.
During 2007-2012, about 40% of men were overweight and 35% were obese. For women, almost 30% were overweight and 37% were obese, Lin Yang, Ph.D., and Dr. Graham A. Colditz of Washington University, St. Louis, reported in a research letter (JAMA Intern. Med. 2015 June 22 [doi:10.1001/jamainternmed.2015.2405]).
Weight-status distributions across racial groups show that non-Hispanic whites were generally less obese than non-Hispanic blacks and Mexican Americans – an effect that was more pronounced among women. About 34% of white women were obese, compared with 57% of black women, with over 17% occupying the heaviest of three obesity levels, according to the investigators’ analysis of the most recent data from the National Health and Nutrition Examination Survey.
Weight groups in the study were defined by body mass index: underweight (< 18.5 kg/m2), normal weight (18.5-24.9), overweight (25.0-29.9), obesity class 1 (30.0-34.9), obesity class 2 (35.0-39.9), and obesity class 3 (≥ 40).
Compared with an earlier study reporting data for 1988-1994, “the greatest increase in the proportion of patients in the obesity class 3 category was among non-Hispanic black women,” Dr. Yang and Dr. Colditz wrote. Health and policy decision-makers should consider “population-based strategies helping to reduce modifiable risk factors such as physical environment interventions, enhancing primary care efforts to prevent and treat obesity, and altering societal norms of behavior,” they added.
The study was funded by the Washington University Transdiscliplinary Research on Energetics and Cancer Center, the Foundation for Barnes-Jewish Hospital, and the Breast Cancer Research Foundation. The investigators did not report any conflicts.
FROM JAMA INTERNAL MEDICINE

Cigarettes account for slightly under half of smoking-related cancer deaths
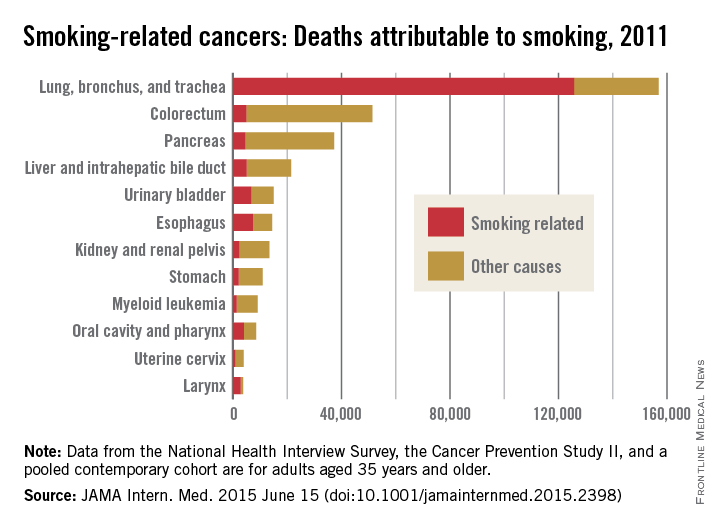
Of the nearly 346,000 U.S. deaths caused by smoking-related cancers in 2011, about 48.5% were attributable to cigarette smoking, according to a research letter published online June 15 in JAMA Internal Medicine.
The latest data available for adults aged 35 years and older show that, of the 12 cancers determined to be caused by smoking, those most likely to be attributed to cigarette smoking were cancers of the lung, bronchus, and trachea (80.2%) and the larynx (76.6%). Lung cancers were, by far, the most numerous, representing 126,000 of the nearly 168,000 total smoking-attributable cancers, said Rebecca L. Siegel of the American Cancer Society, Atlanta, and her associates.
The next most numerous smoking-attributable cancer was that of the esophagus, with a total of 7,300 deaths in 2011, they reported (JAMA Intern. Med. 2015 June 15 [doi:10.1001/jamainternmed.2015.2398]).
The investigators suggested that the “generally lower proportions of deaths caused by smoking in 2011 than in 2000 to 2004” may be the result of a drop in the prevalence of smoking from 23.2% in 2000 to 18.1% in 2012.
Data for the study came from the National Health Interview Survey, the Cancer Prevention Study II, and a pooled contemporary cohort (a group of five studies). Statistical methods and data sources match those used in smoking-attributable mortality calculations in the 2014 surgeon general’s report on smoking.
Analysis of the data was funded by the American Cancer Society. Four of the seven researchers are employees of the ACS.
FROM JAMA INTERNAL MEDICINE
New drugs saw ‘unprecedented’ spending growth in 2014
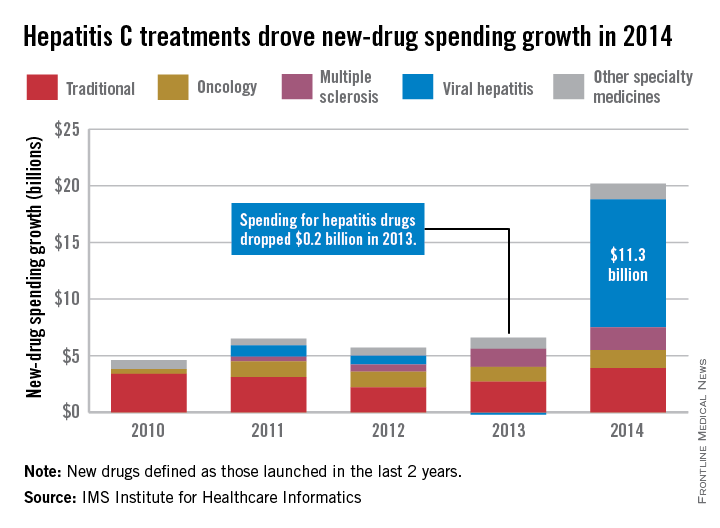
Led by new treatments for hepatitis C, there was an “unprecedented $20.2 billion increase in spending” for new medicines in 2014, which was triple the 2013 level, according to a report from the IMS Institute for Healthcare Informatics.
Compared with 2013, spending for new viral hepatitis drugs was up by $11.3 billion in 2014, accounting for more than half of the total increase. Hepatitis C drugs and other specialty medicines – defined as “products that are often injectable, high-cost, biologic … and include treatment for cancer and other serious chronic conditions” – accounted for 81% of the $20.2 billion, the report noted.
The number of patients who sought treatment for hepatitis C jumped from 17,000 in 2013 to 161,000 in 2014, “owing to new treatments with cure rates over 90% and dramatically fewer side effects,” the IMS Institute said.
Spending on new drugs in the traditional sector, such as those for diabetes, was up by $3.9 billion in 2014. The other leading areas of spending increase in the specialty sector – oncology and multiple sclerosis – were up by $1.6 billion and $2.0 billion, respectively, the report said.
The IMS Institute defines new drugs as those launched in the last 2 years. The report includes data from IMS National Sales Perspectives, which “reports 100% coverage of the retail and nonretail channels for national [non-OTC] pharmaceutical sales at actual transaction prices.”
Dermatology residents confident in their pediatric training
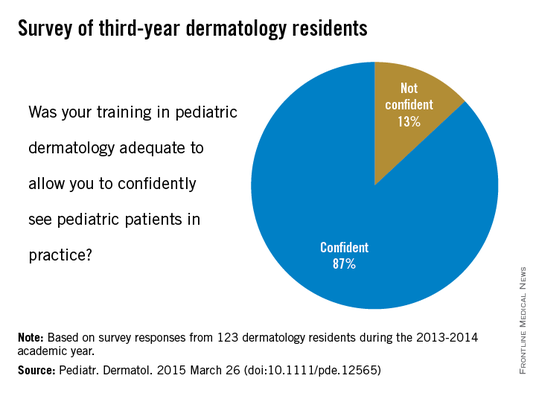
In a survey of last year’s graduating dermatology residents, most said that their training had adequately prepared them to confidently treat pediatric patients, according to a report in Pediatric Dermatology.
Of the 123 respondents to the survey, 87% expressed confidence in their pediatric dermatology training, and 13% said that they were not confident, said Dr. Alaleh Akhavan of Albert Einstein College of Medicine, New York, and her associates (Pediatr. Dermatol. 2015 March 26 [doi:10.1111/pde.12565]).
This high level of confidence may be the result of the didactic experience reported by the residents: 56% said that “their program offered academic time specifically dedicated to pediatrics,” and 80% of “those with dedicated pediatric academic time had pediatric dermatologists leading the majority of their didactic sessions,” the investigators wrote.
When asked about their clinical experience, 82% of the residents said that their program had a dedicated pediatric dermatology clinic, and 69% reported that they had attended more than one clinic per week that was dedicated to pediatric patients – almost 40% put the weekly number at four or more, Dr. Akhavan and her associates reported.
Although most of the “residents are satisfied with their pediatric dermatology education … there appear to be deficiencies in pediatric excisional surgery and genodermatoses management. A standardized curriculum may facilitate further enhancements in pediatric dermatology training and exposure,” they concluded.
The investigators did not disclose any conflicts of interest.
FROM PEDIATRIC DERMATOLOGY

False-positive mammograms cost $2.8 billion a year
False-positive mammograms in women aged 40-59 years cost an estimated $2.8 billion per year in the United States in 2012-2013, according to a report published April 6 in Health Affairs.
The cost of screen-detected invasive breast cancer overdiagnoses was $1.2 billion a year for that time period and age group. Invasive breast cancers represent about $1 billion of that, with the rest coming from overdiagnoses of ductal carcinoma in situ (DCIS), Mei-Sing Ong, Ph.D., and Dr. Kenneth D. Mandl, both of Boston Children’s Hospital, estimated.
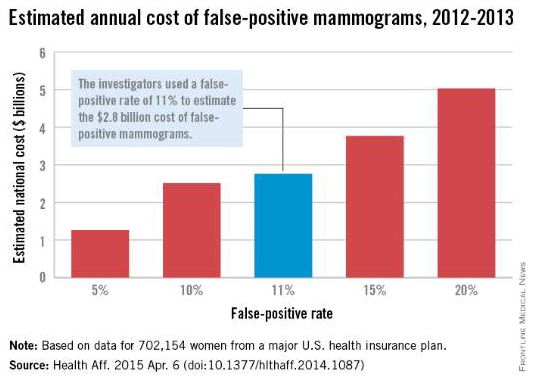
Using expenditure data for 702,154 women from a major U.S. health care insurance plan, the investigators calculated that the average cost of a false-positive mammogram – the mammography plus all related costs over the next 12 months – was $852. The average 12-month costs for invasive breast cancer and DCIS were $51,837 and $12,369, they reported (Health Aff. 2015 Apr. 6 [doi:10.1377/hlthaff.2014.1087]).
Dr. Ong and Dr. Mandl used a false-positive rate of 11% for the mammogram estimate, although they also calculated costs based on a range of rates from 5% to 20%. Based on recent studies in the New England Journal of Medicine and the BMJ, they used an overdiagnosis rate of 22% for the breast cancer estimate; the overdiagnosis rate of 86% for DCIS came from a 2004 study.
“The disutility of overdiagnosis,” together with the high diagnostic and treatment costs of mammography, “may tilt the balance to the point where screening [based on age] appears relatively cost ineffective,” Dr. Ong and Dr. Mandl wrote. It may be time to “shape a more individualized approach to determining who should receive screening, focusing on women who are most likely to benefit.”
Dr. Ong is supported by a fellowship from the National Health and Medical Research Council in Australia, which played no role in the study. Dr. Mandl did not report any conflicts.
False-positive mammograms in women aged 40-59 years cost an estimated $2.8 billion per year in the United States in 2012-2013, according to a report published April 6 in Health Affairs.
The cost of screen-detected invasive breast cancer overdiagnoses was $1.2 billion a year for that time period and age group. Invasive breast cancers represent about $1 billion of that, with the rest coming from overdiagnoses of ductal carcinoma in situ (DCIS), Mei-Sing Ong, Ph.D., and Dr. Kenneth D. Mandl, both of Boston Children’s Hospital, estimated.
Using expenditure data for 702,154 women from a major U.S. health care insurance plan, the investigators calculated that the average cost of a false-positive mammogram – the mammography plus all related costs over the next 12 months – was $852. The average 12-month costs for invasive breast cancer and DCIS were $51,837 and $12,369, they reported (Health Aff. 2015 Apr. 6 [doi:10.1377/hlthaff.2014.1087]).
Dr. Ong and Dr. Mandl used a false-positive rate of 11% for the mammogram estimate, although they also calculated costs based on a range of rates from 5% to 20%. Based on recent studies in the New England Journal of Medicine and the BMJ, they used an overdiagnosis rate of 22% for the breast cancer estimate; the overdiagnosis rate of 86% for DCIS came from a 2004 study.
“The disutility of overdiagnosis,” together with the high diagnostic and treatment costs of mammography, “may tilt the balance to the point where screening [based on age] appears relatively cost ineffective,” Dr. Ong and Dr. Mandl wrote. It may be time to “shape a more individualized approach to determining who should receive screening, focusing on women who are most likely to benefit.”
Dr. Ong is supported by a fellowship from the National Health and Medical Research Council in Australia, which played no role in the study. Dr. Mandl did not report any conflicts.
FROM HEALTH AFFAIRS

Hip replacements not just for the elderly anymore
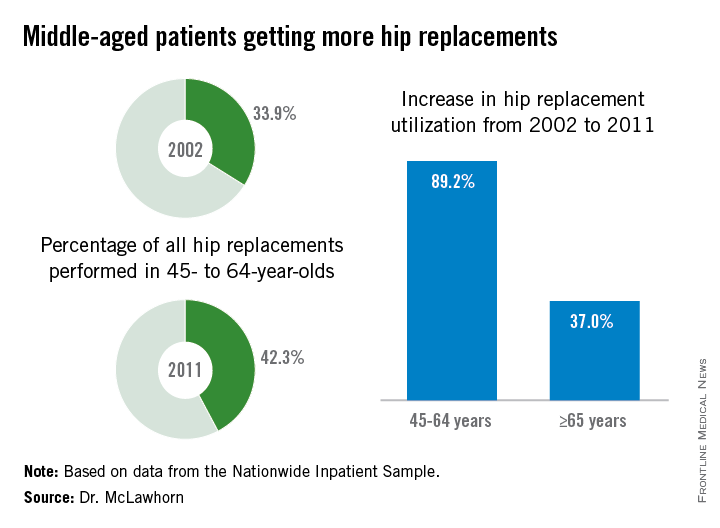
Hip replacement is becoming more common among middle-aged Americans at the same time as the number of surgeons who perform the procedure is declining, Dr. Alexander S. McLawhorn said at the annual meeting of the American Academy of Orthopaedic Surgeons in Las Vegas.
In 2011, patients aged 45-64 years underwent 42.3% of the hip replacements performed, compared with 33.9% in 2002. The number of replacements performed rose from approximately 68,000 in 2002 to 128,000 in 2011, an increase of 89.2%, compared with an increase of 37.0% among those aged 65 years and older, according to data from the Nationwide Inpatient Sample.
This “observed growth was best explained by an expansion of the middle-aged population in the United States. This particular age group is projected to continue expanding, and as such the demand for [hip replacement] in this active group of patients will likely continue to rise as well,” Dr. McLawhorn of the Hospital for Special Surgery, New York, said in a written statement.
According to membership data from the AAOS, however, the number of physicians performing hip replacements declined by almost 29% from 2002 to 2011, which will “increase the future revision burden” on those surgeons who are still doing the procedure, the investigators said.
Dr. McLawhorn had no conflicts to report, but one of his associates disclosed relationships with Ethicon, the Knee Society, Medtronic, Mekanika, and Zimmer.
FROM AAOS 2015
