User login
Richard Franki is the associate editor who writes and creates graphs. He started with the company in 1987, when it was known as the International Medical News Group. In his years as a journalist, Richard has worked for Cap Cities/ABC, Disney, Harcourt, Elsevier, Quadrant, Frontline, and Internet Brands. In the 1990s, he was a contributor to the ill-fated Indications column, predecessor of Livin' on the MDedge.
Patients rate physicians on timeliness of primary care
When it comes to giving patients timely care, ob.gyn. practices have a bit of an edge over the other primary care specialties, the Agency for Healthcare Research and Quality reported.
In a composite of five survey questions asking if patients received timely appointments, care, and information, 65% of ob.gyn. patients said that their physicians always provided such care, compared with 63% for pediatricians, 61% for internists, and 58% for family physicians, according to data from the Consumer Assessment of Healthcare Providers and Systems (CAHPS) Clinician & Group Survey.
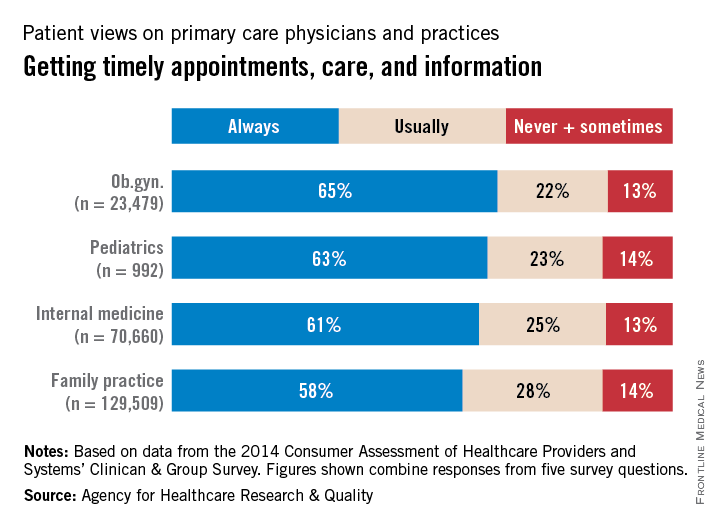
When primary care physicians (not including pediatricians) were considered as a group, 59% of respondents said that they always received timely care, compared with 64% for other specialties. Overall, 62% of respondents said that physician offices always provided timely care. The highest favorable score for any of the 16 most-reported specialties was the 69% achieved by hematology/oncology, the survey data show.
The CAHPS database includes a total of 798,967 patient responses submitted in 2014 and early 2015 by 3,962 medical practices.
When it comes to giving patients timely care, ob.gyn. practices have a bit of an edge over the other primary care specialties, the Agency for Healthcare Research and Quality reported.
In a composite of five survey questions asking if patients received timely appointments, care, and information, 65% of ob.gyn. patients said that their physicians always provided such care, compared with 63% for pediatricians, 61% for internists, and 58% for family physicians, according to data from the Consumer Assessment of Healthcare Providers and Systems (CAHPS) Clinician & Group Survey.
When primary care physicians (not including pediatricians) were considered as a group, 59% of respondents said that they always received timely care, compared with 64% for other specialties. Overall, 62% of respondents said that physician offices always provided timely care. The highest favorable score for any of the 16 most-reported specialties was the 69% achieved by hematology/oncology, the survey data show.
The CAHPS database includes a total of 798,967 patient responses submitted in 2014 and early 2015 by 3,962 medical practices.

Osteoporosis Trends Collide for Mexican American Women
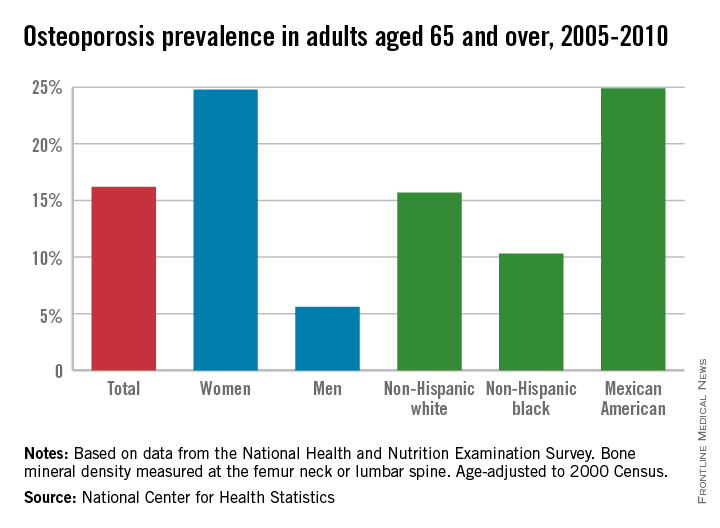
Among adults aged 65 years and over, women were 4.4 times as likely as men to have osteoporosis, and Mexican Americans were 2.4 times more likely than were blacks to have osteoporosis from 2005 to 2010, the National Center for Health Statistics reported.
So where does leave those who are both women and Mexican American?
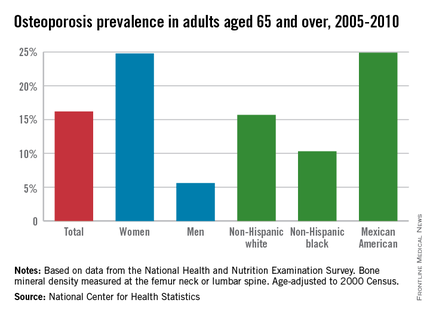
First, a little background: The age-adjusted prevalence of osteoporosis measured at either the lumbar spine or femur neck among adults aged 65 years and over was 24.8% for women and 5.6% for men, for an overall prevalence of 16.2%. Adults aged 65-79 years had an unadjusted prevalence of 12.8%, compared with 25.7% for those aged 80 years and over, according to data from the 2005-2010 National Health and Nutrition Examination Survey.
Age-adjusted prevalence over that time period for Mexican Americans aged 65 years and older was 24.9%, compared with 15.7% for non-Hispanic whites and 10.3% for non-Hispanic blacks.
Mexican American women, who find themselves at the intersection of these two trends, had an adjusted osteoporosis rate of 36.8%, the NCHS reported.
Osteoporosis was defined as a bone mineral density value that was more than 2.5 standard deviations below the mean value for young, non-Hispanic white females.
Among adults aged 65 years and over, women were 4.4 times as likely as men to have osteoporosis, and Mexican Americans were 2.4 times more likely than were blacks to have osteoporosis from 2005 to 2010, the National Center for Health Statistics reported.
So where does leave those who are both women and Mexican American?
First, a little background: The age-adjusted prevalence of osteoporosis measured at either the lumbar spine or femur neck among adults aged 65 years and over was 24.8% for women and 5.6% for men, for an overall prevalence of 16.2%. Adults aged 65-79 years had an unadjusted prevalence of 12.8%, compared with 25.7% for those aged 80 years and over, according to data from the 2005-2010 National Health and Nutrition Examination Survey.
Age-adjusted prevalence over that time period for Mexican Americans aged 65 years and older was 24.9%, compared with 15.7% for non-Hispanic whites and 10.3% for non-Hispanic blacks.
Mexican American women, who find themselves at the intersection of these two trends, had an adjusted osteoporosis rate of 36.8%, the NCHS reported.
Osteoporosis was defined as a bone mineral density value that was more than 2.5 standard deviations below the mean value for young, non-Hispanic white females.
Osteoporosis trends collide for Mexican American women
Among adults aged 65 years and over, women were 4.4 times as likely as men to have osteoporosis, and Mexican Americans were 2.4 times more likely than were blacks to have osteoporosis from 2005 to 2010, the National Center for Health Statistics reported.
So where does leave those who are both women and Mexican American?

First, a little background: The age-adjusted prevalence of osteoporosis measured at either the lumbar spine or femur neck among adults aged 65 years and over was 24.8% for women and 5.6% for men, for an overall prevalence of 16.2%. Adults aged 65-79 years had an unadjusted prevalence of 12.8%, compared with 25.7% for those aged 80 years and over, according to data from the 2005-2010 National Health and Nutrition Examination Survey.
Age-adjusted prevalence over that time period for Mexican Americans aged 65 years and older was 24.9%, compared with 15.7% for non-Hispanic whites and 10.3% for non-Hispanic blacks.
Mexican American women, who find themselves at the intersection of these two trends, had an adjusted osteoporosis rate of 36.8%, the NCHS reported.
Osteoporosis was defined as a bone mineral density value that was more than 2.5 standard deviations below the mean value for young, non-Hispanic white females.
Among adults aged 65 years and over, women were 4.4 times as likely as men to have osteoporosis, and Mexican Americans were 2.4 times more likely than were blacks to have osteoporosis from 2005 to 2010, the National Center for Health Statistics reported.
So where does leave those who are both women and Mexican American?
First, a little background: The age-adjusted prevalence of osteoporosis measured at either the lumbar spine or femur neck among adults aged 65 years and over was 24.8% for women and 5.6% for men, for an overall prevalence of 16.2%. Adults aged 65-79 years had an unadjusted prevalence of 12.8%, compared with 25.7% for those aged 80 years and over, according to data from the 2005-2010 National Health and Nutrition Examination Survey.
Age-adjusted prevalence over that time period for Mexican Americans aged 65 years and older was 24.9%, compared with 15.7% for non-Hispanic whites and 10.3% for non-Hispanic blacks.
Mexican American women, who find themselves at the intersection of these two trends, had an adjusted osteoporosis rate of 36.8%, the NCHS reported.
Osteoporosis was defined as a bone mineral density value that was more than 2.5 standard deviations below the mean value for young, non-Hispanic white females.

Survey identifies top cosmetic concerns
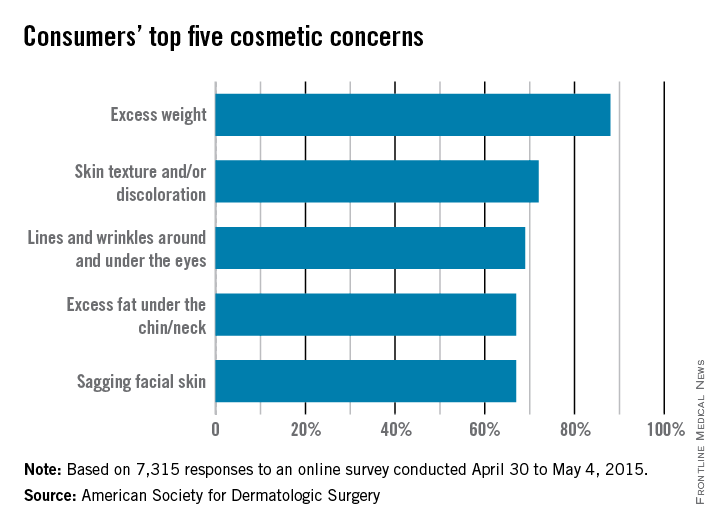
The American Society for Dermatologic Surgery took a poll this spring, and the winner was fat.
The ASDS asked people to identify their biggest cosmetic concerns, and 88% said that they were somewhat to extremely bothered by excess weight. The next most-concerning condition was “skin texture and/or discoloration” (72%), followed by “lines and wrinkles around and under the eyes” (69%), “excess fat [there it is again] under the chin/neck” (67%), and “sagging facial skin” (67%).
More than 207,000 body-sculpting procedures were performed by ASDS members in 2014, with cryolipolysis the most-commonly done procedure.
The 7,315 survey respondents were less-concerned about “lines and wrinkles between my eyebrows” (55%), “hair loss” (43%), and “acne scars” (27%), according to the ASDS.
About half of the respondents were considering a cosmetic procedure, with “ultrasound, laser, light, and radiofrequency treatments for skin tightening or wrinkles” the top choice at 66% and “laser hair removal” next at 55%, the ASDS reported.
More bicyclists, more fatalities
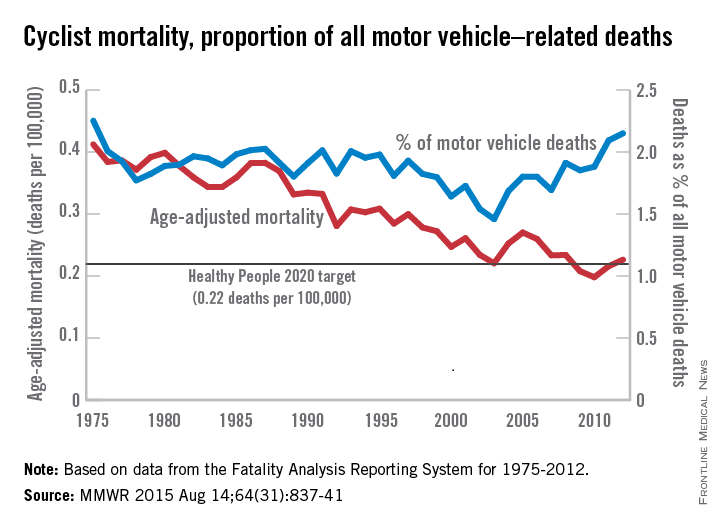
The annual rate for bicyclist deaths associated with motor vehicles dropped 44% from 1975 to 2012, but the downward trend has slowed in recent years, the Centers for Disease Control and Prevention reported.
Annual mortality among cyclists for all motor vehicle–related deaths was 0.23 per 100,000 in 2012, a decline of 44% since 1975 when the rate was 0.41 per 100,000. But the rate is up from just under 0.20 per 100,000 in 2010. In 2012, the rate topped the Healthy People 2020 goal of 0.22 for the first time since 2008, according to Jason Vargo, Ph.D., of the University of Wisconsin, Madison, and his associates (MMWR. 2015 Aug 14;64[31]:837-41).
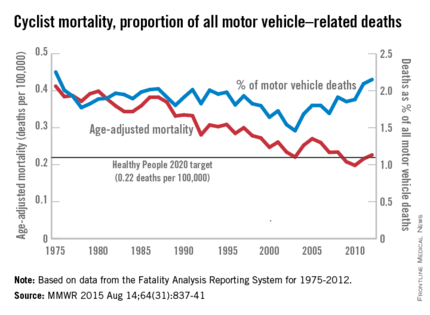
Similarly, the proportion of cyclist deaths among all motor vehicle–related deaths was 2.25% in 1975, and dropped to a low of 1.46% in 2003. Since then, however, the rate has risen steadily and in 2012 stood at 2.15%, the highest rate since 1975.
The explanation may be that the number of bicyclists has been steadily rising. “The share of total household trips taken by bicycle has doubled over the last 35 years” with the largest share of that increase occurring in recent years. From 2000 to 2012, for example, “the number of U.S. workers who traveled to work by bicycle increased 61%,” the researchers wrote.
The report was based on data from the Fatality Analysis Reporting System, which limits fatalities to those involving a motor vehicle on a public road.
The annual rate for bicyclist deaths associated with motor vehicles dropped 44% from 1975 to 2012, but the downward trend has slowed in recent years, the Centers for Disease Control and Prevention reported.
Annual mortality among cyclists for all motor vehicle–related deaths was 0.23 per 100,000 in 2012, a decline of 44% since 1975 when the rate was 0.41 per 100,000. But the rate is up from just under 0.20 per 100,000 in 2010. In 2012, the rate topped the Healthy People 2020 goal of 0.22 for the first time since 2008, according to Jason Vargo, Ph.D., of the University of Wisconsin, Madison, and his associates (MMWR. 2015 Aug 14;64[31]:837-41).
Similarly, the proportion of cyclist deaths among all motor vehicle–related deaths was 2.25% in 1975, and dropped to a low of 1.46% in 2003. Since then, however, the rate has risen steadily and in 2012 stood at 2.15%, the highest rate since 1975.
The explanation may be that the number of bicyclists has been steadily rising. “The share of total household trips taken by bicycle has doubled over the last 35 years” with the largest share of that increase occurring in recent years. From 2000 to 2012, for example, “the number of U.S. workers who traveled to work by bicycle increased 61%,” the researchers wrote.
The report was based on data from the Fatality Analysis Reporting System, which limits fatalities to those involving a motor vehicle on a public road.
FROM MORBIDITY AND MORTALITY WEEKLY REPORT
Inpatient mortality down for high-volume conditions
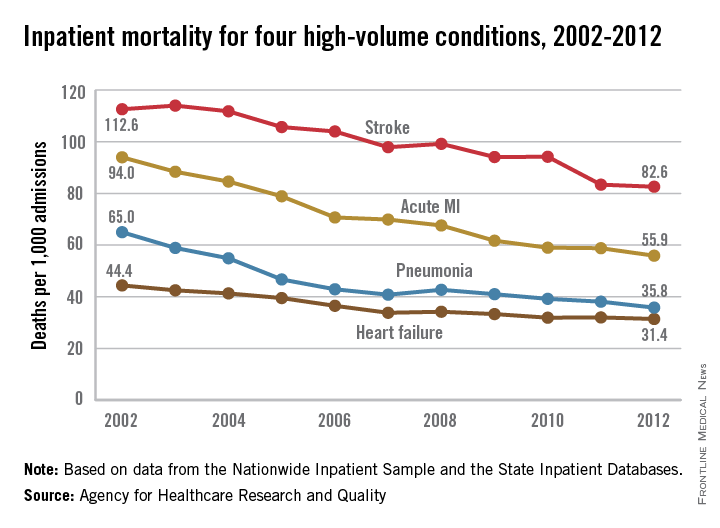
Inpatient mortality for pneumonia, acute MI, heart failure, and stroke each fell significantly from 2002 to 2012, the Agency for Healthcare Research and Quality reported.
Over that period, mortality among adults hospitalized with pneumonia went from 65 per 1,000 admissions to 35.8 per 1,000 for a drop of 45% – largest of the four high-volume conditions. Corresponding declines for the others were 41% for acute MI, 29% for heart failure, and 27% for stroke, the AHRQ noted.

Since “death following discharge from a hospital is not reflected in these data,” the report said, measures of inpatient mortality “can reflect both improvements in health care and shifts in where end-of-life care takes place over time.”
The estimates in the report are based on data from the Nationwide Inpatient Sample (2002-2011) and State Inpatient Databases (2012).
Inpatient mortality for pneumonia, acute MI, heart failure, and stroke each fell significantly from 2002 to 2012, the Agency for Healthcare Research and Quality reported.
Over that period, mortality among adults hospitalized with pneumonia went from 65 per 1,000 admissions to 35.8 per 1,000 for a drop of 45% – largest of the four high-volume conditions. Corresponding declines for the others were 41% for acute MI, 29% for heart failure, and 27% for stroke, the AHRQ noted.
Since “death following discharge from a hospital is not reflected in these data,” the report said, measures of inpatient mortality “can reflect both improvements in health care and shifts in where end-of-life care takes place over time.”
The estimates in the report are based on data from the Nationwide Inpatient Sample (2002-2011) and State Inpatient Databases (2012).
Infant mortality by state: Mass. lowest, Miss. highest
In 2013, infant mortality in Mississippi, the state with the highest rate, was more than twice as high as in Massachusetts, which had the lowest rate, the National Center for Health Statistics reported.
In Mississippi, infant mortality was 9.6 per 1,000 live births in 2013, which represents a 16% decline since 2005. Massachusetts’ lowest-in-the-nation rate that year was 4.18 per 1,000 live births, a drop of 18.5% since 2005, when it had a fourth-in-the-nation rate of 5.13, according to the data from the NCHS linked birth/infant death data set.
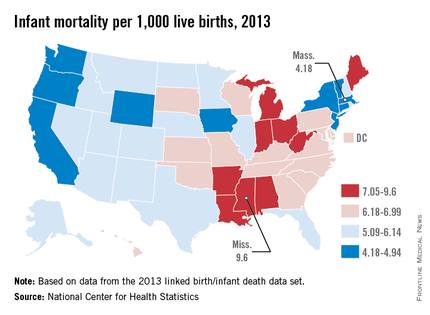
The District of Columbia’s 51% decline – going from a nation-topping rate of 13.67 per 1,000 births to 6.68 – was the largest drop from 2005 to 2013. Vermont’s decline of 33% was the largest among the states. Nine other states had declines of at least 20% from 2005 to 2013, while six states had increases.
Overall, national infant mortality was 5.96 in 2013, a drop of 13% since 2005.
In 2013, infant mortality in Mississippi, the state with the highest rate, was more than twice as high as in Massachusetts, which had the lowest rate, the National Center for Health Statistics reported.
In Mississippi, infant mortality was 9.6 per 1,000 live births in 2013, which represents a 16% decline since 2005. Massachusetts’ lowest-in-the-nation rate that year was 4.18 per 1,000 live births, a drop of 18.5% since 2005, when it had a fourth-in-the-nation rate of 5.13, according to the data from the NCHS linked birth/infant death data set.
The District of Columbia’s 51% decline – going from a nation-topping rate of 13.67 per 1,000 births to 6.68 – was the largest drop from 2005 to 2013. Vermont’s decline of 33% was the largest among the states. Nine other states had declines of at least 20% from 2005 to 2013, while six states had increases.
Overall, national infant mortality was 5.96 in 2013, a drop of 13% since 2005.

Medicare hospital costs down over last 6 months of life
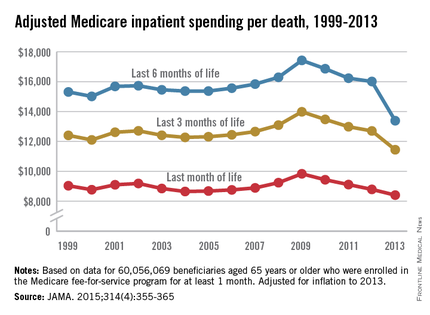
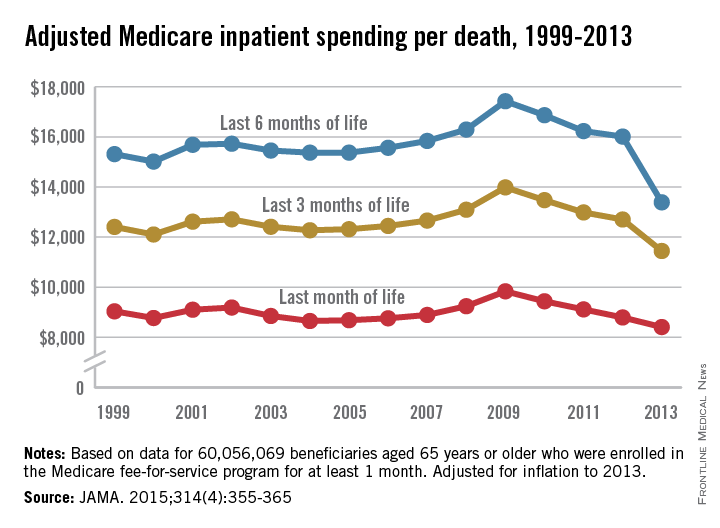
Inpatient costs for Medicare patients over the last 6 months of life dropped 23% per death from 2009 to 2013, a study showed.
After adjustment for inflation, the average inpatient cost for patients aged 65 years and older who died was over $17,400 in 2009. By 2013, Medicare spending in the last 6 months of life had dropped to just under $13,400. The trend in spending was similar over the last 3 months of life and over the last month, but the declines – 18% for the last 3 months and 14.5% for the last month – were not as great, reported Dr. Harlan M. Krumholz of Yale University in New Haven, Conn., and his associates (JAMA. 2015;314(4):355-365).
The investigators noted that “approximately 60% of spending in the last 6 months of beneficiaries’ lives occurred during their final month.”
The analysis included 60,056,069 individuals aged 65 years or older who were enrolled in a Medicare fee-for-service plan for at least 1 month between 1999 and 2013.
Dr. Krumholz is supported by a grant from the National Heart, Lung, and Blood Institute.
FROM JAMA
Medicare hospital-related mortality down since 1999
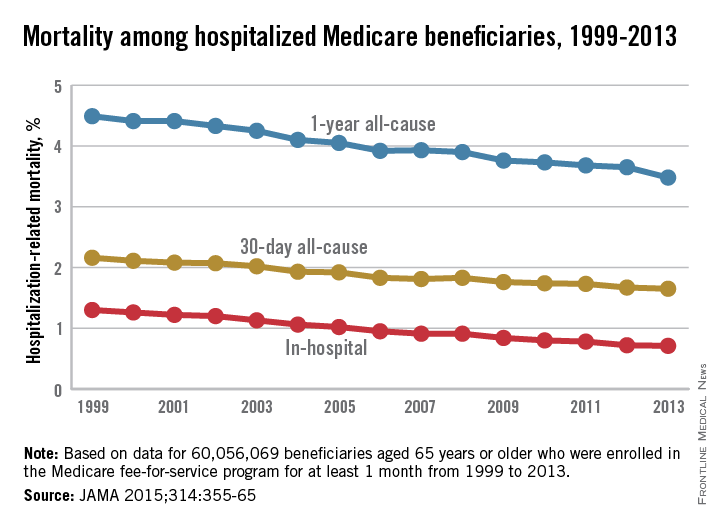
Several measures of mortality declined among hospitalized Medicare fee-for-service beneficiaries from 1999 to 2013, according to a study published July 28 in JAMA.
Over that time period, in-hospital mortality declined from 1.3% to 0.71%. Meanwhile, 30-day mortality declined from 2.16% in 1999 to 1.65% in 2013 and 1-year mortality slipped from 4.49% to 3.48% among 60,056,069 individuals aged 65 years or older who were enrolled in a Medicare fee-for-service plan for at least 1 month over the study period, reported Dr. Harlan M. Krumholz of Yale University in New Haven, Conn., and his associates.
The decline in mortality was accompanied by a drop in the number of hospitalizations, which went from more than 35,000/100,000 person-years of enrollment in 1999 to just under 27,000 in 2013. The number of beneficiaries admitted to the hospital at least once went down as well, from almost 22,000/100,000 person-years to more than 17,000, as did the number of hospitalizations that involved major surgery: 3,784/100,000 person-years in 1999 and 3,105 in 2013, the investigators noted (JAMA 2015;314:355-65).
For each of these measures, “the findings did not change substantially after accounting for beneficiaries’ demographic characteristics and geographical differences,” they wrote.
Dr. Krumholz is supported by a grant from the National Heart, Lung, and Blood Institute.
FROM JAMA

Massachusetts General named top hospital for 2015-2016
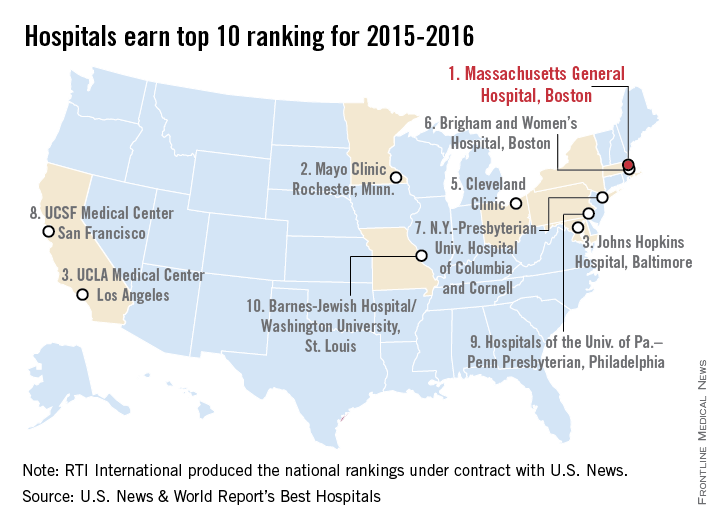
Massachusetts General Hospital in Boston earned the top spot in the latest Best Hospitals ranking from U.S. News & World Report.
After finishing second in the last two rankings, Massachusetts General regained the top spot it won in 2012-2013. The Mayo Clinic in Rochester, Minn., finished second in this year’s Honor Roll after taking the top spot last year, while Johns Hopkins Hospital, Baltimore, and UCLA Medical Center tied for third and the Cleveland Clinic was fifth, U.S. News announced on July 21.
For 2015-2016, there were 15 hospitals in the Honor Roll, which is reserved for those institutions that finish at or near the top in 6 or more of the 16 specialties included in the U.S. News rankings. This year, only 137 hospitals did well enough to be nationally ranked in one or more specialties. Both of those numbers are down from a year ago, when there were 17 hospitals in the Honor Roll and 144 that were ranked nationally in at least one specialty.
The 16 specialties used in the analysis are cancer, cardiology and heart surgery, diabetes and endocrinology, otolaryngology, gastroenterology and gastrointestinal surgery, geriatrics, gynecology, nephrology, neurology and neurosurgery, ophthalmology, orthopedics, psychiatry, pulmonology, rehabilitation, rheumatology, and urology.
This years’ ranking process initially included 4,716 nonfederal community hospitals. The research organization RTI International conducted the physician survey and produced the Best Hospitals methodology and national rankings under contract with U.S. News.