User login
Richard Franki is the associate editor who writes and creates graphs. He started with the company in 1987, when it was known as the International Medical News Group. In his years as a journalist, Richard has worked for Cap Cities/ABC, Disney, Harcourt, Elsevier, Quadrant, Frontline, and Internet Brands. In the 1990s, he was a contributor to the ill-fated Indications column, predecessor of Livin' on the MDedge.
Rate of schizophrenia-related ED visits twice as high in men
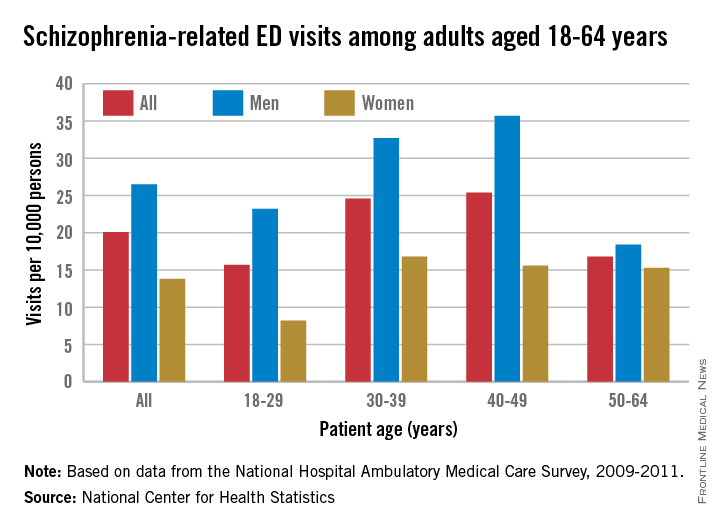
Schizophrenia-related visits to the emergency department were twice as common among men than among women during 2009-2011, the National Center for Health Statistics reported.
Men aged 18-64 years had a rate of 26.5 schizophrenia-related ED visits per 10,000 persons, compared with 13.8 per 10,000 for women. The difference was even greater for those aged 18-29 years, with rates of 23.2 for men and 8.2 for women – almost a threefold difference – according to data from the National Hospital Ambulatory Medical Care Survey.

Combined rates rose for those aged 30-39 and 40-49 years, with men’s rates staying significantly higher than women’s – a trend that did not hold for those aged 50-64 years. In that age group, the rate for men dropped to 18.4 per 10,000, only slightly higher than the 15.3 per 10,000 among women, the NCHS noted.
The report showed that homeless people accounted for 7.5% of schizophrenia-related ED visits over the 3-year period, compared with 0.9% of all other ED visits. For those who lived in a private residence, the rates were 69.2% of all schizophrenia-related visits and 92.3% of all other visits.
For the period of 2009-2011, there was an annual average of 382,000 ED visits related to schizophrenia among adults aged 18-64, for an overall rate of 20.1 per 10,000. A visit was considered schizophrenia related if it had a first-, second-, or third-listed diagnosis of schizophrenia.
Schizophrenia-related visits to the emergency department were twice as common among men than among women during 2009-2011, the National Center for Health Statistics reported.
Men aged 18-64 years had a rate of 26.5 schizophrenia-related ED visits per 10,000 persons, compared with 13.8 per 10,000 for women. The difference was even greater for those aged 18-29 years, with rates of 23.2 for men and 8.2 for women – almost a threefold difference – according to data from the National Hospital Ambulatory Medical Care Survey.
Combined rates rose for those aged 30-39 and 40-49 years, with men’s rates staying significantly higher than women’s – a trend that did not hold for those aged 50-64 years. In that age group, the rate for men dropped to 18.4 per 10,000, only slightly higher than the 15.3 per 10,000 among women, the NCHS noted.
The report showed that homeless people accounted for 7.5% of schizophrenia-related ED visits over the 3-year period, compared with 0.9% of all other ED visits. For those who lived in a private residence, the rates were 69.2% of all schizophrenia-related visits and 92.3% of all other visits.
For the period of 2009-2011, there was an annual average of 382,000 ED visits related to schizophrenia among adults aged 18-64, for an overall rate of 20.1 per 10,000. A visit was considered schizophrenia related if it had a first-, second-, or third-listed diagnosis of schizophrenia.
U.S. injury costs topped $671 billion in 2013
Over 30 million injuries were treated in U.S. emergency departments in 2013, costing an estimated $671 billion, the Centers for Disease Control and Prevention reported.
The largest share of that cost – almost $290 billion, or about 43% – came from the 3 million persons with nonfatal injuries who were hospitalized. Costs for the 27 million people who were treated and released from emergency departments were $167 billion, which was just under 25% of the total. The lifetime cost estimate for the almost 193,000 injury-associated deaths in 2013 was over $214 billion (32%), said Curtis Florence, Ph.D., of the CDC’s National Center for Injury Prevention and Control, Atlanta, and associates.
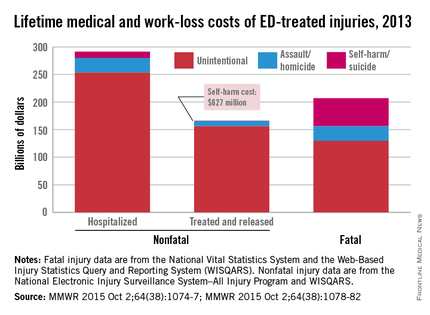
For each ED-treated injury-related death, the mean cost in terms of lost lifetime earnings and medical care provided was just over $1.1 million: Homicides cost over $1.6 million, suicides were $1.2 million each, and each unintentional injury death cost just under $1 million, they said (MMWR. 2015 Oct 2;64[38]:1074-77).
Drug poisonings, including prescription drug overdoses, accounted for the largest share of fatal injury costs (27%), followed by transportation-related deaths (23%) and firearm-related deaths (22%), Dr. Florence and associates noted.
The mean cost for each nonfatal injury (both hospitalized and treated and released from the ED) was $15,211. Self-harm injuries cost $25,121, compared with $23,034 for each assault and $14,685 for each unintentional injury (MMWR. 2015 Oct 2;64[38]:1078-82).
“Injuries cost Americans far too much money, suffering, and preventable death,” CDC Director Tom Frieden said in a written statement. “The doubling of deaths by drug poisoning, including prescription drug overdose and heroin, is particularly alarming.”
The investigators used data from the National Vital Statistics System and the Web-Based Injury Statistics Query and Reporting System (WISQARS) for injury-related deaths and the National Electronic Injury Surveillance System–All Injury Program and WISQARS for nonfatal injuries.
Over 30 million injuries were treated in U.S. emergency departments in 2013, costing an estimated $671 billion, the Centers for Disease Control and Prevention reported.
The largest share of that cost – almost $290 billion, or about 43% – came from the 3 million persons with nonfatal injuries who were hospitalized. Costs for the 27 million people who were treated and released from emergency departments were $167 billion, which was just under 25% of the total. The lifetime cost estimate for the almost 193,000 injury-associated deaths in 2013 was over $214 billion (32%), said Curtis Florence, Ph.D., of the CDC’s National Center for Injury Prevention and Control, Atlanta, and associates.
For each ED-treated injury-related death, the mean cost in terms of lost lifetime earnings and medical care provided was just over $1.1 million: Homicides cost over $1.6 million, suicides were $1.2 million each, and each unintentional injury death cost just under $1 million, they said (MMWR. 2015 Oct 2;64[38]:1074-77).
Drug poisonings, including prescription drug overdoses, accounted for the largest share of fatal injury costs (27%), followed by transportation-related deaths (23%) and firearm-related deaths (22%), Dr. Florence and associates noted.
The mean cost for each nonfatal injury (both hospitalized and treated and released from the ED) was $15,211. Self-harm injuries cost $25,121, compared with $23,034 for each assault and $14,685 for each unintentional injury (MMWR. 2015 Oct 2;64[38]:1078-82).
“Injuries cost Americans far too much money, suffering, and preventable death,” CDC Director Tom Frieden said in a written statement. “The doubling of deaths by drug poisoning, including prescription drug overdose and heroin, is particularly alarming.”
The investigators used data from the National Vital Statistics System and the Web-Based Injury Statistics Query and Reporting System (WISQARS) for injury-related deaths and the National Electronic Injury Surveillance System–All Injury Program and WISQARS for nonfatal injuries.
FROM MMWR

CDC details nonmedical vaccination exemptions
Idaho had the highest percentage of current kindergartners who received nonmedical vaccination exemptions, the Centers for Disease Control and Prevention reported.
For the 2014-2015 school year, 6.2% of the state’s kindergartners received nonmedical exemptions: 137 were religious and 1,295 were philosophic. Vermont had the second-highest exemption rate at 5.9%, almost all of which were philosophic. Oregon was third at 5.8%, but the state does not report religious and philosophic exemptions separately, the CDC said (MMWR 2015;64[33]:897-904).
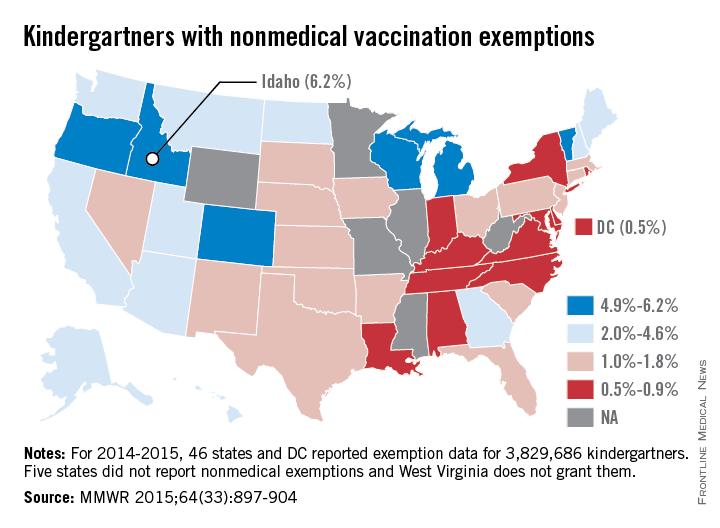
The lowest rate for 2014-2015 was in the District of Columbia, where just 0.5% of kindergartners had nonmedical exemptions for vaccination. The District of Columbia, along with 29 states, does not allow philosophic exemptions The state with the lowest rate was Louisiana at 0.6%, most of them philosophic, with three states tied at 0.7%: Alabama, Kentucky, and New York. None of those three states allows philosophic exemptions, according to the CDC.
Of the 15 states that reported philosophic exemptions, Louisiana had the lowest rate at 0.5% of all kindergartners and Vermont had the highest rate at 5.8%. Of the 41 states that reported religious exemptions, Utah was the lowest with a rate of 0.03% of all kindergartners and Alaska was the highest with a rate of 4.5%, the CDC data show.
Altogether, 46 states and D.C. reported nonmedical exemption data for 3,829,686 current kindergartners. Five states did not report nonmedical exemptions and West Virginia does not grant them. As of the 2016-2017 school year, California will remove both religious and philosophical exemptions and Vermont will remove philosophic exemptions, the CDC noted.
Idaho had the highest percentage of current kindergartners who received nonmedical vaccination exemptions, the Centers for Disease Control and Prevention reported.
For the 2014-2015 school year, 6.2% of the state’s kindergartners received nonmedical exemptions: 137 were religious and 1,295 were philosophic. Vermont had the second-highest exemption rate at 5.9%, almost all of which were philosophic. Oregon was third at 5.8%, but the state does not report religious and philosophic exemptions separately, the CDC said (MMWR 2015;64[33]:897-904).
The lowest rate for 2014-2015 was in the District of Columbia, where just 0.5% of kindergartners had nonmedical exemptions for vaccination. The District of Columbia, along with 29 states, does not allow philosophic exemptions The state with the lowest rate was Louisiana at 0.6%, most of them philosophic, with three states tied at 0.7%: Alabama, Kentucky, and New York. None of those three states allows philosophic exemptions, according to the CDC.
Of the 15 states that reported philosophic exemptions, Louisiana had the lowest rate at 0.5% of all kindergartners and Vermont had the highest rate at 5.8%. Of the 41 states that reported religious exemptions, Utah was the lowest with a rate of 0.03% of all kindergartners and Alaska was the highest with a rate of 4.5%, the CDC data show.
Altogether, 46 states and D.C. reported nonmedical exemption data for 3,829,686 current kindergartners. Five states did not report nonmedical exemptions and West Virginia does not grant them. As of the 2016-2017 school year, California will remove both religious and philosophical exemptions and Vermont will remove philosophic exemptions, the CDC noted.
FROM MORBIDITY AND MORTALITY WEEKLY REPORT

Income varies among Medicare beneficiaries
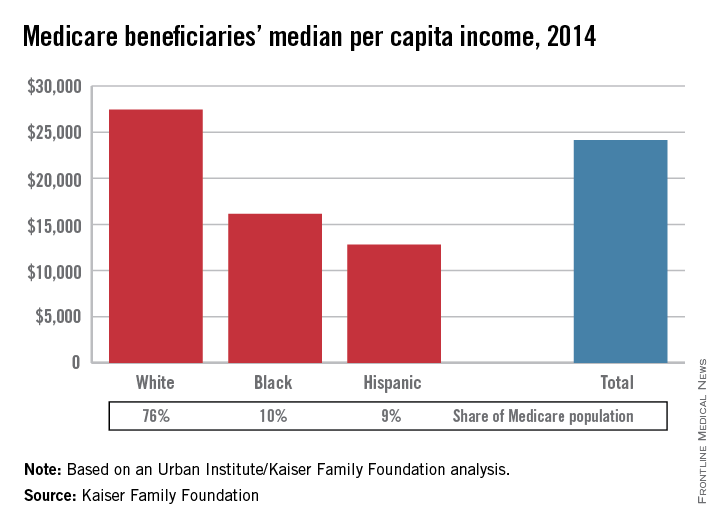
The median income of Medicare beneficiaries was $24,150 in 2014, with considerable variation across various demographic characteristics, the Kaiser Family Foundation reported.
For whites, median per capita income was $27,450 in 2014, compared with $16,150 for blacks and $12,800 for Hispanic beneficiaries, according to the Kaiser/Urban Institute analysis.
About 33% of Medicare beneficiaries were below 200% of the federal poverty level (FPL) – which was $11,670 for an individual last year – and their median income was $12,150. In 2014, 29% of beneficiaries were at 200%-400% of the FPL, with a median income of $23,850, and 38% were at 400% of the FPL or higher, with a median income of $50,200, the report said.
Marriage had quite an effect on income, with married individuals having a median income of $28,300, compared with $21,800 for those who were widowed, $20,500 for those who were divorced, and $14,450 for those who were single. Education also made a difference: Median income for Medicare beneficiaries with a college degree was $41,500, compared with $13,850 for those who had not graduated from high school, according to the Kaiser and Urban Institute investigators.
“As policy makers consider options for decreasing federal Medicare spending and addressing the federal debt and deficit, these findings raise questions about the extent to which the next generation of Medicare beneficiaries will be able to bear a larger share of costs,” the researchers wrote.
Among all beneficiaries in 2014, they noted, 25% had incomes below $14,350 per person and 5% had incomes above $93,000.

Funding down for rheumatology research
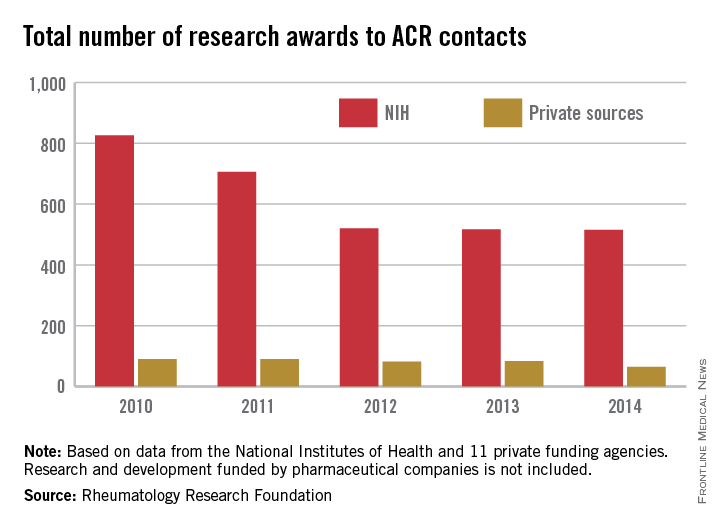
The number of rheumatology research projects funded by the National Institutes of Health dropped by 52% from 2010 to 2014, while the number funded by private foundations fell by 29% over that period, according to data published by the Rheumatology Research Foundation (RRF).
In 2010, the NIH granted awards for 826 projects to “ACR contacts” – members of the American College of Rheumatology or the Association of Rheumatology Health Professionals, as well as individuals who had nonmember profiles within the ACR membership database. By 2014, that number was down to 515, a drop of 52%. In 2010, there were 90 awards granted by a group of 11 private foundations to ACR contacts, with the number of awards falling by 29% to 64 by 2014, the RRF reported.

In that same time period, NIH funding to ACR contacts dropped 41% from $1.16 billion to $686 million while investment by the private foundations – one of which was the RRF – dropped 34% from $20.7 million in 2010 to $13.6 million in 2014, the report showed. Research and development funded by pharmaceutical companies was not included.
Not surprisingly, federal research funding for conditions and diseases associated with rheumatology was mostly down from 2010 to 2014, although by varying degrees. Funding for osteoporosis dropped by 31%, while arthritis and lupus were both down about 22% and Lyme disease spending fell by almost 21%. Federal funding of autoimmune disease research was down by 16%, and research on aging was almost 14% lower. Funding was up for scleroderma (14%) and fibromyalgia (11%), although the total spending for these two areas was much lower than for the others, with 2014 scleroderma funding ($24 million) coming to about a tenth of that for arthritis ($239 million), the RRF reported.
The number of rheumatology research projects funded by the National Institutes of Health dropped by 52% from 2010 to 2014, while the number funded by private foundations fell by 29% over that period, according to data published by the Rheumatology Research Foundation (RRF).
In 2010, the NIH granted awards for 826 projects to “ACR contacts” – members of the American College of Rheumatology or the Association of Rheumatology Health Professionals, as well as individuals who had nonmember profiles within the ACR membership database. By 2014, that number was down to 515, a drop of 52%. In 2010, there were 90 awards granted by a group of 11 private foundations to ACR contacts, with the number of awards falling by 29% to 64 by 2014, the RRF reported.
In that same time period, NIH funding to ACR contacts dropped 41% from $1.16 billion to $686 million while investment by the private foundations – one of which was the RRF – dropped 34% from $20.7 million in 2010 to $13.6 million in 2014, the report showed. Research and development funded by pharmaceutical companies was not included.
Not surprisingly, federal research funding for conditions and diseases associated with rheumatology was mostly down from 2010 to 2014, although by varying degrees. Funding for osteoporosis dropped by 31%, while arthritis and lupus were both down about 22% and Lyme disease spending fell by almost 21%. Federal funding of autoimmune disease research was down by 16%, and research on aging was almost 14% lower. Funding was up for scleroderma (14%) and fibromyalgia (11%), although the total spending for these two areas was much lower than for the others, with 2014 scleroderma funding ($24 million) coming to about a tenth of that for arthritis ($239 million), the RRF reported.
Spending up for the most costly medical conditions
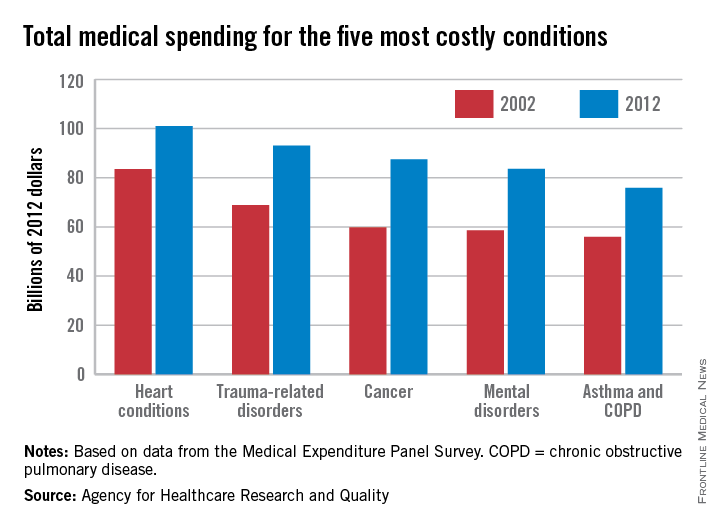
Spending for each of the five most costly medical conditions rose by at least 21% from 2002 to 2012, the Agency for Healthcare Research and Quality reported.
That smallest-of-the-five increase of 21% belonged to the most expensive of the five, heart conditions, which rose from $83.5 billion in 2002 (in 2012 dollars) to $101 billion in 2012. The largest-of-the-five increase went to cancer, which jumped 46% from $59.8 billion to $87.5 billion, with mental disorders showing the next-largest increase as costs rose 43% from $58.6 billion to $83.6 billion, according to data from the Medical Expenditure Panel Survey. The same conditions made up the top five in both 2002 and 2012.
The average expenditure per person affected actually went down slightly for mental disorders – from $1,887 to $1,849 – but the number of persons affected rose 45%, from 31.1 million in 2002 to 45.2 million in 2012, which was the largest increase among the five most costly conditions. The number of people affected went down 1% for trauma-related disorders and 10% for asthma and chronic obstructive pulmonary disease and rose almost 18% for heart conditions and 42% for cancer, the AHRQ said.

Older Women Have Older Hearts
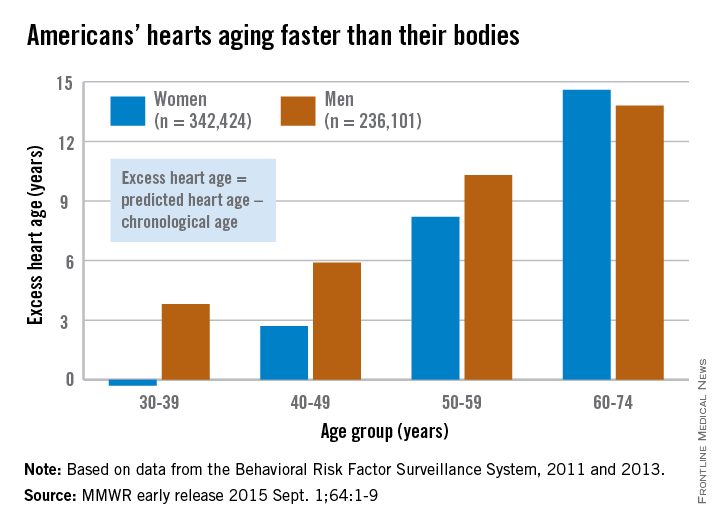
Women may live longer than men, but it’s not because they are younger at heart, according to an MMWR report released Sept. 1.
In the first study offering population-level estimates of heart age, women in the oldest age group, 60-74 years, had older hearts than did men of the same age. The excess heart age for the women was 14.6 years, compared with 13.8 years for men, said Quanhe Yang, Ph.D., of the Centers for Disease Control and Prevention, Atlanta, and his associates. Excess heart age is predicted heart age minus chronological age.
The situation was reversed in the youngest age group: Women aged 30-39 years had an excess heart age of –0.3 years and men had an excess heart age of 3.8 years, they said. The women, in other words, had hearts that were younger than their chronological age.
The concept of heart age was introduced in 2008 by the Framingham Heart Study. “Heart age is the predicted age of [a person’s] heart and blood vessels based on their blood pressure, weight, and smoking and diabetes status,” the investigators explained.
The study used data from 578,525 participants in the Behavioral Risk Factor Surveillance System in 2011 and 2013.
FROM MMWR
Older women have older hearts
Women may live longer than men, but it’s not because they are younger at heart, according to an MMWR report released Sept. 1.
In the first study offering population-level estimates of heart age, women in the oldest age group, 60-74 years, had older hearts than did men of the same age. The excess heart age for the women was 14.6 years, compared with 13.8 years for men, said Quanhe Yang, Ph.D., of the Centers for Disease Control and Prevention, Atlanta, and his associates. Excess heart age is predicted heart age minus chronological age.
The situation was reversed in the youngest age group: Women aged 30-39 years had an excess heart age of –0.3 years and men had an excess heart age of 3.8 years, they said. The women, in other words, had hearts that were younger than their chronological age.
The concept of heart age was introduced in 2008 by the Framingham Heart Study. “Heart age is the predicted age of [a person’s] heart and blood vessels based on their blood pressure, weight, and smoking and diabetes status,” the investigators explained.
The study used data from 578,525 participants in the Behavioral Risk Factor Surveillance System in 2011 and 2013.
FROM MMWR

Insurance marketplace enrollment nears 10 million
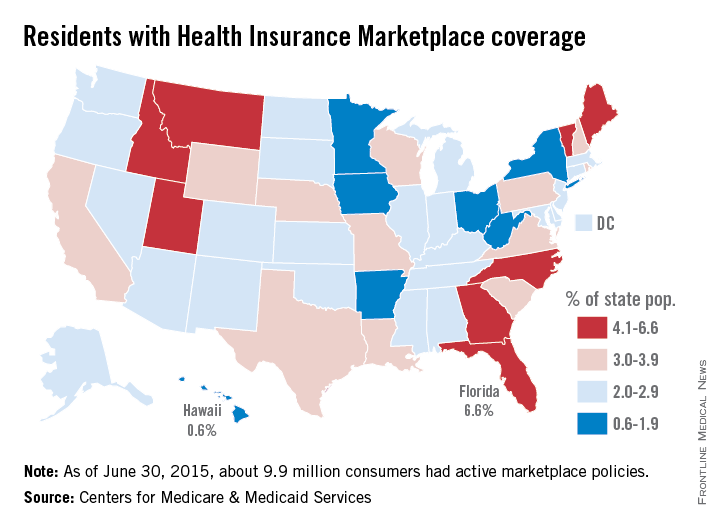
The Health Insurance Marketplaces have a nationwide enrollment of about 9.9 million consumers, according to the latest data release from the Centers for Medicare & Medicaid Services.
As of June 30, the 37 federally facilitated marketplaces had an enrollment of 7.2 million and the 13 state-based marketplaces plus the District of Columbia had an enrollment of 2.7 million. That adds up to nearly 10 million effectuated policies – government-speak meaning that the premiums had been paid and the accounts were active.

The state with the highest marketplace enrollment was California, with almost 1.4 million consumers effectuating themselves into a policy. The state with the highest percentage of its population (6.6%) enrolled, however, is Florida, which has just over 1.3 million enrollees among a population that is less than half of the Golden State’s. Idaho and Vermont were tied for second at 5.3%, with Maine (5.0%) and Montana (4.7%) right behind, the CMS data show.
Marketplace enrollees are a little harder to find in Hawaii, which had the lowest percentage of its population enrolled at 0.6% – just 8,802 effectuaters among the state’s 1.42 million residents. Next lowest was Minnesota at 0.9%, followed by Iowa (1.3%), Ohio (1.6%), Arkansas (1.7%), and West Virginia (1.7%).
The CMS also noted that, nationwide, 83.7% of marketplace enrollees – about 8.3 million consumers – receive an advanced premium tax credit worth an average of $270 a month. About 56% of enrollees also receive cost-sharing reductions, but the value of those reductions was not included in the report.
The Health Insurance Marketplaces have a nationwide enrollment of about 9.9 million consumers, according to the latest data release from the Centers for Medicare & Medicaid Services.
As of June 30, the 37 federally facilitated marketplaces had an enrollment of 7.2 million and the 13 state-based marketplaces plus the District of Columbia had an enrollment of 2.7 million. That adds up to nearly 10 million effectuated policies – government-speak meaning that the premiums had been paid and the accounts were active.
The state with the highest marketplace enrollment was California, with almost 1.4 million consumers effectuating themselves into a policy. The state with the highest percentage of its population (6.6%) enrolled, however, is Florida, which has just over 1.3 million enrollees among a population that is less than half of the Golden State’s. Idaho and Vermont were tied for second at 5.3%, with Maine (5.0%) and Montana (4.7%) right behind, the CMS data show.
Marketplace enrollees are a little harder to find in Hawaii, which had the lowest percentage of its population enrolled at 0.6% – just 8,802 effectuaters among the state’s 1.42 million residents. Next lowest was Minnesota at 0.9%, followed by Iowa (1.3%), Ohio (1.6%), Arkansas (1.7%), and West Virginia (1.7%).
The CMS also noted that, nationwide, 83.7% of marketplace enrollees – about 8.3 million consumers – receive an advanced premium tax credit worth an average of $270 a month. About 56% of enrollees also receive cost-sharing reductions, but the value of those reductions was not included in the report.
Patients rate specialists on timeliness of care
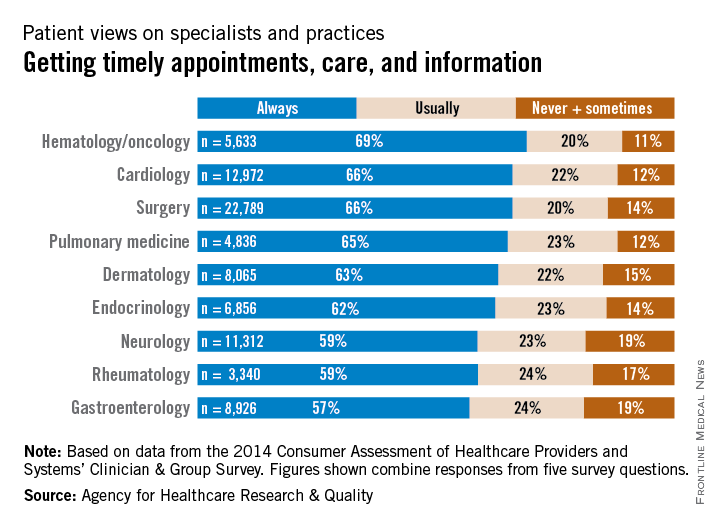
When it comes to giving patients timely care, hematology/oncology practices have an edge over other specialties, the Agency for Healthcare Research and Quality reported.
In a composite of five survey questions asking if physicians provided timely appointments, care, and information, 69% of hematology/oncology patients said that their physicians always provided such care, compared with 66% of cardiology and surgery patients and 65% of pulmonology patients. None of the other specialties included in the report had an always rate higher than 63%, according to data from the Consumer Assessment of Healthcare Providers and Systems (CAHPS) Clinician & Group Survey.
When specialists of the non–primary care variety were considered as a group, 64% of respondents said that they always received timely care, compared with 59% for primary care physicians (not including pediatricians). Overall, 62% of respondents said that physician offices always provided timely care, the survey data show.
The CAHPS database includes a total of 798,967 patient responses submitted in 2014 and early 2015 by 3,962 medical practices.