User login
Richard Franki is the associate editor who writes and creates graphs. He started with the company in 1987, when it was known as the International Medical News Group. In his years as a journalist, Richard has worked for Cap Cities/ABC, Disney, Harcourt, Elsevier, Quadrant, Frontline, and Internet Brands. In the 1990s, he was a contributor to the ill-fated Indications column, predecessor of Livin' on the MDedge.
Joint Commission names top-performing hospitals
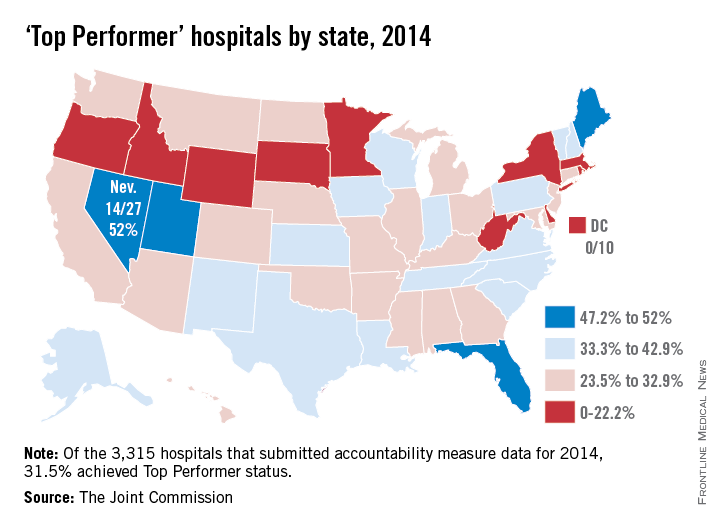
Approximately 31% of U.S. hospitals accredited by the Joint Commission earned “Top Performer” status for 2014, the commission said in its annual report for 2015.
Of the 3,315 hospitals that submitted clinical performance data to the Joint Commission for 2014, 1,043 (31.5%) were recognized as Top Performers. Both numbers were down from 2013, when there were 1,224 (36.9%) top-performing hospitals.

The top-performing state was Nevada, which had 14 of 27 hospitals (52%) recognized by the commission. California and Texas tied for the most recognized hospitals at 95 each, but higher total numbers of hospitals gave those states much lower top-performer rates: 31.3% for California and 37.5% for Texas. Florida, with 47.2% of its hospitals recognized, was the only state with 100 or more hospitals to have a top-performer rate of more than 40%, according to the Joint Commission data.
At the other end of the scale, none of the District of Columbia’s 10 submitting hospitals earned Top Performer status. The state with the lowest rate was Wyoming, where just 1 of 11 hospitals (9.1%) was recognized by the commission. At 18.6%, New York was the only one of the nine states with more than 100 submitting hospitals to have a top-performer rate below 20%, the report noted.
Scores for individual hospitals were derived from 12 sets of accountability measures, which include heart attack care, surgical care, children’s asthma care, and stroke care. Top Performers must “achieve cumulative performance of 95% or above across all reported accountability measures; achieve performance of 95% or above on each and every reported accountability measure with at least 30 denominator cases; and have at least one core measure set with a composite rate of 95% or above and, within that measure set, achieve a performance rate of 95% or above on all applicable individual accountability measures.”
The Top Performer program is going on hiatus for 2016 “due to the evolving national performance measure environment – particularly within the Centers for Medicare & Medicaid Services,” Joint Commission president and chief executive officer Dr. Mark R. Chassin said. “I am confident that hospitals will continue to improve, and that in 2017, we will return with a refreshed program that will better fit the evolving national measure environment.”
Approximately 31% of U.S. hospitals accredited by the Joint Commission earned “Top Performer” status for 2014, the commission said in its annual report for 2015.
Of the 3,315 hospitals that submitted clinical performance data to the Joint Commission for 2014, 1,043 (31.5%) were recognized as Top Performers. Both numbers were down from 2013, when there were 1,224 (36.9%) top-performing hospitals.
The top-performing state was Nevada, which had 14 of 27 hospitals (52%) recognized by the commission. California and Texas tied for the most recognized hospitals at 95 each, but higher total numbers of hospitals gave those states much lower top-performer rates: 31.3% for California and 37.5% for Texas. Florida, with 47.2% of its hospitals recognized, was the only state with 100 or more hospitals to have a top-performer rate of more than 40%, according to the Joint Commission data.
At the other end of the scale, none of the District of Columbia’s 10 submitting hospitals earned Top Performer status. The state with the lowest rate was Wyoming, where just 1 of 11 hospitals (9.1%) was recognized by the commission. At 18.6%, New York was the only one of the nine states with more than 100 submitting hospitals to have a top-performer rate below 20%, the report noted.
Scores for individual hospitals were derived from 12 sets of accountability measures, which include heart attack care, surgical care, children’s asthma care, and stroke care. Top Performers must “achieve cumulative performance of 95% or above across all reported accountability measures; achieve performance of 95% or above on each and every reported accountability measure with at least 30 denominator cases; and have at least one core measure set with a composite rate of 95% or above and, within that measure set, achieve a performance rate of 95% or above on all applicable individual accountability measures.”
The Top Performer program is going on hiatus for 2016 “due to the evolving national performance measure environment – particularly within the Centers for Medicare & Medicaid Services,” Joint Commission president and chief executive officer Dr. Mark R. Chassin said. “I am confident that hospitals will continue to improve, and that in 2017, we will return with a refreshed program that will better fit the evolving national measure environment.”
U.S. flu activity increases slightly
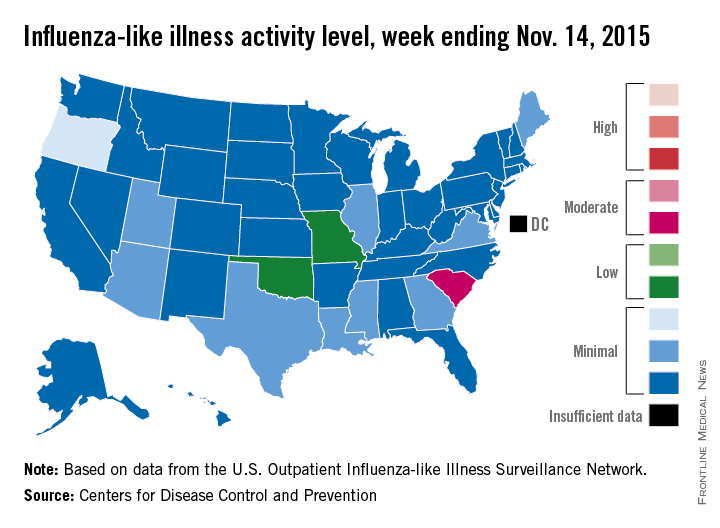
Activity of influenza-like illness (ILI) “increased slightly in the United States” during week 5 of the 2015-2016 influenza season, the Centers for Disease Control and Prevention reported Nov. 20.
Thirteen states were above level-1 activity as of Nov. 14, 2015, compared with seven the week before. South Carolina jumped all the way up to “moderate” activity (level 6) and Missouri and Oklahoma moved into the low-activity category (level 4). Oregon remained at a still-minimal level 3, while Arizona, Georgia, Illinois, Louisiana, Maine, Mississippi, Texas, Utah, and Virginia are at level 2, according to the CDC.

The first influenza-associated pediatric death was reported this week, although it actually occurred during week 4 (the week ending Nov. 7), the CDC said. There has been an average of 143 flu-associated pediatric deaths over the last three flu seasons.
ILI is defined as fever (temperature of 100° F or greater) and cough and/or sore throat. Activity level within a state is the proportion of outpatient visits to health care providers for influenza-like illness.
That proportion for the United States overall was 1.6%, which is up from last week’s 1.4% but still below the national baseline of 2.1%, the CDC said.
Activity of influenza-like illness (ILI) “increased slightly in the United States” during week 5 of the 2015-2016 influenza season, the Centers for Disease Control and Prevention reported Nov. 20.
Thirteen states were above level-1 activity as of Nov. 14, 2015, compared with seven the week before. South Carolina jumped all the way up to “moderate” activity (level 6) and Missouri and Oklahoma moved into the low-activity category (level 4). Oregon remained at a still-minimal level 3, while Arizona, Georgia, Illinois, Louisiana, Maine, Mississippi, Texas, Utah, and Virginia are at level 2, according to the CDC.
The first influenza-associated pediatric death was reported this week, although it actually occurred during week 4 (the week ending Nov. 7), the CDC said. There has been an average of 143 flu-associated pediatric deaths over the last three flu seasons.
ILI is defined as fever (temperature of 100° F or greater) and cough and/or sore throat. Activity level within a state is the proportion of outpatient visits to health care providers for influenza-like illness.
That proportion for the United States overall was 1.6%, which is up from last week’s 1.4% but still below the national baseline of 2.1%, the CDC said.
U.S. influenza activity minimal so far
Four weeks into the 2015-2016 flu season, activity levels of influenza-like illness (ILI) are minimal in all 50 states, the Centers for Disease Control and Prevention reported Nov. 13.
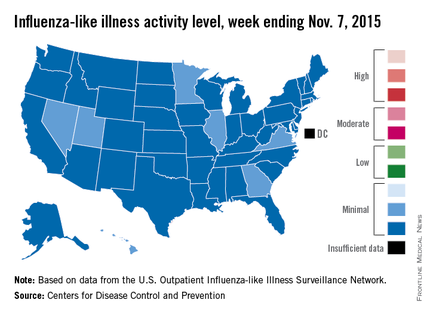
Seven states – Georgia, Hawaii, Illinois, Minnesota, Nevada, Utah, and Virginia – had level 2 activity for the week ending Nov. 7, 2015, which, although still minimal, was higher than the level 1 activity in the other 43 states. There was a moderate level of influenza-like illness activity (level 7) in Puerto Rico, which was up from level 6 the week before, and there were insufficient data to determine flu activity in the District of Columbia, according to the CDC.
ILI is defined as fever (temperature of 100° F or greater) and cough and/or sore throat. Activity level within a state is the proportion of outpatient visits to health care providers for influenza-like illness.
For the country overall, the proportion of outpatient visits for ILI was 1.4%, which is below the national baseline of 2.1% for week 4 of the flu season, the CDC noted.
Four weeks into the 2015-2016 flu season, activity levels of influenza-like illness (ILI) are minimal in all 50 states, the Centers for Disease Control and Prevention reported Nov. 13.
Seven states – Georgia, Hawaii, Illinois, Minnesota, Nevada, Utah, and Virginia – had level 2 activity for the week ending Nov. 7, 2015, which, although still minimal, was higher than the level 1 activity in the other 43 states. There was a moderate level of influenza-like illness activity (level 7) in Puerto Rico, which was up from level 6 the week before, and there were insufficient data to determine flu activity in the District of Columbia, according to the CDC.
ILI is defined as fever (temperature of 100° F or greater) and cough and/or sore throat. Activity level within a state is the proportion of outpatient visits to health care providers for influenza-like illness.
For the country overall, the proportion of outpatient visits for ILI was 1.4%, which is below the national baseline of 2.1% for week 4 of the flu season, the CDC noted.

U.S. brings home a ‘C’ on preterm birth report card
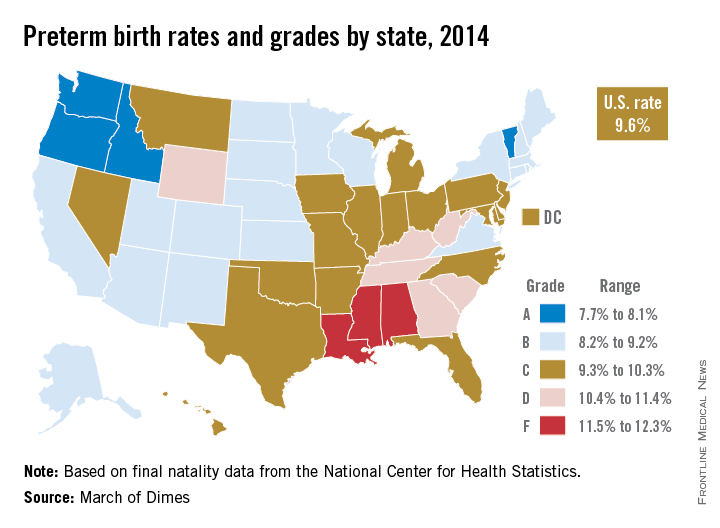
The United States’ 9.6% preterm birth rate in 2014 earned a grade of C on the March of Dimes 2015 Premature Birth Report Card.
Although the United States ranks poorly among high-resource countries when it comes to preterm births, the organization said in a statement, the rate for 2014 was good enough to meet the March of Dimes 2020 goal, which was 9.6%. The organization has reset the goal to 8.1% of live births by 2020.
“Reaching our goal ahead of schedule is progress, but it is not victory – our work is far from done,” Dr. Jennifer L. Howse, president of the March of Dimes, said in the statement.
Among the states, Oregon (7.7%), Vermont (7.9%), Idaho (8.1%), and Washington (8.1%) were the only ones to receive a grade of A. Mississippi (12.9%), Louisiana (12.3%), and Alabama (11.7%) were at the bottom of the class with Fs. Nineteen states earned a B, 18 states and the District of Columbia received a C, and six states received a D, according to final natality data for 2014 from the National Center for Health Statistics.
Among the 100 cities with the highest numbers of births, Portland, Ore., had the lowest preterm birth rate at 7.2%, while Shreveport, La., had the highest rate at 18.8%. The only other cities that earned an A were Oxnard, Calif.; Seattle;and St. Paul, Minn. A total of 17 cities received a grade of F.
“As our new list of city preterm birth rates highlights, many areas of the country, and tens of thousands of families, are not sharing in [the country’s] success. No baby should have to battle the health consequences of an early birth. All babies, everywhere deserve a healthy start in life,” Dr. Howse said.

Avoidable Admissions for Hypertension Highest in Blacks
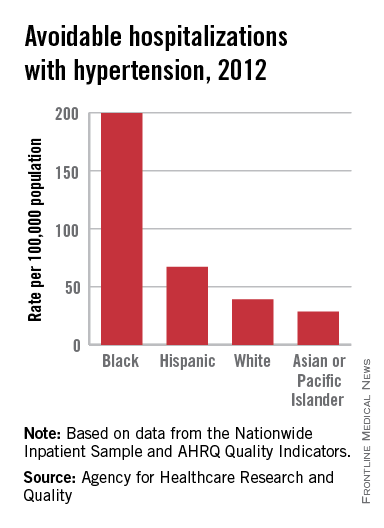
The rate of avoidable hospitalizations with hypertension was far higher for blacks in 2012 than it was among other races/ethnicities, the Agency for Healthcare Research and Quality reported.
That year, the rate for blacks was 200 admissions per 100,000 population, compared with 67 per 100,000 for Hispanics, 39 for whites, and 29 for Asians/Pacific Islanders, according to data from the Nationwide Inpatient Sample and AHRQ Quality Indicators.
“Hospitalizations due to ambulatory care–sensitive conditions such as hypertension … should be largely prevented if ambulatory care is provided in a timely and effective manner,” the AHRQ noted in its 2014 National Healthcare Quality and Disparities Report–Chartbook on Care Coordination.

Avoidable admissions for hypertension highest in blacks
The rate of avoidable hospitalizations with hypertension was far higher for blacks in 2012 than it was among other races/ethnicities, the Agency for Healthcare Research and Quality reported.
That year, the rate for blacks was 200 admissions per 100,000 population, compared with 67 per 100,000 for Hispanics, 39 for whites, and 29 for Asians/Pacific Islanders, according to data from the Nationwide Inpatient Sample and AHRQ Quality Indicators.
“Hospitalizations due to ambulatory care–sensitive conditions such as hypertension … should be largely prevented if ambulatory care is provided in a timely and effective manner,” the AHRQ noted in its 2014 National Healthcare Quality and Disparities Report–Chartbook on Care Coordination.
Over 40% of patients asking for an advertised drug get it
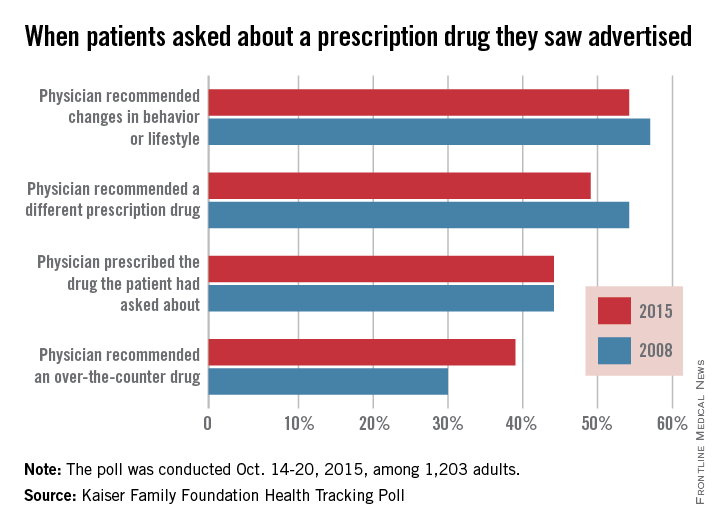
About 28% of patients surveyed say that they have talked to a physician about a prescription drug they saw advertised, and 44% of those patients report that they were given the drug they asked about, according to a Kaiser Family Foundation Health Tracking Poll conducted Oct. 14-20.
About 54% say that their physicians recommended behavior or lifestyle changes after being asked about a drug the patient had seen advertised, while 49% of patients say that the physician recommended a different prescription drug and 39% say that the physician recommended an over-the-counter drug, Kaiser reported.

The results were similar to a Health Tracking Poll conducted in March of 2008, when 32% of patients had talked with their physicians about a drug they had seen advertised. Of those patients, 57% had physicians who recommended lifestyle or behavior changes, 54% recommended a different prescription drug, 44% recommended the drug the patient asked about, and 30% recommended an OTC drug.
The 2015 poll was conducted by phone among a nationally representative sample of 1,203 adults living in the United States.
About 28% of patients surveyed say that they have talked to a physician about a prescription drug they saw advertised, and 44% of those patients report that they were given the drug they asked about, according to a Kaiser Family Foundation Health Tracking Poll conducted Oct. 14-20.
About 54% say that their physicians recommended behavior or lifestyle changes after being asked about a drug the patient had seen advertised, while 49% of patients say that the physician recommended a different prescription drug and 39% say that the physician recommended an over-the-counter drug, Kaiser reported.
The results were similar to a Health Tracking Poll conducted in March of 2008, when 32% of patients had talked with their physicians about a drug they had seen advertised. Of those patients, 57% had physicians who recommended lifestyle or behavior changes, 54% recommended a different prescription drug, 44% recommended the drug the patient asked about, and 30% recommended an OTC drug.
The 2015 poll was conducted by phone among a nationally representative sample of 1,203 adults living in the United States.
Hospitals improve breastfeeding support
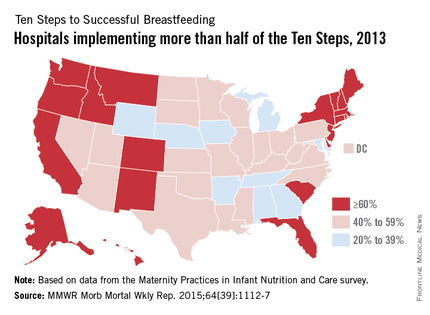
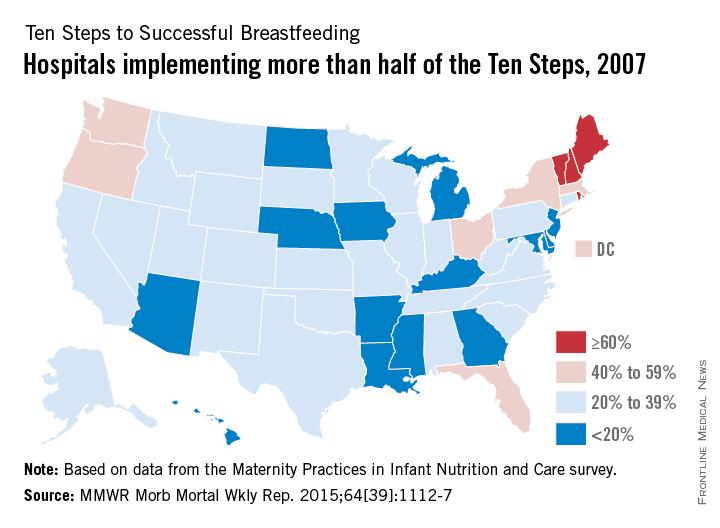
The number of hospitals implementing a majority of the Ten Steps to Successful Breastfeeding, a global standard for hospital care, nearly doubled from 2007 to 2013, the Centers for Disease Control and Prevention reported Oct. 8.
Almost 54% of hospitals nationwide had implemented more than half of the Ten Steps by 2013, compared with 28.7% in 2007, according to data from the biennial Maternity Practices in Infant Nutrition and Care survey (MMWR Morb Mortal Wkly Rep. 2015;64[39]:1112-7).

The Ten Steps to Successful Breastfeeding are policies and practices that form the core of the Baby-Friendly Hospital Initiative, a program launched in 1991 by the World Health Organization and the United Nations Children’s Fund. The Ten Steps that hospitals can take include:
• “Have a written breastfeeding policy that is routinely communicated to all health care staff.”
• “Help mothers initiate breastfeeding within 1 hour of birth.”
• “Practice rooming-in – allow mothers and infants to remain together 24 hours per day.”
Since 2007, when the CDC first surveyed hospitals regarding the Ten Steps, the number of states with more than 60% of hospitals implementing a majority of the steps increased from 4 to 21; the number of states with less than 20% of hospitals implementing a majority dropped from 15 to 0, the CDC noted.
“Breastfeeding has immense health benefits for babies and their mothers,” Dr. Tom Frieden, CDC director, said in a written statement. “More hospitals are better supporting new moms to breastfeed – every newborn should have the best possible start in life.”
The number of hospitals implementing a majority of the Ten Steps to Successful Breastfeeding, a global standard for hospital care, nearly doubled from 2007 to 2013, the Centers for Disease Control and Prevention reported Oct. 8.
Almost 54% of hospitals nationwide had implemented more than half of the Ten Steps by 2013, compared with 28.7% in 2007, according to data from the biennial Maternity Practices in Infant Nutrition and Care survey (MMWR Morb Mortal Wkly Rep. 2015;64[39]:1112-7).
The Ten Steps to Successful Breastfeeding are policies and practices that form the core of the Baby-Friendly Hospital Initiative, a program launched in 1991 by the World Health Organization and the United Nations Children’s Fund. The Ten Steps that hospitals can take include:
• “Have a written breastfeeding policy that is routinely communicated to all health care staff.”
• “Help mothers initiate breastfeeding within 1 hour of birth.”
• “Practice rooming-in – allow mothers and infants to remain together 24 hours per day.”
Since 2007, when the CDC first surveyed hospitals regarding the Ten Steps, the number of states with more than 60% of hospitals implementing a majority of the steps increased from 4 to 21; the number of states with less than 20% of hospitals implementing a majority dropped from 15 to 0, the CDC noted.
“Breastfeeding has immense health benefits for babies and their mothers,” Dr. Tom Frieden, CDC director, said in a written statement. “More hospitals are better supporting new moms to breastfeed – every newborn should have the best possible start in life.”
FROM MMWR
For young adults, suicide rate highest in American Indians/Alaska Natives
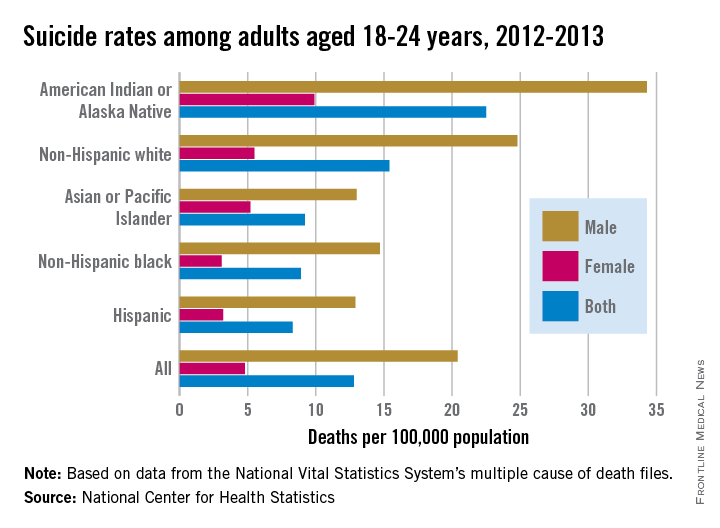
Suicides among American Indian/Alaska Native adults aged 18-24 years exceeded the national rate by 76%, according to the National Center for Health Statistics.
The overall rate for American Indian/Alaska Native adults (AIANs) aged 18-24 from 2012 to 2013 was 22.5/100,000 population, compared with a rate of 12.8/100,000 for all young adults in the age group. The NCHS report also noted that deaths overall among AIANs might be underreported by 30%, so the difference might be even greater.
Non-Hispanic whites, with a rate of 15.4/100,000, were the only other group of the five included in the report that was above the overall rate. Asian/Pacific Islanders aged 18-24 years had a suicide rate of 9.2/100,000, with non-Hispanic blacks at 8.9 and Hispanics the lowest at 8.3, data from the National Vital Statistics System’s multiple cause of death files showed.
Survey: 45% order tests to avoid lawsuits
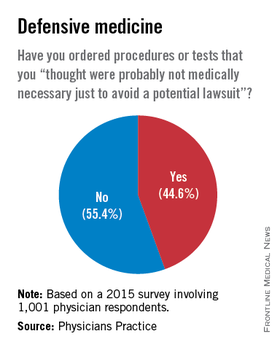
Almost 45% of physicians say that they have practiced defensive medicine, according to a survey of 1,001 physicians conducted by Physicians Practice, a practice management newspaper and website.
To be exact, 44.6% of respondents said that they had ordered tests or procedures that they “thought were probably not medically necessary just to avoid a potential lawsuit,” Physicians Practice reported in its 2015 Great American Physician Survey.
Almost 44% of the physician respondents said that they had been threatened with a malpractice lawsuit, and nearly 32% reported that they had been the defendant in such a lawsuit, the survey results showed.
