User login
Richard Franki is the associate editor who writes and creates graphs. He started with the company in 1987, when it was known as the International Medical News Group. In his years as a journalist, Richard has worked for Cap Cities/ABC, Disney, Harcourt, Elsevier, Quadrant, Frontline, and Internet Brands. In the 1990s, he was a contributor to the ill-fated Indications column, predecessor of Livin' on the MDedge.
Patient income may affect specialist access
Poor patients with multiple chronic conditions are more than twice as likely to have trouble seeing a specialist as are middle- and high-income patients, the Agency for Healthcare Research and Quality reported.
Among adults with multiple chronic conditions who needed to see a specialist in 2012, 22.6% of those who were poor said that access was not always or usually easy, compared with 9.9% for those of high income, 10.1% for middle-income patients, and 15.8% for those of low income, according to data from the Medical Expenditure Panel Survey.
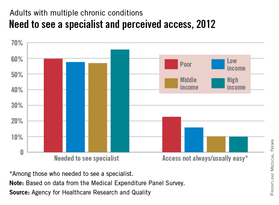
The high-income patients, however, were the most likely to say that they needed to see a specialist in 2012, with 65.6% reporting such a need, compared with 59.7% of poor patients, 57.6% of low-income patients, and 56.9% of middle-income patients, the AHRQ noted.
The report used the following definitions for the four income groups:
Poor: Persons in families with incomes up to 125% of the poverty line.
Low income: Persons in families with incomes over 125% through 200% of the poverty line.
Middle income: Persons in families with incomes over 200% through 400% of the poverty line.
High income: Persons in families with incomes over 400% of the poverty line.
Poor patients with multiple chronic conditions are more than twice as likely to have trouble seeing a specialist as are middle- and high-income patients, the Agency for Healthcare Research and Quality reported.
Among adults with multiple chronic conditions who needed to see a specialist in 2012, 22.6% of those who were poor said that access was not always or usually easy, compared with 9.9% for those of high income, 10.1% for middle-income patients, and 15.8% for those of low income, according to data from the Medical Expenditure Panel Survey.
The high-income patients, however, were the most likely to say that they needed to see a specialist in 2012, with 65.6% reporting such a need, compared with 59.7% of poor patients, 57.6% of low-income patients, and 56.9% of middle-income patients, the AHRQ noted.
The report used the following definitions for the four income groups:
Poor: Persons in families with incomes up to 125% of the poverty line.
Low income: Persons in families with incomes over 125% through 200% of the poverty line.
Middle income: Persons in families with incomes over 200% through 400% of the poverty line.
High income: Persons in families with incomes over 400% of the poverty line.

Former smokers turning to e-cigarettes
Just over 55% of adults who quit smoking cigarettes less than a year before had tried an electronic cigarette, and 22% were currently using them in 2014, the National Center for Health Statistics reports.
Overall, almost 13% of adults had ever tried an electronic cigarette, and close to 4% were using them regularly. Among current smokers, 47% had tried an e-cigarette, and nearly 16% were currently using them, according to data from the 2014 National Health Interview Survey.
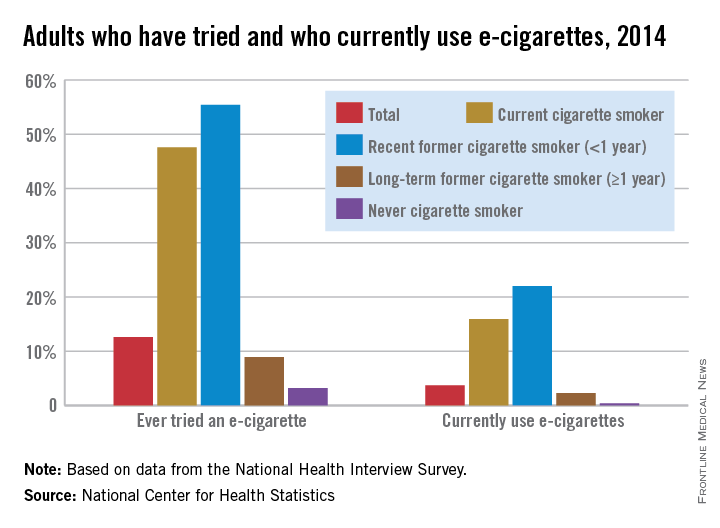
Former smokers who quit more than a year before were much less likely to have tried an e-cigarette (9%) or to be a current user (2%), while 3% of never cigarette smokers reported that they had tried an e-cigarette and 0.4% were currently using them, the NCHS said.
Just over 55% of adults who quit smoking cigarettes less than a year before had tried an electronic cigarette, and 22% were currently using them in 2014, the National Center for Health Statistics reports.
Overall, almost 13% of adults had ever tried an electronic cigarette, and close to 4% were using them regularly. Among current smokers, 47% had tried an e-cigarette, and nearly 16% were currently using them, according to data from the 2014 National Health Interview Survey.
Former smokers who quit more than a year before were much less likely to have tried an e-cigarette (9%) or to be a current user (2%), while 3% of never cigarette smokers reported that they had tried an e-cigarette and 0.4% were currently using them, the NCHS said.

U.S. influenza cases rise above baseline level
For the first time this flu season, the proportion of outpatient visits for influenza-like illness (ILI) was higher than the national baseline level of 2.1%, the Centers for Disease Control and Prevention reported.
According to data from the U.S. Outpatient Influenza-like Illness Surveillance Network, for the week ending Dec. 19 (week 10 of the 2015-2016 season), 2.2% of outpatient visits nationwide involved ILI, the CDC said.
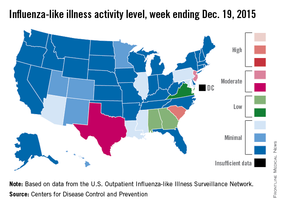
South Carolina remained the only state in the “high” range of activity. New Jersey went up to level 7 – the high end of the “moderate” range – to remain the second most affected state, and Texas jumped from level 2 last week to level 6 this week to move into “moderate” territory. Alabama and Georgia both moved up to “low” status for the first time with ILI activity at level 5, and Virginia stayed at level 4 – the only other state in the “low” range, according to the CDC.
A total of 17 states were at level 2 or higher during week 10, up from 15 states the week before. Arizona, Illinois, Louisiana, Mississippi, and Pennsylvania were at level 3, and Colorado, Hawaii, Minnesota, New Mexico, and Utah were at level 2, data from the Outpatient Influenza-like Illness Surveillance Network revealed.
One influenza-related pediatric death was reported during week 10, bringing the total for the season to four.
For the first time this flu season, the proportion of outpatient visits for influenza-like illness (ILI) was higher than the national baseline level of 2.1%, the Centers for Disease Control and Prevention reported.
According to data from the U.S. Outpatient Influenza-like Illness Surveillance Network, for the week ending Dec. 19 (week 10 of the 2015-2016 season), 2.2% of outpatient visits nationwide involved ILI, the CDC said.
South Carolina remained the only state in the “high” range of activity. New Jersey went up to level 7 – the high end of the “moderate” range – to remain the second most affected state, and Texas jumped from level 2 last week to level 6 this week to move into “moderate” territory. Alabama and Georgia both moved up to “low” status for the first time with ILI activity at level 5, and Virginia stayed at level 4 – the only other state in the “low” range, according to the CDC.
A total of 17 states were at level 2 or higher during week 10, up from 15 states the week before. Arizona, Illinois, Louisiana, Mississippi, and Pennsylvania were at level 3, and Colorado, Hawaii, Minnesota, New Mexico, and Utah were at level 2, data from the Outpatient Influenza-like Illness Surveillance Network revealed.
One influenza-related pediatric death was reported during week 10, bringing the total for the season to four.

Flu activity increases slightly across U.S.
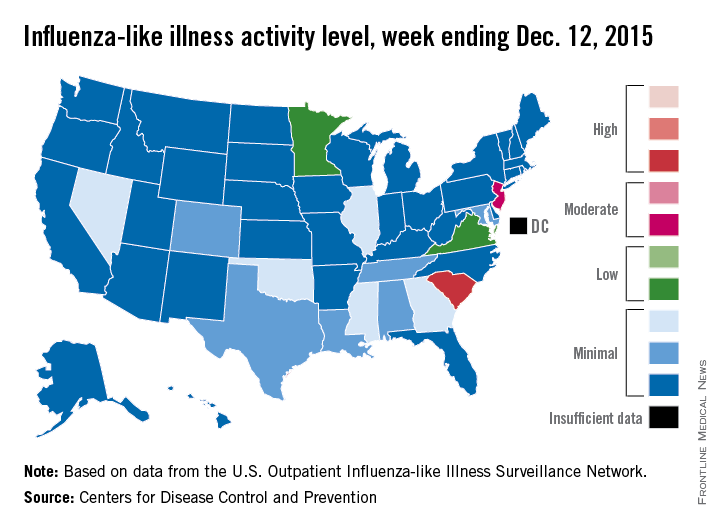
Influenza activity dropped slightly in South Carolina, but remained high enough to make it the nation’s hot spot during week 9 of the 2015-2016 U.S. flu season, the Centers for Disease Control and Prevention reported Dec. 18.
The activity of influenza-like illness (ILI) in South Carolina went from level 9 down to level 8 for the week ending Dec. 12 (week 9), but that kept it in the “high” range, according to the CDC report.

The rest of the United States saw a slight increase in activity, with 15 states at level 2 or higher, compared with 13 the week before. New Jersey had the next-highest level of activity after South Carolina, rising from level 5 last week to level 6, which moved it into the “moderate” range.
Minnesota had the largest increase in ILI activity from the previous week, going from level 1 to level 4, and other states with increased activity were Alabama, Colorado, Georgia, Illinois, Nevada, Tennessee, and Virginia. States besides South Carolina with decreased activity were Arizona, Hawaii, Louisiana, Mississippi, and Texas, the CDC data show.
The proportion of outpatient visits nationwide for ILI – defined as a temperature of 100° F or greater and cough and/or sore throat – was 1.9%, continuing to stay below the national baseline of 2.1%, the CDC said.
Outside of the fifty states, Guam reported widespread activity, Puerto Rico reported “moderate” (level 7) activity, and the District of Columbia and the U.S. Virgin Islands reported sporadic activity, the CDC noted.
Influenza activity dropped slightly in South Carolina, but remained high enough to make it the nation’s hot spot during week 9 of the 2015-2016 U.S. flu season, the Centers for Disease Control and Prevention reported Dec. 18.
The activity of influenza-like illness (ILI) in South Carolina went from level 9 down to level 8 for the week ending Dec. 12 (week 9), but that kept it in the “high” range, according to the CDC report.
The rest of the United States saw a slight increase in activity, with 15 states at level 2 or higher, compared with 13 the week before. New Jersey had the next-highest level of activity after South Carolina, rising from level 5 last week to level 6, which moved it into the “moderate” range.
Minnesota had the largest increase in ILI activity from the previous week, going from level 1 to level 4, and other states with increased activity were Alabama, Colorado, Georgia, Illinois, Nevada, Tennessee, and Virginia. States besides South Carolina with decreased activity were Arizona, Hawaii, Louisiana, Mississippi, and Texas, the CDC data show.
The proportion of outpatient visits nationwide for ILI – defined as a temperature of 100° F or greater and cough and/or sore throat – was 1.9%, continuing to stay below the national baseline of 2.1%, the CDC said.
Outside of the fifty states, Guam reported widespread activity, Puerto Rico reported “moderate” (level 7) activity, and the District of Columbia and the U.S. Virgin Islands reported sporadic activity, the CDC noted.
Cancer incidence higher in men, blacks
The overall incidence of invasive cancer in the United States was 440.3 per 100,000 persons for 2012, the Centers for Disease Control and Prevention reported Dec. 17.
More than 1.5 million such cancers were reported to 49 state registries (excluding Nevada) and the District of Columbia in 2012. Invasive cancers include all cancers excluding basal and squamous cell skin cancers and excluding all in situ cancers other than those of the urinary bladder, the CDC investigators said (MMWR. 2015 Dec 18;64[49]:1353-58).
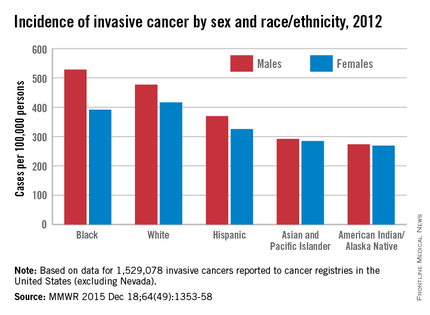
The incidence rate was higher for men (483 per 100,000) than women (412), and was higher for blacks (446) than other races/ethnicities. Blacks had the highest rate (528) among men – almost twice as high as that of American Indians/Alaska Natives (274). Black women, however, had a lower rate (391) than did whites (417), with American Indian/Alaska Natives having the lowest rate (269) among all women by race/ethnicity, the investigators reported.
By cancer site, incidence rates were highest for the female breast (122 per 100,000 females), prostate (105 per 100,000 men), lung/bronchus (60 per 100,000), and colon/rectum (39 per 100,000). These four sites accounted for about half of all the invasive cancers diagnosed in 2012, the investigators noted.
Overall 5-year survival for invasive cancer is 66% for both men and women. Survival rates for the four most common cancers were 88% for female breast, 97% for prostate, 18% for lung/bronchus, and 64% for colon/rectum, according to data from the National Program of Cancer Registries for 27 states from 2001 to 2011.
The overall incidence of invasive cancer in the United States was 440.3 per 100,000 persons for 2012, the Centers for Disease Control and Prevention reported Dec. 17.
More than 1.5 million such cancers were reported to 49 state registries (excluding Nevada) and the District of Columbia in 2012. Invasive cancers include all cancers excluding basal and squamous cell skin cancers and excluding all in situ cancers other than those of the urinary bladder, the CDC investigators said (MMWR. 2015 Dec 18;64[49]:1353-58).
The incidence rate was higher for men (483 per 100,000) than women (412), and was higher for blacks (446) than other races/ethnicities. Blacks had the highest rate (528) among men – almost twice as high as that of American Indians/Alaska Natives (274). Black women, however, had a lower rate (391) than did whites (417), with American Indian/Alaska Natives having the lowest rate (269) among all women by race/ethnicity, the investigators reported.
By cancer site, incidence rates were highest for the female breast (122 per 100,000 females), prostate (105 per 100,000 men), lung/bronchus (60 per 100,000), and colon/rectum (39 per 100,000). These four sites accounted for about half of all the invasive cancers diagnosed in 2012, the investigators noted.
Overall 5-year survival for invasive cancer is 66% for both men and women. Survival rates for the four most common cancers were 88% for female breast, 97% for prostate, 18% for lung/bronchus, and 64% for colon/rectum, according to data from the National Program of Cancer Registries for 27 states from 2001 to 2011.
FROM MMWR

New England the place to be for physician access
Massachusetts has the best physician access in the nation, and the rest of the New England states are not far behind, according to physician recruiting firm Merritt Hawkins.
All the New England states were ranked in the top 10 of the 2015 Physician Access Index, with New Hampshire second, Vermont third, Rhode Island eighth, Maine ninth, and Connecticut tenth. Delaware was the highest-ranked non–New England state, finishing fourth, followed by Maryland in fifth, Minnesota in sixth, and Pennsylvania in seventh.
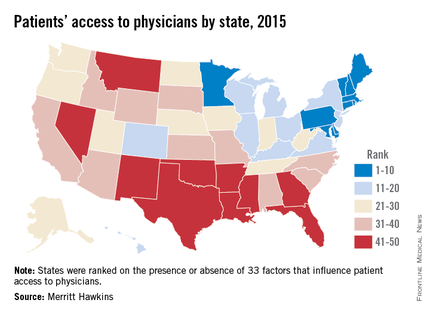
The bottom 10 states were largely clustered in the South and lower Midwest, with Oklahoma getting the not-so-coveted 50th spot, just after Nevada at 49 and New Mexico at 48.
The Physician Access Index uses 33 variables – including physicians per capita, percent of population with health insurance, urgent care centers and retail clinics per capita, and percent of physicians close to retirement. One point goes to the best-performing state and 50 to the lowest performer for each variable, so low score wins. Massachusetts had a score of 442, with Oklahoma coming in at 1,096, Merritt Hawkins said.
The report, however, also noted variability within each state. “No state is without its challenges and strong points where physician access is concerned,” Mark Smith, president of Merritt Hawkins, said in a statement. “There are pockets of patients with poor physician access in highly ranked states and pockets of patients with good physician access in states with low rankings.”
Massachusetts has the best physician access in the nation, and the rest of the New England states are not far behind, according to physician recruiting firm Merritt Hawkins.
All the New England states were ranked in the top 10 of the 2015 Physician Access Index, with New Hampshire second, Vermont third, Rhode Island eighth, Maine ninth, and Connecticut tenth. Delaware was the highest-ranked non–New England state, finishing fourth, followed by Maryland in fifth, Minnesota in sixth, and Pennsylvania in seventh.
The bottom 10 states were largely clustered in the South and lower Midwest, with Oklahoma getting the not-so-coveted 50th spot, just after Nevada at 49 and New Mexico at 48.
The Physician Access Index uses 33 variables – including physicians per capita, percent of population with health insurance, urgent care centers and retail clinics per capita, and percent of physicians close to retirement. One point goes to the best-performing state and 50 to the lowest performer for each variable, so low score wins. Massachusetts had a score of 442, with Oklahoma coming in at 1,096, Merritt Hawkins said.
The report, however, also noted variability within each state. “No state is without its challenges and strong points where physician access is concerned,” Mark Smith, president of Merritt Hawkins, said in a statement. “There are pockets of patients with poor physician access in highly ranked states and pockets of patients with good physician access in states with low rankings.”

Flu activity at ‘high’ level in South Carolina
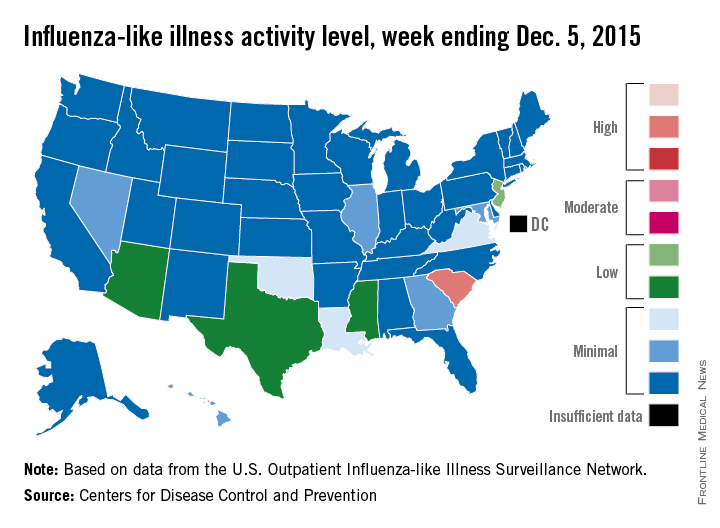
South Carolina officially became the first state to reach a “high” level of influenza activity during the 2015-2016 flu season, the Centers for Disease Control and Prevention reported Dec. 11.
Activity of influenza-like illness (ILI) in the state was at level 9 on a scale of 1-10 for the week ending Dec. 5, 2015. For the country as a whole, however, activity was down a bit, with 13 states at level 2 or higher, compared with 20 states the week before. Among those with reduced ILI activity was Oklahoma, which went from level 6 for the week ending Nov. 28 to level 3 for the week ending Dec. 5, according to the CDC report.

For the week, 1.8% of patient visits reported to the U.S. Outpatient Influenza-like Illness Surveillance Network were for ILI, which is below the national baseline of 2.1%. This measure peaked at almost 6% during last year’s flu season, with that high coming at the end of Dec. 2014. The pattern was similar for the 2013-2014 season, with a peak of about 4.5% during the same week at the end of December, the report showed.
There was one influenza-related pediatric death for the week ending Dec. 5, bringing the total to three that have been reported for the season, the CDC said.
South Carolina officially became the first state to reach a “high” level of influenza activity during the 2015-2016 flu season, the Centers for Disease Control and Prevention reported Dec. 11.
Activity of influenza-like illness (ILI) in the state was at level 9 on a scale of 1-10 for the week ending Dec. 5, 2015. For the country as a whole, however, activity was down a bit, with 13 states at level 2 or higher, compared with 20 states the week before. Among those with reduced ILI activity was Oklahoma, which went from level 6 for the week ending Nov. 28 to level 3 for the week ending Dec. 5, according to the CDC report.
For the week, 1.8% of patient visits reported to the U.S. Outpatient Influenza-like Illness Surveillance Network were for ILI, which is below the national baseline of 2.1%. This measure peaked at almost 6% during last year’s flu season, with that high coming at the end of Dec. 2014. The pattern was similar for the 2013-2014 season, with a peak of about 4.5% during the same week at the end of December, the report showed.
There was one influenza-related pediatric death for the week ending Dec. 5, bringing the total to three that have been reported for the season, the CDC said.
A couple’s health care in retirement could cost $245,000
A couple retiring in 2015 at age 65 can expect to pay $245,000 in health care costs over their lifetimes, according to an estimate from Fidelity Investments.
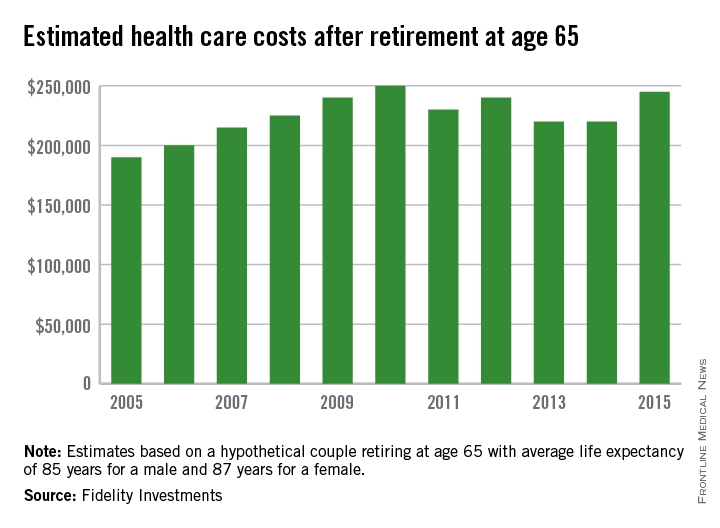
That figure is up 11% from last year’s estimate of $220,000 and has increased 29% since Fidelity’s first estimate in 2005, which came in at $190,000. It is down slightly from 2010, though, when the estimated cost of health care in retirement was $250,000 for a couple.
“Factors boosting this year’s estimate include longer life expectancies and anticipated annual increases for medical and prescription expenses,” Fidelity said in a statement.
A 4%-5% annual rise in health care costs was assumed for the analysis, along with life expectancies of 85 years for a male and 87 years for a female. The estimate does not include the costs of over-the-counter medications, most dental services, and nursing home or long-term care, Fidelity noted.
A couple retiring in 2015 at age 65 can expect to pay $245,000 in health care costs over their lifetimes, according to an estimate from Fidelity Investments.
That figure is up 11% from last year’s estimate of $220,000 and has increased 29% since Fidelity’s first estimate in 2005, which came in at $190,000. It is down slightly from 2010, though, when the estimated cost of health care in retirement was $250,000 for a couple.
“Factors boosting this year’s estimate include longer life expectancies and anticipated annual increases for medical and prescription expenses,” Fidelity said in a statement.
A 4%-5% annual rise in health care costs was assumed for the analysis, along with life expectancies of 85 years for a male and 87 years for a female. The estimate does not include the costs of over-the-counter medications, most dental services, and nursing home or long-term care, Fidelity noted.

Women physicians outnumber men in ob.gyn., lag in other specialties
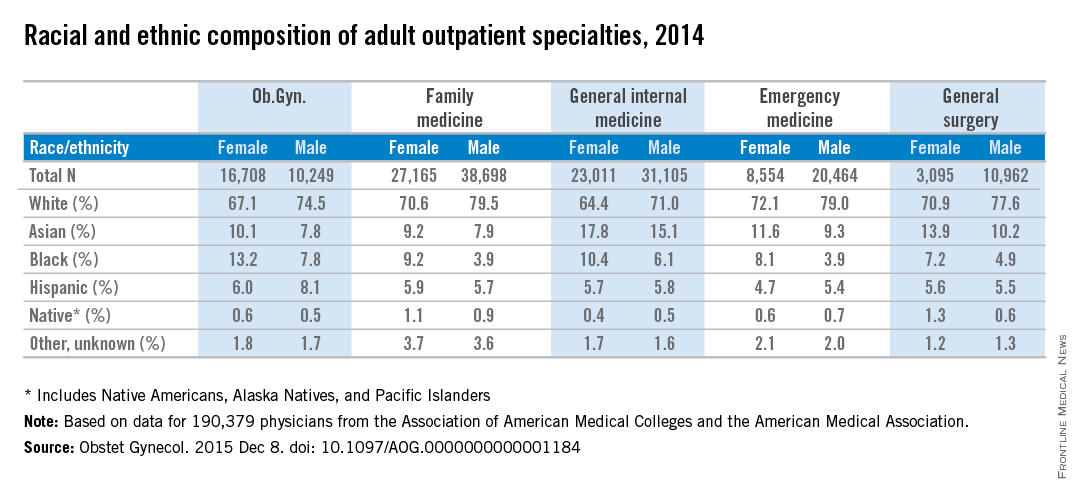
Ob.gyn. is the only one of the five largest adult outpatient specialties in which women make up the majority of physicians, according to a new study.
Women made up almost 62% of ob.gyns. in 2014, but none of the other four specialties – family medicine, general internal medicine, emergency medicine, and general surgery – reached 50%, reported Dr. William F. Rayburn of the University of New Mexico, Albuquerque, and his associates.
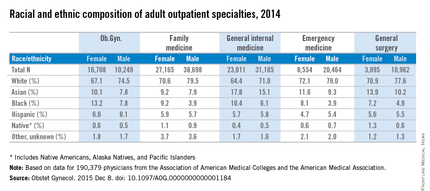
The cross-sectional study of 190,379 physicians also showed that racial and ethnic composition differed between the five specialties, although whites made up the largest racial group in each. Among the minority groups, Asians made up the largest proportion of physicians in the study and were actually overrepresented, compared with the overall U.S. population. Internal medicine had the largest Asian population, followed by general surgery. Asians, along with black physicians, were more likely to be female in each specialty, the investigators said (Obstet Gynecol. 2015 Dec 8. doi: 10.1097/AOG.0000000000001184).
At 18.4%, ob.gyn. had the largest proportion of the underrepresented minorities – blacks, Hispanics, and Natives (Native Americans, Alaska Natives, and Pacific Islanders). Black physicians represented a larger share of ob.gyns. (11.1%) than in any of the other specialties, according to data from the Association of American Medical Colleges and the American Medical Association.
The investigators did not report any conflicts of interest.
Ob.gyn. is the only one of the five largest adult outpatient specialties in which women make up the majority of physicians, according to a new study.
Women made up almost 62% of ob.gyns. in 2014, but none of the other four specialties – family medicine, general internal medicine, emergency medicine, and general surgery – reached 50%, reported Dr. William F. Rayburn of the University of New Mexico, Albuquerque, and his associates.
The cross-sectional study of 190,379 physicians also showed that racial and ethnic composition differed between the five specialties, although whites made up the largest racial group in each. Among the minority groups, Asians made up the largest proportion of physicians in the study and were actually overrepresented, compared with the overall U.S. population. Internal medicine had the largest Asian population, followed by general surgery. Asians, along with black physicians, were more likely to be female in each specialty, the investigators said (Obstet Gynecol. 2015 Dec 8. doi: 10.1097/AOG.0000000000001184).
At 18.4%, ob.gyn. had the largest proportion of the underrepresented minorities – blacks, Hispanics, and Natives (Native Americans, Alaska Natives, and Pacific Islanders). Black physicians represented a larger share of ob.gyns. (11.1%) than in any of the other specialties, according to data from the Association of American Medical Colleges and the American Medical Association.
The investigators did not report any conflicts of interest.
FROM OBSTETRICS AND GYNECOLOGY
‘Moderate’ flu activity seen in two U.S. states
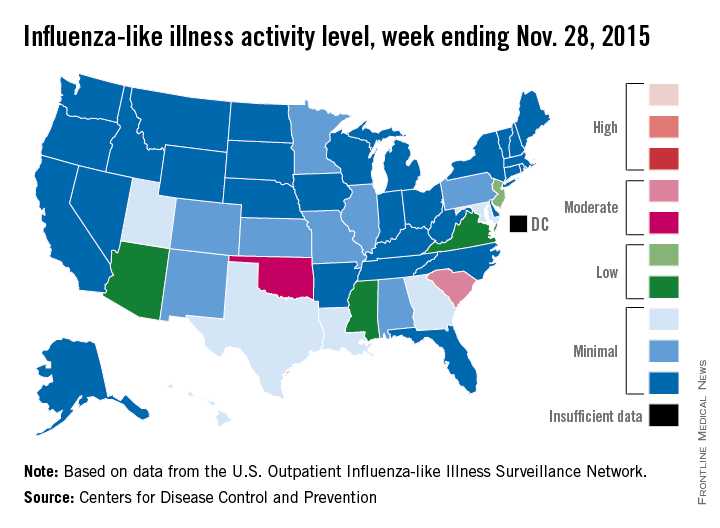
Two U.S. states experienced “moderate” activity of influenza-like illness for the week ending Nov. 28, 2015 – week 7 of the 2015-2016 flu season – the Centers for Disease Control and Prevention reported Dec. 4.
South Carolina had the highest (level 7) activity for the week, with Oklahoma joined by Puerto Rico at level 6. New Jersey was at the highest level (level 5) of “low” activity, while Arizona, Mississippi, and Virginia were a notch lower (level 4) but still in the “low” zone. All told, 20 states had flu activity of level 2 or higher, according to the CDC.

There were no influenza-associated pediatric deaths reported during the week, with two such deaths reported for the 2015-2016 season so far. For week 7 nationwide, 1.9% of patient visits reported through the U.S. Outpatient Influenza-like Illness Surveillance Network were the result of influenza-like illness – defined as a temperature of 100° F or greater and cough and/or sore throat – which is below the national baseline of 2.1%, the CDC said.
During week 7, 1.5% of the 11,288 specimens tested were positive for influenza, with 60% positive for influenza A and 40% positive for influenza B. For the season overall, 1.2% of the 102,675 specimens tested have been positive, with a 61/39 split for influenza A and B, the CDC noted.
Two U.S. states experienced “moderate” activity of influenza-like illness for the week ending Nov. 28, 2015 – week 7 of the 2015-2016 flu season – the Centers for Disease Control and Prevention reported Dec. 4.
South Carolina had the highest (level 7) activity for the week, with Oklahoma joined by Puerto Rico at level 6. New Jersey was at the highest level (level 5) of “low” activity, while Arizona, Mississippi, and Virginia were a notch lower (level 4) but still in the “low” zone. All told, 20 states had flu activity of level 2 or higher, according to the CDC.
There were no influenza-associated pediatric deaths reported during the week, with two such deaths reported for the 2015-2016 season so far. For week 7 nationwide, 1.9% of patient visits reported through the U.S. Outpatient Influenza-like Illness Surveillance Network were the result of influenza-like illness – defined as a temperature of 100° F or greater and cough and/or sore throat – which is below the national baseline of 2.1%, the CDC said.
During week 7, 1.5% of the 11,288 specimens tested were positive for influenza, with 60% positive for influenza A and 40% positive for influenza B. For the season overall, 1.2% of the 102,675 specimens tested have been positive, with a 61/39 split for influenza A and B, the CDC noted.