User login
Richard Franki is the associate editor who writes and creates graphs. He started with the company in 1987, when it was known as the International Medical News Group. In his years as a journalist, Richard has worked for Cap Cities/ABC, Disney, Harcourt, Elsevier, Quadrant, Frontline, and Internet Brands. In the 1990s, he was a contributor to the ill-fated Indications column, predecessor of Livin' on the MDedge.
Supervised residents linked to greater ED resource use
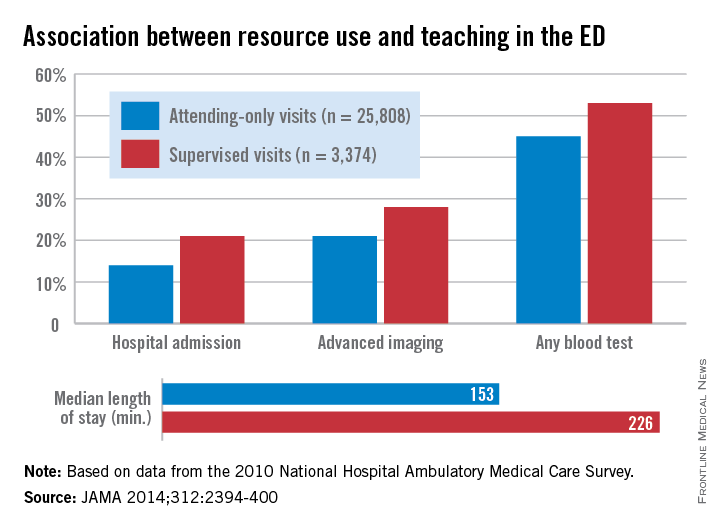
More resources are used in the emergency department when visits involve attending physicians supervising residents, according to a study published Dec. 9 in JAMA.
Compared with attending-only visits in the ED, teaching visits with residents and attendings were more likely to involve hospital admission, advanced imaging, any blood test, and a longer visit time, reported Dr. Stephen R. Pitts of Emory University, Atlanta, and his associates (JAMA 2014;312:2394-400 [doi:10.1001/jama.2014.16172]).
Data for 29,182 visits from the 2010 National Hospital Ambulatory Medical Care Survey’s ED subfile showed that 21% of teaching visits involved a hospital admission, compared with 14% of attending-only vists. Advanced imaging was used in 28% of supervised visits (21% for attending only), and any blood test was used in 53% of supervised visits vs. 45% for attending-only vists. Visits involving a resident also were longer (226 minutes), compared with attending-only visits (153 minutes), Dr. Pitts and his associates said.
“Supervised learning favors a more deliberate, reflective decision-making style than nonteaching clinical visits,” and this was shown by the “consistently higher use of several ED resources among supervised visits, even after adjustment for several other possible determinants,” they concluded.
Dr. Pitts received partial salary support for a time during the study through a contract with the U.S. Dept. of Health & Human Services. One of his associates is an emergency medicine resident and another is the director of an emergency medicine residency. No other conflicts were declared.
FROM JAMA

Few Newly Diagnosed Diabetics Trained in Self-management
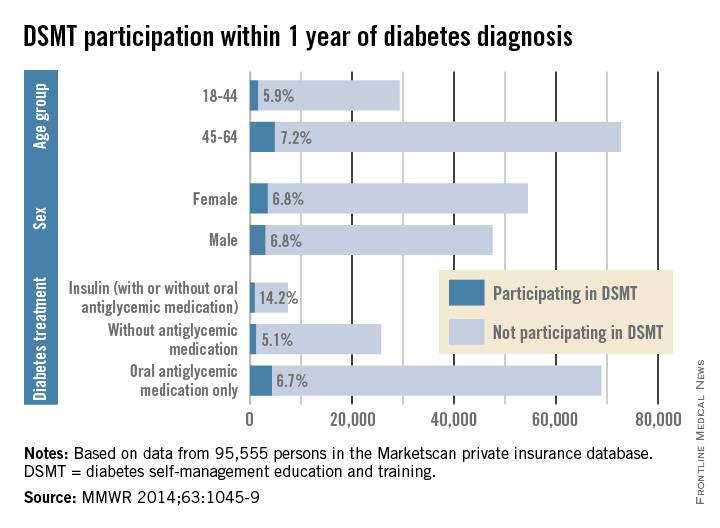
Among insured patients with diabetes, only 6.8% participated in self-management education and training within 1 year of their diagnosis, the Centers for Disease Control and Prevention reported.
There was some variation in the rate of diabetes self-management education and training (DSMT) across various subgroups, but none reached a participation rate higher than 14.2% in a study analyzing 2009-2012 data for 95,555 persons in the Marketscan Commercial Claims and Encounters database (MMWR 2014;63:1045-9).
That 14.2% participation rate was achieved among patients treated with insulin (with or without antiglycemic medication), which was somewhat offset by the small percentage who were using insulin (6.8%). Those taking oral antiglycemics – by far the largest treatment group – had a 6.7% DSMT participation rate and those not taking antiglycemics had a rate of only 5.1%, the CDC reported.
The older of the two age groups in the study, 45- to 69-year-olds, was slightly more likely to participate in DSMT (7.2%) than were those aged 18-44 years (5.9), while men and women were equally likely to participate (6.8%), the Marketscan data showed.
“The finding of low rates of participation in DSMT among privately insured adults with newly diagnosed diabetes underscores the need to identify specific barriers to access and participation in DSMT along with strategies to overcome these barriers,” the CDC investigators wrote.
FROM MORBIDITY AND MORTALITY WEEKLY REPORT

Few newly diagnosed diabetics trained in self-management
Among insured patients with diabetes, only 6.8% participated in self-management education and training within 1 year of their diagnosis, the Centers for Disease Control and Prevention reported.
There was some variation in the rate of diabetes self-management education and training (DSMT) across various subgroups, but none reached a participation rate higher than 14.2% in a study analyzing 2009-2012 data for 95,555 persons in the Marketscan Commercial Claims and Encounters database (MMWR 2014;63:1045-9).
That 14.2% participation rate was achieved among patients treated with insulin (with or without antiglycemic medication), which was somewhat offset by the small percentage who were using insulin (6.8%). Those taking oral antiglycemics – by far the largest treatment group – had a 6.7% DSMT participation rate and those not taking antiglycemics had a rate of only 5.1%, the CDC reported.
The older of the two age groups in the study, 45- to 69-year-olds, was slightly more likely to participate in DSMT (7.2%) than were those aged 18-44 years (5.9), while men and women were equally likely to participate (6.8%), the Marketscan data showed.
“The finding of low rates of participation in DSMT among privately insured adults with newly diagnosed diabetes underscores the need to identify specific barriers to access and participation in DSMT along with strategies to overcome these barriers,” the CDC investigators wrote.
FROM MORBIDITY AND MORTALITY WEEKLY REPORT
Causes for tots’ household falls quantified
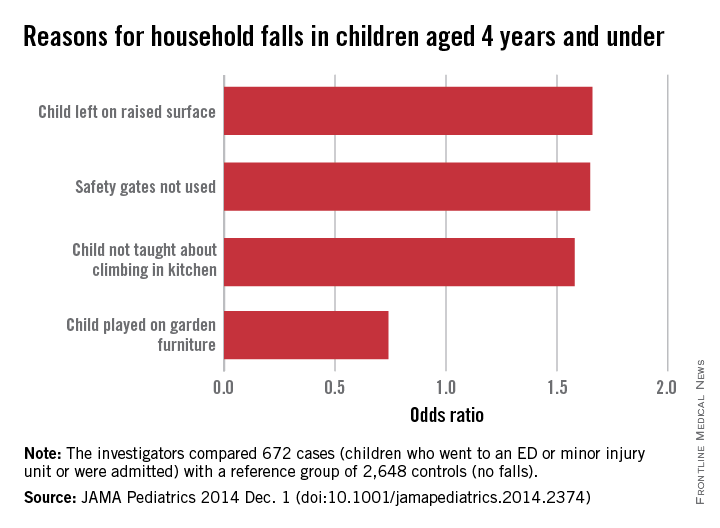
Children aged 4 years and under were more likely to fall from furniture at home and require medical treatment if their parents didn’t use safety gates and didn’t instruct children not to climb on things in the kitchen, according to a study published Dec. 1 in JAMA Pediatrics.
Compared with children who didn’t fall from furniture, those from homes without safety gates were 1.65 times more likely to fall and those not warned about climbing in the kitchen were 1.58 times more likely to end up in an emergency department or minor injury unit or to be admitted to the hospital, reported Dr. Denise Kendrick of the University of Nottingham (England) and her associates (JAMA Pediatr. 2014 Dec. 1 [doi:10.1001/jamapediatrics.2014.2374].
Childen also were more likely to be injured if they were left on a high surface (odds ratio, 1.66), although the effect was much more prominent in those aged 0-12 months (OR, 5.62).
“If our estimated associations are causal, some falls from furniture may be prevented by incorporating fall-prevention advice into child health surveillance programs, personal child health records, home safety assessments, and other child health contacts,” Dr. Kendrick and her associates wrote.
The analysis involved data from 672 children who had fallen from furniture and 2,648 controls who had not fallen on the date of the case’s injury.
The researchers did not report any conflicts of interest.
FROM JAMA PEDIATRICS
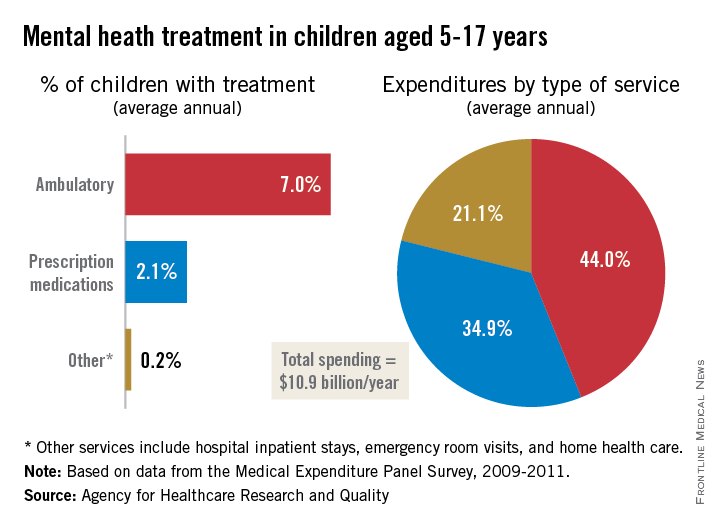
Five million children aged 5-17 treated for mental illness each year
An average of 9.3% of children aged 5-17 years received some type of treatment for a mental health disorder each year from 2009 to 2011, the Agency for Healthcare Research and Quality reported.
That 9.3% translates into about 5 million U.S. children receiving some form of treatment for a mental health disorder annually. The largest share, 7.0%, was children who received ambulatory care, while 2.1% received prescription medications and 0.2% of all children aged 5-17 years received other services that included hospital stays, emergency department visits, and home health care, according to the AHRQ.
Spending for medical services, however, was divided a little more equally, as the 0.2% of children categorized as “other” accounted for 21.1% of the average medical expenditure of $10.9 billion annually over the study period. Prescription medications represented 44% of all spending for children aged 5-17 and 34.9% went to ambulatory care, data from the Medical Expenditure Panel Survey show.

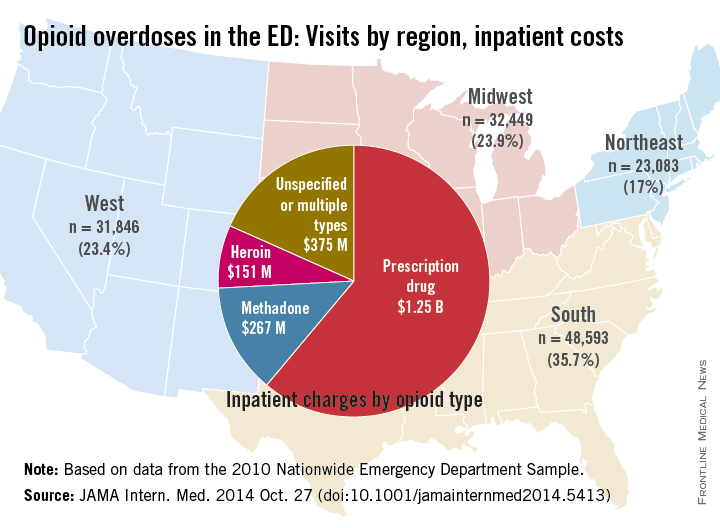
Prescription opioids linked to majority of opioid overdoses
More than two-thirds of all opioid overdoses presenting to U.S. emergency departments in 2010 involved prescription opioids, according to a study published online Oct. 27 in JAMA Internal Medicine.
Of the 135,971 ED visits for opioid overdoses identified, 67.8% involved a prescription opioid (including methadone), 16.1% involved heroin, 13.4% involved unspecified opioids, and 2.7% involved multiple types of opioids, said Michael A. Yokell of Stanford (Calif.) University and his associates (JAMA Intern. Med. 2014 Oct. 27 [doi:10.1001/jamainternmed2014.5413]).
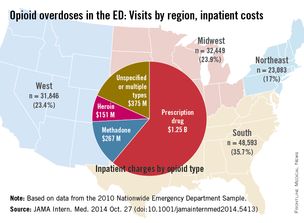
The analysis also showed “marked regional variation in overdose patterns, with the highest burdens of prescription overdose found in the South and West,” the investigators said.
The mean charge for inpatient stays for all overdoses was more than $29,800, with a mean length of stay of 3.8 days. The total cost for all inpatient stays was $2.05 billion, with $1.25 billion going for visits involving prescription opioids and an additional $267 million for visits involving methadone. ED visits involving heroin cost $151 million and visits involving unspecified or multiple opioid types cost $375 million, according to data from the 2010 Nationwide Emergency Department Sample.
The study was funded by Stanford University and by grants from the Centers for Disease Control and Prevention; the National Institutes of Health; and the National Heart, Lung, and Blood Institute. One of the investigators reported employment in the past year with Inflexxion. No other disclosures were reported.
More than two-thirds of all opioid overdoses presenting to U.S. emergency departments in 2010 involved prescription opioids, according to a study published online Oct. 27 in JAMA Internal Medicine.
Of the 135,971 ED visits for opioid overdoses identified, 67.8% involved a prescription opioid (including methadone), 16.1% involved heroin, 13.4% involved unspecified opioids, and 2.7% involved multiple types of opioids, said Michael A. Yokell of Stanford (Calif.) University and his associates (JAMA Intern. Med. 2014 Oct. 27 [doi:10.1001/jamainternmed2014.5413]).
The analysis also showed “marked regional variation in overdose patterns, with the highest burdens of prescription overdose found in the South and West,” the investigators said.
The mean charge for inpatient stays for all overdoses was more than $29,800, with a mean length of stay of 3.8 days. The total cost for all inpatient stays was $2.05 billion, with $1.25 billion going for visits involving prescription opioids and an additional $267 million for visits involving methadone. ED visits involving heroin cost $151 million and visits involving unspecified or multiple opioid types cost $375 million, according to data from the 2010 Nationwide Emergency Department Sample.
The study was funded by Stanford University and by grants from the Centers for Disease Control and Prevention; the National Institutes of Health; and the National Heart, Lung, and Blood Institute. One of the investigators reported employment in the past year with Inflexxion. No other disclosures were reported.
FROM JAMA INTERNAL MEDICINE
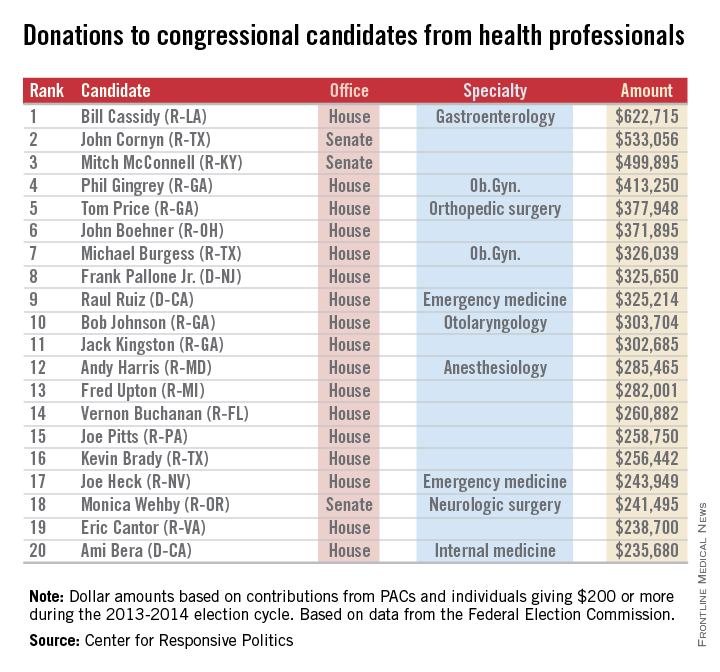
Doctors share the wealth with congressional candidates
Doctors and other health professionals are contributing generously to candidates from both parties in this year’s mid-term election, OpenSecrets.org reported.
Rep. Bill Cassidy (R-La.), a gastroenterologist, has reaped almost $623,000 from his fellow health professionals – more money than any other candidate in the 2013-2014 election cycle. On the other side of Capitol Hill, Sen. John Cornyn (R-Tex.) has taken in the most in donations, totalling just over $533,000 in this election cycle. Senate Minority Leader Mitch McConnell (R-Ky.) has received just under $500,000, according to the Center for Responsive Politics, which operates OpenSecrets.com.
In the House, Rep. Phil Gingrey (R-Ga.), an ob.gyn., has seen about $413,000 in donations. Ten physician-legislators are included in the top 20 candidates most generously supported by health professionals.
The report from the Center for Responsive Politics is based on data released by the Federal Election Commission on Sept. 8, 2014, and covers contributions of $200 or more from political action committees and individuals.
The health professionals category includes physicians, dentists, nurses, physician assistants, other health professionals, and the political action committees that represent them.
Surgeons’ earnings lowest in nonmetropolitan areas
General surgeons from group practices in nonmetropolitan areas earn less than their counterparts in more urban areas, the Medical Group Management Association reported.
The median compensation for general surgeons from nonmetropolitan (population of 49,999 or fewer) areas was $352,000 in 2013, compared with $388,000 for the smallest (50,000-250,000 pop.) metropolitan areas, $412,000 for metro areas between 250,001 and 1 million population, and $385,000 for metro areas with more than 1 million population, according to the MGMA’s “Physician Compensation and Production Survey: 2014 Report Based on 2013 Data.”
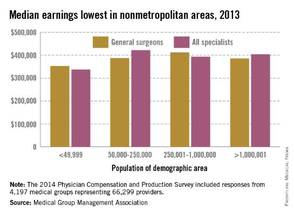
Compared with general surgeons, the median income for all specialists was lower in nonmetro and medium-size metro areas and higher in small and large metropolitan areas.
The survey involved 4,197 groups representing 66,299 providers (including nurse practitioners and physician assistants). The MGMA received responses from 223 practices representing 978 general surgeons.
General surgeons from group practices in nonmetropolitan areas earn less than their counterparts in more urban areas, the Medical Group Management Association reported.
The median compensation for general surgeons from nonmetropolitan (population of 49,999 or fewer) areas was $352,000 in 2013, compared with $388,000 for the smallest (50,000-250,000 pop.) metropolitan areas, $412,000 for metro areas between 250,001 and 1 million population, and $385,000 for metro areas with more than 1 million population, according to the MGMA’s “Physician Compensation and Production Survey: 2014 Report Based on 2013 Data.”
Compared with general surgeons, the median income for all specialists was lower in nonmetro and medium-size metro areas and higher in small and large metropolitan areas.
The survey involved 4,197 groups representing 66,299 providers (including nurse practitioners and physician assistants). The MGMA received responses from 223 practices representing 978 general surgeons.
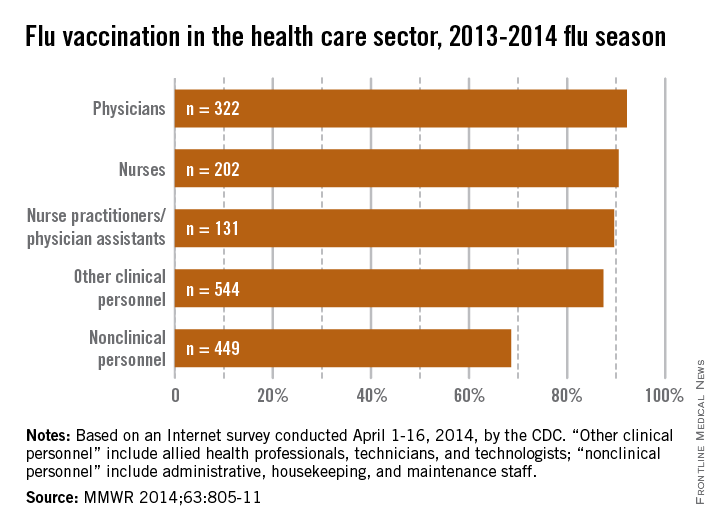
Flu vaccine administered to 75% of health care personnel in 2013-2014
About 75% of health care personnel received an influenza vaccination during the 2013-2014 flu season, up slightly from the 72% who were vaccinated during the 2012-2013 season, the Centers for Disease Control and Prevention reported.
With a vaccination rate of 92.2%, physicians had the highest coverage of the various health care occupations measured. Nurses were second at 90.5%, followed by nurse practitioners/physician assistants at 89.6%. Clinical personnel such as allied health professionals, technicians, and technologists had a vaccination rate of 87.4%, and nonclinical personnel – including administrative staff or managers, food service workers, housekeeping or maintenance staff, and laundry workers – had a rate of 68.6%, the CDC said (MMWR 2014;63:805-11).
|

Coverage among physicians was nearly the same as in the 2012-2013 flu season, when the flu vaccination rate was 92.3%, but coverage among nurses was up from 84.8% last season, and coverage among other clinical personnel increased from 81.9%. Coverage for nonclinical personnel increased by almost 4 percentage points over the 2012-2013 flu season, while nurse practitioners/physician assistants had an increase of slightly more than 1 percentage point, the CDC data showed.
The CDC analysis was based on an Internet survey conducted April 1-16, 2014, with 1,882 eligible responses received.
About 75% of health care personnel received an influenza vaccination during the 2013-2014 flu season, up slightly from the 72% who were vaccinated during the 2012-2013 season, the Centers for Disease Control and Prevention reported.
With a vaccination rate of 92.2%, physicians had the highest coverage of the various health care occupations measured. Nurses were second at 90.5%, followed by nurse practitioners/physician assistants at 89.6%. Clinical personnel such as allied health professionals, technicians, and technologists had a vaccination rate of 87.4%, and nonclinical personnel – including administrative staff or managers, food service workers, housekeeping or maintenance staff, and laundry workers – had a rate of 68.6%, the CDC said (MMWR 2014;63:805-11).
|
Coverage among physicians was nearly the same as in the 2012-2013 flu season, when the flu vaccination rate was 92.3%, but coverage among nurses was up from 84.8% last season, and coverage among other clinical personnel increased from 81.9%. Coverage for nonclinical personnel increased by almost 4 percentage points over the 2012-2013 flu season, while nurse practitioners/physician assistants had an increase of slightly more than 1 percentage point, the CDC data showed.
The CDC analysis was based on an Internet survey conducted April 1-16, 2014, with 1,882 eligible responses received.
FROM MMWR
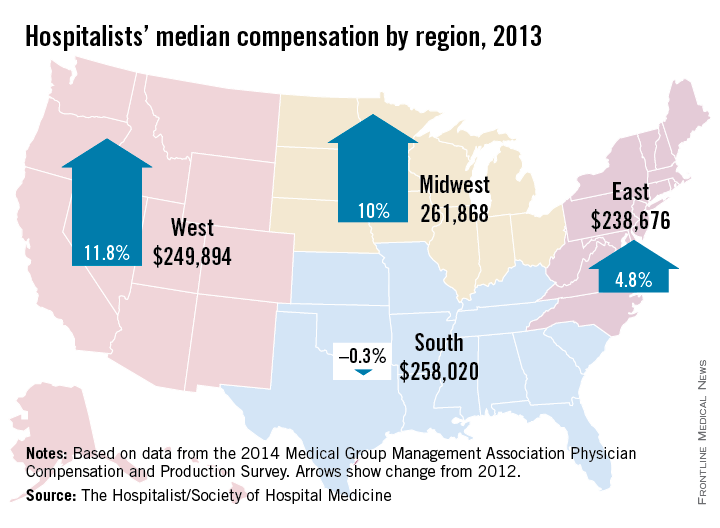
Earnings gain is best in the West
Hospitalists’ median compensation was up 8% last year, with those in the Western region of the United States seeing the largest increase.
The median compensation for hospitalists in the West went up 11.8% from 2012 to 2013, compared with increases of 10% in the Midwest and 4.8% in the East and a drop of 0.3% in the South, according to data from the Medical Group Management Association’s 2014 Physician Compensation and Production Survey.
The MGMA survey, which included responses from 499 groups representing about 6,300 hospitalists, was included in the SHM’s 2014 State of Hospital Medicine report.