User login
Richard Franki is the associate editor who writes and creates graphs. He started with the company in 1987, when it was known as the International Medical News Group. In his years as a journalist, Richard has worked for Cap Cities/ABC, Disney, Harcourt, Elsevier, Quadrant, Frontline, and Internet Brands. In the 1990s, he was a contributor to the ill-fated Indications column, predecessor of Livin' on the MDedge.
Health care coverage down for 26- to 34-year-olds
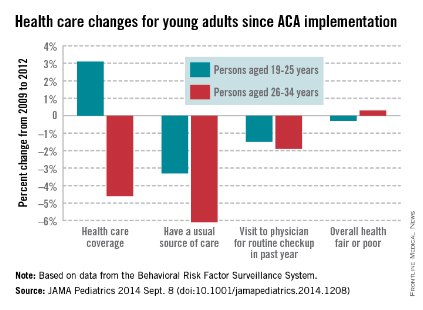
Health care coverage has increased for Americans aged 19-25 years but decreased for those aged 26-34 years since implementation of the Affordable Care Act in 2010, according to a study published online Sept. 8 in JAMA Pediatrics.
From 2009 to 2012, health care coverage rose 3.1% for 19- to 25-year-olds but decreased 4.6% among those aged 26-34. Both groups were less likely to have a usual source of care, but the decrease was larger for the older age group (–6.1% vs. –3.3%), Dr. Meera Kotagal of the University of Washington, Seattle, and her associates reported.
There was, however, no significant difference between the age groups for visits to a physician for a routine checkup in the past year, with 19- to 25-year-olds down 1.5% and 26- to 34-year-olds down 1.9%. The investigators noted that, despite these largely negative changes, there was no significant change in self-reported health status: –0.3% for those aged 19-25 and 0.3% for those aged 26-34.
"Young adults, given their overall healthy status, may not desire regular primary care, and thus an expansion in coverage may not lead these individuals to have a usual source. The proportion of young adults who reported a recent physician’s visit ... has declined yearly since 2003," Dr. Kotagal and her associates wrote (JAMA Pediatr. 2014 Sept. 8 (doi:10.1001/jamapediatrics.2014.1208).
This analysis was based on data for 2009 and 2012 from the Behavioral Risk Factor Surveillance System. The investigators did not report any conflicts of interest.
FROM JAMA PEDIATRICS
Births to unmarried women down since 2008
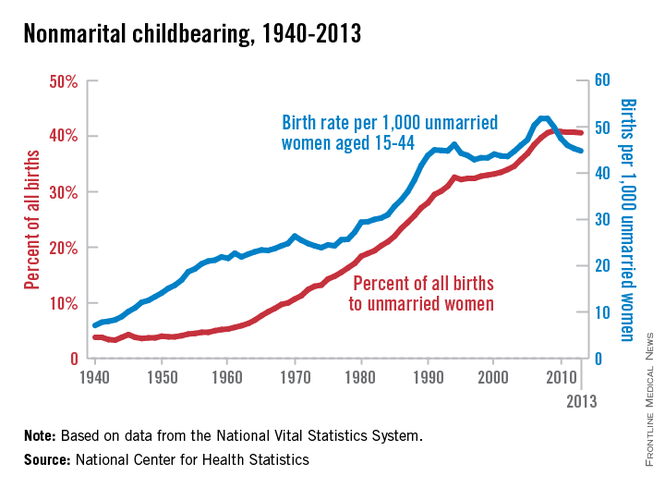
The nonmarital birth rate for women aged 15-44 years has declined 14% since peaking in 2007 and 2008, the National Center for Health Statistics reported.
The rate was 44.8 births per 1,000 unmarried women in 2013, compared with 51.8 in 2007-2008. The percentage of all births to unmarried women – 40.6% in 2013 – has leveled off since reaching a high of 41% in 2009, according to the analysis of data from the National Vital Statistics System.
The total number of births to unmarried women was 1,605,643 in 2013, a drop of 7% since 2008, when it reached a high of 1,726,566. "The recent declines in birth rates and numbers of births to unmarried women parallel to some extent the overall decline in birth rates during this period and also reflect the declines in teen birth rates," the report said, adding that "the majority of births to teenagers are to unmarried women."
Nonmarital birth rates since 2007 are down for all age groups under age 35 years, with the largest percentage declines coming among teenagers: 30% to 14/1,000 for those aged 15-17 years and 26% to 46/1,000 for those aged 18-19 years. The nonmarital birth rate has continued to increase for women aged 35 and over, the NCHS noted.

Most Americans satisfied with cost of brand-name drugs
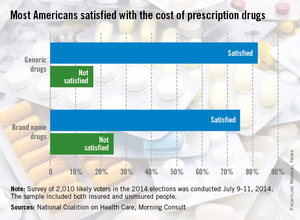
Three-quarters of American adults are satisfied with what they pay for brand-name prescription drugs, according to a survey from the National Coalition on Health Care and digital media company Morning Consult.
Generic drugs are even more popular, getting a satisfaction rate of 82% in the survey, which was conducted July 9-11, among a national sample of 2,010 people likely to vote in the 2014 elections.
When respondents were asked about the transparency of prescription drug pricing, 64% said that there was not enough transparency, 12% said there was enough, and 25% were not sure, the Morning Consult reported.

Health sector well represented among lobbying top spenders
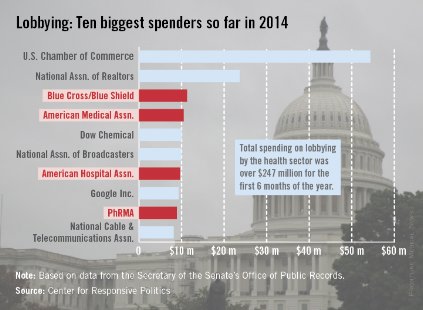
Four of the 10 largest spenders on lobbying for the first 6 months of 2014 are part of the health sector, the Center for Responsive Politics reported.
Blue Cross/Blue Shield was in third place overall, spending almost $11.3 million through the end of June, while the American Medical Association was fourth at $10.5 million, the American Hospital Association was seventh at $9.7 million, and PhRMA (Pharmaceutical Research and Manufacturers of America) was ninth with spending of just under $8.9 million, according to the center.
The U.S. Chamber of Commerce far outdistanced the health sector, however, putting $54.3 million into its lobbying efforts in the first 6 months of 2014 – about $11 million more than the four health-sector representatives combined. The National Association of Realtors was the second-largest lobbyer, spending $23.6 million, the center’s lobbying data showed.
The data on the center’s OpenSecrets website are compiled using lobbying disclosure reports filed with the Secretary of the Senate’s Office of Public Records.
Additional Chronic Conditions Seen in 87% of Diabetes Patients
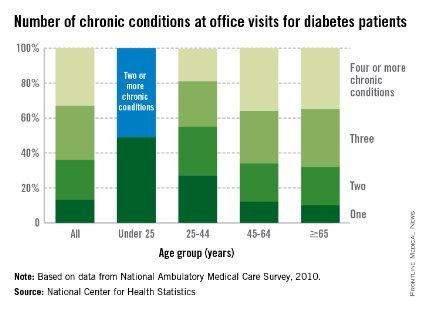
In 2010, 87% of diabetes patients who visited an office-based physician had at least one additional chronic condition, the National Center for Health Statistics reported.
For diabetes patients under the age of 25 years, just over half (51%) of their visits involved patients who had two or more additional chronic conditions, and the number of conditions increased with age. Among those aged 25-44 years, 72% of visits in 2010 involved patients with two or more chronic conditions, according to the NCHS.

In the 45- to 64-year age group, 88% of visits were made by patients with two or more chronic conditions, with 36% involving patients who had four or more such conditions. Among those aged 65 years and over, 90% of visits by patients with diabetes were made by those with two or more additional chronic conditions, the NCHS report said.
The analysis was based on data from the National Ambulatory Medical Care Survey. Information was collected on 13 other chronic conditions besides diabetes: arthritis, asthma, cancer, chronic kidney disease, chronic obstructive pulmonary disease, heart failure, coronary heart disease, depression, hyperlipidemia, hypertension, obesity, osteoporosis, and stroke.
In 2010, 87% of diabetes patients who visited an office-based physician had at least one additional chronic condition, the National Center for Health Statistics reported.
For diabetes patients under the age of 25 years, just over half (51%) of their visits involved patients who had two or more additional chronic conditions, and the number of conditions increased with age. Among those aged 25-44 years, 72% of visits in 2010 involved patients with two or more chronic conditions, according to the NCHS.
In the 45- to 64-year age group, 88% of visits were made by patients with two or more chronic conditions, with 36% involving patients who had four or more such conditions. Among those aged 65 years and over, 90% of visits by patients with diabetes were made by those with two or more additional chronic conditions, the NCHS report said.
The analysis was based on data from the National Ambulatory Medical Care Survey. Information was collected on 13 other chronic conditions besides diabetes: arthritis, asthma, cancer, chronic kidney disease, chronic obstructive pulmonary disease, heart failure, coronary heart disease, depression, hyperlipidemia, hypertension, obesity, osteoporosis, and stroke.

Additional chronic conditions seen in 87% of diabetes patients
In 2010, 87% of diabetes patients who visited an office-based physician had at least one additional chronic condition, the National Center for Health Statistics reported.
For diabetes patients under the age of 25 years, just over half (51%) of their visits involved patients who had two or more additional chronic conditions, and the number of conditions increased with age. Among those aged 25-44 years, 72% of visits in 2010 involved patients with two or more chronic conditions, according to the NCHS.

In the 45- to 64-year age group, 88% of visits were made by patients with two or more chronic conditions, with 36% involving patients who had four or more such conditions. Among those aged 65 years and over, 90% of visits by patients with diabetes were made by those with two or more additional chronic conditions, the NCHS report said.
The analysis was based on data from the National Ambulatory Medical Care Survey. Information was collected on 13 other chronic conditions besides diabetes: arthritis, asthma, cancer, chronic kidney disease, chronic obstructive pulmonary disease, heart failure, coronary heart disease, depression, hyperlipidemia, hypertension, obesity, osteoporosis, and stroke.
In 2010, 87% of diabetes patients who visited an office-based physician had at least one additional chronic condition, the National Center for Health Statistics reported.
For diabetes patients under the age of 25 years, just over half (51%) of their visits involved patients who had two or more additional chronic conditions, and the number of conditions increased with age. Among those aged 25-44 years, 72% of visits in 2010 involved patients with two or more chronic conditions, according to the NCHS.
In the 45- to 64-year age group, 88% of visits were made by patients with two or more chronic conditions, with 36% involving patients who had four or more such conditions. Among those aged 65 years and over, 90% of visits by patients with diabetes were made by those with two or more additional chronic conditions, the NCHS report said.
The analysis was based on data from the National Ambulatory Medical Care Survey. Information was collected on 13 other chronic conditions besides diabetes: arthritis, asthma, cancer, chronic kidney disease, chronic obstructive pulmonary disease, heart failure, coronary heart disease, depression, hyperlipidemia, hypertension, obesity, osteoporosis, and stroke.
Cancer spending: More patients, not more expensive patients
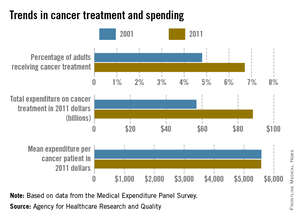
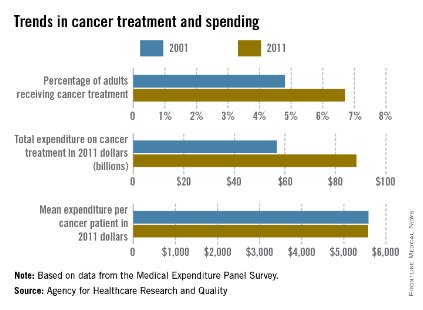
A 55% jump in total expenditures for cancer treatment from 2001 to 2011 appears to reflect an increase in the number of patients, not an increase in the cost of treating those patients, according to a report from the Agency for Healthcare Research and Quality.
Total U.S. spending on cancer treatment increased from $56.8 billion in 2001 (adjusted to 2011 dollars) to $88.3 billion in 2011. Over the same period, the percentage of adults who were treated for cancer increased from 4.8% in 2001 to 6.7% in 2011. The mean expenditure on treatment for patients with cancer, on the other hand, dropped by $8 a patient: from $5,583 in 2001 to $5,575 in 2011, the AHRQ report showed.
Looking at the components of per-patient spending, expenditures for hospital stays dropped from $2,604 in 2001 to $1,956 in 2011, expenditures for ambulatory visits increased from $2,509 to $2,769, expenditures for retail prescription medicines jumped from $201 to $634, and home health expenditures dropped from $232 to $185, according to the AHRQ.
The overall spending on ambulatory visits increased from $25.5 billion in 2001 to $43.8 billion in 2011; the overall spending for hospital stays rose from $26.5 billion to $31 billion; expenditures for prescription medicines shot from $2 billion to $10 billion; and home health spending rose from $2.4 billion to $2.9 billion, the report said.
The report, "Trends in Use and Expenditures for Cancer Treatment among Adults 18 and Older, U.S. Civilian Noninstitutionalized Population, 2001 and 2011," used data from the household component of the Medical Expenditure Panel Survey. All costs were expressed in 2011 dollars.
Pediatric Obesity May Be Leveling Off
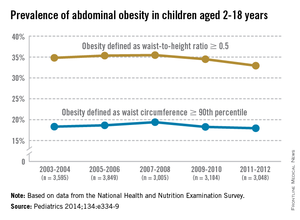
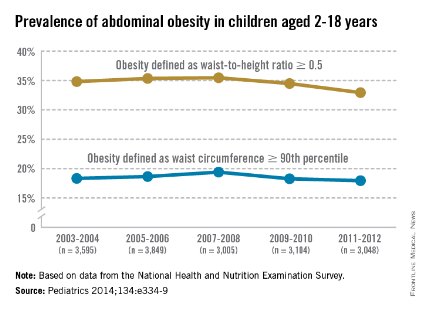
By some measures, the prevalence of pediatric and adolescent obesity appears to have leveled off since 2003, according to an analysis of data from the National Health and Nutrition Examination Survey.
The prevalence of abdominal obesity – as defined by a waist-to-height ratio of 0.5 or higher – reached a peak of 35.5% in 2007-2008, dropping to 32.9% in children and adolescents aged 2-18 years by 2011-2012. When defined as a waist circumference in the 90th percentile or higher, obesity was seen in almost 18% of children and adolescents in 2011-2012 – down from a high of 19.4% in 2007-2008, reported Dr. Bo Xi of Shandong University in Jinan, China, and associates.
The largest decreases from 2003-2004 to 2011-2012 in waist-to-hip ratio were seen among non-Hispanic whites (from 35.3% to 31.4%) and 6- to 11-year-olds (from 33.7% to 30.7%). The largest increase occurred in Mexican Americans, whose prevalence went from 42.5% in 2003-2004 to 46.6% in 2011-2012, the investigators said (Pediatrics 2014;134:e334-9).
Looking at waist circumference, 2- to 5-year-olds had the largest drop in prevalence, from 15.8% in 2003-2004 to 10.9% in 2011-2012. Mexican Americans again had the largest rise, going from 20.1% in 2003-2004 to 24.5% in 2011-2012, Dr. Xi and associates wrote.
"Although the prevalence of abdominal obesity leveled off over the past 9 years among U.S. children and adolescents, it is still high ... suggesting an urgent need for lifestyle modifications," they wrote, and since waist-to-hip ratio may be a better risk indicator for cardiovascular disease than body-mass index or waist circumference, "the message of ‘keep your waist to less than half your height’ is attractive for public health policy."
The study was funded by the Scientific Research Organization Construction Project of Shandong University. The investigators indicated that they had no relevant financial disclosures.
FROM PEDIATRICS

Pediatric obesity may be leveling off
By some measures, the prevalence of pediatric and adolescent obesity appears to have leveled off since 2003, according to an analysis of data from the National Health and Nutrition Examination Survey.
The prevalence of abdominal obesity – as defined by a waist-to-height ratio of 0.5 or higher – reached a peak of 35.5% in 2007-2008, dropping to 32.9% in children and adolescents aged 2-18 years by 2011-2012. When defined as a waist circumference in the 90th percentile or higher, obesity was seen in almost 18% of children and adolescents in 2011-2012 – down from a high of 19.4% in 2007-2008, reported Dr. Bo Xi of Shandong University in Jinan, China, and associates.
The largest decreases from 2003-2004 to 2011-2012 in waist-to-hip ratio were seen among non-Hispanic whites (from 35.3% to 31.4%) and 6- to 11-year-olds (from 33.7% to 30.7%). The largest increase occurred in Mexican Americans, whose prevalence went from 42.5% in 2003-2004 to 46.6% in 2011-2012, the investigators said (Pediatrics 2014;134:e334-9).
Looking at waist circumference, 2- to 5-year-olds had the largest drop in prevalence, from 15.8% in 2003-2004 to 10.9% in 2011-2012. Mexican Americans again had the largest rise, going from 20.1% in 2003-2004 to 24.5% in 2011-2012, Dr. Xi and associates wrote.
"Although the prevalence of abdominal obesity leveled off over the past 9 years among U.S. children and adolescents, it is still high ... suggesting an urgent need for lifestyle modifications," they wrote, and since waist-to-hip ratio may be a better risk indicator for cardiovascular disease than body-mass index or waist circumference, "the message of ‘keep your waist to less than half your height’ is attractive for public health policy."
The study was funded by the Scientific Research Organization Construction Project of Shandong University. The investigators indicated that they had no relevant financial disclosures.
FROM PEDIATRICS
Heroin-related drug-poisoning deaths rose 110% from 2002 to 2011
The annual number of drug-poisoning deaths involving heroin more than doubled from 2002 to 2011, increasing from 2,089 to 4,397, the National Center for Health Statistics reported.
Over that period, the rate of heroin-related drug-poisoning deaths increased 171% among non-Hispanic whites aged 18-44 years – going from 1.4 per 100,000 population to 3.8 – and by 100% among non-Hispanic whites aged 45-64 years – from 0.7 to 1.4 per 100,000, according to the NCHS (MMWR 2014;63:595).
The rates for non-Hispanic blacks and Hispanics, by comparison, were stable. Non-Hispanic blacks were at 1.0 per 100,000 for younger adults and 2.2 per 100,000 for those aged 45-64 years in 2002 and remained there in 2011. The rate for Hispanics aged 18-44 years rose from 1.3 to 1.5, but the rate for 45- to 64-year-olds dropped from 2 to 1.9 per 100,000, according to mortality data from the National Vital Statistics System.
FROM MMWR
