User login
Richard Franki is the associate editor who writes and creates graphs. He started with the company in 1987, when it was known as the International Medical News Group. In his years as a journalist, Richard has worked for Cap Cities/ABC, Disney, Harcourt, Elsevier, Quadrant, Frontline, and Internet Brands. In the 1990s, he was a contributor to the ill-fated Indications column, predecessor of Livin' on the MDedge.
Mayo Clinic tops hospital rankings for 2014-2015
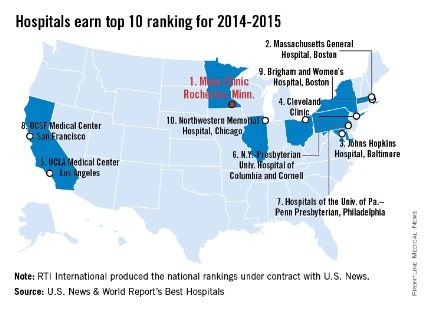
The Mayo Clinic in Rochester, Minn., is the best hospital in the United States, according to the U.S. News & World Report Best Hospitals rankings for 2014-2015.
This is the first time that the Mayo Clinic has taken the top spot in the Best Hospitals Honor Roll. This year’s second-place finisher was Massachusetts General Hospital in Boston, followed by Johns Hopkins Hospital in Baltimore – which won last year – the Cleveland Clinic, and UCLA Medical Center in Los Angeles, U.S. News announced.
For 2014-2015, there were 17 hospitals in the Honor Roll, which is reserved for those institutions that finish at or near the top in 6 or more of the 16 specialties included in the U.S. News rankings. This year, only 144 hospitals did well enough to be nationally ranked in one or more specialties. The 16 ranked specialties are cancer, cardiology and heart surgery; diabetes and endocrinology; otolaryngology; gastroenterology and gastrointestinal surgery; geriatrics; gynecology; nephrology; neurology and neurosurgery; ophthalmology; orthopedics; psychiatry; pulmonology; rehabilitation; rheumatology; and urology.
The ranking process initially comprised 4,743 nonfederal community hospitals, which were rated in the 16 specialties. In the 12 data-driven specialties, scores were based on four elements: reputation with specialists (27.5%), survival (32.5%), patient safety (10%), and other care-related indicators (30%). Four specialties were rated by reputation only. The research organization RTI International conducted the physician survey and produced the Best Hospitals methodology and national rankings under contract with U.S. News.
Long-acting–opioid prescribing rate highest in Maine
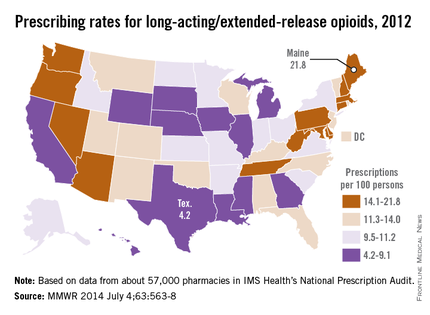
The prescribing rate for long-acting/extended-release opioid pain relievers in Maine, which is the highest in the country, is more than five times higher than that of Texas, which has the lowest rate, the Centers for Disease Control and Prevention reported.
Maine’s prescribing rate for long-acting/extended-release opioid pain relievers (LA/ER OPRs) was 21.8 per 100 persons in 2012, compared with 4.2 per 100 in Texas, making Maine’s rate 5.2 times higher. Delaware had the second-highest LA/ER OPR rate – just behind Maine at 21.7 per 100. After Texas, the next-lowest state was Illinois, which had a prescribing rate of 5.2 per 100, according to CDC investigators (MMWR 2014;63:563-7).
The national rate for LA/ER OPRs was 10.3 per 100 persons, or about 12.5% of the total 258.9 million opioid prescriptions written in 2012. By region, the Northeast was the highest at 12.6 per 100, followed by the South (10.2), the West (9.6), and the Midwest (9.3), they said.
The CDC researchers defined LA/ER OPRs "as those that should be taken only two or three times a day, such as methadone, OxyContin [oxycodone], and Opana [oxymorphone] ER." The analysis was based on a sample of approximately 57,000 pharmacies from IMS Health’s National Prescription Audit that "dispense nearly 80% of the retail prescriptions in the United States," they wrote.
FROM MMWR

Sleep apnea raises cardiomyopathy risk ninefold in pregnancy
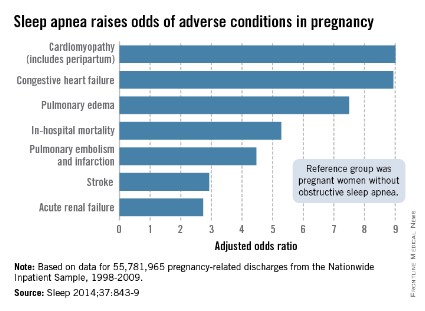
Pregnant women with obstructive sleep apnea are more likely to experience adverse clinical conditions than are pregnant women who do not have sleep apnea, according to an analysis of over 55 million pregnancy-related hospital discharges from 1998 to 2009.
Women with obstructive sleep apnea (OSA) were nine times more likely to have cardiomyopathy and 8.9 times more likely to have congestive heart failure during pregnancy than were women without OSA, after adjustment for numerous factors, including maternal age and obesity, race/ethnicity, household income, heart disease, hyperlipidemia, and prepregnancy diabetes, reported Dr. Judette M. Louis of the University of South Florida, Tampa, and her associates.
Women with OSA also were more likely to have pulmonary edema (adjusted odds ratio, 7.5), in-hospital mortality (AOR, 5.3), pulmonary embolism and infarction (AOR, 4.5), stroke (AOR, 2.9), and acute renal failure (AOR, 2.7), Dr. Louis and her associates said (Sleep 2014;37:843-9).
The investigators analyzed data on 55,781,965 maternal hospital discharges from 1998 to 2009 in the Agency for Healthcare Research and Quality’s Nationwide Inpatient Sample. The institution of one investigator received a grant from ResMed Inc. and equipment from ResMed and Philips Respironics for use in clinical trials.
FROM SLEEP
Hawaii bans indoor tanning for minors
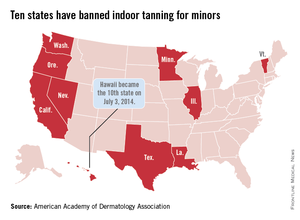
Hawaii Gov. Neil Abercrombie signed a bill on July 3 that makes Hawaii the 10th state to prohibit anyone under age 18 years from using tanning beds, according to the American Academy of Dermatology Association.
The law goes into effect immediately. The other states that have banned indoor tanning for minors are California, Illinois, Louisiana, Minnesota, Nevada, Oregon, Texas, Vermont, and Washington.
"The science is clear. The risk for developing melanoma increases by 59% in individuals who have been exposed to UV radiation from indoor tanning devices, and the risks increase with each subsequent use," AADA President Brent M. Coldiron said in a statement.

Benzodiazepine prescribing rates highest in the South
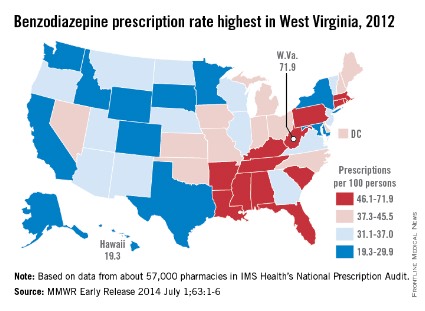
There is wide variation between states in the prescription of benzodiazepines, with rates highest in the South and lowest in the West, the Centers for Disease Control and Prevention reported.
The overall prescribing rate for benzodiazepines in the South for 2012 was 43.1/100 persons – 54% higher than the West’s 27.9/100. Like the South, prescribing rates in the Midwest (38.2/100) and the Northeast (38.1/100) were both above the national rate of 37.6/100 persons, according to the CDC (MMWR 2014 July 1;63:1-6).
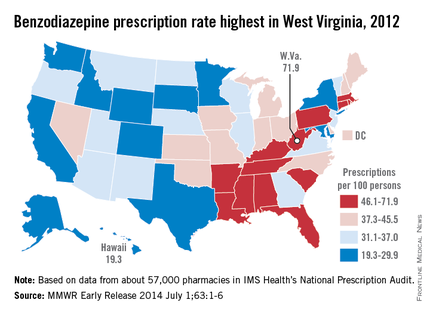
Among individual states, West Virginia’s U.S.-high rate of 71.9/100 was 3.7-fold higher than Hawaii’s low of 19.3/100. West Virginia was even one standard deviation above the states with the next-highest rates: Alabama (61.9), Tennessee (61.4), and Rhode Island (60.2), the analysis showed.
"Previous studies have found that regional prescribing variation cannot be explained by variation in the prevalence of the conditions treated by these drugs," the investigators noted.
The analysis was based on a sample of approximately 57,000 pharmacies from IMS Health’s National Prescription Audit that "dispense nearly 80% of the retail prescriptions in the United States," they wrote.
There is wide variation between states in the prescription of benzodiazepines, with rates highest in the South and lowest in the West, the Centers for Disease Control and Prevention reported.
The overall prescribing rate for benzodiazepines in the South for 2012 was 43.1/100 persons – 54% higher than the West’s 27.9/100. Like the South, prescribing rates in the Midwest (38.2/100) and the Northeast (38.1/100) were both above the national rate of 37.6/100 persons, according to the CDC (MMWR 2014 July 1;63:1-6).
Among individual states, West Virginia’s U.S.-high rate of 71.9/100 was 3.7-fold higher than Hawaii’s low of 19.3/100. West Virginia was even one standard deviation above the states with the next-highest rates: Alabama (61.9), Tennessee (61.4), and Rhode Island (60.2), the analysis showed.
"Previous studies have found that regional prescribing variation cannot be explained by variation in the prevalence of the conditions treated by these drugs," the investigators noted.
The analysis was based on a sample of approximately 57,000 pharmacies from IMS Health’s National Prescription Audit that "dispense nearly 80% of the retail prescriptions in the United States," they wrote.
FROM MORBIDITY AND MORTALITY WEEKLY REPORT

Benzodiazepine prescribing rates highest in the South
There is wide variation between states in the prescription of benzodiazepines, with rates highest in the South and lowest in the West, the Centers for Disease Control and Prevention reported.
The overall prescribing rate for benzodiazepines in the South for 2012 was 43.1/100 persons – 54% higher than the West’s 27.9/100. Like the South, prescribing rates in the Midwest (38.2/100) and the Northeast (38.1/100) were both above the national rate of 37.6/100 persons, according to the CDC (MMWR 2014 July 1;63:1-6).
Among individual states, West Virginia’s U.S.-high rate of 71.9/100 was 3.7-fold higher than Hawaii’s low of 19.3/100. West Virginia was even one standard deviation above the states with the next-highest rates: Alabama (61.9), Tennessee (61.4), and Rhode Island (60.2), the analysis showed.
"Previous studies have found that regional prescribing variation cannot be explained by variation in the prevalence of the conditions treated by these drugs," the investigators noted.
The analysis was based on a sample of approximately 57,000 pharmacies from IMS Health’s National Prescription Audit that "dispense nearly 80% of the retail prescriptions in the United States," they wrote.
FROM MORBIDITY AND MORTALITY WEEKLY REPORT
More Than Half of Older Women Have Experienced Incontinence
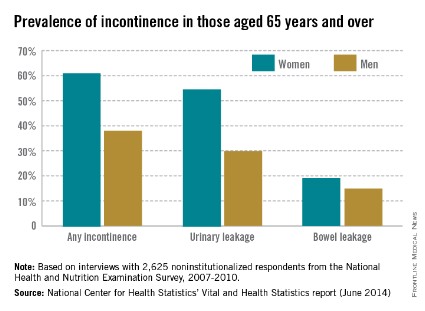
Among noninstitutionalized Americans aged 65 years and older, 61.2% of women and 38% of men experience at least occasional urinary or bowel incontinence, the National Center for Health Statistics reported.
Data from the 2007-2010 National Health and Nutrition Examination Survey (NHANES) show that 54.8% of women and 29.9% of men had urinary leakage at least a few times a month, while 19.2% of women and 14.9% of men had accidental bowel leakage of mucus, liquid stool, or solid stool at least one to three times a month, according to the NCHS (Vital Health Stat. 2014;3[36]).
Among women aged 65-74 years, 60.6% had some type of incontinence, compared with 61.9% of women aged 75 years and over. The difference was larger for men, however, with 34.1% of those aged 65-74 years reporting incontinence, compared with 42.4% of men aged 75 years and over, the report showed.
The NHANES data are based on in-home interviews with a nationally representative sample of 2,625 respondents.

More Than Half of Older Women Have Experienced Incontinence
Among noninstitutionalized Americans aged 65 years and older, 61.2% of women and 38% of men experience at least occasional urinary or bowel incontinence, the National Center for Health Statistics reported.
Data from the 2007-2010 National Health and Nutrition Examination Survey (NHANES) show that 54.8% of women and 29.9% of men had urinary leakage at least a few times a month, while 19.2% of women and 14.9% of men had accidental bowel leakage of mucus, liquid stool, or solid stool at least one to three times a month, according to the NCHS (Vital Health Stat. 2014;3[36]).
Among women aged 65-74 years, 60.6% had some type of incontinence, compared with 61.9% of women aged 75 years and over. The difference was larger for men, however, with 34.1% of those aged 65-74 years reporting incontinence, compared with 42.4% of men aged 75 years and over, the report showed.
The NHANES data are based on in-home interviews with a nationally representative sample of 2,625 respondents.
More than half of older women have experienced incontinence
Among noninstitutionalized Americans aged 65 years and older, 61.2% of women and 38% of men experience at least occasional urinary or bowel incontinence, the National Center for Health Statistics reported.
Data from the 2007-2010 National Health and Nutrition Examination Survey (NHANES) show that 54.8% of women and 29.9% of men had urinary leakage at least a few times a month, while 19.2% of women and 14.9% of men had accidental bowel leakage of mucus, liquid stool, or solid stool at least one to three times a month, according to the NCHS (Vital Health Stat. 2014;3[36]).
Among women aged 65-74 years, 60.6% had some type of incontinence, compared with 61.9% of women aged 75 years and over. The difference was larger for men, however, with 34.1% of those aged 65-74 years reporting incontinence, compared with 42.4% of men aged 75 years and over, the report showed.
The NHANES data are based on in-home interviews with a nationally representative sample of 2,625 respondents.

Health insurance gap widens between large and small companies
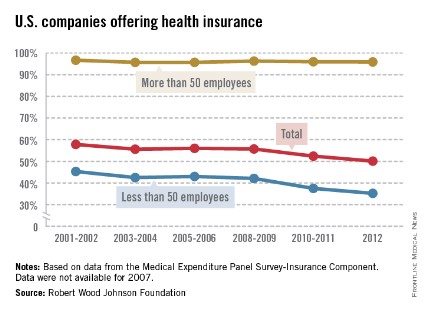
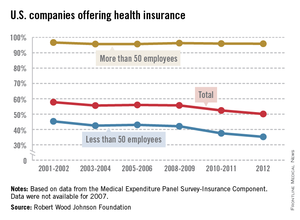
Almost 96% of larger companies still offer health insurance to their employees, but the trend toward smaller companies not providing coverage has accelerated in the last few years, according to the Robert Wood Johnson Foundation.
In 2012, 50.1% of all U.S. firms offered health insurance to their employees, down from 57.8% in 2001-2002. (All estimates represent 2-year averages, except for 2012.) That decline occurred almost entirely among smaller companies – those with fewer than 50 employees – as the percentage offering coverage fell from 45.3% in 2001-2002 to 35.2% in 2012, with two-thirds of the decline occurring after 2008-2009, the RWJF analysis showed.
Among larger companies, the decline was much smaller: from 96.7% in 2001-2002 to 95.9% in 2012.
The data for the analysis came from the Agency for Healthcare Research and Quality’s Medical Expenditure Panel Survey-Insurance Component.