User login
Richard Franki is the associate editor who writes and creates graphs. He started with the company in 1987, when it was known as the International Medical News Group. In his years as a journalist, Richard has worked for Cap Cities/ABC, Disney, Harcourt, Elsevier, Quadrant, Frontline, and Internet Brands. In the 1990s, he was a contributor to the ill-fated Indications column, predecessor of Livin' on the MDedge.
LGBT adults more likely to use tobacco
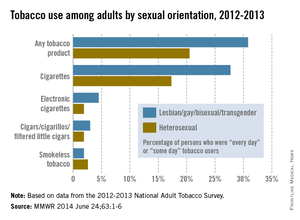
LGBT adults are considerably more likely to use tobacco products than are heterosexual adults, according to a Centers for Disease Control and Prevention report published June 24.
In 2012-2013, the prevalence of "every day" or "some day" use of any tobacco product among lesbian, gay, bisexual, or transgender adults was 30.8%, compared with 20.5% for heterosexual adults. "Every day" or "some day" cigarette use was reported by 27.7% of LGBT adults and 17.3% of heterosexual adults, according to the CDC (MMWR 2014 June 24;63:1-6).
The data from the National Adult Tobacco Survey show that LGBT adults also were more likely to use cigars/cigarillos/filtered small cigarettes (3.0% vs. 1.9%) and electronic cigarettes (4.5% vs. 1.9%), while heterosexual adults were more likely to use smokeless tobacco (2.6% vs. 1.9%), according to the CDC report.
In 2012-2013, the prevalence of "every day" or "some day" use of any tobacco product among lesbian, gay, bisexual, or transgender adults was 30.8%, compared with 20.5% for heterosexual adults. "Every day" or "some day" cigarette use was reported by 27.7% of LGBT adults and 17.3% of heterosexual adults, according to the CDC (MMWR 2014 June 24;63:1-6).
The data from the National Adult Tobacco Survey show that LGBT adults also were more likely to use cigars/cigarillos/filtered small cigarettes (3.0% vs. 1.9%) and electronic cigarettes (4.5% vs. 1.9%), while he
LGBT adults are considerably more likely to use tobacco products than are heterosexual adults, according to a Centers for Disease Control and Prevention report published June 24.
In 2012-2013, the prevalence of "every day" or "some day" use of any tobacco product among lesbian, gay, bisexual, or transgender adults was 30.8%, compared with 20.5% for heterosexual adults. "Every day" or "some day" cigarette use was reported by 27.7% of LGBT adults and 17.3% of heterosexual adults, according to the CDC (MMWR 2014 June 24;63:1-6).
The data from the National Adult Tobacco Survey show that LGBT adults also were more likely to use cigars/cigarillos/filtered small cigarettes (3.0% vs. 1.9%) and electronic cigarettes (4.5% vs. 1.9%), while heterosexual adults were more likely to use smokeless tobacco (2.6% vs. 1.9%), according to the CDC report.
In 2012-2013, the prevalence of "every day" or "some day" use of any tobacco product among lesbian, gay, bisexual, or transgender adults was 30.8%, compared with 20.5% for heterosexual adults. "Every day" or "some day" cigarette use was reported by 27.7% of LGBT adults and 17.3% of heterosexual adults, according to the CDC (MMWR 2014 June 24;63:1-6).
The data from the National Adult Tobacco Survey show that LGBT adults also were more likely to use cigars/cigarillos/filtered small cigarettes (3.0% vs. 1.9%) and electronic cigarettes (4.5% vs. 1.9%), while he
FROM MORBIDITY AND MORTALITY WEEKLY REPORT

Survey: Insurance companies, government blamed for cost of health care
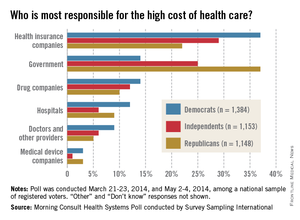
When it comes to the increasingly high cost of health care, Americans are most likely to put the blame on health insurance companies and the government, according to a survey from digital media company Morning Consult.
Among all responders, 30% said that insurance companies were most responsible for the high costs of health care, while 25% put the blame on the government and another 12% named the drug companies, Morning Consult reported.
Things change a bit, though, when viewed through a political lens. Among Democrats, 37% said that insurance companies bore the most responsibility, compared with 14% for the government and 14% for drug companies. Republicans saw the situation a bit differently, with government leading the way at 37%, insurance companies at 22%, and drug companies at 10%. Among Independents, 29% put primary responsibility on insurance companies, 25% on the government, and 10% on drug companies, the survey showed.
Among other entities included in the survey, 9% of all respondents said that hospitals were most responsible for the high cost of health care, 7% blamed physicians, and 2% blamed medical device companies.
The survey was conducted online during March 21-23, 2014, and May 2-4, 2014, among a national sample of 3,687 registered voters. It was performed by Survey Sampling International.

Republicans more likely to report being hurt by health reform
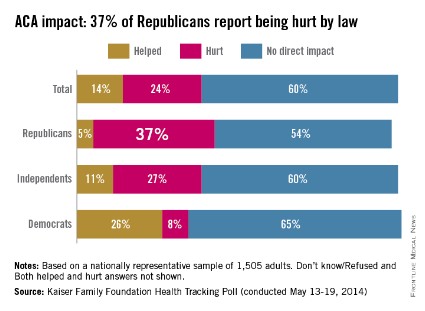
Six out of 10 Americans say that they have not been affected by the Affordable Care Act, with an unsurprising political split among those who say it has either helped or hurt them, according to a report from the Kaiser Family Foundation.
Among Republicans, 37% say that they have been hurt by the health reform law and 5% say that they have been helped. The numbers were basically reversed for Democrats, with 26% saying that they have been helped and 8% reporting that they been hurt. Independents lean more toward the Republicans, with 27% saying that they have been hurt and 11% saying that they have been helped, Kaiser reported in its latest Health Tracking Poll.
Those who report being hurt by the law were most likely to cite their increased health care costs (14% of the public overall), while those who say they have been helped most often say that someone in their family was able to get or keep coverage (5% of the public overall), Kaiser said.
The survey involved a nationally representative sample of 1,505 adults and was conducted May 13-19.
Cancer survivors have higher medical costs
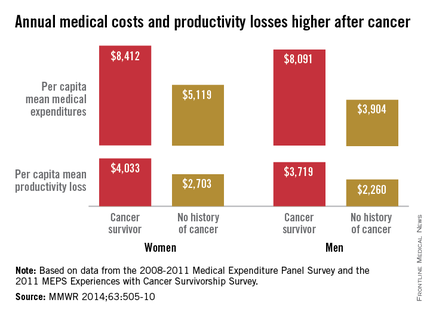
Average annual medical expenses for male cancer survivors were more than double those of men with no history of cancer in 2008-2011, while expenditures for female cancer survivors were 64% higher than those of women without a history of cancer, the Centers for Disease Control and Prevention reported.
A male cancer survivor had a mean annual medical expenditure of $8,091 from 2008 to 2011, along with $3,719 in lost productivity from employment disability, missed work days, and lost household productivity. A man without a history of cancer, by comparison, had an annual medical expenditure of $3,904 and a total productivity loss of $2,260, according to the CDC investigators (MMWR 2014;63:505-10).
For a female cancer survivor, annual medical expenditures totaled $8,412, with $4,033 in lost productivity in 2008-2011. In that same time period, a woman with no history of cancer had medical costs of $5,119 and productivity losses of $2,703, the CDC said.
The report was based on data from the 2008-2011 Medical Expenditure Panel Survey (6,722 cancer survivors and 86,865 with no history) and the 2011 MEPS Experiences with Cancer Survivorship Survey (1,202 cancer survivors).
FROM MORBIDITY AND MORTALITY WEEKLY REPORT

Imaging procedure costs higher in the United States
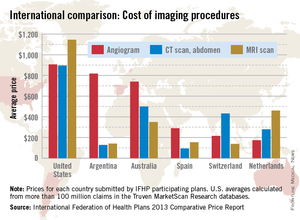
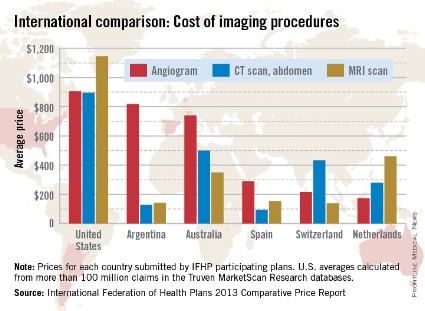
When it comes to diagnostic imaging, the average costs of angiograms, abdominal CTs, and MRIs are higher in the United States than in other industrialized countries, according to the International Federation of Health Plans’ 2013 Comparative Price Report.
The average cost of an angiogram in the United States last year was $907, about 11% higher than Argentina’s $818, which was the second-highest of the six countries included in all three IFHP comparisons. The lowest cost among the six countries was in the Netherlands, at $174.
For an abdominal CT scan, the average cost in the United States was $896 in 2013, compared with $500 in Australia. Spain had the lowest cost, with an average of $94, the IFHP reported. In the United States, the average price for an MRI in 2013 was $1,145, with the Netherlands second at $461 and Switzerland lowest at $138.
New Zealand, which was not included in the angiogram analysis and therefore left out of the graph below, was actually the second most-expensive country in which to get a CT scan ($731) and an MRI ($1,005).
The IFHP is composed of more than 100 member companies in 25 countries. For the survey, the price for each country was submitted by participating member plans. Some prices are drawn from the public sector, and some are from the private sector. U.S. averages are calculated from more than 100 million claims in the Truven MarketScan Research databases.
Million Hearts indicators coming up short
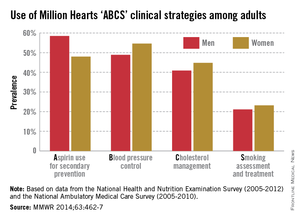
According to its main indicators, the Million Hearts initiative to prevent 1 million heart attacks and strokes by 2017 is falling short of its clinical goals, the Centers for Disease Control and Prevention said May 29.
The four main clinical measures of the Department of Health & Human Services’ initiative are aspirin use for secondary prevention, blood pressure control, cholesterol management, and smoking awareness and treatment, or ABCS. The population-level goal of Million Hearts is to achieve 65% or higher prevalence in each of the ABCS measures, the CDC investigators noted (MMWR 2014;63:462-7).
The latest update of the ABCS measures shows that 53.8% of adults (58.5% of men and 48% of women) are using aspirin for secondary prevention of cardiovascular disease, 51.9% (48.9% of men and 54.6% of women) have their blood pressure under control, 42.8% (40.9% of men and 44.8% of women) are managing their cholesterol, and only 22.2% of tobacco users (21.1% of men and 23.2% of women) were prescribed smoking treatment, they reported.
FROM MORBIDITY AND MORTALITY WEEKLY REPORT

U.S. has more obese people than any other country
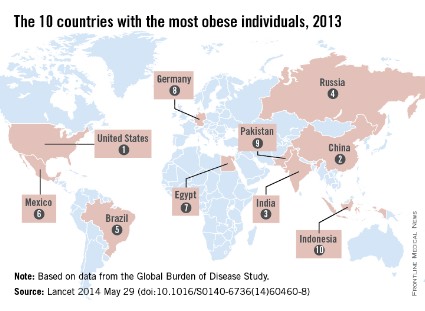
Worldwide, the rate of obesity/overweight has increased by 28% in adults and by 47% in children since 1980, but these rates vary considerably by country, according to a new analysis from the World Health Organization’s Global Burden of Disease Study.
The total number of overweight and obese people is now 2.1 billion, up from 857 million in 1980, said Marie Ng, Ph.D., of the Institute for Health Metrics and Evaluation at the University of Washington, Seattle, and associates (Lancet 2014 May 29 [doi:10.1016/S0140-6736(14)60460-8]).
More than half of the world’s 671 million obese persons, however, live in just 10 countries. The United States has the most, with 13% of the world’s total, followed by (in descending order) China, India, Russia, Brazil, Mexico, Egypt, Germany, Pakistan, and Indonesia, the investigators reported.
"Unlike other major global health risks, such as tobacco and childhood nutrition, obesity is not decreasing worldwide," senior author Emmanuela Gakidou, Ph.D., also of the institute, said in a statement.
The study was funded by the Bill and Melinda Gates Foundation.
FROM THE LANCET
Longer-term opioid use in workers’ comp cases highest in Louisiana
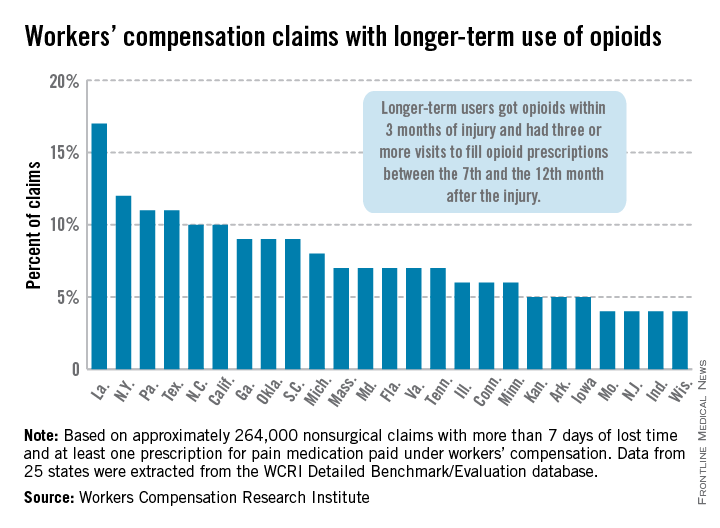
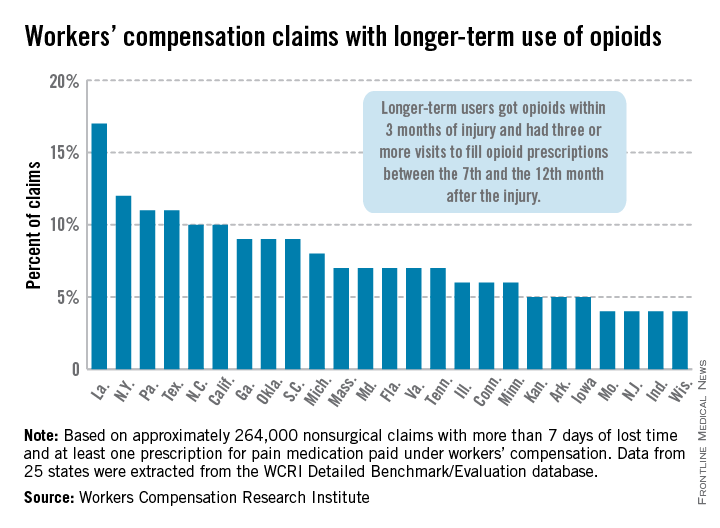
In Louisiana, opioid use lasted more than 6 months in 17% of nonsurgical workers’ compensation claims involving employees who received at least one prescription for pain medication, the Workers Compensation Research Institute reported.
In cases with more than 7 days of lost time, that was the highest rate seen among the 25 states in the study, with New York second at 12% and Pennsylvania and Texas tied for third at 11%. There were four states tied for the lowest rate, at 4%: Missouri, New Jersey, Indiana, and Wisconsin, according to the WCRI report.
Overall, use of narcotics for pain relief by injured workers in such cases ranged from 60% in New Jersey to 88% in Arkansas (median, 76%), while use of any pain medication ranged from 85% in Minnesota to 95% in Florida, Georgia, Tennessee, and Texas (median, 94%), the report showed.
The study involved claims with injuries that occurred from Oct. 1, 2009, through Sept. 30, 2010, with prescriptions filled through March 31, 2012. Longer-term users received a prescription for opioids within 3 months of their injury and had three or more visits to fill opioid prescriptions between the 7th and the 12th month after the injury.
The 25 states in the study "represent more than 70% of the workers’ compensation benefits paid in the United States," the WCRI noted.
The study was based on approximately 264,000 nonsurgical claims and more than 1.5 million prescriptions for pain medications. Data were extracted from the WCRI Detailed Benchmark/Evaluation database and consisted of detailed prescription transactions "collected from workers’ compensation payers and their medical bill review and pharmacy benefit management vendors," the report noted.
10% of Americans take five or more prescription drugs
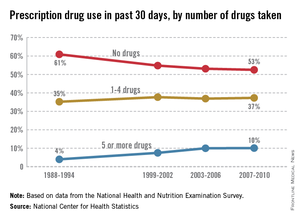
In 2007-2010, 10% of Americans reported taking five or more prescription drugs in the past 30 days, up from 4% in 1988-1994, the National Center for Health Statistics said in its "Health, United States, 2013" report released May 14.
By 2007-2010, close to half of all Americans (47%) reported that they had taken at least one prescription drug in the past month, compared with 40% in 1988-1994, according to the NCHS.
Drug use was greater among older age groups, with 40% of those aged 65 years and over and 17% of those aged 45-64 years taking five or more drugs in the past 30 days, compared with 3% of those aged 18-44 years and 1% of those under age 18, the report said.
The analysis of prescription drug use is based on data from the National Health and Nutrition Examination Survey.

Celebrex cost high in United States, low in Canada
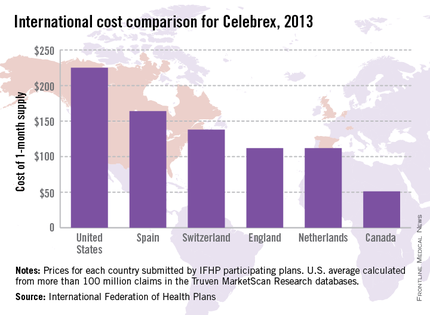
North America is home to the most expensive and least expensive Celebrex, according to the International Federation of Health Plans’ 2013 Comparative Price Report.
The average price for a 1-month supply of Celebrex (celecoxib) was $225 in the United States last year, compared with $51 in Canada, the IFHP reported. The other countries in the survey were the Netherlands ($112), England ($112), Switzerland ($138), and Spain ($164).
Celebrex is approved in the United States for the treatment of osteoarthritis, rheumatoid arthritis, juvenile rheumatoid arthritis in patients 2 years and older, ankylosing spondylitis, acute pain, and primary dysmenorrhea.
The IFHP comprises more than 100 member companies in 25 countries. For the survey, the price for each country was submitted by participating member plans. Some prices are drawn from the public sector, some from the private, and some from both. U.S. averages were calculated from more than 100 million claims in the Truven MarketScan Research databases.
