User login
Richard Franki is the associate editor who writes and creates graphs. He started with the company in 1987, when it was known as the International Medical News Group. In his years as a journalist, Richard has worked for Cap Cities/ABC, Disney, Harcourt, Elsevier, Quadrant, Frontline, and Internet Brands. In the 1990s, he was a contributor to the ill-fated Indications column, predecessor of Livin' on the MDedge.
Humira, Enbrel costs highest in the United States
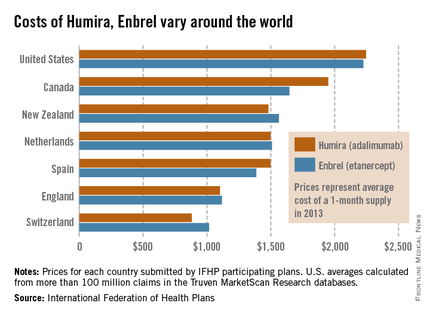
The costs of Humira and Enbrel are higher in the United States, compared with other industrialized countries included in the International Federation of Health Plans’ 2013 Comparative Price Report.
The average cost of a 1-month supply was $2,246 for Humira (adalimumab) in 2013 and $2,225 for Enbrel (etanercept). In Canada, which had second-highest cost for both drugs, Humira cost $1,950 per month and Enbrel cost $1,646 per month, the IFHP reported.
Switzerland had the lowest cost for both drugs among the countries included in the comparison: $881 for Humira and $1,017 for Enbrel.
In the United States, Humira is approved for the treatment of rheumatoid arthritis, juvenile idiopathic arthritis, psoriatic arthritis, ankylosing spondylitis, Crohn’s disease, ulcerative colitis, and plaque psoriasis. Enbrel is approved for RA, polyarticular juvenile idiopathic arthritis in patients aged 2 years or older, psoriatic arthritis, ankylosing spondylitis, and plaque psoriasis.
The IFHP comprises more than 100 member companies in 25 countries. For the survey, the price for each country was submitted by participating member plans. Some prices are drawn from the public sector, some from the private, and some from both. U.S. averages were calculated from more than 100 million claims in the Truven MarketScan Research databases.
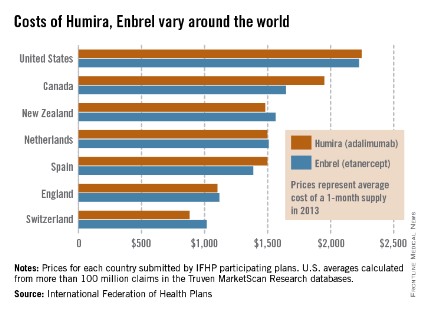
First-birth rates in older women up more than 400% since 1970
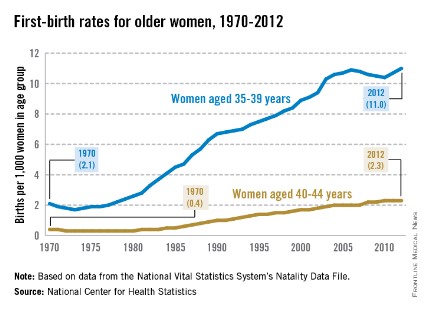
The rate of first births among women aged 35-39 years went up 424% from 1970 to 2012, while the first-birth rate for women aged 40-44 years rose 475%, the National Center for Health Statistics reported.
The first-birth rate for women aged 35-39 years was 11.0 per 1,000 women in that age group in 2012, compared with 2.1 per 1,000 in 1970. For women aged 40-49 years, the rate of first births was 2.3 per 1,000 in 2012, compared with 0.4 in 1970, according to the NCHS.
The investigators noted that first-birth rates for women aged 30-34 years "have increased but not as steadily since the early 2000s," and that rates for women under 30 years old "have declined in the past decade."
From 1990 to 2012, first-birth rates in both age groups increased for all races/ethnicities. Among 35- to 39-year-old women, non-Hispanic blacks had the largest increase, while Asian/Pacific Islanders had the largest increase for those aged 40-44 years. American Indian/Alaska native women had the smallest increases in both age groups, the report showed.
The NCHS analysis was based on data from the National Vital Statistics System’s Natality Data File, which includes information for all births in the United States.
Physician offices provided $10.5 billion in uncompensated care in 2013
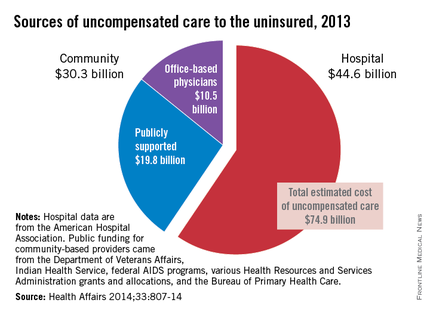
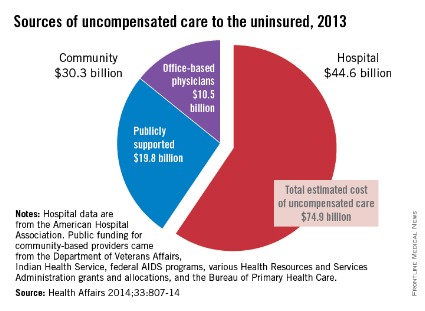
Office-based physicians provided an estimated $10.5 billion worth of in-kind services and charity care to the uninsured in 2013, according to an analysis of uncompensated care in the United States.
Total expenditures for care to the uninsured were projected by using two methods: One used data from the federal Medical Expenditure Panel Survey (MEPS), and the other "used published secondary data from health care providers and government sources," said Teresa A. Coughlin and her associates at the Urban Institute in Washington.
The MEPS data yielded a total uncompensated expenditure of $84.9 billion for 2013, while the second analysis projected a total cost of $74.9 billion. The difference reflects the exclusion of information from some sources in the second analysis, such as drugs provided at no charge by some pharmaceutical companies, and conservative assumptions made about uncompensated care provided by publicly funded sources such as the U.S. Department of Veterans Affairs and the Indian Health Service, they said (Health Aff. 2014;33:807-14).
The $10.5 billion in care provided by office-based physicians represents 14% of the $74.9 billion from the second analysis. The largest share (59.5%, or $44.6 billion) was provided by hospitals, with the other $19.8 billion (26.4%) coming from community sources funded by the VA, IHS, local and state health departments, and automobile and home-owners insurance, Ms. Coughlin and her associates reported.
The MEPS data could not be used to see how costs of uncompensated care were divided among providers and which funding sources paid for such care, so only the second analysis estimated physicians’ share, the investigators noted.
The study was part of a project for the Kaiser Commission on Medicaid and the Uninsured.
FROM HEALTH AFFAIRS
Big-city primary care physicians use fewer midlevel providers
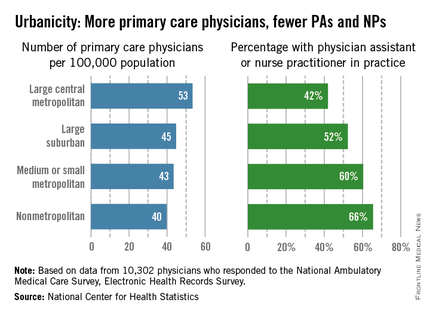
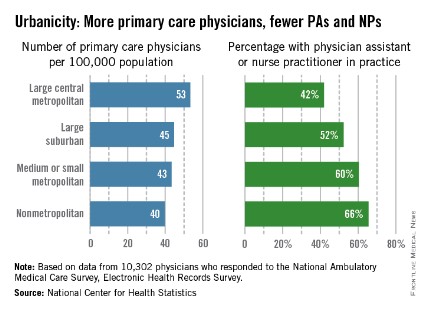
The supply of primary care physicians is greatest in large metropolitan areas, but those big-city PCPs are the least likely to work with physician assistants and nurse practitioners, the National Center for Health Statistics said in a report released May 8.
In 2012, there was a significant trend toward greater availability of PCPs with increased urbanicity, with large central metropolitan areas having 53 PCPs per 100,000 population, large suburban areas at 45 per 100,000, medium or small metropolitan areas at 43 per 100,000, and nonmetropolitan areas at 40 per 100,000, according to NCHS.
The trend, though still significant, reversed for the percentage of primary care practices with PAs or NPs. In nonmetropolitan areas, there was a PA or NP in 66% of offices, compared with 60% for small or medium-sized cities, 52% for large suburbs, and 42% for large central cities, the report showed.
For the analysis, PCPs included those specializing in family and general medicine, internal medicine, pediatrics, and geriatrics. The data used came from 10,302 physicians who responded to the National Ambulatory Medical Care Survey, Electronic Health Records Survey.
Black children more likely to visit ED with injuries
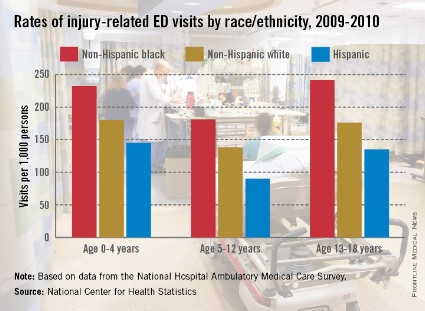
African American children and teenagers had higher rates of injury-related emergency department visits than did whites or Hispanics during 2009-2010, the National Center for Health Statistics said in a report released May 6.
Rates of such visits for non-Hispanic blacks were higher in all three age groups examined, with statistically significant differences seen between black children (232 visits per 1,000 persons) and Hispanic children (145 per 1,000) aged 0-4 years. The difference between blacks and whites aged 0-4 years (180 per 1,000) did not reach significance, according to the NCHS.
In the other two age groups, 5-12 years and 13-18 years, the visit rates between all three groups were statistically significant. For those aged 5-12 years, rates were 181 per 1,000 black children, 138 per 1,000 whites, and 90 per 1,000 Hispanics. Among 13- to 18-year-olds, ED visit rates for injuries were 241 for black teens, 176 for whites, and 135 for Hispanics, the NCHS said.
The researchers used data from the 2009-2010 National Hospital Ambulatory Medical Care Survey, which involved approximately 480 nonfederal, general, and short-stay hospitals and 35,000 ED visits each year.
ACA exchanges most expensive in state-based systems
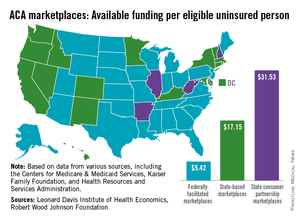
States that opted to run their own Affordable Care Act–mandated health insurance marketplace spent more than three times as much per uninsured person to assist consumers than did states with federally run exchanges.
An analysis by the Leonard Davis Institute of Economics and the Robert Wood Johnson Foundation showed that the 17 state-based marketplaces (SBMs) spent an average of $17.15/eligible uninsured person, compared with $5.42/eligible uninsured person in the 29 federally facilitated marketplaces (FFMs). The five states that use a state-consumer partnership to run their marketplaces spent $31.53/uninsured person.
"SBMs accounted for 50% of total consumer assistance funds, although they have just 31% of all uninsured. In contrast, 63% of the uninsured live in FFM states, which accounted for 33% of the funding. The five partnership states in charge of consumer assistance functions were home to just 6% of the uninsured, but garnered 17% of the funding," the report noted.
The District of Columbia, grouped among the SBM states, spent $163.93/uninsured person, which was higher than any state. The highest-spending state was Hawaii (SBM) at $87.86, and the lowest-spending state was Georgia (FFM), which spent $4.24 per uninsured person, according to the report.
The joint study used data from the Centers for Medicare & Medicaid Services, the Kaiser Family Foundation, and the Health Resources and Services Administration. The Leonard Davis Institute is a cooperative venture between the University of Pennsylvania and the Children’s Hospital of Philadelphia.

CDC: Policy Changes Could Prevent 100,000 Deaths a Year
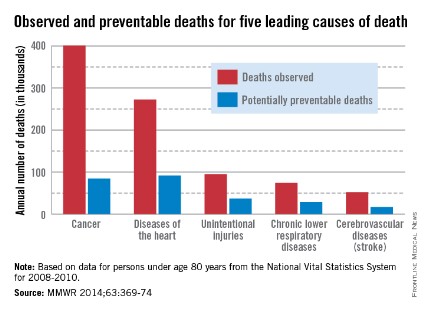
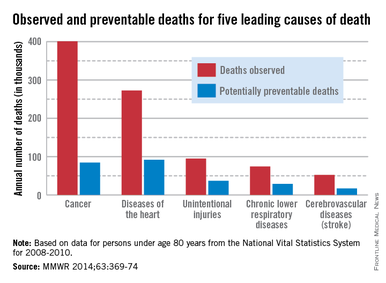
About one-third of heart disease deaths and one-fifth of cancer deaths could be prevented if overall U.S. death rates were the same as those in the states with the lowest rates, the Centers for Disease Control and Prevention reported May 1.
By using an average of the three states with the lowest death rates as a benchmark for each of the five causes, the analysis showed that 91,757 deaths from heart disease could be prevented each year. For cancer, 84,443 deaths could be prevented annually, according to the CDC report (MMWR 2014;63:369-74).
The total number of potentially preventable deaths is around 100,000, because the figures for each cause cannot be added together because someone who doesn’t die of heart disease may die of cancer or stroke, CDC Director Tom Frieden noted in a press briefing. For the rest of the top five causes of death, the numbers of avoidable deaths were 36,836 for unintentional injuries, 28,831 for chronic lower respiratory disease, and 16,973 for cerebrovascular disease.
The report highlights "the enormous variability among states" when it comes to public health policy, he said, with deaths for all five causes highest in the Southeast.
"In this country, your health and safety are determined more by your ZIP code than your genetic code," Dr. Frieden said. "We need to move the needle on policy change and programmatic change."
The analysis used mortality data from 2008 to 2010 for those younger than age 80 years from the National Vital Statistics System.
CDC: Policy changes could prevent 100,000 deaths a year
About one-third of heart disease deaths and one-fifth of cancer deaths could be prevented if overall U.S. death rates were the same as those in the states with the lowest rates, the Centers for Disease Control and Prevention reported May 1.
By using an average of the three states with the lowest death rates as a benchmark for each of the five causes, the analysis showed that 91,757 deaths from heart disease could be prevented each year. For cancer, 84,443 deaths could be prevented annually, according to the CDC report (MMWR 2014;63:369-74).
The total number of potentially preventable deaths is around 100,000, because the figures for each cause cannot be added together because someone who doesn’t die of heart disease may die of cancer or stroke, CDC Director Tom Frieden noted in a press briefing. For the rest of the top five causes of death, the numbers of avoidable deaths were 36,836 for unintentional injuries, 28,831 for chronic lower respiratory disease, and 16,973 for cerebrovascular disease.
The report highlights "the enormous variability among states" when it comes to public health policy, he said, with deaths for all five causes highest in the Southeast.
"In this country, your health and safety are determined more by your ZIP code than your genetic code," Dr. Frieden said. "We need to move the needle on policy change and programmatic change."
The analysis used mortality data from 2008 to 2010 for those younger than age 80 years from the National Vital Statistics System.
FROM MMWR

Marijuana users less likely to adhere to opioid therapy
For chronic pain patients who are prescribed opioids, nonadherence rates are increased among marijuana users and can be as high as or higher than rates in cocaine users, according to a review of a commercial urine drug monitoring database.
Of 116,001 samples submitted to Ameritox for patients prescribed hydrocodone, 29% contained marijuana and a nonprescribed medication and 30% contained cocaine and a nonprescribed medication. Of those with no illicit drug found, 22% had a nonprescribed medication, reported Michael DeGeorge Jr., Pharm.D., and Eric Dawson, Pharm.D., who were both associate directors of medical affairs at Ameritox, a pain medication monitoring laboratory, at the time of the study. Dr. DeGeorge is now director of medical affairs for the company.
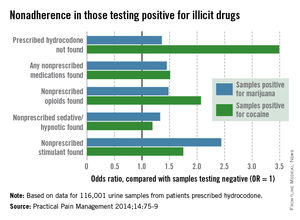
Among samples testing positive for marijuana, 37% did not contain the prescribed hydrocodone, compared with 60% of samples positive for cocaine and 30% of those containing no illicit drugs, the investigators said (Pract. Pain Manage. 2014;14:75-9).
The review also showed that, when compared with samples containing no illicit drugs, those from marijuana users were more likely to contain a nonprescribed opioid (odds ratio, 1.48; 2.07 for cocaine), a nonprescribed sedative/hypnotic (OR, 1.33; 1.19 for cocaine), and a nonprescribed stimulant (OR, 2.44; 1.75 for cocaine), Dr. DeGeorge and Dr. Dawson noted.
"These results indicate that marijuana use should be explored via UDM [urine drug monitoring] in chronic pain patients prescribed opioids. For clinicians who continue to prescribe opioids even if UDM confirms the use of marijuana, this [study] suggests that these patients should be considered at higher risk of medication misuse than patients not using illicit drugs," they wrote.
Such high-risk patients, they added, may warrant "more frequent follow-up, including the use of clinical tools such as prescription drug monitoring programs and more frequent urine drug testing." This recommendation is consistent with recent guidelines from the American Society of Interventional Pain Physicians (Pain Physician 2012;15:s1-s65) and the American Pain Society and the American Academy of Pain Medicine (J. Pain 2009;10:113-30).
The review involved samples submitted to Ameritox from May 16, 2011, to May 15, 2012. Samples were included if physicians requested testing for both marijuana and cocaine. Of the 116,001 samples eligible for inclusion, 85% (99,115) had no illicit drugs present, 13% (15,153) were positive for marijuana only, and 2% (1,731) were positive for cocaine only, Dr. DeGeorge and Dr. Dawson said.
For chronic pain patients who are prescribed opioids, nonadherence rates are increased among marijuana users and can be as high as or higher than rates in cocaine users, according to a review of a commercial urine drug monitoring database.
Of 116,001 samples submitted to Ameritox for patients prescribed hydrocodone, 29% contained marijuana and a nonprescribed medication and 30% contained cocaine and a nonprescribed medication. Of those with no illicit drug found, 22% had a nonprescribed medication, reported Michael DeGeorge Jr., Pharm.D., and Eric Dawson, Pharm.D., who were both associate directors of medical affairs at Ameritox, a pain medication monitoring laboratory, at the time of the study. Dr. DeGeorge is now director of medical affairs for the company.
Among samples testing positive for marijuana, 37% did not contain the prescribed hydrocodone, compared with 60% of samples positive for cocaine and 30% of those containing no illicit drugs, the investigators said (Pract. Pain Manage. 2014;14:75-9).
The review also showed that, when compared with samples containing no illicit drugs, those from marijuana users were more likely to contain a nonprescribed opioid (odds ratio, 1.48; 2.07 for cocaine), a nonprescribed sedative/hypnotic (OR, 1.33; 1.19 for cocaine), and a nonprescribed stimulant (OR, 2.44; 1.75 for cocaine), Dr. DeGeorge and Dr. Dawson noted.
"These results indicate that marijuana use should be explored via UDM [urine drug monitoring] in chronic pain patients prescribed opioids. For clinicians who continue to prescribe opioids even if UDM confirms the use of marijuana, this [study] suggests that these patients should be considered at higher risk of medication misuse than patients not using illicit drugs," they wrote.
Such high-risk patients, they added, may warrant "more frequent follow-up, including the use of clinical tools such as prescription drug monitoring programs and more frequent urine drug testing." This recommendation is consistent with recent guidelines from the American Society of Interventional Pain Physicians (Pain Physician 2012;15:s1-s65) and the American Pain Society and the American Academy of Pain Medicine (J. Pain 2009;10:113-30).
The review involved samples submitted to Ameritox from May 16, 2011, to May 15, 2012. Samples were included if physicians requested testing for both marijuana and cocaine. Of the 116,001 samples eligible for inclusion, 85% (99,115) had no illicit drugs present, 13% (15,153) were positive for marijuana only, and 2% (1,731) were positive for cocaine only, Dr. DeGeorge and Dr. Dawson said.
FROM PRACTICAL PAIN MANAGEMENT

Complication Rates Decline Among Diabetes Patients
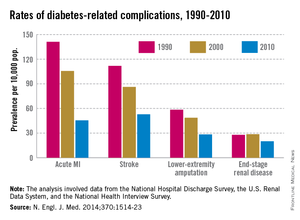
The rate of diabetes-related myocardial infarction has fallen almost 68% since 1990, according to an analysis of several federal data sources.
From 1990 to 2010, the rate of acute MI among adults with diabetes fell from 141 cases/10,000 diabetes patients to 45.5/10,000, Edward W. Gregg, Ph.D. and associates reported.
The rate of diabetes-related stroke was down 53% from 1990 to 2010, dropping from 112 cases/10,000 patients to 53/10,000. Lower-extremity amputations declined by 51% over the same period, as the rate went from 58 cases/10,000 to 28/10,000. The rate of end-stage renal disease fell from 28 cases/10,000 in 1990 to 20/10,000 in 2010 for a 28% decline.
These decreases among diabetes patients surpassed the reductions seen among the nondiabetic population over the same time period, but "the large increase in the number of prevalent cases of diabetes" suggests that "the total burden, or absolute number of cases of complications, will probably continue to increase in the coming decades," wrote Dr. Gregg of the Centers for Disease Control and Prevention, Atlanta, and his associates (N. Engl. J. Med. 2014;370:1514-23).
The analysis involved data from the National Hospital Discharge Survey, the U.S. Renal Data System, and the National Health Interview Survey.