User login
Developing and Measuring Effectiveness of a Distance Learning Dermatology Course: A Prospective Observational Study
Medical education has seen major changes over the last decade. The allotted time for preclinical education has decreased from 24 months to 18 months or less at most institutions, with an increased focus on content associated with health care delivery and health system science.1,2 Many schools now include at least some blended learning with online delivery of preclinical education.3 On the other hand, the clinical portion of medical education has remained largely unchanged prior to the COVID-19 pandemic, with the apprenticeship framework allowing the experienced physician to observe, mentor, and pass on practical knowledge so that the apprentice can one day gain independence after demonstrating adequate proficiency.4
With respect to dermatology education, skin disorders are in the top 5 reported reasons for visits to primary care5; however, a 2009 survey found that only 0.24% to 0.30% of medical schools’ curricula are spent on dermatology.6 Moreover, one institution found that fourth-year medical students received an average of 46.6% on a 15-item quiz designed to assess the ability to diagnose and treat common dermatologic conditions, and within that same cohort, 87.6% of students felt that they received inadequate training in dermatology during medical school.7
COVID-19 caused an unprecedented paradigm shift when medical schools throughout the country, including our own, canceled clinical rotations at the end of March 2020 to protect students and control the spread of infection. To enable clinical and preclinical learning to continue, institutions around the globe turned to either online learning or participation in telehealth as a substitute for clinical rotations.8-10 At the Uniformed Services University of the Health Sciences (Bethesda, Maryland), one of the many online clinical courses offered included a distance learning (DL) dermatology course. Herein, we describe the results of a prospective study evaluating short-term information recall and comprehension as well as students’ confidence in their ability to apply course objectives over 3 months of an online DL dermatology course.
Methods
Between April and July 2020, 14 students at the Uniformed Services University of the Health Sciences (Table 1) enrolled in 1 of 3 four-week DL dermatology classes. The students independently completed the Basic Dermatology Curriculum, a set of online modules with demonstrated efficacy from the American Academy of Dermatology, over 4 weeks.11 Additionally, students were instructed to review an hour of clinical dermatology images daily from online dermatology atlases and e-books accessed through our medical school’s virtual library. Optional Free Open Access Meducation resources also were provided. The course syllabus provided the students with clear expectations, links to the resources, and a recommended daily schedule.

An online video conferencing platform was utilized for an orientation session and 4 subsequent weekly 1.5-hour virtual meetings. The weekly DL meetings focused on a discussion of clinical images pertinent to the American Academy of Dermatology modules covered for the week. These interactive analytic sessions were referred to as Clinpic sessions. With instructor guidance, the students learned to describe images, and they provided differential diagnoses, workup, and treatments for various skin diseases. The virtual meetings included supplemental lectures detailing the use of teledermatology and laser therapy in the Military Health System and a journal review on the cutaneous manifestations of COVID-19.
A 40-question, image-based pretest and posttest utilized during clinical rotations evaluated knowledge recall and comprehension. A precourse and postcourse survey using a 5-point Likert scale (1=not confident; 5=extremely confident) assessed students’ confidence levels across course objectives: general knowledge of dermatology, working knowledge of teledermatology, ability to accurately describe skin lesions, generate sound differential diagnoses, and formulate a reasonable treatment plan. Statistical analysis was performed using free online statistical software at statskingdom.com.12
Results
All 14 student enrollees completed the precourse and postcourse tests and surveys. Pretest and posttest scores followed a normal distribution and therefore met criteria for utilization of a parametric test. The precourse test average of 67% (range, 40%–90%) improved to 84% postcourse (range, 70%–98%; P<.001; 95% CI, 11-23 by paired t test). Not surprisingly, the 2 students who had completed a dermatology rotation had higher average pretest and posttest scores (pretest, 87%; posttest, 94%). Students’ confidence with the course objectives were mostly at the somewhat confident level on the 5-point Likert scale precourse survey. By the end of the course, student survey responses increased to confident and very confident levels, corresponding to an overall improvement of 1.3 points (P<.001 by paired t test)(Table 2) when the mean of the survey results was aggregated across every question. Instructor evaluation of student performance mirrored student assessments.

Comment
The DL dermatology course succeeded in helping the enrolled students attain course objectives and offered a reasonable solution when in-person interaction was restricted. The students in the DL course made notable improvements in their dermatology knowledge and improved their communication, diagnosis, and management skills. Although a blended dermatology curriculum with e-learning combined with clinical experience has been shown to increase knowledge acquisition,13,14 our results suggest that an online-only program also can increase comprehension as well as students’ confidence in their abilities.
A major challenge for the DL course was the lack of opportunity to perform common dermatology procedures. The addition of a hands-on skin procedure module would have been a great supplement to the course but was not possible due to social distancing guidelines during the COVID-19 pandemic. The small sample size and voluntary enrollment were limitations to this study.
Conclusion
Although the traditional dermatology rotation remains the gold standard for clinical instruction, a well-organized DL teaching environment allowed for a more controlled learning experience with a broader coverage of topics to include potentially greater exposure to rare skin disorders not typically encountered in everyday practice. A DL dermatology course may serve as an enduring curriculum for those who wish to learn dermatology more broadly and are not interested in performing skin procedures or direct patient exposure (eg, those pursuing non–primary care specialties, pathology, or radiology). It also may be attractive to students who have had a prior clinical dermatology rotation and desire a different learning experience with a wide coverage of topics.
Acknowledgments—The authors thank Thomas Darling, MD, PhD (Bethesda, Maryland), for coining the term Clinpic and providing critical feedback throughout the course. The authors also thank Sorana Raiciulescu, MS (Bethesda, Maryland), for assistance with the statistical analysis.
- Emanuel EJ. The inevitable reimagining of medical education. JAMA. 2020;323:1127-1128.
- Skochelak SE, Stack SJ. Creating the medical schools of the future. Acad Med. 2017;92:16-19.
- Vallée A, Blacher J, Cariou A, et al. Blended learning compared to traditional learning in medical education: systematic review and meta-analysis. J Med Internet Res. 2020;22:E16504.
- Rangachari D, Brown LE, Kern DE, et al. Clinical coaching: evolving the apprenticeship model for modern housestaff. Med Teach. 2017;39:780-782.
- Finley CR, Chan DS, Garrison S, et al. What are the most common conditions in primary care? Can Fam Physician. 2018;64:832-840.
- McCleskey PE, Gilson RT, DeVillez RL. Medical student core curriculum in dermatology survey. J Am Acad Dermatol. 2009;61:30-35.e4.
- Ulman CA, Binder SB, Borges NJ. Assessment of medical students’ proficiency in dermatology: are medical students adequately prepared to diagnose and treat common dermatologic conditions in the United States? J Educ Eval Health Prof. 2015;12:18.
- Loh TY, Hsiao JL, Shi VY. COVID-19 and its effect on medical student education in dermatology. J Am Acad Dermatol. 2020;83:E163-E164.
- Hilburg R, Patel N, Ambruso S, et al. Medical education during the coronavirus disease-2019 pandemic: learning from a distance. Adv Chronic Kidney Dis. 2020;27:412-417.
- Rose S. Medical student education in the time of COVID-19. JAMA. 2020;323:2131-2132.
- McCleskey PE. Clinic teaching made easy: a prospective study of the American Academy of Dermatology core curriculum in primary care learners. J Am Acad Dermatol. 2013;69:273-279.e1.
- Paired T Test calculator. Statistics Kingdom website. Accessed February 7, 2022. http://www.statskingdom.com/160MeanT2pair.html
- Fransen F, Martens H, Nagtzaam I, et al. Use of e-learning in clinical clerkships: effects on acquisition of dermatological knowledge and learning processes. Int J Med Educ. 2018;9:11-17.
- Silva CS, Souza MB, Silva Filho RS, et al. E-learning program for medical students in dermatology. Clinics. 2011;66:619-622.
Medical education has seen major changes over the last decade. The allotted time for preclinical education has decreased from 24 months to 18 months or less at most institutions, with an increased focus on content associated with health care delivery and health system science.1,2 Many schools now include at least some blended learning with online delivery of preclinical education.3 On the other hand, the clinical portion of medical education has remained largely unchanged prior to the COVID-19 pandemic, with the apprenticeship framework allowing the experienced physician to observe, mentor, and pass on practical knowledge so that the apprentice can one day gain independence after demonstrating adequate proficiency.4
With respect to dermatology education, skin disorders are in the top 5 reported reasons for visits to primary care5; however, a 2009 survey found that only 0.24% to 0.30% of medical schools’ curricula are spent on dermatology.6 Moreover, one institution found that fourth-year medical students received an average of 46.6% on a 15-item quiz designed to assess the ability to diagnose and treat common dermatologic conditions, and within that same cohort, 87.6% of students felt that they received inadequate training in dermatology during medical school.7
COVID-19 caused an unprecedented paradigm shift when medical schools throughout the country, including our own, canceled clinical rotations at the end of March 2020 to protect students and control the spread of infection. To enable clinical and preclinical learning to continue, institutions around the globe turned to either online learning or participation in telehealth as a substitute for clinical rotations.8-10 At the Uniformed Services University of the Health Sciences (Bethesda, Maryland), one of the many online clinical courses offered included a distance learning (DL) dermatology course. Herein, we describe the results of a prospective study evaluating short-term information recall and comprehension as well as students’ confidence in their ability to apply course objectives over 3 months of an online DL dermatology course.
Methods
Between April and July 2020, 14 students at the Uniformed Services University of the Health Sciences (Table 1) enrolled in 1 of 3 four-week DL dermatology classes. The students independently completed the Basic Dermatology Curriculum, a set of online modules with demonstrated efficacy from the American Academy of Dermatology, over 4 weeks.11 Additionally, students were instructed to review an hour of clinical dermatology images daily from online dermatology atlases and e-books accessed through our medical school’s virtual library. Optional Free Open Access Meducation resources also were provided. The course syllabus provided the students with clear expectations, links to the resources, and a recommended daily schedule.
An online video conferencing platform was utilized for an orientation session and 4 subsequent weekly 1.5-hour virtual meetings. The weekly DL meetings focused on a discussion of clinical images pertinent to the American Academy of Dermatology modules covered for the week. These interactive analytic sessions were referred to as Clinpic sessions. With instructor guidance, the students learned to describe images, and they provided differential diagnoses, workup, and treatments for various skin diseases. The virtual meetings included supplemental lectures detailing the use of teledermatology and laser therapy in the Military Health System and a journal review on the cutaneous manifestations of COVID-19.
A 40-question, image-based pretest and posttest utilized during clinical rotations evaluated knowledge recall and comprehension. A precourse and postcourse survey using a 5-point Likert scale (1=not confident; 5=extremely confident) assessed students’ confidence levels across course objectives: general knowledge of dermatology, working knowledge of teledermatology, ability to accurately describe skin lesions, generate sound differential diagnoses, and formulate a reasonable treatment plan. Statistical analysis was performed using free online statistical software at statskingdom.com.12
Results
All 14 student enrollees completed the precourse and postcourse tests and surveys. Pretest and posttest scores followed a normal distribution and therefore met criteria for utilization of a parametric test. The precourse test average of 67% (range, 40%–90%) improved to 84% postcourse (range, 70%–98%; P<.001; 95% CI, 11-23 by paired t test). Not surprisingly, the 2 students who had completed a dermatology rotation had higher average pretest and posttest scores (pretest, 87%; posttest, 94%). Students’ confidence with the course objectives were mostly at the somewhat confident level on the 5-point Likert scale precourse survey. By the end of the course, student survey responses increased to confident and very confident levels, corresponding to an overall improvement of 1.3 points (P<.001 by paired t test)(Table 2) when the mean of the survey results was aggregated across every question. Instructor evaluation of student performance mirrored student assessments.
Comment
The DL dermatology course succeeded in helping the enrolled students attain course objectives and offered a reasonable solution when in-person interaction was restricted. The students in the DL course made notable improvements in their dermatology knowledge and improved their communication, diagnosis, and management skills. Although a blended dermatology curriculum with e-learning combined with clinical experience has been shown to increase knowledge acquisition,13,14 our results suggest that an online-only program also can increase comprehension as well as students’ confidence in their abilities.
A major challenge for the DL course was the lack of opportunity to perform common dermatology procedures. The addition of a hands-on skin procedure module would have been a great supplement to the course but was not possible due to social distancing guidelines during the COVID-19 pandemic. The small sample size and voluntary enrollment were limitations to this study.
Conclusion
Although the traditional dermatology rotation remains the gold standard for clinical instruction, a well-organized DL teaching environment allowed for a more controlled learning experience with a broader coverage of topics to include potentially greater exposure to rare skin disorders not typically encountered in everyday practice. A DL dermatology course may serve as an enduring curriculum for those who wish to learn dermatology more broadly and are not interested in performing skin procedures or direct patient exposure (eg, those pursuing non–primary care specialties, pathology, or radiology). It also may be attractive to students who have had a prior clinical dermatology rotation and desire a different learning experience with a wide coverage of topics.
Acknowledgments—The authors thank Thomas Darling, MD, PhD (Bethesda, Maryland), for coining the term Clinpic and providing critical feedback throughout the course. The authors also thank Sorana Raiciulescu, MS (Bethesda, Maryland), for assistance with the statistical analysis.
- Emanuel EJ. The inevitable reimagining of medical education. JAMA. 2020;323:1127-1128.
- Skochelak SE, Stack SJ. Creating the medical schools of the future. Acad Med. 2017;92:16-19.
- Vallée A, Blacher J, Cariou A, et al. Blended learning compared to traditional learning in medical education: systematic review and meta-analysis. J Med Internet Res. 2020;22:E16504.
- Rangachari D, Brown LE, Kern DE, et al. Clinical coaching: evolving the apprenticeship model for modern housestaff. Med Teach. 2017;39:780-782.
- Finley CR, Chan DS, Garrison S, et al. What are the most common conditions in primary care? Can Fam Physician. 2018;64:832-840.
- McCleskey PE, Gilson RT, DeVillez RL. Medical student core curriculum in dermatology survey. J Am Acad Dermatol. 2009;61:30-35.e4.
- Ulman CA, Binder SB, Borges NJ. Assessment of medical students’ proficiency in dermatology: are medical students adequately prepared to diagnose and treat common dermatologic conditions in the United States? J Educ Eval Health Prof. 2015;12:18.
- Loh TY, Hsiao JL, Shi VY. COVID-19 and its effect on medical student education in dermatology. J Am Acad Dermatol. 2020;83:E163-E164.
- Hilburg R, Patel N, Ambruso S, et al. Medical education during the coronavirus disease-2019 pandemic: learning from a distance. Adv Chronic Kidney Dis. 2020;27:412-417.
- Rose S. Medical student education in the time of COVID-19. JAMA. 2020;323:2131-2132.
- McCleskey PE. Clinic teaching made easy: a prospective study of the American Academy of Dermatology core curriculum in primary care learners. J Am Acad Dermatol. 2013;69:273-279.e1.
- Paired T Test calculator. Statistics Kingdom website. Accessed February 7, 2022. http://www.statskingdom.com/160MeanT2pair.html
- Fransen F, Martens H, Nagtzaam I, et al. Use of e-learning in clinical clerkships: effects on acquisition of dermatological knowledge and learning processes. Int J Med Educ. 2018;9:11-17.
- Silva CS, Souza MB, Silva Filho RS, et al. E-learning program for medical students in dermatology. Clinics. 2011;66:619-622.
Practice Points
- An e-learning distance learning (DL) dermatology course can substantially improve clinically relevant skills and knowledge in dermatology.
- A DL dermatology course may serve as an alternative to clinical rotations for those who wish to learn dermatology more broadly and are not interested in performing skin procedures or direct patient exposure.
Incorporation of Clinical Staff Pharmacists in the Emergency Department Sepsis Response at a Single Institution
Sepsis is life-threatening organ dysfunction caused by dysregulated host response to an infection that can progress to shock. Sepsis is a major cause of death in the United States, with > 1 million people developing sepsis and > 250,000 people dying from sepsis annually.1 The Surviving Sepsis Campaign (SSC) guidelines recommend treating sepsis as an emergency with timely administration of fluids and antibiotics, as administering antibiotics within the first hour has been found to reduce mortality and disease progression. In addition, empiric antibiotic regimens should be chosen to target the most probable pathogens and dosing should be optimized. To achieve this, the SSC guidelines recommend that hospitals develop quality improvement (QI) programs developed by a multidisciplinary group to improve sepsis recognition and response using a protocolized approach.2
There are several studies describing efforts to improve the sepsis response at facilities, some of which have evaluated the addition of a pharmacist into the sepsis response, particularly in the emergency department (ED). Some studies found improved selection and decreased time to antibiotic administration with the addition of an ED pharmacist.3-7 Despite this, ED pharmacists are not present in all hospitals, with a 2015 national survey reporting the presence of an ED pharmacist in 68.7% of respondents at 187 facilities. Even facilities with ED pharmacists often have limited hours of coverage, with at least 8 hours of coverage in 49.4% of facilities with an ED pharmacist and no weekend coverage at 34.8% of these facilities.8
While many hospitals do not routinely employ ED pharmacists, most hospitals have clinical staff pharmacists (CSPs), and many inpatient hospital pharmacies are staffed with CSPs 24 hours per day, 7 days per week. A 2017 survey conducted by the American Society of Health-System Pharmacists (ASHP) found 43% of all hospital pharmacy departments were staffed by a CSP around the clock, with the prevalence increasing to 56.7 to 100% in hospitals with > 100 beds.9 As a result, CSPs may be a useful resource to assist with the management of patients with sepsis in hospitals without an ED pharmacist.
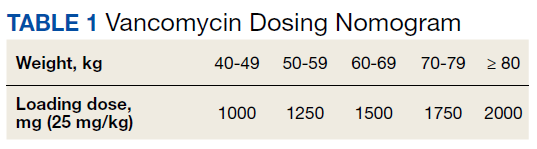
At the Lexington Veterans Affairs Health Care System (LVAHCS) in Kentucky, the inpatient pharmacy department is staffed with a CSP 24/7 but does not have an ED pharmacist. Therefore, when an interdisciplinary group developed an ED sepsis bundle as part of a QI initiative on sepsis recognition and response, the group took a unique approach of incorporating CSPs into the response team to assist with antimicrobial selection and dosing. An antibiotic selection algorithm and vancomycin dosing nomogram were developed to aid CSPs to select and dose antibiotics (Figure, Table 1). We describe the implementation of this process and evaluate CSPs’ accuracy in antimicrobial selection and vancomycin dosing.
Methods
Lexington VAHCS is a 94-bed hospital that provides services to veterans, including an ED, inpatient medical services, surgical services, acute mental health, progressive care, and intensive care units. This facility has 1 antimicrobial stewardship clinical pharmacy specialist, 2 critical care clinical pharmacy specialists, and 16 full-time CSPs with 24-hour CSP coverage. The annual ED volume at the time of this study was approximately 21,000 patients.
Consistent with the SSC guideline recommendation to develop multidisciplinary QI initiatives on sepsis recognition and response, an Interdisciplinary Sepsis Committee (ISC) was created in 2018 comprised of ED, pulmonary, critical care, and infectious diseases licensed independent practitioners (LIPs), ED nurses, and pharmacists. The ISC developed a comprehensive set of sepsis tools that included a sepsis screening tool used by ED triage nurses to provide early detection of sepsis and an updated electronic order set to decrease time to appropriate treatment. This order set included automatic orders for blood cultures and serum lactate, the initiation of IV crystalloids, as well as a Sepsis Alert order placed by ED LIPs which alerted CSPs to a patient with sepsis in the ED.
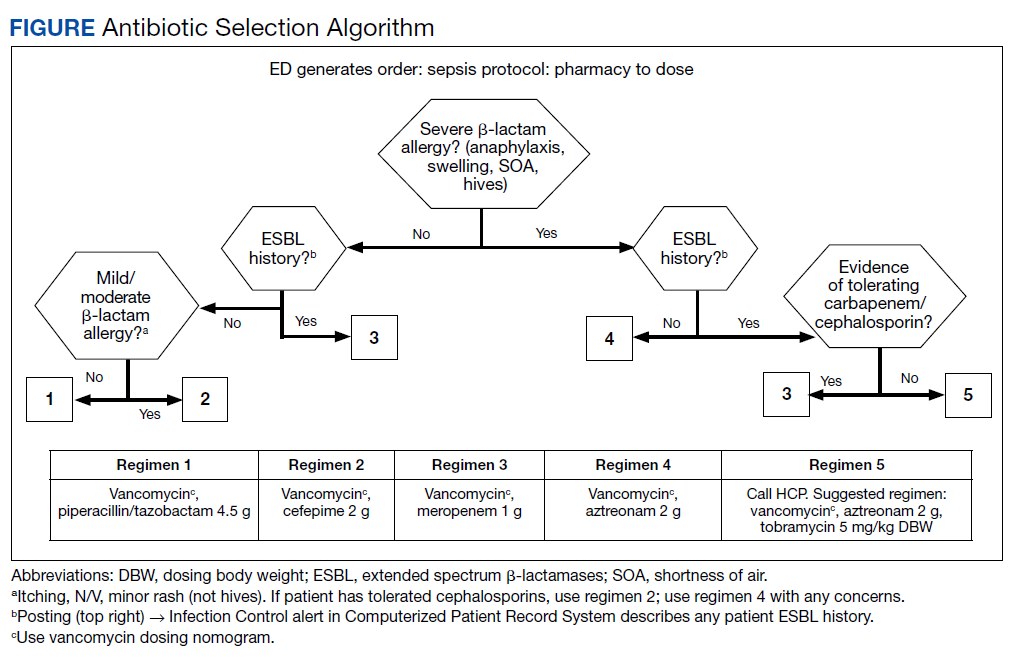
To ensure a protocol-based approach by the CSPs responding to the sepsis alert, an antibiotic algorithm and vancomycin dosing nomogram were developed by the ISC based on current guideline recommendations and the local antibiogram. These were subsequently approved by ED practitioners, the pharmacy and therapeutics committee, and the critical care committee. The antibiotic algorithm prompts CSPs to perform a chart review to identify β-lactam allergies, evaluate the severity of the allergy and which agents the patient has tolerated in the past, as well as determine whether the patient has a history of extended spectrum β-lactamase (ESBL)–producing organisms from previous cultures. A decision tree then guides CSPs toward the selection of 1 of 5 empiric antibiotic regimens to cover all likely pathogens. The medication orders are then entered by the CSPs as a telephone order from the ED LIP per protocol. Unless patients had a true vancomycin allergy, all patients received vancomycin as the empiric gram-positive backbone of the regimen. The vancomycin dosing nomogram was created to ensure an appropriate and consistent vancomycin weight-based loading dose was administered.
Prior to implementation, the antimicrobial stewardship pharmacist educated CSPs on the use of these tools, including simulated orders for mock sepsis alerts to ensure competency. A copy of the algorithm and nomogram were emailed to all CSPs and posted in a prominent location in the pharmacy.
As part of continuous performance improvement efforts of the ISC, a retrospective cohort study was conducted through chart review on patients at the Lexington VAHCS with an order for a sepsis alert in the ED from December 3, 2018 to May 31, 2020 to assess the accuracy of the CSPs’ antibiotic selection and dosing. Patients were excluded if they had a vancomycin allergy or if the ED practitioner ordered antibiotics prior to the CSPs placing orders. Patients could be included more than once in the study if they had sepsis alerts placed on different dates.
The primary outcomes were CSPs’ accuracy in antimicrobial selection with the antibiotic selection algorithm and vancomycin dosing nomogram. The antibiotic selection was deemed accurate if the appropriate antibiotic regimen was selected based on allergy status and previous cultures as directed in the algorithm. The vancomycin dose was considered accurate if the dose chosen was appropriate based on the patient’s weight at the time of ED presentation. Secondary outcomes included time to administration of antibiotics from ED presentation as well as time to antibiotics administration from sepsis alert initiation. Time of administration was considered the time the antibiotics were scanned in the bar code medication administration (BCMA) system.
Descriptive statistics were used with data presented as percentages for nominal data and median as IQR for continuous data. In accordance with our facility’s project assessment process, this project was determined not to constitute human subjects research; therefore, this QI project did not require review by the institutional review board.
Results
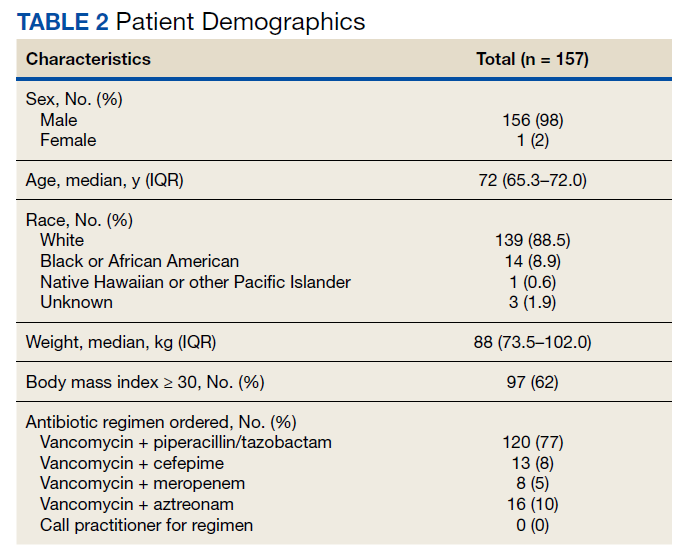
Between December 3, 2018 and May 31, 2020, 160 sepsis alerts were ordered by ED practitioners. Of the 160 patients, 157 were included in the final data analysis. Two patients were excluded due to vancomycin allergy, and 1 patient because the physician ordered antibiotics prior to pharmacist order entry. The population was largely composed of male patients (98%) with a median age of 72 years (Table 2).
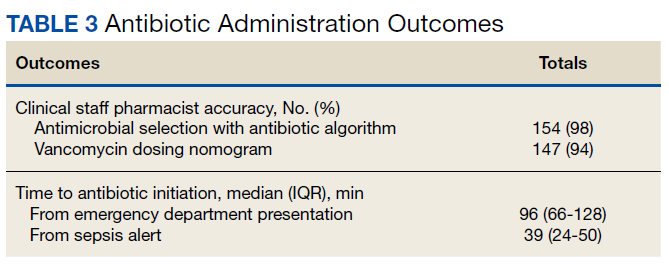
Of 157 sepsis alerts, the antibiotic selection algorithm was used appropriately in 154 (98%) instances (Table 3). Chart reviews were performed in instances of antimicrobial selection different from the algorithm. Of the 3 patients who received antibiotics not consistent with the algorithm, 1 patient without a history of ESBL-producing organisms in their culture history received meropenem instead of piperacillin/tazobactam. Another patient without a penicillin allergy received cefepime (plus metronidazole ordered separately from the ED practitioner) instead of piperacillin/tazobactam, and the third patient received piperacillin/tazobactam instead of meropenem despite a culture history of ESBL-producing organisms. Vancomycin dose was appropriate according to the weight-based nomogram in 147 cases (94%). The median time to administration of first dose antibiotics was 39 minutes after the sepsis alert order was placed and 96 minutes after initial ED presentation.
Discussion
This study found extremely high rates of accuracy among CSPs for both the antibiotic selection algorithm (98%) and the vancomycin dosing nomogram (94%). Moreover, analysis of the 3 patients who received antibiotics that were inconsistent with the algorithm revealed that 2 of these patients arguably still received adequate empiric coverage, increasing the percentage of patients receiving appropriate empiric antibiotics to 99.4%. Similarly, chart review of 10 patients who received vancomycin doses that deviated from the nomogram revealed that in at least 3 cases, patients were likely given correct vancomycin doses based on the patient’s last known weight. However, when actual current weights were recorded soon after admission, the updated weights rendered the initial vancomycin loading dose incorrect when this analysis was performed. Thus, the adherence to the vancomycin dosing nomogram is higher than it appears.
Median time to antibiotic administration from the sepsis alert was 39 minutes—well within SSC recommendations (60 minutes).2 Previous internal analyses at Lexington VAHCS demonstrated the mean time to first dose of antibiotics in the ED has been 39 minutes since about 2015. Thus, this initiative did not necessarily make this process quicker; however it did remove 1 responsibility from LIPs so that they could focus their efforts on other components of sepsis management.
Further studies are needed to evaluate the effects of this initiative on other aspects of the sepsis bundle, such as volume of fluid administered and appropriateness of laboratory tests. It was noted that while the time to first-dose antibiotic administration was < 1 hour from order placement, the median time from ED presentation to antibiotic administration was 96 minutes. This suggests that another focus of the sepsis workgroup should be on speeding recognition of sepsis, triggering the sepsis alert even sooner, and evaluating the feasibility of storing first doses of antibiotics in the automatic dispensing cabinets in the ED.
Limitations
This descriptive study evaluating CSPs’ ability to accurately use the newly developed antibiotic selection algorithm and vancomycin dosing nomogram had no control group for outcome comparison. This study was not designed to evaluate clinical outcomes, such as mortality, so the impact of these interventions need to be further studied. In addition, as veterans receive most of their care at our facility, with their allergies and previous cultures readily available in our electronic health record, this process may not be feasible at other facilities where patients' care is divided among multiple facilities/systems.
Moreover, as the veteran population studied was predominately male patients aged > 60 years, implementation at other hospitals may require the dosing nomograms and treatment algorithms to be adapted for a broader population, such as children and pregnant women. In particular, the ISC chose to implement an algorithm that did not differentiate between suspected source of infections and included anti-Pseudomonal coverage in all regimens based on the most encountered diseases among our veteran population and our local antibiogram; implementation at other facilities would require a thoughtful evaluation of the most appropriate site-specific regimen. Finally, many of the CSPs at our facility are board certified and/or residency trained, so more staff development may be required prior to implementation at other facilities, depending on the experience and comfort level of the CSPs.
Strengths
This study describes an example of a protocolized and multidisciplinary approach to improve sepsis recognition and standardize the response, consistent with SSC guideline recommendations. To the best of our knowledge, this is the first study to demonstrate the incorporation of CSPs into the interdisciplinary sepsis response. This allows for CSPs to practice at the top of their license and contributes to their professional development. Although it was not formally assessed, anecdotally CSPs reported that this process presented a negligible addition to their workload (< 5 minutes was the most reported time requirement), and they expressed satisfaction with their involvement in the sepsis response. Overall, this presents a possible solution to improve the sepsis response in hospitals without a dedicated ED pharmacist.
Conclusions
This study describes the successful incorporation of CSPs into the sepsis response in the ED. As CSPs are more likely than ED pharmacists to be present at a facility, they are arguably an underused resource whose clinical skills can be used to optimize the treatment of patients with sepsis.
1. Centers for Disease Control and Prevention. Sepsis. Accessed March 8, 2022. https://www.cdc.gov/sepsis/what-is-sepsis.html
2. Rhodes A, Evans LE, Alhazzani W, et al. Surviving Sepsis Campaign: international guidelines for management of sepsis and septic shock: 2016. Crit Care Med. 2017 Mar;45(3):486-552. doi:10.1097/CCM.0000000000002255
3. Denny KJ, Gartside JG, Alcorn K, et al. Appropriateness of antibiotic prescribing in the emergency department. J Antimicrob Chemother. 2019 Feb 1;74(2):515-520. doi:10.1093/jac/dky447
4. Laine ME, Flynn JD, Flannery AH. Impact of pharmacist intervention on selection and timing of appropriate antimicrobial therapy in septic shock. J Pharm Pract. 2018 Feb;31(1):46-51. doi:10.1177/0897190017696953
5. Weant KA, Baker SN. Emergency medicine pharmacists and sepsis management. J Pharm Pract. 2013 Aug;26(4):401-5. doi:10.1177/0897190012467211
6. Farmer BM, Hayes BD, Rao R, et al. The role of clinical pharmacists in the emergency department. J Med Toxicol. 2018 Mar;14(1):114-116. doi:10.1007/s13181-017-0634-4
7. Yarbrough N, Bloxam M, Priano J, Louzon Lynch P, Hunt LN, Elfman J. Pharmacist impact on sepsis bundle compliance through participation on an emergency department sepsis alert team. Am J Emerg Med. 2019;37(4):762-763. doi:10.1016/j.ajem.2018.08.00
8. Thomas MC, Acquisto NM, Shirk MB, et al. A national survey of emergency pharmacy practice in the United States. Am J Health Syst Pharm. 2016 Mar 15;73(6):386-94. doi:10.2146/ajhp150321
9. Schneider PJ, Pedersen CA, Scheckelhoff DJ. ASHP national survey of pharmacy practice in hospital settings: dispensing and administration-2017. Am J Health Syst Pharm. 2018;75(16):1203-1226. doi:10.2146/ajhp180151
Sepsis is life-threatening organ dysfunction caused by dysregulated host response to an infection that can progress to shock. Sepsis is a major cause of death in the United States, with > 1 million people developing sepsis and > 250,000 people dying from sepsis annually.1 The Surviving Sepsis Campaign (SSC) guidelines recommend treating sepsis as an emergency with timely administration of fluids and antibiotics, as administering antibiotics within the first hour has been found to reduce mortality and disease progression. In addition, empiric antibiotic regimens should be chosen to target the most probable pathogens and dosing should be optimized. To achieve this, the SSC guidelines recommend that hospitals develop quality improvement (QI) programs developed by a multidisciplinary group to improve sepsis recognition and response using a protocolized approach.2
There are several studies describing efforts to improve the sepsis response at facilities, some of which have evaluated the addition of a pharmacist into the sepsis response, particularly in the emergency department (ED). Some studies found improved selection and decreased time to antibiotic administration with the addition of an ED pharmacist.3-7 Despite this, ED pharmacists are not present in all hospitals, with a 2015 national survey reporting the presence of an ED pharmacist in 68.7% of respondents at 187 facilities. Even facilities with ED pharmacists often have limited hours of coverage, with at least 8 hours of coverage in 49.4% of facilities with an ED pharmacist and no weekend coverage at 34.8% of these facilities.8
While many hospitals do not routinely employ ED pharmacists, most hospitals have clinical staff pharmacists (CSPs), and many inpatient hospital pharmacies are staffed with CSPs 24 hours per day, 7 days per week. A 2017 survey conducted by the American Society of Health-System Pharmacists (ASHP) found 43% of all hospital pharmacy departments were staffed by a CSP around the clock, with the prevalence increasing to 56.7 to 100% in hospitals with > 100 beds.9 As a result, CSPs may be a useful resource to assist with the management of patients with sepsis in hospitals without an ED pharmacist.
At the Lexington Veterans Affairs Health Care System (LVAHCS) in Kentucky, the inpatient pharmacy department is staffed with a CSP 24/7 but does not have an ED pharmacist. Therefore, when an interdisciplinary group developed an ED sepsis bundle as part of a QI initiative on sepsis recognition and response, the group took a unique approach of incorporating CSPs into the response team to assist with antimicrobial selection and dosing. An antibiotic selection algorithm and vancomycin dosing nomogram were developed to aid CSPs to select and dose antibiotics (Figure, Table 1). We describe the implementation of this process and evaluate CSPs’ accuracy in antimicrobial selection and vancomycin dosing.
Methods
Lexington VAHCS is a 94-bed hospital that provides services to veterans, including an ED, inpatient medical services, surgical services, acute mental health, progressive care, and intensive care units. This facility has 1 antimicrobial stewardship clinical pharmacy specialist, 2 critical care clinical pharmacy specialists, and 16 full-time CSPs with 24-hour CSP coverage. The annual ED volume at the time of this study was approximately 21,000 patients.
Consistent with the SSC guideline recommendation to develop multidisciplinary QI initiatives on sepsis recognition and response, an Interdisciplinary Sepsis Committee (ISC) was created in 2018 comprised of ED, pulmonary, critical care, and infectious diseases licensed independent practitioners (LIPs), ED nurses, and pharmacists. The ISC developed a comprehensive set of sepsis tools that included a sepsis screening tool used by ED triage nurses to provide early detection of sepsis and an updated electronic order set to decrease time to appropriate treatment. This order set included automatic orders for blood cultures and serum lactate, the initiation of IV crystalloids, as well as a Sepsis Alert order placed by ED LIPs which alerted CSPs to a patient with sepsis in the ED.
To ensure a protocol-based approach by the CSPs responding to the sepsis alert, an antibiotic algorithm and vancomycin dosing nomogram were developed by the ISC based on current guideline recommendations and the local antibiogram. These were subsequently approved by ED practitioners, the pharmacy and therapeutics committee, and the critical care committee. The antibiotic algorithm prompts CSPs to perform a chart review to identify β-lactam allergies, evaluate the severity of the allergy and which agents the patient has tolerated in the past, as well as determine whether the patient has a history of extended spectrum β-lactamase (ESBL)–producing organisms from previous cultures. A decision tree then guides CSPs toward the selection of 1 of 5 empiric antibiotic regimens to cover all likely pathogens. The medication orders are then entered by the CSPs as a telephone order from the ED LIP per protocol. Unless patients had a true vancomycin allergy, all patients received vancomycin as the empiric gram-positive backbone of the regimen. The vancomycin dosing nomogram was created to ensure an appropriate and consistent vancomycin weight-based loading dose was administered.
Prior to implementation, the antimicrobial stewardship pharmacist educated CSPs on the use of these tools, including simulated orders for mock sepsis alerts to ensure competency. A copy of the algorithm and nomogram were emailed to all CSPs and posted in a prominent location in the pharmacy.
As part of continuous performance improvement efforts of the ISC, a retrospective cohort study was conducted through chart review on patients at the Lexington VAHCS with an order for a sepsis alert in the ED from December 3, 2018 to May 31, 2020 to assess the accuracy of the CSPs’ antibiotic selection and dosing. Patients were excluded if they had a vancomycin allergy or if the ED practitioner ordered antibiotics prior to the CSPs placing orders. Patients could be included more than once in the study if they had sepsis alerts placed on different dates.
The primary outcomes were CSPs’ accuracy in antimicrobial selection with the antibiotic selection algorithm and vancomycin dosing nomogram. The antibiotic selection was deemed accurate if the appropriate antibiotic regimen was selected based on allergy status and previous cultures as directed in the algorithm. The vancomycin dose was considered accurate if the dose chosen was appropriate based on the patient’s weight at the time of ED presentation. Secondary outcomes included time to administration of antibiotics from ED presentation as well as time to antibiotics administration from sepsis alert initiation. Time of administration was considered the time the antibiotics were scanned in the bar code medication administration (BCMA) system.
Descriptive statistics were used with data presented as percentages for nominal data and median as IQR for continuous data. In accordance with our facility’s project assessment process, this project was determined not to constitute human subjects research; therefore, this QI project did not require review by the institutional review board.
Results
Between December 3, 2018 and May 31, 2020, 160 sepsis alerts were ordered by ED practitioners. Of the 160 patients, 157 were included in the final data analysis. Two patients were excluded due to vancomycin allergy, and 1 patient because the physician ordered antibiotics prior to pharmacist order entry. The population was largely composed of male patients (98%) with a median age of 72 years (Table 2).
Of 157 sepsis alerts, the antibiotic selection algorithm was used appropriately in 154 (98%) instances (Table 3). Chart reviews were performed in instances of antimicrobial selection different from the algorithm. Of the 3 patients who received antibiotics not consistent with the algorithm, 1 patient without a history of ESBL-producing organisms in their culture history received meropenem instead of piperacillin/tazobactam. Another patient without a penicillin allergy received cefepime (plus metronidazole ordered separately from the ED practitioner) instead of piperacillin/tazobactam, and the third patient received piperacillin/tazobactam instead of meropenem despite a culture history of ESBL-producing organisms. Vancomycin dose was appropriate according to the weight-based nomogram in 147 cases (94%). The median time to administration of first dose antibiotics was 39 minutes after the sepsis alert order was placed and 96 minutes after initial ED presentation.
Discussion
This study found extremely high rates of accuracy among CSPs for both the antibiotic selection algorithm (98%) and the vancomycin dosing nomogram (94%). Moreover, analysis of the 3 patients who received antibiotics that were inconsistent with the algorithm revealed that 2 of these patients arguably still received adequate empiric coverage, increasing the percentage of patients receiving appropriate empiric antibiotics to 99.4%. Similarly, chart review of 10 patients who received vancomycin doses that deviated from the nomogram revealed that in at least 3 cases, patients were likely given correct vancomycin doses based on the patient’s last known weight. However, when actual current weights were recorded soon after admission, the updated weights rendered the initial vancomycin loading dose incorrect when this analysis was performed. Thus, the adherence to the vancomycin dosing nomogram is higher than it appears.
Median time to antibiotic administration from the sepsis alert was 39 minutes—well within SSC recommendations (60 minutes).2 Previous internal analyses at Lexington VAHCS demonstrated the mean time to first dose of antibiotics in the ED has been 39 minutes since about 2015. Thus, this initiative did not necessarily make this process quicker; however it did remove 1 responsibility from LIPs so that they could focus their efforts on other components of sepsis management.
Further studies are needed to evaluate the effects of this initiative on other aspects of the sepsis bundle, such as volume of fluid administered and appropriateness of laboratory tests. It was noted that while the time to first-dose antibiotic administration was < 1 hour from order placement, the median time from ED presentation to antibiotic administration was 96 minutes. This suggests that another focus of the sepsis workgroup should be on speeding recognition of sepsis, triggering the sepsis alert even sooner, and evaluating the feasibility of storing first doses of antibiotics in the automatic dispensing cabinets in the ED.
Limitations
This descriptive study evaluating CSPs’ ability to accurately use the newly developed antibiotic selection algorithm and vancomycin dosing nomogram had no control group for outcome comparison. This study was not designed to evaluate clinical outcomes, such as mortality, so the impact of these interventions need to be further studied. In addition, as veterans receive most of their care at our facility, with their allergies and previous cultures readily available in our electronic health record, this process may not be feasible at other facilities where patients' care is divided among multiple facilities/systems.
Moreover, as the veteran population studied was predominately male patients aged > 60 years, implementation at other hospitals may require the dosing nomograms and treatment algorithms to be adapted for a broader population, such as children and pregnant women. In particular, the ISC chose to implement an algorithm that did not differentiate between suspected source of infections and included anti-Pseudomonal coverage in all regimens based on the most encountered diseases among our veteran population and our local antibiogram; implementation at other facilities would require a thoughtful evaluation of the most appropriate site-specific regimen. Finally, many of the CSPs at our facility are board certified and/or residency trained, so more staff development may be required prior to implementation at other facilities, depending on the experience and comfort level of the CSPs.
Strengths
This study describes an example of a protocolized and multidisciplinary approach to improve sepsis recognition and standardize the response, consistent with SSC guideline recommendations. To the best of our knowledge, this is the first study to demonstrate the incorporation of CSPs into the interdisciplinary sepsis response. This allows for CSPs to practice at the top of their license and contributes to their professional development. Although it was not formally assessed, anecdotally CSPs reported that this process presented a negligible addition to their workload (< 5 minutes was the most reported time requirement), and they expressed satisfaction with their involvement in the sepsis response. Overall, this presents a possible solution to improve the sepsis response in hospitals without a dedicated ED pharmacist.
Conclusions
This study describes the successful incorporation of CSPs into the sepsis response in the ED. As CSPs are more likely than ED pharmacists to be present at a facility, they are arguably an underused resource whose clinical skills can be used to optimize the treatment of patients with sepsis.
1. Centers for Disease Control and Prevention. Sepsis. Accessed March 8, 2022. https://www.cdc.gov/sepsis/what-is-sepsis.html
2. Rhodes A, Evans LE, Alhazzani W, et al. Surviving Sepsis Campaign: international guidelines for management of sepsis and septic shock: 2016. Crit Care Med. 2017 Mar;45(3):486-552. doi:10.1097/CCM.0000000000002255
3. Denny KJ, Gartside JG, Alcorn K, et al. Appropriateness of antibiotic prescribing in the emergency department. J Antimicrob Chemother. 2019 Feb 1;74(2):515-520. doi:10.1093/jac/dky447
4. Laine ME, Flynn JD, Flannery AH. Impact of pharmacist intervention on selection and timing of appropriate antimicrobial therapy in septic shock. J Pharm Pract. 2018 Feb;31(1):46-51. doi:10.1177/0897190017696953
5. Weant KA, Baker SN. Emergency medicine pharmacists and sepsis management. J Pharm Pract. 2013 Aug;26(4):401-5. doi:10.1177/0897190012467211
6. Farmer BM, Hayes BD, Rao R, et al. The role of clinical pharmacists in the emergency department. J Med Toxicol. 2018 Mar;14(1):114-116. doi:10.1007/s13181-017-0634-4
7. Yarbrough N, Bloxam M, Priano J, Louzon Lynch P, Hunt LN, Elfman J. Pharmacist impact on sepsis bundle compliance through participation on an emergency department sepsis alert team. Am J Emerg Med. 2019;37(4):762-763. doi:10.1016/j.ajem.2018.08.00
8. Thomas MC, Acquisto NM, Shirk MB, et al. A national survey of emergency pharmacy practice in the United States. Am J Health Syst Pharm. 2016 Mar 15;73(6):386-94. doi:10.2146/ajhp150321
9. Schneider PJ, Pedersen CA, Scheckelhoff DJ. ASHP national survey of pharmacy practice in hospital settings: dispensing and administration-2017. Am J Health Syst Pharm. 2018;75(16):1203-1226. doi:10.2146/ajhp180151
Outcomes After Injection-Based Therapy: A Pain Outcomes Questionnaire for Veterans Univariate Analysis
Chronic pain is persistent or recurring pain lasting more than 3 months past normal healing time. Primary care professionals usually refer patients experiencing chronic pain to pain specialists to better identify, treat, and manage the pain. Chronic noncancer-related pain affects more Americans than diabetes mellitus, cardiac disease, and cancer combined.1 Veterans are no exception. The prevalence of severe pain was significantly higher in veterans compared with that of nonveterans who had back pain (21.6 vs 16.7%, respectively), jaw pain (37.5 vs 22.9%, respectively), severe headaches or migraine (26.4 vs 15.9%, respectively), and neck pain (27.7 vs 21.4%, respectively).2 At an individual level, those who experience chronic pain can expect impaired functional capacity, reduced ability to work, sleep disturbance, reduced social interactions, and considerable psychological distress. At a societal level, the cost of treating chronic pain is exorbitant, exceeding $600 billion annually, yet treatment outcomes remain variable at best.3 Greater efforts are needed to improve and standardize patient outcomes.
Interventional pain procedures performed under fluoroscopic or ultrasound guidance by specialist physicians have shown mixed responses in previous studies. Past systematic reviews demonstrate reductions in pain scores after lumbar or caudal epidural steroid injections (ESIs) and radiofrequency ablation of nerves supplying lumbar and thoracic facet joints.4-7 However, one review found insufficient evidence to support injection therapy for chronic low back pain.8 Unfortunately, the majority of the included studies evaluated outcomes using the visual analogue scale (VAS) or other limited factors, such as physical examination findings. Current biopsychosocial conceptualizations of chronic pain are beginning to recognize the complex nature of the experience of pain and highlighting the significance of multimodal management.9 It is vital that our assessment of chronic pain, like our treatment options, be multidimensional and reflect these underpinning principles.
The Pain Outcomes Questionnaire-For Veterans (POQ-VA) was developed within the Veterans Health Administration (VHA) by Clark and colleagues in 2003. It represents a brief but psychometrically sound pain outcomes instrument that assesses all key domains and meets accreditation body standards. The POQ-VA is valid and reliable for evaluating effectiveness of treatment of chronic noncancer pain in veterans in routine clinical practice.10 This review is the first study to use the POQ-VA to assess the impact of interventional pain procedures on veterans with chronic noncancer pain.
The aim of this study was to perform a retrospective review of POQ-VA scores before and after injection-based interventional treatment for chronic pain to determine whether the procedure affected patient outcomes. We hypothesized that POQ-VA scores would improve across multiple domains in the veteran population postprocedure. This study was approved by the Institutional Review Board (IRB-2018-053) at the Providence Veterans Affairs Medical Center (VAMC) in Rhode Island.
Methods
Using the Computerized Patient Record System, all adult veteran patients who had attended at least 2 appointments between April 1, 2009, and April 1, 2019 at the Providence VAMC interventional pain clinic were identified. POQ-VA reports were extracted provided the following criteria were met: (1) the veteran received an injection-based interventional treatment for chronic pain, including trigger point injections, ESIs, nerve blocks, and radiofrequency ablations; (2) the veteran completed POQ-VA both pre- and posttreatment; and (3) posttreatment POQ-VA reports were completed within 6 months of treatment. All patients who did not fit these criteria were excluded from the study.
After deidentification, 112 pre- and posttreatment POQ-VA reports were identified. All subsequent statistical analyses were conducted using Stata SE version 15. Descriptive statistics including mean, range, SD, and percent change were computed for POQ-VA domain—pain, mobility, activities of daily living (ADL), vitality, negative affect, fear, and total raw score—as well as for each POQ-VA question. Given that POQ-VA domain scores were found to be approximately normally distributed without outliers, domain scores were treated as continuous variables, and a paired samples t test was conducted to compare means among POQ-VA domains. Individual question responses were analyzed using nonparametric testing methods to account for the lack of normal distribution in each question, treating the range of 0 to 10 as an ordinal variable. A Wilcoxon matched-pairs signed-rank test was conducted to compare means among individual question responses before and after treatment.
Results
Of 112 included patients, 102 (91%) were male and 10 (9%) were female. The mean age was 62 years (range, 35-90). Diagnosis and procedures varied due to patient symptoms varying from muscle pain, nerve pain, degenerative disc disease, and osteoarthritis.


POQ-VA scores across all domains, including total raw score, showed statistically significant improvement after treatment (Table 1). Directionally, the POQ-VA scores for all 20 questions reflect a positive treatment response and 17 had statistically significant changes (P < .05) (Table 2). The changes in self-perceived energy level, safety, and feelings of tension were not statistically significant. Esteem had the greatest magnitude decrease, falling from 5.2 preprocedure to 3.8 postprocedure (P < .001). Other similarly significant magnitudes of improvement were seen from pre- to postprocedure in questions pertaining to grooming (2.2 to 1.6, P = .003) and the ability to use the bathroom (3.4 to 2.6, P < .001).
Discussion
The most important finding of this study was the ability of the POQ-VA to detect statistically significant positive responses to injection therapy across all domains. The largest improvements were in self-reported pain intensity, pain-related impairment in mobility and ADLs, and self-reported dysphoric effects. The single largest improvement posttreatment was a reduction in scores related to low self-esteem.
Chronic pain can be assessed in a variety of ways ranging from physical examination findings and subjective numerical ratings to extensive patient-reported questionnaires. The International Association for the Study of Pain acknowledges that pain is a complex experience and recommends assessment should be comprehensive.11 Many patient-reported questionnaires are available to clinicians, including some that address pain in a specific body part, such as the Oswestry Low Back Pain Disability Questionnaire, or those that focus on depression or quality-of-life measures, such as the SF-36.12,13
One major benefit of using the POQ-VA is its potential to demonstrate benefits across multiple domains, reflecting the complex nature of chronic pain. The POQ-VA also separates domain or scale scores, allowing clinicians to identify individuals with different patterns of dysfunction across domains.10 This separation also provides insight into which treatment options are best for chronic pain patients with predominant patterns or lower scores in certain domains. The use of a single summary score, as seen in other questionnaires such as the Roland-Morris Activity Scale, may conceal treatment-induced changes in specific outcome domains.14 Additionally, like many other similar instruments, the POQ-VA is easy to understand and use, requires no special training, takes little time to complete, and can be completed in person or over the phone.
As chronic pain has been studied further and its complexity recognized, more instruments have been developed and modified to reflect these new elements. There is no one scale applicable to all populations. A discussion about the strengths and weaknesses of each available assessment tool is outside the scope of this review. However, to date, the POQ-VA is the only instrument that has been validated to detect change following treatment of chronic pain in an exclusively veteran population.10 This validation emphasizes the importance of this study as it supports the use of this outcome measure to monitor treatment of pain in VA facilities.
One of the secondary findings indicated that injection therapy improved veterans’ physical activity levels and self-esteem and lowered pain scores as well as kinesiophobia and anxiety. The role of interventional procedures has been well established in the field of chronic pain, but their efficacy has been less clear. Injections are costly and not without risk, and these factors relegate them to fourth-line treatment options in most situations.15 Several meta-analyses have demonstrated small improvements in pain scores and patient-reported questionnaires after medial branch blocks, and lumbar or caudal ESIs for chronic back pain.5-7 However, an updated Cochrane Review concluded that there was insufficient evidence to support the use of injection therapy in subacute and chronic low back pain.8 The review acknowledged the limited methodologic quality of the trials and could not definitively report that injection therapy did not have benefits for certain subgroups of patients. The ability of researchers to detect benefit from an intervention is intrinsically linked to how outcomes are determined. The most interesting finding of our study was the patient-reported improved self-esteem scores. Many trials included in the systematic reviews discussed used outcome measures that did not have the multidimensional scope to demonstrate such a potential benefit.
Limitations
Our relatively small sample size represents the main shortcoming of this study. Because many posttreatment questionnaires were never collected, unfortunately, much potential data was lost. Most procedures performed were corticosteroid injections for the treatment of low back pain. This represented a combination of lumbar ESI, caudal ESI, medial branch blocks, and sacroiliac joint injections. The limited numbers meant that a further regression analysis of each injection type was not possible. Since few interventions treated pain in other areas of the body, it is difficult to determine whether procedures such as hip joint injections and ilioinguinal nerve blocks provided overall benefit. In the same vein, there is an inability to comment on which injection for chronic low back pain was the most efficacious.
The veteran population, while similar to the general population experiencing chronic pain, is more likely to experience PTSD and other mental health conditions.2 According to medical literature, no randomized controlled trials have been published examining pain interventions exclusively in veterans, so the applicability of these results needs further investigation. This study suggests there are potential benefits for the veteran population, not solely perhaps from receiving injection therapy, but to having access to an interventional pain clinic led by a pain physician within a network of other specialties. While limited by the inherent biases of a retrospective review, this study highlights the potential value in continuing to study this subgroup of patients, especially in the setting of an interdisciplinary approach.
Recent literature suggests interdisciplinary chronic pain management represents the best outcomes for patients’ physical, emotional, and social health, though these kinds of focused outpatient programs have not been studied on a large scale.16 The evolution of pain management in recent years to incorporating a biopsychosocial model has revolutionized how pain is treated and assessed, with multiple studies suggesting the greatest benefits lie in a multipronged approach.16,17 Past studies assessing individual interventions for chronic pain tend not to show strongly positive results, further reinforcing the idea that the answer does not lie in a specific treatment. Many veterans who were included in this study possibly had received or were receiving adjunct therapies such as physical therapy, cognitive behavioral therapy, and acupuncture for pain management, as well as oral and topical medications. Unfortunately, due to the selected methodology, it was not possible for us to gather those data. In turn, we were unable to determine how much these additional factors played a role in changing patient scores, alongside injection therapy. This inability to control variables in this type of research continues to present a challenge to data interpretation, even in the highest quality of research, as acknowledged by Staal and colleagues.8
Future research may be best focused by expanding our knowledge of outpatient interdisciplinary pain management programs. Some interventions may be more relevant for a particular group within a program, and this information can be useful to direct resources.18 Future prospects will require an appropriate multidimensional assessment tool, and the POQ-VA is an example of a valid and reliable option for monitoring progress in pain management in the veteran population.
Conclusions
The POQ-VA is the only instrument to date that has been validated to detect change following treatment of chronic pain in an exclusively veteran population. Our study is the first univariate analysis since the instrument’s validation in 2003. Our descriptive and inferential statistics suggest that the majority of veterans undergoing injection therapy for chronic pain had statistically significant improvements in POQ-VA measures within a 6-month period following treatment. In order to conduct more rigorous, multivariate studies, continued and more widespread use of the POQ-VA instrument is warranted.
1. Johannes CB, Le TK, Zhou X, Johnston JA, Dworkin RH. The prevalence of chronic pain in United States adults: results of an Internet-based survey. J Pain. 2010;11(11):1230-1239. doi:10.1016/j.jpain.2010.07.002
2. Nahin RL. Severe Pain in Veterans: The effect of age and sex, and comparisons with the general population. J Pain. 2017;18(3):247-254. doi:10.1016/j.jpain.2016.10.021
3. Witkin LR, Farrar JT, Ashburn MA. Can assessing chronic pain outcomes data improve outcomes?. Pain Med. 2013;14(6):779-791. doi:10.1111/pme.12075
4. Benyamin RM, Manchikanti L, Parr AT, et al. The effectiveness of lumbar interlaminar epidural injections in managing chronic low back and lower extremity pain. Pain Physician. 2012;15(4):E363-E404.
5. Zhai J, Zhang L, Li M, et al. Epidural injection with or without steroid in managing chronic low-back and lower extremity pain: a meta-analysis of 10 randomized controlled trials. Am J Ther. 2017;24(3):e259-e269. doi:10.1097/MJT.0000000000000265
6. Parr AT, Manchikanti L, Hameed H, et al. Caudal epidural injections in the management of chronic low back pain: a systematic appraisal of the literature. Pain Physician. 2012;15(3):E159-E198.
7. Lee CH, Chung CK, Kim CH. The efficacy of conventional radiofrequency denervation in patients with chronic low back pain originating from the facet joints: a meta-analysis of randomized controlled trials. Spine J. 2017;17(11):1770-1780. doi:10.1016/j.spinee.2017.05.006
8. Staal JB, de Bie R, de Vet HC, Hildebrandt J, Nelemans P. Injection therapy for subacute and chronic low-back pain. Cochrane Database Syst Rev. 2008;2008(3):CD001824. Published 2008 Jul 16. doi:10.1002/14651858.CD001824.pub3
9. Gironda RJ, Clark ME. Cluster analysis of the pain outcomes questionnaire. Pain Med. 2008;9(7):813-823. doi:10.1111/j.1526-4637.2007.00397.x
10. Clark ME, Gironda RJ, Young RW. Development and validation of the Pain Outcomes Questionnaire-VA. J Rehabil Res Dev. 2003;40(5):381-395. doi:10.1682/jrrd.2003.09.0381
11. Watt-Watson J, McGillion M, Lax L, et al. Evaluating an Innovative eLearning Pain Education Interprofessional Resource: A Pre-Post Study. Pain Med. 2019;20(1):37-49. doi:10.1093/pm/pny105
12. Fairbank JC, Couper J, Davies JB, O’Brien JP. The Oswestry low back pain disability questionnaire. Physiotherapy. 1980;66(8):271-273.
13. Ware JE Jr, Sherbourne CD. The MOS 36-item short-form health survey (SF-36). I. Conceptual framework and item selection. Med Care. 1992;30(6):473-483.
14. Jensen MP, Strom SE, Turner JA, Romano JM. Validity of the Sickness Impact Profile Roland scale as a measure of dysfunction in chronic pain patients. Pain. 1992;50(2):157-162. doi:10.1016/0304-3959(92)90156-6
15. Hylands-White N, Duarte RV, Raphael JH. An overview of treatment approaches for chronic pain management. Rheumatol Int. 2017;37(1):29-42. doi:10.1007/s00296-016-3481-8
16. Bujak BK, Regan E, Beattie PF, Harrington S. The effectiveness of interdisciplinary intensive outpatient programs in a population with diverse chronic pain conditions: a systematic review and meta-analysis. Pain Manag. 2019;9(4):417-429. doi:10.2217/pmt-2018-0087
17. Guzmán J, Esmail R, Karjalainen K, Malmivaara A, Irvin E, Bombardier C. Multidisciplinary bio-psycho-social rehabilitation for chronic low back pain. Cochrane Database Syst Rev. 2002;(1):CD000963. doi:10.1002/14651858.CD000963
18. Wilson IR. Management of chronic pain through pain management programmes. Br Med Bull. 2017;124(1):55-64. doi:10.1093/bmb/ldx032
Chronic pain is persistent or recurring pain lasting more than 3 months past normal healing time. Primary care professionals usually refer patients experiencing chronic pain to pain specialists to better identify, treat, and manage the pain. Chronic noncancer-related pain affects more Americans than diabetes mellitus, cardiac disease, and cancer combined.1 Veterans are no exception. The prevalence of severe pain was significantly higher in veterans compared with that of nonveterans who had back pain (21.6 vs 16.7%, respectively), jaw pain (37.5 vs 22.9%, respectively), severe headaches or migraine (26.4 vs 15.9%, respectively), and neck pain (27.7 vs 21.4%, respectively).2 At an individual level, those who experience chronic pain can expect impaired functional capacity, reduced ability to work, sleep disturbance, reduced social interactions, and considerable psychological distress. At a societal level, the cost of treating chronic pain is exorbitant, exceeding $600 billion annually, yet treatment outcomes remain variable at best.3 Greater efforts are needed to improve and standardize patient outcomes.
Interventional pain procedures performed under fluoroscopic or ultrasound guidance by specialist physicians have shown mixed responses in previous studies. Past systematic reviews demonstrate reductions in pain scores after lumbar or caudal epidural steroid injections (ESIs) and radiofrequency ablation of nerves supplying lumbar and thoracic facet joints.4-7 However, one review found insufficient evidence to support injection therapy for chronic low back pain.8 Unfortunately, the majority of the included studies evaluated outcomes using the visual analogue scale (VAS) or other limited factors, such as physical examination findings. Current biopsychosocial conceptualizations of chronic pain are beginning to recognize the complex nature of the experience of pain and highlighting the significance of multimodal management.9 It is vital that our assessment of chronic pain, like our treatment options, be multidimensional and reflect these underpinning principles.
The Pain Outcomes Questionnaire-For Veterans (POQ-VA) was developed within the Veterans Health Administration (VHA) by Clark and colleagues in 2003. It represents a brief but psychometrically sound pain outcomes instrument that assesses all key domains and meets accreditation body standards. The POQ-VA is valid and reliable for evaluating effectiveness of treatment of chronic noncancer pain in veterans in routine clinical practice.10 This review is the first study to use the POQ-VA to assess the impact of interventional pain procedures on veterans with chronic noncancer pain.
The aim of this study was to perform a retrospective review of POQ-VA scores before and after injection-based interventional treatment for chronic pain to determine whether the procedure affected patient outcomes. We hypothesized that POQ-VA scores would improve across multiple domains in the veteran population postprocedure. This study was approved by the Institutional Review Board (IRB-2018-053) at the Providence Veterans Affairs Medical Center (VAMC) in Rhode Island.
Methods
Using the Computerized Patient Record System, all adult veteran patients who had attended at least 2 appointments between April 1, 2009, and April 1, 2019 at the Providence VAMC interventional pain clinic were identified. POQ-VA reports were extracted provided the following criteria were met: (1) the veteran received an injection-based interventional treatment for chronic pain, including trigger point injections, ESIs, nerve blocks, and radiofrequency ablations; (2) the veteran completed POQ-VA both pre- and posttreatment; and (3) posttreatment POQ-VA reports were completed within 6 months of treatment. All patients who did not fit these criteria were excluded from the study.
After deidentification, 112 pre- and posttreatment POQ-VA reports were identified. All subsequent statistical analyses were conducted using Stata SE version 15. Descriptive statistics including mean, range, SD, and percent change were computed for POQ-VA domain—pain, mobility, activities of daily living (ADL), vitality, negative affect, fear, and total raw score—as well as for each POQ-VA question. Given that POQ-VA domain scores were found to be approximately normally distributed without outliers, domain scores were treated as continuous variables, and a paired samples t test was conducted to compare means among POQ-VA domains. Individual question responses were analyzed using nonparametric testing methods to account for the lack of normal distribution in each question, treating the range of 0 to 10 as an ordinal variable. A Wilcoxon matched-pairs signed-rank test was conducted to compare means among individual question responses before and after treatment.
Results
Of 112 included patients, 102 (91%) were male and 10 (9%) were female. The mean age was 62 years (range, 35-90). Diagnosis and procedures varied due to patient symptoms varying from muscle pain, nerve pain, degenerative disc disease, and osteoarthritis.
POQ-VA scores across all domains, including total raw score, showed statistically significant improvement after treatment (Table 1). Directionally, the POQ-VA scores for all 20 questions reflect a positive treatment response and 17 had statistically significant changes (P < .05) (Table 2). The changes in self-perceived energy level, safety, and feelings of tension were not statistically significant. Esteem had the greatest magnitude decrease, falling from 5.2 preprocedure to 3.8 postprocedure (P < .001). Other similarly significant magnitudes of improvement were seen from pre- to postprocedure in questions pertaining to grooming (2.2 to 1.6, P = .003) and the ability to use the bathroom (3.4 to 2.6, P < .001).
Discussion
The most important finding of this study was the ability of the POQ-VA to detect statistically significant positive responses to injection therapy across all domains. The largest improvements were in self-reported pain intensity, pain-related impairment in mobility and ADLs, and self-reported dysphoric effects. The single largest improvement posttreatment was a reduction in scores related to low self-esteem.
Chronic pain can be assessed in a variety of ways ranging from physical examination findings and subjective numerical ratings to extensive patient-reported questionnaires. The International Association for the Study of Pain acknowledges that pain is a complex experience and recommends assessment should be comprehensive.11 Many patient-reported questionnaires are available to clinicians, including some that address pain in a specific body part, such as the Oswestry Low Back Pain Disability Questionnaire, or those that focus on depression or quality-of-life measures, such as the SF-36.12,13
One major benefit of using the POQ-VA is its potential to demonstrate benefits across multiple domains, reflecting the complex nature of chronic pain. The POQ-VA also separates domain or scale scores, allowing clinicians to identify individuals with different patterns of dysfunction across domains.10 This separation also provides insight into which treatment options are best for chronic pain patients with predominant patterns or lower scores in certain domains. The use of a single summary score, as seen in other questionnaires such as the Roland-Morris Activity Scale, may conceal treatment-induced changes in specific outcome domains.14 Additionally, like many other similar instruments, the POQ-VA is easy to understand and use, requires no special training, takes little time to complete, and can be completed in person or over the phone.
As chronic pain has been studied further and its complexity recognized, more instruments have been developed and modified to reflect these new elements. There is no one scale applicable to all populations. A discussion about the strengths and weaknesses of each available assessment tool is outside the scope of this review. However, to date, the POQ-VA is the only instrument that has been validated to detect change following treatment of chronic pain in an exclusively veteran population.10 This validation emphasizes the importance of this study as it supports the use of this outcome measure to monitor treatment of pain in VA facilities.
One of the secondary findings indicated that injection therapy improved veterans’ physical activity levels and self-esteem and lowered pain scores as well as kinesiophobia and anxiety. The role of interventional procedures has been well established in the field of chronic pain, but their efficacy has been less clear. Injections are costly and not without risk, and these factors relegate them to fourth-line treatment options in most situations.15 Several meta-analyses have demonstrated small improvements in pain scores and patient-reported questionnaires after medial branch blocks, and lumbar or caudal ESIs for chronic back pain.5-7 However, an updated Cochrane Review concluded that there was insufficient evidence to support the use of injection therapy in subacute and chronic low back pain.8 The review acknowledged the limited methodologic quality of the trials and could not definitively report that injection therapy did not have benefits for certain subgroups of patients. The ability of researchers to detect benefit from an intervention is intrinsically linked to how outcomes are determined. The most interesting finding of our study was the patient-reported improved self-esteem scores. Many trials included in the systematic reviews discussed used outcome measures that did not have the multidimensional scope to demonstrate such a potential benefit.
Limitations
Our relatively small sample size represents the main shortcoming of this study. Because many posttreatment questionnaires were never collected, unfortunately, much potential data was lost. Most procedures performed were corticosteroid injections for the treatment of low back pain. This represented a combination of lumbar ESI, caudal ESI, medial branch blocks, and sacroiliac joint injections. The limited numbers meant that a further regression analysis of each injection type was not possible. Since few interventions treated pain in other areas of the body, it is difficult to determine whether procedures such as hip joint injections and ilioinguinal nerve blocks provided overall benefit. In the same vein, there is an inability to comment on which injection for chronic low back pain was the most efficacious.
The veteran population, while similar to the general population experiencing chronic pain, is more likely to experience PTSD and other mental health conditions.2 According to medical literature, no randomized controlled trials have been published examining pain interventions exclusively in veterans, so the applicability of these results needs further investigation. This study suggests there are potential benefits for the veteran population, not solely perhaps from receiving injection therapy, but to having access to an interventional pain clinic led by a pain physician within a network of other specialties. While limited by the inherent biases of a retrospective review, this study highlights the potential value in continuing to study this subgroup of patients, especially in the setting of an interdisciplinary approach.
Recent literature suggests interdisciplinary chronic pain management represents the best outcomes for patients’ physical, emotional, and social health, though these kinds of focused outpatient programs have not been studied on a large scale.16 The evolution of pain management in recent years to incorporating a biopsychosocial model has revolutionized how pain is treated and assessed, with multiple studies suggesting the greatest benefits lie in a multipronged approach.16,17 Past studies assessing individual interventions for chronic pain tend not to show strongly positive results, further reinforcing the idea that the answer does not lie in a specific treatment. Many veterans who were included in this study possibly had received or were receiving adjunct therapies such as physical therapy, cognitive behavioral therapy, and acupuncture for pain management, as well as oral and topical medications. Unfortunately, due to the selected methodology, it was not possible for us to gather those data. In turn, we were unable to determine how much these additional factors played a role in changing patient scores, alongside injection therapy. This inability to control variables in this type of research continues to present a challenge to data interpretation, even in the highest quality of research, as acknowledged by Staal and colleagues.8
Future research may be best focused by expanding our knowledge of outpatient interdisciplinary pain management programs. Some interventions may be more relevant for a particular group within a program, and this information can be useful to direct resources.18 Future prospects will require an appropriate multidimensional assessment tool, and the POQ-VA is an example of a valid and reliable option for monitoring progress in pain management in the veteran population.
Conclusions
The POQ-VA is the only instrument to date that has been validated to detect change following treatment of chronic pain in an exclusively veteran population. Our study is the first univariate analysis since the instrument’s validation in 2003. Our descriptive and inferential statistics suggest that the majority of veterans undergoing injection therapy for chronic pain had statistically significant improvements in POQ-VA measures within a 6-month period following treatment. In order to conduct more rigorous, multivariate studies, continued and more widespread use of the POQ-VA instrument is warranted.
1. Johannes CB, Le TK, Zhou X, Johnston JA, Dworkin RH. The prevalence of chronic pain in United States adults: results of an Internet-based survey. J Pain. 2010;11(11):1230-1239. doi:10.1016/j.jpain.2010.07.002
2. Nahin RL. Severe Pain in Veterans: The effect of age and sex, and comparisons with the general population. J Pain. 2017;18(3):247-254. doi:10.1016/j.jpain.2016.10.021
3. Witkin LR, Farrar JT, Ashburn MA. Can assessing chronic pain outcomes data improve outcomes?. Pain Med. 2013;14(6):779-791. doi:10.1111/pme.12075
4. Benyamin RM, Manchikanti L, Parr AT, et al. The effectiveness of lumbar interlaminar epidural injections in managing chronic low back and lower extremity pain. Pain Physician. 2012;15(4):E363-E404.
5. Zhai J, Zhang L, Li M, et al. Epidural injection with or without steroid in managing chronic low-back and lower extremity pain: a meta-analysis of 10 randomized controlled trials. Am J Ther. 2017;24(3):e259-e269. doi:10.1097/MJT.0000000000000265
6. Parr AT, Manchikanti L, Hameed H, et al. Caudal epidural injections in the management of chronic low back pain: a systematic appraisal of the literature. Pain Physician. 2012;15(3):E159-E198.
7. Lee CH, Chung CK, Kim CH. The efficacy of conventional radiofrequency denervation in patients with chronic low back pain originating from the facet joints: a meta-analysis of randomized controlled trials. Spine J. 2017;17(11):1770-1780. doi:10.1016/j.spinee.2017.05.006
8. Staal JB, de Bie R, de Vet HC, Hildebrandt J, Nelemans P. Injection therapy for subacute and chronic low-back pain. Cochrane Database Syst Rev. 2008;2008(3):CD001824. Published 2008 Jul 16. doi:10.1002/14651858.CD001824.pub3
9. Gironda RJ, Clark ME. Cluster analysis of the pain outcomes questionnaire. Pain Med. 2008;9(7):813-823. doi:10.1111/j.1526-4637.2007.00397.x
10. Clark ME, Gironda RJ, Young RW. Development and validation of the Pain Outcomes Questionnaire-VA. J Rehabil Res Dev. 2003;40(5):381-395. doi:10.1682/jrrd.2003.09.0381
11. Watt-Watson J, McGillion M, Lax L, et al. Evaluating an Innovative eLearning Pain Education Interprofessional Resource: A Pre-Post Study. Pain Med. 2019;20(1):37-49. doi:10.1093/pm/pny105
12. Fairbank JC, Couper J, Davies JB, O’Brien JP. The Oswestry low back pain disability questionnaire. Physiotherapy. 1980;66(8):271-273.
13. Ware JE Jr, Sherbourne CD. The MOS 36-item short-form health survey (SF-36). I. Conceptual framework and item selection. Med Care. 1992;30(6):473-483.
14. Jensen MP, Strom SE, Turner JA, Romano JM. Validity of the Sickness Impact Profile Roland scale as a measure of dysfunction in chronic pain patients. Pain. 1992;50(2):157-162. doi:10.1016/0304-3959(92)90156-6
15. Hylands-White N, Duarte RV, Raphael JH. An overview of treatment approaches for chronic pain management. Rheumatol Int. 2017;37(1):29-42. doi:10.1007/s00296-016-3481-8
16. Bujak BK, Regan E, Beattie PF, Harrington S. The effectiveness of interdisciplinary intensive outpatient programs in a population with diverse chronic pain conditions: a systematic review and meta-analysis. Pain Manag. 2019;9(4):417-429. doi:10.2217/pmt-2018-0087
17. Guzmán J, Esmail R, Karjalainen K, Malmivaara A, Irvin E, Bombardier C. Multidisciplinary bio-psycho-social rehabilitation for chronic low back pain. Cochrane Database Syst Rev. 2002;(1):CD000963. doi:10.1002/14651858.CD000963
18. Wilson IR. Management of chronic pain through pain management programmes. Br Med Bull. 2017;124(1):55-64. doi:10.1093/bmb/ldx032
Elective Total Hip Arthroplasty: Which Surgical Approach Is Optimal?
Total hip arthroplasty (THA) is one of the most successful orthopedic interventions performed today in terms of pain relief, cost effectiveness, and clinical outcomes.1 As a definitive treatment for end-stage arthritis of the hip, more than 330,000 procedures are performed in the Unites States each year. The number performed is growing by > 5% per year and is predicted to double by 2030, partly due to patients living longer, older individuals seeking a higher level of functionality than did previous generations, and better access to health care.2,3
The THA procedure also has become increasingly common in a younger population for posttraumatic fractures and conditions that lead to early-onset secondary arthritis, such as avascular necrosis, juvenile rheumatoid arthritis, hip dysplasia, Perthes disease, and femoroacetabular impingement.4 Younger patients are more likely to need a revision. According to a study by Evans and colleagues using available arthroplasty registry data, about three-quarters of hip replacements last 15 to 20 years, and 58% of hip replacements last 25 years in patients with osteoarthritis.5
For decades, the THA procedure of choice has been a standard posterior approach (PA). The PA was used because it allowed excellent intraoperative exposure and was applicable to a wide range of hip problems.6 In the past several years, modified muscle-sparing surgical approaches have been introduced. Two performed frequently are the mini PA (MPA) and the direct anterior approach (DAA).
The MPA is a modification of the PA. Surgeons perform the THA through a small incision without cutting the abductor muscles that are critical to hip stability and gait. A study published in 2010 concluded that the MPA was associated with less pain, shorter hospital length of stay (LOS) (therefore, an economic saving), and an earlier return to walking postoperatively.7
The DAA has been around since the early days of THA. Carl Hueter first described the anterior approach to the hip in 1881 (referred to as the Hueter approach). Smith-Peterson is frequently credited with popularizing the DAA technique during his career after publishing his first description of the approach in 1917.8 About 10 years ago, the DAA showed a resurgence as another muscle-sparing alternative for THAs. The DAA is considered to be a true intermuscular approach that preserves the soft tissues around the hip joint, thereby preserving the stability of the joint.9-11 The optimal surgical approach is still the subject of debate.
We present a male with right hip end-stage degenerative joint disease (DJD) and review some medical literature. Although other approaches to THA can be used (lateral, anterolateral), the discussion focuses on 2 muscle-sparing approaches performed frequently, the MPA and the DAA, and can be of value to primary care practitioners in their discussion with patients.
Case Presentation
A 61-year-old male patient presented with progressive right hip pain. At age 37, he had a left THA via a PA due to hip dysplasia and a revision on the same hip at age 55 (the polyethylene liner was replaced and the cobalt chromium head was changed to ceramic), again through a PA. An orthopedic clinical evaluation and X-rays confirmed end-stage DJD of the right hip (Figure). He was informed to return to plan an elective THA when the “bad days were significantly greater than the good days” and/or when his functionality or quality of life was unacceptable. The orthopedic surgeon favored an MPA but offered a hand-off to colleagues who preferred the DAA. The patient was given information to review.
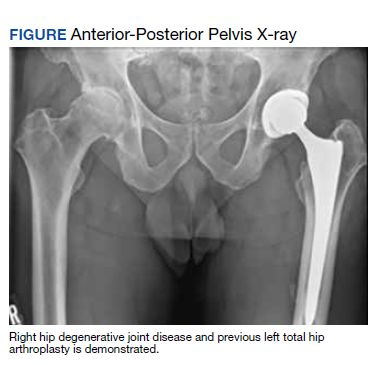
Discussion
No matter which approach is used, one study concluded that surgeons who perform > 50 hip replacements each year have better overall outcomes.12
The MPA emerged in the past decade as a muscle-sparing modification of the PA. The incision length (< 10 cm) is the simplest way of categorizing the surgery as an MPA. However, the amount of deep surgical dissection is a more important consideration for sparing muscle (for improved postoperative functionality, recovery, and joint stability) due to the gluteus maximus insertion, the quadratus femoris, and the piriformis tendons being left intact.13-16
Multiple studies have directly compared the MPA and PA, with variable results. One study concluded that the MPA was associated with lower surgical blood loss, lower pain at rest, and a faster recovery compared with that of the PA. Still, the study found no significant difference in postoperative laboratory values of possible markers of increased tissue damage and surgical invasiveness, such as creatinine phosphokinase (CPK) levels.15 Another randomized controlled trial (RCT) of 100 patients concluded that there was a trend for improved walking times and patient satisfaction at 6 weeks post-MPA vs PA.16 Other studies have found that the MPA and PA were essentially equivalent to each other regarding operative time, early postoperative outcomes, transfusion rate, hospital LOS, and postoperative complications.14 However, a recent meta-analysis found positive trends in favor of the MPA. The MPA was associated with a slight decrease in operating time, blood loss, hospital LOS, and earlier improvement in Harris hip scores. The meta-analysis found no significant decrease in the rate of dislocation or femoral fracture.13 Studies are still needed to evaluate long-term implant survival and outcomes for MPA and PA.
The DAA has received renewed attention as surgeons seek minimally invasive techniques and more rapid recoveries.6 The DAA involves a 3- to 4-inch incision on the front of the hip and enters the hip joint through the intermuscular interval between the tensor fasciae latae and gluteus medius muscles laterally and the sartorius muscle and rectus fascia medially.9 The DAA is considered a true intermuscular approach that preserves the soft tissues around the hip joint (including the posterior capsule), thereby presumably preserving the stability of the joint.9 The popularity for this approach has been attributed primarily to claims of improved recovery times, lower pain levels, improved patient satisfaction, as well as improved accuracy on both implant placement/alignment and leg length restoration.17 Orthopedic surgeons are increasingly being trained in the DAA during their residency and fellowship training.
There are many potential disadvantages to DAA. For example, DAA may present intraoperative radiation exposure for patients and surgeons during a fluoroscopy-assisted procedure. In addition, neuropraxia, particularly to the lateral femoral cutaneous nerve, can cause transient or permanent meralgia paresthetica. Wound healing may also present problems for female and obese patients, particularly those with a body mass index > 39 who are at increased risk of wound complications. DAA also increases time under anesthesia. Patients may experience proximal femoral fractures and dislocations and complex/challenging femoral exposure and bone preparation. Finally, sagittal malalignment of the stem could lead to loosening and an increased need for revision surgery.18
Another disadvantage of the DAA compared with the PA and MPA is the steep learning curve. Most studies find that the complication rate decreases only when the surgeon performs a significant number of DAA procedures. DeSteiger and colleagues noted a learning curve of 50 to 100 cases needed, and Masonis and colleagues concluded that at least 100 cases needed to be done to decrease operating and fluoroscopy times.19,20 Many orthopedic surgeons perform < 25 THA procedures a year.21
With the recent surge in popularity of the DAA, several studies have evaluated the DAA vs the MPA. A prospective RCT of 54 patients comparing the 2 approaches found that DAA patients walked without assistive devices sooner than did MPA patients: 22 days for DAA and 28 days for MPA.22 Improved cup position and a faster return of functionality were found in another study. DAA patients transitioned to a cane at 12 days vs 15.5 days for MPA patients and had a negative Trendelenburg sign at 16.7 days vs 24.8 days for MPA patients.23
Comparing DAA and MPA for inflammatory markers (serum CPK, C-reactive protein, interleukin-6, interleukin-1 β and tumor necrosis factor-α), the level of CPK postoperatively was 5.5 times higher in MPA patients, consistent with significantly more muscle damage. However, the overall physiologic burden as demonstrated by the measurement of all inflammatory markers was similar between the MPA and the DAA. This suggests that the inflammatory cascade associated with THA may be influenced more by the osteotomy and prosthesis implantation than by the surgical approach.24
Of note, some surgeons who perform the DAA recommend fewer postoperative precautions and suggest that physical therapy may not be necessary after discharge.25,26 Nevertheless, physiotherapeutic rehabilitation after all THA surgery is recommended as the standard treatment to minimize postoperative complications, such as hip dislocation, wound infection, deep venous thrombosis, and pulmonary embolism, and to maximize the patient’s functionality.27-29 RCTs are needed to look at long-term data on clinical outcomes between the MPA and DAA. Dislocation is a risk regardless of the approach used. Nevertheless, rates of dislocation, in general, are now very low, given the use of larger femoral head implants for all approaches.
Conclusions
THA is one of the most successful surgical procedures performed today. Patients desire hip pain relief and a return to function with as little interruption in their life as possible. Additionally, health care systems and insurers require THA procedures to be as efficient and cost-effective as possible. The debate regarding the most effective or preferable approach for THA continues. Although some prospective RCTs found that patients who underwent the DAA had objectively faster recovery than patients who had the MPA, it is also acknowledged that the results were dependent on surgeons who are very skilled in performing DAAs. The hope of both approaches is to get the individual moving as quickly and safely as possible to avoid a cascade of deterioration in the postoperative period. Factors other than the surgical approach, including patient selection, surgical volume and experience, careful preoperative assessments, attentive pain management, and rapid rehabilitation protocols, may be just as important as to which procedure is performed.30 The final decision should still be dependent on the patient-surgeon relationship and informed decision making.
In this case, the patient reviewed all the information he was given and independently researched the 2 procedures over many months. Ultimately, he decided to undergo a right THA via the DAA.
1. Elmallah RK, Chughtai M, Khlopas A. et al. Determining cost-effectiveness of total hip and knee arthroplasty using the Short Form-6D utility measure. J Arthroplasty. 2017;32(2):351-354. doi:10.1016/j.arth.2016.08.006
2. Kurtz SM, Ong KL, Lau E, Bozic KJ. Impact of the economic downturn on total joint replacement demand in the United States: updated projections to 2021. J Bone Joint Surg Am. 2014;96(8):624-630. doi:10.2106/JBJS.M.00285
3. Kurtz, S, Ong KL, Lau E, Mowat F, Halpern M. Projections of primary and revision hip and knee arthroplasty in the United States from 2005 to 2030. J Bone Joint Surg Am. 2007;89(4):780-785. doi:10.2106/JBJS.F.00222
4. Sheahan WT, Parvataneni HK. Asymptomatic but time for a hip revision. Fed Pract. 2016;33(2):39-43.
5. Evans, JT, Evans JP, Walker RW, et al. How long does a hip replacement last? A systematic review and meta-analysis of case series and national registry reports with more than 15 years of follow-up. Lancet. 2019;393(10172):647-654. doi:10.1016/S0140-6736(18)31665-9
6. Yang X, Huang H-F, Sun L , Yang Z, Deng C-Y, Tian XB. Direct anterior approach versus posterolateral approach in total hip arthroplasty: a systematic review and meta-analysis of randomized controlled studies. Orthop Surg. 2020;12:1065-1073. doi:10.1111/os.12669
7. Varela Egocheaga JR, Suárez-Suárez MA, Fernández-Villán M, González-Sastre V, Varela-Gómez JR, Murcia-Mazón A. Minimally invasive posterior approach in total hip arthroplasty. Prospective randomized trial. An Sist Sanit Navar. 2010:33(2):133-143. doi:10.4321/s1137-66272010000300002
8. Raxhbauer F, Kain MS, Leunig M. The history of the anterior approach to the hip. Orthop Clin North Am. 2009;40(3):311-320. doi:10.1016/j.ocl.2009.02.007
9. Jia F, Guo B, Xu F, Hou Y, Tang X, Huang L. A comparison of clinical, radiographic and surgical outcomes of total hip arthroplasty between direct anterior and posterior approaches: a systematic review and meta-analysis. Hip Int. 2019;29(6):584-596. doi:10.1177/1120700018820652
10. Kennon RE Keggi JM, Wetmore RS, Zatorski LE, Huo MH, Keggi KJ. Total hip arthroplasty through a minimally invasive anterior surgical approach. J Bone Joint Surg Am. 2003;85-A(suppl 4):39-48. doi:10.2106/00004623-200300004-00005
11. Bal BS, Vallurupalli S. Minimally invasive total hip arthroplasty with the anterior approach. Indian J Orthop. 2008;42(3):301-308. doi:10.4103/0019-5413.41853
12. Katz JN, Losina E, Barrett E. Association between hospital and surgeon procedure volume and outcomes of total hip replacement in the United States Medicare population. J Bone Joint Surg Am. 2001;83(11):1622-1629. doi:10.2106/00004623-200111000-00002
13. Berstock JR, Blom AW, Beswick AD. A systematic review and meta-analysis of the standard versus mini-incision approach to a total hip arthroplasty. J Arthroplasty. 2014;29(10):1970-1982. doi:10.1016/j.arth.2014.05.021
14. Chimento GF, Pavone V, Sharrock S, Kahn K, Cahill J, Sculco TP. Minimally invasive total hip arthroplasty: a prospective randomized study. J Arthroplasty. 2005;20(2):139-144. doi:10.1016/j.arth.2004.09.061
15. Fink B, Mittelstaedt A, Schulz MS, Sebena P, Sing J. Comparison of a minimally invasive posterior approach and the standard posterior approach for total hip arthroplasty. A prospective and comparative study. J Orthop Surg Res. 2010;5:46. doi:10.1186/1749-799X-5-46
16. Khan RJ, Maor D, Hofmann M, Haebich S. A comparison of a less invasive piriformis-sparing approach versus the standard approach to the hip: a randomized controlled trial. J Bone Joint Surg Br. 2012;94:43-50. doi:10.1302/0301-620X.94B1.27001
17. Galakatos GR. Direct anterior total hip arthroplasty. Missouri Med. 2018;115(6):537-541.
18. Flevas, DA, Tsantes AG, Mavrogenis, AE. Direct anterior approach total hip arthroplasty revisited. JBJS Rev. 2020;8(4):e0144. doi:10.2106/JBJS.RVW.19.00144
19. DeSteiger RN, Lorimer M, Solomon M. What is the learning curve for the anterior approach for total hip arthroplasty? Clin Orthop Relat Res. 2015;473(12):3860-3866. doi:10.1007/s11999-015-4565-6
20. Masonis J, Thompson C, Odum S. Safe and accurate: learning the direct anterior total hip arthroplasty. Orthopedics. 2008;31(12)(suppl 2).
21. Bal BS. Clinical faceoff: anterior total hip versus mini-posterior: Which one is better? Clin Orthop Relat Res. 2015;473(4):1192-1196. doi:10.1007/s11999-014-3684-9
22. Taunton MJ, Mason JB, Odum SM, Bryan D, Springer BD. Direct anterior total hip arthroplasty yields more rapid voluntary cessation of all walking aids: a prospective, randomized clinical trial. J Arthroplasty. 2014;29;(suppl 9):169-172. doi:10.1016/j.arth.2014.03.05
23. Nakata K, Nishikawa M, Yamamoto K, Hirota S, Yoshikawa H. A clinical comparative study of the direct anterior with mini-posterior approach: two consecutive series. J Arthroplasty. 2009;24(5):698-704. doi:10.1016/j.arth.2008.04.012
24. Bergin PF, Doppelt JD, Kephart CJ. Comparison of minimally invasive direct anterior versus posterior total hip arthroplasty based on inflammation and muscle damage markers. Bone Joint Surg Am. 2011; 93(15):1392-1398. doi:10.2106/JBJS.J.00557
25. Carli AV, Poitras S, Clohisy JC, Beaule PE. Variation in use of postoperative precautions and equipment following total hip arthroplasty: a survey of the AAHKS and CAS membership. J Arthroplasty. 2018;33(10):3201-3205. doi:10.1016/j.arth.2018.05.043
26. Kavcˇicˇ G, Mirt PK, Tumpej J, Bedenčič. The direct anterior approach for total hip arthroplasty without specific table: surgical approach and our seven years of experience. Published June 14, 2019. Accessed March 4, 2022. https://crimsonăpublishers.com/rabs/fulltext/RABS.000520.php27. American Academy of Orthopedic Surgeons. Total hip replacement exercise guide. Published 2017. Updated February 2022. Accessed March 4, 2022. https://orthoinfo.aaos.org/en/recovery/total-hip-replacement-exercise-guide
28. Medical Advisory Secretariat. Physiotherapy rehabilitation after total knee or hip replacement: an evidence-based analysis. Ont Health Technol Assess Ser. 2005;5(8):1-91.
29. Pa˘unescu F, Didilescu A, Antonescu DM. Factors that may influence the functional outcome after primary total hip arthroplasty. Clujul Med. 2013;86(2):121-127.
30. Poehling-Monaghan KL, Kamath AF, Taunton MJ, Pagnano MW. Direct anterior versus miniposterior THA with the same advanced perioperative protocols: surprising early clinical results. Clin Orthop Relat Res. 2015;473(2):623-631. doi:10.1007/s11999-014-3827-z
Total hip arthroplasty (THA) is one of the most successful orthopedic interventions performed today in terms of pain relief, cost effectiveness, and clinical outcomes.1 As a definitive treatment for end-stage arthritis of the hip, more than 330,000 procedures are performed in the Unites States each year. The number performed is growing by > 5% per year and is predicted to double by 2030, partly due to patients living longer, older individuals seeking a higher level of functionality than did previous generations, and better access to health care.2,3
The THA procedure also has become increasingly common in a younger population for posttraumatic fractures and conditions that lead to early-onset secondary arthritis, such as avascular necrosis, juvenile rheumatoid arthritis, hip dysplasia, Perthes disease, and femoroacetabular impingement.4 Younger patients are more likely to need a revision. According to a study by Evans and colleagues using available arthroplasty registry data, about three-quarters of hip replacements last 15 to 20 years, and 58% of hip replacements last 25 years in patients with osteoarthritis.5
For decades, the THA procedure of choice has been a standard posterior approach (PA). The PA was used because it allowed excellent intraoperative exposure and was applicable to a wide range of hip problems.6 In the past several years, modified muscle-sparing surgical approaches have been introduced. Two performed frequently are the mini PA (MPA) and the direct anterior approach (DAA).
The MPA is a modification of the PA. Surgeons perform the THA through a small incision without cutting the abductor muscles that are critical to hip stability and gait. A study published in 2010 concluded that the MPA was associated with less pain, shorter hospital length of stay (LOS) (therefore, an economic saving), and an earlier return to walking postoperatively.7
The DAA has been around since the early days of THA. Carl Hueter first described the anterior approach to the hip in 1881 (referred to as the Hueter approach). Smith-Peterson is frequently credited with popularizing the DAA technique during his career after publishing his first description of the approach in 1917.8 About 10 years ago, the DAA showed a resurgence as another muscle-sparing alternative for THAs. The DAA is considered to be a true intermuscular approach that preserves the soft tissues around the hip joint, thereby preserving the stability of the joint.9-11 The optimal surgical approach is still the subject of debate.
We present a male with right hip end-stage degenerative joint disease (DJD) and review some medical literature. Although other approaches to THA can be used (lateral, anterolateral), the discussion focuses on 2 muscle-sparing approaches performed frequently, the MPA and the DAA, and can be of value to primary care practitioners in their discussion with patients.
Case Presentation
A 61-year-old male patient presented with progressive right hip pain. At age 37, he had a left THA via a PA due to hip dysplasia and a revision on the same hip at age 55 (the polyethylene liner was replaced and the cobalt chromium head was changed to ceramic), again through a PA. An orthopedic clinical evaluation and X-rays confirmed end-stage DJD of the right hip (Figure). He was informed to return to plan an elective THA when the “bad days were significantly greater than the good days” and/or when his functionality or quality of life was unacceptable. The orthopedic surgeon favored an MPA but offered a hand-off to colleagues who preferred the DAA. The patient was given information to review.
Discussion
No matter which approach is used, one study concluded that surgeons who perform > 50 hip replacements each year have better overall outcomes.12
The MPA emerged in the past decade as a muscle-sparing modification of the PA. The incision length (< 10 cm) is the simplest way of categorizing the surgery as an MPA. However, the amount of deep surgical dissection is a more important consideration for sparing muscle (for improved postoperative functionality, recovery, and joint stability) due to the gluteus maximus insertion, the quadratus femoris, and the piriformis tendons being left intact.13-16
Multiple studies have directly compared the MPA and PA, with variable results. One study concluded that the MPA was associated with lower surgical blood loss, lower pain at rest, and a faster recovery compared with that of the PA. Still, the study found no significant difference in postoperative laboratory values of possible markers of increased tissue damage and surgical invasiveness, such as creatinine phosphokinase (CPK) levels.15 Another randomized controlled trial (RCT) of 100 patients concluded that there was a trend for improved walking times and patient satisfaction at 6 weeks post-MPA vs PA.16 Other studies have found that the MPA and PA were essentially equivalent to each other regarding operative time, early postoperative outcomes, transfusion rate, hospital LOS, and postoperative complications.14 However, a recent meta-analysis found positive trends in favor of the MPA. The MPA was associated with a slight decrease in operating time, blood loss, hospital LOS, and earlier improvement in Harris hip scores. The meta-analysis found no significant decrease in the rate of dislocation or femoral fracture.13 Studies are still needed to evaluate long-term implant survival and outcomes for MPA and PA.
The DAA has received renewed attention as surgeons seek minimally invasive techniques and more rapid recoveries.6 The DAA involves a 3- to 4-inch incision on the front of the hip and enters the hip joint through the intermuscular interval between the tensor fasciae latae and gluteus medius muscles laterally and the sartorius muscle and rectus fascia medially.9 The DAA is considered a true intermuscular approach that preserves the soft tissues around the hip joint (including the posterior capsule), thereby presumably preserving the stability of the joint.9 The popularity for this approach has been attributed primarily to claims of improved recovery times, lower pain levels, improved patient satisfaction, as well as improved accuracy on both implant placement/alignment and leg length restoration.17 Orthopedic surgeons are increasingly being trained in the DAA during their residency and fellowship training.
There are many potential disadvantages to DAA. For example, DAA may present intraoperative radiation exposure for patients and surgeons during a fluoroscopy-assisted procedure. In addition, neuropraxia, particularly to the lateral femoral cutaneous nerve, can cause transient or permanent meralgia paresthetica. Wound healing may also present problems for female and obese patients, particularly those with a body mass index > 39 who are at increased risk of wound complications. DAA also increases time under anesthesia. Patients may experience proximal femoral fractures and dislocations and complex/challenging femoral exposure and bone preparation. Finally, sagittal malalignment of the stem could lead to loosening and an increased need for revision surgery.18
Another disadvantage of the DAA compared with the PA and MPA is the steep learning curve. Most studies find that the complication rate decreases only when the surgeon performs a significant number of DAA procedures. DeSteiger and colleagues noted a learning curve of 50 to 100 cases needed, and Masonis and colleagues concluded that at least 100 cases needed to be done to decrease operating and fluoroscopy times.19,20 Many orthopedic surgeons perform < 25 THA procedures a year.21
With the recent surge in popularity of the DAA, several studies have evaluated the DAA vs the MPA. A prospective RCT of 54 patients comparing the 2 approaches found that DAA patients walked without assistive devices sooner than did MPA patients: 22 days for DAA and 28 days for MPA.22 Improved cup position and a faster return of functionality were found in another study. DAA patients transitioned to a cane at 12 days vs 15.5 days for MPA patients and had a negative Trendelenburg sign at 16.7 days vs 24.8 days for MPA patients.23
Comparing DAA and MPA for inflammatory markers (serum CPK, C-reactive protein, interleukin-6, interleukin-1 β and tumor necrosis factor-α), the level of CPK postoperatively was 5.5 times higher in MPA patients, consistent with significantly more muscle damage. However, the overall physiologic burden as demonstrated by the measurement of all inflammatory markers was similar between the MPA and the DAA. This suggests that the inflammatory cascade associated with THA may be influenced more by the osteotomy and prosthesis implantation than by the surgical approach.24
Of note, some surgeons who perform the DAA recommend fewer postoperative precautions and suggest that physical therapy may not be necessary after discharge.25,26 Nevertheless, physiotherapeutic rehabilitation after all THA surgery is recommended as the standard treatment to minimize postoperative complications, such as hip dislocation, wound infection, deep venous thrombosis, and pulmonary embolism, and to maximize the patient’s functionality.27-29 RCTs are needed to look at long-term data on clinical outcomes between the MPA and DAA. Dislocation is a risk regardless of the approach used. Nevertheless, rates of dislocation, in general, are now very low, given the use of larger femoral head implants for all approaches.
Conclusions
THA is one of the most successful surgical procedures performed today. Patients desire hip pain relief and a return to function with as little interruption in their life as possible. Additionally, health care systems and insurers require THA procedures to be as efficient and cost-effective as possible. The debate regarding the most effective or preferable approach for THA continues. Although some prospective RCTs found that patients who underwent the DAA had objectively faster recovery than patients who had the MPA, it is also acknowledged that the results were dependent on surgeons who are very skilled in performing DAAs. The hope of both approaches is to get the individual moving as quickly and safely as possible to avoid a cascade of deterioration in the postoperative period. Factors other than the surgical approach, including patient selection, surgical volume and experience, careful preoperative assessments, attentive pain management, and rapid rehabilitation protocols, may be just as important as to which procedure is performed.30 The final decision should still be dependent on the patient-surgeon relationship and informed decision making.
In this case, the patient reviewed all the information he was given and independently researched the 2 procedures over many months. Ultimately, he decided to undergo a right THA via the DAA.
1. Elmallah RK, Chughtai M, Khlopas A. et al. Determining cost-effectiveness of total hip and knee arthroplasty using the Short Form-6D utility measure. J Arthroplasty. 2017;32(2):351-354. doi:10.1016/j.arth.2016.08.006
2. Kurtz SM, Ong KL, Lau E, Bozic KJ. Impact of the economic downturn on total joint replacement demand in the United States: updated projections to 2021. J Bone Joint Surg Am. 2014;96(8):624-630. doi:10.2106/JBJS.M.00285
3. Kurtz, S, Ong KL, Lau E, Mowat F, Halpern M. Projections of primary and revision hip and knee arthroplasty in the United States from 2005 to 2030. J Bone Joint Surg Am. 2007;89(4):780-785. doi:10.2106/JBJS.F.00222
4. Sheahan WT, Parvataneni HK. Asymptomatic but time for a hip revision. Fed Pract. 2016;33(2):39-43.
5. Evans, JT, Evans JP, Walker RW, et al. How long does a hip replacement last? A systematic review and meta-analysis of case series and national registry reports with more than 15 years of follow-up. Lancet. 2019;393(10172):647-654. doi:10.1016/S0140-6736(18)31665-9
6. Yang X, Huang H-F, Sun L , Yang Z, Deng C-Y, Tian XB. Direct anterior approach versus posterolateral approach in total hip arthroplasty: a systematic review and meta-analysis of randomized controlled studies. Orthop Surg. 2020;12:1065-1073. doi:10.1111/os.12669
7. Varela Egocheaga JR, Suárez-Suárez MA, Fernández-Villán M, González-Sastre V, Varela-Gómez JR, Murcia-Mazón A. Minimally invasive posterior approach in total hip arthroplasty. Prospective randomized trial. An Sist Sanit Navar. 2010:33(2):133-143. doi:10.4321/s1137-66272010000300002
8. Raxhbauer F, Kain MS, Leunig M. The history of the anterior approach to the hip. Orthop Clin North Am. 2009;40(3):311-320. doi:10.1016/j.ocl.2009.02.007
9. Jia F, Guo B, Xu F, Hou Y, Tang X, Huang L. A comparison of clinical, radiographic and surgical outcomes of total hip arthroplasty between direct anterior and posterior approaches: a systematic review and meta-analysis. Hip Int. 2019;29(6):584-596. doi:10.1177/1120700018820652
10. Kennon RE Keggi JM, Wetmore RS, Zatorski LE, Huo MH, Keggi KJ. Total hip arthroplasty through a minimally invasive anterior surgical approach. J Bone Joint Surg Am. 2003;85-A(suppl 4):39-48. doi:10.2106/00004623-200300004-00005
11. Bal BS, Vallurupalli S. Minimally invasive total hip arthroplasty with the anterior approach. Indian J Orthop. 2008;42(3):301-308. doi:10.4103/0019-5413.41853
12. Katz JN, Losina E, Barrett E. Association between hospital and surgeon procedure volume and outcomes of total hip replacement in the United States Medicare population. J Bone Joint Surg Am. 2001;83(11):1622-1629. doi:10.2106/00004623-200111000-00002
13. Berstock JR, Blom AW, Beswick AD. A systematic review and meta-analysis of the standard versus mini-incision approach to a total hip arthroplasty. J Arthroplasty. 2014;29(10):1970-1982. doi:10.1016/j.arth.2014.05.021
14. Chimento GF, Pavone V, Sharrock S, Kahn K, Cahill J, Sculco TP. Minimally invasive total hip arthroplasty: a prospective randomized study. J Arthroplasty. 2005;20(2):139-144. doi:10.1016/j.arth.2004.09.061
15. Fink B, Mittelstaedt A, Schulz MS, Sebena P, Sing J. Comparison of a minimally invasive posterior approach and the standard posterior approach for total hip arthroplasty. A prospective and comparative study. J Orthop Surg Res. 2010;5:46. doi:10.1186/1749-799X-5-46
16. Khan RJ, Maor D, Hofmann M, Haebich S. A comparison of a less invasive piriformis-sparing approach versus the standard approach to the hip: a randomized controlled trial. J Bone Joint Surg Br. 2012;94:43-50. doi:10.1302/0301-620X.94B1.27001
17. Galakatos GR. Direct anterior total hip arthroplasty. Missouri Med. 2018;115(6):537-541.
18. Flevas, DA, Tsantes AG, Mavrogenis, AE. Direct anterior approach total hip arthroplasty revisited. JBJS Rev. 2020;8(4):e0144. doi:10.2106/JBJS.RVW.19.00144
19. DeSteiger RN, Lorimer M, Solomon M. What is the learning curve for the anterior approach for total hip arthroplasty? Clin Orthop Relat Res. 2015;473(12):3860-3866. doi:10.1007/s11999-015-4565-6
20. Masonis J, Thompson C, Odum S. Safe and accurate: learning the direct anterior total hip arthroplasty. Orthopedics. 2008;31(12)(suppl 2).
21. Bal BS. Clinical faceoff: anterior total hip versus mini-posterior: Which one is better? Clin Orthop Relat Res. 2015;473(4):1192-1196. doi:10.1007/s11999-014-3684-9
22. Taunton MJ, Mason JB, Odum SM, Bryan D, Springer BD. Direct anterior total hip arthroplasty yields more rapid voluntary cessation of all walking aids: a prospective, randomized clinical trial. J Arthroplasty. 2014;29;(suppl 9):169-172. doi:10.1016/j.arth.2014.03.05
23. Nakata K, Nishikawa M, Yamamoto K, Hirota S, Yoshikawa H. A clinical comparative study of the direct anterior with mini-posterior approach: two consecutive series. J Arthroplasty. 2009;24(5):698-704. doi:10.1016/j.arth.2008.04.012
24. Bergin PF, Doppelt JD, Kephart CJ. Comparison of minimally invasive direct anterior versus posterior total hip arthroplasty based on inflammation and muscle damage markers. Bone Joint Surg Am. 2011; 93(15):1392-1398. doi:10.2106/JBJS.J.00557
25. Carli AV, Poitras S, Clohisy JC, Beaule PE. Variation in use of postoperative precautions and equipment following total hip arthroplasty: a survey of the AAHKS and CAS membership. J Arthroplasty. 2018;33(10):3201-3205. doi:10.1016/j.arth.2018.05.043
26. Kavcˇicˇ G, Mirt PK, Tumpej J, Bedenčič. The direct anterior approach for total hip arthroplasty without specific table: surgical approach and our seven years of experience. Published June 14, 2019. Accessed March 4, 2022. https://crimsonăpublishers.com/rabs/fulltext/RABS.000520.php27. American Academy of Orthopedic Surgeons. Total hip replacement exercise guide. Published 2017. Updated February 2022. Accessed March 4, 2022. https://orthoinfo.aaos.org/en/recovery/total-hip-replacement-exercise-guide
28. Medical Advisory Secretariat. Physiotherapy rehabilitation after total knee or hip replacement: an evidence-based analysis. Ont Health Technol Assess Ser. 2005;5(8):1-91.
29. Pa˘unescu F, Didilescu A, Antonescu DM. Factors that may influence the functional outcome after primary total hip arthroplasty. Clujul Med. 2013;86(2):121-127.
30. Poehling-Monaghan KL, Kamath AF, Taunton MJ, Pagnano MW. Direct anterior versus miniposterior THA with the same advanced perioperative protocols: surprising early clinical results. Clin Orthop Relat Res. 2015;473(2):623-631. doi:10.1007/s11999-014-3827-z
Neutropenia and Leukopenia After Cross Taper From Quetiapine to Divalproex for the Treatment of Borderline Personality Disorder
Valproic acid (VPA) and its derivative, divalproex (DVP) are prescribed for a variety of indications, commonly for seizure control in patients with epilepsy, mood stabilization in patients with bipolar disorder, and migraine prophylaxis. Gastrointestinal distress and sedation are among the most reported adverse effects (AEs) with DVP therapy.1 Although serious hepatic and hematologic AEs are rare, monitoring is still recommended. DVP can cause various hematologic dyscrasias, the most common being thrombocytopenia.1,2 Neutropenia and leukopenia have been reported in isolated cases, most occurring in pediatric patients or patients with epilepsy.3-14
Several case reports of DVP-related neutropenia (absolute neutrophil count [ANC] < 1.50 103/mcL) and leukopenia (white blood cell count [WBC] < 4.0 103/mcL) were reviewed during our literature search, some caused by DVP monotherapy; others were thought to be related to concomitant use of DVP and another drug.15-25 Quetiapine was the antipsychotic most commonly implicated in causing hematologic abnormalities when combined with DVP. We report a case of neutropenia and leukopenia that presented after a cross taper from quetiapine to DVP for the treatment of borderline personality disorder (BPD).
Although no medications have been approved by the US Food and Drug Administration (FDA) for the treatment of BPD, mood stabilizers, including DVP, have literature to support their use for the treatment of affective dysregulation and impulsive behavioral dyscontrol.26-28 A therapeutic range for DVP in the treatment of BPD has not been defined; therefore, for this case report, the generally accepted range of 50 to 100 µg/mL will be considered therapeutic.1
Case Presentation
A 34-year-old male patient presented to the mental health clinic pharmacist reporting that his current psychotropic medication regimen was not effective. His medical history included posttraumatic stress disorder (PTSD), opioid use disorder, alcohol use disorder, stimulant use disorder, cannabis use, BPD, hypertension, hyperlipidemia, prediabetes, gastroesophageal reflex disease, and a pulmonary nodule. On initial presentation, the patient was prescribed buprenorphine 24 mg/naloxone 6 mg, quetiapine 400 mg, duloxetine 120 mg, and prazosin 15 mg per day. At the time of pharmacy consultation, last reported alcohol or nonprescribed opioid use was about 6 months prior, and methamphetamine use about 1 month prior, with ongoing cannabis use. The patient had a history of participating in cognitive processing therapy, dialectical behavior therapy (DBT), and residential treatment for both PTSD and substance use. Additionally, he was actively participating in contingency management for stimulant use disorder and self-management and recovery training group.
The patient reported ongoing mood lability, hypervigilance, and oversedation with current psychotropic regimen. The prescriber of his medication for opioid use disorder also reported the patient experienced labile mood, impulsive behavior, and anger outbursts. In the setting of intolerability due to oversedation with quetiapine, cardiometabolic risk, and lack of clear indication for use, the patient and health care practitioner (HCP) agreed to taper quetiapine and initiate a trial of DVP for affective dysregulation and impulsive-behavioral dyscontrol. To prevent cholinergic rebound and insomnia with abrupt discontinuation of quetiapine, DVP and quetiapine were cross tapered. The following cross taper was prescribed: quetiapine 300 mg and DVP 500 mg per day for week 1; quetiapine 200 mg and DVP 500 mg per day for week 2; quetiapine 100 mg and DVP 1000 mg per day for week 3; quetiapine 50 mg and DVP 1000 mg per day for week 4; followed by DVP 1000 mg per day and discontinuation of quetiapine.
During a 4-week follow-up appointment, the patient reported appropriate completion of cross taper but stopped taking the DVP 3 days prior to the appointment due to self-reported lack of efficacy. For this reason, serum VPA level was not obtained. After discussion with his HCP, the patient restarted DVP 1000 mg per day without retitration with plans to get laboratory tests in 1 week. The next week, laboratory tests were notable for VPA level 28.74 (reference range, 50-100) µg/mL, low WBC 3.51 (reference range, 4.00-10.00) 103/mcL, platelets 169 (reference range, 150-420) 103/mcL, and low ANC 1.00 (reference range, 1.50-7.40) 103/mcL (Table). This raised clinical concern as the patient had no history of documented neutropenia or leukopenia, with most recent complete blood count (CBC) prior to DVP initiation 3 months earlier while prescribed quetiapine.
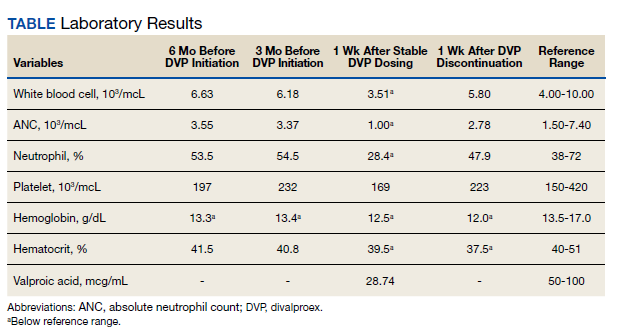
On further review, the HCP opted to cease administration of DVP and repeat CBC with differential in 1 week. Nine days later, laboratory tests were performed and compared with those collected the week before, revealing resolution of neutropenia and leukopenia. A score of 7 on the Naranjo Adverse Drug Reaction Probability Scale (NADRPS) was determined based on previous conclusive reports on the reaction (+1), appeared after suspected drug administration (+2), improved with drug discontinuation (+1), confirmed by objective evidence (+1), and no alternative causes could be found (+2).29 With a NADRPS score of 7, an AE of probable DVP-induced neutropenia was documented and medication was not resumed.
Discussion
Our case report describes isolated neutropenia and leukopenia that developed after a cross taper from quetiapine to DVP. Hematologic abnormalities resolved after discontinuation of DVP, suggesting a likely correlation. DVP has a well-established, dose-related prevalence of thrombocytopenia occurring in up to 27% of patients.1 Fewer case reports exist on neutropenia and leukopenia. DVP-induced neutropenia is thought to be a result of direct bone marrow suppression, whereas the more commonly occurring blood dyscrasia, thrombocytopenia, is thought to be caused by an antibody-mediated destruction of platelets.6
Management of DVP-induced thrombocytopenia is often dependent on the severity of the reaction. In mild-to-moderate cases, intervention may not be necessary as thrombocytopenia has been shown to resolve without adjustment to DVP therapy.1 In more severe or symptomatic cases, dose reduction or discontinuation of the offending agent is recommended, typically resulting in resolution shortly following pharmacologic intervention.
Guidance on the management of other drug-induced hematologic abnormalities, such as neutropenia and leukopenia are not as well established. A 2019 systematic review of idiosyncratic drug-induced neutropenia suggested that continuing the offending drug with strict monitoring could be considered in cases of mild neutropenia. In cases of moderate neutropenia, the author suggests temporary cessation of the drug and reinstatement once neutrophil count normalizes and definitive cessation of the drug in severe cases.30
In our case, continuing the offending agent with close monitoring was considered, similar to the well-established management of clozapine-induced neutropenia. However, due to the concern that the ANC was bordering moderate neutropenia in the absence of a therapeutic VPA level as well as a significant reduction in platelets, although not meeting criteria for thrombocytopenia, the decision was made to err on the side of caution and discontinue the most likely offending agent.
It is important to highlight that DVP was replacing quetiapine in the form of a cross taper. Quetiapine is structurally similar to clozapine. While clozapine has strict monitoring requirements related to neutropenia, blood dyscrasias with quetiapine therapy are rare. Quetiapine-induced hematologic abnormalities may be due to direct toxicity or to an immune-mediated mechanism, leading to bone marrow suppression.20 Case reports documenting blood dyscrasias with the combination of DVP and quetiapine were identified during literature review.15-19 Despite these case reports, we believe DVP was the primary offending agent in our case as the patient’s last dose of quetiapine was 2 weeks before obtaining the abnormal CBC. There was no history of blood dyscrasias with quetiapine monotherapy; however, the effect of the combination of DVP and quetiapine is unknown as no CBC was obtained during the cross-taper period.
Although there are no FDA-approved medications for the treatment of BPD, mood stabilizers, including DVP, have some research to support their use for the treatment of affective dysregulation and impulsive-behavioral dyscontrol.26-28 In our case, DVP was selected due to the evidence for use in BPD and ability to assess adherence with therapeutic monitoring. Although polypharmacy is a concern in patients with BPD, in our case we believed that the patient’s ongoing mood lability and impulsive behaviors warranted pharmacologic intervention. Additionally, DVP provided an advantage in its ability to quickly titrate to therapeutic dose when compared with lamotrigine and a lower risk of cognitive AEs when compared with topiramate.
Conclusions
To our knowledge, this case report demonstrates the first published case of neutropenia and leukopenia related to DVP therapy for the treatment of BPD. Routine CBC monitoring is recommended with DVP therapy, and our case highlights the importance of evaluating for not only thrombocytopenia, but also other blood dyscrasias during the titration phase even in the absence of a therapeutic VPA level. Further studies are warranted to determine incidence of DVP-related neutropenia and leukopenia and to evaluate the safety of continuing DVP in cases of mild-to-moderate neutropenia with close monitoring.
1. Depakote (valproic acid). Package insert. Abbott Laboratories; June 2000.
2. Conley EL, Coley KC, Pollock BG, Dapos SV, Maxwell R, Branch RA. Prevalence and risk of thrombocytopenia with valproic acid: experience at a psychiatric teaching hospital. Pharmacotherapy. 2001;21(11):1325-1330. doi:10.1592/phco.21.17.1325.34418
3. Jaeken J, van Goethem C, Casaer P, Devlieger H, Eggermont E, Pilet M. Neutropenia during sodium valproate therapy. Arch Dis Child. 1979;54(12):986-987. doi:10.1136/adc.54.12.986
4. Barr RD, Copeland SA, Stockwell MC, Morris N, Kelton JC. Valproic acid and immune thrombocytopenia. Arch Dis Child. 1982;57(9):681-684. doi:10.1136/adc.57.9.681
5. Symon DNK, Russell G. Sodium valproate and neutropenia (letter). Arch Dis Child. 1983;58:235. doi:10.1136/adc.58.3.235
6. Watts RG, Emanuel PD, Zuckerman KS, Howard TH. Valproic acid-induced cytopenias: evidence for a dose-related suppression of hematopoiesis. J Pediatr. 1990;117(3):495-499. doi:10.1016/s0022-3476(05)81105-9
7. Blackburn SC, Oliart AD, García-Rodríguez LA, Pérez Gutthann S. Antiepileptics and blood dyscrasias: a cohort study. Pharmacotherapy. 1998;18(6):1277-1283.
8. Acharya S, Bussel JB. Hematologic toxicity of sodium valproate. J Pediatr Hematol Oncol. 2000;22(1):62-65. doi:10.1097/00043426-200001000-00012
9. Vesta KS, Medina PJ. Valproic acid-induced neutropenia. Ann Pharmacother. 2003;37(6):819-821. doi:10.1345/aph.1C381
10. Kohli U, Gulati, S. Sodium valproate induced isolated neutropenia. Indian J Pediatr. 2006;73(9):844-844. doi:10.1007/BF02790401
11. Hsu HC, Tseng HK, Wang SC, Wang YY. Valproic acid-induced agranulocytosis. Int J Gerontol. 2009;3(2):137-139. doi:10.1016/S1873-9598(09)70036-5
12. Chakraborty S, Chakraborty J, Mandal S, Ghosal MK. A rare occurrence of isolated neutropenia with valproic acid: a case report. J Indian Med Assoc. 2011;109(5):345-346.
13. Stoner SC, Deal E, Lurk JT. Delayed-onset neutropenia with divalproex sodium. Ann Pharmacother. 2008;42(10):1507-1510. doi:10.1345/aph.1L239
14. Storch DD. Severe leukopenia with valproate. J Am Acad Child Adolesc Psychiatry. 2000;39(10):1208-1209. doi:10.1097/00004583-200010000-00003
15. Rahman A, Mican LM, Fischer C, Campbell AH. Evaluating the incidence of leukopenia and neutropenia with valproate, quetiapine, or the combination in children and adolescents. Ann Pharmacother. 2009;43:822-830. doi:10.1345/aph.1L617
16. Hung WC, Hsieh MH. Neutropenia associated with the comedication of quetiapine and valproate in 2 elderly patients. J Clin Psychopharmacol. 2012;32(3):416-417. doi:10.1097/JCP.0b013e3182549d2d
17. Park HJ, Kim JY. Incidence of neutropenia with valproate and quetiapine combination treatment in subjects with acquired brain injuries. Arch Phys Med Rehabil. 2016;97(2):183-188. doi:10.1016/j.apmr.2015.09.004
18. Estabrook KR, Pheister M. A case of quetiapine XR and divalproex-associated neutropenia followed by successful use of ziprasidone. J Clin Psychopharmacol. 2012;32(3):417-418. doi:10.1097/JCP.0b013e318253a071
19. Nair P, Lippmann S. Is leukopenia associated with divalproex and/or quetiapine? Psychosomatics. 2005;46(2):188-189. doi:10.1176/appi.psy.46.2.188
20. Cowan C, Oakley C. Leukopenia and neutropenia induced by quetiapine. Prog Neuropsychopharmacol Biol Psychiatry. 2007;31(1):292-294. doi:10.1016/j.pnpbp.2006.07.003
21. Fan KY, Chen WY, Huang MC. Quetiapine-associated leucopenia and thrombocytopenia: a case report. BMC Psychiatry. 2015;15:110. doi:10.1186/s12888-015-0495-9
22. Malik S, Lally J, Ajnakina O, et al. Sodium valproate and clozapine induced neutropenia: A case control study using register data. Schizophr Res. 2018;195:267-273. doi:10.1016/j.schres.2017.08.041
23. Pantelis C, Adesanya A. Increased risk of neutropaenia and agranulocytosis with sodium valproate used adjunctively with clozapine. Aust N Z J Psychiatry. 2001;35(4):544-545. doi:10.1046/j.1440-1614.2001.0911f.x
24. Madeb R, Hirschmann S, Kurs R, Turkie A, Modai I. Combined clozapine and valproic acid treatment-induced agranulocytosis. Eur Psychiatry. 2002;17(4):238-239. doi:10.1016/s0924-9338(02)00659-4
25. Dose M, Hellweg R, Yassouridis A, Theison M, Emrich HM. Combined treatment of schizophrenic psychoses with haloperidol and valproate. Pharmacopsychiatry. 1998;31(4):122-125. doi:10.1055/s-2007-979312
26. Ingenhoven T, Lafay P, Rinne T, Passchier J, Duivenvoorden H. Effectiveness of pharmacotherapy for severe personality disorders: meta-analyses of randomized controlled trials. J Clin Psychiatry. 2010;71:14. doi:10.4088/jcp.08r04526gre
27. Mercer D, Douglass AB, Links PS. Meta-analyses of mood stabilizers, antidepressants and antipsychotics in the treatment of borderline personality disorder: effectiveness for depression and anger symptoms. J Pers Disord. 2009;23(2):156-174. doi:10.1521/pedi.2009.23.2.156
28. Hollander E, Swann AC, Coccaro EF, Jiang P, Smith TB. Impact of trait impulsivity and state aggression on divalproex versus placebo response in borderline personality disorder. Am J Psychiatry. 2005;162(3):621-624. doi:10.1176/appi.ajp.162.3.621
29. Naranjo CA, Busto U, Sellers EM, Sandor P, Ruiz I, Roberts EA, et al. A method for estimating the probability of adverse drug reactions. Clin Pharmacol Ther. 1981;30:239-245. doi:10.1038/clpt.1981.154
30. Andrès E, Villalba NL, Zulfiqar AA, Serraj K, Mourot-Cottet R, Gottenberg AJ. State of art of idiosyncratic drug-induced neutropenia or agranulocytosis, with a focus on biotherapies. J Clin Med. 2019;8(9):1351. doi:10.3390/jcm8091351
Valproic acid (VPA) and its derivative, divalproex (DVP) are prescribed for a variety of indications, commonly for seizure control in patients with epilepsy, mood stabilization in patients with bipolar disorder, and migraine prophylaxis. Gastrointestinal distress and sedation are among the most reported adverse effects (AEs) with DVP therapy.1 Although serious hepatic and hematologic AEs are rare, monitoring is still recommended. DVP can cause various hematologic dyscrasias, the most common being thrombocytopenia.1,2 Neutropenia and leukopenia have been reported in isolated cases, most occurring in pediatric patients or patients with epilepsy.3-14
Several case reports of DVP-related neutropenia (absolute neutrophil count [ANC] < 1.50 103/mcL) and leukopenia (white blood cell count [WBC] < 4.0 103/mcL) were reviewed during our literature search, some caused by DVP monotherapy; others were thought to be related to concomitant use of DVP and another drug.15-25 Quetiapine was the antipsychotic most commonly implicated in causing hematologic abnormalities when combined with DVP. We report a case of neutropenia and leukopenia that presented after a cross taper from quetiapine to DVP for the treatment of borderline personality disorder (BPD).
Although no medications have been approved by the US Food and Drug Administration (FDA) for the treatment of BPD, mood stabilizers, including DVP, have literature to support their use for the treatment of affective dysregulation and impulsive behavioral dyscontrol.26-28 A therapeutic range for DVP in the treatment of BPD has not been defined; therefore, for this case report, the generally accepted range of 50 to 100 µg/mL will be considered therapeutic.1
Case Presentation
A 34-year-old male patient presented to the mental health clinic pharmacist reporting that his current psychotropic medication regimen was not effective. His medical history included posttraumatic stress disorder (PTSD), opioid use disorder, alcohol use disorder, stimulant use disorder, cannabis use, BPD, hypertension, hyperlipidemia, prediabetes, gastroesophageal reflex disease, and a pulmonary nodule. On initial presentation, the patient was prescribed buprenorphine 24 mg/naloxone 6 mg, quetiapine 400 mg, duloxetine 120 mg, and prazosin 15 mg per day. At the time of pharmacy consultation, last reported alcohol or nonprescribed opioid use was about 6 months prior, and methamphetamine use about 1 month prior, with ongoing cannabis use. The patient had a history of participating in cognitive processing therapy, dialectical behavior therapy (DBT), and residential treatment for both PTSD and substance use. Additionally, he was actively participating in contingency management for stimulant use disorder and self-management and recovery training group.
The patient reported ongoing mood lability, hypervigilance, and oversedation with current psychotropic regimen. The prescriber of his medication for opioid use disorder also reported the patient experienced labile mood, impulsive behavior, and anger outbursts. In the setting of intolerability due to oversedation with quetiapine, cardiometabolic risk, and lack of clear indication for use, the patient and health care practitioner (HCP) agreed to taper quetiapine and initiate a trial of DVP for affective dysregulation and impulsive-behavioral dyscontrol. To prevent cholinergic rebound and insomnia with abrupt discontinuation of quetiapine, DVP and quetiapine were cross tapered. The following cross taper was prescribed: quetiapine 300 mg and DVP 500 mg per day for week 1; quetiapine 200 mg and DVP 500 mg per day for week 2; quetiapine 100 mg and DVP 1000 mg per day for week 3; quetiapine 50 mg and DVP 1000 mg per day for week 4; followed by DVP 1000 mg per day and discontinuation of quetiapine.
During a 4-week follow-up appointment, the patient reported appropriate completion of cross taper but stopped taking the DVP 3 days prior to the appointment due to self-reported lack of efficacy. For this reason, serum VPA level was not obtained. After discussion with his HCP, the patient restarted DVP 1000 mg per day without retitration with plans to get laboratory tests in 1 week. The next week, laboratory tests were notable for VPA level 28.74 (reference range, 50-100) µg/mL, low WBC 3.51 (reference range, 4.00-10.00) 103/mcL, platelets 169 (reference range, 150-420) 103/mcL, and low ANC 1.00 (reference range, 1.50-7.40) 103/mcL (Table). This raised clinical concern as the patient had no history of documented neutropenia or leukopenia, with most recent complete blood count (CBC) prior to DVP initiation 3 months earlier while prescribed quetiapine.
On further review, the HCP opted to cease administration of DVP and repeat CBC with differential in 1 week. Nine days later, laboratory tests were performed and compared with those collected the week before, revealing resolution of neutropenia and leukopenia. A score of 7 on the Naranjo Adverse Drug Reaction Probability Scale (NADRPS) was determined based on previous conclusive reports on the reaction (+1), appeared after suspected drug administration (+2), improved with drug discontinuation (+1), confirmed by objective evidence (+1), and no alternative causes could be found (+2).29 With a NADRPS score of 7, an AE of probable DVP-induced neutropenia was documented and medication was not resumed.
Discussion
Our case report describes isolated neutropenia and leukopenia that developed after a cross taper from quetiapine to DVP. Hematologic abnormalities resolved after discontinuation of DVP, suggesting a likely correlation. DVP has a well-established, dose-related prevalence of thrombocytopenia occurring in up to 27% of patients.1 Fewer case reports exist on neutropenia and leukopenia. DVP-induced neutropenia is thought to be a result of direct bone marrow suppression, whereas the more commonly occurring blood dyscrasia, thrombocytopenia, is thought to be caused by an antibody-mediated destruction of platelets.6
Management of DVP-induced thrombocytopenia is often dependent on the severity of the reaction. In mild-to-moderate cases, intervention may not be necessary as thrombocytopenia has been shown to resolve without adjustment to DVP therapy.1 In more severe or symptomatic cases, dose reduction or discontinuation of the offending agent is recommended, typically resulting in resolution shortly following pharmacologic intervention.
Guidance on the management of other drug-induced hematologic abnormalities, such as neutropenia and leukopenia are not as well established. A 2019 systematic review of idiosyncratic drug-induced neutropenia suggested that continuing the offending drug with strict monitoring could be considered in cases of mild neutropenia. In cases of moderate neutropenia, the author suggests temporary cessation of the drug and reinstatement once neutrophil count normalizes and definitive cessation of the drug in severe cases.30
In our case, continuing the offending agent with close monitoring was considered, similar to the well-established management of clozapine-induced neutropenia. However, due to the concern that the ANC was bordering moderate neutropenia in the absence of a therapeutic VPA level as well as a significant reduction in platelets, although not meeting criteria for thrombocytopenia, the decision was made to err on the side of caution and discontinue the most likely offending agent.
It is important to highlight that DVP was replacing quetiapine in the form of a cross taper. Quetiapine is structurally similar to clozapine. While clozapine has strict monitoring requirements related to neutropenia, blood dyscrasias with quetiapine therapy are rare. Quetiapine-induced hematologic abnormalities may be due to direct toxicity or to an immune-mediated mechanism, leading to bone marrow suppression.20 Case reports documenting blood dyscrasias with the combination of DVP and quetiapine were identified during literature review.15-19 Despite these case reports, we believe DVP was the primary offending agent in our case as the patient’s last dose of quetiapine was 2 weeks before obtaining the abnormal CBC. There was no history of blood dyscrasias with quetiapine monotherapy; however, the effect of the combination of DVP and quetiapine is unknown as no CBC was obtained during the cross-taper period.
Although there are no FDA-approved medications for the treatment of BPD, mood stabilizers, including DVP, have some research to support their use for the treatment of affective dysregulation and impulsive-behavioral dyscontrol.26-28 In our case, DVP was selected due to the evidence for use in BPD and ability to assess adherence with therapeutic monitoring. Although polypharmacy is a concern in patients with BPD, in our case we believed that the patient’s ongoing mood lability and impulsive behaviors warranted pharmacologic intervention. Additionally, DVP provided an advantage in its ability to quickly titrate to therapeutic dose when compared with lamotrigine and a lower risk of cognitive AEs when compared with topiramate.
Conclusions
To our knowledge, this case report demonstrates the first published case of neutropenia and leukopenia related to DVP therapy for the treatment of BPD. Routine CBC monitoring is recommended with DVP therapy, and our case highlights the importance of evaluating for not only thrombocytopenia, but also other blood dyscrasias during the titration phase even in the absence of a therapeutic VPA level. Further studies are warranted to determine incidence of DVP-related neutropenia and leukopenia and to evaluate the safety of continuing DVP in cases of mild-to-moderate neutropenia with close monitoring.
1. Depakote (valproic acid). Package insert. Abbott Laboratories; June 2000.
2. Conley EL, Coley KC, Pollock BG, Dapos SV, Maxwell R, Branch RA. Prevalence and risk of thrombocytopenia with valproic acid: experience at a psychiatric teaching hospital. Pharmacotherapy. 2001;21(11):1325-1330. doi:10.1592/phco.21.17.1325.34418
3. Jaeken J, van Goethem C, Casaer P, Devlieger H, Eggermont E, Pilet M. Neutropenia during sodium valproate therapy. Arch Dis Child. 1979;54(12):986-987. doi:10.1136/adc.54.12.986
4. Barr RD, Copeland SA, Stockwell MC, Morris N, Kelton JC. Valproic acid and immune thrombocytopenia. Arch Dis Child. 1982;57(9):681-684. doi:10.1136/adc.57.9.681
5. Symon DNK, Russell G. Sodium valproate and neutropenia (letter). Arch Dis Child. 1983;58:235. doi:10.1136/adc.58.3.235
6. Watts RG, Emanuel PD, Zuckerman KS, Howard TH. Valproic acid-induced cytopenias: evidence for a dose-related suppression of hematopoiesis. J Pediatr. 1990;117(3):495-499. doi:10.1016/s0022-3476(05)81105-9
7. Blackburn SC, Oliart AD, García-Rodríguez LA, Pérez Gutthann S. Antiepileptics and blood dyscrasias: a cohort study. Pharmacotherapy. 1998;18(6):1277-1283.
8. Acharya S, Bussel JB. Hematologic toxicity of sodium valproate. J Pediatr Hematol Oncol. 2000;22(1):62-65. doi:10.1097/00043426-200001000-00012
9. Vesta KS, Medina PJ. Valproic acid-induced neutropenia. Ann Pharmacother. 2003;37(6):819-821. doi:10.1345/aph.1C381
10. Kohli U, Gulati, S. Sodium valproate induced isolated neutropenia. Indian J Pediatr. 2006;73(9):844-844. doi:10.1007/BF02790401
11. Hsu HC, Tseng HK, Wang SC, Wang YY. Valproic acid-induced agranulocytosis. Int J Gerontol. 2009;3(2):137-139. doi:10.1016/S1873-9598(09)70036-5
12. Chakraborty S, Chakraborty J, Mandal S, Ghosal MK. A rare occurrence of isolated neutropenia with valproic acid: a case report. J Indian Med Assoc. 2011;109(5):345-346.
13. Stoner SC, Deal E, Lurk JT. Delayed-onset neutropenia with divalproex sodium. Ann Pharmacother. 2008;42(10):1507-1510. doi:10.1345/aph.1L239
14. Storch DD. Severe leukopenia with valproate. J Am Acad Child Adolesc Psychiatry. 2000;39(10):1208-1209. doi:10.1097/00004583-200010000-00003
15. Rahman A, Mican LM, Fischer C, Campbell AH. Evaluating the incidence of leukopenia and neutropenia with valproate, quetiapine, or the combination in children and adolescents. Ann Pharmacother. 2009;43:822-830. doi:10.1345/aph.1L617
16. Hung WC, Hsieh MH. Neutropenia associated with the comedication of quetiapine and valproate in 2 elderly patients. J Clin Psychopharmacol. 2012;32(3):416-417. doi:10.1097/JCP.0b013e3182549d2d
17. Park HJ, Kim JY. Incidence of neutropenia with valproate and quetiapine combination treatment in subjects with acquired brain injuries. Arch Phys Med Rehabil. 2016;97(2):183-188. doi:10.1016/j.apmr.2015.09.004
18. Estabrook KR, Pheister M. A case of quetiapine XR and divalproex-associated neutropenia followed by successful use of ziprasidone. J Clin Psychopharmacol. 2012;32(3):417-418. doi:10.1097/JCP.0b013e318253a071
19. Nair P, Lippmann S. Is leukopenia associated with divalproex and/or quetiapine? Psychosomatics. 2005;46(2):188-189. doi:10.1176/appi.psy.46.2.188
20. Cowan C, Oakley C. Leukopenia and neutropenia induced by quetiapine. Prog Neuropsychopharmacol Biol Psychiatry. 2007;31(1):292-294. doi:10.1016/j.pnpbp.2006.07.003
21. Fan KY, Chen WY, Huang MC. Quetiapine-associated leucopenia and thrombocytopenia: a case report. BMC Psychiatry. 2015;15:110. doi:10.1186/s12888-015-0495-9
22. Malik S, Lally J, Ajnakina O, et al. Sodium valproate and clozapine induced neutropenia: A case control study using register data. Schizophr Res. 2018;195:267-273. doi:10.1016/j.schres.2017.08.041
23. Pantelis C, Adesanya A. Increased risk of neutropaenia and agranulocytosis with sodium valproate used adjunctively with clozapine. Aust N Z J Psychiatry. 2001;35(4):544-545. doi:10.1046/j.1440-1614.2001.0911f.x
24. Madeb R, Hirschmann S, Kurs R, Turkie A, Modai I. Combined clozapine and valproic acid treatment-induced agranulocytosis. Eur Psychiatry. 2002;17(4):238-239. doi:10.1016/s0924-9338(02)00659-4
25. Dose M, Hellweg R, Yassouridis A, Theison M, Emrich HM. Combined treatment of schizophrenic psychoses with haloperidol and valproate. Pharmacopsychiatry. 1998;31(4):122-125. doi:10.1055/s-2007-979312
26. Ingenhoven T, Lafay P, Rinne T, Passchier J, Duivenvoorden H. Effectiveness of pharmacotherapy for severe personality disorders: meta-analyses of randomized controlled trials. J Clin Psychiatry. 2010;71:14. doi:10.4088/jcp.08r04526gre
27. Mercer D, Douglass AB, Links PS. Meta-analyses of mood stabilizers, antidepressants and antipsychotics in the treatment of borderline personality disorder: effectiveness for depression and anger symptoms. J Pers Disord. 2009;23(2):156-174. doi:10.1521/pedi.2009.23.2.156
28. Hollander E, Swann AC, Coccaro EF, Jiang P, Smith TB. Impact of trait impulsivity and state aggression on divalproex versus placebo response in borderline personality disorder. Am J Psychiatry. 2005;162(3):621-624. doi:10.1176/appi.ajp.162.3.621
29. Naranjo CA, Busto U, Sellers EM, Sandor P, Ruiz I, Roberts EA, et al. A method for estimating the probability of adverse drug reactions. Clin Pharmacol Ther. 1981;30:239-245. doi:10.1038/clpt.1981.154
30. Andrès E, Villalba NL, Zulfiqar AA, Serraj K, Mourot-Cottet R, Gottenberg AJ. State of art of idiosyncratic drug-induced neutropenia or agranulocytosis, with a focus on biotherapies. J Clin Med. 2019;8(9):1351. doi:10.3390/jcm8091351
Prevalence and Predictors of Lower Limb Amputation in the Spinal Cord Injury Population
At the James A. Haley Veterans’ Hospital (JAHVH) in Tampa, Florida, the prevalence of amputations among patients at the spinal cord injury (SCI) center seems high. Despite limited data demonstrating altered hemodynamics in the lower extremities (LEs) among the SCI population and increased frequency of peripheral arterial disease (PAD), amputations among patients with SCI have received little attention in research.1-3
In the United States, most amputations are caused by vascular disease related to peripheral arterial disease (PAD) and diabetes mellitus (DM).4 PAD primarily affects the LEs and is caused by atherosclerotic obstruction leading to insufficient blood flow. PAD can present clinically as LE pain, nonhealing ulcers, nonpalpable distal pulses, shiny or cold skin, absence of hair on the LE, or distal extremity pallor when the affected extremity is elevated. However, PAD is often asymptomatic. The diagnosis of PAD is typically made with an ankle-brachial index (ABI) ≤ 0.9.5 The prevalence of PAD is about 4.3% in Americans aged ≥ 40 years, increases with age, and is almost twice as common among Black Americans compared with that of White Americans.6 Many studies in SCI populations have documented an increased prevalence of DM, dyslipidemia, obesity, hypertension (HTN), and cigarette smoking.7-9 PAD shares these risk factors with coronary artery disease (CAD), but relative to CAD, tobacco smoking was a more substantial causative factor for PAD.10 Given the preponderance of associated risk factors in this population, PAD is likely more prevalent among patients with SCI than in the population without disabilities. Beyond these known risk factors, researchers hypothesized that SCI contributes to vascular disease by altering arterial function. However, this is still a topic of debate.11-13 Trauma also is a common cause of amputation, accounting for 45% of amputations in 2005.4 Patients with SCI may experience traumatic amputations simultaneously as their SCI, but they may also be predisposed to traumatic amputations related to osteopenia and impaired sensation.
Since amputation is an invasive surgery, knowing the severity of this issue is important in the SCI population. This study quantifies the prevalence of amputations of the LEs among the patients at our SCI center. It then characterizes these amputations’ etiology, their relationship with medical comorbidities, and certain SCI classifications.
Methods
This retrospective cohort study used the US Department of Veterans Affairs (VA) Computerized Patient Record System. The cohort was defined as all patients who received an annual examination at our SCI center over 4 years from October 1, 2009 to September 30, 2013. Annual examination includes a physical examination, relevant surveillance laboratory tests, and imaging, such as renal ultrasound for those with indwelling urinary catheters. One characteristic of the patient population in the VA system is that diagnoses, such as multiple sclerosis (MS) and amyotrophic lateral sclerosis (ALS), that involve spinal cord lesions causing symptoms are included in the registry, besides those with other traumatic or nontraumatic SCI. October 1 to September 30 was chosen based on the VA fiscal year (FY).
During this period, 1678 patients had an annual examination. Of those, 299 patients had an SCI etiology of ALS or MS, and 41 had nonfocal SCI etiology that could not be assessed using the American Spinal Injury Association Impairment Scale (AIS) and were excluded. Also excluded were 283 patients who did not have an annual examination during the specified time span. Some patients do not have an annual examination every year; for those with multiple annual examinations during that time frame, the most recent was used.
One thousand fifty-five patients were included in the statistical analysis. Date of birth, sex, race, ethnicity, date of death, smoking status, DM diagnosis, HTN diagnosis, use of an antiplatelet, antihypertensive, or lipid-lowering agent, blood pressure, hemoglobin A1c, and lipid panel were collected. The amputation level and etiology were noted. The levels of amputation were classified as toe/partial foot,
Statistical Analysis
Descriptive data were summarized as the median and IQR for continuous variables or the number and percentage for categorical variables. The χ2 test was used to analyze the association between categorical variables and amputation status. A nonparametric Wilcoxon test was used to investigate the distribution of continuous variables across patients with amputation and patients without amputation. Binary logistic regression analysis was used to investigate amputation risk factors. We report goodness of fit using the Hosmer and Lemeshow test and the area under the curve (AUC) for the multivariate model. Statistical significance was prespecified at a 2-sided P < .05. SAS version 9.4 was used for all statistical analyses.
Results
Mean age was approximately 61 years for the 91 patients at the time of the most recent amputation (Table 1). Among those with amputation, 63% were paraplegic and 37% were tetraplegic.
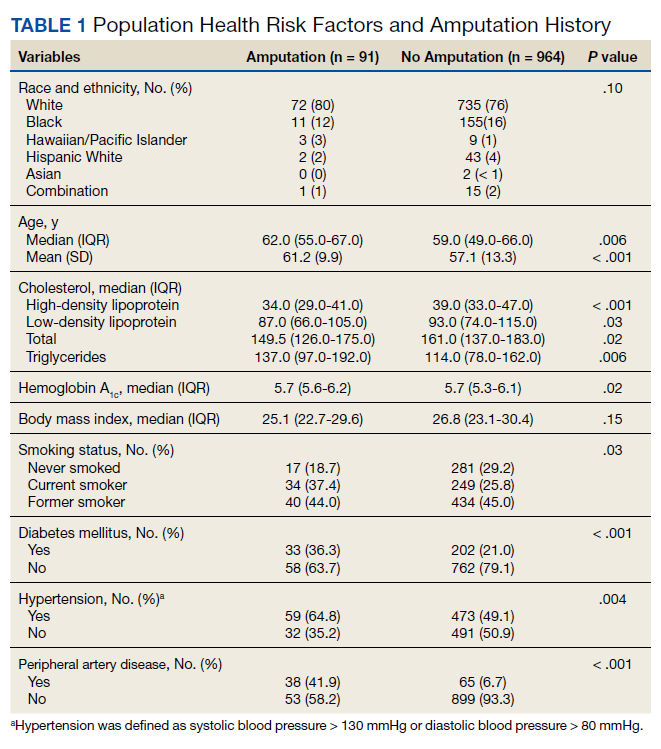
Of 1055 patients with SCI, 91 (8.6%) patients had an amputation. Of those, 70 (76.1%) were from nontraumatic causes (dysvascular), 17 (18.5%) were traumatic, 4 (4.3%) were from other causes (ie, cancer), and only 1 (1.1%) was of unknown cause.
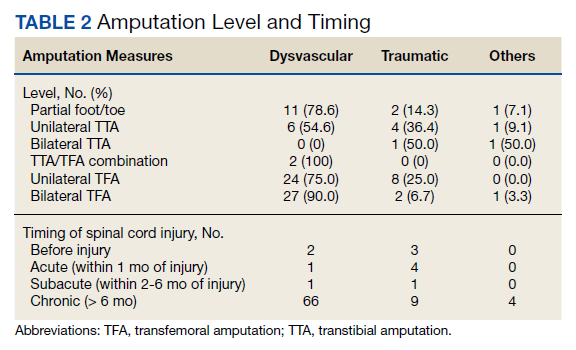
Of the 91 patients with amputation, 64 (69.6%) had at least 1 TFA—33 were unilateral and 31 were bilateral. Two patients had a TFA on one side and a TTA on the other. Partial foot/toe and TTA were less common amputation levels with 14 (15.4%) and 13 (14.3%), respectively. Most amputations (86.8%) occurred over 6 months from the day of initial SCI, and were most commonly dysvascular (Table 2). Traumatic amputation occurred more evenly at various stages, pre-SCI, during acute SCI, subacute SCI, and chronic SCI.
Injury by Impairment Scale Level
Forty-nine (11.5%) of 426 patients with AIS level A SCI had undergone amputation. In order of prevalence, 23 (46.9%) were unilateral TFA, 17 (34.6%) were bilateral TFA, 10.2% were partial foot/toe, 4.1% were unilateral TTA, and 4.1% were a TTA/TFA combination. Both hip and knee disarticulations were classified in the TFA category.
Sixteen (13.0%) of 123 patients with AIS level B SCI had undergone amputation; 5 (31.3%) of those amputations were unilateral TFA, 6 (37.5%) were bilateral TFA, 3 (18.8%) were partial toe or foot, and 1 (6.3%) was for unilateral and bilateral TTA each.
Twelve (8.4%) of 143 patients with AIS level C SCI had undergone amputation: 6 (50.0%) were bilateral TFA; 3 (25.0%) were unilateral TFA; and 3 (25.0%) were unilateral TTA.
Fourteen (3.9%) of 356 patients with AIS level D SCI had undergone amputation. Of those 6 (42.9%) underwent a partial foot/toe amputation; 5 (35.7%) had undergone a unilateral TTA, and 1 (7.1%) underwent amputation in each of the following categories: bilateral TTA, unilateral TFA, and bilateral TFA each.
None of the 7 individuals with AIS E level SCI had undergone amputation.
Health Risk Factors
Of the 91 patients with amputation, the majority (81.3%) were either former or current smokers. Thirty-six percent of those who had undergone amputation had a diagnosis of DM, while only 21% of those who had not undergone amputation had a diagnosis of DM.
At the time of their annual examination 532 patients had a diagnosis of HTN while 523 patients did not. Among patients with amputations, 59 (64.8%) had HTN, while 32 (35.2%) did not. Of the 964 patients without amputation, the prevalence of HTN was 50.9%
.Of 1055 patients with SCI, only 103 (9.8%) had a PAD diagnosis, including 38 (41.9%) patients with amputation. Just 65 (6.7%) patients with SCI without amputation had PAD (P < .001). PAD is highly correlated with dysvascular causes of amputation. Among those with amputations due to dysvascular etiology, 50.0% (35/70) had PAD, but for the 21 amputations due to nondysvascular etiology, only 3 (14.3%) had PAD (P = .004).
Amputation Predictive Model
A multivariate logistic regression analysis was used to build a predictive model for amputation among patients with SCI while controlling for covariates. In our multivariate analysis, high-density lipoprotein cholesterol (HDL-C), tetraplegia, and PAD were predictive factors for amputation. Patients with SCI who had PAD were 8.6 times more likely to undergo amputation compared to those without PAD (odds ratio [OR], 9.8; P < .001; 95% CI, 5.9-16.3). Every unit of HDL-C decreased the odds of amputation by 5% (OR, 0.95; P < .001; 95% CI, 0.93-0.98).
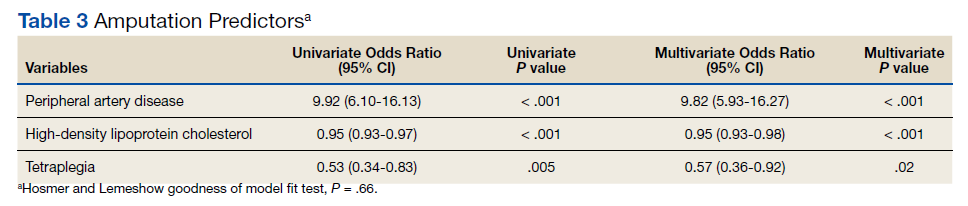
Having tetraplegia decreased the odds of amputation by 43%, compared with those with paraplegia (OR, 0.57; P = .02; 95% CI, 0.36 - 0.92). AUC was 0.76, and the Hosmer and Lemeshow goodness of model fit test P value was .66, indicating the good predictive power of the model (Table 3).
Discussion
In the US, 54 to 82% of amputations occur secondary to chronic vascular disease. Our study showed similar results: 76.1% of amputations were dysvascular.4,16 Even in a 2019 systematic review, the most recent prevalence of amputation data was in 2005.17 The study concluded that among the general population in the US, prevalence of amputation was estimated to be 1 in 190 people, or about 0.5% of the population.4 We found that the prevalence of amputation among the SCI population in this study was 8.7%. This result is consistent with our initial hypothesis that the prevalence of amputation would be higher among the people with SCI. Using a different case acquisition method, Svircev and colleagues reported that about a 4% prevalence of LE amputation among veterans with chronic SCI (over 1 year from the initial SCI), with an emphasis that it was not a study of amputation incidence.18 In comparison, we calculated a 7.5% prevalence of amputation during the chronic SCI stage, which showed institutional variation and a consistent observation that LE amputations occurred more frequently in the SCI population.
Our results showed a positive correlation between the completeness of injury and the prevalence of amputation. Those individuals with a motor complete injury, AIS A (40.3%) or AIS B (11.7%) account for approximately half of all amputations in our population with SCI. Another finding was that proximal amputations were more frequent with more neurologically complete SCIs. Of those with an injury classified as AIS A and an amputation, 42 of 49 subjects underwent at least 1 TFA (23 were unilateral TFA, 17 were bilateral TFA, 2 were a TFA/TTA combination). Of those with an AIS B injury and an amputation, 11 of 16 subjects (68.8%) had at least 1 TFA (5 unilateral TFA and 6 bilateral TFA). Among patients with AIS C injury and amputation, 75% had a TFA. At the same time, only 13.3% of all amputations were at the transfemoral level in those with an AIS D injury. None of the participants with an injury classified as AIS E had undergone an amputation.
Given a paucity of literature available regarding amputation levels in patients with SCI, a discussion with a JAHVH vascular surgeon helped explain the rationale behind different levels of amputation among the SCI population—TFA was performed in 64 of 91 cases (70%). Institutionally, TFAs were performed more often because this level had the greatest chance of healing, avoiding infection, and eliminating knee contracture issues, which may affect quality of life. This was believed to be the best option in those individuals who were already nonambulatory. Although this study did not collect data on ambulatory status, this helps explain why those with an SCI classification of AIS D were more likely to have had a more distal amputation to preserve current or a future chance of ambulation, provided that whether the limb is salvageable is the priority of surgical decision.
The prevalence of PAD among veterans is generally higher than it is in the nonveteran population. Studies show that the prevalence of PAD risk factors in the veteran population exceeds national estimates. Nearly two-thirds of veterans have HTN, 1 in 4 has DM, and 1 in 4 is a current smoker, placing veterans at a significantly increased risk of PADand, therefore, amputation.19,20 These rates were about the same or greater in our SCI population: 50.4% had HTN, 22.3% had a diagnosis of DM, and 71.8% smoked previously or currently smoked. In 3 large studies, HTN was second only to current smoking as the most attributable risk factor for PAD.21
Ongoing research by JAHVH vascular surgeons suggests that patients with SCI were younger and less likely to have HTN, PAD, and/or CAD compared with patients undergoing TFA without SCI. Additionally, patients with SCI had better postoperative outcomes in terms of 30-day mortality, 3-year mortality, and had no increased rate of surgical revisions, strokes, or wound-healing complications. This supports the previous thought that the AIS classification plays a large role in determining amputation levels.
One result in this study is that paraplegia is one of the predictors of future amputation compared with tetraplegia. To our knowledge, there is no literature that supports or explains this finding. A hypothetical factor that could explain this observation is the difference in duration of survival—those with paraplegia who live longer are more likely to experience end-stage consequence of vascular diseases. Another proposed factor is that those with paraplegia are generally more active and have a higher likelihood of sustaining a traumatic cause of amputation, even though this etiology of amputation is minor.An unexpected finding in our study was that of 1055 patients with SCI, only 9.8% had a PAD diagnosis. In contrast, 41.3% of those with amputation had a PAD diagnosis. JAHVH does not screen for PAD, so this likely represents only the symptomatic cases.
Diagnosing PAD in patients with SCI is challenging as they may lack classic clinical symptoms, such as pain with ambulation and impotence, secondary to their neurologic injury. Instead, the health care practitioner must rely on physical signs, such as necrosis.22 Of note given the undetermined utility of diagnosing PAD in patients with SCI, early endovascular interventions are not typically performed. We could not find literature regarding when intervention for PAD in patients with SCI should be performed or how frequently those with SCI should be assessed for PAD. One study showed impaired ambulation prior to limb salvage procedures was associated with poor functional outcomes in terms of survival, independent living, and ambulatory status.23 This could help explain why endovascular procedures are done relatively infrequently in this population. With the lack of studies regarding PAD in the SCI population, outcomes analysis of these patients, including the rate of initial interventions, re-intervention for re-amputation (possibly at a higher level), or vascular inflow procedures, are needed.
It would be beneficial for future studies to examine whether inflammatory markers, such as C-reactive protein (CRP), were more elevated in patients with SCI who underwent amputation compared with those who did not. Chronic underlying inflammation has been shown to be a risk factor for PAD. One study showed that, independently of other risk factors, elevated CRP levels roughly tripled the risk of developing PAD.24 This study suggested that there is an increased risk of dysvascular amputation among the SCI population at this center. This information is significant because it can help influence JAHVH clinical practice for veterans with SCI and vascular diseases.
Limitations
As a single-center study carried out at an SCI specialized center of a VA hospital, this study's finding may not be generalizable. Incomplete documentation in the health record may have led to underreporting of amputations and other information. The practice of the vascular surgeons at JAHVH may not represent the approach of vascular surgeons nationwide. Another limitation of this study is that the duration of SCI was not considered when looking at health risk factors associated with amputation in the SCI population (ie, total cholesterol, hemoglobin A1c, etc). Finally, the medication regimens were not reviewed to determine whether they meet the standard of care in relation to eventual diagnosis of PAD.
A prospective study comparing the prevalence of amputation between veterans with SCI vs veterans without SCI could better investigate the difference in amputation risks. This study only compared our veterans with SCI in reference to the general population. Veterans are more likely to be smokers than the general population, contributing to PAD.17 In addition, data regarding patients’ functional status in regard to transferring and ambulation before and after amputation were not collected, which would have contributed to an understanding of how amputation affects functional status in this population.
Conclusions
There is an increased prevalence of amputation among veterans with SCI compared with that of the nationwide population and a plurality were TFAs. This data suggest that those with a motor complete SCI are more likely to undergo a more proximal amputation. This is likely secondary to a lower likelihood of ambulation with more neurologically complete injuries along with a greater chance of healing with a more proximal amputation. It is challenging to correlate any variables specific to SCI (ie, immobility, time since injury, level of injury, etc) with an increased risk of amputation as the known comorbidities associated with PAD are highly prevalent in this population. Having PAD, low HDL-C (< 40 mg/dL), and paraplegia instead of tetraplegia were independent predictors of amputation.
Health care professionals need to be aware of the high prevalence of amputation in the SCI population. Comorbidities should be aggressively treated as PAD, in addition to being associated with amputation, has been linked with increased mortality.25 Studies using a larger population and multiple centers are needed to confirm such a concerning finding.
Acknowledgments
This material is based on work supported (or supported in part) with resources and the use of facilities at the James A. Haley Veterans’ Hospital (JAHVH). Authors gratefully acknowledge the inputs and support of Dr. James Brooks, MD, RPVI, assistant professor of surgery, University of South Florida (USF), and attending surgeon, vascular surgery service, medical director of the peripheral vascular laboratory, JAHVH; and Dr. Kevin White, MD, assistant professor, USF, and Chief of Spinal Cord Injury Center, JAHVH.
1. Hopman MT, Nommensen E, van Asten WN, Oeseburg B, Binkhorst RA. Properties of the venous vascular system in the lower extremities of individuals with paraplegia. Paraplegia. 1994;32(12):810-816. doi:10.1038/sc.1994.128
2. Theisen D, Vanlandewijck Y, Sturbois X, Francaux M. Central and peripheral haemodynamics in individuals with paraplegia during light and heavy exercise. J Rehabil Med. 2001;33(1):16-20. doi:10.1080/165019701300006489
3. Bell JW, Chen D, Bahls M, Newcomer SC. Evidence for greater burden of peripheral arterial disease in lower extremity arteries of spinal cord-injured individuals. Am J Physiol Heart Circ Physiol. 2011;301(3):H766-H772. doi:10.1152/ajpheart.00507.2011
4. Ziegler-Graham K, MacKenzie EJ, Ephraim PL, Travison TG, Brookmeyer R. Estimating the prevalence of limb loss in the United States: 2005 to 2050. Arch Phys Med Rehabil. 2008;89(3):422-429. doi:10.1016/j.apmr.2007.11.005
5. Hennion DR, Siano KA. Diagnosis and treatment of peripheral arterial disease. Am Fam Physician. 2013;88(5):306-310.
6. Selvin E, Erlinger TP. Prevalence of and risk factors for peripheral arterial disease in the United States: results from the National Health and Nutrition Examination Survey, 1999-2000. Circulation. 2004;110(6):738-743. doi:10.1161/01.CIR.0000137913.26087.F0
7. Bauman WA, Spungen AM. Disorders of carbohydrate and lipid metabolism in veterans with paraplegia or quadriplegia: a model of premature aging. Metabolism. 1994;43(6):749-756. doi:10.1016/0026-0495(94)90126-0
8. Jörgensen S, Hill M, Lexell J. Cardiovascular risk factors among older adults with long-term spinal cord injury. PM R. 2019;11(1):8-16. doi:10.1016/j.pmrj.2018.06.008
9. Wu JC, Chen YC, Liu L, et al. Increased risk of stroke after spinal cord injury: a nationwide 4-year follow-up cohort study. Neurology. 2012;78(14):1051-1057. doi:10.1212/WNL.0b013e31824e8eaa
10. Price JF, Mowbray PI, Lee AJ, Rumley A, Lowe GD, Fowkes FG. Relationship between smoking and cardiovascular risk factors in the development of peripheral arterial disease and coronary artery disease: Edinburgh Artery Study. Eur Heart J. 1999;20(5):344-353. doi:10.1053/euhj.1998.1194
11. Bell JW, Chen D, Bahls M, Newcomer SC. Altered resting hemodynamics in lower-extremity arteries of individuals with spinal cord injury. J Spinal Cord Med. 2013;36(2):104-111. doi:10.1179/2045772312Y.0000000052
12. Miyatani M, Masani K, Oh PI, Miyachi M, Popovic MR, Craven BC. Pulse wave velocity for assessment of arterial stiffness among people with spinal cord injury: a pilot study. J Spinal Cord Med. 2009;32(1):72-78. doi:10.1080/10790268.2009.11760755
13. Oliver JJ, Webb DJ. Noninvasive assessment of arterial stiffness and risk of atherosclerotic events. Arterioscler Thromb Vasc Biol. 2003;23(4):554-566. doi:10.1161/01.ATV.0000060460.52916.D6
14. Ephraim PL, Dillifngham TR, Sector M, Pezzin LE, MacKenzie EJ. Epidemiology of limb loss and congenital limb deficiency: a review of the literature. Arch Phys Med Rehabil. 2003;84(5): 747-761. doi:10.1016/s0003-9993(02)04932-8.15. Levin ME. Preventing amputation in the patient with diabetes. Diabetes Care. 1995;18(10)1383-1394. doi:10.2337/diacare.18.10.1383
16. Dillingham TR, Pezzin LE, MacKenzie EJ. Limb amputation and limb deficiency: epidemiology and recent trends in the United States. South Med J. 2002;95(8):875-883. doi:10.1097/00007611- 200208000-00018
17. Lo J, Chan L, Flynn S. A systematic review of the incidence, prevalence, costs, and activity and work limitations of amputation, osteoarthritis, rheumatoid arthritis, back pain, multiple sclerosis, spinal cord injury, stroke, and traumatic brain injury in the United States: a 2019 update. Arch Phys Med Rehabil. 2021;102:115-131. doi:10.1016/j.apmr.2020.04.001
18. Svircev, J, Tan D, Garrison A, Pennelly, B, Burns SP. Limb loss in individuals with chronic spinal cord injury. J Spinal Cord Med. doi:10.1080/10790268.2020.1800964
19. Brown DW. Smoking prevalence among US veterans. J Gen Intern Med. 2010;25(2):147-149. doi:10.1007/s11606-009-1160-0
20. Selim AJ, Berlowitz DR, Fincke G, et al. The health status of elderly veteran enrollees in the Veterans Health Administration. J Am Geriatr Soc. 2004;52(8):1271-1276. doi:10.1111/j.1532-5415.2004.52355.x
21. Criqui MH, Aboyans V. Epidemiology of peripheral artery disease. Circ Res. 2015;116(9):1509-1526. doi:10.1161/CIRCRESAHA.116.303849
22. Yokoo KM, Kronon M, Lewis VL Jr, McCarthy WJ, McMillan WD, Meyer PR Jr. Peripheral vascular disease in spinal cord injury patients: a difficult diagnosis. Ann Plast Surg. 1996;37(5):495-499. doi:10.1097/00000637-199611000-00007
23. Taylor SM, Kalbaugh CA, Blackhurst DW, Cass, et al. Determinants of functional outcome after revascularization for critical limb ischemia: an analysis of 1000 consecutive vascular interventions. J Vasc Surg. 2006;44(4):747–756. doi:10.1016/j.jvs.2006.06.015
24. Abdellaoui A, Al-Khaffaf H. C-reactive protein (CRP) as a marker in peripheral vascular disease. Eur J Vasc Endovasc Surg. 2007;34(1):18-22. doi:10.1016/j.ejvs.2006.10.040
25. Caro J, Migliaccio-Walle K, Ishak KJ, Proskorovsky I. The morbidity and mortality following a diagnosis of peripheral arterial disease: long-term follow-up of a large database. BMC Cardiovasc Disord. 2005;5:14. doi:10.1186/1471-2261-5-14
At the James A. Haley Veterans’ Hospital (JAHVH) in Tampa, Florida, the prevalence of amputations among patients at the spinal cord injury (SCI) center seems high. Despite limited data demonstrating altered hemodynamics in the lower extremities (LEs) among the SCI population and increased frequency of peripheral arterial disease (PAD), amputations among patients with SCI have received little attention in research.1-3
In the United States, most amputations are caused by vascular disease related to peripheral arterial disease (PAD) and diabetes mellitus (DM).4 PAD primarily affects the LEs and is caused by atherosclerotic obstruction leading to insufficient blood flow. PAD can present clinically as LE pain, nonhealing ulcers, nonpalpable distal pulses, shiny or cold skin, absence of hair on the LE, or distal extremity pallor when the affected extremity is elevated. However, PAD is often asymptomatic. The diagnosis of PAD is typically made with an ankle-brachial index (ABI) ≤ 0.9.5 The prevalence of PAD is about 4.3% in Americans aged ≥ 40 years, increases with age, and is almost twice as common among Black Americans compared with that of White Americans.6 Many studies in SCI populations have documented an increased prevalence of DM, dyslipidemia, obesity, hypertension (HTN), and cigarette smoking.7-9 PAD shares these risk factors with coronary artery disease (CAD), but relative to CAD, tobacco smoking was a more substantial causative factor for PAD.10 Given the preponderance of associated risk factors in this population, PAD is likely more prevalent among patients with SCI than in the population without disabilities. Beyond these known risk factors, researchers hypothesized that SCI contributes to vascular disease by altering arterial function. However, this is still a topic of debate.11-13 Trauma also is a common cause of amputation, accounting for 45% of amputations in 2005.4 Patients with SCI may experience traumatic amputations simultaneously as their SCI, but they may also be predisposed to traumatic amputations related to osteopenia and impaired sensation.
Since amputation is an invasive surgery, knowing the severity of this issue is important in the SCI population. This study quantifies the prevalence of amputations of the LEs among the patients at our SCI center. It then characterizes these amputations’ etiology, their relationship with medical comorbidities, and certain SCI classifications.
Methods
This retrospective cohort study used the US Department of Veterans Affairs (VA) Computerized Patient Record System. The cohort was defined as all patients who received an annual examination at our SCI center over 4 years from October 1, 2009 to September 30, 2013. Annual examination includes a physical examination, relevant surveillance laboratory tests, and imaging, such as renal ultrasound for those with indwelling urinary catheters. One characteristic of the patient population in the VA system is that diagnoses, such as multiple sclerosis (MS) and amyotrophic lateral sclerosis (ALS), that involve spinal cord lesions causing symptoms are included in the registry, besides those with other traumatic or nontraumatic SCI. October 1 to September 30 was chosen based on the VA fiscal year (FY).
During this period, 1678 patients had an annual examination. Of those, 299 patients had an SCI etiology of ALS or MS, and 41 had nonfocal SCI etiology that could not be assessed using the American Spinal Injury Association Impairment Scale (AIS) and were excluded. Also excluded were 283 patients who did not have an annual examination during the specified time span. Some patients do not have an annual examination every year; for those with multiple annual examinations during that time frame, the most recent was used.
One thousand fifty-five patients were included in the statistical analysis. Date of birth, sex, race, ethnicity, date of death, smoking status, DM diagnosis, HTN diagnosis, use of an antiplatelet, antihypertensive, or lipid-lowering agent, blood pressure, hemoglobin A1c, and lipid panel were collected. The amputation level and etiology were noted. The levels of amputation were classified as toe/partial foot,
Statistical Analysis
Descriptive data were summarized as the median and IQR for continuous variables or the number and percentage for categorical variables. The χ2 test was used to analyze the association between categorical variables and amputation status. A nonparametric Wilcoxon test was used to investigate the distribution of continuous variables across patients with amputation and patients without amputation. Binary logistic regression analysis was used to investigate amputation risk factors. We report goodness of fit using the Hosmer and Lemeshow test and the area under the curve (AUC) for the multivariate model. Statistical significance was prespecified at a 2-sided P < .05. SAS version 9.4 was used for all statistical analyses.
Results
Mean age was approximately 61 years for the 91 patients at the time of the most recent amputation (Table 1). Among those with amputation, 63% were paraplegic and 37% were tetraplegic.
Of 1055 patients with SCI, 91 (8.6%) patients had an amputation. Of those, 70 (76.1%) were from nontraumatic causes (dysvascular), 17 (18.5%) were traumatic, 4 (4.3%) were from other causes (ie, cancer), and only 1 (1.1%) was of unknown cause.
Of the 91 patients with amputation, 64 (69.6%) had at least 1 TFA—33 were unilateral and 31 were bilateral. Two patients had a TFA on one side and a TTA on the other. Partial foot/toe and TTA were less common amputation levels with 14 (15.4%) and 13 (14.3%), respectively. Most amputations (86.8%) occurred over 6 months from the day of initial SCI, and were most commonly dysvascular (Table 2). Traumatic amputation occurred more evenly at various stages, pre-SCI, during acute SCI, subacute SCI, and chronic SCI.
Injury by Impairment Scale Level
Forty-nine (11.5%) of 426 patients with AIS level A SCI had undergone amputation. In order of prevalence, 23 (46.9%) were unilateral TFA, 17 (34.6%) were bilateral TFA, 10.2% were partial foot/toe, 4.1% were unilateral TTA, and 4.1% were a TTA/TFA combination. Both hip and knee disarticulations were classified in the TFA category.
Sixteen (13.0%) of 123 patients with AIS level B SCI had undergone amputation; 5 (31.3%) of those amputations were unilateral TFA, 6 (37.5%) were bilateral TFA, 3 (18.8%) were partial toe or foot, and 1 (6.3%) was for unilateral and bilateral TTA each.
Twelve (8.4%) of 143 patients with AIS level C SCI had undergone amputation: 6 (50.0%) were bilateral TFA; 3 (25.0%) were unilateral TFA; and 3 (25.0%) were unilateral TTA.
Fourteen (3.9%) of 356 patients with AIS level D SCI had undergone amputation. Of those 6 (42.9%) underwent a partial foot/toe amputation; 5 (35.7%) had undergone a unilateral TTA, and 1 (7.1%) underwent amputation in each of the following categories: bilateral TTA, unilateral TFA, and bilateral TFA each.
None of the 7 individuals with AIS E level SCI had undergone amputation.
Health Risk Factors
Of the 91 patients with amputation, the majority (81.3%) were either former or current smokers. Thirty-six percent of those who had undergone amputation had a diagnosis of DM, while only 21% of those who had not undergone amputation had a diagnosis of DM.
At the time of their annual examination 532 patients had a diagnosis of HTN while 523 patients did not. Among patients with amputations, 59 (64.8%) had HTN, while 32 (35.2%) did not. Of the 964 patients without amputation, the prevalence of HTN was 50.9%
.Of 1055 patients with SCI, only 103 (9.8%) had a PAD diagnosis, including 38 (41.9%) patients with amputation. Just 65 (6.7%) patients with SCI without amputation had PAD (P < .001). PAD is highly correlated with dysvascular causes of amputation. Among those with amputations due to dysvascular etiology, 50.0% (35/70) had PAD, but for the 21 amputations due to nondysvascular etiology, only 3 (14.3%) had PAD (P = .004).
Amputation Predictive Model
A multivariate logistic regression analysis was used to build a predictive model for amputation among patients with SCI while controlling for covariates. In our multivariate analysis, high-density lipoprotein cholesterol (HDL-C), tetraplegia, and PAD were predictive factors for amputation. Patients with SCI who had PAD were 8.6 times more likely to undergo amputation compared to those without PAD (odds ratio [OR], 9.8; P < .001; 95% CI, 5.9-16.3). Every unit of HDL-C decreased the odds of amputation by 5% (OR, 0.95; P < .001; 95% CI, 0.93-0.98).
Having tetraplegia decreased the odds of amputation by 43%, compared with those with paraplegia (OR, 0.57; P = .02; 95% CI, 0.36 - 0.92). AUC was 0.76, and the Hosmer and Lemeshow goodness of model fit test P value was .66, indicating the good predictive power of the model (Table 3).
Discussion
In the US, 54 to 82% of amputations occur secondary to chronic vascular disease. Our study showed similar results: 76.1% of amputations were dysvascular.4,16 Even in a 2019 systematic review, the most recent prevalence of amputation data was in 2005.17 The study concluded that among the general population in the US, prevalence of amputation was estimated to be 1 in 190 people, or about 0.5% of the population.4 We found that the prevalence of amputation among the SCI population in this study was 8.7%. This result is consistent with our initial hypothesis that the prevalence of amputation would be higher among the people with SCI. Using a different case acquisition method, Svircev and colleagues reported that about a 4% prevalence of LE amputation among veterans with chronic SCI (over 1 year from the initial SCI), with an emphasis that it was not a study of amputation incidence.18 In comparison, we calculated a 7.5% prevalence of amputation during the chronic SCI stage, which showed institutional variation and a consistent observation that LE amputations occurred more frequently in the SCI population.
Our results showed a positive correlation between the completeness of injury and the prevalence of amputation. Those individuals with a motor complete injury, AIS A (40.3%) or AIS B (11.7%) account for approximately half of all amputations in our population with SCI. Another finding was that proximal amputations were more frequent with more neurologically complete SCIs. Of those with an injury classified as AIS A and an amputation, 42 of 49 subjects underwent at least 1 TFA (23 were unilateral TFA, 17 were bilateral TFA, 2 were a TFA/TTA combination). Of those with an AIS B injury and an amputation, 11 of 16 subjects (68.8%) had at least 1 TFA (5 unilateral TFA and 6 bilateral TFA). Among patients with AIS C injury and amputation, 75% had a TFA. At the same time, only 13.3% of all amputations were at the transfemoral level in those with an AIS D injury. None of the participants with an injury classified as AIS E had undergone an amputation.
Given a paucity of literature available regarding amputation levels in patients with SCI, a discussion with a JAHVH vascular surgeon helped explain the rationale behind different levels of amputation among the SCI population—TFA was performed in 64 of 91 cases (70%). Institutionally, TFAs were performed more often because this level had the greatest chance of healing, avoiding infection, and eliminating knee contracture issues, which may affect quality of life. This was believed to be the best option in those individuals who were already nonambulatory. Although this study did not collect data on ambulatory status, this helps explain why those with an SCI classification of AIS D were more likely to have had a more distal amputation to preserve current or a future chance of ambulation, provided that whether the limb is salvageable is the priority of surgical decision.
The prevalence of PAD among veterans is generally higher than it is in the nonveteran population. Studies show that the prevalence of PAD risk factors in the veteran population exceeds national estimates. Nearly two-thirds of veterans have HTN, 1 in 4 has DM, and 1 in 4 is a current smoker, placing veterans at a significantly increased risk of PADand, therefore, amputation.19,20 These rates were about the same or greater in our SCI population: 50.4% had HTN, 22.3% had a diagnosis of DM, and 71.8% smoked previously or currently smoked. In 3 large studies, HTN was second only to current smoking as the most attributable risk factor for PAD.21
Ongoing research by JAHVH vascular surgeons suggests that patients with SCI were younger and less likely to have HTN, PAD, and/or CAD compared with patients undergoing TFA without SCI. Additionally, patients with SCI had better postoperative outcomes in terms of 30-day mortality, 3-year mortality, and had no increased rate of surgical revisions, strokes, or wound-healing complications. This supports the previous thought that the AIS classification plays a large role in determining amputation levels.
One result in this study is that paraplegia is one of the predictors of future amputation compared with tetraplegia. To our knowledge, there is no literature that supports or explains this finding. A hypothetical factor that could explain this observation is the difference in duration of survival—those with paraplegia who live longer are more likely to experience end-stage consequence of vascular diseases. Another proposed factor is that those with paraplegia are generally more active and have a higher likelihood of sustaining a traumatic cause of amputation, even though this etiology of amputation is minor.An unexpected finding in our study was that of 1055 patients with SCI, only 9.8% had a PAD diagnosis. In contrast, 41.3% of those with amputation had a PAD diagnosis. JAHVH does not screen for PAD, so this likely represents only the symptomatic cases.
Diagnosing PAD in patients with SCI is challenging as they may lack classic clinical symptoms, such as pain with ambulation and impotence, secondary to their neurologic injury. Instead, the health care practitioner must rely on physical signs, such as necrosis.22 Of note given the undetermined utility of diagnosing PAD in patients with SCI, early endovascular interventions are not typically performed. We could not find literature regarding when intervention for PAD in patients with SCI should be performed or how frequently those with SCI should be assessed for PAD. One study showed impaired ambulation prior to limb salvage procedures was associated with poor functional outcomes in terms of survival, independent living, and ambulatory status.23 This could help explain why endovascular procedures are done relatively infrequently in this population. With the lack of studies regarding PAD in the SCI population, outcomes analysis of these patients, including the rate of initial interventions, re-intervention for re-amputation (possibly at a higher level), or vascular inflow procedures, are needed.
It would be beneficial for future studies to examine whether inflammatory markers, such as C-reactive protein (CRP), were more elevated in patients with SCI who underwent amputation compared with those who did not. Chronic underlying inflammation has been shown to be a risk factor for PAD. One study showed that, independently of other risk factors, elevated CRP levels roughly tripled the risk of developing PAD.24 This study suggested that there is an increased risk of dysvascular amputation among the SCI population at this center. This information is significant because it can help influence JAHVH clinical practice for veterans with SCI and vascular diseases.
Limitations
As a single-center study carried out at an SCI specialized center of a VA hospital, this study's finding may not be generalizable. Incomplete documentation in the health record may have led to underreporting of amputations and other information. The practice of the vascular surgeons at JAHVH may not represent the approach of vascular surgeons nationwide. Another limitation of this study is that the duration of SCI was not considered when looking at health risk factors associated with amputation in the SCI population (ie, total cholesterol, hemoglobin A1c, etc). Finally, the medication regimens were not reviewed to determine whether they meet the standard of care in relation to eventual diagnosis of PAD.
A prospective study comparing the prevalence of amputation between veterans with SCI vs veterans without SCI could better investigate the difference in amputation risks. This study only compared our veterans with SCI in reference to the general population. Veterans are more likely to be smokers than the general population, contributing to PAD.17 In addition, data regarding patients’ functional status in regard to transferring and ambulation before and after amputation were not collected, which would have contributed to an understanding of how amputation affects functional status in this population.
Conclusions
There is an increased prevalence of amputation among veterans with SCI compared with that of the nationwide population and a plurality were TFAs. This data suggest that those with a motor complete SCI are more likely to undergo a more proximal amputation. This is likely secondary to a lower likelihood of ambulation with more neurologically complete injuries along with a greater chance of healing with a more proximal amputation. It is challenging to correlate any variables specific to SCI (ie, immobility, time since injury, level of injury, etc) with an increased risk of amputation as the known comorbidities associated with PAD are highly prevalent in this population. Having PAD, low HDL-C (< 40 mg/dL), and paraplegia instead of tetraplegia were independent predictors of amputation.
Health care professionals need to be aware of the high prevalence of amputation in the SCI population. Comorbidities should be aggressively treated as PAD, in addition to being associated with amputation, has been linked with increased mortality.25 Studies using a larger population and multiple centers are needed to confirm such a concerning finding.
Acknowledgments
This material is based on work supported (or supported in part) with resources and the use of facilities at the James A. Haley Veterans’ Hospital (JAHVH). Authors gratefully acknowledge the inputs and support of Dr. James Brooks, MD, RPVI, assistant professor of surgery, University of South Florida (USF), and attending surgeon, vascular surgery service, medical director of the peripheral vascular laboratory, JAHVH; and Dr. Kevin White, MD, assistant professor, USF, and Chief of Spinal Cord Injury Center, JAHVH.
1. Hopman MT, Nommensen E, van Asten WN, Oeseburg B, Binkhorst RA. Properties of the venous vascular system in the lower extremities of individuals with paraplegia. Paraplegia. 1994;32(12):810-816. doi:10.1038/sc.1994.128
2. Theisen D, Vanlandewijck Y, Sturbois X, Francaux M. Central and peripheral haemodynamics in individuals with paraplegia during light and heavy exercise. J Rehabil Med. 2001;33(1):16-20. doi:10.1080/165019701300006489
3. Bell JW, Chen D, Bahls M, Newcomer SC. Evidence for greater burden of peripheral arterial disease in lower extremity arteries of spinal cord-injured individuals. Am J Physiol Heart Circ Physiol. 2011;301(3):H766-H772. doi:10.1152/ajpheart.00507.2011
4. Ziegler-Graham K, MacKenzie EJ, Ephraim PL, Travison TG, Brookmeyer R. Estimating the prevalence of limb loss in the United States: 2005 to 2050. Arch Phys Med Rehabil. 2008;89(3):422-429. doi:10.1016/j.apmr.2007.11.005
5. Hennion DR, Siano KA. Diagnosis and treatment of peripheral arterial disease. Am Fam Physician. 2013;88(5):306-310.
6. Selvin E, Erlinger TP. Prevalence of and risk factors for peripheral arterial disease in the United States: results from the National Health and Nutrition Examination Survey, 1999-2000. Circulation. 2004;110(6):738-743. doi:10.1161/01.CIR.0000137913.26087.F0
7. Bauman WA, Spungen AM. Disorders of carbohydrate and lipid metabolism in veterans with paraplegia or quadriplegia: a model of premature aging. Metabolism. 1994;43(6):749-756. doi:10.1016/0026-0495(94)90126-0
8. Jörgensen S, Hill M, Lexell J. Cardiovascular risk factors among older adults with long-term spinal cord injury. PM R. 2019;11(1):8-16. doi:10.1016/j.pmrj.2018.06.008
9. Wu JC, Chen YC, Liu L, et al. Increased risk of stroke after spinal cord injury: a nationwide 4-year follow-up cohort study. Neurology. 2012;78(14):1051-1057. doi:10.1212/WNL.0b013e31824e8eaa
10. Price JF, Mowbray PI, Lee AJ, Rumley A, Lowe GD, Fowkes FG. Relationship between smoking and cardiovascular risk factors in the development of peripheral arterial disease and coronary artery disease: Edinburgh Artery Study. Eur Heart J. 1999;20(5):344-353. doi:10.1053/euhj.1998.1194
11. Bell JW, Chen D, Bahls M, Newcomer SC. Altered resting hemodynamics in lower-extremity arteries of individuals with spinal cord injury. J Spinal Cord Med. 2013;36(2):104-111. doi:10.1179/2045772312Y.0000000052
12. Miyatani M, Masani K, Oh PI, Miyachi M, Popovic MR, Craven BC. Pulse wave velocity for assessment of arterial stiffness among people with spinal cord injury: a pilot study. J Spinal Cord Med. 2009;32(1):72-78. doi:10.1080/10790268.2009.11760755
13. Oliver JJ, Webb DJ. Noninvasive assessment of arterial stiffness and risk of atherosclerotic events. Arterioscler Thromb Vasc Biol. 2003;23(4):554-566. doi:10.1161/01.ATV.0000060460.52916.D6
14. Ephraim PL, Dillifngham TR, Sector M, Pezzin LE, MacKenzie EJ. Epidemiology of limb loss and congenital limb deficiency: a review of the literature. Arch Phys Med Rehabil. 2003;84(5): 747-761. doi:10.1016/s0003-9993(02)04932-8.15. Levin ME. Preventing amputation in the patient with diabetes. Diabetes Care. 1995;18(10)1383-1394. doi:10.2337/diacare.18.10.1383
16. Dillingham TR, Pezzin LE, MacKenzie EJ. Limb amputation and limb deficiency: epidemiology and recent trends in the United States. South Med J. 2002;95(8):875-883. doi:10.1097/00007611- 200208000-00018
17. Lo J, Chan L, Flynn S. A systematic review of the incidence, prevalence, costs, and activity and work limitations of amputation, osteoarthritis, rheumatoid arthritis, back pain, multiple sclerosis, spinal cord injury, stroke, and traumatic brain injury in the United States: a 2019 update. Arch Phys Med Rehabil. 2021;102:115-131. doi:10.1016/j.apmr.2020.04.001
18. Svircev, J, Tan D, Garrison A, Pennelly, B, Burns SP. Limb loss in individuals with chronic spinal cord injury. J Spinal Cord Med. doi:10.1080/10790268.2020.1800964
19. Brown DW. Smoking prevalence among US veterans. J Gen Intern Med. 2010;25(2):147-149. doi:10.1007/s11606-009-1160-0
20. Selim AJ, Berlowitz DR, Fincke G, et al. The health status of elderly veteran enrollees in the Veterans Health Administration. J Am Geriatr Soc. 2004;52(8):1271-1276. doi:10.1111/j.1532-5415.2004.52355.x
21. Criqui MH, Aboyans V. Epidemiology of peripheral artery disease. Circ Res. 2015;116(9):1509-1526. doi:10.1161/CIRCRESAHA.116.303849
22. Yokoo KM, Kronon M, Lewis VL Jr, McCarthy WJ, McMillan WD, Meyer PR Jr. Peripheral vascular disease in spinal cord injury patients: a difficult diagnosis. Ann Plast Surg. 1996;37(5):495-499. doi:10.1097/00000637-199611000-00007
23. Taylor SM, Kalbaugh CA, Blackhurst DW, Cass, et al. Determinants of functional outcome after revascularization for critical limb ischemia: an analysis of 1000 consecutive vascular interventions. J Vasc Surg. 2006;44(4):747–756. doi:10.1016/j.jvs.2006.06.015
24. Abdellaoui A, Al-Khaffaf H. C-reactive protein (CRP) as a marker in peripheral vascular disease. Eur J Vasc Endovasc Surg. 2007;34(1):18-22. doi:10.1016/j.ejvs.2006.10.040
25. Caro J, Migliaccio-Walle K, Ishak KJ, Proskorovsky I. The morbidity and mortality following a diagnosis of peripheral arterial disease: long-term follow-up of a large database. BMC Cardiovasc Disord. 2005;5:14. doi:10.1186/1471-2261-5-14
The VA Goes Its Own Way on Aducanumab
In the Veterans Health Administration (VHA), the current prevalence of veterans with dementia is estimated to be about 10%.1 A 2013 report from the VHA Office of Policy and Planning projected a 22% increase in patients with dementia between 2020 and 2033. That increase amounts to between 276,000 and 335,000 additional veterans enrolled in the US Department of Veterans Affairs (VA) health care.2 Of course, these alarming statistics can in no way begin to convey the devastating biopsychosocial impact of Alzheimer disease and other dementias on veterans and their families. In many cases, veterans’ service to their country resulted in injuries and illnesses that increased the risk that they would develop dementia, such as traumatic brain injuries and posttraumatic stress disorder.3
Confronted with these concerning statistics, why didn’t VA Pharmacy Benefits Management (PBM) follow the US Food and Drug Administration (FDA) approval of aduncanumab-avwa for patients with dementia? Instead, PBM issued a monograph in July 2021 that recommended against providing aduncanumab-avwa to patients with Alzheimer dementia (mild or otherwise) or mild cognitive impairment, “given the lack of evidence of a robust and meaningful clinical benefit and the known safety signal.”4
In this editorial, I examine the reasons for the PBM recommendation, explain how the VA denial of approval for this new drug for dementia contravened that of the FDA and the ethical implications of this decision for veterans with dementia and the health care professionals (HCPs) who treat them.
The VA PBM national drug monographs are scientific reviews of clinical data supporting the potential inclusion of new medications in the VHA formulary.Aducanumab-avwa is a human monoclonal antibody. Its mechanism of action is to stimulate clearance of β-amyloid plaques from the brains of patients with Alzheimer disease. β-amyloid is a protein byproduct of amyloid precursor protein. Abnormal levels of β-amyloid build up in the brain of a patient with Alzheimer disease, forming clumps that disrupt neuronal connections that enable information transmission and other functions contributing to the death of brain cells.5
The FDA approved aducanumab on June 7, 2021, through the accelerated approval pathway.6 Drugs approved through the regular pathway must show a clinical benefit. Because detecting and demonstrating clinical benefit through research can be a lengthy process, in 1992 the FDA initiated the accelerated approval pathway. This alternative regulatory option permits the agency to approve a drug that “filled an unmet medical need” for a serious or life-threatening condition based on a surrogate endpoint.7 Examples of such endpoints are laboratory values, imaging evidence, physical signs, or other objective findings that are believed to predict a clinical benefit. In 2012, the FDA Safety Innovations Act expanded the basis for approval to an intermediate clinical endpoint: a measure of a therapeutic effect that demonstrates a “reasonable likelihood” of predicting clinical benefit.7
The FDA, unlike the PBM, found that aducanumab “provided a meaningful therapeutic advantage over existing treatments.” The FDA underscored that unlike other medications currently available to treat Alzheimer dementias that target symptoms, aducanumab acts on the underlying neurophysiology and neuropathology of the disease based on the decrease in β-amyloid plaques in participants in 2 large clinical trials. The FDA approved the drug for the treatment of patients with either mild cognitive impairment or in the mild state of Alzheimer dementia.
From the time of its announcement, the FDA decision to approve the drug was controversial and criticized in both professional articles and the news media. A particular poignant charge by Largent and Lynch was that the FDA had exploited the desperation of vulnerable patients with dementia and their families willing to try medications with unclear value and uncertain risk precisely because they believed they had no other viable options.8 Critics charged that the FDA took the unusual step of overruling the recommendations of a council of its senior advisors, claiming that there was insufficient evidence for approval; that there was a potential conflict of interest between the agency and the pharmaceutical industry; and that the FDA inappropriately used the accelerated approval pathway.9 In August 2021, in response to these critiques, the Office of the Inspector General announced that it would review the process the agency used in approving the drug.10 Nor was the VA alone in its refusal: The Centers for Medicare and Medicaid (CMS) has proposed to cover the drug for its beneficiaries enrolled in CMS-endorsed clinical trials with the caveat that the drug’s manufacturer, Biogen, must continue to conduct studies on the safety and effectiveness of the drug.11
Why did VHA come to a different scientific conclusion than that of the FDA? In reviewing the data from the 2 major studies, PBM did not find that this surrogate endpoint of reduction in β-amyloid plaques was a valid measure of a meaningful clinical benefit. Further, this lack of valid therapeutic change could not outweigh the risks of the amyloid-related imaging abnormalities (ARIA) in research participants. ARIA include cerebral vasogenic edema, effusions in sulci, microhemorrhages in the brain, and/or localized superficial siderosis. These findings are thought to be the result of the antibody binding to β-amyloid deposits that in turn increase cerebrovascular permeability.5
Thus, in not approving aducanumab, PBM and VHA leadership acted on the core bioethical principles of beneficence and nonmaleficence to prevent harms that proportionally outweighed benefits. Another ethical consideration for the VHA was that of distributive justice given the expense of the medication and the VHA obligation to be responsible stewards of public resources. At the time of the VHA decision, a year’s worth of aducanumab cost about $56,000: In December 2021, the manufacturer announced a dramatic decrease in the drug’s price.12 Although it may seem that fairness requires the VHA to provide any possible treatment for veterans whose cognitive impairment is in part an adverse effect of their time in uniform, a stronger counter argument is that the same high safety and scientific standard should be used for the approval of medications for patients with dementia as for any other disorder.
Among VHA HCPs and their patients with new and early diagnosed mild cognitive impairment or mild dementia, what is lacking in PBM’s clinical ethics analysis is the important principle of autonomy. PBM did carve out a space for the use of the drug in “highly selected patients by experts and centers that have the necessary diagnostic and management expertise.”5 The series of safety standards that must be met along with monitoring for the drug to be prescribed is PBM’s effort to obtain an equilibrium between preventing harm while respecting professional judgment and patient choice. PBM and VHA will reconsider its criteria if research shows improved effectiveness and safety. As with most debated decisions, for some patients and HCPs that balancing act may not have gone far enough, yet many believe that VHA for now is on the right side of the controversy.
1. Williamson V, Stevelink SAM, Greenberg K, Greenberg N. Prevalence of mental health disorders in elderly U.S. military veterans: a metaanalysis and systematic review. Am J Geriatr Psychiatry. 2018;26:534-545. doi:10.1016/j.jagp.2017.11.001
2. US Department of Veterans Affairs, Veterans Health Administration, Office of the Assistant Deputy Under Secretary for Health for Policy and Planning. Projections of the prevalence and incidence of dementias. Updated November 5, 2021. Accessed March 20, 2022. www.va.gov/geriatrics/GEC_Data_Reports.asp
3. Zhu CW, Sano M. Demographic, health, and exposure risks associated with cognitive loss, Alzheimer’s disease and other dementias in US military veterans. Front Psychiatry. 2021;12:610334. doi:10.3389/fpsyt.2021.610334
4. VHA Pharmacy Benefits Management Services, Medical Advisory Panel, and VISN Pharmacist Executives. Aducanumab-avwa (ADUHELM) National Drug Monograph. Published July 2021. Accessed March 20, 2022. https://www.pbm.va.gov/PBM/clinicalguidance/drugmonographs/Aducanumab_ADUHELM_monograph_508.pdf
5. National Institutes of Health, National Institute on Aging. What happens to the brain in Alzheimer’s disease? Updated May 16, 2017. Accessed March 20, 2022. https://www.nia.nih.gov/health/what-happens-brain-alzheimers-disease
6. US Food and Drug Administration. FDA grants accelerated approval for Alzheimer’s drug. News release. Published June 7, 2021. Accessed March 21, 2022. https://www.fda.gov/news-events/press-announcements/fda-grants-accelerated-approval-alzheimers-drug
7. US Food and Drug Administration. Accelerated approval. Updated January 4, 2018. Accessed March 21,2022.https://www.fda.gov/patients/fast-track-breakthrough-therapy-accelerated-approval-priority-review/accelerated-approval
8. Largent EL, Peterson E, Lynch HF. FDA approval and the ethics of desperation. JAMA Intern Med. 2021;181(12):1555-1556. doi:10.1001/jamainternmed.2021.6045
9. Belluck P, Kaplan S, Robbins R. How an unproven Alzheimer’s drug got approved. New York Times, Updated October 21, 2021. Accessed March 21, 2022. https://www.nytimes.com/2021/07/19/health/alzheimers-drug-aduhelm-fda.html
10. US Department of Health and Human Services, Office of the Inspector General. Review of the FDA’s accelerated approval pathway. Accessed March 20, 2022. https://oig.hhs.gov/reports-and-publications/workplan/summary/wp-summary-0000608.asp
11. Centers for Medicare and Medicaid Services. Monoclonal antibodies directed against amyloid for the treatment of Alzheimer’s disease decision summary. Published January 11, 2022. Accessed March 21, 2022. https://www.cms.gov/medicare-coverage-database/view/ncacal-decision-memo.aspx?proposed=Y&NCAId=305
12. Gleckman H. What’s behind Biogen’s move to cut prices on its controversial Alzheimer’s drug alduhelm. Forbes. Published December 23, 2021. Accessed March 21,2022. https://www.forbes.com/sites/howardgleckman/2021/12/23/whats-behind-biogens-move-to-cut-prices-on-its-controversial-alzheimers-drug-aduhelm/?sh=498c6a235154
In the Veterans Health Administration (VHA), the current prevalence of veterans with dementia is estimated to be about 10%.1 A 2013 report from the VHA Office of Policy and Planning projected a 22% increase in patients with dementia between 2020 and 2033. That increase amounts to between 276,000 and 335,000 additional veterans enrolled in the US Department of Veterans Affairs (VA) health care.2 Of course, these alarming statistics can in no way begin to convey the devastating biopsychosocial impact of Alzheimer disease and other dementias on veterans and their families. In many cases, veterans’ service to their country resulted in injuries and illnesses that increased the risk that they would develop dementia, such as traumatic brain injuries and posttraumatic stress disorder.3
Confronted with these concerning statistics, why didn’t VA Pharmacy Benefits Management (PBM) follow the US Food and Drug Administration (FDA) approval of aduncanumab-avwa for patients with dementia? Instead, PBM issued a monograph in July 2021 that recommended against providing aduncanumab-avwa to patients with Alzheimer dementia (mild or otherwise) or mild cognitive impairment, “given the lack of evidence of a robust and meaningful clinical benefit and the known safety signal.”4
In this editorial, I examine the reasons for the PBM recommendation, explain how the VA denial of approval for this new drug for dementia contravened that of the FDA and the ethical implications of this decision for veterans with dementia and the health care professionals (HCPs) who treat them.
The VA PBM national drug monographs are scientific reviews of clinical data supporting the potential inclusion of new medications in the VHA formulary.Aducanumab-avwa is a human monoclonal antibody. Its mechanism of action is to stimulate clearance of β-amyloid plaques from the brains of patients with Alzheimer disease. β-amyloid is a protein byproduct of amyloid precursor protein. Abnormal levels of β-amyloid build up in the brain of a patient with Alzheimer disease, forming clumps that disrupt neuronal connections that enable information transmission and other functions contributing to the death of brain cells.5
The FDA approved aducanumab on June 7, 2021, through the accelerated approval pathway.6 Drugs approved through the regular pathway must show a clinical benefit. Because detecting and demonstrating clinical benefit through research can be a lengthy process, in 1992 the FDA initiated the accelerated approval pathway. This alternative regulatory option permits the agency to approve a drug that “filled an unmet medical need” for a serious or life-threatening condition based on a surrogate endpoint.7 Examples of such endpoints are laboratory values, imaging evidence, physical signs, or other objective findings that are believed to predict a clinical benefit. In 2012, the FDA Safety Innovations Act expanded the basis for approval to an intermediate clinical endpoint: a measure of a therapeutic effect that demonstrates a “reasonable likelihood” of predicting clinical benefit.7
The FDA, unlike the PBM, found that aducanumab “provided a meaningful therapeutic advantage over existing treatments.” The FDA underscored that unlike other medications currently available to treat Alzheimer dementias that target symptoms, aducanumab acts on the underlying neurophysiology and neuropathology of the disease based on the decrease in β-amyloid plaques in participants in 2 large clinical trials. The FDA approved the drug for the treatment of patients with either mild cognitive impairment or in the mild state of Alzheimer dementia.
From the time of its announcement, the FDA decision to approve the drug was controversial and criticized in both professional articles and the news media. A particular poignant charge by Largent and Lynch was that the FDA had exploited the desperation of vulnerable patients with dementia and their families willing to try medications with unclear value and uncertain risk precisely because they believed they had no other viable options.8 Critics charged that the FDA took the unusual step of overruling the recommendations of a council of its senior advisors, claiming that there was insufficient evidence for approval; that there was a potential conflict of interest between the agency and the pharmaceutical industry; and that the FDA inappropriately used the accelerated approval pathway.9 In August 2021, in response to these critiques, the Office of the Inspector General announced that it would review the process the agency used in approving the drug.10 Nor was the VA alone in its refusal: The Centers for Medicare and Medicaid (CMS) has proposed to cover the drug for its beneficiaries enrolled in CMS-endorsed clinical trials with the caveat that the drug’s manufacturer, Biogen, must continue to conduct studies on the safety and effectiveness of the drug.11
Why did VHA come to a different scientific conclusion than that of the FDA? In reviewing the data from the 2 major studies, PBM did not find that this surrogate endpoint of reduction in β-amyloid plaques was a valid measure of a meaningful clinical benefit. Further, this lack of valid therapeutic change could not outweigh the risks of the amyloid-related imaging abnormalities (ARIA) in research participants. ARIA include cerebral vasogenic edema, effusions in sulci, microhemorrhages in the brain, and/or localized superficial siderosis. These findings are thought to be the result of the antibody binding to β-amyloid deposits that in turn increase cerebrovascular permeability.5
Thus, in not approving aducanumab, PBM and VHA leadership acted on the core bioethical principles of beneficence and nonmaleficence to prevent harms that proportionally outweighed benefits. Another ethical consideration for the VHA was that of distributive justice given the expense of the medication and the VHA obligation to be responsible stewards of public resources. At the time of the VHA decision, a year’s worth of aducanumab cost about $56,000: In December 2021, the manufacturer announced a dramatic decrease in the drug’s price.12 Although it may seem that fairness requires the VHA to provide any possible treatment for veterans whose cognitive impairment is in part an adverse effect of their time in uniform, a stronger counter argument is that the same high safety and scientific standard should be used for the approval of medications for patients with dementia as for any other disorder.
Among VHA HCPs and their patients with new and early diagnosed mild cognitive impairment or mild dementia, what is lacking in PBM’s clinical ethics analysis is the important principle of autonomy. PBM did carve out a space for the use of the drug in “highly selected patients by experts and centers that have the necessary diagnostic and management expertise.”5 The series of safety standards that must be met along with monitoring for the drug to be prescribed is PBM’s effort to obtain an equilibrium between preventing harm while respecting professional judgment and patient choice. PBM and VHA will reconsider its criteria if research shows improved effectiveness and safety. As with most debated decisions, for some patients and HCPs that balancing act may not have gone far enough, yet many believe that VHA for now is on the right side of the controversy.
1. Williamson V, Stevelink SAM, Greenberg K, Greenberg N. Prevalence of mental health disorders in elderly U.S. military veterans: a metaanalysis and systematic review. Am J Geriatr Psychiatry. 2018;26:534-545. doi:10.1016/j.jagp.2017.11.001
2. US Department of Veterans Affairs, Veterans Health Administration, Office of the Assistant Deputy Under Secretary for Health for Policy and Planning. Projections of the prevalence and incidence of dementias. Updated November 5, 2021. Accessed March 20, 2022. www.va.gov/geriatrics/GEC_Data_Reports.asp
3. Zhu CW, Sano M. Demographic, health, and exposure risks associated with cognitive loss, Alzheimer’s disease and other dementias in US military veterans. Front Psychiatry. 2021;12:610334. doi:10.3389/fpsyt.2021.610334
4. VHA Pharmacy Benefits Management Services, Medical Advisory Panel, and VISN Pharmacist Executives. Aducanumab-avwa (ADUHELM) National Drug Monograph. Published July 2021. Accessed March 20, 2022. https://www.pbm.va.gov/PBM/clinicalguidance/drugmonographs/Aducanumab_ADUHELM_monograph_508.pdf
5. National Institutes of Health, National Institute on Aging. What happens to the brain in Alzheimer’s disease? Updated May 16, 2017. Accessed March 20, 2022. https://www.nia.nih.gov/health/what-happens-brain-alzheimers-disease
6. US Food and Drug Administration. FDA grants accelerated approval for Alzheimer’s drug. News release. Published June 7, 2021. Accessed March 21, 2022. https://www.fda.gov/news-events/press-announcements/fda-grants-accelerated-approval-alzheimers-drug
7. US Food and Drug Administration. Accelerated approval. Updated January 4, 2018. Accessed March 21,2022.https://www.fda.gov/patients/fast-track-breakthrough-therapy-accelerated-approval-priority-review/accelerated-approval
8. Largent EL, Peterson E, Lynch HF. FDA approval and the ethics of desperation. JAMA Intern Med. 2021;181(12):1555-1556. doi:10.1001/jamainternmed.2021.6045
9. Belluck P, Kaplan S, Robbins R. How an unproven Alzheimer’s drug got approved. New York Times, Updated October 21, 2021. Accessed March 21, 2022. https://www.nytimes.com/2021/07/19/health/alzheimers-drug-aduhelm-fda.html
10. US Department of Health and Human Services, Office of the Inspector General. Review of the FDA’s accelerated approval pathway. Accessed March 20, 2022. https://oig.hhs.gov/reports-and-publications/workplan/summary/wp-summary-0000608.asp
11. Centers for Medicare and Medicaid Services. Monoclonal antibodies directed against amyloid for the treatment of Alzheimer’s disease decision summary. Published January 11, 2022. Accessed March 21, 2022. https://www.cms.gov/medicare-coverage-database/view/ncacal-decision-memo.aspx?proposed=Y&NCAId=305
12. Gleckman H. What’s behind Biogen’s move to cut prices on its controversial Alzheimer’s drug alduhelm. Forbes. Published December 23, 2021. Accessed March 21,2022. https://www.forbes.com/sites/howardgleckman/2021/12/23/whats-behind-biogens-move-to-cut-prices-on-its-controversial-alzheimers-drug-aduhelm/?sh=498c6a235154
Exercise to Reduce Posttraumatic Stress Disorder Symptoms in Veterans
Physical exercise offers preventative and therapeutic benefits for a range of chronic health conditions, including cardiovascular disease, type 2 diabetes mellitus, Alzheimer disease, and depression.1,2 Exercise has been well studied for its antidepressant effects, its ability to reduce risk of aging-related dementia, and favorable effects on a range of cognitive functions.2 Lesser evidence exists regarding the impact of exercise on other mental health concerns. Therefore, an accurate understanding of whether physical exercise may ameliorate other conditions is important.
A small meta-analysis by Rosenbaum and colleagues found that exercise interventions were superior to control conditions for symptom reduction in study participants with posttraumatic stress disorder (PTSD).3 This meta-analysis included 4 randomized clinical trials representing 200 cases. The trial included a variety of physical activities (eg, yoga, aerobic, and strength-building exercises) and control conditions, and participants recruited from online, community, inpatient, and outpatient settings. The standardized mean difference (SMD) produced by the analysis indicated a small-to-medium effect (Hedges g, -0.35), with the authors reporting no evidence of publication bias, although an assessment of potential bias associated with individual trial design characteristics was not conducted. Of note, a meta-analysis by Watts and colleagues found that effect sizes for PTSD treatments tend to be smaller in veteran populations.4 Therefore, how much the mean effect size estimate in the study is applicable to veterans with PTSD is unknown.3
Veterans represent a unique subpopulation in which PTSD is common, although no meta-analysis yet published has synthesized the effects of exercise interventions from trials of veterans with PTSD.5 A recent systematic review by Whitworth and Ciccolo concluded that exercise may be associated with reduced risk of PTSD, a briefer course of PTSD symptoms, and/or reduced sleep- and depression-related difficulties.6 However, that review primarily included observational, cross-sectional, and qualitative works. No trials included in our meta-analysis were included in that review.6
Evidence-based psychotherapies like cognitive processing therapy and prolonged exposure have been shown to be effective for treating PTSD in veterans; however, these modalities are accompanied by high rates of dropout (eg, 40-60%), thereby limiting their clinical utility.7 The use of complementary and alternative approaches for treatment in the United States has increased in recent years, and exercise represents an important complementary treatment option.8 In a study by Baldwin and colleagues, nearly 50% of veterans reported using complementary or alternative approaches, and veterans with PTSD were among those likely to use such approaches.9 However, current studies of the effects of exercise interventions on PTSD symptom reduction are mostly small and varied, making determinations difficult regarding the potential utility of exercise for treating this condition in veterans.
Literature Search
No previous research has synthesized the literature on the effects of exercise on PTSD in the veteran population. The current meta-analysis aims to provide a synthesis of systematically selected studies on this topic to determine whether exercise-based interventions are effective at reducing veterans’ symptoms of PTSD. Our hypothesis was that, when used as a primary or adjuvant intervention for PTSD, physical exercise would be associated with a reduction of PTSD symptom scale scores. We planned a priori to produce separate estimates for single-arm and multi-arm trials. We also wanted to conduct a careful risk of bias assessment—or evaluation of study features that may have systematically influenced results—for included trials, not only to provide context for interpretation of results, but also to inform suggestions for research to advance this field of inquiry.10
Methods
This study was preregistered on PROSPERO and followed PRISMA guidelines for meta-analyses and systematic reviews.11 Supplementary materials, such as the PRISMA checklist, study data, and funnel plots, are available online (doi.org/10.6084/m9.figshare.c.5618437.v1). Conference abstracts were omitted due to a lack of necessary information. We decided early in the planning process to include both randomized and single-arm trials, expecting the number of completed studies in the area of exercise for PTSD symptom reduction in veterans, and particularly randomized trials of such, would be relatively small.
Studies were included if they met the following criteria: (1) the study was a single- or multi-arm interventional trial; (2) participants were veterans; (3) participants had a current diagnosis of PTSD or exhibited subthreshold PTSD symptoms, as established by authors of the individual studies and supported by a structured clinical interview, semistructured interview, or elevated scores on PTSD symptom self-report measures; (4) the study included an intervention in which exercise (physical activity that is planned, structured, repetitive, and purposive in the sense that improvement or maintenance of physical fitness or health is an objective) was the primary component; (5) PTSD symptom severity was by a clinician-rated or self-report measure; and (6) the study was published in a peer-reviewed journal.12 Studies were excluded if means, standard deviations, and sample sizes were not available or the full text of the study was not available in English.

The systematic review was conducted using PubMed, PsycINFO, and Cochrane Library databases, from the earliest record to February 2021. The following search phrase was used, without additional limits, to acquire a list of potential studies: (“PTSD” or “post-traumatic stress disorder” or “posttraumatic stress disorder” or “post traumatic stress disorder”) and (“veteran” or “veterans”) and (“exercise” or “aerobic” or “activity” or “physical activity”). The references of identified publications also were searched for additional studies. Then, study titles and abstracts were evaluated and finally, full texts were evaluated to determine study inclusion. All screening, study selection, and risk of bias and data extraction activities were performed by 2 independent reviewers (DR and MJ) with disagreements resolved through discussion and consensus (Figure 1). A list of studies excluded during full-text review and rationales can be viewed online (doi.org/10.6084/m9.figshare.c.5618437.v1).
Data Collection
Data were extracted from included studies using custom forms and included the following information based on PRISMA guidelines: (1) study design characteristics; (2) intervention details; and (3) PTSD outcome information.11 PTSD symptom severity was the primary outcome of interest. Outcome data were included if they were derived from a measure of PTSD symptoms—equivalency across measures was assumed for meta-analyses. Potential study bias for each outcome was evaluated using the ROBINS-I and Cochrane Collaboration’s RoB 2 tools for single-arm and multi-arm trials, respectively.13,14 These tools evaluate domains related to the design, conduct, and analysis of studies that are associated with bias (ie, systematic error in findings, such as under- or overestimation of results).10 Examples include how well authors performed and concealed randomization procedures, addressed missing data, and measured study outcomes.13,14 The risk of bias (eg, low, moderate, serious) associated with each domain is rated and, based on the domain ratings, each study is then given an overall rating regarding how much risk influences bias.13,14 Broadly, lower risk of bias corresponds to higher confidence in the validity of results.
Finally, 4 authors (associated with 2 single- and 2 multi-arm studies) were contacted and asked to provide further information. Data for 1 additional multi-arm study were obtained from these communications and included in the final study selection.15 These authors were also asked for information about any unpublished works of which they were aware, although no additional works were identified.
Statistical Analyses
Analyses were performed with R Studio R 3.6.0 software.16 An SMD (also known as Hedges g) was calculated for each study outcome: for single-arm trials, this was the SMD between pre- and postintervention scores, whereas for multi-arm trials, this was the SMD between postintervention outcome scores across groups. CIs for each SMD were calculated using a standard normal distribution. Combined SMDs were estimated separately for single- and multi-arm studies, using random-effects meta-analyses. In order to include multiple relevant outcomes from a single trial (ie, for studies using multiple PTSD symptom measures), robust variance estimation was used.17 Precision was used to weight SMDs.
Correlations between pre- and postintervention scores were not available for 1 single-arm study.18 A correlation coefficient of 0.8 was imputed to calculate the standard error of the of the SMDs for the Clinician-Administered PTSD Scale (CAPS) and the PTSD Checklist (PCL), as this value is consistent with past findings regarding the test-retest reliability of these measures.19-22 A sensitivity analysis, using several alternative correlational values, revealed that the choice of correlation coefficient did not impact the overall results of the meta-analysis.
I2 was used to evaluate between-study heterogeneity. Values of I2 > 25%, 50%, and 75% were selected to reflect low, moderate, and high heterogeneity, respectively, in accordance with guidelines described by Higgins and colleagues.23 Potential publication bias was assessed via funnel plot and Egger test.24 Finally, although collection of depressive symptom scores was proposed as a secondary outcome in the study protocol, such data were available only for 1 multi-arm study. As a result, this outcome was not evaluated.
Results
Six studies with 101 total participants were included in the single-arm analyses (Table 1).18,25-29 Participants consisted of veterans with chronic pain, post-9/11 veterans, female veterans of childbearing age, veterans with a history of trauma therapy, and other veterans. Types of exercise included moderate aerobic exercise and yoga. PTSD symptom measures included the CAPS and the PCL (PCL-5 or PCL-M versions). Reported financial sources for included studies included federal grant funding, nonprofit material support, outside organization support, use of US Department of Veterans Affairs (VA) resources, and no reported financial support.
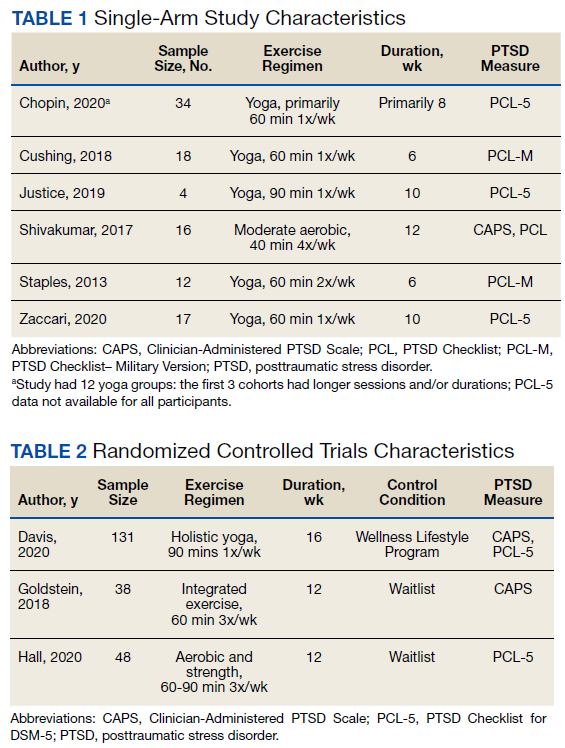
With respect to individual studies, Shivakumar and colleagues found that completion of an aerobic exercise program was associated with reduced scores on 2 different PTSD symptom scales (PCL and CAPS) in 16 women veterans.18 A trauma-informed yoga intervention study with 18 participants by Cushing and colleagues demonstrated veteran participation to be associated with large reductions in PTSD, anxiety, and depression scale scores.25 In a study with 34 veterans, Chopin and colleagues found that a trauma-informed yoga intervention was associated with a statistically significant reduction in PTSD symptoms, as did a study by Zaccari and colleagues with 17 veterans.26,29 Justice and Brems also found some evidence that trauma-informed yoga interventions helped PTSD symptoms in a small sample of 4 veterans, although these results were not quantitatively analyzed.27 In contrast, a small pilot study (n = 12) by Staples and colleagues testing a biweekly, 6-week yoga program did not show a significant effect on PTSD symptoms.28
Three studies with 217 total veteran participants were included in the multi-arm analyses (Table 2).15,30,31 As all multi-arm trials incorporated randomization, they will be referred to as randomized controlled trials (RCTs). On contact, Davis and colleagues provided veteran-specific results for their trial; as such, our data differ from those within the published article.15 Participants from all included studies were veterans currently experiencing symptoms of PTSD. Types of exercise included yoga and combined methods (eg, aerobic and strength training).15,30,31 PTSD symptom measures included the CAPS or the PCL-5.15,30,31 Reported financial sources for included studies included federal grant funding, as well as nonprofit support, private donations, and VA and Department of Defense resources.
Davis and colleagues conducted a recently concluded RCT with > 130 veteran participants and found that a novel manualized yoga program was superior to an attention control in reducing PTSD symptom scale scores for veterans.15 Goldstein and colleagues found that a program consisting of both aerobic and resistance exercises reduced PTSD symptoms to a greater extent than a waitlist control condition, with 47 veterans randomized in this trial.30 Likewise, Hall and colleagues conducted a pilot RCT in which an intervention that integrated exercise and cognitive behavioral techniques was compared to a waitlist control condition.31 For the 48 veterans included in the analyses, the authors reported greater PTSD symptom reduction associated with integrated exercise than that of the control condition; however, the study was not powered to detect statistically significant differences between groups.
Bias Assessment
Results for the risk of bias assessments can be viewed in Tables 3 and 4. For single-arm studies, overall risk of bias was serious for all included trials. Serious risk of bias was found in 2 domains: confounding, due to a lack of accounting for potential preexisting baseline trends (eg, regression to the mean) that could have impacted study results; and measurement, due to the use of a self-report symptom measure (PCL) or CAPS with unblinded assessors. Multiple studies also showed moderate risk in the missing data domain due to participant dropout without appropriate analytic methods to address potential bias.
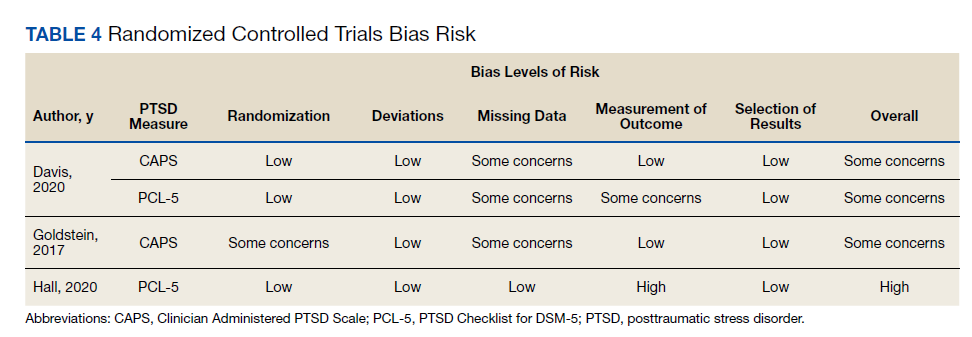
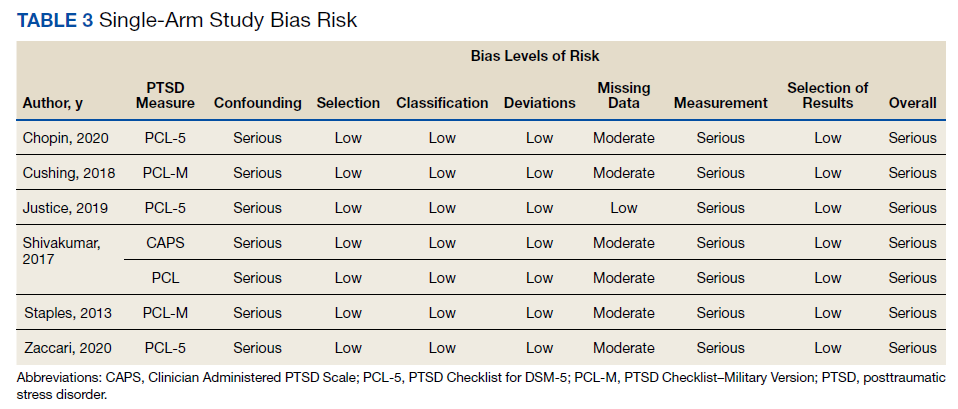
For RCTs, overall risk of bias ranged from some concerns to high risk. High risk of bias was found in 1 domain, measurement of outcome, due to use of a self-report symptom measure (PCL) with unblinded groups.31 The other 2 studies all had some concern of bias in at least 1 of the following domains: randomization, missing data, and measurement of outcome.
Pooled Standardized Mean Differences
Meta-analytic results can be viewed in Figure 2. The pooled SMD for the 6 single-arm studies was -0.60 (df = 4.41, 95% CI, -1.08 to -0.12, P = .03), indicating a statistically significant reduction in PTSD symptoms over the course of an exercise intervention. Combining SMDs for the 3 included RCTs revealed a pooled SMD of -0.40 (df = 1.57, 95% CI, -0.86 to 0.06, P = .06), indicating that exercise did not result in a statistically significant reduction in PTSD symptoms compared with control conditions.
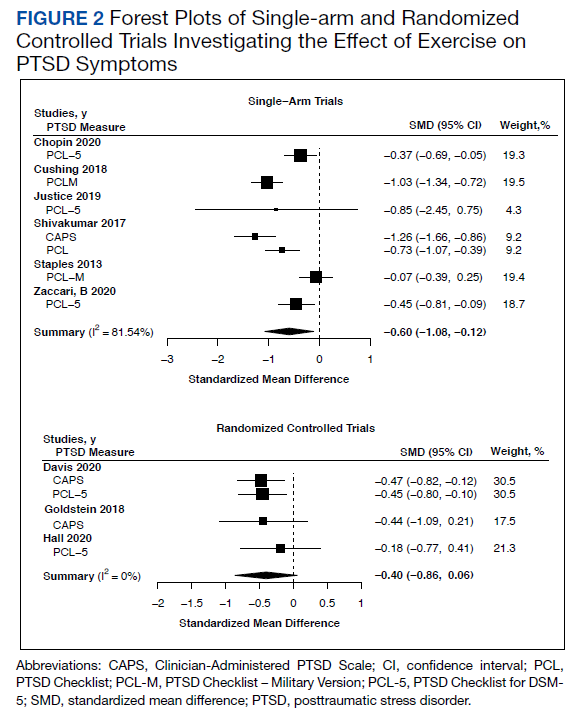
Publication Bias and Heterogeneity
Visual inspection funnel plots and Egger test did not suggest the presence of publication bias for RCTs (t = 1.21, df = 2, P = .35) or single-arm studies (t = -0.36, df = 5, P = .73).
Single-arm studies displayed a high degree of heterogeneity (I2 = 81.5%). Including sample size or exercise duration as variables in meta-regressions did not reduce heterogeneity (I2 = 85.2% and I2 = 83.8%, respectively). Performing a subgroup analysis only on studies using yoga as an intervention also did not reduce heterogeneity (I2 = 79.2%). Due to the small number of studies, no further exploration of heterogeneity was conducted on single-arm studies. RCTs did not display any heterogeneity (I2 = 0%).
Discussion
Our report represents an early synthesis of the first prospective studies of physical exercise interventions for PTSD in veterans. Results from meta-analyses of 6 single-arm studies (101 participants) and 3 RCTs (217 participants) provide early evidence that exercise may reduce PTSD symptoms in veterans. Yoga was the most common form of exercise used in single-arm studies, whereas RCTs used a wider range of interventions. The pooled SMD of -0.60 for single-arm longitudinal studies suggest a medium decrease in PTSD symptoms for veterans who engage in exercise interventions. Analysis of the RCTs supported this finding, with a pooled SMD of -0.40 reflecting a small-to-medium effect of exercise on PTSD symptoms over control conditions, although this result did not achieve statistical significance. Of note, while the nonsignificant finding for RCTs may have been due to insufficient power caused by the limited number of included studies, possibly exercise was not more efficacious than were the control conditions.
Although RCTs represented a variety of exercise types, PTSD symptom measures, and veteran subgroups, statistical results were not indicative of heterogeneity. However, only the largest and most comprehensive study of exercise for PTSD in veterans to date by Davis and colleagues had a statistically significant SMD.15 Of note, one of the other 2 RCTs displayed an SMD of a similar magnitude, but this study had a much smaller sample size and was underpowered to detect significance.30 Additionally, risk of bias assessments for single-arm studies and RCTs revealed study characteristics that suggest possible inflation of absolute effect sizes for individual studies. Therefore, the pooled SMDs we report are interpretable but may exceed the true effect of exercise for PTSD symptom reduction in veterans.
Based on results of our analyses, it is reasonable, albeit preliminary, to conclude that exercise interventions may result in reduced PTSD symptoms among veterans. At the very least, these findings support the continued investigation of such interventions for veterans. Given the unique and salubrious characteristics of physical exercise, such results, if supported by further research, suggest that exercise-based interventions may be particularly valuable within the trauma treatment realm. For example, exercise can be less expensive and more convenient than attending traditional treatment, and for veterans reluctant to engage in standard treatment approaches such as psychiatric and psychosocial modalities, complementary approaches entailing exercise may be viewed as particularly acceptable or enjoyable.32 In addition to possibly reducing PTSD symptoms, exercise is a well-established treatment for conditions commonly comorbid with PTSD, including depression, anxiety disorders, cognitive difficulties, and certain chronic pain conditions.6 As such, exercise represents a holistic treatment option that has the potential to augment standard PTSD care.
Limitations
The present study has several important limitations. First, few studies were found that met the broad eligibility criteria and those that did often had a small sample size. Besides highlighting a gap in the extant research, the limited studies available for meta-analysis means that caution must be taken when interpreting results. Fortunately, this issue will likely resolve once additional studies investigating the impact of exercise on PTSD symptoms in veterans are available for synthesis.
Relatedly, the included study interventions varied considerably, both in the types of exercise used and the characteristics of the exercises (eg, frequency, duration, and intensity), which is relevant as different exercise modalities are associated with differential physical effects.33 Including such a mixture of exercises may have given an incomplete picture of their potential therapeutic effects. Also, none of the RCTs compared exercise against first-line treatments for PTSD, such as prolonged exposure or cognitive processing therapy, which would have provided further insight into the role exercise could play in clinical settings.7
Another limitation is the elevated risk of bias found in most studies, particularly present in the longitudinal single-arm studies, all of which were rated at serious risk. For instance, no single-arm study controlled for preexisting baseline trends: without such (and lacking a comparison control group like in RCTs), it is possible that the observed effects were due to extraneous factors, rather than the exercise intervention. Although not as severe, the multi-arm RCTs also displayed at least moderate risk of bias. Therefore, SMDs may have been overestimated for each group of studies.
Finally, the results of the single-arm meta-analysis displayed high statistical heterogeneity, reducing the generalizability of the results. One possible cause of this heterogeneity may have been the yoga interventions, as a separate analysis removing the only nonyoga study did not reduce heterogeneity. This result was surprising, as the included yoga interventions seemed similar across studies. While the presence of high heterogeneity does require some caution when applying these results to outside interventions, the present study made use of random-effects meta-analysis, a technique that incorporates study heterogeneity into the statistical model, thereby strengthening the findings compared with that of a traditional fixed-effects approach.10
Future Steps
Several future steps are warranted to improve knowledge of exercise as a treatment for PTSD in veterans and in the general population. With current meta-analyses limited to small numbers of studies, additional studies of the efficacy of exercise for treating PTSD could help in several ways. A larger pool of studies would enable future meta-analyses to explore related questions, such as those regarding the impact of exercise on quality of life or depressive symptom reduction among veterans with PTSD. A greater number of studies also would enable meta-analysts to explore potentially critical moderators. For example, the duration, frequency, or type of exercise may moderate the effect of exercise on PTSD symptom reduction. Moderators related to patient or study design characteristics also should be explored in future studies.
Future work also should evaluate the impact that specific features of exercise regimens have on PTSD. Knowing whether the type or structure of exercise affects its clinical use would be invaluable in developing and implementing efficient exercise-based interventions. For example, if facilitated exercise was found to be significantly more effective at reducing PTSD symptoms than exercise completed independently, the development of exercise intervention programs in the VA and other facilities that commonly treat PTSD may be warranted. Additionally, it may be useful to identify specific mechanisms through which exercise reduces PTSD symptoms. For example, in addition to its beneficial biological effects, exercise also promotes psychological health through behavioral activation and alterations within reinforcement/reward systems, suggesting that exercise regularity may be more important than intensity.34,35 Understanding which mechanisms contribute most to change will aid in the development of more efficient interventions.
Given that veterans are demonstrating considerable interest in complementary and alternative PTSD treatments, it is critical that researchers focus on high-quality randomized tests of these interventions. Therefore, in addition to greater quality of exercise intervention studies, future efforts should be focused on RCTs that are designed in such a way as to limit potential introduction of bias. For example, assessment data should be completed by blinded assessors using standardized measures, and analyses should account for missing data and unequal participant attrition between groups. Ideally, pre-intervention trends across multiple baseline datapoints also would be collected in single-arm studies to avoid confounding related to regression to the mean. It is also recommended that future meta-analyses use risk of bias assessments and consider how the results of such assessments may impact the interpretation of results.
Conclusions
Findings from both single-arm studies and RCTs suggest possible benefit of exercise on PTSD symptom reduction, although confirmation of findings is needed. No study found increased symptoms following exercise intervention. Thus, it is reasonable to consider physical exercise, such as yoga, as an adjunct, whole-health consistent treatment. HCPs working with veterans with past traumatic experiences should consider incorporating exercise into patient care. Enhanced educational efforts emphasizing the psychotherapeutic impact of exercise may also have value for the veteran population. Furthermore, the current risk of bias assessments highlights the need for additional high-quality RCTs evaluating the specific impact of exercise on PTSD symptom reduction in veterans. In particular, this field of inquiry would benefit from larger samples and design characteristics to reduce bias (eg, blinding when possible, use of CAPS vs only self-report symptom measures, reducing problematic attrition, corrections for missing data, etc).
Acknowledgments
This research is the result of work supported with resources and the use of facilities at the VA Eastern Kansas Healthcare System (Dwight D. Eisenhower VA Medical Center). It was also supported by the Department of Veterans Affairs Office of Academic Affiliations Advanced Fellowship Program in Mental Illness Research and Treatment, as well as the Rocky Mountain Mental Illness Research, Education, and Clinical Center. Since Dr. Reis and Dr. Gaddy are employees of the US Government and contributed to this manuscript as part of their official duties, the work is not subject to US copyright. This study was preregistered on PROSPERO (https://www.crd.york.ac.uk/prospero/; ID: CRD42020153419).
1. Reiner M, Niermann C, Jekauc D, Woll A. Long-term health benefits of physical activity—a systematic review of longitudinal studies. BMC Public Health. 2013;13:813. doi:10.1186/1471-2458-13-813
2. Walsh R. Lifestyle and mental health. Am Psychol. 2011;66(7):579-592. doi:10.1037/a0021769
3. Rosenbaum S, Vancampfort D, Steel Z, Newby J, Ward PB, Stubbs B. Physical activity in the treatment of posttraumatic stress disorder: a systematic review and meta-analysis. Psychiatry Res. 2015;230(2):130-136. doi:10.1016/j.psychres.2015.10.017
4. Watts BV, Schnurr PP, Mayo L, Young-Xu Y, Weeks WB, Friedman MJ. Meta-analysis of the efficacy of treatments for posttraumatic stress disorder. J Clin Psychiatry. 2013;74(6):e541-550. doi:10.4088/JCP.12r08225
5. Tanielian T, Jaycox L, eds. Invisible Wounds of War: Psychological and Cognitive Injuries, Their Consequences, and Services to Assist Recovery. RAND Corporation; 2008
6. Whitworth JW, Ciccolo JT. Exercise and post-traumatic stress disorder in military veterans: a systematic review. Mil Med. 2016;181(9):953-960. doi:10.7205/MILMED-D-15-00488
7. Rutt BT, Oehlert ME, Krieshok TS, Lichtenberg JW. Effectiveness of cognitive processing therapy and prolonged exposure in the Department of Veterans Affairs. Psychol Rep. 2018;121(2):282-302. doi:10.1177/0033294117727746
8. Clarke TC, Black LI, Stussman BJ, Barnes PM, Nahin RL. Trends in the use of complementary health approaches among adults: United States, 2002-2012. Natl Health Stat Report. 2015(79):1-16.
9. Baldwin CM, Long K, Kroesen K, Brooks AJ, Bell IR. A profile of military veterans in the southwestern United States who use complementary and alternative medicine: Implications for integrated care. Arch Intern Med. 2002;162(15):1697-1704. doi:10.1001/archinte.162.15.1697
10. Higgins JPT, Thomas J, Chanlder J, et al, eds. Cochrane Handbook for Systematic Reviews of Interventions. Version 6.2 (updated February 2021). Cochrane; 2021.
11. Liberati A, Altman DG, Tetzlaff J, et al. The PRISMA statement for reporting systematic reviews and meta-analyses of studies that evaluate health care interventions: explanation and elaboration. PLoS Med. 2009;6(7):e1000100. doi:10.1371/journal.pmed.1000100
12. Caspersen CJ, Powell KE, Christenson GM. Physical activity, exercise, and physical fitness: definitions and distinctions for health-related research. Public Health Rep. 1985;100(2):126-131.
13. Sterne JAC, Hernán MA, Reeves BC, et al. ROBINS-I: a tool for assessing risk of bias in non-randomised studies of interventions. BMJ. 2016;355:i4919. doi:10.1136/bmj.i4919
14. Sterne JAC, Savovic´ J, Page MJ, et al. RoB 2: a revised tool for assessing risk of bias in randomised trials. BMJ. 2019;366:l4898. doi:10.1136/bmj.l4898
15. Davis LW, Schmid AA, Daggy JK, et al. Symptoms improve after a yoga program designed for PTSD in a randomized controlled trial with veterans and civilians. Psychol Trauma. 2020;12(8):904-912. doi:10.1037/tra0000564
16. R Core Team. R: a language and environment for statistical computing. R Foundation for Statistical Computing; 2019.
17. Tipton E. Small sample adjustments for robust variance estimation with meta-regression. Psychol Methods .2015;20(3):375-393. doi:10.1037/met0000011
18. Shivakumar G, Anderson EH, Surís AM, North CS. Exercise for PTSD in women veterans: a proof-of-concept study. Mil Med. 2017;182(11):e1809-e1814. doi:10.7205/MILMED-D-16-00440
19. Blake DD, Weathers FW, Nagy LM, et al. The development of a Clinician-Administered PTSD Scale. J Trauma Stress. 1995;8(1):75-90. doi:10.1007/BF02105408
20. Blanchard EB, Jones-Alexander J, Buckley TC, Forneris CA. Psychometric properties of the PTSD Checklist (PCL). Behav Res Ther. 1996;34(8):669-673. doi:10.1016/0005-7967(96)00033-2
21. Weathers FW, Bovin MJ, Lee DJ, et al. The Clinician- Administered PTSD Scale for DSM-5 (CAPS- 5): Development and initial psychometric evaluation in military veterans. Psychol Assess. 2018;30(3):383-395.doi:10.1037/pas0000486
22. Wilkins KC, Lang AJ, Norman SB. Synthesis of the psychometric properties of the PTSD checklist (PCL) military, civilian, and specific versions. Depress Anxiety. 2011;28(7):596-606. doi:10.1002/da.20837
23. Higgins JP, Thompson SG, Deeks JJ, Altman DG. Measuring inconsistency in meta-analyses. BMJ. 2003;327(7414):557-560. doi:10.1136/bmj.327.7414.557
24. Egger M, Davey Smith G, Schneider M, Minder C. Bias in meta-analysis detected by a simple, graphical test. BMJ. 1997;315(7109):629-634. doi:10.1136/bmj.315.7109.629
25. Cushing RE, Braun KL, Alden CISW, Katz AR. Military- tailored yoga for veterans with post-traumatic stress disorder. Mil Med. 2018;183(5-6):e223-e231. doi:10.1093/milmed/usx071
26. Chopin SM, Sheerin CM, Meyer BL. Yoga for warriors: An intervention for veterans with comorbid chronic pain and PTSD. Psychol Trauma. 2020;12(8):888-896. doi:10.1037/tra0000649
27. Justice L, Brems C. Bridging body and mind: case series of a 10-week trauma-informed yoga protocol for veterans. Int J Yoga Therap. 2019;29(1):65-79. doi:10.17761/D-17-2019-00029
28. Staples JK, Hamilton MF, Uddo M. A yoga program for the symptoms of post-traumatic stress disorder in veterans. Mil Med. 2013;178(8):854-860. doi:10.7205/MILMED-D-12-00536
29. Zaccari B, Callahan ML, Storzbach D, McFarlane N, Hudson R, Loftis JM. Yoga for veterans with PTSD: Cognitive functioning, mental health, and salivary cortisol. Psychol Trauma. 2020;12(8):913-917. doi:10.1037/tra0000909
30. Goldstein LA, Mehling WE, Metzler TJ, et al. Veterans Group Exercise: A randomized pilot trial of an Integrative Exercise program for veterans with posttraumatic stress. J Affect Disord. 2018;227:345-352. doi:10.1016/j.jad.2017.11.002
31. Hall KS, Morey MC, Bosworth HB, et al. Pilot randomized controlled trial of exercise training for older veterans with PTSD. J Behav Med. 2020;43(4):648-659. doi:10.1007/s10865-019-00073-w
32. Gaddy MA. Implementation of an integrative medicine treatment program at a Veterans Health Administration residential mental health facility. Psychol Serv. 2018;15(4):503- 509. doi:10.1037/ser0000189
33. Werner CM, Hecksteden A, Morsch A, et al. Differential effects of endurance, interval, and resistance training on telomerase activity and telomere length in a randomized, controlled study. Eur Heart J. 2019;40(1):34- 46. doi:10.1093/eurheartj/ehy585
34. Silverman MN, Deuster PA. Biological mechanisms underlying the role of physical fitness in health and resilience. Interface Focus. 2014;4(5):20140040. doi:10.1098/rsfs.2014.0040
35. Smith PJ, Merwin RM. The role of exercise in management of mental health disorders: an integrative review. Annu Rev Med. 2021;72:45-62. doi:10.1146/annurev-med-060619-022943.
Physical exercise offers preventative and therapeutic benefits for a range of chronic health conditions, including cardiovascular disease, type 2 diabetes mellitus, Alzheimer disease, and depression.1,2 Exercise has been well studied for its antidepressant effects, its ability to reduce risk of aging-related dementia, and favorable effects on a range of cognitive functions.2 Lesser evidence exists regarding the impact of exercise on other mental health concerns. Therefore, an accurate understanding of whether physical exercise may ameliorate other conditions is important.
A small meta-analysis by Rosenbaum and colleagues found that exercise interventions were superior to control conditions for symptom reduction in study participants with posttraumatic stress disorder (PTSD).3 This meta-analysis included 4 randomized clinical trials representing 200 cases. The trial included a variety of physical activities (eg, yoga, aerobic, and strength-building exercises) and control conditions, and participants recruited from online, community, inpatient, and outpatient settings. The standardized mean difference (SMD) produced by the analysis indicated a small-to-medium effect (Hedges g, -0.35), with the authors reporting no evidence of publication bias, although an assessment of potential bias associated with individual trial design characteristics was not conducted. Of note, a meta-analysis by Watts and colleagues found that effect sizes for PTSD treatments tend to be smaller in veteran populations.4 Therefore, how much the mean effect size estimate in the study is applicable to veterans with PTSD is unknown.3
Veterans represent a unique subpopulation in which PTSD is common, although no meta-analysis yet published has synthesized the effects of exercise interventions from trials of veterans with PTSD.5 A recent systematic review by Whitworth and Ciccolo concluded that exercise may be associated with reduced risk of PTSD, a briefer course of PTSD symptoms, and/or reduced sleep- and depression-related difficulties.6 However, that review primarily included observational, cross-sectional, and qualitative works. No trials included in our meta-analysis were included in that review.6
Evidence-based psychotherapies like cognitive processing therapy and prolonged exposure have been shown to be effective for treating PTSD in veterans; however, these modalities are accompanied by high rates of dropout (eg, 40-60%), thereby limiting their clinical utility.7 The use of complementary and alternative approaches for treatment in the United States has increased in recent years, and exercise represents an important complementary treatment option.8 In a study by Baldwin and colleagues, nearly 50% of veterans reported using complementary or alternative approaches, and veterans with PTSD were among those likely to use such approaches.9 However, current studies of the effects of exercise interventions on PTSD symptom reduction are mostly small and varied, making determinations difficult regarding the potential utility of exercise for treating this condition in veterans.
Literature Search
No previous research has synthesized the literature on the effects of exercise on PTSD in the veteran population. The current meta-analysis aims to provide a synthesis of systematically selected studies on this topic to determine whether exercise-based interventions are effective at reducing veterans’ symptoms of PTSD. Our hypothesis was that, when used as a primary or adjuvant intervention for PTSD, physical exercise would be associated with a reduction of PTSD symptom scale scores. We planned a priori to produce separate estimates for single-arm and multi-arm trials. We also wanted to conduct a careful risk of bias assessment—or evaluation of study features that may have systematically influenced results—for included trials, not only to provide context for interpretation of results, but also to inform suggestions for research to advance this field of inquiry.10
Methods
This study was preregistered on PROSPERO and followed PRISMA guidelines for meta-analyses and systematic reviews.11 Supplementary materials, such as the PRISMA checklist, study data, and funnel plots, are available online (doi.org/10.6084/m9.figshare.c.5618437.v1). Conference abstracts were omitted due to a lack of necessary information. We decided early in the planning process to include both randomized and single-arm trials, expecting the number of completed studies in the area of exercise for PTSD symptom reduction in veterans, and particularly randomized trials of such, would be relatively small.
Studies were included if they met the following criteria: (1) the study was a single- or multi-arm interventional trial; (2) participants were veterans; (3) participants had a current diagnosis of PTSD or exhibited subthreshold PTSD symptoms, as established by authors of the individual studies and supported by a structured clinical interview, semistructured interview, or elevated scores on PTSD symptom self-report measures; (4) the study included an intervention in which exercise (physical activity that is planned, structured, repetitive, and purposive in the sense that improvement or maintenance of physical fitness or health is an objective) was the primary component; (5) PTSD symptom severity was by a clinician-rated or self-report measure; and (6) the study was published in a peer-reviewed journal.12 Studies were excluded if means, standard deviations, and sample sizes were not available or the full text of the study was not available in English.
The systematic review was conducted using PubMed, PsycINFO, and Cochrane Library databases, from the earliest record to February 2021. The following search phrase was used, without additional limits, to acquire a list of potential studies: (“PTSD” or “post-traumatic stress disorder” or “posttraumatic stress disorder” or “post traumatic stress disorder”) and (“veteran” or “veterans”) and (“exercise” or “aerobic” or “activity” or “physical activity”). The references of identified publications also were searched for additional studies. Then, study titles and abstracts were evaluated and finally, full texts were evaluated to determine study inclusion. All screening, study selection, and risk of bias and data extraction activities were performed by 2 independent reviewers (DR and MJ) with disagreements resolved through discussion and consensus (Figure 1). A list of studies excluded during full-text review and rationales can be viewed online (doi.org/10.6084/m9.figshare.c.5618437.v1).
Data Collection
Data were extracted from included studies using custom forms and included the following information based on PRISMA guidelines: (1) study design characteristics; (2) intervention details; and (3) PTSD outcome information.11 PTSD symptom severity was the primary outcome of interest. Outcome data were included if they were derived from a measure of PTSD symptoms—equivalency across measures was assumed for meta-analyses. Potential study bias for each outcome was evaluated using the ROBINS-I and Cochrane Collaboration’s RoB 2 tools for single-arm and multi-arm trials, respectively.13,14 These tools evaluate domains related to the design, conduct, and analysis of studies that are associated with bias (ie, systematic error in findings, such as under- or overestimation of results).10 Examples include how well authors performed and concealed randomization procedures, addressed missing data, and measured study outcomes.13,14 The risk of bias (eg, low, moderate, serious) associated with each domain is rated and, based on the domain ratings, each study is then given an overall rating regarding how much risk influences bias.13,14 Broadly, lower risk of bias corresponds to higher confidence in the validity of results.
Finally, 4 authors (associated with 2 single- and 2 multi-arm studies) were contacted and asked to provide further information. Data for 1 additional multi-arm study were obtained from these communications and included in the final study selection.15 These authors were also asked for information about any unpublished works of which they were aware, although no additional works were identified.
Statistical Analyses
Analyses were performed with R Studio R 3.6.0 software.16 An SMD (also known as Hedges g) was calculated for each study outcome: for single-arm trials, this was the SMD between pre- and postintervention scores, whereas for multi-arm trials, this was the SMD between postintervention outcome scores across groups. CIs for each SMD were calculated using a standard normal distribution. Combined SMDs were estimated separately for single- and multi-arm studies, using random-effects meta-analyses. In order to include multiple relevant outcomes from a single trial (ie, for studies using multiple PTSD symptom measures), robust variance estimation was used.17 Precision was used to weight SMDs.
Correlations between pre- and postintervention scores were not available for 1 single-arm study.18 A correlation coefficient of 0.8 was imputed to calculate the standard error of the of the SMDs for the Clinician-Administered PTSD Scale (CAPS) and the PTSD Checklist (PCL), as this value is consistent with past findings regarding the test-retest reliability of these measures.19-22 A sensitivity analysis, using several alternative correlational values, revealed that the choice of correlation coefficient did not impact the overall results of the meta-analysis.
I2 was used to evaluate between-study heterogeneity. Values of I2 > 25%, 50%, and 75% were selected to reflect low, moderate, and high heterogeneity, respectively, in accordance with guidelines described by Higgins and colleagues.23 Potential publication bias was assessed via funnel plot and Egger test.24 Finally, although collection of depressive symptom scores was proposed as a secondary outcome in the study protocol, such data were available only for 1 multi-arm study. As a result, this outcome was not evaluated.
Results
Six studies with 101 total participants were included in the single-arm analyses (Table 1).18,25-29 Participants consisted of veterans with chronic pain, post-9/11 veterans, female veterans of childbearing age, veterans with a history of trauma therapy, and other veterans. Types of exercise included moderate aerobic exercise and yoga. PTSD symptom measures included the CAPS and the PCL (PCL-5 or PCL-M versions). Reported financial sources for included studies included federal grant funding, nonprofit material support, outside organization support, use of US Department of Veterans Affairs (VA) resources, and no reported financial support.
With respect to individual studies, Shivakumar and colleagues found that completion of an aerobic exercise program was associated with reduced scores on 2 different PTSD symptom scales (PCL and CAPS) in 16 women veterans.18 A trauma-informed yoga intervention study with 18 participants by Cushing and colleagues demonstrated veteran participation to be associated with large reductions in PTSD, anxiety, and depression scale scores.25 In a study with 34 veterans, Chopin and colleagues found that a trauma-informed yoga intervention was associated with a statistically significant reduction in PTSD symptoms, as did a study by Zaccari and colleagues with 17 veterans.26,29 Justice and Brems also found some evidence that trauma-informed yoga interventions helped PTSD symptoms in a small sample of 4 veterans, although these results were not quantitatively analyzed.27 In contrast, a small pilot study (n = 12) by Staples and colleagues testing a biweekly, 6-week yoga program did not show a significant effect on PTSD symptoms.28
Three studies with 217 total veteran participants were included in the multi-arm analyses (Table 2).15,30,31 As all multi-arm trials incorporated randomization, they will be referred to as randomized controlled trials (RCTs). On contact, Davis and colleagues provided veteran-specific results for their trial; as such, our data differ from those within the published article.15 Participants from all included studies were veterans currently experiencing symptoms of PTSD. Types of exercise included yoga and combined methods (eg, aerobic and strength training).15,30,31 PTSD symptom measures included the CAPS or the PCL-5.15,30,31 Reported financial sources for included studies included federal grant funding, as well as nonprofit support, private donations, and VA and Department of Defense resources.
Davis and colleagues conducted a recently concluded RCT with > 130 veteran participants and found that a novel manualized yoga program was superior to an attention control in reducing PTSD symptom scale scores for veterans.15 Goldstein and colleagues found that a program consisting of both aerobic and resistance exercises reduced PTSD symptoms to a greater extent than a waitlist control condition, with 47 veterans randomized in this trial.30 Likewise, Hall and colleagues conducted a pilot RCT in which an intervention that integrated exercise and cognitive behavioral techniques was compared to a waitlist control condition.31 For the 48 veterans included in the analyses, the authors reported greater PTSD symptom reduction associated with integrated exercise than that of the control condition; however, the study was not powered to detect statistically significant differences between groups.
Bias Assessment
Results for the risk of bias assessments can be viewed in Tables 3 and 4. For single-arm studies, overall risk of bias was serious for all included trials. Serious risk of bias was found in 2 domains: confounding, due to a lack of accounting for potential preexisting baseline trends (eg, regression to the mean) that could have impacted study results; and measurement, due to the use of a self-report symptom measure (PCL) or CAPS with unblinded assessors. Multiple studies also showed moderate risk in the missing data domain due to participant dropout without appropriate analytic methods to address potential bias.
For RCTs, overall risk of bias ranged from some concerns to high risk. High risk of bias was found in 1 domain, measurement of outcome, due to use of a self-report symptom measure (PCL) with unblinded groups.31 The other 2 studies all had some concern of bias in at least 1 of the following domains: randomization, missing data, and measurement of outcome.
Pooled Standardized Mean Differences
Meta-analytic results can be viewed in Figure 2. The pooled SMD for the 6 single-arm studies was -0.60 (df = 4.41, 95% CI, -1.08 to -0.12, P = .03), indicating a statistically significant reduction in PTSD symptoms over the course of an exercise intervention. Combining SMDs for the 3 included RCTs revealed a pooled SMD of -0.40 (df = 1.57, 95% CI, -0.86 to 0.06, P = .06), indicating that exercise did not result in a statistically significant reduction in PTSD symptoms compared with control conditions.
Publication Bias and Heterogeneity
Visual inspection funnel plots and Egger test did not suggest the presence of publication bias for RCTs (t = 1.21, df = 2, P = .35) or single-arm studies (t = -0.36, df = 5, P = .73).
Single-arm studies displayed a high degree of heterogeneity (I2 = 81.5%). Including sample size or exercise duration as variables in meta-regressions did not reduce heterogeneity (I2 = 85.2% and I2 = 83.8%, respectively). Performing a subgroup analysis only on studies using yoga as an intervention also did not reduce heterogeneity (I2 = 79.2%). Due to the small number of studies, no further exploration of heterogeneity was conducted on single-arm studies. RCTs did not display any heterogeneity (I2 = 0%).
Discussion
Our report represents an early synthesis of the first prospective studies of physical exercise interventions for PTSD in veterans. Results from meta-analyses of 6 single-arm studies (101 participants) and 3 RCTs (217 participants) provide early evidence that exercise may reduce PTSD symptoms in veterans. Yoga was the most common form of exercise used in single-arm studies, whereas RCTs used a wider range of interventions. The pooled SMD of -0.60 for single-arm longitudinal studies suggest a medium decrease in PTSD symptoms for veterans who engage in exercise interventions. Analysis of the RCTs supported this finding, with a pooled SMD of -0.40 reflecting a small-to-medium effect of exercise on PTSD symptoms over control conditions, although this result did not achieve statistical significance. Of note, while the nonsignificant finding for RCTs may have been due to insufficient power caused by the limited number of included studies, possibly exercise was not more efficacious than were the control conditions.
Although RCTs represented a variety of exercise types, PTSD symptom measures, and veteran subgroups, statistical results were not indicative of heterogeneity. However, only the largest and most comprehensive study of exercise for PTSD in veterans to date by Davis and colleagues had a statistically significant SMD.15 Of note, one of the other 2 RCTs displayed an SMD of a similar magnitude, but this study had a much smaller sample size and was underpowered to detect significance.30 Additionally, risk of bias assessments for single-arm studies and RCTs revealed study characteristics that suggest possible inflation of absolute effect sizes for individual studies. Therefore, the pooled SMDs we report are interpretable but may exceed the true effect of exercise for PTSD symptom reduction in veterans.
Based on results of our analyses, it is reasonable, albeit preliminary, to conclude that exercise interventions may result in reduced PTSD symptoms among veterans. At the very least, these findings support the continued investigation of such interventions for veterans. Given the unique and salubrious characteristics of physical exercise, such results, if supported by further research, suggest that exercise-based interventions may be particularly valuable within the trauma treatment realm. For example, exercise can be less expensive and more convenient than attending traditional treatment, and for veterans reluctant to engage in standard treatment approaches such as psychiatric and psychosocial modalities, complementary approaches entailing exercise may be viewed as particularly acceptable or enjoyable.32 In addition to possibly reducing PTSD symptoms, exercise is a well-established treatment for conditions commonly comorbid with PTSD, including depression, anxiety disorders, cognitive difficulties, and certain chronic pain conditions.6 As such, exercise represents a holistic treatment option that has the potential to augment standard PTSD care.
Limitations
The present study has several important limitations. First, few studies were found that met the broad eligibility criteria and those that did often had a small sample size. Besides highlighting a gap in the extant research, the limited studies available for meta-analysis means that caution must be taken when interpreting results. Fortunately, this issue will likely resolve once additional studies investigating the impact of exercise on PTSD symptoms in veterans are available for synthesis.
Relatedly, the included study interventions varied considerably, both in the types of exercise used and the characteristics of the exercises (eg, frequency, duration, and intensity), which is relevant as different exercise modalities are associated with differential physical effects.33 Including such a mixture of exercises may have given an incomplete picture of their potential therapeutic effects. Also, none of the RCTs compared exercise against first-line treatments for PTSD, such as prolonged exposure or cognitive processing therapy, which would have provided further insight into the role exercise could play in clinical settings.7
Another limitation is the elevated risk of bias found in most studies, particularly present in the longitudinal single-arm studies, all of which were rated at serious risk. For instance, no single-arm study controlled for preexisting baseline trends: without such (and lacking a comparison control group like in RCTs), it is possible that the observed effects were due to extraneous factors, rather than the exercise intervention. Although not as severe, the multi-arm RCTs also displayed at least moderate risk of bias. Therefore, SMDs may have been overestimated for each group of studies.
Finally, the results of the single-arm meta-analysis displayed high statistical heterogeneity, reducing the generalizability of the results. One possible cause of this heterogeneity may have been the yoga interventions, as a separate analysis removing the only nonyoga study did not reduce heterogeneity. This result was surprising, as the included yoga interventions seemed similar across studies. While the presence of high heterogeneity does require some caution when applying these results to outside interventions, the present study made use of random-effects meta-analysis, a technique that incorporates study heterogeneity into the statistical model, thereby strengthening the findings compared with that of a traditional fixed-effects approach.10
Future Steps
Several future steps are warranted to improve knowledge of exercise as a treatment for PTSD in veterans and in the general population. With current meta-analyses limited to small numbers of studies, additional studies of the efficacy of exercise for treating PTSD could help in several ways. A larger pool of studies would enable future meta-analyses to explore related questions, such as those regarding the impact of exercise on quality of life or depressive symptom reduction among veterans with PTSD. A greater number of studies also would enable meta-analysts to explore potentially critical moderators. For example, the duration, frequency, or type of exercise may moderate the effect of exercise on PTSD symptom reduction. Moderators related to patient or study design characteristics also should be explored in future studies.
Future work also should evaluate the impact that specific features of exercise regimens have on PTSD. Knowing whether the type or structure of exercise affects its clinical use would be invaluable in developing and implementing efficient exercise-based interventions. For example, if facilitated exercise was found to be significantly more effective at reducing PTSD symptoms than exercise completed independently, the development of exercise intervention programs in the VA and other facilities that commonly treat PTSD may be warranted. Additionally, it may be useful to identify specific mechanisms through which exercise reduces PTSD symptoms. For example, in addition to its beneficial biological effects, exercise also promotes psychological health through behavioral activation and alterations within reinforcement/reward systems, suggesting that exercise regularity may be more important than intensity.34,35 Understanding which mechanisms contribute most to change will aid in the development of more efficient interventions.
Given that veterans are demonstrating considerable interest in complementary and alternative PTSD treatments, it is critical that researchers focus on high-quality randomized tests of these interventions. Therefore, in addition to greater quality of exercise intervention studies, future efforts should be focused on RCTs that are designed in such a way as to limit potential introduction of bias. For example, assessment data should be completed by blinded assessors using standardized measures, and analyses should account for missing data and unequal participant attrition between groups. Ideally, pre-intervention trends across multiple baseline datapoints also would be collected in single-arm studies to avoid confounding related to regression to the mean. It is also recommended that future meta-analyses use risk of bias assessments and consider how the results of such assessments may impact the interpretation of results.
Conclusions
Findings from both single-arm studies and RCTs suggest possible benefit of exercise on PTSD symptom reduction, although confirmation of findings is needed. No study found increased symptoms following exercise intervention. Thus, it is reasonable to consider physical exercise, such as yoga, as an adjunct, whole-health consistent treatment. HCPs working with veterans with past traumatic experiences should consider incorporating exercise into patient care. Enhanced educational efforts emphasizing the psychotherapeutic impact of exercise may also have value for the veteran population. Furthermore, the current risk of bias assessments highlights the need for additional high-quality RCTs evaluating the specific impact of exercise on PTSD symptom reduction in veterans. In particular, this field of inquiry would benefit from larger samples and design characteristics to reduce bias (eg, blinding when possible, use of CAPS vs only self-report symptom measures, reducing problematic attrition, corrections for missing data, etc).
Acknowledgments
This research is the result of work supported with resources and the use of facilities at the VA Eastern Kansas Healthcare System (Dwight D. Eisenhower VA Medical Center). It was also supported by the Department of Veterans Affairs Office of Academic Affiliations Advanced Fellowship Program in Mental Illness Research and Treatment, as well as the Rocky Mountain Mental Illness Research, Education, and Clinical Center. Since Dr. Reis and Dr. Gaddy are employees of the US Government and contributed to this manuscript as part of their official duties, the work is not subject to US copyright. This study was preregistered on PROSPERO (https://www.crd.york.ac.uk/prospero/; ID: CRD42020153419).
1. Reiner M, Niermann C, Jekauc D, Woll A. Long-term health benefits of physical activity—a systematic review of longitudinal studies. BMC Public Health. 2013;13:813. doi:10.1186/1471-2458-13-813
2. Walsh R. Lifestyle and mental health. Am Psychol. 2011;66(7):579-592. doi:10.1037/a0021769
3. Rosenbaum S, Vancampfort D, Steel Z, Newby J, Ward PB, Stubbs B. Physical activity in the treatment of posttraumatic stress disorder: a systematic review and meta-analysis. Psychiatry Res. 2015;230(2):130-136. doi:10.1016/j.psychres.2015.10.017
4. Watts BV, Schnurr PP, Mayo L, Young-Xu Y, Weeks WB, Friedman MJ. Meta-analysis of the efficacy of treatments for posttraumatic stress disorder. J Clin Psychiatry. 2013;74(6):e541-550. doi:10.4088/JCP.12r08225
5. Tanielian T, Jaycox L, eds. Invisible Wounds of War: Psychological and Cognitive Injuries, Their Consequences, and Services to Assist Recovery. RAND Corporation; 2008
6. Whitworth JW, Ciccolo JT. Exercise and post-traumatic stress disorder in military veterans: a systematic review. Mil Med. 2016;181(9):953-960. doi:10.7205/MILMED-D-15-00488
7. Rutt BT, Oehlert ME, Krieshok TS, Lichtenberg JW. Effectiveness of cognitive processing therapy and prolonged exposure in the Department of Veterans Affairs. Psychol Rep. 2018;121(2):282-302. doi:10.1177/0033294117727746
8. Clarke TC, Black LI, Stussman BJ, Barnes PM, Nahin RL. Trends in the use of complementary health approaches among adults: United States, 2002-2012. Natl Health Stat Report. 2015(79):1-16.
9. Baldwin CM, Long K, Kroesen K, Brooks AJ, Bell IR. A profile of military veterans in the southwestern United States who use complementary and alternative medicine: Implications for integrated care. Arch Intern Med. 2002;162(15):1697-1704. doi:10.1001/archinte.162.15.1697
10. Higgins JPT, Thomas J, Chanlder J, et al, eds. Cochrane Handbook for Systematic Reviews of Interventions. Version 6.2 (updated February 2021). Cochrane; 2021.
11. Liberati A, Altman DG, Tetzlaff J, et al. The PRISMA statement for reporting systematic reviews and meta-analyses of studies that evaluate health care interventions: explanation and elaboration. PLoS Med. 2009;6(7):e1000100. doi:10.1371/journal.pmed.1000100
12. Caspersen CJ, Powell KE, Christenson GM. Physical activity, exercise, and physical fitness: definitions and distinctions for health-related research. Public Health Rep. 1985;100(2):126-131.
13. Sterne JAC, Hernán MA, Reeves BC, et al. ROBINS-I: a tool for assessing risk of bias in non-randomised studies of interventions. BMJ. 2016;355:i4919. doi:10.1136/bmj.i4919
14. Sterne JAC, Savovic´ J, Page MJ, et al. RoB 2: a revised tool for assessing risk of bias in randomised trials. BMJ. 2019;366:l4898. doi:10.1136/bmj.l4898
15. Davis LW, Schmid AA, Daggy JK, et al. Symptoms improve after a yoga program designed for PTSD in a randomized controlled trial with veterans and civilians. Psychol Trauma. 2020;12(8):904-912. doi:10.1037/tra0000564
16. R Core Team. R: a language and environment for statistical computing. R Foundation for Statistical Computing; 2019.
17. Tipton E. Small sample adjustments for robust variance estimation with meta-regression. Psychol Methods .2015;20(3):375-393. doi:10.1037/met0000011
18. Shivakumar G, Anderson EH, Surís AM, North CS. Exercise for PTSD in women veterans: a proof-of-concept study. Mil Med. 2017;182(11):e1809-e1814. doi:10.7205/MILMED-D-16-00440
19. Blake DD, Weathers FW, Nagy LM, et al. The development of a Clinician-Administered PTSD Scale. J Trauma Stress. 1995;8(1):75-90. doi:10.1007/BF02105408
20. Blanchard EB, Jones-Alexander J, Buckley TC, Forneris CA. Psychometric properties of the PTSD Checklist (PCL). Behav Res Ther. 1996;34(8):669-673. doi:10.1016/0005-7967(96)00033-2
21. Weathers FW, Bovin MJ, Lee DJ, et al. The Clinician- Administered PTSD Scale for DSM-5 (CAPS- 5): Development and initial psychometric evaluation in military veterans. Psychol Assess. 2018;30(3):383-395.doi:10.1037/pas0000486
22. Wilkins KC, Lang AJ, Norman SB. Synthesis of the psychometric properties of the PTSD checklist (PCL) military, civilian, and specific versions. Depress Anxiety. 2011;28(7):596-606. doi:10.1002/da.20837
23. Higgins JP, Thompson SG, Deeks JJ, Altman DG. Measuring inconsistency in meta-analyses. BMJ. 2003;327(7414):557-560. doi:10.1136/bmj.327.7414.557
24. Egger M, Davey Smith G, Schneider M, Minder C. Bias in meta-analysis detected by a simple, graphical test. BMJ. 1997;315(7109):629-634. doi:10.1136/bmj.315.7109.629
25. Cushing RE, Braun KL, Alden CISW, Katz AR. Military- tailored yoga for veterans with post-traumatic stress disorder. Mil Med. 2018;183(5-6):e223-e231. doi:10.1093/milmed/usx071
26. Chopin SM, Sheerin CM, Meyer BL. Yoga for warriors: An intervention for veterans with comorbid chronic pain and PTSD. Psychol Trauma. 2020;12(8):888-896. doi:10.1037/tra0000649
27. Justice L, Brems C. Bridging body and mind: case series of a 10-week trauma-informed yoga protocol for veterans. Int J Yoga Therap. 2019;29(1):65-79. doi:10.17761/D-17-2019-00029
28. Staples JK, Hamilton MF, Uddo M. A yoga program for the symptoms of post-traumatic stress disorder in veterans. Mil Med. 2013;178(8):854-860. doi:10.7205/MILMED-D-12-00536
29. Zaccari B, Callahan ML, Storzbach D, McFarlane N, Hudson R, Loftis JM. Yoga for veterans with PTSD: Cognitive functioning, mental health, and salivary cortisol. Psychol Trauma. 2020;12(8):913-917. doi:10.1037/tra0000909
30. Goldstein LA, Mehling WE, Metzler TJ, et al. Veterans Group Exercise: A randomized pilot trial of an Integrative Exercise program for veterans with posttraumatic stress. J Affect Disord. 2018;227:345-352. doi:10.1016/j.jad.2017.11.002
31. Hall KS, Morey MC, Bosworth HB, et al. Pilot randomized controlled trial of exercise training for older veterans with PTSD. J Behav Med. 2020;43(4):648-659. doi:10.1007/s10865-019-00073-w
32. Gaddy MA. Implementation of an integrative medicine treatment program at a Veterans Health Administration residential mental health facility. Psychol Serv. 2018;15(4):503- 509. doi:10.1037/ser0000189
33. Werner CM, Hecksteden A, Morsch A, et al. Differential effects of endurance, interval, and resistance training on telomerase activity and telomere length in a randomized, controlled study. Eur Heart J. 2019;40(1):34- 46. doi:10.1093/eurheartj/ehy585
34. Silverman MN, Deuster PA. Biological mechanisms underlying the role of physical fitness in health and resilience. Interface Focus. 2014;4(5):20140040. doi:10.1098/rsfs.2014.0040
35. Smith PJ, Merwin RM. The role of exercise in management of mental health disorders: an integrative review. Annu Rev Med. 2021;72:45-62. doi:10.1146/annurev-med-060619-022943.
Review of Ethnoracial Representation in Clinical Trials (Phases 1 Through 4) of Atopic Dermatitis Therapies
To the Editor:
Atopic dermatitis (AD) affects an estimated 7.2% of adults and 10.7% of children in the United States; however, AD might affect different races at a varying rate.1 Compared to their European American counterparts, Asian/Pacific Islanders and African Americans are 7 and 3 times more likely, respectively, to be given a diagnosis of AD.2
Despite being disproportionately affected by AD, minority groups might be underrepresented in clinical trials of AD treatments.3 One explanation for this imbalance might be that ethnoracial representation differs across regions in the United States, perhaps in regions where clinical trials are conducted. Price et al3 investigated racial representation in clinical trials of AD globally and found that patients of color are consistently underrepresented.
Research on racial representation in clinical trials within the United States—on national and regional scales—is lacking from the current AD literature. We conducted a study to compare racial and ethnic disparities in AD clinical trials across regions of the United States.
Using the ClinicalTrials.gov database (www.clinicaltrials.gov) of the National Library of Medicine, we identified clinical trials of AD treatments (encompassing phases 1 through 4) in the United States that were completed before March 14, 2021, with the earliest data from 2013. Search terms included atopic dermatitis, with an advanced search for interventional (clinical trials) and with results.
In total, 95 completed clinical trials were identified, of which 26 (27.4%) reported ethnoracial demographic data. One trial was excluded due to misrepresentation regarding the classification of individuals who identified as more than 1 racial category. Clinical trials for systemic treatments (7 [28%]) and topical treatments (18 [72%]) were identified.
All ethnoracial data were self-reported by trial participants based on US Food and Drug Administration guidelines for racial and ethnic categorization.4 Trial participants who identified ethnically as Hispanic or Latino might have been a part of any racial group. Only 7 of the 25 included clinical trials (28%) provided ethnic demographic data (Hispanic [Latino] or non-Hispanic); 72% of trials failed to report ethnicity. Ethnic data included in our analysis came from only the 7 clinical trials that included these data. International multicenter trials that included a US site were excluded.
Ultimately, the number of trials included in our analysis was 25, comprised of 2443 participants. Data were further organized by US geographic region (Northeast, Midwest, South, West, and multiregion trials [ie, conducted in ≥2 regions]). No AD clinical trials were conducted solely in the Midwest; it was only included within multiregion trials.
Compared to their representation in the 2019 US Census, most minority groups were overrepresented in clinical trials, while White individuals were underrepresented (eTable). The percentages of our findings on representation for race are as follows (US Census data are listed in parentheses for comparison5):
- White: 56.8% (72.5%)
- Black/African American: 28.3% (12.7%)
- Asian: 10.3% (5.5%)
- Multiracial: 1.1% (3.3%)
- Native Hawaiian or other Pacific Islander: 0.3% (0.2%)
- American Indian or Alaska Native: 0.2% (0.8%)
- Other: 0.5% (4.9%).
 of Atopic Dermatitis Therapies")
Our findings on representation for ethnicity are as follows (US Census data is listed in parentheses for comparison5):
- Hispanic or Latino: 21.4% (18.0%)
Although representation of Black/African American and Asian participants in clinical trials was higher than their representation in US Census data and representation of White participants was lower in clinical trials than their representation in census data, equal representation among all racial and ethnic groups is still lacking. A potential explanation for this finding might be that requirements for trial inclusion selected for more minority patients, given the propensity for greater severity of AD among those racial groups.2 Another explanation might be that efforts to include minority patients in clinical trials are improving.
There were great differences in ethnoracial representation in clinical trials when regions within the United States were compared. Based on census population data by region, the West had the highest percentage (29.9%) of Hispanic or Latino residents; however, this group represented only 11.7% of participants in AD clinical trials in that region.5
The South had the greatest number of participants in AD clinical trials of any region, which was consistent with research findings on an association between severity of AD and heat.6 With a warmer climate correlating with an increased incidence of AD, it is possible that more people are willing to participate in clinical trials in the South.
The Midwest was the only region in which region-specific clinical trials were not conducted. Recent studies have shown that individuals with AD who live in the Midwest have comparatively less access to health care associated with AD treatment and are more likely to visit an emergency department because of AD than individuals in any other US region.7 This discrepancy highlights the need for increased access to resources and clinical trials focused on the treatment of AD in the Midwest.
In 1993, the National Institutes of Health Revitalization Act established a federal legislative mandate to encourage inclusion of women and people of color in clinical trials.8 During the last 2 decades, there have been improvements in ethnoracial reporting. A 2020 global study found that 81.1% of randomized controlled trials (phases 2 and 3) of AD treatments reported ethnoracial data.3
Equal representation in clinical trials allows for further investigation of the connection between race, AD severity, and treatment efficacy. Clinical trials need to have equal representation of ethnoracial categories across all regions of the United States. If one group is notably overrepresented, ethnoracial associations related to the treatment of AD might go undetected.9 Similarly, if representation is unequal, relationships of treatment efficacy within ethnoracial groups also might go undetected. None of the clinical trials that we analyzed investigated treatment efficacy by race, suggesting that there is a need for future research in this area.
It also is important to note that broad classifications of race and ethnicity are limiting and therefore overlook differences within ethnoracial categories. Although representation of minority patients in clinical trials for AD treatments is improving, we conclude that there remains a need for greater and equal representation of minority groups in clinical trials of AD treatments in the United States.
- Avena-Woods C. Overview of atopic dermatitis. Am J Manag Care. 2017;23(8 suppl):S115-S123.
- Kaufman BP, Guttman‐Yassky E, Alexis AF. Atopic dermatitis in diverse racial and ethnic groups—variations in epidemiology, genetics, clinical presentation and treatment. Exp Dermatol. 2018;27:340-357. doi:10.1111/exd.13514
- Price KN, Krase JM, Loh TY, et al. Racial and ethnic disparities in global atopic dermatitis clinical trials. Br J Dermatol. 2020;183:378-380. doi:10.1111/bjd.18938
- Collection of race and ethnicity data in clinical trials: guidance for industry and Food and Drug Administration staff. US Food and Drug Administration; October 26, 2016. Accessed February 20, 2022. https://www.fda.gov/media/75453/download
- United States Census Bureau. 2019 Population estimates by age, sex, race and Hispanic origin. Published June 25, 2020. Accessed March 22, 2022. https://www.census.gov/newsroom/press-kits/2020/population-estimates-detailed.html
- Fleischer AB Jr. Atopic dermatitis: the relationship to temperature and seasonality in the United States. Int J Dermatol. 2019;58:465-471. doi:10.1111/ijd.14289
- Wu KK, Nguyen KB, Sandhu JK, et al. Does location matter? geographic variations in healthcare resource use for atopic dermatitis in the United States. J Dermatolog Treat. 2021;32:314-320. doi:10.1080/09546634.2019.1656796
- National Institutes of Health Revitalization Act of 1993, 42 USC 201 (1993). Accessed February 20, 2022. https://www.govinfo.gov/content/pkg/STATUTE-107/pdf/STATUTE-107-Pg122.pdf
- Hirano SA, Murray SB, Harvey VM. Reporting, representation, and subgroup analysis of race and ethnicity in published clinical trials of atopic dermatitis in the United States between 2000 and 2009. Pediatr Dermatol. 2012;29:749-755. doi:10.1111/j.1525-1470.2012.01797.x
To the Editor:
Atopic dermatitis (AD) affects an estimated 7.2% of adults and 10.7% of children in the United States; however, AD might affect different races at a varying rate.1 Compared to their European American counterparts, Asian/Pacific Islanders and African Americans are 7 and 3 times more likely, respectively, to be given a diagnosis of AD.2
Despite being disproportionately affected by AD, minority groups might be underrepresented in clinical trials of AD treatments.3 One explanation for this imbalance might be that ethnoracial representation differs across regions in the United States, perhaps in regions where clinical trials are conducted. Price et al3 investigated racial representation in clinical trials of AD globally and found that patients of color are consistently underrepresented.
Research on racial representation in clinical trials within the United States—on national and regional scales—is lacking from the current AD literature. We conducted a study to compare racial and ethnic disparities in AD clinical trials across regions of the United States.
Using the ClinicalTrials.gov database (www.clinicaltrials.gov) of the National Library of Medicine, we identified clinical trials of AD treatments (encompassing phases 1 through 4) in the United States that were completed before March 14, 2021, with the earliest data from 2013. Search terms included atopic dermatitis, with an advanced search for interventional (clinical trials) and with results.
In total, 95 completed clinical trials were identified, of which 26 (27.4%) reported ethnoracial demographic data. One trial was excluded due to misrepresentation regarding the classification of individuals who identified as more than 1 racial category. Clinical trials for systemic treatments (7 [28%]) and topical treatments (18 [72%]) were identified.
All ethnoracial data were self-reported by trial participants based on US Food and Drug Administration guidelines for racial and ethnic categorization.4 Trial participants who identified ethnically as Hispanic or Latino might have been a part of any racial group. Only 7 of the 25 included clinical trials (28%) provided ethnic demographic data (Hispanic [Latino] or non-Hispanic); 72% of trials failed to report ethnicity. Ethnic data included in our analysis came from only the 7 clinical trials that included these data. International multicenter trials that included a US site were excluded.
Ultimately, the number of trials included in our analysis was 25, comprised of 2443 participants. Data were further organized by US geographic region (Northeast, Midwest, South, West, and multiregion trials [ie, conducted in ≥2 regions]). No AD clinical trials were conducted solely in the Midwest; it was only included within multiregion trials.
Compared to their representation in the 2019 US Census, most minority groups were overrepresented in clinical trials, while White individuals were underrepresented (eTable). The percentages of our findings on representation for race are as follows (US Census data are listed in parentheses for comparison5):
- White: 56.8% (72.5%)
- Black/African American: 28.3% (12.7%)
- Asian: 10.3% (5.5%)
- Multiracial: 1.1% (3.3%)
- Native Hawaiian or other Pacific Islander: 0.3% (0.2%)
- American Indian or Alaska Native: 0.2% (0.8%)
- Other: 0.5% (4.9%).
Our findings on representation for ethnicity are as follows (US Census data is listed in parentheses for comparison5):
- Hispanic or Latino: 21.4% (18.0%)
Although representation of Black/African American and Asian participants in clinical trials was higher than their representation in US Census data and representation of White participants was lower in clinical trials than their representation in census data, equal representation among all racial and ethnic groups is still lacking. A potential explanation for this finding might be that requirements for trial inclusion selected for more minority patients, given the propensity for greater severity of AD among those racial groups.2 Another explanation might be that efforts to include minority patients in clinical trials are improving.
There were great differences in ethnoracial representation in clinical trials when regions within the United States were compared. Based on census population data by region, the West had the highest percentage (29.9%) of Hispanic or Latino residents; however, this group represented only 11.7% of participants in AD clinical trials in that region.5
The South had the greatest number of participants in AD clinical trials of any region, which was consistent with research findings on an association between severity of AD and heat.6 With a warmer climate correlating with an increased incidence of AD, it is possible that more people are willing to participate in clinical trials in the South.
The Midwest was the only region in which region-specific clinical trials were not conducted. Recent studies have shown that individuals with AD who live in the Midwest have comparatively less access to health care associated with AD treatment and are more likely to visit an emergency department because of AD than individuals in any other US region.7 This discrepancy highlights the need for increased access to resources and clinical trials focused on the treatment of AD in the Midwest.
In 1993, the National Institutes of Health Revitalization Act established a federal legislative mandate to encourage inclusion of women and people of color in clinical trials.8 During the last 2 decades, there have been improvements in ethnoracial reporting. A 2020 global study found that 81.1% of randomized controlled trials (phases 2 and 3) of AD treatments reported ethnoracial data.3
Equal representation in clinical trials allows for further investigation of the connection between race, AD severity, and treatment efficacy. Clinical trials need to have equal representation of ethnoracial categories across all regions of the United States. If one group is notably overrepresented, ethnoracial associations related to the treatment of AD might go undetected.9 Similarly, if representation is unequal, relationships of treatment efficacy within ethnoracial groups also might go undetected. None of the clinical trials that we analyzed investigated treatment efficacy by race, suggesting that there is a need for future research in this area.
It also is important to note that broad classifications of race and ethnicity are limiting and therefore overlook differences within ethnoracial categories. Although representation of minority patients in clinical trials for AD treatments is improving, we conclude that there remains a need for greater and equal representation of minority groups in clinical trials of AD treatments in the United States.
- Avena-Woods C. Overview of atopic dermatitis. Am J Manag Care. 2017;23(8 suppl):S115-S123.
- Kaufman BP, Guttman‐Yassky E, Alexis AF. Atopic dermatitis in diverse racial and ethnic groups—variations in epidemiology, genetics, clinical presentation and treatment. Exp Dermatol. 2018;27:340-357. doi:10.1111/exd.13514
- Price KN, Krase JM, Loh TY, et al. Racial and ethnic disparities in global atopic dermatitis clinical trials. Br J Dermatol. 2020;183:378-380. doi:10.1111/bjd.18938
- Collection of race and ethnicity data in clinical trials: guidance for industry and Food and Drug Administration staff. US Food and Drug Administration; October 26, 2016. Accessed February 20, 2022. https://www.fda.gov/media/75453/download
- United States Census Bureau. 2019 Population estimates by age, sex, race and Hispanic origin. Published June 25, 2020. Accessed March 22, 2022. https://www.census.gov/newsroom/press-kits/2020/population-estimates-detailed.html
- Fleischer AB Jr. Atopic dermatitis: the relationship to temperature and seasonality in the United States. Int J Dermatol. 2019;58:465-471. doi:10.1111/ijd.14289
- Wu KK, Nguyen KB, Sandhu JK, et al. Does location matter? geographic variations in healthcare resource use for atopic dermatitis in the United States. J Dermatolog Treat. 2021;32:314-320. doi:10.1080/09546634.2019.1656796
- National Institutes of Health Revitalization Act of 1993, 42 USC 201 (1993). Accessed February 20, 2022. https://www.govinfo.gov/content/pkg/STATUTE-107/pdf/STATUTE-107-Pg122.pdf
- Hirano SA, Murray SB, Harvey VM. Reporting, representation, and subgroup analysis of race and ethnicity in published clinical trials of atopic dermatitis in the United States between 2000 and 2009. Pediatr Dermatol. 2012;29:749-755. doi:10.1111/j.1525-1470.2012.01797.x
Practice Points
- Although minority groups are disproportionally affected by atopic dermatitis (AD), they may be underrepresented in clinical trials for AD in the United States.
- Equal representation among ethnoracial groups in clinical trials is important to allow for a more thorough investigation of the efficacy of treatments for AD.
When Are Inpatient and Emergency Dermatologic Consultations Appropriate?
There are limited clinical data concerning inpatient and emergency department (ED) dermatologic consultations. The indications for these consultations vary widely, but in one study (N=271), it was found that 21% of inpatient consultations were for contact dermatitis and 10% were for drug eruptions.1 In the same study, 77% of patients who required a dermatology consultation eventually were given a different diagnosis or change in treatment after consultation. For example, of all consultations for suspected cellulitis, only 10% were confirmed after dermatology evaluation.1
Hospitalists and emergency physicians continue to struggle with the assessment of dermatologic conditions, often consulting dermatology whenever a patient has a “rash” or skin concern. Dermatology is still not emphasized in medical education and often is taught to most medical students in an abbreviated fashion, which results in physicians feeling ill-equipped to deal with any dermatologic condition—either mundane or potentially life-threatening. A study in 2016 showed that a monthly lecture series given to hospitalists over the course of 5 years did not improve diagnostic accuracy in patients who were admitted with skin manifestations.2 This further shows that there is a need for dermatologic experts in the hospital.
We need to develop better guidelines for physicians in the ED and on inpatient units to guide them on appropriate use of dermatologic consultation outside the ambulatory office and the clinic. A 2013 study showed that patients often were discharged immediately after a dermatologic consultation, furthering our hypothesis that many inpatient consultations can be delayed until after discharge.3
In an era in which medical costs are soaring and there is constant surveillance for ways to reduce costs without impairing quality of care, limiting unnecessary specialty consultations should be embraced. In 2009, $1.8 billion in Medicare claims was paid for dermatology-related admissions.3 A substantial savings to Medicare consulting fees for certain diagnoses, such as cellulitis or contact dermatitis, could be realized if patients were referred for outpatient assessment and treatment. In a study of 271 consultations, 54 patients also had a skin biopsy, which further increases dollars spent on inpatient care and is (usually) something that can be performed in the outpatient setting.1 In another study, the more common recommended treatments were topical corticosteroids and supportive educational measures for patients and hospital staff,3 which further substantiates that most dermatology consultations are not truly emergent and can wait for outpatient consultation.
In addition, we are dealing with the COVID-19 pandemic in our hospitals and EDs. Many physicians, including dermatologists, would prefer to avoid unnecessary exposure to SARS-CoV-2 on inpatient units and in the ED. It certainly would be preferable to require consultants to come in to evaluate patients only when they truly need to be seen while in the hospital.
There also is limited dermatology training in other specialties, and the dermatology team can help fill this gap with educational programs and one-on-one teaching. Hospital teams have signaled this need, but there has been limited success with multiple teaching opportunities.4
We believe that this need for inpatient dermatology services can be filled with the newer subspecialty of hospital dermatology, which is not commonly present at most hospitals; a reason why the subspecialty has not been more popular is that there are few available data in the form of randomized clinical trials that can guide inpatient dermatologists with the care of rare hospital skin diseases.5 Having a dermatologic hospitalist available might allow for patients to be seen more readily, which ultimately will save lives and health care dollars and would increase real-time teaching and education for house staff, nursing, and attendings at the bedside.
In a 2018 article,6 it was postulated that quicker diagnosis of pseudocellulitis and initiation of antibiotics to treat this condition would save the US health care system $210 million annually. We believe that pseudocellulitis would be best evaluated by inpatient dermatology teams, thereby avoiding costly dermatologic consultations, at an average rate of $138.89.6
Morbilliform drug eruptions are among the most common skin conditions seen in the hospital; approximately 95% of cases are an uncomplicated reaction to a medication or virus. Data show that many of these consultations might be unnecessary.7
Our institution (Hackensack University Medical Center, New Jersey) is a tertiary hospital that also is connected with a major cancer center. Given this connection, skin eruptions due to chemotherapy and radiation are common. The treatment of drug eruptions, graft-vs-host disease, and other oncologic or drug-related eruptions should be within the scope of practice of our hospitalists, but these cases frequently involve dermatologic consultation.
We constructed a consultation flowchart (Figure) to help guide the triage of patients in need of dermatologic evaluation by inpatient teams and possibly to avoid unnecessary consultation fees. The manner in which this—or any flowchart or teaching aid—is conveyed to hospital personnel is critical so that these tools are not perceived as patronizing or confrontational. In our flowchart, we list emergent dermatologic conditions that we believe are appropriate for dermatology consultation including erythrodermic psoriasis, bullous pemphigoid flare, and Stevens-Johnson syndrome/toxic epidermal necrolysis.

We believe that the flowchart can educate inpatient medical teams about appropriate dermatology consultation. Use of the flowchart also may decrease unnecessary consultations, which ultimately will lower health care spending overall.
- Davila M, Christenson LJ, Sontheimer RD. Epidemiology and outcomes of dermatology in-patient consultations in a Midwestern U.S. university hospital. Dermatol Online J. 2010;16:12.
- Beshay A, Liu M, Fox L, et al. Inpatient dermatology consultative programs: a continued need, tools for needs assessment for curriculum development, and a call for new methods of teaching. J Am Acad Dermatol. 2016;74:769-771. doi:10.1016/j.jaad.2015.11.017
- Hu L, Haynes H, Ferrazza D, et al. Impact of specialist consultations on inpatient admissions for dermatology-specific and related DRGs. J Gen Intern Med. 2013;28:1477-1482. doi:10.1007/s11606-013-2440-2
- Faletsky A, Han JJ, Mostaghimi A. Inpatient dermatology best practice strategies for educating and relaying findings to colleagues. Curr Dermatol Rep. 2020;9:256-260. doi:10.1007/s13671-020-00317-y
- Fox LP. Hospital dermatology, introduction. Semin Cutan Med Surg. 2017;36:1-2. doi:10.12788/j.sder.2017.015
- Li D, Xia FD, Khosravi H, et al. Outcomes of early dermatology consultation for inpatients diagnosed with cellulitis. JAMA Dermatol. 2018;154:537-543. doi:10.1001/jamadermatol.2017.6197
- Biesbroeck LK, Shinohara MM. Inpatient consultative dermatology. Med Clin North Am. 2015;99:1349-1364. doi:10.1016/j.mcna.2015.06.004
There are limited clinical data concerning inpatient and emergency department (ED) dermatologic consultations. The indications for these consultations vary widely, but in one study (N=271), it was found that 21% of inpatient consultations were for contact dermatitis and 10% were for drug eruptions.1 In the same study, 77% of patients who required a dermatology consultation eventually were given a different diagnosis or change in treatment after consultation. For example, of all consultations for suspected cellulitis, only 10% were confirmed after dermatology evaluation.1
Hospitalists and emergency physicians continue to struggle with the assessment of dermatologic conditions, often consulting dermatology whenever a patient has a “rash” or skin concern. Dermatology is still not emphasized in medical education and often is taught to most medical students in an abbreviated fashion, which results in physicians feeling ill-equipped to deal with any dermatologic condition—either mundane or potentially life-threatening. A study in 2016 showed that a monthly lecture series given to hospitalists over the course of 5 years did not improve diagnostic accuracy in patients who were admitted with skin manifestations.2 This further shows that there is a need for dermatologic experts in the hospital.
We need to develop better guidelines for physicians in the ED and on inpatient units to guide them on appropriate use of dermatologic consultation outside the ambulatory office and the clinic. A 2013 study showed that patients often were discharged immediately after a dermatologic consultation, furthering our hypothesis that many inpatient consultations can be delayed until after discharge.3
In an era in which medical costs are soaring and there is constant surveillance for ways to reduce costs without impairing quality of care, limiting unnecessary specialty consultations should be embraced. In 2009, $1.8 billion in Medicare claims was paid for dermatology-related admissions.3 A substantial savings to Medicare consulting fees for certain diagnoses, such as cellulitis or contact dermatitis, could be realized if patients were referred for outpatient assessment and treatment. In a study of 271 consultations, 54 patients also had a skin biopsy, which further increases dollars spent on inpatient care and is (usually) something that can be performed in the outpatient setting.1 In another study, the more common recommended treatments were topical corticosteroids and supportive educational measures for patients and hospital staff,3 which further substantiates that most dermatology consultations are not truly emergent and can wait for outpatient consultation.
In addition, we are dealing with the COVID-19 pandemic in our hospitals and EDs. Many physicians, including dermatologists, would prefer to avoid unnecessary exposure to SARS-CoV-2 on inpatient units and in the ED. It certainly would be preferable to require consultants to come in to evaluate patients only when they truly need to be seen while in the hospital.
There also is limited dermatology training in other specialties, and the dermatology team can help fill this gap with educational programs and one-on-one teaching. Hospital teams have signaled this need, but there has been limited success with multiple teaching opportunities.4
We believe that this need for inpatient dermatology services can be filled with the newer subspecialty of hospital dermatology, which is not commonly present at most hospitals; a reason why the subspecialty has not been more popular is that there are few available data in the form of randomized clinical trials that can guide inpatient dermatologists with the care of rare hospital skin diseases.5 Having a dermatologic hospitalist available might allow for patients to be seen more readily, which ultimately will save lives and health care dollars and would increase real-time teaching and education for house staff, nursing, and attendings at the bedside.
In a 2018 article,6 it was postulated that quicker diagnosis of pseudocellulitis and initiation of antibiotics to treat this condition would save the US health care system $210 million annually. We believe that pseudocellulitis would be best evaluated by inpatient dermatology teams, thereby avoiding costly dermatologic consultations, at an average rate of $138.89.6
Morbilliform drug eruptions are among the most common skin conditions seen in the hospital; approximately 95% of cases are an uncomplicated reaction to a medication or virus. Data show that many of these consultations might be unnecessary.7
Our institution (Hackensack University Medical Center, New Jersey) is a tertiary hospital that also is connected with a major cancer center. Given this connection, skin eruptions due to chemotherapy and radiation are common. The treatment of drug eruptions, graft-vs-host disease, and other oncologic or drug-related eruptions should be within the scope of practice of our hospitalists, but these cases frequently involve dermatologic consultation.
We constructed a consultation flowchart (Figure) to help guide the triage of patients in need of dermatologic evaluation by inpatient teams and possibly to avoid unnecessary consultation fees. The manner in which this—or any flowchart or teaching aid—is conveyed to hospital personnel is critical so that these tools are not perceived as patronizing or confrontational. In our flowchart, we list emergent dermatologic conditions that we believe are appropriate for dermatology consultation including erythrodermic psoriasis, bullous pemphigoid flare, and Stevens-Johnson syndrome/toxic epidermal necrolysis.
We believe that the flowchart can educate inpatient medical teams about appropriate dermatology consultation. Use of the flowchart also may decrease unnecessary consultations, which ultimately will lower health care spending overall.
- Davila M, Christenson LJ, Sontheimer RD. Epidemiology and outcomes of dermatology in-patient consultations in a Midwestern U.S. university hospital. Dermatol Online J. 2010;16:12.
- Beshay A, Liu M, Fox L, et al. Inpatient dermatology consultative programs: a continued need, tools for needs assessment for curriculum development, and a call for new methods of teaching. J Am Acad Dermatol. 2016;74:769-771. doi:10.1016/j.jaad.2015.11.017
- Hu L, Haynes H, Ferrazza D, et al. Impact of specialist consultations on inpatient admissions for dermatology-specific and related DRGs. J Gen Intern Med. 2013;28:1477-1482. doi:10.1007/s11606-013-2440-2
- Faletsky A, Han JJ, Mostaghimi A. Inpatient dermatology best practice strategies for educating and relaying findings to colleagues. Curr Dermatol Rep. 2020;9:256-260. doi:10.1007/s13671-020-00317-y
- Fox LP. Hospital dermatology, introduction. Semin Cutan Med Surg. 2017;36:1-2. doi:10.12788/j.sder.2017.015
- Li D, Xia FD, Khosravi H, et al. Outcomes of early dermatology consultation for inpatients diagnosed with cellulitis. JAMA Dermatol. 2018;154:537-543. doi:10.1001/jamadermatol.2017.6197
- Biesbroeck LK, Shinohara MM. Inpatient consultative dermatology. Med Clin North Am. 2015;99:1349-1364. doi:10.1016/j.mcna.2015.06.004
Practice Points
- Primary inpatient teams should call patients’ insurance companies to verify in-network dermatologists for eventual outpatient follow-up.
- Chronic skin problems (eg, psoriasis, hidradenitis suppurativa) are better cared for in an outpatient setting due to the necessity for follow-up reassessments.
- There remains a need to fill knowledge gaps for common inpatient dermatologic problems that do not necessitate consultations, such as morbilliform drug rash and other chronic and unchanged dermatoses.