User login
Trauma-Informed Training for Veterans Treatment Court Professionals: Program Development and Initial Feedback
Veterans who interact with the criminal justice system (ie, justice-involved veterans) have heightened rates of mental health and psychosocial needs, including posttraumatic stress disorder (PTSD), substance use disorder, depression, suicidal ideation and attempt, and homelessness.1,2 Alongside these criminogenic risk factors, recidivism is common among justice-involved veterans: About 70% of incarcerated veterans disclosed at least one prior incarceration.3
To address the complex interplay of psychosocial factors, mental health concerns, and justice involvement among veterans, veterans treatment courts (VTCs) emerged as an alternative to incarceration.4 VTC participation often consists of integrated treatment and rehabilitative services (eg, vocational training, health care), ongoing monitoring for substance use, graduated responses to address treatment adherence, and ongoing communication with the judge and legal counsel.4
A primary aim of these courts is to address psychosocial needs believed to underlie criminal behavior, thus reducing risk of recidivism and promoting successful recovery and community integration for eligible veterans. To do so, VTCs collaborate with community-based and/or US Department of Veterans Affairs services, such as the Veterans Justice Outreach program (VJO). VJO specialists identify and refer justice-involved veterans to Veterans Health Administration (VHA) and community care and serve as a liaison between VTC staff and VHA health care professionals (HCPs).5
VTC outcome studies highlight the importance of not only diverting veterans to problem-solving courts, but also ensuring their optimal participation. Successful graduates of VTC programs demonstrate significant improvements in mental health symptoms, life satisfaction, and social support, as well as lower rates of law enforcement interactions.6,7 However, less is known about supporting those veterans who have difficulty engaging in VTCs and either discontinue participation or require lengthier periods of participation to meet court graduation requirements.8 One possibility to improve engagement among these veterans is to enhance court practices to best meet their needs.
In addition to delivering treatment, VHA mental health professionals may serve a critical interdisciplinary role by lending expertise to support VTC practices. For example, equipping court professionals with clinical knowledge and skills related to motivation may strengthen the staff’s interactions with participants, enabling them to address barriers as they arise and to facilitate veterans’ treatment adherence. Additionally, responsiveness to the impact of trauma exposure, which is common among this population, may prove important as related symptoms can affect veterans’ engagement, receptivity, and behavior in court settings. Indeed, prior examinations of justice-involved veterans have found trauma exposure rates ranging from 60% to 90% and PTSD rates ranging from 27% to 40%.1,2 Notably, involvement with the justice system (eg, incarceration) may itself further increase risk of trauma exposure (eg, experiencing a physical or sexual assault in prison) or exacerbate existing PTSD.9 Nonetheless, whereas many drug courts and domestic violence courts have been established, problem-solving courts with a specialized focus on trauma exposure remain rare, suggesting a potential gap in court training.
VHA HCPs have the potential to facilitate justice-involved veterans’ successful court and treatment participation by coordinating with VJO specialists to provide training and consultation to the courts. Supporting efforts to effectively and responsively address criminogenic risk (eg, mental health) in VTC settings may in turn reduce the likelihood of recidivism.10 Given the elevated rates of trauma exposure among justice-involved veterans and the relative lack of trauma-focused VTCs, we developed a trauma-informed training for VTC professionals that centered on related clinical presentations of justice-involved veterans and frequently occurring challenges in the context of court participation.
Program Development
This educational program aimed to (1) provide psychoeducation on trauma exposure, PTSD, and existing evidence-based treatments; (2) present clinical considerations for justice-involved veterans related to trauma exposure and/or PTSD; and (3) introduce skills to facilitate effective communication and trauma-informed care practices among professionals working with veterans in a treatment court.
Prior to piloting the program, we conducted a needs assessment with VTC professionals and identified relevant theoretical constructs and brief interventions for inclusion in the training. Additionally, given the dearth of prior research on mental health education for VTCs, the team consulted with the developers of PTSD 101, a VHA workshop for veterans’ families that promotes psychoeducation, support, and effective communication.11 Doing so informed approaches to delivering education to nonclinical audiences that interact with veterans with histories of trauma exposure. As this was a program development project, it was determined to be exempt from institutional review board review.
Needs Assessment
In the initial stages of development, local VJO specialists identified regional VTCs and facilitated introductions to these courts. Two of the 3 Rocky Mountain region VTCs that were contacted expressed interest in receiving trauma-informed training. Based on preliminary interest, the facilitators conducted a needs assessment with VJO and VTC staff from these 2 courts to capture requests for specific content and past experiences with other mental health trainings.
Guided by the focus group model, the needs assessments took place during three 1-hour meetings with VJO specialists and a 1-hour meeting with VJO specialists, VTC professionals, and community-based clinical partners.12 Additionally, attending a VTC graduation and court session allowed for observations of court practices and interactions with veterans. A total of 13 professionals (judges, court coordinators, case managers, peer mentors, VJO specialists, and clinicians who specialize in substance use disorder and intimate partner violence) participated in the needs assessments.
The most critical need identified by court professionals was a focus on how to apply knowledge about trauma and PTSD to interactions with justice-involved veterans. This was reportedly absent from prior training sessions the courts had received. Both Rocky Mountain region VTCs expressed a strong interest in and openness to adapting practices based on research and practice recommendations. Additional requests that emerged included a refresher on psychoeducation related to trauma and how to address the personal impact of working with this population (eg, compassion fatigue).
Training Components
Based on the needs identified by VTC professionals and informed by consultation with the developers of PTSD 101, 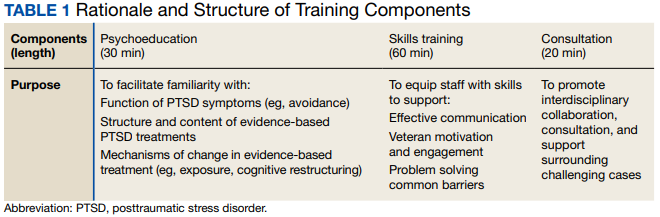
Psychoeducation. The initial portion of the training consisted of psychoeducation to increase VTC staff familiarity with the distinctions between trauma exposure and a formal diagnosis of PTSD, mechanisms underlying PTSD, and evidence-based treatment. To deepen conceptual understanding of trauma and PTSD beyond an overview of criteria set forth in The Diagnostic and Statistical Manual of Mental Disorders, Fifth Edition (DSM-5), psychoeducation centered on the drivers of avoidance (eg, short-term benefit vs long-term consequences), behaviors that often facilitate avoidance (eg, substance use), functions underlying these behaviors (eg, distress reduction), and structure and mechanisms of change in evidence-based treatments for PTSD, including cognitive processing therapy and prolonged exposure.13,14
Fostering court familiarity with cognitive processing therapy and prolonged exposure may bolster veteran engagement in treatment through regular reinforcement of skills and concepts introduced in therapy. This may prove particularly salient given the limited engagement with mental health treatment and elevated dropout rates from PTSD treatment among the general veteran population.15,16
Exercises and metaphors were used to illustrate concepts in multiple ways. For example, training attendees engaged in a “stop, drop, and roll” thought exercise in which they were asked to brainstorm behavioral reactions to catching on fire. This exercise illustrated the tendency for individuals to revert to common yet unhelpful attempts at problem solving (eg, running due to panic, which would exacerbate the fire), particularly in crisis and without prior education regarding adaptive ways to respond. Attendee-generated examples, such as running, were used to demonstrate the importance of practicing and reinforcing skill development prior to a crisis, to ensure proficiency and optimal response. Additionally, in prompting consideration of one’s response tendencies, this exercise may engender empathy and understanding for veterans.
Skills training. Efforts to promote veteran engagement in court, facilitate motivation and readiness for change, and address barriers that arise (eg, distress associated with court appearances) may support successful and timely graduation. As such, skills training constituted the largest component of the training and drew from observations of court practices and the VTCs’ identified challenges. Consistent with the project’s aims and reported needs of the court, skills that target common presentations following trauma exposure (eg, avoidance, hypervigilance) were prioritized for this pilot training. Strategies included brief interventions from dialectical behavior therapy, acceptance and commitment therapy, and motivational interviewing to strengthen the support provided by staff to veterans and address their needs (Table 2).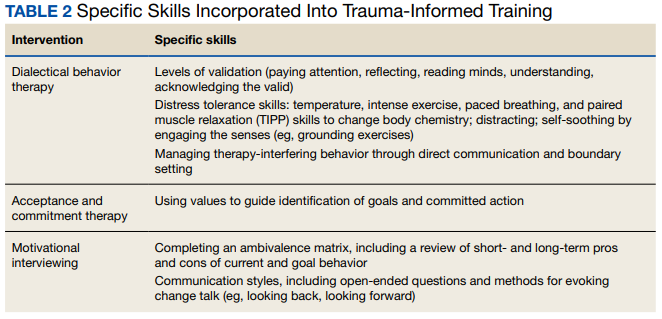
Training attendees also participated in exercises to reiterate skills. For example, attendees completed an ambivalence matrix using an audience-identified common behavior that is difficult to change (eg, heavy alcohol use as a coping mechanism for distress).
Attendees engaged in an exercise that involved identifying unhelpful thoughts and behaviors, targets for validation, and veteran strengths from a hypothetical case vignette. This vignette involved a VTC participant who initially engaged effectively but began to demonstrate difficulty appropriately engaging in court and mental health treatment as well as challenging interactions with VTC staff (eg, raised voice during court sessions, not respecting communication boundaries).
Pilot Test
Based on scheduling parameters communicated by court coordinators, the pilot training was designed as a presentation during times reserved for court staffing meetings. To accommodate court preferences due to the COVID-19 pandemic, one 90-minute training was conducted virtually in March 2022, and the other training was conducted in person in April 2022 for 2 hours. The trainings were facilitated by 2 VHA clinical psychologists and included the judge, court coordinator, VJO specialist, peer mentors, case managers, probation/parole officers, and community-based HCPs who partner with the court (eg, social workers, psychologists). About 12 to 15 professionals attended each training session.
Feedback
Feedback was solicited from attendees via an anonymous online survey. Seven participants completed the survey; the response rate of about 20% was consistent with those observed for other surveys of court professionals.20 Many attendees also provided feedback directly to the facilitators. Feedback highlighted that the skills-based components not only were perceived as most helpful but also notably distinguished this training. “What set this training apart from other training events was the practical applications,” one attendee noted. “It was not just information or education, both instructors did an incredible job of explaining exactly how we could apply the knowledge they were sharing. They did this in such a way that it was easy to understand and apply.”
Specific skills were consistently identified as helpful, including managing intense emotions, addressing ambivalence, and approaching sanctions and rewards. Additionally, employing a less formal approach to the training, with relatable overviews of concepts and immediate responsiveness to requests for expansion on a topic, was perceived as a unique benefit: Another attendee appreciated that “It was beneficial to sit around a table with a less formal presentation and be able to ask questions.” This approach seemed particularly well suited for the program’s cross-disciplinary audience. Attendees reported that they valued the relatively limited focus on DSM-5 criteria. Attendees emphasized that education specific to veterans on evidence-based PTSD treatments, psychoeducation, and avoidance was very helpful. Respondents also recommended that the training be lengthened to a daylong workshop to accommodate greater opportunity to practice skills and consultation.
The consultation portion of the training provided insight into additional areas of importance to incorporate into future iterations. Identified needs included appropriate and realistic boundary setting (eg, addressing disruptions in the courtroom), suggestions for improving and expanding homework assigned by the court, and ways to address concerns about PTSD treatment shared by veterans in court (eg, attributing substance use relapses to the intensiveness of trauma-focused treatment vs lack of familiarity with alternate coping skills). Additionally, the VTC professionals’ desire to support mental health professionals’ work with veterans was clearly evident, highlighting the bidirectional value of interdisciplinary collaboration between VHA mental health professionals and VTC professionals.
Discussion
A trauma-informed training was developed and delivered to 2 VTCs in the Rocky Mountain region with the goal of providing relevant psychoeducation and introducing skills to bolster court practices that address veteran needs. Psychoeducational components of the training that were particularly well received and prompted significant participant engagement included discussions and examples of avoidance, levels of validation, language to facilitate motivation and address barriers, mechanisms underlying treatment, and potential functions underlying limited veteran treatment engagement. Distress tolerance, approaches to sanctions and rewards, and use of ambivalence matrices to guide motivation were identified as particularly helpful skills.
The pilot phase of this trauma-informed training provided valuable insights into developing mental health trainings for VTCs. Specifically, VTCs may benefit from the expertise of VHA HCPs and are particularly interested in learning brief skills to improve their practices. The usefulness of such trainings may be bolstered by efforts to form relationships with the court to identify their perceived needs and employing an iterative process that is responsive to feedback both during and after the training. Last, each stage of this project was strengthened by collaboration with VJO specialists, highlighting the importance of future collaboration between VJO and VHA mental health clinics to further support justice-involved veterans. For example, VJO specialists were instrumental in identifying training needs related to veterans’ clinical presentations in court, facilitating introductions to local VTCs, and helping to address barriers to piloting, like scheduling.
Modifications and Future Directions
The insights gained through the process of training design, delivery, and feedback inform future development of this training. Based on the feedback received, subsequent versions of the training may be expanded into a half- or full-day workshop to allow for adequate time for skills training and feedback, as well as consultation. Doing so will enable facilitators to further foster attendees’ familiarity with and confidence in their ability to use these skills. Furthermore, the consultation portion of this training revealed areas that may benefit from greater attention, including how to address challenging interactions in court (eg, addressing gender dynamics between court professionals and participants) and better support veterans who are having difficulty engaging in mental health treatment (eg, courts’ observation of high rates of dropout around the third or fourth session of evidence-based treatment for PTSD). Last, all attendees who responded to the survey expressed interest in a brief resource guide based on the training, emphasizing the need for ready access to key skills and concepts to support the use of strategies learned.
An additional future aim of this project is to conduct a more thorough evaluation of the needs and outcomes related to this trauma-informed training for VTC professionals. With the rapid growth of VTCs nationwide, relatively little examination of court processes and practices has occurred, and there is a lack of research on the development or effectiveness of mental health trainings provided to VTCs.21 Therefore, we intend to conduct larger scale qualitative interviews with court personnel and VJO specialists to obtain a clearer understanding of the needs related to skills-based training and gaps in psychoeducation. These comprehensive needs assessments may also capture common comorbidities that were not incorporated into the pilot training (eg, substance use disorders) but may be important training targets for court professionals. This information will be used to inform subsequent expansion and adaptation of the training into a longer workshop. Program evaluation will be conducted via survey-based feedback on perceived usefulness of the workshop and self-report of confidence in and use of strategies to improve court practices. Furthermore, efforts to obtain veteran outcome data, such as treatment engagement and successful participation in VTC, may be pursued.
Limitations
This training development and pilot project provided valuable foundational information regarding a largely unexamined component of treatment courts—the benefit of skills-based trainings to facilitate court practices related to justice-involved veterans. However, it is worth noting that survey responses were limited; thus, the feedback received may not reflect all attendees’ perceptions. Additionally, because both training sessions were conducted solely with 2 courts in the Rocky Mountain area, feedback may be limited to the needs of this geographic region.
Conclusions
A trauma-informed training was developed for VTCs to facilitate relevant understanding of justice-involved veterans’ needs and presentations in court, introduce skills to address challenges that arise (eg, motivation, emotional dysregulation), and provide interdisciplinary support to court professionals. This training was an important step toward fostering strong collaborations between VHA HCPs and community-based veterans courts, and feedback received during development and following implementation highlighted the perceived need for a skills-based approach to such trainings. Further program development and evaluation can strengthen this training and provide a foundation for dissemination to a broader scope of VTCs, with the goal of reducing recidivism risk among justice-involved veterans by promoting effective engagement in problem-solving court.
1. Blodgett JC, Avoundjian T, Finlay AK, et al. Prevalence of mental health disorders among justice-involved veterans. Epidemiol Rev. 2015;37(1):163-176. doi:10.1093/epirev/mxu003
2. Saxon AJ, Davis TM, Sloan KL, McKnight KM, McFall ME, Kivlahan DR. Trauma, symptoms of posttraumatic stress disorder, and associated problems among incarcerated veterans. Psychiatr Serv. 2001;52(7):959-964. doi:10.1176/appi.ps.52.7.959
3. Bronson J, Carson AC, Noonan M. Veterans in prison and jail, 2011-12. December 2015. Accessed January 11, 2023. https://bjs.ojp.gov/content/pub/pdf/vpj1112.pdf
4. Cartwright T. “To care for him who shall have borne the battle”: the recent development of veterans treatment courts in America. Stanford Law Rev. 2011;22(1):295-316.
5. Finlay AK, Smelson D, Sawh L, et al. U.S. Department of Veterans Affairs Veterans Justice Outreach Program: connecting justice-involved veterans with mental health and substance use disorder Treatment. Crim Justice Policy Rev. 2016;27(2):10.1177/0887403414562601. doi:10.1177/0887403414562601
6. Knudsen KJ, Wingenfeld S. A specialized treatment court for veterans with trauma exposure: implications for the field. Community Ment Health J. 2016;52(2):127-135. doi:10.1007/s10597-015-9845-9
7. Montgomery LM, Olson JN. Veterans treatment court impact on veteran mental health and life satisfaction. J Psychol Behav Sci. 2018;6(1):1-4. doi:10.15640/jpbs.v6n1a1
8. Tsai J, Finlay A, Flatley B, Kasprow WJ, Clark S. A national study of veterans treatment court participants: who benefits and who recidivates. Adm Policy Ment Health. 2018;45(2):236-244. doi:10.1007/s10488-017-0816-z
9. Wolff NL, Shi J. Trauma and incarcerated persons. In: Scott CL, ed. Handbook of Correctional Mental Health. American Psychiatric Publishing, Inc.; 2010:277-320.
10. Bonta J, Andrews DA. Risk-need-responsivity model for offender assessment and rehabilitation. Rehabilitation. 2007;6:1-22. https://www.publicsafety.gc.ca/cnt/rsrcs/pblctns/rsk-nd-rspnsvty/index-en.aspx
11. US Department of Veterans Affairs, Office of Mental Health and Suicide Prevention, Family Services Section; Caska-Wallace CM, Campbell SB, Glynn SM. PTSD 101 for family and friends: a support and education workshop. 2020.
12. Tipping J. Focus groups: a method of needs assessment. J Contin Educ Health Prof. 1998;18(3):150-154. doi:10.1002/chp.1340180304
13. Resick PA, Monson CM, Chard KM. Cognitive Processing Therapy for PTSD: A Comprehensive Manual. The Guilford Press; 2017.
14. Foa EB, Hembree EA, Rothbaum BO. Prolonged Exposure Therapy for PTSD: Emotional Processing of Traumatic Experiences: Therapist Guide. Oxford University Press; 2007. doi:10.1093/med:psych/9780195308501.001.0001
15. Seal KH, Maguen S, Cohen B, et al. VA mental health services utilization in Iraq and Afghanistan veterans in the first year of receiving new mental health diagnoses. J Trauma Stress. 2010;23(1):5-16. doi:10.1002/jts.20493
16. Edwards-Stewart A, Smolenski DJ, Bush NE, et al. Posttraumatic stress disorder treatment dropout among military and veteran populations: a systematic review and meta-analysis. J Trauma Stress. 2021;34(4):808-818. doi:10.1002/jts.22653
17. Linehan MM. Dialectical Behavior Therapy Skills Training Manual. 2nd ed. Guildford Press; 2015.
18. Hayes SC, Strosahl KD, Wilson KG. Acceptance and Commitment Therapy: The Process and Practice of Mindful Change. 2nd ed. Guildford Press; 2016.
19. Miller WR, Rollnick S. Motivational Interviewing: Preparing People for Change. 2nd ed. The Guildford Press; 2002.
20. National Center for State Courts. A survey of members of major national court organizations. October 2010. Accessed January 11, 2023. https://www.ncsc.org/__data/assets/pdf_file/0015/16350/survey-summary-10-26.pdf
21. Baldwin JM, Brooke EJ. Pausing in the wake of rapid adoption: a call to critically examine the veterans treatment court concept. J Offender Rehabil. 2019;58(1):1-29. doi:10.1080/10509674.2018.1549181
Veterans who interact with the criminal justice system (ie, justice-involved veterans) have heightened rates of mental health and psychosocial needs, including posttraumatic stress disorder (PTSD), substance use disorder, depression, suicidal ideation and attempt, and homelessness.1,2 Alongside these criminogenic risk factors, recidivism is common among justice-involved veterans: About 70% of incarcerated veterans disclosed at least one prior incarceration.3
To address the complex interplay of psychosocial factors, mental health concerns, and justice involvement among veterans, veterans treatment courts (VTCs) emerged as an alternative to incarceration.4 VTC participation often consists of integrated treatment and rehabilitative services (eg, vocational training, health care), ongoing monitoring for substance use, graduated responses to address treatment adherence, and ongoing communication with the judge and legal counsel.4
A primary aim of these courts is to address psychosocial needs believed to underlie criminal behavior, thus reducing risk of recidivism and promoting successful recovery and community integration for eligible veterans. To do so, VTCs collaborate with community-based and/or US Department of Veterans Affairs services, such as the Veterans Justice Outreach program (VJO). VJO specialists identify and refer justice-involved veterans to Veterans Health Administration (VHA) and community care and serve as a liaison between VTC staff and VHA health care professionals (HCPs).5
VTC outcome studies highlight the importance of not only diverting veterans to problem-solving courts, but also ensuring their optimal participation. Successful graduates of VTC programs demonstrate significant improvements in mental health symptoms, life satisfaction, and social support, as well as lower rates of law enforcement interactions.6,7 However, less is known about supporting those veterans who have difficulty engaging in VTCs and either discontinue participation or require lengthier periods of participation to meet court graduation requirements.8 One possibility to improve engagement among these veterans is to enhance court practices to best meet their needs.
In addition to delivering treatment, VHA mental health professionals may serve a critical interdisciplinary role by lending expertise to support VTC practices. For example, equipping court professionals with clinical knowledge and skills related to motivation may strengthen the staff’s interactions with participants, enabling them to address barriers as they arise and to facilitate veterans’ treatment adherence. Additionally, responsiveness to the impact of trauma exposure, which is common among this population, may prove important as related symptoms can affect veterans’ engagement, receptivity, and behavior in court settings. Indeed, prior examinations of justice-involved veterans have found trauma exposure rates ranging from 60% to 90% and PTSD rates ranging from 27% to 40%.1,2 Notably, involvement with the justice system (eg, incarceration) may itself further increase risk of trauma exposure (eg, experiencing a physical or sexual assault in prison) or exacerbate existing PTSD.9 Nonetheless, whereas many drug courts and domestic violence courts have been established, problem-solving courts with a specialized focus on trauma exposure remain rare, suggesting a potential gap in court training.
VHA HCPs have the potential to facilitate justice-involved veterans’ successful court and treatment participation by coordinating with VJO specialists to provide training and consultation to the courts. Supporting efforts to effectively and responsively address criminogenic risk (eg, mental health) in VTC settings may in turn reduce the likelihood of recidivism.10 Given the elevated rates of trauma exposure among justice-involved veterans and the relative lack of trauma-focused VTCs, we developed a trauma-informed training for VTC professionals that centered on related clinical presentations of justice-involved veterans and frequently occurring challenges in the context of court participation.
Program Development
This educational program aimed to (1) provide psychoeducation on trauma exposure, PTSD, and existing evidence-based treatments; (2) present clinical considerations for justice-involved veterans related to trauma exposure and/or PTSD; and (3) introduce skills to facilitate effective communication and trauma-informed care practices among professionals working with veterans in a treatment court.
Prior to piloting the program, we conducted a needs assessment with VTC professionals and identified relevant theoretical constructs and brief interventions for inclusion in the training. Additionally, given the dearth of prior research on mental health education for VTCs, the team consulted with the developers of PTSD 101, a VHA workshop for veterans’ families that promotes psychoeducation, support, and effective communication.11 Doing so informed approaches to delivering education to nonclinical audiences that interact with veterans with histories of trauma exposure. As this was a program development project, it was determined to be exempt from institutional review board review.
Needs Assessment
In the initial stages of development, local VJO specialists identified regional VTCs and facilitated introductions to these courts. Two of the 3 Rocky Mountain region VTCs that were contacted expressed interest in receiving trauma-informed training. Based on preliminary interest, the facilitators conducted a needs assessment with VJO and VTC staff from these 2 courts to capture requests for specific content and past experiences with other mental health trainings.
Guided by the focus group model, the needs assessments took place during three 1-hour meetings with VJO specialists and a 1-hour meeting with VJO specialists, VTC professionals, and community-based clinical partners.12 Additionally, attending a VTC graduation and court session allowed for observations of court practices and interactions with veterans. A total of 13 professionals (judges, court coordinators, case managers, peer mentors, VJO specialists, and clinicians who specialize in substance use disorder and intimate partner violence) participated in the needs assessments.
The most critical need identified by court professionals was a focus on how to apply knowledge about trauma and PTSD to interactions with justice-involved veterans. This was reportedly absent from prior training sessions the courts had received. Both Rocky Mountain region VTCs expressed a strong interest in and openness to adapting practices based on research and practice recommendations. Additional requests that emerged included a refresher on psychoeducation related to trauma and how to address the personal impact of working with this population (eg, compassion fatigue).
Training Components
Based on the needs identified by VTC professionals and informed by consultation with the developers of PTSD 101,
Psychoeducation. The initial portion of the training consisted of psychoeducation to increase VTC staff familiarity with the distinctions between trauma exposure and a formal diagnosis of PTSD, mechanisms underlying PTSD, and evidence-based treatment. To deepen conceptual understanding of trauma and PTSD beyond an overview of criteria set forth in The Diagnostic and Statistical Manual of Mental Disorders, Fifth Edition (DSM-5), psychoeducation centered on the drivers of avoidance (eg, short-term benefit vs long-term consequences), behaviors that often facilitate avoidance (eg, substance use), functions underlying these behaviors (eg, distress reduction), and structure and mechanisms of change in evidence-based treatments for PTSD, including cognitive processing therapy and prolonged exposure.13,14
Fostering court familiarity with cognitive processing therapy and prolonged exposure may bolster veteran engagement in treatment through regular reinforcement of skills and concepts introduced in therapy. This may prove particularly salient given the limited engagement with mental health treatment and elevated dropout rates from PTSD treatment among the general veteran population.15,16
Exercises and metaphors were used to illustrate concepts in multiple ways. For example, training attendees engaged in a “stop, drop, and roll” thought exercise in which they were asked to brainstorm behavioral reactions to catching on fire. This exercise illustrated the tendency for individuals to revert to common yet unhelpful attempts at problem solving (eg, running due to panic, which would exacerbate the fire), particularly in crisis and without prior education regarding adaptive ways to respond. Attendee-generated examples, such as running, were used to demonstrate the importance of practicing and reinforcing skill development prior to a crisis, to ensure proficiency and optimal response. Additionally, in prompting consideration of one’s response tendencies, this exercise may engender empathy and understanding for veterans.
Skills training. Efforts to promote veteran engagement in court, facilitate motivation and readiness for change, and address barriers that arise (eg, distress associated with court appearances) may support successful and timely graduation. As such, skills training constituted the largest component of the training and drew from observations of court practices and the VTCs’ identified challenges. Consistent with the project’s aims and reported needs of the court, skills that target common presentations following trauma exposure (eg, avoidance, hypervigilance) were prioritized for this pilot training. Strategies included brief interventions from dialectical behavior therapy, acceptance and commitment therapy, and motivational interviewing to strengthen the support provided by staff to veterans and address their needs (Table 2).
Training attendees also participated in exercises to reiterate skills. For example, attendees completed an ambivalence matrix using an audience-identified common behavior that is difficult to change (eg, heavy alcohol use as a coping mechanism for distress).
Attendees engaged in an exercise that involved identifying unhelpful thoughts and behaviors, targets for validation, and veteran strengths from a hypothetical case vignette. This vignette involved a VTC participant who initially engaged effectively but began to demonstrate difficulty appropriately engaging in court and mental health treatment as well as challenging interactions with VTC staff (eg, raised voice during court sessions, not respecting communication boundaries).
Pilot Test
Based on scheduling parameters communicated by court coordinators, the pilot training was designed as a presentation during times reserved for court staffing meetings. To accommodate court preferences due to the COVID-19 pandemic, one 90-minute training was conducted virtually in March 2022, and the other training was conducted in person in April 2022 for 2 hours. The trainings were facilitated by 2 VHA clinical psychologists and included the judge, court coordinator, VJO specialist, peer mentors, case managers, probation/parole officers, and community-based HCPs who partner with the court (eg, social workers, psychologists). About 12 to 15 professionals attended each training session.
Feedback
Feedback was solicited from attendees via an anonymous online survey. Seven participants completed the survey; the response rate of about 20% was consistent with those observed for other surveys of court professionals.20 Many attendees also provided feedback directly to the facilitators. Feedback highlighted that the skills-based components not only were perceived as most helpful but also notably distinguished this training. “What set this training apart from other training events was the practical applications,” one attendee noted. “It was not just information or education, both instructors did an incredible job of explaining exactly how we could apply the knowledge they were sharing. They did this in such a way that it was easy to understand and apply.”
Specific skills were consistently identified as helpful, including managing intense emotions, addressing ambivalence, and approaching sanctions and rewards. Additionally, employing a less formal approach to the training, with relatable overviews of concepts and immediate responsiveness to requests for expansion on a topic, was perceived as a unique benefit: Another attendee appreciated that “It was beneficial to sit around a table with a less formal presentation and be able to ask questions.” This approach seemed particularly well suited for the program’s cross-disciplinary audience. Attendees reported that they valued the relatively limited focus on DSM-5 criteria. Attendees emphasized that education specific to veterans on evidence-based PTSD treatments, psychoeducation, and avoidance was very helpful. Respondents also recommended that the training be lengthened to a daylong workshop to accommodate greater opportunity to practice skills and consultation.
The consultation portion of the training provided insight into additional areas of importance to incorporate into future iterations. Identified needs included appropriate and realistic boundary setting (eg, addressing disruptions in the courtroom), suggestions for improving and expanding homework assigned by the court, and ways to address concerns about PTSD treatment shared by veterans in court (eg, attributing substance use relapses to the intensiveness of trauma-focused treatment vs lack of familiarity with alternate coping skills). Additionally, the VTC professionals’ desire to support mental health professionals’ work with veterans was clearly evident, highlighting the bidirectional value of interdisciplinary collaboration between VHA mental health professionals and VTC professionals.
Discussion
A trauma-informed training was developed and delivered to 2 VTCs in the Rocky Mountain region with the goal of providing relevant psychoeducation and introducing skills to bolster court practices that address veteran needs. Psychoeducational components of the training that were particularly well received and prompted significant participant engagement included discussions and examples of avoidance, levels of validation, language to facilitate motivation and address barriers, mechanisms underlying treatment, and potential functions underlying limited veteran treatment engagement. Distress tolerance, approaches to sanctions and rewards, and use of ambivalence matrices to guide motivation were identified as particularly helpful skills.
The pilot phase of this trauma-informed training provided valuable insights into developing mental health trainings for VTCs. Specifically, VTCs may benefit from the expertise of VHA HCPs and are particularly interested in learning brief skills to improve their practices. The usefulness of such trainings may be bolstered by efforts to form relationships with the court to identify their perceived needs and employing an iterative process that is responsive to feedback both during and after the training. Last, each stage of this project was strengthened by collaboration with VJO specialists, highlighting the importance of future collaboration between VJO and VHA mental health clinics to further support justice-involved veterans. For example, VJO specialists were instrumental in identifying training needs related to veterans’ clinical presentations in court, facilitating introductions to local VTCs, and helping to address barriers to piloting, like scheduling.
Modifications and Future Directions
The insights gained through the process of training design, delivery, and feedback inform future development of this training. Based on the feedback received, subsequent versions of the training may be expanded into a half- or full-day workshop to allow for adequate time for skills training and feedback, as well as consultation. Doing so will enable facilitators to further foster attendees’ familiarity with and confidence in their ability to use these skills. Furthermore, the consultation portion of this training revealed areas that may benefit from greater attention, including how to address challenging interactions in court (eg, addressing gender dynamics between court professionals and participants) and better support veterans who are having difficulty engaging in mental health treatment (eg, courts’ observation of high rates of dropout around the third or fourth session of evidence-based treatment for PTSD). Last, all attendees who responded to the survey expressed interest in a brief resource guide based on the training, emphasizing the need for ready access to key skills and concepts to support the use of strategies learned.
An additional future aim of this project is to conduct a more thorough evaluation of the needs and outcomes related to this trauma-informed training for VTC professionals. With the rapid growth of VTCs nationwide, relatively little examination of court processes and practices has occurred, and there is a lack of research on the development or effectiveness of mental health trainings provided to VTCs.21 Therefore, we intend to conduct larger scale qualitative interviews with court personnel and VJO specialists to obtain a clearer understanding of the needs related to skills-based training and gaps in psychoeducation. These comprehensive needs assessments may also capture common comorbidities that were not incorporated into the pilot training (eg, substance use disorders) but may be important training targets for court professionals. This information will be used to inform subsequent expansion and adaptation of the training into a longer workshop. Program evaluation will be conducted via survey-based feedback on perceived usefulness of the workshop and self-report of confidence in and use of strategies to improve court practices. Furthermore, efforts to obtain veteran outcome data, such as treatment engagement and successful participation in VTC, may be pursued.
Limitations
This training development and pilot project provided valuable foundational information regarding a largely unexamined component of treatment courts—the benefit of skills-based trainings to facilitate court practices related to justice-involved veterans. However, it is worth noting that survey responses were limited; thus, the feedback received may not reflect all attendees’ perceptions. Additionally, because both training sessions were conducted solely with 2 courts in the Rocky Mountain area, feedback may be limited to the needs of this geographic region.
Conclusions
A trauma-informed training was developed for VTCs to facilitate relevant understanding of justice-involved veterans’ needs and presentations in court, introduce skills to address challenges that arise (eg, motivation, emotional dysregulation), and provide interdisciplinary support to court professionals. This training was an important step toward fostering strong collaborations between VHA HCPs and community-based veterans courts, and feedback received during development and following implementation highlighted the perceived need for a skills-based approach to such trainings. Further program development and evaluation can strengthen this training and provide a foundation for dissemination to a broader scope of VTCs, with the goal of reducing recidivism risk among justice-involved veterans by promoting effective engagement in problem-solving court.
1. Blodgett JC, Avoundjian T, Finlay AK, et al. Prevalence of mental health disorders among justice-involved veterans. Epidemiol Rev. 2015;37(1):163-176. doi:10.1093/epirev/mxu003
2. Saxon AJ, Davis TM, Sloan KL, McKnight KM, McFall ME, Kivlahan DR. Trauma, symptoms of posttraumatic stress disorder, and associated problems among incarcerated veterans. Psychiatr Serv. 2001;52(7):959-964. doi:10.1176/appi.ps.52.7.959
3. Bronson J, Carson AC, Noonan M. Veterans in prison and jail, 2011-12. December 2015. Accessed January 11, 2023. https://bjs.ojp.gov/content/pub/pdf/vpj1112.pdf
4. Cartwright T. “To care for him who shall have borne the battle”: the recent development of veterans treatment courts in America. Stanford Law Rev. 2011;22(1):295-316.
5. Finlay AK, Smelson D, Sawh L, et al. U.S. Department of Veterans Affairs Veterans Justice Outreach Program: connecting justice-involved veterans with mental health and substance use disorder Treatment. Crim Justice Policy Rev. 2016;27(2):10.1177/0887403414562601. doi:10.1177/0887403414562601
6. Knudsen KJ, Wingenfeld S. A specialized treatment court for veterans with trauma exposure: implications for the field. Community Ment Health J. 2016;52(2):127-135. doi:10.1007/s10597-015-9845-9
7. Montgomery LM, Olson JN. Veterans treatment court impact on veteran mental health and life satisfaction. J Psychol Behav Sci. 2018;6(1):1-4. doi:10.15640/jpbs.v6n1a1
8. Tsai J, Finlay A, Flatley B, Kasprow WJ, Clark S. A national study of veterans treatment court participants: who benefits and who recidivates. Adm Policy Ment Health. 2018;45(2):236-244. doi:10.1007/s10488-017-0816-z
9. Wolff NL, Shi J. Trauma and incarcerated persons. In: Scott CL, ed. Handbook of Correctional Mental Health. American Psychiatric Publishing, Inc.; 2010:277-320.
10. Bonta J, Andrews DA. Risk-need-responsivity model for offender assessment and rehabilitation. Rehabilitation. 2007;6:1-22. https://www.publicsafety.gc.ca/cnt/rsrcs/pblctns/rsk-nd-rspnsvty/index-en.aspx
11. US Department of Veterans Affairs, Office of Mental Health and Suicide Prevention, Family Services Section; Caska-Wallace CM, Campbell SB, Glynn SM. PTSD 101 for family and friends: a support and education workshop. 2020.
12. Tipping J. Focus groups: a method of needs assessment. J Contin Educ Health Prof. 1998;18(3):150-154. doi:10.1002/chp.1340180304
13. Resick PA, Monson CM, Chard KM. Cognitive Processing Therapy for PTSD: A Comprehensive Manual. The Guilford Press; 2017.
14. Foa EB, Hembree EA, Rothbaum BO. Prolonged Exposure Therapy for PTSD: Emotional Processing of Traumatic Experiences: Therapist Guide. Oxford University Press; 2007. doi:10.1093/med:psych/9780195308501.001.0001
15. Seal KH, Maguen S, Cohen B, et al. VA mental health services utilization in Iraq and Afghanistan veterans in the first year of receiving new mental health diagnoses. J Trauma Stress. 2010;23(1):5-16. doi:10.1002/jts.20493
16. Edwards-Stewart A, Smolenski DJ, Bush NE, et al. Posttraumatic stress disorder treatment dropout among military and veteran populations: a systematic review and meta-analysis. J Trauma Stress. 2021;34(4):808-818. doi:10.1002/jts.22653
17. Linehan MM. Dialectical Behavior Therapy Skills Training Manual. 2nd ed. Guildford Press; 2015.
18. Hayes SC, Strosahl KD, Wilson KG. Acceptance and Commitment Therapy: The Process and Practice of Mindful Change. 2nd ed. Guildford Press; 2016.
19. Miller WR, Rollnick S. Motivational Interviewing: Preparing People for Change. 2nd ed. The Guildford Press; 2002.
20. National Center for State Courts. A survey of members of major national court organizations. October 2010. Accessed January 11, 2023. https://www.ncsc.org/__data/assets/pdf_file/0015/16350/survey-summary-10-26.pdf
21. Baldwin JM, Brooke EJ. Pausing in the wake of rapid adoption: a call to critically examine the veterans treatment court concept. J Offender Rehabil. 2019;58(1):1-29. doi:10.1080/10509674.2018.1549181
Evaluation of the Appropriateness of Aspirin Therapy in a Veteran Population
Aspirin is an antiplatelet agent that binds irreversibly to COX-1 and COX-2 enzymes, which results in decreased prostaglandin and thromboxane A2 production and inhibition of platelet aggregation. Aspirin often is used for its antipyretic, analgesic, and antiplatelet properties. Its use in cardiovascular disease (CVD) has been studied extensively over the past few decades, and recent data are changing the framework for aspirin use in primary prevention of atherosclerotic cardiovascular disease (ASCVD). Primary prevention refers to efforts to prevent the incidence of cardiovascular events, whereas secondary prevention refers to efforts to prevent a cardiovascular event after one has occurred.1 This differentiation is important as it guides the course of treatment.
Three trials published in 2018 evaluated aspirin use in primary prevention of ASCVD. The ASCEND trial evaluated aspirin use for primary prevention of ASCVD in patients with diabetes mellitus (DM). This study concluded that although aspirin prevented serious vascular events in patients with DM, the benefit observed was largely counteracted by the bleeding hazard.2 The ARRIVE trial evaluated aspirin use for primary prevention in patients with a moderate CVD risk. The study concluded that aspirin use in patients at moderate risk of CVD could not be assessed due to the low incidence rate of CVD; however, the study concluded that aspirin did not reduce the incidence of cardiovascular events for patients at low CVD risk and that aspirin caused more mild gastrointestinal bleeds compared with placebo.3 The ASPREE trial evaluated aspirin use for primary prevention in patients aged > 70 years to determine whether its use prolonged a healthy lifespan. This trial concluded that patients who received daily aspirin were at a higher risk of major hemorrhage and that aspirin did not diminish CVD risk compared with placebo.4
These studies led to a paradigm shift in therapy to reevaluate aspirin use for primary prevention. Current indications for aspirin include secondary prevention of ASCVD (ie, myocardial infarction [MI], coronary artery bypass graft, transient ischemic attack [TIA], and stroke), venous thromboembolism prophylaxis in the setting of orthopedic surgery, or valvular disease with replacement and analgesia. It is important to note that certain clinical circumstances may warrant aspirin use for primary prevention of ASCVD on a patient-specific basis, and this decision should be made using a risk/benefit analysis with the patient.
In April 2022, the US Preventive Services Task Force (USPSTF) recommended against using low-dose aspirin for primary prevention of ASCVD in individuals aged ≥ 60 years. The USPSTF noted that for patients who have a ≥ 10%, 10-year CVD risk, the decision to initiate aspirin should be based on a risk/benefit discussion and may be beneficial in certain patient populations.5A 2019 National Heart, Lung, and Blood Institute survey found that 29 million Americans used aspirin for primary prevention of ASCVD, and 6.6 million of these Americans used aspirin for primary prevention without the recommendation of a health care professional (HCP). Almost half of these individuals were aged > 70 years and, therefore, at an increased risk for bleeding.6 With the recent studies and changes in guidelines highlighting a higher risk rather than benefit with the use of aspirin for primary prevention, the current use of aspirin for primary prevention in the United States needs to be readdressed.
HCPs should assess the appropriateness of aspirin use in their patients to ensure that the risks of aspirin do not outweigh the benefits. Pharmacists can play a vital role in the assessment of aspirin for primary prevention during patient visits and make recommendations to primary care practitioners to deprescribe aspirin when appropriate.
Methods
The objective of this study was to evaluate the appropriateness of aspirin therapy in patient aligned care team (PACT) clinics at the Captain James A. Lovell Federal Health Care Center (FHCC) in North Chicago, Illinois. The PACT clinics are a category of clinics that include all the primary care clinics at FHCC.
The primary outcome of this study was to determine the percentage of patients inappropriately on aspirin therapy. To assess the inappropriate use of aspirin, relevant history of ASCVD was collected. Patients were divided into 3 groups: those with a history of ASCVD, those with no risk factors or history of ASCVD, and those with risk factors and no history of ASCVD. Patients were then categorized for their indication for aspirin use, which included either primary or secondary prevention of ASCVD. Patients were categorized into the primary prevention group if they had no history of ASCVD, whereas patients with a history of ASCVD were placed into the secondary prevention group.
ASCVD was defined as patients with acute coronary syndrome (ACS), history of MI, stable or unstable angina, coronary or other arterial revascularization, stroke, TIA, or peripheral artery disease (PAD), including aortic aneurysm (all with an atherosclerotic origin). Possible ASCVD risk was defined as patients with DM with a major risk factor (family history of premature ASCVD, hypertension, dyslipidemia, smoking, chronic kidney disease [CKD]/albuminuria) or patients diagnosed with coronary artery disease without an event. The percentage of patients followed by a PACT pharmacist, the number of pharmacist follow-up visits during the study period, and the date of the first 81-mg aspirin pharmacy order that was filled at FHCC were also collected.
The secondary outcome of this study focused on patients who were using aspirin for primary prevention and assessed potential reasons that may warrant deprescribing aspirin therapy. One reason for deprescribing is that aspirin may not be indicated for some patients, including those with DM without cardiovascular complications, patients aged > 70 years, and/or patients with CKD (defined as estimated glomerular filtration rate < 60 mL/min). Another reason for deprescribing is contraindication, which included patients with coagulopathy, thrombocytopenia (defined as platelet count < 150,000 mL), a history of gastrointestinal bleeding, peptic ulcer disease or other major bleeds, and/or consistent use of medications that increase bleeding risk (such as nonsteroidal anti-inflammatory agents, steroids, or anticoagulants) for > 14 days.
The safety outcome of this study assessed bleeding events while on aspirin therapy. All patients were categorized depending on if they had a major, minor, or no bleeding event while on aspirin therapy. Hemorrhagic stroke, symptomatic intracranial bleeding, bleeds located in other critical sites or organs (intracranial, intraspinal, intraocular, retroperitoneal, intra‐articular or pericardial), bleeds causing hemodynamic instability requiring vasopressors, bleeds causing a > 2 g/dL hemoglobin drop since initiation of aspirin therapy, severe extracranial bleeding requiring transfusion or hospitalization, fatal bleeding, or bleeds requiring > 2 units of red blood cell transfusion were considered major bleeding events. Minor bleeding events were any events that did not meet the criteria for major bleeding, including bruising, bleeding gums, epistaxis, hemorrhoidal bleeds, and bleeding that did not require intervention or treatment.7
Patients were included if they were aged > 18 years, had an active prescription for 81-mg aspirin tablet on September 30, 2021, and were seen in FHCC PACT clinics or at affiliated community-based outpatient centers. Other doses of aspirin were excluded as the 81-mg dose is the standard dose for primary prevention of ASCVD in the United States. US Department of Defense patients, home-based primary care patients, and community living center patients were excluded in this study. Patients with an aspirin prescription from a non–US Department of Veterans Affairs (VA) facility and patients on aspirin for reasons other than cardiovascular protection (such as pain, fever, etc) also were excluded from this study.
Data were collected from the FHCC electronic health record. A list was generated to include all active prescriptions for aspirin filled at FHCC as of September 30, 2021. Data were reviewed before this date to capture primary and secondary outcomes. No information was gathered from the chart after that date. This project was approved by the Edward Hines, Jr. VA Hospital Institutional Review Board. The primary and secondary outcomes were reported using descriptive statistics.
Results
This study reviewed 140 patient records and 105 patients met inclusion criteria. 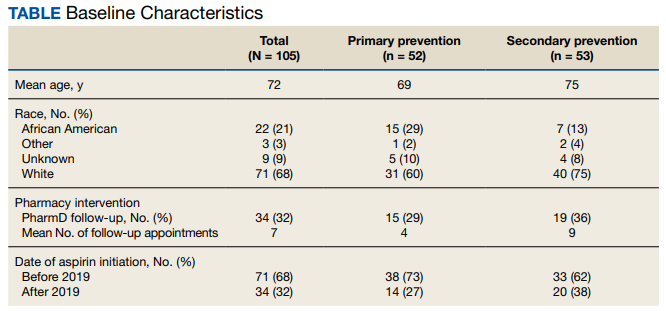
For the primary endpoint, 53 patients (50%) were on aspirin for secondary prevention and 52 (50%) were on aspirin for primary prevention. Of the 105 patients included in the study, 31 (30%) had a possible ASCVD risk and were taking aspirin for primary prevention, while 21 (20%) had no ASCVD and were taking aspirin for primary prevention. Of the 52 patients on aspirin for primary prevention, 31 patients (60%) had a possible risk for ASCVD. Of the 52 patients in the primary prevention group, 15 (29%) were followed by a pharmacist, and the average number of follow-up appointments was 4.
The secondary endpoint focused on patients taking aspirin for primary prevention and the factors that may warrant deprescribing aspirin. Of the 52 patients on aspirin for primary prevention, 25 patients were aged > 70 years, 15 patients were concurrently taking medications that may increase bleeding risk,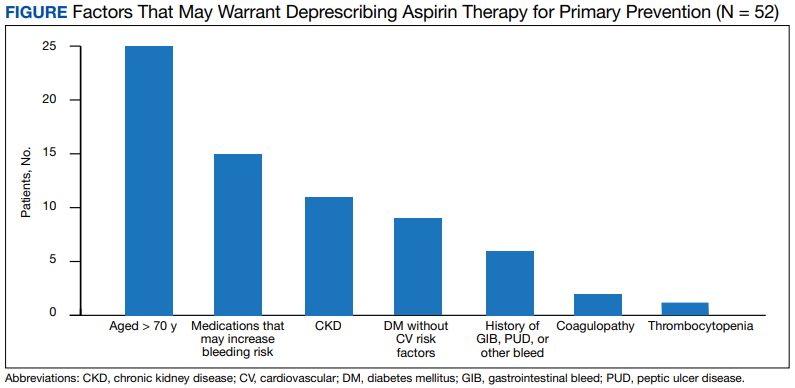
For the entire study group, 6 patients (6%) experienced a major bleeding event while on aspirin, 46 (44%) experienced a minor bleeding event while on aspirin, and 53 (50%) experienced no bleeding events while on aspirin. Of the 6 patients who experienced major bleeding events, 4 were on aspirin for secondary prevention, and 2 were on aspirin for primary prevention with ASCVD risk factors. The major bleeding events included 4 gastrointestinal bleeds, 1 intracranial hemorrhage, and 1 hemorrhagic stroke. Of the 46 who experienced minor bleeding events, 20 patients were on aspirin for primary prevention; 11 of those patients had possible ASCVD risk factors and 9 had no documented ASCVD. The minor bleeding events included hematuria, epistaxis, bleeding scabs, and dental bleeding.
Discussion
The majority of patients in this study were on aspirin appropriately. Indications deemed appropriate for aspirin therapy include secondary prevention and primary prevention with a possible ASCVD risk. About 20% of the total patient population in this study was taking aspirin for primary prevention with no ASCVD risk. For these patients, the risk of bleeding likely outweighs the benefits of aspirin therapy as patients are at low risk for ASCVD; therefore, aspirin therapy is likely inappropriate in this patient population. These patients may be unnecessarily at an increased risk for bleeding and may benefit from deprescribing aspirin. For the safety of patients, HCPs should be continuously assessing the appropriateness of aspirin for primary prevention and deprescribing when necessary.
About one-third of the patients using aspirin for primary prevention were followed by a pharmacist. Pharmacists can play a key role in deprescribing aspirin for primary prevention when aspirin use is deemed inappropriate. About 30% of the total patient population in this study was on aspirin for primary prevention with possible ASCVD risk. This patient population may benefit from aspirin therapy as they are at a higher risk for ASCVD. For these patients, a risk/benefit discussion is necessary to determine the appropriateness of aspirin for primary prevention. This risk/benefit discussion should be a continuous conversation between patients and HCPs as different factors such as age and changes in comorbid conditions and medications may increase bleeding risk.
The secondary endpoint focused on patients taking aspirin for primary prevention and the factors that may warrant deprescribing aspirin. The most common factors seen in this study included patients who were aged > 70 years, patients who were concurrently taking medications that may increase bleeding risk, and patients with CKD. All of these factors increase bleeding risk, making the risks potentially outweigh the benefits of aspirin for primary prevention. These factors should be the primary focus when assessing patients on aspirin for primary prevention to promote deprescribing aspirin if deemed appropriate as they were the most prevalent in this study.
The safety endpoints focused on bleeding events as a whole as well as the bleeding events seen in the primary prevention group. There were 2 major bleeding events and 20 minor bleeding events in the primary prevention group. The number of bleeding events both major and minor further shows the need for a continuous risk/benefit discussion between patients and HCPs on continued aspirin use for primary prevention. The bleeding risk with aspirin is prevalent. HCPs should continue to assess for factors that increase the bleeding risk that may warrant deprescribing aspirin to prevent future bleeding events in this patient population.
Strengths and Limitations
As there have been recent updates to guidelines on the use of aspirin for primary prevention, a strength of this study is that it evaluates a topic that is relevant in health care. Another strength of this study is that it focuses on specific patient factors that HCPs can assess when determining whether aspirin for primary prevention is appropriate in their patients. These specific patient factors can also be used as a guide to help HCPs deprescribe aspirin for primary prevention when appropriate.
One of the limitations of this study is that bleeding events that occurred outside of the FHCC were unable to be assessed unless the HCP specifically commented on the bleeding event in the chart. This could potentially underestimate the bleeding events seen in this study. Another limitation is that the bleeding risk for patients who were not on aspirin was not assessed. There was no comparison group to ascertain whether the bleeding risk was higher in the aspirin group compared with a no aspirin group. However, many of the major clinical trials saw an increased risk of bleeding in the aspirin group compared with placebo.
Conclusions
Aspirin therapy for secondary prevention remains an important part of treatment. Aspirin therapy for primary prevention may be appropriate for patients with a possible ASCVD risk. The therapy may be inappropriate in cases where patients have an increased bleeding risk and low or no ASCVD risk. It is important to continuously assess the need for aspirin therapy for patients in the setting of primary prevention. Common factors seen in this study to warrant deprescribing aspirin for primary prevention include patients aged > 70 years, concurrent use of medications that increase bleeding risk, and patients with CKD. By assessing ASCVD risk as well as bleeding risk and having a risk/benefit discussion between the HCP and patient, aspirin used for primary prevention can be appropriately deprescribed when the risks of bleeding outweigh the benefits.
Acknowledgments
The authors thank the Captain James A. Lovell Federal Health Care Center research committee (Hong-Yen Vi, PharmD, BCPS; Shaiza Khan, PharmD, BCPS; Yinka Alaka, BPharm, PharmD; Jennifer Kwon, PharmD, BCOP) and coinvestigator Aeman Choudhury, PharmD, BCPS, BCACP.
1. Warner TD, Nylander S, Whatling C. Anti-platelet therapy: cyclo-oxygenase inhibition and the use of aspirin with particular regard to dual anti-platelet therapy. Br J Clin Pharmacol. 2011;72(4):619-633. doi:10.1111/j.1365-2125.2011.03943.x
2. ASCEND Study Collaborative Group, Bowman L, Mafham M, et al. Effects of aspirin for primary prevention in persons with diabetes mellitus. N Engl J Med. 2018;379(16):1529-1539. doi:10.1056/NEJMoa1804988
3. Gaziano JM, Brotons C, Coppolecchia R, et al. Use of aspirin to reduce risk of initial vascular events in patients at moderate risk of cardiovascular disease (ARRIVE): a randomised, double-blind, placebo-controlled trial. Lancet. 2018;392(10152):1036-1046. doi:10.1016/S0140-6736(18)31924-X
4. McNeil JJ, Wolfe R, Woods RL, et al. Effect of aspirin on cardiovascular events and bleeding in the healthy elderly. N Engl J Med. 2018;379(16):1509-1518. doi:10.1056/NEJMoa1805819
5. US Preventive Services Task Force, Davidson KW, Barry MJ, et al. Aspirin use to prevent cardiovascular disease: US Preventive Services Task Force Recommendation Statement. JAMA. 2022;327(16):1577-1584. doi:10.1001/jama.2022.4983
6. Murphy E, McEvoy JW. Does stopping aspirin differ fundamentally from not starting aspirin in the primary prevention of cardiovascular disease among older adults? Ann Intern Med. 2022;175(5):757-758. doi:10.7326/M22-0550
7. Schulman S, Kearon C; Subcommittee on Control of Anticoagulation of the Scientific and Standardization Committee of the International Society on Thrombosis and Haemostasis. Definition of major bleeding in clinical investigations of antihemostatic medicinal products in non-surgical patients. J Thromb Haemost. 2005;3(4):692-694. doi:10.1111/j.1538-7836.2005.01204.
Aspirin is an antiplatelet agent that binds irreversibly to COX-1 and COX-2 enzymes, which results in decreased prostaglandin and thromboxane A2 production and inhibition of platelet aggregation. Aspirin often is used for its antipyretic, analgesic, and antiplatelet properties. Its use in cardiovascular disease (CVD) has been studied extensively over the past few decades, and recent data are changing the framework for aspirin use in primary prevention of atherosclerotic cardiovascular disease (ASCVD). Primary prevention refers to efforts to prevent the incidence of cardiovascular events, whereas secondary prevention refers to efforts to prevent a cardiovascular event after one has occurred.1 This differentiation is important as it guides the course of treatment.
Three trials published in 2018 evaluated aspirin use in primary prevention of ASCVD. The ASCEND trial evaluated aspirin use for primary prevention of ASCVD in patients with diabetes mellitus (DM). This study concluded that although aspirin prevented serious vascular events in patients with DM, the benefit observed was largely counteracted by the bleeding hazard.2 The ARRIVE trial evaluated aspirin use for primary prevention in patients with a moderate CVD risk. The study concluded that aspirin use in patients at moderate risk of CVD could not be assessed due to the low incidence rate of CVD; however, the study concluded that aspirin did not reduce the incidence of cardiovascular events for patients at low CVD risk and that aspirin caused more mild gastrointestinal bleeds compared with placebo.3 The ASPREE trial evaluated aspirin use for primary prevention in patients aged > 70 years to determine whether its use prolonged a healthy lifespan. This trial concluded that patients who received daily aspirin were at a higher risk of major hemorrhage and that aspirin did not diminish CVD risk compared with placebo.4
These studies led to a paradigm shift in therapy to reevaluate aspirin use for primary prevention. Current indications for aspirin include secondary prevention of ASCVD (ie, myocardial infarction [MI], coronary artery bypass graft, transient ischemic attack [TIA], and stroke), venous thromboembolism prophylaxis in the setting of orthopedic surgery, or valvular disease with replacement and analgesia. It is important to note that certain clinical circumstances may warrant aspirin use for primary prevention of ASCVD on a patient-specific basis, and this decision should be made using a risk/benefit analysis with the patient.
In April 2022, the US Preventive Services Task Force (USPSTF) recommended against using low-dose aspirin for primary prevention of ASCVD in individuals aged ≥ 60 years. The USPSTF noted that for patients who have a ≥ 10%, 10-year CVD risk, the decision to initiate aspirin should be based on a risk/benefit discussion and may be beneficial in certain patient populations.5A 2019 National Heart, Lung, and Blood Institute survey found that 29 million Americans used aspirin for primary prevention of ASCVD, and 6.6 million of these Americans used aspirin for primary prevention without the recommendation of a health care professional (HCP). Almost half of these individuals were aged > 70 years and, therefore, at an increased risk for bleeding.6 With the recent studies and changes in guidelines highlighting a higher risk rather than benefit with the use of aspirin for primary prevention, the current use of aspirin for primary prevention in the United States needs to be readdressed.
HCPs should assess the appropriateness of aspirin use in their patients to ensure that the risks of aspirin do not outweigh the benefits. Pharmacists can play a vital role in the assessment of aspirin for primary prevention during patient visits and make recommendations to primary care practitioners to deprescribe aspirin when appropriate.
Methods
The objective of this study was to evaluate the appropriateness of aspirin therapy in patient aligned care team (PACT) clinics at the Captain James A. Lovell Federal Health Care Center (FHCC) in North Chicago, Illinois. The PACT clinics are a category of clinics that include all the primary care clinics at FHCC.
The primary outcome of this study was to determine the percentage of patients inappropriately on aspirin therapy. To assess the inappropriate use of aspirin, relevant history of ASCVD was collected. Patients were divided into 3 groups: those with a history of ASCVD, those with no risk factors or history of ASCVD, and those with risk factors and no history of ASCVD. Patients were then categorized for their indication for aspirin use, which included either primary or secondary prevention of ASCVD. Patients were categorized into the primary prevention group if they had no history of ASCVD, whereas patients with a history of ASCVD were placed into the secondary prevention group.
ASCVD was defined as patients with acute coronary syndrome (ACS), history of MI, stable or unstable angina, coronary or other arterial revascularization, stroke, TIA, or peripheral artery disease (PAD), including aortic aneurysm (all with an atherosclerotic origin). Possible ASCVD risk was defined as patients with DM with a major risk factor (family history of premature ASCVD, hypertension, dyslipidemia, smoking, chronic kidney disease [CKD]/albuminuria) or patients diagnosed with coronary artery disease without an event. The percentage of patients followed by a PACT pharmacist, the number of pharmacist follow-up visits during the study period, and the date of the first 81-mg aspirin pharmacy order that was filled at FHCC were also collected.
The secondary outcome of this study focused on patients who were using aspirin for primary prevention and assessed potential reasons that may warrant deprescribing aspirin therapy. One reason for deprescribing is that aspirin may not be indicated for some patients, including those with DM without cardiovascular complications, patients aged > 70 years, and/or patients with CKD (defined as estimated glomerular filtration rate < 60 mL/min). Another reason for deprescribing is contraindication, which included patients with coagulopathy, thrombocytopenia (defined as platelet count < 150,000 mL), a history of gastrointestinal bleeding, peptic ulcer disease or other major bleeds, and/or consistent use of medications that increase bleeding risk (such as nonsteroidal anti-inflammatory agents, steroids, or anticoagulants) for > 14 days.
The safety outcome of this study assessed bleeding events while on aspirin therapy. All patients were categorized depending on if they had a major, minor, or no bleeding event while on aspirin therapy. Hemorrhagic stroke, symptomatic intracranial bleeding, bleeds located in other critical sites or organs (intracranial, intraspinal, intraocular, retroperitoneal, intra‐articular or pericardial), bleeds causing hemodynamic instability requiring vasopressors, bleeds causing a > 2 g/dL hemoglobin drop since initiation of aspirin therapy, severe extracranial bleeding requiring transfusion or hospitalization, fatal bleeding, or bleeds requiring > 2 units of red blood cell transfusion were considered major bleeding events. Minor bleeding events were any events that did not meet the criteria for major bleeding, including bruising, bleeding gums, epistaxis, hemorrhoidal bleeds, and bleeding that did not require intervention or treatment.7
Patients were included if they were aged > 18 years, had an active prescription for 81-mg aspirin tablet on September 30, 2021, and were seen in FHCC PACT clinics or at affiliated community-based outpatient centers. Other doses of aspirin were excluded as the 81-mg dose is the standard dose for primary prevention of ASCVD in the United States. US Department of Defense patients, home-based primary care patients, and community living center patients were excluded in this study. Patients with an aspirin prescription from a non–US Department of Veterans Affairs (VA) facility and patients on aspirin for reasons other than cardiovascular protection (such as pain, fever, etc) also were excluded from this study.
Data were collected from the FHCC electronic health record. A list was generated to include all active prescriptions for aspirin filled at FHCC as of September 30, 2021. Data were reviewed before this date to capture primary and secondary outcomes. No information was gathered from the chart after that date. This project was approved by the Edward Hines, Jr. VA Hospital Institutional Review Board. The primary and secondary outcomes were reported using descriptive statistics.
Results
This study reviewed 140 patient records and 105 patients met inclusion criteria.
For the primary endpoint, 53 patients (50%) were on aspirin for secondary prevention and 52 (50%) were on aspirin for primary prevention. Of the 105 patients included in the study, 31 (30%) had a possible ASCVD risk and were taking aspirin for primary prevention, while 21 (20%) had no ASCVD and were taking aspirin for primary prevention. Of the 52 patients on aspirin for primary prevention, 31 patients (60%) had a possible risk for ASCVD. Of the 52 patients in the primary prevention group, 15 (29%) were followed by a pharmacist, and the average number of follow-up appointments was 4.
The secondary endpoint focused on patients taking aspirin for primary prevention and the factors that may warrant deprescribing aspirin. Of the 52 patients on aspirin for primary prevention, 25 patients were aged > 70 years, 15 patients were concurrently taking medications that may increase bleeding risk,
For the entire study group, 6 patients (6%) experienced a major bleeding event while on aspirin, 46 (44%) experienced a minor bleeding event while on aspirin, and 53 (50%) experienced no bleeding events while on aspirin. Of the 6 patients who experienced major bleeding events, 4 were on aspirin for secondary prevention, and 2 were on aspirin for primary prevention with ASCVD risk factors. The major bleeding events included 4 gastrointestinal bleeds, 1 intracranial hemorrhage, and 1 hemorrhagic stroke. Of the 46 who experienced minor bleeding events, 20 patients were on aspirin for primary prevention; 11 of those patients had possible ASCVD risk factors and 9 had no documented ASCVD. The minor bleeding events included hematuria, epistaxis, bleeding scabs, and dental bleeding.
Discussion
The majority of patients in this study were on aspirin appropriately. Indications deemed appropriate for aspirin therapy include secondary prevention and primary prevention with a possible ASCVD risk. About 20% of the total patient population in this study was taking aspirin for primary prevention with no ASCVD risk. For these patients, the risk of bleeding likely outweighs the benefits of aspirin therapy as patients are at low risk for ASCVD; therefore, aspirin therapy is likely inappropriate in this patient population. These patients may be unnecessarily at an increased risk for bleeding and may benefit from deprescribing aspirin. For the safety of patients, HCPs should be continuously assessing the appropriateness of aspirin for primary prevention and deprescribing when necessary.
About one-third of the patients using aspirin for primary prevention were followed by a pharmacist. Pharmacists can play a key role in deprescribing aspirin for primary prevention when aspirin use is deemed inappropriate. About 30% of the total patient population in this study was on aspirin for primary prevention with possible ASCVD risk. This patient population may benefit from aspirin therapy as they are at a higher risk for ASCVD. For these patients, a risk/benefit discussion is necessary to determine the appropriateness of aspirin for primary prevention. This risk/benefit discussion should be a continuous conversation between patients and HCPs as different factors such as age and changes in comorbid conditions and medications may increase bleeding risk.
The secondary endpoint focused on patients taking aspirin for primary prevention and the factors that may warrant deprescribing aspirin. The most common factors seen in this study included patients who were aged > 70 years, patients who were concurrently taking medications that may increase bleeding risk, and patients with CKD. All of these factors increase bleeding risk, making the risks potentially outweigh the benefits of aspirin for primary prevention. These factors should be the primary focus when assessing patients on aspirin for primary prevention to promote deprescribing aspirin if deemed appropriate as they were the most prevalent in this study.
The safety endpoints focused on bleeding events as a whole as well as the bleeding events seen in the primary prevention group. There were 2 major bleeding events and 20 minor bleeding events in the primary prevention group. The number of bleeding events both major and minor further shows the need for a continuous risk/benefit discussion between patients and HCPs on continued aspirin use for primary prevention. The bleeding risk with aspirin is prevalent. HCPs should continue to assess for factors that increase the bleeding risk that may warrant deprescribing aspirin to prevent future bleeding events in this patient population.
Strengths and Limitations
As there have been recent updates to guidelines on the use of aspirin for primary prevention, a strength of this study is that it evaluates a topic that is relevant in health care. Another strength of this study is that it focuses on specific patient factors that HCPs can assess when determining whether aspirin for primary prevention is appropriate in their patients. These specific patient factors can also be used as a guide to help HCPs deprescribe aspirin for primary prevention when appropriate.
One of the limitations of this study is that bleeding events that occurred outside of the FHCC were unable to be assessed unless the HCP specifically commented on the bleeding event in the chart. This could potentially underestimate the bleeding events seen in this study. Another limitation is that the bleeding risk for patients who were not on aspirin was not assessed. There was no comparison group to ascertain whether the bleeding risk was higher in the aspirin group compared with a no aspirin group. However, many of the major clinical trials saw an increased risk of bleeding in the aspirin group compared with placebo.
Conclusions
Aspirin therapy for secondary prevention remains an important part of treatment. Aspirin therapy for primary prevention may be appropriate for patients with a possible ASCVD risk. The therapy may be inappropriate in cases where patients have an increased bleeding risk and low or no ASCVD risk. It is important to continuously assess the need for aspirin therapy for patients in the setting of primary prevention. Common factors seen in this study to warrant deprescribing aspirin for primary prevention include patients aged > 70 years, concurrent use of medications that increase bleeding risk, and patients with CKD. By assessing ASCVD risk as well as bleeding risk and having a risk/benefit discussion between the HCP and patient, aspirin used for primary prevention can be appropriately deprescribed when the risks of bleeding outweigh the benefits.
Acknowledgments
The authors thank the Captain James A. Lovell Federal Health Care Center research committee (Hong-Yen Vi, PharmD, BCPS; Shaiza Khan, PharmD, BCPS; Yinka Alaka, BPharm, PharmD; Jennifer Kwon, PharmD, BCOP) and coinvestigator Aeman Choudhury, PharmD, BCPS, BCACP.
1. Warner TD, Nylander S, Whatling C. Anti-platelet therapy: cyclo-oxygenase inhibition and the use of aspirin with particular regard to dual anti-platelet therapy. Br J Clin Pharmacol. 2011;72(4):619-633. doi:10.1111/j.1365-2125.2011.03943.x
2. ASCEND Study Collaborative Group, Bowman L, Mafham M, et al. Effects of aspirin for primary prevention in persons with diabetes mellitus. N Engl J Med. 2018;379(16):1529-1539. doi:10.1056/NEJMoa1804988
3. Gaziano JM, Brotons C, Coppolecchia R, et al. Use of aspirin to reduce risk of initial vascular events in patients at moderate risk of cardiovascular disease (ARRIVE): a randomised, double-blind, placebo-controlled trial. Lancet. 2018;392(10152):1036-1046. doi:10.1016/S0140-6736(18)31924-X
4. McNeil JJ, Wolfe R, Woods RL, et al. Effect of aspirin on cardiovascular events and bleeding in the healthy elderly. N Engl J Med. 2018;379(16):1509-1518. doi:10.1056/NEJMoa1805819
5. US Preventive Services Task Force, Davidson KW, Barry MJ, et al. Aspirin use to prevent cardiovascular disease: US Preventive Services Task Force Recommendation Statement. JAMA. 2022;327(16):1577-1584. doi:10.1001/jama.2022.4983
6. Murphy E, McEvoy JW. Does stopping aspirin differ fundamentally from not starting aspirin in the primary prevention of cardiovascular disease among older adults? Ann Intern Med. 2022;175(5):757-758. doi:10.7326/M22-0550
7. Schulman S, Kearon C; Subcommittee on Control of Anticoagulation of the Scientific and Standardization Committee of the International Society on Thrombosis and Haemostasis. Definition of major bleeding in clinical investigations of antihemostatic medicinal products in non-surgical patients. J Thromb Haemost. 2005;3(4):692-694. doi:10.1111/j.1538-7836.2005.01204.
Service-Related Toxin Exposure and Acute Myeloid Leukemia in Veterans
Members of the United States military who served in Vietnam between 1961 and 1971 risked exposure to the weaponized chemical defoliant known as Agent Orange. Among the components of Agent Orange, benzene and tetrachlorodibenzo-p-dioxin (TCDD) are known carcinogens linked to several cancers. They include multiple myeloma, Hodgkin and non-Hodgkin lymphoma, as well as bladder, prostate, and lung cancer.
In this ReCAP, Dr Timothy O'Brien, section chief of hematology at the Louis Stokes Cleveland VA Medical Center, examines the evidence that suggests a link between service-related Agent Orange exposure and acute myeloid leukemia (AML). He discusses preclinical models that show a relationship between benzene and TCDD exposure and the development of AML.
Dr O'Brien also explains the factors that have limited researchers' ability to positively connect Agent Orange and AML. For example, there is a dwindling cohort of affected patients to study because dioxins can lie latent in fat cells for more than a decade, delaying the development of AML. During that time, many veterans will have died from unrelated causes.
More research is needed for veterans to receive service-connected benefits for AML diagnoses. However, as Dr O'Brien notes, the PACT Act provides coverage for veterans who developed AML after exposure to benzene-contaminated water at Camp Lejeune.
--
Timothy O'Brien, MD, Associate Professor, Case Western Reserve University School of Medicine; Chief of Hematology, Louis Stokes Cleveland VA Medical Center, Cleveland, Ohio
Timothy O'Brien, MD, has disclosed no relevant financial relationships.

Infiltrating Wound Vacuum-Assisted Closure With Topical Amphotericin for Mucormycosis Infection of the Achilles Tendon
Vacuum-assisted closure (VAC) of wounds has become a foundational tool in the armamentarium of wound care specialists. Using a system consisting of a sponge, semi-occlusive barrier, and fluid collection device, VAC systems apply constant negative pressure resulting in macro and micro deformation to a wound, stabilization of the wound environment, and removal of inflammatory factors in wound fluid.1 These conditions allow for the removal of drainage and fluid from a wound bed, reduced edema and inflammation, reduced bacterial load, recruitment of healing factors, approximation of wound edges, and increased blood flow to the wound.2
In complex, infected wounds, a variation of negative pressure wound therapy (NPWT) via the instillation of topical antibiotics (instillation VAC) has been used.3 This variation has been advantageous even in soft tissue fungal infections. Early and aggressive treatment of such infections is critical to prevent dissemination, particularly in aggressive infections, such as mucormycosis.4 We present a case of a patient with a mucormycosis infection of his left Achilles tendon and overlying skin who was successfully treated with surgical debridement and wound care with instillation NPWT with topical amphotericin B.
Case Presentation
A 53-year-old man underwent left Achilles tendon reconstruction with allograft after a complete tear during exercise. He had no relevant medical history and was otherwise healthy, which he attributed to working out daily. About a week after the operation, he began having incisional breakdown, prompting presentation to an emergency department. There, he received IV antibiotics along with multiple debridements. After the wound failed to improve and intra-operative cultures grew mucormycosis, he was transferred to our facility for a higher level of care. On admission, he was immediately given IV amphotericin B and scheduled for repeat debridement.
After 1 prior debridement and 10 total days of IV amphotericin, a repeat debridement was performed. After the debridement, the installation VAC was applied to the patient’s left lower extremity wound with an instilling fluid of amphotericin B and the settings as follows: smart phase instill volume, 110 mL; soak time, 3.5 hours; target pressure, 125 mm Hg; intensity, low; and VAC therapy mode, continuous. After 5 days, the wound bed appeared clean without overt signs of infection. However, due to some toxicity to healthy surrounding soft tissue, the instillation VAC was discontinued and standard NPWT was started. The patient underwent 2 additional rounds of debridement with partial delayed closure. Four weeks after discontinuation of the instillation VAC, the wound appeared healthy and granulated so the patient underwent split-thickness skin grafting to the left posterior ankle. He subsequently completed a course of oral antifungal medication as an outpatient.
The patient was seen in the outpatient clinic for 14 months from the initial mucormycosis infection (Figure). 
Discussion
Mucormycosis is an infection caused by fungi in the class Zygomycetes and of the order Mucorales that typically occurs in immunocompromised patients, especially those with diabetic ketoacidosis and neutropenia. Given that this patient had no relevant medical history and was otherwise healthy, he was at extremely low risk of this type of infection. In this patient’s case, the spores of this nonseptate hyphae wide-branching species were most likely introduced at the time of left Achilles tendon repair. Mucormycosis is progressive and can be fatal unless treated, with a mortality rate approaching 70%.5 The rarity and heterogeneity of mucormycosis make treatment variable.6 No prospective or randomized clinical trials exist in plastic surgery literature.
The use of wound VAC in combination with the instillation of amphotericin B to treat cutaneous mucormycosis is not well documented. Mucormycosis infections are traditionally addressed with surgical debridement and antifungal therapy, specifically IV amphotericin B.7,8 As previously noted, NPWT has become the gold standard in treating complex wounds.3 Additionally, wound VAC therapy with instillation has been noted in the literature as a reliable method to treat bacteria-infected wounds, providing a shorter treatment period and earlier wound closure.9 Instillation VAC therapy has proven particularly useful in complex, infected wounds, such as aggressive fungal infections.
Mucormycosis treatment is challenging particularly in the extremities as management must balance both mortality and limb salvage. In this case, the use of NPWT with wound VAC and intervals of instilling amphotericin B facilitated infection control in this lower extremity mucormycosis infection. The significant adverse effect profile of amphotericin B, particularly the nephrotoxicity, should be seriously considered when deciding the treatment regimen for patients affected by mucormycosis. Locally, topical amphotericin B has been reported to cause blistering, itchiness, redness, peeling, and dryness. However, topical preparations of amphotericin B are nontoxic unlike their IV counterpart, able to cross the physiological barriers of the skin while simultaneously targeting macrophages in the dermis and epidermis.10
Conclusions
Although the mainstay of treatment for systemic mucormycosis is radical debridement and IV amphotericin B, a more localized infection may benefit from an adjunct like an instillation wound VAC with topical amphotericin B, as presented in this case study. Swift treatment with wound VAC was beneficial in the overall recovery and tissue healing of this patient and may be beneficial in similar cases.
1. Normandin S, Safran T, Winocour S, et al. negative pressure wound therapy: mechanism of action and clinical applications. Semin Plast Surg. 2021;35(3):164-170. doi:10.1055/s-0041-1731792
2. Agarwal P, Kukrele R, Sharma D. Vacuum assisted closure (VAC)/negative pressure wound therapy (NPWT) for difficult wounds: a review. J Clin Orthop Trauma. 2019;10(5):845-848. doi:10.1016/j.jcot.2019.06.015
3. Gabriel A, Shores J, Bernstein B, et al. A clinical review of infected wound treatment with Vacuum Assisted Closure (V.A.C.) therapy: experience and case series. Int Wound J. 2009;6(suppl 2):1-25. doi:10.1111/j.1742-481X.2009.00628.x
4. Guégan S, Lanternier F, Rouzaud C, Dupin N, Lortholary O. Fungal skin and soft tissue infections. Curr Opin Infect Dis. 2016;29(2):124-130. doi:10.1097/QCO.0000000000000252
5. Ibrahim AS, Spellberg B, Walsh TJ, Kontoyiannis DP. Pathogenesis of mucormycosis. Clin Infect Dis. 2012;54(suppl 1):S16-S22. doi:10.1093/cid/cir865
6. Sipsas NV, Gamaletsou MN, Anastasopoulou A, Kontoyiannis DP. Therapy of mucormycosis. J Fungi (Basel). 2018;4(3):90. Published 2018 Jul 31. doi:10.3390/jof4030090
7. Spellberg B, Edwards J Jr, Ibrahim A. Novel perspectives on mucormycosis: pathophysiology, presentation, and management. Clin Microbiol Rev. 2005;18(3):556-569. doi:10.1128/CMR.18.3.556-569.2005
8. Losee JE, Selber J, Vega S, Hall C, Scott G, Serletti JM. Primary cutaneous mucormycosis: guide to surgical management. Ann Plast Surg. 2002;49(4):385-390. doi:10.1097/00000637-200210000-00009
9. Webb LX. New techniques in wound management: vacuum-assisted wound closure. J Am Acad Orthop Surg. 2002;10(5):303-311. doi:10.5435/00124635-200209000-00002
10. Varikuti S, Oghumu S, Saljoughian N, et al. Topical treatment with nanoliposomal Amphotericin B reduces early lesion growth but fails to induce cure in an experimental model of cutaneous leishmaniasis caused by Leishmania mexicana. Acta Trop. 2017;173:102-108. doi:10.1016/j.actatropica.2017.06.004
Vacuum-assisted closure (VAC) of wounds has become a foundational tool in the armamentarium of wound care specialists. Using a system consisting of a sponge, semi-occlusive barrier, and fluid collection device, VAC systems apply constant negative pressure resulting in macro and micro deformation to a wound, stabilization of the wound environment, and removal of inflammatory factors in wound fluid.1 These conditions allow for the removal of drainage and fluid from a wound bed, reduced edema and inflammation, reduced bacterial load, recruitment of healing factors, approximation of wound edges, and increased blood flow to the wound.2
In complex, infected wounds, a variation of negative pressure wound therapy (NPWT) via the instillation of topical antibiotics (instillation VAC) has been used.3 This variation has been advantageous even in soft tissue fungal infections. Early and aggressive treatment of such infections is critical to prevent dissemination, particularly in aggressive infections, such as mucormycosis.4 We present a case of a patient with a mucormycosis infection of his left Achilles tendon and overlying skin who was successfully treated with surgical debridement and wound care with instillation NPWT with topical amphotericin B.
Case Presentation
A 53-year-old man underwent left Achilles tendon reconstruction with allograft after a complete tear during exercise. He had no relevant medical history and was otherwise healthy, which he attributed to working out daily. About a week after the operation, he began having incisional breakdown, prompting presentation to an emergency department. There, he received IV antibiotics along with multiple debridements. After the wound failed to improve and intra-operative cultures grew mucormycosis, he was transferred to our facility for a higher level of care. On admission, he was immediately given IV amphotericin B and scheduled for repeat debridement.
After 1 prior debridement and 10 total days of IV amphotericin, a repeat debridement was performed. After the debridement, the installation VAC was applied to the patient’s left lower extremity wound with an instilling fluid of amphotericin B and the settings as follows: smart phase instill volume, 110 mL; soak time, 3.5 hours; target pressure, 125 mm Hg; intensity, low; and VAC therapy mode, continuous. After 5 days, the wound bed appeared clean without overt signs of infection. However, due to some toxicity to healthy surrounding soft tissue, the instillation VAC was discontinued and standard NPWT was started. The patient underwent 2 additional rounds of debridement with partial delayed closure. Four weeks after discontinuation of the instillation VAC, the wound appeared healthy and granulated so the patient underwent split-thickness skin grafting to the left posterior ankle. He subsequently completed a course of oral antifungal medication as an outpatient.
The patient was seen in the outpatient clinic for 14 months from the initial mucormycosis infection (Figure).
Discussion
Mucormycosis is an infection caused by fungi in the class Zygomycetes and of the order Mucorales that typically occurs in immunocompromised patients, especially those with diabetic ketoacidosis and neutropenia. Given that this patient had no relevant medical history and was otherwise healthy, he was at extremely low risk of this type of infection. In this patient’s case, the spores of this nonseptate hyphae wide-branching species were most likely introduced at the time of left Achilles tendon repair. Mucormycosis is progressive and can be fatal unless treated, with a mortality rate approaching 70%.5 The rarity and heterogeneity of mucormycosis make treatment variable.6 No prospective or randomized clinical trials exist in plastic surgery literature.
The use of wound VAC in combination with the instillation of amphotericin B to treat cutaneous mucormycosis is not well documented. Mucormycosis infections are traditionally addressed with surgical debridement and antifungal therapy, specifically IV amphotericin B.7,8 As previously noted, NPWT has become the gold standard in treating complex wounds.3 Additionally, wound VAC therapy with instillation has been noted in the literature as a reliable method to treat bacteria-infected wounds, providing a shorter treatment period and earlier wound closure.9 Instillation VAC therapy has proven particularly useful in complex, infected wounds, such as aggressive fungal infections.
Mucormycosis treatment is challenging particularly in the extremities as management must balance both mortality and limb salvage. In this case, the use of NPWT with wound VAC and intervals of instilling amphotericin B facilitated infection control in this lower extremity mucormycosis infection. The significant adverse effect profile of amphotericin B, particularly the nephrotoxicity, should be seriously considered when deciding the treatment regimen for patients affected by mucormycosis. Locally, topical amphotericin B has been reported to cause blistering, itchiness, redness, peeling, and dryness. However, topical preparations of amphotericin B are nontoxic unlike their IV counterpart, able to cross the physiological barriers of the skin while simultaneously targeting macrophages in the dermis and epidermis.10
Conclusions
Although the mainstay of treatment for systemic mucormycosis is radical debridement and IV amphotericin B, a more localized infection may benefit from an adjunct like an instillation wound VAC with topical amphotericin B, as presented in this case study. Swift treatment with wound VAC was beneficial in the overall recovery and tissue healing of this patient and may be beneficial in similar cases.
1. Normandin S, Safran T, Winocour S, et al. negative pressure wound therapy: mechanism of action and clinical applications. Semin Plast Surg. 2021;35(3):164-170. doi:10.1055/s-0041-1731792
2. Agarwal P, Kukrele R, Sharma D. Vacuum assisted closure (VAC)/negative pressure wound therapy (NPWT) for difficult wounds: a review. J Clin Orthop Trauma. 2019;10(5):845-848. doi:10.1016/j.jcot.2019.06.015
3. Gabriel A, Shores J, Bernstein B, et al. A clinical review of infected wound treatment with Vacuum Assisted Closure (V.A.C.) therapy: experience and case series. Int Wound J. 2009;6(suppl 2):1-25. doi:10.1111/j.1742-481X.2009.00628.x
4. Guégan S, Lanternier F, Rouzaud C, Dupin N, Lortholary O. Fungal skin and soft tissue infections. Curr Opin Infect Dis. 2016;29(2):124-130. doi:10.1097/QCO.0000000000000252
5. Ibrahim AS, Spellberg B, Walsh TJ, Kontoyiannis DP. Pathogenesis of mucormycosis. Clin Infect Dis. 2012;54(suppl 1):S16-S22. doi:10.1093/cid/cir865
6. Sipsas NV, Gamaletsou MN, Anastasopoulou A, Kontoyiannis DP. Therapy of mucormycosis. J Fungi (Basel). 2018;4(3):90. Published 2018 Jul 31. doi:10.3390/jof4030090
7. Spellberg B, Edwards J Jr, Ibrahim A. Novel perspectives on mucormycosis: pathophysiology, presentation, and management. Clin Microbiol Rev. 2005;18(3):556-569. doi:10.1128/CMR.18.3.556-569.2005
8. Losee JE, Selber J, Vega S, Hall C, Scott G, Serletti JM. Primary cutaneous mucormycosis: guide to surgical management. Ann Plast Surg. 2002;49(4):385-390. doi:10.1097/00000637-200210000-00009
9. Webb LX. New techniques in wound management: vacuum-assisted wound closure. J Am Acad Orthop Surg. 2002;10(5):303-311. doi:10.5435/00124635-200209000-00002
10. Varikuti S, Oghumu S, Saljoughian N, et al. Topical treatment with nanoliposomal Amphotericin B reduces early lesion growth but fails to induce cure in an experimental model of cutaneous leishmaniasis caused by Leishmania mexicana. Acta Trop. 2017;173:102-108. doi:10.1016/j.actatropica.2017.06.004

Nonsurgical options for stress urinary incontinence
In the article, “Nonsurgical treatments for patients with urinary incontinence” (OBG Manag. September 2022;34:36- 42.), the authors, Ashley J. Murillo, MD, and Halina M. Zyczynski, MD, discuss the successful nonsurgical management of urge urinary incontinence, stress urinary incontinence, and mixed urinary incontinence, presenting the case of a 39-year-old woman with urine leakage during exercise. As a follow-up for readers, OBG Management posted a quiz question asking, “Which of the following is a nonsurgical treatment for stress urinary incontinence?”
A total of 129 readers cast their vote:
50.4% (65 readers) said bladder retraining
36.4% (47 readers) said periurethral bulking
13.2% (17 readers) said antimuscarinic agents
The correct answer was periurethral bulking, as bladder retraining and antimuscarinic agents, according to TABLE 1 in Murillo and Zyczynski’s article, are appropriate for managing urge urinary incontinence.
Increased dietary fiber intake might protect from migraine
Key clinical point: Increased intake of dietary fiber seemed protective against migraine or severe headache in a large population of US adults.
Major finding: Risk for migraine or severe headache was 26% lower among patients in the highest (22.10-95.50 g/day) vs lowest (0.0-7.79 g/day) quintile of dietary fiber intake (adjusted odds ratio 0.74; P = .0029).
Study details: This cross-sectional study included 12,710 participants from the US National Health and Nutrition Examination Survey, of which 2527 experienced migraine or severe headache.
Disclosures: This study did not declare the source of funding. The authors declared no conflicts of interest.
Source: Huang H and He K. The association between dietary fiber intake and severe headaches or migraine in US adults. Front Nutr. 2023;9:1044066 (Jan 4). Doi: 10.3389/fnut.2022.1044066
Index vein diagnoses migraine aura with excellent accuracy in emergency setting
Key clinical point: Index vein served as a good biomarker for migraine aura with a high diagnostic specificity and sensitivity in the emergency setting in patients with acute neurological deficit.
Major finding: Prevalence of index vein was more frequent in patients with migraine aura (17%) vs those with stroke (2%)/epileptic seizure (4%) or control participants (1%; P < .001). Index vein was highly specific to migraine aura (specificity 97%; 95% CI 95%-99%), with an ability to diagnose migraine aura with 94% sensitivity (95% CI 87.4%-97.8%) and 73.5% specificity (95% CI 66.8%-79.5%) at a cut-off of 4 points.
Study details: This retrospective case-control study included 400 patients who presented to the emergency department with an acute neurological deficit, underwent brain magnetic resonance imaging, and were discharged with a diagnosis of migraine aura/ischemic stroke/epileptic seizure or none of these (control participants).
Disclosures: This study did not receive any specific funding. Two authors declared serving as part-time employees at Zynnon or as a consultant, speaker, or advisory board member for various sources.
Source: Scutelnic A et al. The “index vein” as a sign for migraine aura in the emergency setting. Cephalalgia. 2023 (Jan 9). Doi: 10.1177/033310242211320
Higher dietary zinc intake tied to reduced migraine risk
Key clinical point: American adults with higher dietary zinc intake were at a lower risk for migraine, demonstrating an inverse association between dietary zinc intake and migraine.
Major finding: The risk for migraine was significantly lower among participants in the highest (≥15.8 mg/day) vs lowest (≤5.9 mg/day) quintile of dietary zinc intake (adjusted odds ratio [aOR] 0.70; P = .029) and remained low among participants with dietary zinc intake of at least 6.0-8.4 mg/day (aOR 0.73; P = .004).
Study details: This cross-sectional study included 11,088 adults with or without migraine from the US National Health and Nutrition Examination Survey (1999-2004).
Disclosures: This study was supported by grants from the National Natural Science Foundation of China. The authors declared no conflicts of interest.
Source: Liu H et al. Dietary zinc intake and migraine in adults: A cross-sectional analysis of the National Health and Nutrition Examination Survey 1999-2004. Headache. 2023 (Jan 1). Doi: 10.1111/head.14431
Eptinezumab improves patient-reported outcomes in migraine
Key clinical point: Eptinezumab vs placebo demonstrated significantly greater and sustained improvements in patient-reported overall health, quality of life, and most bothersome symptoms in patients with migraine and 2-4 preventive treatment failures.
Major finding: At week 12, 100 and 300 mg eptinezumab vs placebo led to significantly greater improvements in EQ-5D-5L visual analog scale scores (difference from placebo [Δ] 5.1; P < .001, and Δ 7.5; P < .0001, respectively), 6-item Headache Impact Test total scores (Δ −3.8 and −5.4, respectively; both P < .0001), Migraine-Specific Quality of Life Questionnaire scores (both P < .0001), and patient-identified most bothersome symptoms (both P < .0001), with effects sustained until week 24.
Study details: Findings are from the phase 3b DELIVER trial including 890 adults with episodic/chronic migraine and 2-4 prior preventive treatment failures who were randomly assigned to receive eptinezumab (100/300 mg) or placebo.
Disclosures: The clinical trial and publication was funded by H. Lundbeck A/S. Five authors declared being employees of H. Lundbeck A/S. Three authors reported ties with various sources.
Source: Goadsby PJ et al. Eptinezumab improved patient-reported outcomes and quality of life in patients with migraine and prior preventive treatment failures. Eur J Neurol. 2022 (Dec 30). Doi: 10.1111/ene.15670
Chronic migraine: OnabotulinumtoxinA effectively reduces neck disability
Key clinical point: Single session of onabotulinumtoxinA effectively reduced neck and migraine-related disability and pain intensity over 3 months in patients with chronic migraine.
Major finding: OnabotulinumtoxinA significantly reduced Neck Disability Index scores (median −16.5 points; P < .001) and Migraine Disability Assessment scores (median −28 points; P < .001) after 4 weeks. The neck pain intensity and migraine headache intensity reduced by almost half (both P < .001) and the median number of monthly headache days reduced from 20 to 6 days (P < .001) after 3 months of onabotulinumtoxinA treatment.
Study details: This retrospective study included 134 patients with chronic migraine who received one session of onabotulinumtoxinA treatment.
Disclosures: This study did not receive any external funding. The authors declared no conflicts of interest.
Source: Onan D et al. OnabotulinumtoxinA treatment in chronic migraine: Investigation of its effects on disability, headache and neck pain intensity. Toxins (Basel). 2022;15(1):29 (Dec 30). Doi: 10.3390/toxins15010029