User login
Anti-obesity medications: Breakthroughs and limitations
Obesity is a major health problem in the United States. The Centers for Disease Control and Prevention (CDC) defines the problem as weight that is higher than what is healthy for a given height, with quantitative definitions of overweight and obesity as body mass indices (BMIs) of 25 to 29.9 kg/m2 and ≥ 30 kg/m2, respectively.1 The prevalence of obesity among adults in 2017 ̶ 2018 was reported by the CDC to be 42.4%.2 Among women, the reported prevalence of obesity was lowest among Asian individuals (17.2%) and greatest among non-Hispanic Black individuals (56.9%), with White (39.8%) and Hispanic individuals (43.7%) having rates in between.2 In a meta-analysis of prospective studies that included 4 million people who were never smokers and had no chronic disease at baseline, age- and sex-adjusted mortality rates were studied over a median of 14 years of follow-up.3 Compared with those with a BMI of 20 to 25 kg/m2, people with a BMI of 30 to 34.9 kg/m2 or a BMI of 35 to 39.9 kg/m2 had increased risks of death of 46% and 94%, respectively, demonstrating that obesity increases this risk.3
The increased risk of death associated with obesity is caused by obesity-related diseases that cause early mortality, including diabetes mellitus (DM), dyslipidemia, hypertension, coronary heart disease, heart failure, atrial fibrillation, stroke, and venous thromboembolic events.4 Obesity is also associated with an increased risk of many cancers, including cancer of the endometrium, kidney, esophagus, stomach, colon, rectum, gallbladder, pancreas, liver, and breast.5 With regard to gynecologic disease, obesity is associated with an increased risk of fibroids and heavy menstrual bleeding.6 For pregnant patients, obesity is associated with increased risks of7:
- miscarriage and stillbirth
- preeclampsia and gestational hypertension
- gestational diabetes
- severe maternal morbidity
- postterm pregnancy
- venous thromboembolism
- endometritis.
For obese patients, weight loss can normalize blood pressure, reduce the risk of cardiovascular events, decrease the risk of cancer, and cure type 2 DM.8
Bariatric surgery: The gold standard treatment for reliable and sustained weight loss
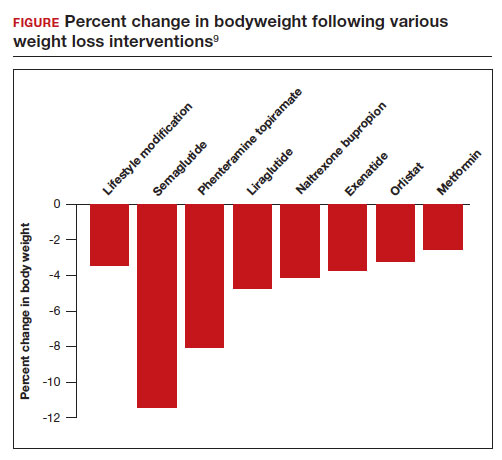
All patients with obesity should be counseled to reduce caloric intake and increase physical activity. Dietary counseling provided by a nutritionist may help reinforce advice given by a provider. However, lifestyle interventions are associated with modest weight loss (<5% of bodyweight; FIGURE
In the Swedish Obese Subjects study, involving 2,010 people, following bariatric surgery the mean decrease in bodyweight was 23% at 2 years, with a slow increase in weight thereafter, resulting in a sustained mean weight loss of 18% at 10 years.8 In this study, people in the diet and exercise control group had no change in bodyweight over 10 years of follow-up.8 Not all eligible obese patients want to undergo bariatric surgery because it is an arduous sequential process involving 6 months of intensive preoperative preparation, bariatric surgery, recovery, and intensive postoperative follow-up. The perioperative mortality rate is 0.03% to 0.2%.10 Following bariatric surgery, additional operations may be necessary for more than 10% of patients.10 With recent breakthroughs in the medication management of obesity, patients who do not want bariatric surgery can achieve reliable weight loss of greater than 10% of body weight with glucagon-like peptide -1 (GLP-1) agonists.
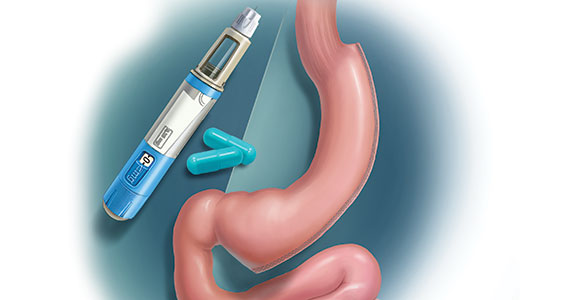
GLP-1 agonist analogues: Practice-changing breakthrough in medication treatment
GLP-1, a 30 amino acid peptide, is produced by intestinal enteroendocrine cells and neurons in the medulla and hypothalamus.11 GLP-1 reduces hunger cravings and causes satiety, reducing daily food intake.12 GLP-1 also enhances the secretion of insulin, making GLP-1 agonists an effective treatment for type 2 DM. In humans and experimental animals, the administration of exogenous GLP-1 agonists decreases hunger cravings and causes satiety, reducing food intake, resulting in weight loss.12 The synthetic GLP-1 agonists, liraglutide (Saxenda) and semaglutide (Wegovy) are approved by the US Food and Drug Administration (FDA) as anti-obesity medications.
Native GLP-1 has a short circulating half-life of approximately 2 minutes. The synthetic GLP-1 agonist medications liraglutide and semaglutide are modified to significantly increase their half-life. Liraglutide is a modified version of GLP-1 with a palmitic acid side chain and an amino acid spacer resulting in reduced degradation and a 15-hour half-life, necessitating daily administration. Semaglutide has a steric acid diacid at Lys26, a large synthetic spacer, a modification of amino acid 8 with the addition of α-aminobutyric acid and a 165-hour half-life, permitting weekly administration.13 For weight loss, liraglutide and semaglultide are administered by subcutaneous injection. Tirzepatide (Mounjaro) is a novel GLP-1 agonist. It is also a gastric inhibitory peptide, is FDA approved to treat type 2 DM, and is awaiting FDA approval as a weight loss medication.Tirzepatide causes substantial weight loss, similar to the effect of semaglutide.14
Semaglutide and weight loss
Semaglutide is approved by the FDA for chronic weight management as an adjunct to a reduced-calorie diet and increased physical activity in adults with a BMI ≥ 30 kg/m2 or ≥ 27 kg/m2 in the presence of a weight-related comorbidity. It is also FDA approved to treat type 2 DM.
In a weight loss trial, 1,961 overweight and obese patients with a mean BMI of 38 kg/m2, were randomly assigned to semaglutide or placebo treatment for 68 weeks. All the participants were following a regimen that included a calorie-reduced diet and increased physical activity. The mean changes in body weight for the patients in the semaglutide and placebo treatment groups were -14.9% and -2.4%, respectively. The treatment difference was -12.4% (95% confidence interval [CI], -13.4% to -11.5%; P <.001). In this study, compared with placebo, semaglutide treatment resulted in a greater decrease in waist circumference, -5.3 in versus -1.6 in.15 A network meta-analysis of the efficacy of weight loss medicines indicates that semaglutide is the most effective medication currently FDA approved for weight loss, reliably producing substantial weight loss (FIGURE).9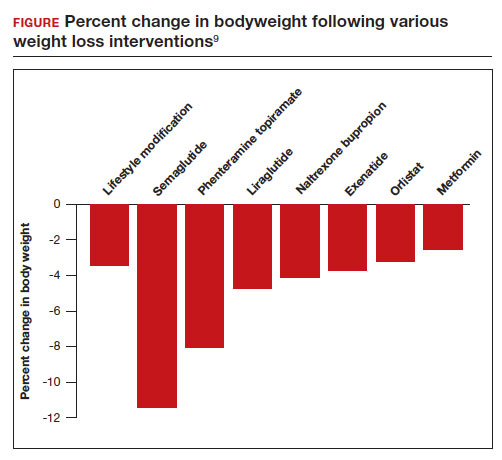
In one randomized clinical trial, investigators directly compared the efficacy of semaglutide and liraglutide in achieving weight loss. In this trial, 338 patients were assigned randomly to treatment with semaglutide 2.4 mg weekly subcutaneous injection, liraglutide 3.0 mg daily subcutaneous injection, or placebo. All the participants were following a regimen that included a calorie-reduced diet and increased physical activity.16 After 68 weeks of treatment, the mean weight changes were -15.8%, -6.4%, and -1.9% in the semaglutide, liraglutide, and placebo groups, respectively. The difference between the semaglutide and liraglutide groups was -9.4% (95% CI, -12% to -6.8%; P <.001).16
Continue to: Semaglutide dose-escalation and contraindications...
Semaglutide dose-escalation and contraindications
For weight loss, the target dose of semaglutide is 2.4 mg once weekly subcutaneous injection achieved by sequential dose escalation. To give patients time to adjust to adverse effects caused by the medication, a standardized dose-escalation regimen is recommended. The FDA-approved escalation regimen for semaglutide treatment begins with a weekly subcutaneous dose of 0.25 mg for 4 weeks, followed by an increase in the weekly dosage every 4 weeks: 0.5 mg, 1.0 mg, 1.7 mg, and 2.4 mg.17 To support the dose-escalation process there are 5 unique autoinjectors that deliver the appropriate dose for the current step.
Semaglutide is contraindicated if the patient has an allergy to the medication or if there is a personal or family history of medullary thyroid cancer.17 In animal toxicology studies, semaglutide at clinically relevant dosing was associated with an increased risk of developing medullary thyroid cancer. Patients with a personal history of multiple endocrine neoplasia syndrome type 2, (medullary thyroid cancer, pheochromocytoma, and primary hyperparathyroidism) should not take semaglutide. Semaglutide may cause fetal harm and the FDA recommends discontinuing semaglutide at least 2 months before pregnancy.17 According to the FDA, the safety of semaglutide during breastfeeding has not been established. In Canada, breastfeeding is a contraindication to semaglutide treatment.18
Limitations of medication treatment of obesity
There are important limitations to semaglutide treatment of obesity, including:
- weight gain after stopping treatment
- limited medical insurance supportfor an expensive medication treatment
- bothersome adverse effects.
Weight gain posttreatment. After stopping medication treatment of obesity, weight gain occurs in most patients. However, patients may remain below baseline weight for a long time after stopping medication therapy. In one trial of 803 patients, after 20 weeks of semaglutide treatment (16-week dose-escalation phase, followed by 4 weeks on a weekly dose of 2.4 mg), the participants were randomized to 48 additional weeks of semaglutide or placebo.19 All the participants were following a regimen that included a calorie-reduced diet and increased physical activity. At the initial 20 weeks of treatment time point the mean weight change was -10.6%. Over the following 48 weeks, the patients treated with semaglutidehad an additional mean weight change of -7.9%, while the mean weight change for the placebo group was +6.9%.
Medical insurance coverage. A major barrier to semaglutide treatment of obesity is the medication’s cost. At the website GoodRx (https://www.goodrx.com/), the estimated price for a 1-month supply of semaglutide (Wegovy) is $1,350.20 By contrast, a 1-month supply of phentermine-topiramate (Qsymia) is approximately $205. Currently, many medical insurance plans do not cover the cost of semaglutide treatment for weight loss. Patent protection for liraglutide may expire in the next few years, permitting the marketing of a lower-cost generic formulation, increasing the availability of the medication. However, as noted above, compared with liraglutide, semaglutide treatment results in much greater weight loss.
The most common adverse effects associated with semaglutide treatment are nausea, vomiting, diarrhea, and constipation. In one randomized clinical trial involving 1,961 patients, the frequency of adverse effects reported by patients taking semaglutide incrementally above the frequency of the same adverse effect reported by patients on placebo was: nausea (27%), vomiting (18%), diarrhea (16%), constipation (14%), dyspepsia (7%), and abdominal pain (5%).15 In this study, treatment was discontinued due to adverse effects in 7% and 3% of the patients in the semaglutide and placebo groups, respectively. Experts believe that adverse effects can be minimized by increasing the dose slowly and decreasing the dose if adverse effects are bothersome to the patient.
Measuring the benefits of semaglutide weight loss
Overweight and obesity are prevalent problems with many adverse consequences, including an increased risk of death. In population studies, weight loss following bariatric surgery is associated with a substantial reduction in mortality, cancer, and heart disease compared with conventional therapy.21 Over the next few years, the effect of semaglutide-induced weight loss on the rate of cancer and heart disease should become clear. If semaglutide treatment of obesity is associated with a reduction in cancer and heart disease, it would be a truly breakthrough medication. ●
- Defining adult and overweight obesity. Centers for Disease Control and Prevention website. https://www.cdc.gov/obesity/basics/adult-defining.html. Accessed June 19, 2023.
- Hales CM, Carroll MD, Fryar CD, et al. Prevalence of obesity and severe obesity among adults: United States, 2017–2018. NCH Data Brief. 2020;360. https://www.cdc.gov/nchs/data /databriefs/db360-h.pdf. Accessed June 19, 2023.
- The Global BMI Mortality Collaboration. Bodymass index and all-cause mortality: individual- participant-data meta-analysis of 239 prospective studies in four continents. Lancet. 2016;388:776-786.
- Grover SA, Kaouache M, Rempel P, et al. Years of life lost and health life-years lost from diabetes and cardiovascular disease in the overweight and obese people: a modelling study. Lancet Diabetes Endocrinol. 2015;3:114-122.
- Lega IC, Lipscombe LL. Review: diabetes, obesity and cancer—pathophysiology and clinical implications. Endocr Rev. 2020;41:bnz014.
- Venkatesh SS, Ferreira T, Benonisdottir S, et al. Obesity and risk of female reproductive conditions: a mendelian randomization study. PLoS Med. 19:e1003679.
- Catalano PM, Shankar K. Obesity and pregnancy: mechanisms of short term and longterm adverse consequences for mother and child. BMJ. 2017;356:j1.
- Sjorstrom L. Review of the key results from the Swedish Obese Subjects (SOS) trial—a prospective controlled intervention study of bariatric surgery. J Intern Med. 2013;273:219-234.
- Shi Q, Wang Y, Hao Q, et al. Pharmacotherapy for adults with overweight and obesity: a systematic review and network meta-analysis of randomized controlled trials. Lancet. 2022;399:259-269.
- Arterburn DE, Telem DA, Kushner RF, et al. Benefits and risks of bariatric surgery in adults: a review. JAMA. 2020;324:879-887.
- Brierly DI, Holt MK, Singh A, et al. Central and peripheral GLP-1 systems are involved in the control of eating behavior by linking food intake and satiety. Nat Metab. 2021;3:258-273.
- Friedrichsen M, Breitschaft A, Tadayon S, et al. The effect of semaglutide 2.4 mg once weekly on energy intake, appetite, control of eating and gastric emptying in adults with obesity. Diabetes Obes Metab. 2021;23:754-762.
- Gotfredsen CF, Molck AM, Thorup I, et al. The human GLP-1 analogs liraglutide and semaglutide: absence of histopathological effects on the pancreas in nonhuman primates. Diabetes. 2014;63:2486-2497.
- Frias JP, Davies MJ, Rosenstock J, et al. Tirzepatide versus semaglutide once weekly in patients with type 2 diabetes. N Engl J Med. 2021;385:503-515.
- Wilding JPH, Batterham RL, Calanna S, et al. Once weekly semaglutide in adults with overweight or obesity. N Engl J Med. 2021;384:989-1000.
- Rubino DM, Greenway FL, Khalid U, et al. Effect of weekly subcutaneous semaglutide vs daily liraglutide on body weight in adults with overweight or obesity without diabetes. JAMA. 2022;327:138-150.
- Wegovy [package insert]. Bagsvaerd, Denmark: Novo Nordisk; 2021.
- Wegovy Product Monograph. Mississauga, Ontario: Novo Nordisk Canada Inc; June 30, 2022. https://pdf.hres.ca/dpd_pm/00066484.PDF
- Rubino D, Abrahamsson N, Davies M, et al. Effect of continued weekly subcutaneous semaglutide vs placebo on weight loss maintenance in adults with overweight or obesity. JAMA. 2021;325: 1414-1425.
- GoodRx website. https://www.goodrx.com/. Accessed June 19, 2023.
- Wiggins T, Guidozzi N, Welbourn R, et al. Association of bariatric surgery with all-cause mortality and incidence of obesity-related disease at a population level: a systematic review and metaanalysis. PLoS Med. 2020;17:e1003206.

Robert L. Barbieri, MD
Editor in Chief, OBG Management
Chair Emeritus, Department of Obstetrics and Gynecology
Brigham and Women’s Hospital
Kate Macy Ladd Distinguished Professor of Obstetrics,
Gynecology and Reproductive Biology
Harvard Medical School
Boston, Massachusetts
The author reports no conflict of interest related to this article.
Robert L. Barbieri, MD
Editor in Chief, OBG Management
Chair Emeritus, Department of Obstetrics and Gynecology
Brigham and Women’s Hospital
Kate Macy Ladd Distinguished Professor of Obstetrics,
Gynecology and Reproductive Biology
Harvard Medical School
Boston, Massachusetts
The author reports no conflict of interest related to this article.
Robert L. Barbieri, MD
Editor in Chief, OBG Management
Chair Emeritus, Department of Obstetrics and Gynecology
Brigham and Women’s Hospital
Kate Macy Ladd Distinguished Professor of Obstetrics,
Gynecology and Reproductive Biology
Harvard Medical School
Boston, Massachusetts
The author reports no conflict of interest related to this article.
Obesity is a major health problem in the United States. The Centers for Disease Control and Prevention (CDC) defines the problem as weight that is higher than what is healthy for a given height, with quantitative definitions of overweight and obesity as body mass indices (BMIs) of 25 to 29.9 kg/m2 and ≥ 30 kg/m2, respectively.1 The prevalence of obesity among adults in 2017 ̶ 2018 was reported by the CDC to be 42.4%.2 Among women, the reported prevalence of obesity was lowest among Asian individuals (17.2%) and greatest among non-Hispanic Black individuals (56.9%), with White (39.8%) and Hispanic individuals (43.7%) having rates in between.2 In a meta-analysis of prospective studies that included 4 million people who were never smokers and had no chronic disease at baseline, age- and sex-adjusted mortality rates were studied over a median of 14 years of follow-up.3 Compared with those with a BMI of 20 to 25 kg/m2, people with a BMI of 30 to 34.9 kg/m2 or a BMI of 35 to 39.9 kg/m2 had increased risks of death of 46% and 94%, respectively, demonstrating that obesity increases this risk.3
The increased risk of death associated with obesity is caused by obesity-related diseases that cause early mortality, including diabetes mellitus (DM), dyslipidemia, hypertension, coronary heart disease, heart failure, atrial fibrillation, stroke, and venous thromboembolic events.4 Obesity is also associated with an increased risk of many cancers, including cancer of the endometrium, kidney, esophagus, stomach, colon, rectum, gallbladder, pancreas, liver, and breast.5 With regard to gynecologic disease, obesity is associated with an increased risk of fibroids and heavy menstrual bleeding.6 For pregnant patients, obesity is associated with increased risks of7:
- miscarriage and stillbirth
- preeclampsia and gestational hypertension
- gestational diabetes
- severe maternal morbidity
- postterm pregnancy
- venous thromboembolism
- endometritis.
For obese patients, weight loss can normalize blood pressure, reduce the risk of cardiovascular events, decrease the risk of cancer, and cure type 2 DM.8
Bariatric surgery: The gold standard treatment for reliable and sustained weight loss
All patients with obesity should be counseled to reduce caloric intake and increase physical activity. Dietary counseling provided by a nutritionist may help reinforce advice given by a provider. However, lifestyle interventions are associated with modest weight loss (<5% of bodyweight; FIGURE
In the Swedish Obese Subjects study, involving 2,010 people, following bariatric surgery the mean decrease in bodyweight was 23% at 2 years, with a slow increase in weight thereafter, resulting in a sustained mean weight loss of 18% at 10 years.8 In this study, people in the diet and exercise control group had no change in bodyweight over 10 years of follow-up.8 Not all eligible obese patients want to undergo bariatric surgery because it is an arduous sequential process involving 6 months of intensive preoperative preparation, bariatric surgery, recovery, and intensive postoperative follow-up. The perioperative mortality rate is 0.03% to 0.2%.10 Following bariatric surgery, additional operations may be necessary for more than 10% of patients.10 With recent breakthroughs in the medication management of obesity, patients who do not want bariatric surgery can achieve reliable weight loss of greater than 10% of body weight with glucagon-like peptide -1 (GLP-1) agonists.
GLP-1 agonist analogues: Practice-changing breakthrough in medication treatment
GLP-1, a 30 amino acid peptide, is produced by intestinal enteroendocrine cells and neurons in the medulla and hypothalamus.11 GLP-1 reduces hunger cravings and causes satiety, reducing daily food intake.12 GLP-1 also enhances the secretion of insulin, making GLP-1 agonists an effective treatment for type 2 DM. In humans and experimental animals, the administration of exogenous GLP-1 agonists decreases hunger cravings and causes satiety, reducing food intake, resulting in weight loss.12 The synthetic GLP-1 agonists, liraglutide (Saxenda) and semaglutide (Wegovy) are approved by the US Food and Drug Administration (FDA) as anti-obesity medications.
Native GLP-1 has a short circulating half-life of approximately 2 minutes. The synthetic GLP-1 agonist medications liraglutide and semaglutide are modified to significantly increase their half-life. Liraglutide is a modified version of GLP-1 with a palmitic acid side chain and an amino acid spacer resulting in reduced degradation and a 15-hour half-life, necessitating daily administration. Semaglutide has a steric acid diacid at Lys26, a large synthetic spacer, a modification of amino acid 8 with the addition of α-aminobutyric acid and a 165-hour half-life, permitting weekly administration.13 For weight loss, liraglutide and semaglultide are administered by subcutaneous injection. Tirzepatide (Mounjaro) is a novel GLP-1 agonist. It is also a gastric inhibitory peptide, is FDA approved to treat type 2 DM, and is awaiting FDA approval as a weight loss medication.Tirzepatide causes substantial weight loss, similar to the effect of semaglutide.14
Semaglutide and weight loss
Semaglutide is approved by the FDA for chronic weight management as an adjunct to a reduced-calorie diet and increased physical activity in adults with a BMI ≥ 30 kg/m2 or ≥ 27 kg/m2 in the presence of a weight-related comorbidity. It is also FDA approved to treat type 2 DM.
In a weight loss trial, 1,961 overweight and obese patients with a mean BMI of 38 kg/m2, were randomly assigned to semaglutide or placebo treatment for 68 weeks. All the participants were following a regimen that included a calorie-reduced diet and increased physical activity. The mean changes in body weight for the patients in the semaglutide and placebo treatment groups were -14.9% and -2.4%, respectively. The treatment difference was -12.4% (95% confidence interval [CI], -13.4% to -11.5%; P <.001). In this study, compared with placebo, semaglutide treatment resulted in a greater decrease in waist circumference, -5.3 in versus -1.6 in.15 A network meta-analysis of the efficacy of weight loss medicines indicates that semaglutide is the most effective medication currently FDA approved for weight loss, reliably producing substantial weight loss (FIGURE).9
In one randomized clinical trial, investigators directly compared the efficacy of semaglutide and liraglutide in achieving weight loss. In this trial, 338 patients were assigned randomly to treatment with semaglutide 2.4 mg weekly subcutaneous injection, liraglutide 3.0 mg daily subcutaneous injection, or placebo. All the participants were following a regimen that included a calorie-reduced diet and increased physical activity.16 After 68 weeks of treatment, the mean weight changes were -15.8%, -6.4%, and -1.9% in the semaglutide, liraglutide, and placebo groups, respectively. The difference between the semaglutide and liraglutide groups was -9.4% (95% CI, -12% to -6.8%; P <.001).16
Continue to: Semaglutide dose-escalation and contraindications...
Semaglutide dose-escalation and contraindications
For weight loss, the target dose of semaglutide is 2.4 mg once weekly subcutaneous injection achieved by sequential dose escalation. To give patients time to adjust to adverse effects caused by the medication, a standardized dose-escalation regimen is recommended. The FDA-approved escalation regimen for semaglutide treatment begins with a weekly subcutaneous dose of 0.25 mg for 4 weeks, followed by an increase in the weekly dosage every 4 weeks: 0.5 mg, 1.0 mg, 1.7 mg, and 2.4 mg.17 To support the dose-escalation process there are 5 unique autoinjectors that deliver the appropriate dose for the current step.
Semaglutide is contraindicated if the patient has an allergy to the medication or if there is a personal or family history of medullary thyroid cancer.17 In animal toxicology studies, semaglutide at clinically relevant dosing was associated with an increased risk of developing medullary thyroid cancer. Patients with a personal history of multiple endocrine neoplasia syndrome type 2, (medullary thyroid cancer, pheochromocytoma, and primary hyperparathyroidism) should not take semaglutide. Semaglutide may cause fetal harm and the FDA recommends discontinuing semaglutide at least 2 months before pregnancy.17 According to the FDA, the safety of semaglutide during breastfeeding has not been established. In Canada, breastfeeding is a contraindication to semaglutide treatment.18
Limitations of medication treatment of obesity
There are important limitations to semaglutide treatment of obesity, including:
- weight gain after stopping treatment
- limited medical insurance supportfor an expensive medication treatment
- bothersome adverse effects.
Weight gain posttreatment. After stopping medication treatment of obesity, weight gain occurs in most patients. However, patients may remain below baseline weight for a long time after stopping medication therapy. In one trial of 803 patients, after 20 weeks of semaglutide treatment (16-week dose-escalation phase, followed by 4 weeks on a weekly dose of 2.4 mg), the participants were randomized to 48 additional weeks of semaglutide or placebo.19 All the participants were following a regimen that included a calorie-reduced diet and increased physical activity. At the initial 20 weeks of treatment time point the mean weight change was -10.6%. Over the following 48 weeks, the patients treated with semaglutidehad an additional mean weight change of -7.9%, while the mean weight change for the placebo group was +6.9%.
Medical insurance coverage. A major barrier to semaglutide treatment of obesity is the medication’s cost. At the website GoodRx (https://www.goodrx.com/), the estimated price for a 1-month supply of semaglutide (Wegovy) is $1,350.20 By contrast, a 1-month supply of phentermine-topiramate (Qsymia) is approximately $205. Currently, many medical insurance plans do not cover the cost of semaglutide treatment for weight loss. Patent protection for liraglutide may expire in the next few years, permitting the marketing of a lower-cost generic formulation, increasing the availability of the medication. However, as noted above, compared with liraglutide, semaglutide treatment results in much greater weight loss.
The most common adverse effects associated with semaglutide treatment are nausea, vomiting, diarrhea, and constipation. In one randomized clinical trial involving 1,961 patients, the frequency of adverse effects reported by patients taking semaglutide incrementally above the frequency of the same adverse effect reported by patients on placebo was: nausea (27%), vomiting (18%), diarrhea (16%), constipation (14%), dyspepsia (7%), and abdominal pain (5%).15 In this study, treatment was discontinued due to adverse effects in 7% and 3% of the patients in the semaglutide and placebo groups, respectively. Experts believe that adverse effects can be minimized by increasing the dose slowly and decreasing the dose if adverse effects are bothersome to the patient.
Measuring the benefits of semaglutide weight loss
Overweight and obesity are prevalent problems with many adverse consequences, including an increased risk of death. In population studies, weight loss following bariatric surgery is associated with a substantial reduction in mortality, cancer, and heart disease compared with conventional therapy.21 Over the next few years, the effect of semaglutide-induced weight loss on the rate of cancer and heart disease should become clear. If semaglutide treatment of obesity is associated with a reduction in cancer and heart disease, it would be a truly breakthrough medication. ●
Obesity is a major health problem in the United States. The Centers for Disease Control and Prevention (CDC) defines the problem as weight that is higher than what is healthy for a given height, with quantitative definitions of overweight and obesity as body mass indices (BMIs) of 25 to 29.9 kg/m2 and ≥ 30 kg/m2, respectively.1 The prevalence of obesity among adults in 2017 ̶ 2018 was reported by the CDC to be 42.4%.2 Among women, the reported prevalence of obesity was lowest among Asian individuals (17.2%) and greatest among non-Hispanic Black individuals (56.9%), with White (39.8%) and Hispanic individuals (43.7%) having rates in between.2 In a meta-analysis of prospective studies that included 4 million people who were never smokers and had no chronic disease at baseline, age- and sex-adjusted mortality rates were studied over a median of 14 years of follow-up.3 Compared with those with a BMI of 20 to 25 kg/m2, people with a BMI of 30 to 34.9 kg/m2 or a BMI of 35 to 39.9 kg/m2 had increased risks of death of 46% and 94%, respectively, demonstrating that obesity increases this risk.3
The increased risk of death associated with obesity is caused by obesity-related diseases that cause early mortality, including diabetes mellitus (DM), dyslipidemia, hypertension, coronary heart disease, heart failure, atrial fibrillation, stroke, and venous thromboembolic events.4 Obesity is also associated with an increased risk of many cancers, including cancer of the endometrium, kidney, esophagus, stomach, colon, rectum, gallbladder, pancreas, liver, and breast.5 With regard to gynecologic disease, obesity is associated with an increased risk of fibroids and heavy menstrual bleeding.6 For pregnant patients, obesity is associated with increased risks of7:
- miscarriage and stillbirth
- preeclampsia and gestational hypertension
- gestational diabetes
- severe maternal morbidity
- postterm pregnancy
- venous thromboembolism
- endometritis.
For obese patients, weight loss can normalize blood pressure, reduce the risk of cardiovascular events, decrease the risk of cancer, and cure type 2 DM.8
Bariatric surgery: The gold standard treatment for reliable and sustained weight loss
All patients with obesity should be counseled to reduce caloric intake and increase physical activity. Dietary counseling provided by a nutritionist may help reinforce advice given by a provider. However, lifestyle interventions are associated with modest weight loss (<5% of bodyweight; FIGURE
In the Swedish Obese Subjects study, involving 2,010 people, following bariatric surgery the mean decrease in bodyweight was 23% at 2 years, with a slow increase in weight thereafter, resulting in a sustained mean weight loss of 18% at 10 years.8 In this study, people in the diet and exercise control group had no change in bodyweight over 10 years of follow-up.8 Not all eligible obese patients want to undergo bariatric surgery because it is an arduous sequential process involving 6 months of intensive preoperative preparation, bariatric surgery, recovery, and intensive postoperative follow-up. The perioperative mortality rate is 0.03% to 0.2%.10 Following bariatric surgery, additional operations may be necessary for more than 10% of patients.10 With recent breakthroughs in the medication management of obesity, patients who do not want bariatric surgery can achieve reliable weight loss of greater than 10% of body weight with glucagon-like peptide -1 (GLP-1) agonists.
GLP-1 agonist analogues: Practice-changing breakthrough in medication treatment
GLP-1, a 30 amino acid peptide, is produced by intestinal enteroendocrine cells and neurons in the medulla and hypothalamus.11 GLP-1 reduces hunger cravings and causes satiety, reducing daily food intake.12 GLP-1 also enhances the secretion of insulin, making GLP-1 agonists an effective treatment for type 2 DM. In humans and experimental animals, the administration of exogenous GLP-1 agonists decreases hunger cravings and causes satiety, reducing food intake, resulting in weight loss.12 The synthetic GLP-1 agonists, liraglutide (Saxenda) and semaglutide (Wegovy) are approved by the US Food and Drug Administration (FDA) as anti-obesity medications.
Native GLP-1 has a short circulating half-life of approximately 2 minutes. The synthetic GLP-1 agonist medications liraglutide and semaglutide are modified to significantly increase their half-life. Liraglutide is a modified version of GLP-1 with a palmitic acid side chain and an amino acid spacer resulting in reduced degradation and a 15-hour half-life, necessitating daily administration. Semaglutide has a steric acid diacid at Lys26, a large synthetic spacer, a modification of amino acid 8 with the addition of α-aminobutyric acid and a 165-hour half-life, permitting weekly administration.13 For weight loss, liraglutide and semaglultide are administered by subcutaneous injection. Tirzepatide (Mounjaro) is a novel GLP-1 agonist. It is also a gastric inhibitory peptide, is FDA approved to treat type 2 DM, and is awaiting FDA approval as a weight loss medication.Tirzepatide causes substantial weight loss, similar to the effect of semaglutide.14
Semaglutide and weight loss
Semaglutide is approved by the FDA for chronic weight management as an adjunct to a reduced-calorie diet and increased physical activity in adults with a BMI ≥ 30 kg/m2 or ≥ 27 kg/m2 in the presence of a weight-related comorbidity. It is also FDA approved to treat type 2 DM.
In a weight loss trial, 1,961 overweight and obese patients with a mean BMI of 38 kg/m2, were randomly assigned to semaglutide or placebo treatment for 68 weeks. All the participants were following a regimen that included a calorie-reduced diet and increased physical activity. The mean changes in body weight for the patients in the semaglutide and placebo treatment groups were -14.9% and -2.4%, respectively. The treatment difference was -12.4% (95% confidence interval [CI], -13.4% to -11.5%; P <.001). In this study, compared with placebo, semaglutide treatment resulted in a greater decrease in waist circumference, -5.3 in versus -1.6 in.15 A network meta-analysis of the efficacy of weight loss medicines indicates that semaglutide is the most effective medication currently FDA approved for weight loss, reliably producing substantial weight loss (FIGURE).9
In one randomized clinical trial, investigators directly compared the efficacy of semaglutide and liraglutide in achieving weight loss. In this trial, 338 patients were assigned randomly to treatment with semaglutide 2.4 mg weekly subcutaneous injection, liraglutide 3.0 mg daily subcutaneous injection, or placebo. All the participants were following a regimen that included a calorie-reduced diet and increased physical activity.16 After 68 weeks of treatment, the mean weight changes were -15.8%, -6.4%, and -1.9% in the semaglutide, liraglutide, and placebo groups, respectively. The difference between the semaglutide and liraglutide groups was -9.4% (95% CI, -12% to -6.8%; P <.001).16
Continue to: Semaglutide dose-escalation and contraindications...
Semaglutide dose-escalation and contraindications
For weight loss, the target dose of semaglutide is 2.4 mg once weekly subcutaneous injection achieved by sequential dose escalation. To give patients time to adjust to adverse effects caused by the medication, a standardized dose-escalation regimen is recommended. The FDA-approved escalation regimen for semaglutide treatment begins with a weekly subcutaneous dose of 0.25 mg for 4 weeks, followed by an increase in the weekly dosage every 4 weeks: 0.5 mg, 1.0 mg, 1.7 mg, and 2.4 mg.17 To support the dose-escalation process there are 5 unique autoinjectors that deliver the appropriate dose for the current step.
Semaglutide is contraindicated if the patient has an allergy to the medication or if there is a personal or family history of medullary thyroid cancer.17 In animal toxicology studies, semaglutide at clinically relevant dosing was associated with an increased risk of developing medullary thyroid cancer. Patients with a personal history of multiple endocrine neoplasia syndrome type 2, (medullary thyroid cancer, pheochromocytoma, and primary hyperparathyroidism) should not take semaglutide. Semaglutide may cause fetal harm and the FDA recommends discontinuing semaglutide at least 2 months before pregnancy.17 According to the FDA, the safety of semaglutide during breastfeeding has not been established. In Canada, breastfeeding is a contraindication to semaglutide treatment.18
Limitations of medication treatment of obesity
There are important limitations to semaglutide treatment of obesity, including:
- weight gain after stopping treatment
- limited medical insurance supportfor an expensive medication treatment
- bothersome adverse effects.
Weight gain posttreatment. After stopping medication treatment of obesity, weight gain occurs in most patients. However, patients may remain below baseline weight for a long time after stopping medication therapy. In one trial of 803 patients, after 20 weeks of semaglutide treatment (16-week dose-escalation phase, followed by 4 weeks on a weekly dose of 2.4 mg), the participants were randomized to 48 additional weeks of semaglutide or placebo.19 All the participants were following a regimen that included a calorie-reduced diet and increased physical activity. At the initial 20 weeks of treatment time point the mean weight change was -10.6%. Over the following 48 weeks, the patients treated with semaglutidehad an additional mean weight change of -7.9%, while the mean weight change for the placebo group was +6.9%.
Medical insurance coverage. A major barrier to semaglutide treatment of obesity is the medication’s cost. At the website GoodRx (https://www.goodrx.com/), the estimated price for a 1-month supply of semaglutide (Wegovy) is $1,350.20 By contrast, a 1-month supply of phentermine-topiramate (Qsymia) is approximately $205. Currently, many medical insurance plans do not cover the cost of semaglutide treatment for weight loss. Patent protection for liraglutide may expire in the next few years, permitting the marketing of a lower-cost generic formulation, increasing the availability of the medication. However, as noted above, compared with liraglutide, semaglutide treatment results in much greater weight loss.
The most common adverse effects associated with semaglutide treatment are nausea, vomiting, diarrhea, and constipation. In one randomized clinical trial involving 1,961 patients, the frequency of adverse effects reported by patients taking semaglutide incrementally above the frequency of the same adverse effect reported by patients on placebo was: nausea (27%), vomiting (18%), diarrhea (16%), constipation (14%), dyspepsia (7%), and abdominal pain (5%).15 In this study, treatment was discontinued due to adverse effects in 7% and 3% of the patients in the semaglutide and placebo groups, respectively. Experts believe that adverse effects can be minimized by increasing the dose slowly and decreasing the dose if adverse effects are bothersome to the patient.
Measuring the benefits of semaglutide weight loss
Overweight and obesity are prevalent problems with many adverse consequences, including an increased risk of death. In population studies, weight loss following bariatric surgery is associated with a substantial reduction in mortality, cancer, and heart disease compared with conventional therapy.21 Over the next few years, the effect of semaglutide-induced weight loss on the rate of cancer and heart disease should become clear. If semaglutide treatment of obesity is associated with a reduction in cancer and heart disease, it would be a truly breakthrough medication. ●
- Defining adult and overweight obesity. Centers for Disease Control and Prevention website. https://www.cdc.gov/obesity/basics/adult-defining.html. Accessed June 19, 2023.
- Hales CM, Carroll MD, Fryar CD, et al. Prevalence of obesity and severe obesity among adults: United States, 2017–2018. NCH Data Brief. 2020;360. https://www.cdc.gov/nchs/data /databriefs/db360-h.pdf. Accessed June 19, 2023.
- The Global BMI Mortality Collaboration. Bodymass index and all-cause mortality: individual- participant-data meta-analysis of 239 prospective studies in four continents. Lancet. 2016;388:776-786.
- Grover SA, Kaouache M, Rempel P, et al. Years of life lost and health life-years lost from diabetes and cardiovascular disease in the overweight and obese people: a modelling study. Lancet Diabetes Endocrinol. 2015;3:114-122.
- Lega IC, Lipscombe LL. Review: diabetes, obesity and cancer—pathophysiology and clinical implications. Endocr Rev. 2020;41:bnz014.
- Venkatesh SS, Ferreira T, Benonisdottir S, et al. Obesity and risk of female reproductive conditions: a mendelian randomization study. PLoS Med. 19:e1003679.
- Catalano PM, Shankar K. Obesity and pregnancy: mechanisms of short term and longterm adverse consequences for mother and child. BMJ. 2017;356:j1.
- Sjorstrom L. Review of the key results from the Swedish Obese Subjects (SOS) trial—a prospective controlled intervention study of bariatric surgery. J Intern Med. 2013;273:219-234.
- Shi Q, Wang Y, Hao Q, et al. Pharmacotherapy for adults with overweight and obesity: a systematic review and network meta-analysis of randomized controlled trials. Lancet. 2022;399:259-269.
- Arterburn DE, Telem DA, Kushner RF, et al. Benefits and risks of bariatric surgery in adults: a review. JAMA. 2020;324:879-887.
- Brierly DI, Holt MK, Singh A, et al. Central and peripheral GLP-1 systems are involved in the control of eating behavior by linking food intake and satiety. Nat Metab. 2021;3:258-273.
- Friedrichsen M, Breitschaft A, Tadayon S, et al. The effect of semaglutide 2.4 mg once weekly on energy intake, appetite, control of eating and gastric emptying in adults with obesity. Diabetes Obes Metab. 2021;23:754-762.
- Gotfredsen CF, Molck AM, Thorup I, et al. The human GLP-1 analogs liraglutide and semaglutide: absence of histopathological effects on the pancreas in nonhuman primates. Diabetes. 2014;63:2486-2497.
- Frias JP, Davies MJ, Rosenstock J, et al. Tirzepatide versus semaglutide once weekly in patients with type 2 diabetes. N Engl J Med. 2021;385:503-515.
- Wilding JPH, Batterham RL, Calanna S, et al. Once weekly semaglutide in adults with overweight or obesity. N Engl J Med. 2021;384:989-1000.
- Rubino DM, Greenway FL, Khalid U, et al. Effect of weekly subcutaneous semaglutide vs daily liraglutide on body weight in adults with overweight or obesity without diabetes. JAMA. 2022;327:138-150.
- Wegovy [package insert]. Bagsvaerd, Denmark: Novo Nordisk; 2021.
- Wegovy Product Monograph. Mississauga, Ontario: Novo Nordisk Canada Inc; June 30, 2022. https://pdf.hres.ca/dpd_pm/00066484.PDF
- Rubino D, Abrahamsson N, Davies M, et al. Effect of continued weekly subcutaneous semaglutide vs placebo on weight loss maintenance in adults with overweight or obesity. JAMA. 2021;325: 1414-1425.
- GoodRx website. https://www.goodrx.com/. Accessed June 19, 2023.
- Wiggins T, Guidozzi N, Welbourn R, et al. Association of bariatric surgery with all-cause mortality and incidence of obesity-related disease at a population level: a systematic review and metaanalysis. PLoS Med. 2020;17:e1003206.
- Defining adult and overweight obesity. Centers for Disease Control and Prevention website. https://www.cdc.gov/obesity/basics/adult-defining.html. Accessed June 19, 2023.
- Hales CM, Carroll MD, Fryar CD, et al. Prevalence of obesity and severe obesity among adults: United States, 2017–2018. NCH Data Brief. 2020;360. https://www.cdc.gov/nchs/data /databriefs/db360-h.pdf. Accessed June 19, 2023.
- The Global BMI Mortality Collaboration. Bodymass index and all-cause mortality: individual- participant-data meta-analysis of 239 prospective studies in four continents. Lancet. 2016;388:776-786.
- Grover SA, Kaouache M, Rempel P, et al. Years of life lost and health life-years lost from diabetes and cardiovascular disease in the overweight and obese people: a modelling study. Lancet Diabetes Endocrinol. 2015;3:114-122.
- Lega IC, Lipscombe LL. Review: diabetes, obesity and cancer—pathophysiology and clinical implications. Endocr Rev. 2020;41:bnz014.
- Venkatesh SS, Ferreira T, Benonisdottir S, et al. Obesity and risk of female reproductive conditions: a mendelian randomization study. PLoS Med. 19:e1003679.
- Catalano PM, Shankar K. Obesity and pregnancy: mechanisms of short term and longterm adverse consequences for mother and child. BMJ. 2017;356:j1.
- Sjorstrom L. Review of the key results from the Swedish Obese Subjects (SOS) trial—a prospective controlled intervention study of bariatric surgery. J Intern Med. 2013;273:219-234.
- Shi Q, Wang Y, Hao Q, et al. Pharmacotherapy for adults with overweight and obesity: a systematic review and network meta-analysis of randomized controlled trials. Lancet. 2022;399:259-269.
- Arterburn DE, Telem DA, Kushner RF, et al. Benefits and risks of bariatric surgery in adults: a review. JAMA. 2020;324:879-887.
- Brierly DI, Holt MK, Singh A, et al. Central and peripheral GLP-1 systems are involved in the control of eating behavior by linking food intake and satiety. Nat Metab. 2021;3:258-273.
- Friedrichsen M, Breitschaft A, Tadayon S, et al. The effect of semaglutide 2.4 mg once weekly on energy intake, appetite, control of eating and gastric emptying in adults with obesity. Diabetes Obes Metab. 2021;23:754-762.
- Gotfredsen CF, Molck AM, Thorup I, et al. The human GLP-1 analogs liraglutide and semaglutide: absence of histopathological effects on the pancreas in nonhuman primates. Diabetes. 2014;63:2486-2497.
- Frias JP, Davies MJ, Rosenstock J, et al. Tirzepatide versus semaglutide once weekly in patients with type 2 diabetes. N Engl J Med. 2021;385:503-515.
- Wilding JPH, Batterham RL, Calanna S, et al. Once weekly semaglutide in adults with overweight or obesity. N Engl J Med. 2021;384:989-1000.
- Rubino DM, Greenway FL, Khalid U, et al. Effect of weekly subcutaneous semaglutide vs daily liraglutide on body weight in adults with overweight or obesity without diabetes. JAMA. 2022;327:138-150.
- Wegovy [package insert]. Bagsvaerd, Denmark: Novo Nordisk; 2021.
- Wegovy Product Monograph. Mississauga, Ontario: Novo Nordisk Canada Inc; June 30, 2022. https://pdf.hres.ca/dpd_pm/00066484.PDF
- Rubino D, Abrahamsson N, Davies M, et al. Effect of continued weekly subcutaneous semaglutide vs placebo on weight loss maintenance in adults with overweight or obesity. JAMA. 2021;325: 1414-1425.
- GoodRx website. https://www.goodrx.com/. Accessed June 19, 2023.
- Wiggins T, Guidozzi N, Welbourn R, et al. Association of bariatric surgery with all-cause mortality and incidence of obesity-related disease at a population level: a systematic review and metaanalysis. PLoS Med. 2020;17:e1003206.
To what extent do growth abnormalities increase the risk of stillbirth near term in pregnancies complicated by diabetes?
McElwee ER, Oliver EA, McFarling K, et al. Risk of stillbirth in pregnancies complicated by diabetes, stratified by fetal growth. Obstet Gynecol. 2023;141:801-809. doi:10.1097/AOG.0000000000005102.
EXPERT COMMENTARY
Stillbirth is defined as intrauterine demise at or beyond 20 weeks’ gestation. Pregestational DM and GDM significantly increase the risk of stillbirth. Both fetal growth restriction and macrosomia are common complications of pregnancies affected by diabetes, and they further increase the risk of stillbirth. While maternal variables such as glycemic control and medication requirement are currently used to assess the risks of expectant management and inform delivery timing, abnormal fetal growth is not.
Investigators sought to evaluate the stillbirth rates per week of expectant management during the late third trimester stratified by birth weight (as a surrogate for fetal growth) in pregnancies complicated by PG-DM or GDM.
Details of the study
McElwee and colleagues used the US National Vital Statistics System to identify nonanomalous singleton pregnancies complicated by PG-DM or GDM from 2014 to 2017.1 Pregnancies were stratified by birth weight and categorized as being LGA (birth weight > 90th percentile for gestational age), SGA (birth weight < 10th percentile for gestational age), or AGA. Stillbirths were identified from 34 0/7 through 39 6/7 weeks of gestation, and conditional stillbirth rates per 10,000 pregnancies were calculated for each week of gestation.
Results. Among 834,631 pregnancies complicated by PG-DM (13.1%) or GDM (86.9%), there were 3,033 stillbirths, of which 61% were in pregnancies with PG-DM. Stillbirth rates increased with advancing gestational age for both PG-DM and GDM regardless of birth weight. In pregnancies with PG-DM, fetuses that were LGA or SGA had a higher relative risk of stillbirth compared with their AGA counterparts at each gestational age. This stillbirth risk was highest in pregnancies with PG-DM that were LGA. At 39 weeks, the stillbirth rate in this population was 96.9/10,000 ongoing pregnancies and was 5 times higher than pregnancies with PG-DM that were AGA. When the GDM-related AGA group was selected as the referent (as the lowest-risk comparison group), pregnancies with PG-DM that were LGA had a 21-times higher relative risk of stillbirth at 37 and 38 weeks of gestation.
Study strengths and limitations
Decisions on the optimal timing of delivery seek to strike a balance between the increased neonatal morbidity with delivery before 39 weeks’ gestation and the increased risk of stillbirth with expectant management. In pregnancies complicated by diabetes, current guidelines from the American College of Obstetricians and Gynecologists recommend consideration of maternal variables, such as medication requirement, glycemic control, and vascular sequelae, to inform decisions on delivery timing, as these factors have been postulated to influence the risk of stillbirth with pregnancy prolongation.2 These recommendations are based largely on expert opinion and retrospective data.
The question of how fetal growth abnormalities factor into this complicated decision making is also an area of low-quality evidence despite studies that demonstrate that both SGA and LGA fetuses in pregnancies complicated by diabetes are at increased risk of stillbirth.3
The large population-based study design by McElwee and colleagues allowed the investigators to examine a rare event (stillbirth) with multiple stratification levels and sufficient statistical power and to contribute to this literature.
Significant limitations, however, must be considered before generalizing these results. The data were restricted to variables available on birth and death certificates, and more granular information—such as the type of DM, level of glycemic control, frequency of antenatal testing, and stillbirth work-up—could not be assessed. Ultrasonographic estimations of fetal weight also were not included. Birth weight data were used as a proxy, although we know that these variables do not always correlate well given the limited accuracy of ultrasonography in assessing projected birth weight, particularly later in pregnancy. The authors also did not control for highly prevalent variables (for example, hypertension, obesity) that are likely associated with abnormal fetal growth and stillbirth in these populations. ●
The present study demonstrates that both SGA and LGA are significant risk factors for stillbirth in pregnancies with either PG-DM or GDM in the late preterm and early term periods, and this risk should be considered when making decisions on appropriate timing of delivery. The conditional stillbirth rate was highest in pregnancies with PG-DM with LGA fetuses, and this risk increased with each week of expectant management. This population may benefit the most from critical assessment of the risk of stillbirth with ongoing pregnancy. Notably, the quality of evidence is not sufficient to universally alter delivery timing guidelines in this population. We recommend individual assessment of each clinical scenario when making these decisions.
NIGEL MADDEN, MD; MICHELLE A. KOMINIAREK, MD, MS
- McElwee ER, Oliver EA, McFarling K, et al. Risk of stillbirth in pregnancies complicated by diabetes, stratified by fetal growth. Obstet Gynecol. 2023;141:801-809. doi:10.1097 /AOG.0000000000005102
- ACOG Committee Opinion No. 764. Medically indicated late-preterm and early-term deliveries. Obstet Gynecol. 2019;133:e151-e155. doi:10.1097/AOG.0000000000003083
- Starikov R, Dudley D, Reddy UM. Stillbirth in the pregnancy complicated by diabetes. Curr Diab Rep. 2015;15:11. doi:10.1007/s11892-015-0580-y
McElwee ER, Oliver EA, McFarling K, et al. Risk of stillbirth in pregnancies complicated by diabetes, stratified by fetal growth. Obstet Gynecol. 2023;141:801-809. doi:10.1097/AOG.0000000000005102.
EXPERT COMMENTARY
Stillbirth is defined as intrauterine demise at or beyond 20 weeks’ gestation. Pregestational DM and GDM significantly increase the risk of stillbirth. Both fetal growth restriction and macrosomia are common complications of pregnancies affected by diabetes, and they further increase the risk of stillbirth. While maternal variables such as glycemic control and medication requirement are currently used to assess the risks of expectant management and inform delivery timing, abnormal fetal growth is not.
Investigators sought to evaluate the stillbirth rates per week of expectant management during the late third trimester stratified by birth weight (as a surrogate for fetal growth) in pregnancies complicated by PG-DM or GDM.
Details of the study
McElwee and colleagues used the US National Vital Statistics System to identify nonanomalous singleton pregnancies complicated by PG-DM or GDM from 2014 to 2017.1 Pregnancies were stratified by birth weight and categorized as being LGA (birth weight > 90th percentile for gestational age), SGA (birth weight < 10th percentile for gestational age), or AGA. Stillbirths were identified from 34 0/7 through 39 6/7 weeks of gestation, and conditional stillbirth rates per 10,000 pregnancies were calculated for each week of gestation.
Results. Among 834,631 pregnancies complicated by PG-DM (13.1%) or GDM (86.9%), there were 3,033 stillbirths, of which 61% were in pregnancies with PG-DM. Stillbirth rates increased with advancing gestational age for both PG-DM and GDM regardless of birth weight. In pregnancies with PG-DM, fetuses that were LGA or SGA had a higher relative risk of stillbirth compared with their AGA counterparts at each gestational age. This stillbirth risk was highest in pregnancies with PG-DM that were LGA. At 39 weeks, the stillbirth rate in this population was 96.9/10,000 ongoing pregnancies and was 5 times higher than pregnancies with PG-DM that were AGA. When the GDM-related AGA group was selected as the referent (as the lowest-risk comparison group), pregnancies with PG-DM that were LGA had a 21-times higher relative risk of stillbirth at 37 and 38 weeks of gestation.
Study strengths and limitations
Decisions on the optimal timing of delivery seek to strike a balance between the increased neonatal morbidity with delivery before 39 weeks’ gestation and the increased risk of stillbirth with expectant management. In pregnancies complicated by diabetes, current guidelines from the American College of Obstetricians and Gynecologists recommend consideration of maternal variables, such as medication requirement, glycemic control, and vascular sequelae, to inform decisions on delivery timing, as these factors have been postulated to influence the risk of stillbirth with pregnancy prolongation.2 These recommendations are based largely on expert opinion and retrospective data.
The question of how fetal growth abnormalities factor into this complicated decision making is also an area of low-quality evidence despite studies that demonstrate that both SGA and LGA fetuses in pregnancies complicated by diabetes are at increased risk of stillbirth.3
The large population-based study design by McElwee and colleagues allowed the investigators to examine a rare event (stillbirth) with multiple stratification levels and sufficient statistical power and to contribute to this literature.
Significant limitations, however, must be considered before generalizing these results. The data were restricted to variables available on birth and death certificates, and more granular information—such as the type of DM, level of glycemic control, frequency of antenatal testing, and stillbirth work-up—could not be assessed. Ultrasonographic estimations of fetal weight also were not included. Birth weight data were used as a proxy, although we know that these variables do not always correlate well given the limited accuracy of ultrasonography in assessing projected birth weight, particularly later in pregnancy. The authors also did not control for highly prevalent variables (for example, hypertension, obesity) that are likely associated with abnormal fetal growth and stillbirth in these populations. ●
The present study demonstrates that both SGA and LGA are significant risk factors for stillbirth in pregnancies with either PG-DM or GDM in the late preterm and early term periods, and this risk should be considered when making decisions on appropriate timing of delivery. The conditional stillbirth rate was highest in pregnancies with PG-DM with LGA fetuses, and this risk increased with each week of expectant management. This population may benefit the most from critical assessment of the risk of stillbirth with ongoing pregnancy. Notably, the quality of evidence is not sufficient to universally alter delivery timing guidelines in this population. We recommend individual assessment of each clinical scenario when making these decisions.
NIGEL MADDEN, MD; MICHELLE A. KOMINIAREK, MD, MS
McElwee ER, Oliver EA, McFarling K, et al. Risk of stillbirth in pregnancies complicated by diabetes, stratified by fetal growth. Obstet Gynecol. 2023;141:801-809. doi:10.1097/AOG.0000000000005102.
EXPERT COMMENTARY
Stillbirth is defined as intrauterine demise at or beyond 20 weeks’ gestation. Pregestational DM and GDM significantly increase the risk of stillbirth. Both fetal growth restriction and macrosomia are common complications of pregnancies affected by diabetes, and they further increase the risk of stillbirth. While maternal variables such as glycemic control and medication requirement are currently used to assess the risks of expectant management and inform delivery timing, abnormal fetal growth is not.
Investigators sought to evaluate the stillbirth rates per week of expectant management during the late third trimester stratified by birth weight (as a surrogate for fetal growth) in pregnancies complicated by PG-DM or GDM.
Details of the study
McElwee and colleagues used the US National Vital Statistics System to identify nonanomalous singleton pregnancies complicated by PG-DM or GDM from 2014 to 2017.1 Pregnancies were stratified by birth weight and categorized as being LGA (birth weight > 90th percentile for gestational age), SGA (birth weight < 10th percentile for gestational age), or AGA. Stillbirths were identified from 34 0/7 through 39 6/7 weeks of gestation, and conditional stillbirth rates per 10,000 pregnancies were calculated for each week of gestation.
Results. Among 834,631 pregnancies complicated by PG-DM (13.1%) or GDM (86.9%), there were 3,033 stillbirths, of which 61% were in pregnancies with PG-DM. Stillbirth rates increased with advancing gestational age for both PG-DM and GDM regardless of birth weight. In pregnancies with PG-DM, fetuses that were LGA or SGA had a higher relative risk of stillbirth compared with their AGA counterparts at each gestational age. This stillbirth risk was highest in pregnancies with PG-DM that were LGA. At 39 weeks, the stillbirth rate in this population was 96.9/10,000 ongoing pregnancies and was 5 times higher than pregnancies with PG-DM that were AGA. When the GDM-related AGA group was selected as the referent (as the lowest-risk comparison group), pregnancies with PG-DM that were LGA had a 21-times higher relative risk of stillbirth at 37 and 38 weeks of gestation.
Study strengths and limitations
Decisions on the optimal timing of delivery seek to strike a balance between the increased neonatal morbidity with delivery before 39 weeks’ gestation and the increased risk of stillbirth with expectant management. In pregnancies complicated by diabetes, current guidelines from the American College of Obstetricians and Gynecologists recommend consideration of maternal variables, such as medication requirement, glycemic control, and vascular sequelae, to inform decisions on delivery timing, as these factors have been postulated to influence the risk of stillbirth with pregnancy prolongation.2 These recommendations are based largely on expert opinion and retrospective data.
The question of how fetal growth abnormalities factor into this complicated decision making is also an area of low-quality evidence despite studies that demonstrate that both SGA and LGA fetuses in pregnancies complicated by diabetes are at increased risk of stillbirth.3
The large population-based study design by McElwee and colleagues allowed the investigators to examine a rare event (stillbirth) with multiple stratification levels and sufficient statistical power and to contribute to this literature.
Significant limitations, however, must be considered before generalizing these results. The data were restricted to variables available on birth and death certificates, and more granular information—such as the type of DM, level of glycemic control, frequency of antenatal testing, and stillbirth work-up—could not be assessed. Ultrasonographic estimations of fetal weight also were not included. Birth weight data were used as a proxy, although we know that these variables do not always correlate well given the limited accuracy of ultrasonography in assessing projected birth weight, particularly later in pregnancy. The authors also did not control for highly prevalent variables (for example, hypertension, obesity) that are likely associated with abnormal fetal growth and stillbirth in these populations. ●
The present study demonstrates that both SGA and LGA are significant risk factors for stillbirth in pregnancies with either PG-DM or GDM in the late preterm and early term periods, and this risk should be considered when making decisions on appropriate timing of delivery. The conditional stillbirth rate was highest in pregnancies with PG-DM with LGA fetuses, and this risk increased with each week of expectant management. This population may benefit the most from critical assessment of the risk of stillbirth with ongoing pregnancy. Notably, the quality of evidence is not sufficient to universally alter delivery timing guidelines in this population. We recommend individual assessment of each clinical scenario when making these decisions.
NIGEL MADDEN, MD; MICHELLE A. KOMINIAREK, MD, MS
- McElwee ER, Oliver EA, McFarling K, et al. Risk of stillbirth in pregnancies complicated by diabetes, stratified by fetal growth. Obstet Gynecol. 2023;141:801-809. doi:10.1097 /AOG.0000000000005102
- ACOG Committee Opinion No. 764. Medically indicated late-preterm and early-term deliveries. Obstet Gynecol. 2019;133:e151-e155. doi:10.1097/AOG.0000000000003083
- Starikov R, Dudley D, Reddy UM. Stillbirth in the pregnancy complicated by diabetes. Curr Diab Rep. 2015;15:11. doi:10.1007/s11892-015-0580-y
- McElwee ER, Oliver EA, McFarling K, et al. Risk of stillbirth in pregnancies complicated by diabetes, stratified by fetal growth. Obstet Gynecol. 2023;141:801-809. doi:10.1097 /AOG.0000000000005102
- ACOG Committee Opinion No. 764. Medically indicated late-preterm and early-term deliveries. Obstet Gynecol. 2019;133:e151-e155. doi:10.1097/AOG.0000000000003083
- Starikov R, Dudley D, Reddy UM. Stillbirth in the pregnancy complicated by diabetes. Curr Diab Rep. 2015;15:11. doi:10.1007/s11892-015-0580-y

Racial Disparities in Hidradenitis Suppurativa–Related Pain: A Cross-sectional Analysis
Hidradenitis suppurativa (HS), a chronic inflammatory disease that is characterized by tender inflamed nodules of the skin and subcutaneous tissue, disproportionately affects postpubertal females as well as Black/African American individuals. The nodules can rupture, form sinus tracts, and scar. 1 Hidradenitis suppurativa has been associated with cardiovascular disease, type 2 diabetes mellitus, polycystic ovary syndrome, depression, suicide, and substance use disorders. Because of the symptom burden and associated conditions, HS can be a painful and distressing disease that substantially impairs the quality of life for individuals with this condition. 2
Pain is a commonly reported symptom in HS that often goes untreated. Furthermore, HS-related pain is complex due to the involvement of different pain types that require various treatment modalities.3 According to Savage et al,4 recognizing whether HS-related pain is acute, chronic, neuropathic, or nociceptive is vital in establishing a framework for an effective pain management scheme. Currently, such established multimodal pain management strategies in dermatology do not exist. In 2021, dermatology-specific pain management strategies proposed the use of a multimodal regimen to address the multifaceted nature of HS-related pain.4 However, these strategies failed to recognize the systemic racial and ethnic biases in the US health care system that undermine pain management care for minority groups.5,6 One approach to combatting racial disparities in pain management is determining average pain levels across racial groups.7 This study sought to compare HS-related pain scores by racial groups. Furthermore, we assessed differences in perception of patients’ respective pain management regimens by race. We hypothesized that the average HS-related pain intensities and pain management would differ between self-reported racial groups.
Methods
This cross-sectional study took place over 5 months (August through December 2021). A survey was emailed to 2198 adult patients with HS in the University of Alabama Health System. The survey consisted of demographic and general questions about a patient’s HS. Pain scores were captured using the numeric rating scale (NRS), a measurement tool for pain intensity on a scale from 0 to 10. 8 Age at diagnosis, gender, education level, household income, total body areas affected by HS, disease severity (categorized as mild, moderate, and severe), comorbidities including mood disorders, tobacco use, and HS and HS-related pain medication regimens also were collected. Additionally, participants were asked about their level of agreement with the following statements: “I am satisfied with how my pain related to HS is being managed by my doctors” and “My pain related to HS is under control.” The level of agreement was measured using a 5-point Likert scale, with responses ranging from strongly disagree to strongly agree. All data included in the analysis were self-reported. The study received institutional review board approval for the University of Alabama at Birmingham.
Statistical Analysis—Descriptive statistics were used to assess statistical differences in patient characteristics of Black/African American participants compared to other participants, including White, Asian, and Hispanic/Latino participants. Thirteen participants were excluded from the final analysis: 2 participants were missing data, and 11 biracial participants were excluded due to overlapping White and Black/African American races that may have confounded the analysis. Categorical variables were reported as frequencies and percentages, and χ2 and Fisher exact tests, when necessary, were used to test for statistically significant differences. Continuous variables were summarized with means and standard deviations, and a t test was used for statistically significant differences.
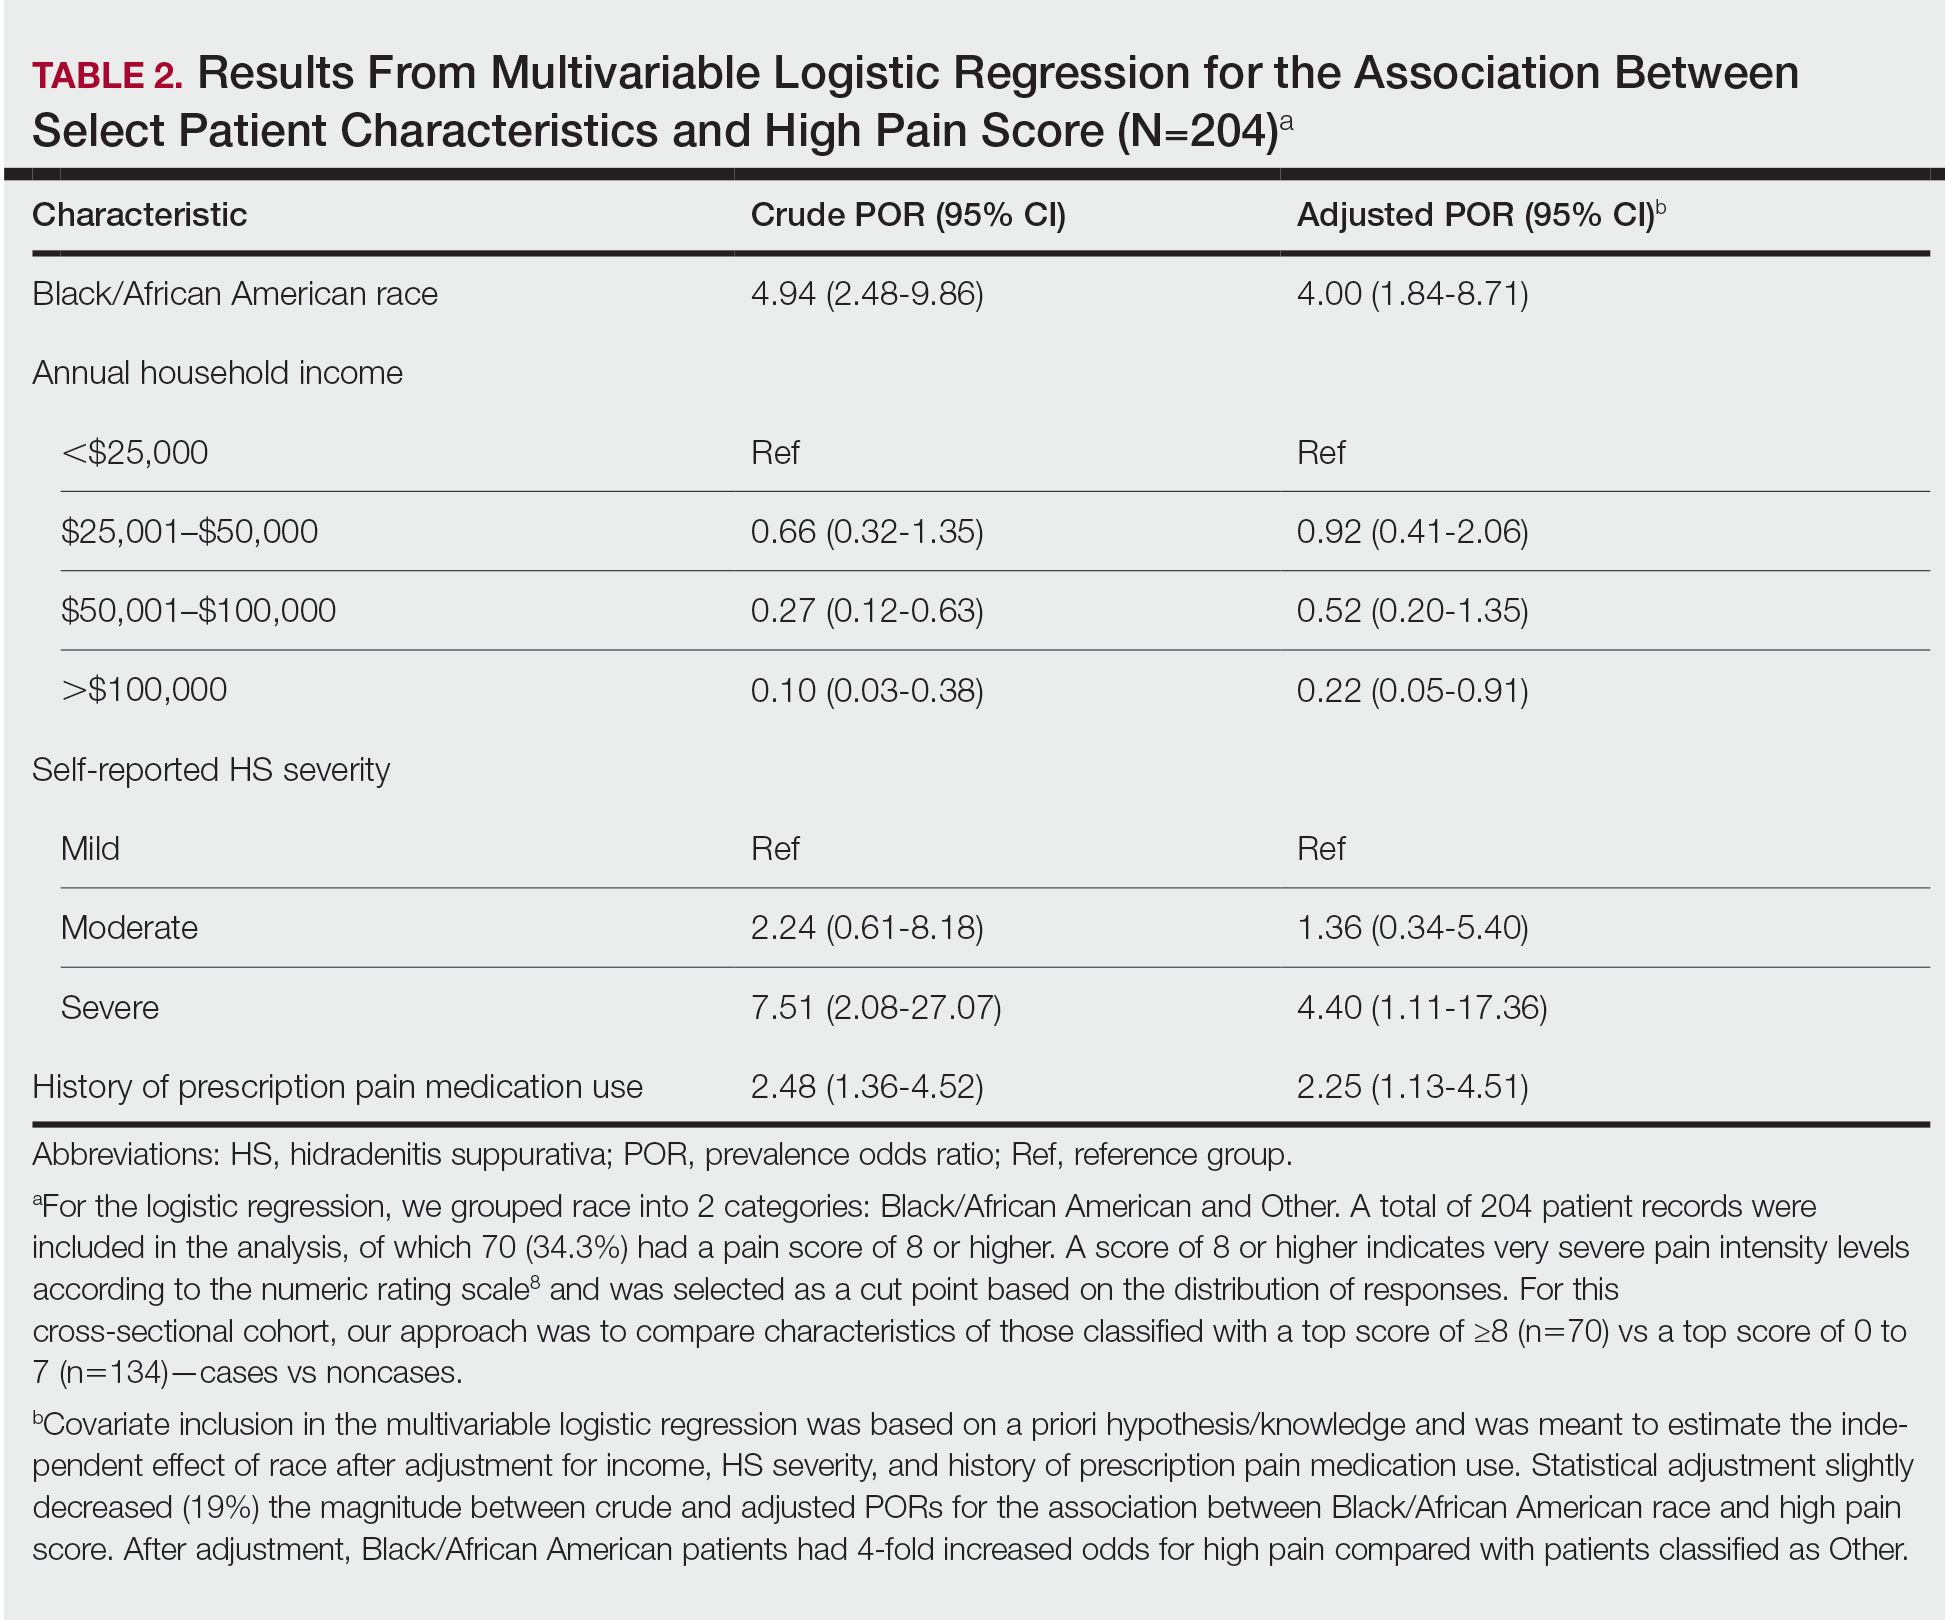
Logistic regression was performed to assess the relationship between race and pain after adjusting for confounding variables such as obesity, current tobacco use, self-reported HS severity, and the presence of comorbidities. A total of 204 patient records were included in the analysis, of which 70 (34.3%) had a pain score of 8 or higher, which indicates very severe pain intensity levels on the NRS,8 and were selected as a cut point based on the distribution of responses. For this cross-sectional cohort, our approach was to compare characteristics of those classified with a top score of 8 or higher (n=70) vs a top score of 0 to 7 (n=134)(cases vs noncases). Statistical analyses were performed using JMP Pro 16 (JMP Statistical Discovery LLC) at an α=.05 significance level; logistic regression was performed using SPSS Statistics (IBM). For the logistic regression, we grouped patient race into 2 categories: Black/African American and Other, which included White, Asian, and Hispanic/Latino participants.
Crude and adjusted multivariable logistic regression analyses were used to calculate prevalence odds ratios with 95% confidence intervals. Covariate inclusion in the multivariable logistic regression was based on a priori hypothesis/knowledge and was meant to estimate the independent effect of race after adjustment for income, HS severity, and history of prescription pain medication use. Other variables, including tobacco use, obesity, mood disorders, and current HS treatments, were all individually tested in the multivariate analysis and did not significantly impact the odds ratio for high pain. Statistical adjustment slightly decreased (19%) the magnitude between crude and adjusted prevalence odds ratios for the association between Black/African American race and high pain score.
Results
Survey Demographics —The final analysis included 204 survey respondents. Most respondents were Black/African American (58.82%), and nearly all were female (89.71%)(Table 1). The mean age (SD) of respondents was 37.37 (11.29) years (range, 19-70 years). Many respondents reported having completed some college (36.27%) or receiving a bachelor’s degree (19.12%). Of patients who were not Black/African American, 10.71% had higher than a master’s degree, whereas no Black/African American patients held a degree higher than a master’s ( P = .0052). Additionally, more Black/African American respondents (35.83%) reported an annual household income level of less than $25,000 compared with respondents who were not Black/African American (19.05%, P = .0001). Most respondents rated the severity of their HS as moderate or severe (46.57% and 41.67%, respectively), and there was no significant difference in reported severity of HS between racial groups ( P = .5395).


Pain Scores—As documented in the Methods, respondents were asked to rate their HS-related pain intensity from 0 to 10 using the NRS. The average pain score (SD)—the level of pain intensity over the prior month—was 6.39 (2.56)(range, 0–10). The mean pain score (SD) at the time of the survey was 3.61 (2.98)(range, 0–10)(Table 1). These data revealed that Black/African American patients had a significantly higher average pain score (SD) than patients with HS who were not Black/African American (7.08 [2.49] and 5.40 [2.35], respectively; P<.0001). After adjustment with multivariable logistical regression, Black/African American patients had 4-fold increased odds for very severe levels of pain (score of ≥8) compared with patients who were not Black/African American.
Pain Management—Although pain scores were higher for Black/African American patients with HS, there was no significant difference in the perception of pain control between racial groups (P=.0761). Additionally, we found low income (adjusted prevalence odds ratio [POR], 0.22; 95% CI, 0.05-0.91), a history of prescription pain medication use (adjusted POR, 2.25; 95% CI, 1.13-4.51), and HS severity (adjusted POR, 4.40; 95% CI, 1.11-17.36) all to be independent risk factors contributing to higher pain scores in patients with HS (Table 2). Lastly, we noted current or reported history of pain medication use was significantly correlated with higher pain scores (P=.0280 and P=.0213, respectively).
Satisfaction With Pain Management—The level of satisfaction with physician management of HS-related pain was significantly different between Black/African American patients and those who were not Black/African American (P=.0129). Of those who identified as Black/African American, 26.7% (n=32) strongly disagreed with the statement, “I am satisfied with how my pain related to HS is being managed by my doctors,” whereas only 15.5% (n=13) of patients who were not Black/African American strongly disagreed.
Comment
There is no cure for HS, and a large focus of treatment is pain management. Because racial disparities in the treatment of chronic pain will affect those with HS, we conducted a cross-sectional analysis of pain and pain management among HS patients. We found that Black/African American patients with HS have higher average pain scores than those who are not Black/African American and were 4 times more likely to experience very severe pain. Prior studies have established that patients with HS often report higher pain levels than patients with other chronic inflammatory skin conditions, 7,8 and our study identified racial disparities in HS-related pain management.
Measuring pain is challenging because of its multidimensional and subjective nature, making it essential to consider underlying causes and patients’ emotional responses to pain.9 By adjusting for confounding factors that may influence pain, such as mood disorders, disease severity, comorbidities, and medication use, we were able to gain better insight into fundamental differences in average pain intensity levels among racial groups and assess what factors may be contributing to a patient’s pain perception. Our study determined that lower income levels, higher HS disease severity, and a history of prescription pain medication use were all independent risk factors for high pain. Of note, obesity, tobacco use, and mood disorders such as anxiety and depression did not significantly differ between racial groups or increase the odds of high pain between racial groups identified.
With low income being an independent risk factor for high pain, we must consider the social determinants of health and how they may influence the pain experience in HS. We speculate that low income may be associated with other social determinants of health for the patients assessed in this study, such as lack of social and community support or limited health care access that contribute to worse health outcomes.10,11 In addition, low income contributes to limited access to medical care or treatments12; without access to effective HS management, lower-income patients may be at risk for higher disease severity and thus higher pain levels. However, economic stability is only a part of the whole picture; therefore, assessing the other social determinants of health in patients with HS may lead to better health outcomes and quality of life.
Another identified risk factor for high pain was a reported history of prescription pain medication use. This finding suggests that patients with moderate to severe pain likely have required stronger analgesic medications in the past. We further speculate that high pain levels in patients who have received prescription pain medications indicate either undertreatment, mistreatment, or recalcitrant pain. More research is needed to assess the relationship between HS-related pain intensity, analgesic medications, and providers who manage HS-related pain.
We also found that Black/African American patients with HS had a significantly higher dissatisfaction with their physician’s management of their pain, which could be attributable to several factors, including biological differences in medication metabolism (in which the patient has medication-resistant HS), undertreatment of pain, and/or poor doctor-patient relations. These reasons coincide with other diseases where health disparities are found.13-15 Recognizing these factors will be key to dismantling the disparities in HS that are noted within this study. The limitations of this work include the cross-sectional study design and its inability to evaluate causal factors of high pain levels across racial groups, the NRS lack of insight on pain chronicity or pain experience,7 the lack of provider or institution perspectives, and self-reported data. Additionally, only patients with email access were included, which may have excluded vulnerable populations with more pain associated with their HS.
Our findings highlight an area for further investigation to assess why these racial differences exist in HS-related pain. The results also emphasize the need for research evaluating whether systemic or health care provider biases contribute to racial differences in HS-related pain management.
Acknowledgment — Dr. Weir was supported by the Predoctoral Clinical/Translational Research Program (TL1), a National Institutes of Health Ruth L. Kirschstein National Research Service Award (NRSA), through the University of Alabama at Birmingham (UAB) Center for Clinical and Translational Science (CCTS).
- Garg A, Kirby JS, Lavian J, et al. Sex- and age-adjusted population analysis of prevalence estimates for hidradenitis suppurativa in the United States. JAMA Dermatol. 2017;153:760-764. doi:10.1001/jamadermatol.2017.0201
- Nguyen TV, Damiani G, Orenstein LAV, et al. Hidradenitis suppurativa: an update on epidemiology, phenotypes, diagnosis, pathogenesis, comorbidities and quality of life. J Eur Acad Dermatol Venereol. 2021;35:50-61. doi:10.1111/jdv.16677
- Krajewski PK, Matusiak Ł, von Stebut E, et al. Pain in hidradenitis suppurativa: a cross-sectional study of 1,795 patients. Acta Derm Venereol. 2021;101:adv00364. doi:10.2340/00015555-3724
- Savage KT, Singh V, Patel ZS, et al. Pain management in hidradenitis suppurativa and a proposed treatment algorithm. J Am Acad Dermatol. 2021;85:187-199. doi:10.1016/j.jaad.2020.09.039
- Morales ME, Yong RJ. Racial and ethnic disparities in the treatment of chronic pain. Pain Med. 2021;22:75-90. doi:10.1093/pm/pnaa427
- US Department of Health and Human Services. 2019 National Healthcare Quality and Disparities Report. December 2020. Accessed June 21, 2023. https://www.ahrq.gov/sites/default/files/wysiwyg/research/findings/nhqrdr/2019qdr.pdf
- Hoffman KM, Trawalter S, Axt JR, et al. Racial bias in pain assessment and treatment recommendations, and false beliefs about biological differences between blacks and whites. Proc Natl Acad Sci U S A. 2016;113:4296-4301. doi:10.1073/pnas.1516047113
- Patel ZS, Hoffman LK, Buse DC, et al. Pain, psychological comorbidities, disability, and impaired quality of life in hidradenitis suppurativa. Curr Pain Headache Rep. 2017;21:49. doi:10.1007/s11916-017-0647-3. Published correction appears in Curr Pain Headache Rep. 2017;21:52.
- McDowell I. Pain measurements. In: Measuring Health: A Guide to Rating Scales and Questionnaires. Oxford University Press; 2006:477-478.
- Singh GK, Daus GP, Allender M, et al. Social determinants of health in the United States: addressing major health inequality trends for the nation, 1935-2016. Int J MCH AIDS. 2017;6:139-164. doi:10.21106/ijma.236
- Sulley S, Bayssie M. Social determinants of health: an evaluation of risk factors associated with inpatient presentations in the United States. Cureus. 2021;13:E13287. doi:10.7759/cureus.13287
- Lazar M, Davenport L. Barriers to health care access for low income families: a review of literature. J Community Health Nurs. 2018;35:28-37. doi:10.1080/07370016.2018.1404832
- Ghoshal M, Shapiro H, Todd K, et al. Chronic noncancer pain management and systemic racism: time to move toward equal care standards.J Pain Res. 2020;13:2825-2836. doi:10.214/JPR.S287314
- Cintron A, Morrison RS. Pain and ethnicity in the United States: a systematic review. J Palliat Med. 2006;9:1454-1473. doi:10.1089/jpm.2006.9.1454
- Green CR, Anderson KO, Baker TA, et al. The unequal burden of pain: confronting racial and ethnic disparities in pain. Pain Med. 2003;4:277-294. doi:10.1046/j.1526-4637.2003.03034.x. Published correction appears in Pain Med. 2005;6:99.
Hidradenitis suppurativa (HS), a chronic inflammatory disease that is characterized by tender inflamed nodules of the skin and subcutaneous tissue, disproportionately affects postpubertal females as well as Black/African American individuals. The nodules can rupture, form sinus tracts, and scar. 1 Hidradenitis suppurativa has been associated with cardiovascular disease, type 2 diabetes mellitus, polycystic ovary syndrome, depression, suicide, and substance use disorders. Because of the symptom burden and associated conditions, HS can be a painful and distressing disease that substantially impairs the quality of life for individuals with this condition. 2
Pain is a commonly reported symptom in HS that often goes untreated. Furthermore, HS-related pain is complex due to the involvement of different pain types that require various treatment modalities.3 According to Savage et al,4 recognizing whether HS-related pain is acute, chronic, neuropathic, or nociceptive is vital in establishing a framework for an effective pain management scheme. Currently, such established multimodal pain management strategies in dermatology do not exist. In 2021, dermatology-specific pain management strategies proposed the use of a multimodal regimen to address the multifaceted nature of HS-related pain.4 However, these strategies failed to recognize the systemic racial and ethnic biases in the US health care system that undermine pain management care for minority groups.5,6 One approach to combatting racial disparities in pain management is determining average pain levels across racial groups.7 This study sought to compare HS-related pain scores by racial groups. Furthermore, we assessed differences in perception of patients’ respective pain management regimens by race. We hypothesized that the average HS-related pain intensities and pain management would differ between self-reported racial groups.
Methods
This cross-sectional study took place over 5 months (August through December 2021). A survey was emailed to 2198 adult patients with HS in the University of Alabama Health System. The survey consisted of demographic and general questions about a patient’s HS. Pain scores were captured using the numeric rating scale (NRS), a measurement tool for pain intensity on a scale from 0 to 10. 8 Age at diagnosis, gender, education level, household income, total body areas affected by HS, disease severity (categorized as mild, moderate, and severe), comorbidities including mood disorders, tobacco use, and HS and HS-related pain medication regimens also were collected. Additionally, participants were asked about their level of agreement with the following statements: “I am satisfied with how my pain related to HS is being managed by my doctors” and “My pain related to HS is under control.” The level of agreement was measured using a 5-point Likert scale, with responses ranging from strongly disagree to strongly agree. All data included in the analysis were self-reported. The study received institutional review board approval for the University of Alabama at Birmingham.
Statistical Analysis—Descriptive statistics were used to assess statistical differences in patient characteristics of Black/African American participants compared to other participants, including White, Asian, and Hispanic/Latino participants. Thirteen participants were excluded from the final analysis: 2 participants were missing data, and 11 biracial participants were excluded due to overlapping White and Black/African American races that may have confounded the analysis. Categorical variables were reported as frequencies and percentages, and χ2 and Fisher exact tests, when necessary, were used to test for statistically significant differences. Continuous variables were summarized with means and standard deviations, and a t test was used for statistically significant differences.
Logistic regression was performed to assess the relationship between race and pain after adjusting for confounding variables such as obesity, current tobacco use, self-reported HS severity, and the presence of comorbidities. A total of 204 patient records were included in the analysis, of which 70 (34.3%) had a pain score of 8 or higher, which indicates very severe pain intensity levels on the NRS,8 and were selected as a cut point based on the distribution of responses. For this cross-sectional cohort, our approach was to compare characteristics of those classified with a top score of 8 or higher (n=70) vs a top score of 0 to 7 (n=134)(cases vs noncases). Statistical analyses were performed using JMP Pro 16 (JMP Statistical Discovery LLC) at an α=.05 significance level; logistic regression was performed using SPSS Statistics (IBM). For the logistic regression, we grouped patient race into 2 categories: Black/African American and Other, which included White, Asian, and Hispanic/Latino participants.
Crude and adjusted multivariable logistic regression analyses were used to calculate prevalence odds ratios with 95% confidence intervals. Covariate inclusion in the multivariable logistic regression was based on a priori hypothesis/knowledge and was meant to estimate the independent effect of race after adjustment for income, HS severity, and history of prescription pain medication use. Other variables, including tobacco use, obesity, mood disorders, and current HS treatments, were all individually tested in the multivariate analysis and did not significantly impact the odds ratio for high pain. Statistical adjustment slightly decreased (19%) the magnitude between crude and adjusted prevalence odds ratios for the association between Black/African American race and high pain score.
Results
Survey Demographics —The final analysis included 204 survey respondents. Most respondents were Black/African American (58.82%), and nearly all were female (89.71%)(Table 1). The mean age (SD) of respondents was 37.37 (11.29) years (range, 19-70 years). Many respondents reported having completed some college (36.27%) or receiving a bachelor’s degree (19.12%). Of patients who were not Black/African American, 10.71% had higher than a master’s degree, whereas no Black/African American patients held a degree higher than a master’s ( P = .0052). Additionally, more Black/African American respondents (35.83%) reported an annual household income level of less than $25,000 compared with respondents who were not Black/African American (19.05%, P = .0001). Most respondents rated the severity of their HS as moderate or severe (46.57% and 41.67%, respectively), and there was no significant difference in reported severity of HS between racial groups ( P = .5395).
Pain Scores—As documented in the Methods, respondents were asked to rate their HS-related pain intensity from 0 to 10 using the NRS. The average pain score (SD)—the level of pain intensity over the prior month—was 6.39 (2.56)(range, 0–10). The mean pain score (SD) at the time of the survey was 3.61 (2.98)(range, 0–10)(Table 1). These data revealed that Black/African American patients had a significantly higher average pain score (SD) than patients with HS who were not Black/African American (7.08 [2.49] and 5.40 [2.35], respectively; P<.0001). After adjustment with multivariable logistical regression, Black/African American patients had 4-fold increased odds for very severe levels of pain (score of ≥8) compared with patients who were not Black/African American.
Pain Management—Although pain scores were higher for Black/African American patients with HS, there was no significant difference in the perception of pain control between racial groups (P=.0761). Additionally, we found low income (adjusted prevalence odds ratio [POR], 0.22; 95% CI, 0.05-0.91), a history of prescription pain medication use (adjusted POR, 2.25; 95% CI, 1.13-4.51), and HS severity (adjusted POR, 4.40; 95% CI, 1.11-17.36) all to be independent risk factors contributing to higher pain scores in patients with HS (Table 2). Lastly, we noted current or reported history of pain medication use was significantly correlated with higher pain scores (P=.0280 and P=.0213, respectively).
Satisfaction With Pain Management—The level of satisfaction with physician management of HS-related pain was significantly different between Black/African American patients and those who were not Black/African American (P=.0129). Of those who identified as Black/African American, 26.7% (n=32) strongly disagreed with the statement, “I am satisfied with how my pain related to HS is being managed by my doctors,” whereas only 15.5% (n=13) of patients who were not Black/African American strongly disagreed.
Comment
There is no cure for HS, and a large focus of treatment is pain management. Because racial disparities in the treatment of chronic pain will affect those with HS, we conducted a cross-sectional analysis of pain and pain management among HS patients. We found that Black/African American patients with HS have higher average pain scores than those who are not Black/African American and were 4 times more likely to experience very severe pain. Prior studies have established that patients with HS often report higher pain levels than patients with other chronic inflammatory skin conditions, 7,8 and our study identified racial disparities in HS-related pain management.
Measuring pain is challenging because of its multidimensional and subjective nature, making it essential to consider underlying causes and patients’ emotional responses to pain.9 By adjusting for confounding factors that may influence pain, such as mood disorders, disease severity, comorbidities, and medication use, we were able to gain better insight into fundamental differences in average pain intensity levels among racial groups and assess what factors may be contributing to a patient’s pain perception. Our study determined that lower income levels, higher HS disease severity, and a history of prescription pain medication use were all independent risk factors for high pain. Of note, obesity, tobacco use, and mood disorders such as anxiety and depression did not significantly differ between racial groups or increase the odds of high pain between racial groups identified.
With low income being an independent risk factor for high pain, we must consider the social determinants of health and how they may influence the pain experience in HS. We speculate that low income may be associated with other social determinants of health for the patients assessed in this study, such as lack of social and community support or limited health care access that contribute to worse health outcomes.10,11 In addition, low income contributes to limited access to medical care or treatments12; without access to effective HS management, lower-income patients may be at risk for higher disease severity and thus higher pain levels. However, economic stability is only a part of the whole picture; therefore, assessing the other social determinants of health in patients with HS may lead to better health outcomes and quality of life.
Another identified risk factor for high pain was a reported history of prescription pain medication use. This finding suggests that patients with moderate to severe pain likely have required stronger analgesic medications in the past. We further speculate that high pain levels in patients who have received prescription pain medications indicate either undertreatment, mistreatment, or recalcitrant pain. More research is needed to assess the relationship between HS-related pain intensity, analgesic medications, and providers who manage HS-related pain.
We also found that Black/African American patients with HS had a significantly higher dissatisfaction with their physician’s management of their pain, which could be attributable to several factors, including biological differences in medication metabolism (in which the patient has medication-resistant HS), undertreatment of pain, and/or poor doctor-patient relations. These reasons coincide with other diseases where health disparities are found.13-15 Recognizing these factors will be key to dismantling the disparities in HS that are noted within this study. The limitations of this work include the cross-sectional study design and its inability to evaluate causal factors of high pain levels across racial groups, the NRS lack of insight on pain chronicity or pain experience,7 the lack of provider or institution perspectives, and self-reported data. Additionally, only patients with email access were included, which may have excluded vulnerable populations with more pain associated with their HS.
Our findings highlight an area for further investigation to assess why these racial differences exist in HS-related pain. The results also emphasize the need for research evaluating whether systemic or health care provider biases contribute to racial differences in HS-related pain management.
Acknowledgment — Dr. Weir was supported by the Predoctoral Clinical/Translational Research Program (TL1), a National Institutes of Health Ruth L. Kirschstein National Research Service Award (NRSA), through the University of Alabama at Birmingham (UAB) Center for Clinical and Translational Science (CCTS).
Hidradenitis suppurativa (HS), a chronic inflammatory disease that is characterized by tender inflamed nodules of the skin and subcutaneous tissue, disproportionately affects postpubertal females as well as Black/African American individuals. The nodules can rupture, form sinus tracts, and scar. 1 Hidradenitis suppurativa has been associated with cardiovascular disease, type 2 diabetes mellitus, polycystic ovary syndrome, depression, suicide, and substance use disorders. Because of the symptom burden and associated conditions, HS can be a painful and distressing disease that substantially impairs the quality of life for individuals with this condition. 2
Pain is a commonly reported symptom in HS that often goes untreated. Furthermore, HS-related pain is complex due to the involvement of different pain types that require various treatment modalities.3 According to Savage et al,4 recognizing whether HS-related pain is acute, chronic, neuropathic, or nociceptive is vital in establishing a framework for an effective pain management scheme. Currently, such established multimodal pain management strategies in dermatology do not exist. In 2021, dermatology-specific pain management strategies proposed the use of a multimodal regimen to address the multifaceted nature of HS-related pain.4 However, these strategies failed to recognize the systemic racial and ethnic biases in the US health care system that undermine pain management care for minority groups.5,6 One approach to combatting racial disparities in pain management is determining average pain levels across racial groups.7 This study sought to compare HS-related pain scores by racial groups. Furthermore, we assessed differences in perception of patients’ respective pain management regimens by race. We hypothesized that the average HS-related pain intensities and pain management would differ between self-reported racial groups.
Methods
This cross-sectional study took place over 5 months (August through December 2021). A survey was emailed to 2198 adult patients with HS in the University of Alabama Health System. The survey consisted of demographic and general questions about a patient’s HS. Pain scores were captured using the numeric rating scale (NRS), a measurement tool for pain intensity on a scale from 0 to 10. 8 Age at diagnosis, gender, education level, household income, total body areas affected by HS, disease severity (categorized as mild, moderate, and severe), comorbidities including mood disorders, tobacco use, and HS and HS-related pain medication regimens also were collected. Additionally, participants were asked about their level of agreement with the following statements: “I am satisfied with how my pain related to HS is being managed by my doctors” and “My pain related to HS is under control.” The level of agreement was measured using a 5-point Likert scale, with responses ranging from strongly disagree to strongly agree. All data included in the analysis were self-reported. The study received institutional review board approval for the University of Alabama at Birmingham.
Statistical Analysis—Descriptive statistics were used to assess statistical differences in patient characteristics of Black/African American participants compared to other participants, including White, Asian, and Hispanic/Latino participants. Thirteen participants were excluded from the final analysis: 2 participants were missing data, and 11 biracial participants were excluded due to overlapping White and Black/African American races that may have confounded the analysis. Categorical variables were reported as frequencies and percentages, and χ2 and Fisher exact tests, when necessary, were used to test for statistically significant differences. Continuous variables were summarized with means and standard deviations, and a t test was used for statistically significant differences.
Logistic regression was performed to assess the relationship between race and pain after adjusting for confounding variables such as obesity, current tobacco use, self-reported HS severity, and the presence of comorbidities. A total of 204 patient records were included in the analysis, of which 70 (34.3%) had a pain score of 8 or higher, which indicates very severe pain intensity levels on the NRS,8 and were selected as a cut point based on the distribution of responses. For this cross-sectional cohort, our approach was to compare characteristics of those classified with a top score of 8 or higher (n=70) vs a top score of 0 to 7 (n=134)(cases vs noncases). Statistical analyses were performed using JMP Pro 16 (JMP Statistical Discovery LLC) at an α=.05 significance level; logistic regression was performed using SPSS Statistics (IBM). For the logistic regression, we grouped patient race into 2 categories: Black/African American and Other, which included White, Asian, and Hispanic/Latino participants.
Crude and adjusted multivariable logistic regression analyses were used to calculate prevalence odds ratios with 95% confidence intervals. Covariate inclusion in the multivariable logistic regression was based on a priori hypothesis/knowledge and was meant to estimate the independent effect of race after adjustment for income, HS severity, and history of prescription pain medication use. Other variables, including tobacco use, obesity, mood disorders, and current HS treatments, were all individually tested in the multivariate analysis and did not significantly impact the odds ratio for high pain. Statistical adjustment slightly decreased (19%) the magnitude between crude and adjusted prevalence odds ratios for the association between Black/African American race and high pain score.
Results
Survey Demographics —The final analysis included 204 survey respondents. Most respondents were Black/African American (58.82%), and nearly all were female (89.71%)(Table 1). The mean age (SD) of respondents was 37.37 (11.29) years (range, 19-70 years). Many respondents reported having completed some college (36.27%) or receiving a bachelor’s degree (19.12%). Of patients who were not Black/African American, 10.71% had higher than a master’s degree, whereas no Black/African American patients held a degree higher than a master’s ( P = .0052). Additionally, more Black/African American respondents (35.83%) reported an annual household income level of less than $25,000 compared with respondents who were not Black/African American (19.05%, P = .0001). Most respondents rated the severity of their HS as moderate or severe (46.57% and 41.67%, respectively), and there was no significant difference in reported severity of HS between racial groups ( P = .5395).
Pain Scores—As documented in the Methods, respondents were asked to rate their HS-related pain intensity from 0 to 10 using the NRS. The average pain score (SD)—the level of pain intensity over the prior month—was 6.39 (2.56)(range, 0–10). The mean pain score (SD) at the time of the survey was 3.61 (2.98)(range, 0–10)(Table 1). These data revealed that Black/African American patients had a significantly higher average pain score (SD) than patients with HS who were not Black/African American (7.08 [2.49] and 5.40 [2.35], respectively; P<.0001). After adjustment with multivariable logistical regression, Black/African American patients had 4-fold increased odds for very severe levels of pain (score of ≥8) compared with patients who were not Black/African American.
Pain Management—Although pain scores were higher for Black/African American patients with HS, there was no significant difference in the perception of pain control between racial groups (P=.0761). Additionally, we found low income (adjusted prevalence odds ratio [POR], 0.22; 95% CI, 0.05-0.91), a history of prescription pain medication use (adjusted POR, 2.25; 95% CI, 1.13-4.51), and HS severity (adjusted POR, 4.40; 95% CI, 1.11-17.36) all to be independent risk factors contributing to higher pain scores in patients with HS (Table 2). Lastly, we noted current or reported history of pain medication use was significantly correlated with higher pain scores (P=.0280 and P=.0213, respectively).
Satisfaction With Pain Management—The level of satisfaction with physician management of HS-related pain was significantly different between Black/African American patients and those who were not Black/African American (P=.0129). Of those who identified as Black/African American, 26.7% (n=32) strongly disagreed with the statement, “I am satisfied with how my pain related to HS is being managed by my doctors,” whereas only 15.5% (n=13) of patients who were not Black/African American strongly disagreed.
Comment
There is no cure for HS, and a large focus of treatment is pain management. Because racial disparities in the treatment of chronic pain will affect those with HS, we conducted a cross-sectional analysis of pain and pain management among HS patients. We found that Black/African American patients with HS have higher average pain scores than those who are not Black/African American and were 4 times more likely to experience very severe pain. Prior studies have established that patients with HS often report higher pain levels than patients with other chronic inflammatory skin conditions, 7,8 and our study identified racial disparities in HS-related pain management.
Measuring pain is challenging because of its multidimensional and subjective nature, making it essential to consider underlying causes and patients’ emotional responses to pain.9 By adjusting for confounding factors that may influence pain, such as mood disorders, disease severity, comorbidities, and medication use, we were able to gain better insight into fundamental differences in average pain intensity levels among racial groups and assess what factors may be contributing to a patient’s pain perception. Our study determined that lower income levels, higher HS disease severity, and a history of prescription pain medication use were all independent risk factors for high pain. Of note, obesity, tobacco use, and mood disorders such as anxiety and depression did not significantly differ between racial groups or increase the odds of high pain between racial groups identified.
With low income being an independent risk factor for high pain, we must consider the social determinants of health and how they may influence the pain experience in HS. We speculate that low income may be associated with other social determinants of health for the patients assessed in this study, such as lack of social and community support or limited health care access that contribute to worse health outcomes.10,11 In addition, low income contributes to limited access to medical care or treatments12; without access to effective HS management, lower-income patients may be at risk for higher disease severity and thus higher pain levels. However, economic stability is only a part of the whole picture; therefore, assessing the other social determinants of health in patients with HS may lead to better health outcomes and quality of life.
Another identified risk factor for high pain was a reported history of prescription pain medication use. This finding suggests that patients with moderate to severe pain likely have required stronger analgesic medications in the past. We further speculate that high pain levels in patients who have received prescription pain medications indicate either undertreatment, mistreatment, or recalcitrant pain. More research is needed to assess the relationship between HS-related pain intensity, analgesic medications, and providers who manage HS-related pain.
We also found that Black/African American patients with HS had a significantly higher dissatisfaction with their physician’s management of their pain, which could be attributable to several factors, including biological differences in medication metabolism (in which the patient has medication-resistant HS), undertreatment of pain, and/or poor doctor-patient relations. These reasons coincide with other diseases where health disparities are found.13-15 Recognizing these factors will be key to dismantling the disparities in HS that are noted within this study. The limitations of this work include the cross-sectional study design and its inability to evaluate causal factors of high pain levels across racial groups, the NRS lack of insight on pain chronicity or pain experience,7 the lack of provider or institution perspectives, and self-reported data. Additionally, only patients with email access were included, which may have excluded vulnerable populations with more pain associated with their HS.
Our findings highlight an area for further investigation to assess why these racial differences exist in HS-related pain. The results also emphasize the need for research evaluating whether systemic or health care provider biases contribute to racial differences in HS-related pain management.
Acknowledgment — Dr. Weir was supported by the Predoctoral Clinical/Translational Research Program (TL1), a National Institutes of Health Ruth L. Kirschstein National Research Service Award (NRSA), through the University of Alabama at Birmingham (UAB) Center for Clinical and Translational Science (CCTS).
- Garg A, Kirby JS, Lavian J, et al. Sex- and age-adjusted population analysis of prevalence estimates for hidradenitis suppurativa in the United States. JAMA Dermatol. 2017;153:760-764. doi:10.1001/jamadermatol.2017.0201
- Nguyen TV, Damiani G, Orenstein LAV, et al. Hidradenitis suppurativa: an update on epidemiology, phenotypes, diagnosis, pathogenesis, comorbidities and quality of life. J Eur Acad Dermatol Venereol. 2021;35:50-61. doi:10.1111/jdv.16677
- Krajewski PK, Matusiak Ł, von Stebut E, et al. Pain in hidradenitis suppurativa: a cross-sectional study of 1,795 patients. Acta Derm Venereol. 2021;101:adv00364. doi:10.2340/00015555-3724
- Savage KT, Singh V, Patel ZS, et al. Pain management in hidradenitis suppurativa and a proposed treatment algorithm. J Am Acad Dermatol. 2021;85:187-199. doi:10.1016/j.jaad.2020.09.039
- Morales ME, Yong RJ. Racial and ethnic disparities in the treatment of chronic pain. Pain Med. 2021;22:75-90. doi:10.1093/pm/pnaa427
- US Department of Health and Human Services. 2019 National Healthcare Quality and Disparities Report. December 2020. Accessed June 21, 2023. https://www.ahrq.gov/sites/default/files/wysiwyg/research/findings/nhqrdr/2019qdr.pdf
- Hoffman KM, Trawalter S, Axt JR, et al. Racial bias in pain assessment and treatment recommendations, and false beliefs about biological differences between blacks and whites. Proc Natl Acad Sci U S A. 2016;113:4296-4301. doi:10.1073/pnas.1516047113
- Patel ZS, Hoffman LK, Buse DC, et al. Pain, psychological comorbidities, disability, and impaired quality of life in hidradenitis suppurativa. Curr Pain Headache Rep. 2017;21:49. doi:10.1007/s11916-017-0647-3. Published correction appears in Curr Pain Headache Rep. 2017;21:52.
- McDowell I. Pain measurements. In: Measuring Health: A Guide to Rating Scales and Questionnaires. Oxford University Press; 2006:477-478.
- Singh GK, Daus GP, Allender M, et al. Social determinants of health in the United States: addressing major health inequality trends for the nation, 1935-2016. Int J MCH AIDS. 2017;6:139-164. doi:10.21106/ijma.236
- Sulley S, Bayssie M. Social determinants of health: an evaluation of risk factors associated with inpatient presentations in the United States. Cureus. 2021;13:E13287. doi:10.7759/cureus.13287
- Lazar M, Davenport L. Barriers to health care access for low income families: a review of literature. J Community Health Nurs. 2018;35:28-37. doi:10.1080/07370016.2018.1404832
- Ghoshal M, Shapiro H, Todd K, et al. Chronic noncancer pain management and systemic racism: time to move toward equal care standards.J Pain Res. 2020;13:2825-2836. doi:10.214/JPR.S287314
- Cintron A, Morrison RS. Pain and ethnicity in the United States: a systematic review. J Palliat Med. 2006;9:1454-1473. doi:10.1089/jpm.2006.9.1454
- Green CR, Anderson KO, Baker TA, et al. The unequal burden of pain: confronting racial and ethnic disparities in pain. Pain Med. 2003;4:277-294. doi:10.1046/j.1526-4637.2003.03034.x. Published correction appears in Pain Med. 2005;6:99.
- Garg A, Kirby JS, Lavian J, et al. Sex- and age-adjusted population analysis of prevalence estimates for hidradenitis suppurativa in the United States. JAMA Dermatol. 2017;153:760-764. doi:10.1001/jamadermatol.2017.0201
- Nguyen TV, Damiani G, Orenstein LAV, et al. Hidradenitis suppurativa: an update on epidemiology, phenotypes, diagnosis, pathogenesis, comorbidities and quality of life. J Eur Acad Dermatol Venereol. 2021;35:50-61. doi:10.1111/jdv.16677
- Krajewski PK, Matusiak Ł, von Stebut E, et al. Pain in hidradenitis suppurativa: a cross-sectional study of 1,795 patients. Acta Derm Venereol. 2021;101:adv00364. doi:10.2340/00015555-3724
- Savage KT, Singh V, Patel ZS, et al. Pain management in hidradenitis suppurativa and a proposed treatment algorithm. J Am Acad Dermatol. 2021;85:187-199. doi:10.1016/j.jaad.2020.09.039
- Morales ME, Yong RJ. Racial and ethnic disparities in the treatment of chronic pain. Pain Med. 2021;22:75-90. doi:10.1093/pm/pnaa427
- US Department of Health and Human Services. 2019 National Healthcare Quality and Disparities Report. December 2020. Accessed June 21, 2023. https://www.ahrq.gov/sites/default/files/wysiwyg/research/findings/nhqrdr/2019qdr.pdf
- Hoffman KM, Trawalter S, Axt JR, et al. Racial bias in pain assessment and treatment recommendations, and false beliefs about biological differences between blacks and whites. Proc Natl Acad Sci U S A. 2016;113:4296-4301. doi:10.1073/pnas.1516047113
- Patel ZS, Hoffman LK, Buse DC, et al. Pain, psychological comorbidities, disability, and impaired quality of life in hidradenitis suppurativa. Curr Pain Headache Rep. 2017;21:49. doi:10.1007/s11916-017-0647-3. Published correction appears in Curr Pain Headache Rep. 2017;21:52.
- McDowell I. Pain measurements. In: Measuring Health: A Guide to Rating Scales and Questionnaires. Oxford University Press; 2006:477-478.
- Singh GK, Daus GP, Allender M, et al. Social determinants of health in the United States: addressing major health inequality trends for the nation, 1935-2016. Int J MCH AIDS. 2017;6:139-164. doi:10.21106/ijma.236
- Sulley S, Bayssie M. Social determinants of health: an evaluation of risk factors associated with inpatient presentations in the United States. Cureus. 2021;13:E13287. doi:10.7759/cureus.13287
- Lazar M, Davenport L. Barriers to health care access for low income families: a review of literature. J Community Health Nurs. 2018;35:28-37. doi:10.1080/07370016.2018.1404832
- Ghoshal M, Shapiro H, Todd K, et al. Chronic noncancer pain management and systemic racism: time to move toward equal care standards.J Pain Res. 2020;13:2825-2836. doi:10.214/JPR.S287314
- Cintron A, Morrison RS. Pain and ethnicity in the United States: a systematic review. J Palliat Med. 2006;9:1454-1473. doi:10.1089/jpm.2006.9.1454
- Green CR, Anderson KO, Baker TA, et al. The unequal burden of pain: confronting racial and ethnic disparities in pain. Pain Med. 2003;4:277-294. doi:10.1046/j.1526-4637.2003.03034.x. Published correction appears in Pain Med. 2005;6:99.
Practice Points
- Racial disparities exist in the management of hidradenitis suppurativa (HS)–related pain.
- Black/African American patients with HS are 4 times more likely to experience very severe pain than patients of other races or ethnicities.
- Lower income levels, higher HS disease severity, and a history of prescription pain medication use are all independent risk factors for very severe pain in patients with HS.
Commentary: Refractory chronic migraine treatment, July 2023
Calcitonin gene-related peptide (CGRP) antagonist medications have revolutionized migraine therapy since being introduced in 2018. The initial preventive trials for monoclonal antibodies (mAb) excluded older adults, with a cutoff in all studies at age 65 years. Long-term safety studies have not revealed signals for concern related to vascular or other adverse events. The study by Muñoz-Vendrell and colleagues investigated the efficacy of CGRP mAb in treatment-refractory older adults.
This was an observational retrospective study in participants older than 65 years that had previously used three or more prior migraine preventives unsuccessfully. The primary endpoints were reduction in monthly migraine days after 6 months of treatment and the presence of adverse effects. Secondary endpoints were reductions in headache and acute medication frequency as well as improvement in patient reported outcomes.
A total of 162 participants were followed at 18 different headache centers throughout Spain. All patients had at least 8 headache days per month and had been treated unsuccessfully with three prior medications for migraine prevention, one of which was botulinum toxin. The median age was 68 years, and over 80% had chronic migraine. The reduction in mean headache days was 10 days per month; 72% continued to use their CGRP mAb after using it for 6 months. Participants were compared relative to medication overuse but no significant differences were found between those who overused medication and others.
This study highlights the efficacy of CGRP medications in those outside of the initially studied population. Other preventive medications may be contraindicated in this population, but CGRP antagonists do appear to be safe and effective options for older adults.
Opiate medications are typically considered inappropriate as an acute treatment for migraine. Even infrequent use of opiate medications has been shown to be associated with worse migraine outcomes, specifically higher frequency and a higher likelihood to convert from episodic to chronic migraine. Van Welie and colleagues performed a cross-sectional questionnaire-based study assessing levels of opioid use in patients with migraine.
Participants were selected from the Leiden Headache Center and fit the diagnostic criteria of migraine. They were given an e-questionnaire to determine their use of these opiates: buprenorphine, fentanyl, hydromorphone, morphine, oxycodone, tapentadol, and tramadol (codeine was not included in this list). Patients were separately divided between chronic and episodic migraine groups. The primary outcome was assessing for current acute treatment of migraine with an opiate; secondary outcomes were association of chronicity of migraine and likelihood of medication overuse with opiate use.
Only approximately 1.8% of participants reported that they currently use an opiate for acute migraine treatment; 12.5% reported that they previously have used an opiate and 25.7% reported using an opiate for another pain condition. Tramadol was the most commonly used opiate medication, followed by oxycodone and morphine; 2.4% of patients reported that their opiate use was not prescribed by their doctor. Primary care doctors were the most common prescribers of the opiate medications; 16% of the time, patients were told that it was a preventive treatment for migraine. Opiate use was more frequent in patients with a diagnosis of chronic migraine, and the duration of use was greater.
Opiate medications remain a poor acute choice of treatment for migraine, and this study shows a correlation between higher opiate use and chronic migraine. There are many other acute medications now available for migraine, many of them migraine-specific treatments, such as triptans, gepants, and ditans. This research again shows that opiates should be avoided if at all possible for migraine.
Patients with medication overuse headache are more likely to be treatment-refractory, and the addition of acute medications often can be less effective if they remain on the overused medication. There has been a long-standing debate whether it is best to wean medications first or start a preventive initially when faced with medication overuse. The CGRP antagonists may be one of the better preventive options in this situation, and one mAb (fremenezumab) reported positive data in a small medication overuse trial. The study by Guerzoni and colleagues investigated the effectiveness of galcanezumab in chronic migraine with medication overuse.
This was a prospective trial conducted at the University Hospital of Modena. A total of 78 patients with a diagnosis of chronic migraine and medication overuse were enrolled for 15 months, with follow-up every 3 months. At each follow-up appointment, they completed a questionnaire asking them details about: mean migraine days per month, mean number of painkillers taken per month, mean days per month taking a painkiller, average migraine severity, and the Headache Impact Test (HIT-6) and Migraine Disability Assessment (MIDAS) questions. Patients were given the standard-dosing regimen of glacanezumab for migraine and were not blinded; this was an open-label study.
The mean migraine days per month were significantly reduced after 3, 6, 9, and 12 months. The amount of painkillers used per month and days of painkillers per month both reduced significantly as well. Migraine-related disability on HIT-6 and MIDAS were all reduced significantly as well. The most significant improvement long-term was noted in patients who improved the most during the initial 3 months of treatment.
The debate regarding the best treatment for patients with medication overuse will continue, but this study highlights the effectiveness of CGRP mAb use in this population. Patients were able to decrease the use of acute medications without a strict wean off of their previous medication. Ideally, a similar study should also be done for additional mAb and oral CGRP antagonists.
Calcitonin gene-related peptide (CGRP) antagonist medications have revolutionized migraine therapy since being introduced in 2018. The initial preventive trials for monoclonal antibodies (mAb) excluded older adults, with a cutoff in all studies at age 65 years. Long-term safety studies have not revealed signals for concern related to vascular or other adverse events. The study by Muñoz-Vendrell and colleagues investigated the efficacy of CGRP mAb in treatment-refractory older adults.
This was an observational retrospective study in participants older than 65 years that had previously used three or more prior migraine preventives unsuccessfully. The primary endpoints were reduction in monthly migraine days after 6 months of treatment and the presence of adverse effects. Secondary endpoints were reductions in headache and acute medication frequency as well as improvement in patient reported outcomes.
A total of 162 participants were followed at 18 different headache centers throughout Spain. All patients had at least 8 headache days per month and had been treated unsuccessfully with three prior medications for migraine prevention, one of which was botulinum toxin. The median age was 68 years, and over 80% had chronic migraine. The reduction in mean headache days was 10 days per month; 72% continued to use their CGRP mAb after using it for 6 months. Participants were compared relative to medication overuse but no significant differences were found between those who overused medication and others.
This study highlights the efficacy of CGRP medications in those outside of the initially studied population. Other preventive medications may be contraindicated in this population, but CGRP antagonists do appear to be safe and effective options for older adults.
Opiate medications are typically considered inappropriate as an acute treatment for migraine. Even infrequent use of opiate medications has been shown to be associated with worse migraine outcomes, specifically higher frequency and a higher likelihood to convert from episodic to chronic migraine. Van Welie and colleagues performed a cross-sectional questionnaire-based study assessing levels of opioid use in patients with migraine.
Participants were selected from the Leiden Headache Center and fit the diagnostic criteria of migraine. They were given an e-questionnaire to determine their use of these opiates: buprenorphine, fentanyl, hydromorphone, morphine, oxycodone, tapentadol, and tramadol (codeine was not included in this list). Patients were separately divided between chronic and episodic migraine groups. The primary outcome was assessing for current acute treatment of migraine with an opiate; secondary outcomes were association of chronicity of migraine and likelihood of medication overuse with opiate use.
Only approximately 1.8% of participants reported that they currently use an opiate for acute migraine treatment; 12.5% reported that they previously have used an opiate and 25.7% reported using an opiate for another pain condition. Tramadol was the most commonly used opiate medication, followed by oxycodone and morphine; 2.4% of patients reported that their opiate use was not prescribed by their doctor. Primary care doctors were the most common prescribers of the opiate medications; 16% of the time, patients were told that it was a preventive treatment for migraine. Opiate use was more frequent in patients with a diagnosis of chronic migraine, and the duration of use was greater.
Opiate medications remain a poor acute choice of treatment for migraine, and this study shows a correlation between higher opiate use and chronic migraine. There are many other acute medications now available for migraine, many of them migraine-specific treatments, such as triptans, gepants, and ditans. This research again shows that opiates should be avoided if at all possible for migraine.
Patients with medication overuse headache are more likely to be treatment-refractory, and the addition of acute medications often can be less effective if they remain on the overused medication. There has been a long-standing debate whether it is best to wean medications first or start a preventive initially when faced with medication overuse. The CGRP antagonists may be one of the better preventive options in this situation, and one mAb (fremenezumab) reported positive data in a small medication overuse trial. The study by Guerzoni and colleagues investigated the effectiveness of galcanezumab in chronic migraine with medication overuse.
This was a prospective trial conducted at the University Hospital of Modena. A total of 78 patients with a diagnosis of chronic migraine and medication overuse were enrolled for 15 months, with follow-up every 3 months. At each follow-up appointment, they completed a questionnaire asking them details about: mean migraine days per month, mean number of painkillers taken per month, mean days per month taking a painkiller, average migraine severity, and the Headache Impact Test (HIT-6) and Migraine Disability Assessment (MIDAS) questions. Patients were given the standard-dosing regimen of glacanezumab for migraine and were not blinded; this was an open-label study.
The mean migraine days per month were significantly reduced after 3, 6, 9, and 12 months. The amount of painkillers used per month and days of painkillers per month both reduced significantly as well. Migraine-related disability on HIT-6 and MIDAS were all reduced significantly as well. The most significant improvement long-term was noted in patients who improved the most during the initial 3 months of treatment.
The debate regarding the best treatment for patients with medication overuse will continue, but this study highlights the effectiveness of CGRP mAb use in this population. Patients were able to decrease the use of acute medications without a strict wean off of their previous medication. Ideally, a similar study should also be done for additional mAb and oral CGRP antagonists.
Calcitonin gene-related peptide (CGRP) antagonist medications have revolutionized migraine therapy since being introduced in 2018. The initial preventive trials for monoclonal antibodies (mAb) excluded older adults, with a cutoff in all studies at age 65 years. Long-term safety studies have not revealed signals for concern related to vascular or other adverse events. The study by Muñoz-Vendrell and colleagues investigated the efficacy of CGRP mAb in treatment-refractory older adults.
This was an observational retrospective study in participants older than 65 years that had previously used three or more prior migraine preventives unsuccessfully. The primary endpoints were reduction in monthly migraine days after 6 months of treatment and the presence of adverse effects. Secondary endpoints were reductions in headache and acute medication frequency as well as improvement in patient reported outcomes.
A total of 162 participants were followed at 18 different headache centers throughout Spain. All patients had at least 8 headache days per month and had been treated unsuccessfully with three prior medications for migraine prevention, one of which was botulinum toxin. The median age was 68 years, and over 80% had chronic migraine. The reduction in mean headache days was 10 days per month; 72% continued to use their CGRP mAb after using it for 6 months. Participants were compared relative to medication overuse but no significant differences were found between those who overused medication and others.
This study highlights the efficacy of CGRP medications in those outside of the initially studied population. Other preventive medications may be contraindicated in this population, but CGRP antagonists do appear to be safe and effective options for older adults.
Opiate medications are typically considered inappropriate as an acute treatment for migraine. Even infrequent use of opiate medications has been shown to be associated with worse migraine outcomes, specifically higher frequency and a higher likelihood to convert from episodic to chronic migraine. Van Welie and colleagues performed a cross-sectional questionnaire-based study assessing levels of opioid use in patients with migraine.
Participants were selected from the Leiden Headache Center and fit the diagnostic criteria of migraine. They were given an e-questionnaire to determine their use of these opiates: buprenorphine, fentanyl, hydromorphone, morphine, oxycodone, tapentadol, and tramadol (codeine was not included in this list). Patients were separately divided between chronic and episodic migraine groups. The primary outcome was assessing for current acute treatment of migraine with an opiate; secondary outcomes were association of chronicity of migraine and likelihood of medication overuse with opiate use.
Only approximately 1.8% of participants reported that they currently use an opiate for acute migraine treatment; 12.5% reported that they previously have used an opiate and 25.7% reported using an opiate for another pain condition. Tramadol was the most commonly used opiate medication, followed by oxycodone and morphine; 2.4% of patients reported that their opiate use was not prescribed by their doctor. Primary care doctors were the most common prescribers of the opiate medications; 16% of the time, patients were told that it was a preventive treatment for migraine. Opiate use was more frequent in patients with a diagnosis of chronic migraine, and the duration of use was greater.
Opiate medications remain a poor acute choice of treatment for migraine, and this study shows a correlation between higher opiate use and chronic migraine. There are many other acute medications now available for migraine, many of them migraine-specific treatments, such as triptans, gepants, and ditans. This research again shows that opiates should be avoided if at all possible for migraine.
Patients with medication overuse headache are more likely to be treatment-refractory, and the addition of acute medications often can be less effective if they remain on the overused medication. There has been a long-standing debate whether it is best to wean medications first or start a preventive initially when faced with medication overuse. The CGRP antagonists may be one of the better preventive options in this situation, and one mAb (fremenezumab) reported positive data in a small medication overuse trial. The study by Guerzoni and colleagues investigated the effectiveness of galcanezumab in chronic migraine with medication overuse.
This was a prospective trial conducted at the University Hospital of Modena. A total of 78 patients with a diagnosis of chronic migraine and medication overuse were enrolled for 15 months, with follow-up every 3 months. At each follow-up appointment, they completed a questionnaire asking them details about: mean migraine days per month, mean number of painkillers taken per month, mean days per month taking a painkiller, average migraine severity, and the Headache Impact Test (HIT-6) and Migraine Disability Assessment (MIDAS) questions. Patients were given the standard-dosing regimen of glacanezumab for migraine and were not blinded; this was an open-label study.
The mean migraine days per month were significantly reduced after 3, 6, 9, and 12 months. The amount of painkillers used per month and days of painkillers per month both reduced significantly as well. Migraine-related disability on HIT-6 and MIDAS were all reduced significantly as well. The most significant improvement long-term was noted in patients who improved the most during the initial 3 months of treatment.
The debate regarding the best treatment for patients with medication overuse will continue, but this study highlights the effectiveness of CGRP mAb use in this population. Patients were able to decrease the use of acute medications without a strict wean off of their previous medication. Ideally, a similar study should also be done for additional mAb and oral CGRP antagonists.
Necessary Updates to Skin Cancer Risk Stratification
1. Powers JG, Patel NA, Powers EA, Mayer JE, Stricklin GP, Geller AC. Skin cancer
risk factors and preventative behaviors among United States military veterans deployed to Iraq and Afghanistan. J Invest Dermatol. 2015;135:2871-2873.
2. Balci S, Ayaz L, Gorur A, Yildirim Yaroglu H, Akbayir S, Dogruer Unal N, Bulut B,
Tursen U, Tamer L. microRNA profiling for early detection of nonmelanoma skin cancer. Clin Exp Dermatol. 2016;41(4):346-51. doi:10.1111/ced.12736
3. Siegel RL, Miller KD, Fuchs HE, Jemal A. Cancer statistics, 2022. CA Cancer J Clin. 2022;72(1):7-33. doi:10.3322/caac.21708
4. Agbai ON, Buster K, Sanchez M, Hernandez C, Kundu RV, Chiu M, et al. Skin cancer and photoprotection in people of color: a review and recommendations for physicians and the public. J Am Acad Dermatol. 2014;70(4):748-62.
5. Chou SE, Gaysynsky A, Trivedi N, Vanderpool R. Using social media for health: national data from HINTS 2019. Journ of Health Comm. 2019;26(3):184-193. doi:10.1080/10810730.2021.
6. Stern RS. Prevalence of a history of skin cancer in 2007: results of an incidence-based model. Arch Dermatol. 2010;146(3):279-82.
7. Dennis LK, et al. Sunburns and risk of cutaneous melanoma: does age matter? A comprehensive meta-analysis. Annals of Epidem. 2008;18(8):614-627. doi:10.1016/j.annepidem.2008.
8. Wu S, Han J, Laden F, Qureshi AA. Long-term ultraviolet flux, other potential risk factors, and skin cancer risk: a cohort study. Cancer Epidemiol Biomar Prev. 2014;23(6):1080-1089.
9. 2020 Demographics Profile of the military community. US Department of Defense. 2020:iv. Accessed November 15, 2022. 2020 Demographics Profile of the Military Community (militaryonesource.mil)
10. Apalla Z, Lallas A, Sotiriou E, Lazaridou E, Ioannides D. Epidemiological trends in skin cancer. Dermatol Pract Concept. 2017;7:1-6.
11. Basch CH, Hillyer GC. Skin cancer on Instagram: implications for adolescents and young adults. Int J Adolesc Med Health. 2022;34(3). doi:10.1515/ijamh-2019-0218
1. Powers JG, Patel NA, Powers EA, Mayer JE, Stricklin GP, Geller AC. Skin cancer
risk factors and preventative behaviors among United States military veterans deployed to Iraq and Afghanistan. J Invest Dermatol. 2015;135:2871-2873.
2. Balci S, Ayaz L, Gorur A, Yildirim Yaroglu H, Akbayir S, Dogruer Unal N, Bulut B,
Tursen U, Tamer L. microRNA profiling for early detection of nonmelanoma skin cancer. Clin Exp Dermatol. 2016;41(4):346-51. doi:10.1111/ced.12736
3. Siegel RL, Miller KD, Fuchs HE, Jemal A. Cancer statistics, 2022. CA Cancer J Clin. 2022;72(1):7-33. doi:10.3322/caac.21708
4. Agbai ON, Buster K, Sanchez M, Hernandez C, Kundu RV, Chiu M, et al. Skin cancer and photoprotection in people of color: a review and recommendations for physicians and the public. J Am Acad Dermatol. 2014;70(4):748-62.
5. Chou SE, Gaysynsky A, Trivedi N, Vanderpool R. Using social media for health: national data from HINTS 2019. Journ of Health Comm. 2019;26(3):184-193. doi:10.1080/10810730.2021.
6. Stern RS. Prevalence of a history of skin cancer in 2007: results of an incidence-based model. Arch Dermatol. 2010;146(3):279-82.
7. Dennis LK, et al. Sunburns and risk of cutaneous melanoma: does age matter? A comprehensive meta-analysis. Annals of Epidem. 2008;18(8):614-627. doi:10.1016/j.annepidem.2008.
8. Wu S, Han J, Laden F, Qureshi AA. Long-term ultraviolet flux, other potential risk factors, and skin cancer risk: a cohort study. Cancer Epidemiol Biomar Prev. 2014;23(6):1080-1089.
9. 2020 Demographics Profile of the military community. US Department of Defense. 2020:iv. Accessed November 15, 2022. 2020 Demographics Profile of the Military Community (militaryonesource.mil)
10. Apalla Z, Lallas A, Sotiriou E, Lazaridou E, Ioannides D. Epidemiological trends in skin cancer. Dermatol Pract Concept. 2017;7:1-6.
11. Basch CH, Hillyer GC. Skin cancer on Instagram: implications for adolescents and young adults. Int J Adolesc Med Health. 2022;34(3). doi:10.1515/ijamh-2019-0218
1. Powers JG, Patel NA, Powers EA, Mayer JE, Stricklin GP, Geller AC. Skin cancer
risk factors and preventative behaviors among United States military veterans deployed to Iraq and Afghanistan. J Invest Dermatol. 2015;135:2871-2873.
2. Balci S, Ayaz L, Gorur A, Yildirim Yaroglu H, Akbayir S, Dogruer Unal N, Bulut B,
Tursen U, Tamer L. microRNA profiling for early detection of nonmelanoma skin cancer. Clin Exp Dermatol. 2016;41(4):346-51. doi:10.1111/ced.12736
3. Siegel RL, Miller KD, Fuchs HE, Jemal A. Cancer statistics, 2022. CA Cancer J Clin. 2022;72(1):7-33. doi:10.3322/caac.21708
4. Agbai ON, Buster K, Sanchez M, Hernandez C, Kundu RV, Chiu M, et al. Skin cancer and photoprotection in people of color: a review and recommendations for physicians and the public. J Am Acad Dermatol. 2014;70(4):748-62.
5. Chou SE, Gaysynsky A, Trivedi N, Vanderpool R. Using social media for health: national data from HINTS 2019. Journ of Health Comm. 2019;26(3):184-193. doi:10.1080/10810730.2021.
6. Stern RS. Prevalence of a history of skin cancer in 2007: results of an incidence-based model. Arch Dermatol. 2010;146(3):279-82.
7. Dennis LK, et al. Sunburns and risk of cutaneous melanoma: does age matter? A comprehensive meta-analysis. Annals of Epidem. 2008;18(8):614-627. doi:10.1016/j.annepidem.2008.
8. Wu S, Han J, Laden F, Qureshi AA. Long-term ultraviolet flux, other potential risk factors, and skin cancer risk: a cohort study. Cancer Epidemiol Biomar Prev. 2014;23(6):1080-1089.
9. 2020 Demographics Profile of the military community. US Department of Defense. 2020:iv. Accessed November 15, 2022. 2020 Demographics Profile of the Military Community (militaryonesource.mil)
10. Apalla Z, Lallas A, Sotiriou E, Lazaridou E, Ioannides D. Epidemiological trends in skin cancer. Dermatol Pract Concept. 2017;7:1-6.
11. Basch CH, Hillyer GC. Skin cancer on Instagram: implications for adolescents and young adults. Int J Adolesc Med Health. 2022;34(3). doi:10.1515/ijamh-2019-0218


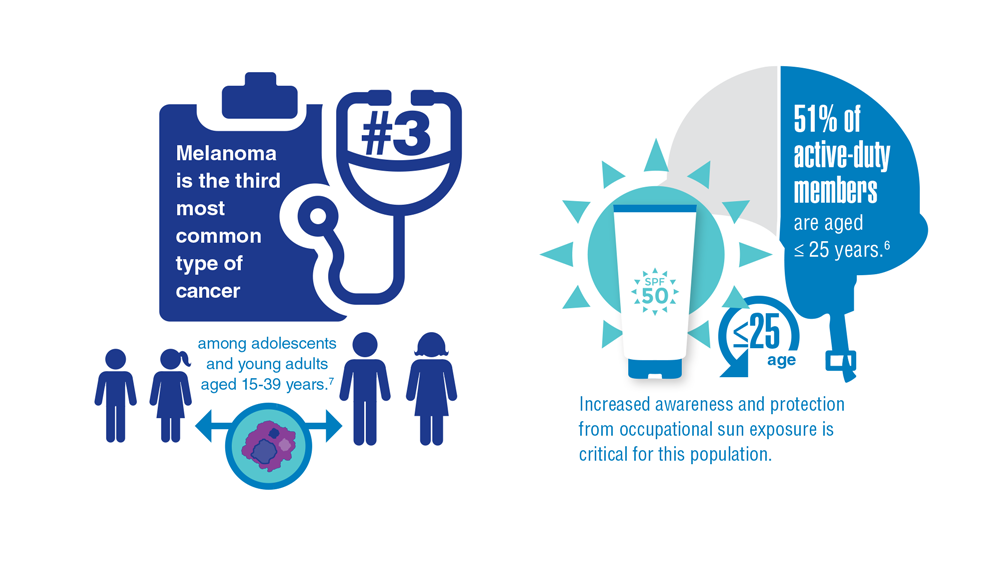


Gender Disparity in Breast Cancer Among US Veterans
1. Giordano SH, Cohen DS, Buzdar AU, Perkins G, Hortobagyi GN. Breast carcinoma in men: a population-based study. Cancer. 2004;101(1):51-57. doi:10.1002/cncr.20312
2. Key statistics for breast cancer in men. American Cancer Society. Updated January 12, 2022. Accessed December 14, 2022. https://www.cancer.org/cancer/breast-cancer-in-men/about/key-statistics.html
3. Aggarwal A, Adepoju B, Yacur M, Maron D, Sharma MH. Gender disparity in breast cancer: a veteran population-based comparison. Clin Breast Cancer. 2021;21(4):e471-e478. doi:10.1016/j.clbc.2021.01.013
4. Ravandi-Kashani F, Hayes TG. Male breast cancer: a review of the literature. Eur J Cancer. 1998;34(9):1341-1347. doi:10.1016/s0959-8049(98)00028-8
5. Giordano SH. A review of diagnosis and management of male breast cancer. Oncologist. 2005;10(7):471-479. doi:10.1634/theoncologist.10-7-471
6. Midding E, Halbach SM, Kowalski C, Weber R, Würstlein R, Ernstmann N. Men with a “woman's disease”: stigmatization of male breast cancer patients—a mixed methods analysis. Am J Mens Health. 2018;12(6):2194-2207. doi:10.1177/1557988318799025
7. Key statistics for breast cancer. American Cancer Society. Updated October 6, 2022. Accessed December 14, 2022. https://www.cancer.org/cancer/breast-cancer/about/how-common-is-breast-cancer.html
8. Male breast cancer incidence and mortality, United States—2013-2017. Centers for Disease Control and Prevention. Updated October 1, 2020. Accessed December 14, 2022. https://www.cdc.gov/cancer/uscs/about/data-briefs/no19-male-breast-cancer-incidence-mortality-UnitedStates-2013-2017.htm
9. Anderson WF, Althuis MD, Brinton LA, Devesa SS. Is male breast cancer similar or different than female breast cancer? Breast Cancer Res Treat. 2004;83(1):77-86. doi:10.1023/B:BREA.0000010701.08825.2d 10. Pritzlaff M, Summerour P, McFarland R, et al. Male breast cancer in a multi-gene panel testing cohort: insights and unexpected results. Breast Cancer Res Treat. 2017;161(3):575-586. doi:10.1007/s10549-016-4085-4
11. Ottini L, Capalbo C, Rizzolo P, et al. HER2-positive male breast cancer: an update. Breast Cancer (Dove Med Press). 2010;2:45-58. doi:10.2147/BCTT.S6519
12. Risk factors for breast cancer in men. American Cancer Society. Updated April 27, 2018. Accessed December 14, 2022. https://www.cancer.org/cancer/breast-cancer-in-men/causes-risks-prevention/risk-factors.html
13. Palli D, Masala G, Mariani-Constantini R, et al. A gene–environment interaction between occupation and BRCA1/BRCA2 mutations in male breast cancer? Eur J Cancer. 2004;40(16):2472-2479. doi:10.1016/j.ejca.2004.07.012
14. Hansen J. Elevated risk for male breast cancer after occupational exposure to gasoline and vehicular combustion products. Am J Ind Med. 2000;37(4):349-352. doi:10.1002/(sici)1097-0274(200004)37:4<349::aid-ajim4>3.0.co;2-l
15. Sung H, DeSantis C, Jemal A. Subtype-specific breast cancer incidence rates in Black versus White men in the United States. JNCI Cancer Spectr. 2020;4(1):pkz091. doi:10.1093/jncics/pkz091
16. Breast cancer, male: statistics. Cancer.net. January 2022. Accessed December 14, 2022. https://www.cancer.net/cancer-types/breast-cancer-male/statistics
1. Giordano SH, Cohen DS, Buzdar AU, Perkins G, Hortobagyi GN. Breast carcinoma in men: a population-based study. Cancer. 2004;101(1):51-57. doi:10.1002/cncr.20312
2. Key statistics for breast cancer in men. American Cancer Society. Updated January 12, 2022. Accessed December 14, 2022. https://www.cancer.org/cancer/breast-cancer-in-men/about/key-statistics.html
3. Aggarwal A, Adepoju B, Yacur M, Maron D, Sharma MH. Gender disparity in breast cancer: a veteran population-based comparison. Clin Breast Cancer. 2021;21(4):e471-e478. doi:10.1016/j.clbc.2021.01.013
4. Ravandi-Kashani F, Hayes TG. Male breast cancer: a review of the literature. Eur J Cancer. 1998;34(9):1341-1347. doi:10.1016/s0959-8049(98)00028-8
5. Giordano SH. A review of diagnosis and management of male breast cancer. Oncologist. 2005;10(7):471-479. doi:10.1634/theoncologist.10-7-471
6. Midding E, Halbach SM, Kowalski C, Weber R, Würstlein R, Ernstmann N. Men with a “woman's disease”: stigmatization of male breast cancer patients—a mixed methods analysis. Am J Mens Health. 2018;12(6):2194-2207. doi:10.1177/1557988318799025
7. Key statistics for breast cancer. American Cancer Society. Updated October 6, 2022. Accessed December 14, 2022. https://www.cancer.org/cancer/breast-cancer/about/how-common-is-breast-cancer.html
8. Male breast cancer incidence and mortality, United States—2013-2017. Centers for Disease Control and Prevention. Updated October 1, 2020. Accessed December 14, 2022. https://www.cdc.gov/cancer/uscs/about/data-briefs/no19-male-breast-cancer-incidence-mortality-UnitedStates-2013-2017.htm
9. Anderson WF, Althuis MD, Brinton LA, Devesa SS. Is male breast cancer similar or different than female breast cancer? Breast Cancer Res Treat. 2004;83(1):77-86. doi:10.1023/B:BREA.0000010701.08825.2d 10. Pritzlaff M, Summerour P, McFarland R, et al. Male breast cancer in a multi-gene panel testing cohort: insights and unexpected results. Breast Cancer Res Treat. 2017;161(3):575-586. doi:10.1007/s10549-016-4085-4
11. Ottini L, Capalbo C, Rizzolo P, et al. HER2-positive male breast cancer: an update. Breast Cancer (Dove Med Press). 2010;2:45-58. doi:10.2147/BCTT.S6519
12. Risk factors for breast cancer in men. American Cancer Society. Updated April 27, 2018. Accessed December 14, 2022. https://www.cancer.org/cancer/breast-cancer-in-men/causes-risks-prevention/risk-factors.html
13. Palli D, Masala G, Mariani-Constantini R, et al. A gene–environment interaction between occupation and BRCA1/BRCA2 mutations in male breast cancer? Eur J Cancer. 2004;40(16):2472-2479. doi:10.1016/j.ejca.2004.07.012
14. Hansen J. Elevated risk for male breast cancer after occupational exposure to gasoline and vehicular combustion products. Am J Ind Med. 2000;37(4):349-352. doi:10.1002/(sici)1097-0274(200004)37:4<349::aid-ajim4>3.0.co;2-l
15. Sung H, DeSantis C, Jemal A. Subtype-specific breast cancer incidence rates in Black versus White men in the United States. JNCI Cancer Spectr. 2020;4(1):pkz091. doi:10.1093/jncics/pkz091
16. Breast cancer, male: statistics. Cancer.net. January 2022. Accessed December 14, 2022. https://www.cancer.net/cancer-types/breast-cancer-male/statistics
1. Giordano SH, Cohen DS, Buzdar AU, Perkins G, Hortobagyi GN. Breast carcinoma in men: a population-based study. Cancer. 2004;101(1):51-57. doi:10.1002/cncr.20312
2. Key statistics for breast cancer in men. American Cancer Society. Updated January 12, 2022. Accessed December 14, 2022. https://www.cancer.org/cancer/breast-cancer-in-men/about/key-statistics.html
3. Aggarwal A, Adepoju B, Yacur M, Maron D, Sharma MH. Gender disparity in breast cancer: a veteran population-based comparison. Clin Breast Cancer. 2021;21(4):e471-e478. doi:10.1016/j.clbc.2021.01.013
4. Ravandi-Kashani F, Hayes TG. Male breast cancer: a review of the literature. Eur J Cancer. 1998;34(9):1341-1347. doi:10.1016/s0959-8049(98)00028-8
5. Giordano SH. A review of diagnosis and management of male breast cancer. Oncologist. 2005;10(7):471-479. doi:10.1634/theoncologist.10-7-471
6. Midding E, Halbach SM, Kowalski C, Weber R, Würstlein R, Ernstmann N. Men with a “woman's disease”: stigmatization of male breast cancer patients—a mixed methods analysis. Am J Mens Health. 2018;12(6):2194-2207. doi:10.1177/1557988318799025
7. Key statistics for breast cancer. American Cancer Society. Updated October 6, 2022. Accessed December 14, 2022. https://www.cancer.org/cancer/breast-cancer/about/how-common-is-breast-cancer.html
8. Male breast cancer incidence and mortality, United States—2013-2017. Centers for Disease Control and Prevention. Updated October 1, 2020. Accessed December 14, 2022. https://www.cdc.gov/cancer/uscs/about/data-briefs/no19-male-breast-cancer-incidence-mortality-UnitedStates-2013-2017.htm
9. Anderson WF, Althuis MD, Brinton LA, Devesa SS. Is male breast cancer similar or different than female breast cancer? Breast Cancer Res Treat. 2004;83(1):77-86. doi:10.1023/B:BREA.0000010701.08825.2d 10. Pritzlaff M, Summerour P, McFarland R, et al. Male breast cancer in a multi-gene panel testing cohort: insights and unexpected results. Breast Cancer Res Treat. 2017;161(3):575-586. doi:10.1007/s10549-016-4085-4
11. Ottini L, Capalbo C, Rizzolo P, et al. HER2-positive male breast cancer: an update. Breast Cancer (Dove Med Press). 2010;2:45-58. doi:10.2147/BCTT.S6519
12. Risk factors for breast cancer in men. American Cancer Society. Updated April 27, 2018. Accessed December 14, 2022. https://www.cancer.org/cancer/breast-cancer-in-men/causes-risks-prevention/risk-factors.html
13. Palli D, Masala G, Mariani-Constantini R, et al. A gene–environment interaction between occupation and BRCA1/BRCA2 mutations in male breast cancer? Eur J Cancer. 2004;40(16):2472-2479. doi:10.1016/j.ejca.2004.07.012
14. Hansen J. Elevated risk for male breast cancer after occupational exposure to gasoline and vehicular combustion products. Am J Ind Med. 2000;37(4):349-352. doi:10.1002/(sici)1097-0274(200004)37:4<349::aid-ajim4>3.0.co;2-l
15. Sung H, DeSantis C, Jemal A. Subtype-specific breast cancer incidence rates in Black versus White men in the United States. JNCI Cancer Spectr. 2020;4(1):pkz091. doi:10.1093/jncics/pkz091
16. Breast cancer, male: statistics. Cancer.net. January 2022. Accessed December 14, 2022. https://www.cancer.net/cancer-types/breast-cancer-male/statistics

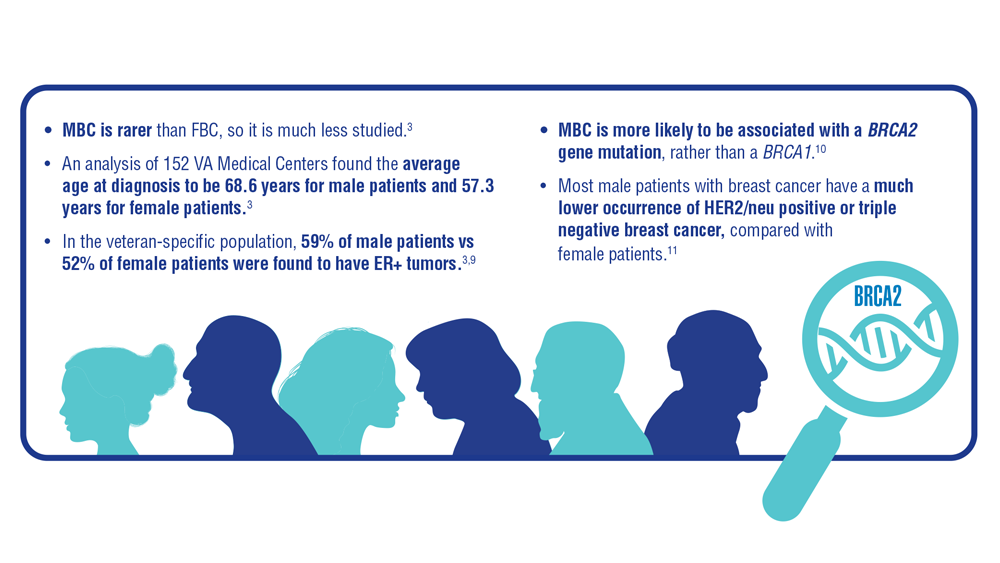
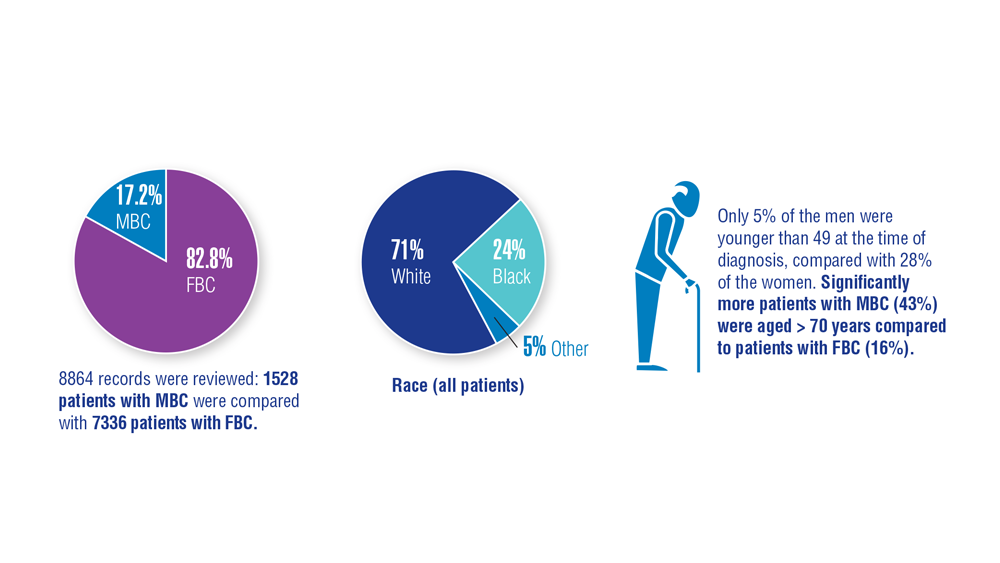
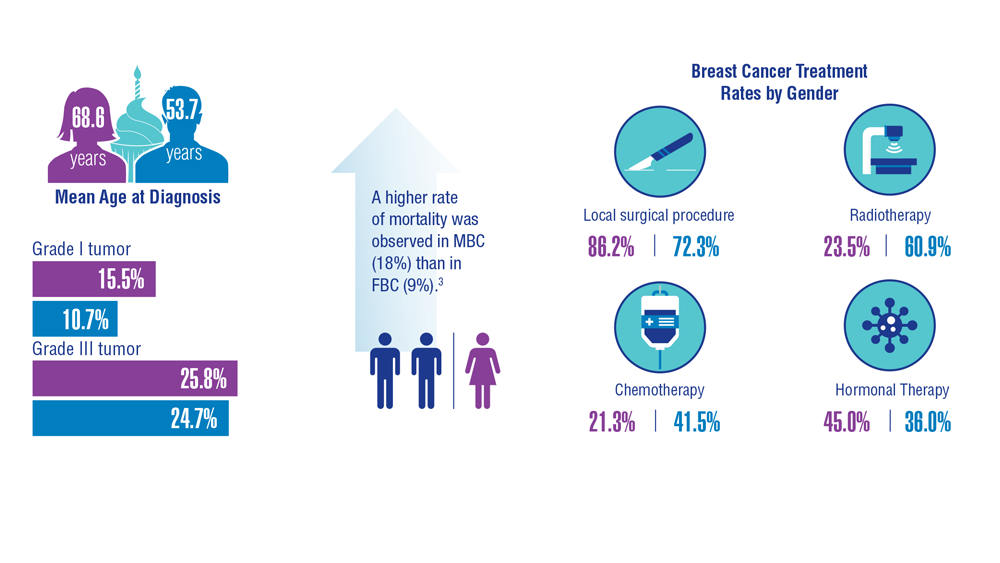
Innovation in Cancer Treatment
- US Department of Veterans Affairs. National Precision Oncology Program (NPOP). June 10, 2019. Accessed December 8, 2022. https://www.cancer.va.gov/CANCER/NPOP.asp
- US Department of Veterans Affairs, Office of Research and Development. VA National Precision Oncology Program brings tailored cancer treatment to veterans. October 3, 2019. Accessed December 8, 2022. https://www.research.va.gov/currents/1019-VA-National-Precision-Oncology-Program-brings-tailored-cancer-treatment-to-Veterans.cfm
- Kelley M, Ahmed S. National Precision Oncology Program (NPOP): right treatment for the right patient at the right time. 2022. Unpublished data.
- Vashistha V et al. PLoS One. 2020;15(7):e0235861. doi:10.1371/journal.pone.0235861
- Dong OM et al. Value Health. 2022;25(4):582-594. doi:10.1016/j.jval.2021.09.017
- Sadik H et al. JCO Precis Oncol. 2022;6:e2200246. doi:10.1200/PO.22.00246
- Petrillo LA et al. J Pain Symptom Manage. 2021;62(3):e65-e74. doi:10.1016/j.jpainsymman.2021.02.010
- Waks AG, Winer EP. JAMA. 2019;321(3):288-300. doi:10.1001/jama.2018.19323
- Mellinghoff IK et al. Clin Cancer Res. 2021;27(16):4491-4499. doi:10.1158/1078-0432.CCR-21-0611
- Debela DT et al. SAGE Open Med. 2021;9:20503121211034366. doi:10.1177/20503121211034366
- Gambardella V et al. Cancers (Basel). 2020;12(4):1009. doi:10.3390/cancers12041009
- US Department of Veterans Affairs, Office of Research and Development. VA Lung Precision Oncology Program (LPOP). Updated January 27, 2022. Accessed January 23, 2023. https://www.research.va.gov/programs/pop/lpop.cfm
- Montgomery B et al. Fed Pract. 2020;37(suppl 4):S48-S53. doi:10.12788/fp.0021
- Kelley MJ. Fed Pract. 2020;37(suppl 4):S22-S27. doi:10.12788/fp.0037
- Poonnen PJ et al. JCO Precis Oncol. 2019;3:PO.19.00075. doi:10.1200/PO.19.00075
- Natera awarded national MRD testing contract by the U.S. Department of Veterans Affairs [press release]. Natera. November 2, 2022. Accessed January 23, 2023. https://www.natera.com/company/news/natera-awarded-national-mrd-testing-contract-by-the-u-s-department-of-veterans-affairs/
- Katsoulakis E et al. JCO Precis Oncol. 2020;4:PO.19.00118. doi:10.1200/PO.19.00118
- Skoulidis F et al. N Engl J Med. 2021;384(25):2371-2381. doi:10.1056/NEJMoa2103695
- To KKW et al. Front Oncol. 2021;11:635007. doi:10.3389/fonc.2021.635007
- Price MJ et al. JCO Precis Oncol. 2022;6(1):e2100461. doi:10.1200/PO.21.00461
- André T et al; KEYNOTE-177 Investigators. N Engl J Med. 2020;383(23):2207-2218. doi:10.1056/NEJMoa2017699
- Stivala S, Meyer SC. Cancers (Basel). 2021;13(20):5035. doi:10.3390/cancers13205035
- Konteatis Z et al. ACS Med Chem Lett. 2020;11(2):101-107. doi:10.1021/acsmedchemlett.9b00509
- OncoKB™ - MSK's precision oncology knowledge base. OncoKB. Accessed December 22, 2022. https://www.oncokb.org/actionableGenes
- National Library of Medicine, National Center for Biotechnology Information. PubChem compound database. Accessed December 22, 2022. https://pubchem.ncbi.nlm.nih.gov/
- US Department of Veterans Affairs. National Precision Oncology Program (NPOP). June 10, 2019. Accessed December 8, 2022. https://www.cancer.va.gov/CANCER/NPOP.asp
- US Department of Veterans Affairs, Office of Research and Development. VA National Precision Oncology Program brings tailored cancer treatment to veterans. October 3, 2019. Accessed December 8, 2022. https://www.research.va.gov/currents/1019-VA-National-Precision-Oncology-Program-brings-tailored-cancer-treatment-to-Veterans.cfm
- Kelley M, Ahmed S. National Precision Oncology Program (NPOP): right treatment for the right patient at the right time. 2022. Unpublished data.
- Vashistha V et al. PLoS One. 2020;15(7):e0235861. doi:10.1371/journal.pone.0235861
- Dong OM et al. Value Health. 2022;25(4):582-594. doi:10.1016/j.jval.2021.09.017
- Sadik H et al. JCO Precis Oncol. 2022;6:e2200246. doi:10.1200/PO.22.00246
- Petrillo LA et al. J Pain Symptom Manage. 2021;62(3):e65-e74. doi:10.1016/j.jpainsymman.2021.02.010
- Waks AG, Winer EP. JAMA. 2019;321(3):288-300. doi:10.1001/jama.2018.19323
- Mellinghoff IK et al. Clin Cancer Res. 2021;27(16):4491-4499. doi:10.1158/1078-0432.CCR-21-0611
- Debela DT et al. SAGE Open Med. 2021;9:20503121211034366. doi:10.1177/20503121211034366
- Gambardella V et al. Cancers (Basel). 2020;12(4):1009. doi:10.3390/cancers12041009
- US Department of Veterans Affairs, Office of Research and Development. VA Lung Precision Oncology Program (LPOP). Updated January 27, 2022. Accessed January 23, 2023. https://www.research.va.gov/programs/pop/lpop.cfm
- Montgomery B et al. Fed Pract. 2020;37(suppl 4):S48-S53. doi:10.12788/fp.0021
- Kelley MJ. Fed Pract. 2020;37(suppl 4):S22-S27. doi:10.12788/fp.0037
- Poonnen PJ et al. JCO Precis Oncol. 2019;3:PO.19.00075. doi:10.1200/PO.19.00075
- Natera awarded national MRD testing contract by the U.S. Department of Veterans Affairs [press release]. Natera. November 2, 2022. Accessed January 23, 2023. https://www.natera.com/company/news/natera-awarded-national-mrd-testing-contract-by-the-u-s-department-of-veterans-affairs/
- Katsoulakis E et al. JCO Precis Oncol. 2020;4:PO.19.00118. doi:10.1200/PO.19.00118
- Skoulidis F et al. N Engl J Med. 2021;384(25):2371-2381. doi:10.1056/NEJMoa2103695
- To KKW et al. Front Oncol. 2021;11:635007. doi:10.3389/fonc.2021.635007
- Price MJ et al. JCO Precis Oncol. 2022;6(1):e2100461. doi:10.1200/PO.21.00461
- André T et al; KEYNOTE-177 Investigators. N Engl J Med. 2020;383(23):2207-2218. doi:10.1056/NEJMoa2017699
- Stivala S, Meyer SC. Cancers (Basel). 2021;13(20):5035. doi:10.3390/cancers13205035
- Konteatis Z et al. ACS Med Chem Lett. 2020;11(2):101-107. doi:10.1021/acsmedchemlett.9b00509
- OncoKB™ - MSK's precision oncology knowledge base. OncoKB. Accessed December 22, 2022. https://www.oncokb.org/actionableGenes
- National Library of Medicine, National Center for Biotechnology Information. PubChem compound database. Accessed December 22, 2022. https://pubchem.ncbi.nlm.nih.gov/
- US Department of Veterans Affairs. National Precision Oncology Program (NPOP). June 10, 2019. Accessed December 8, 2022. https://www.cancer.va.gov/CANCER/NPOP.asp
- US Department of Veterans Affairs, Office of Research and Development. VA National Precision Oncology Program brings tailored cancer treatment to veterans. October 3, 2019. Accessed December 8, 2022. https://www.research.va.gov/currents/1019-VA-National-Precision-Oncology-Program-brings-tailored-cancer-treatment-to-Veterans.cfm
- Kelley M, Ahmed S. National Precision Oncology Program (NPOP): right treatment for the right patient at the right time. 2022. Unpublished data.
- Vashistha V et al. PLoS One. 2020;15(7):e0235861. doi:10.1371/journal.pone.0235861
- Dong OM et al. Value Health. 2022;25(4):582-594. doi:10.1016/j.jval.2021.09.017
- Sadik H et al. JCO Precis Oncol. 2022;6:e2200246. doi:10.1200/PO.22.00246
- Petrillo LA et al. J Pain Symptom Manage. 2021;62(3):e65-e74. doi:10.1016/j.jpainsymman.2021.02.010
- Waks AG, Winer EP. JAMA. 2019;321(3):288-300. doi:10.1001/jama.2018.19323
- Mellinghoff IK et al. Clin Cancer Res. 2021;27(16):4491-4499. doi:10.1158/1078-0432.CCR-21-0611
- Debela DT et al. SAGE Open Med. 2021;9:20503121211034366. doi:10.1177/20503121211034366
- Gambardella V et al. Cancers (Basel). 2020;12(4):1009. doi:10.3390/cancers12041009
- US Department of Veterans Affairs, Office of Research and Development. VA Lung Precision Oncology Program (LPOP). Updated January 27, 2022. Accessed January 23, 2023. https://www.research.va.gov/programs/pop/lpop.cfm
- Montgomery B et al. Fed Pract. 2020;37(suppl 4):S48-S53. doi:10.12788/fp.0021
- Kelley MJ. Fed Pract. 2020;37(suppl 4):S22-S27. doi:10.12788/fp.0037
- Poonnen PJ et al. JCO Precis Oncol. 2019;3:PO.19.00075. doi:10.1200/PO.19.00075
- Natera awarded national MRD testing contract by the U.S. Department of Veterans Affairs [press release]. Natera. November 2, 2022. Accessed January 23, 2023. https://www.natera.com/company/news/natera-awarded-national-mrd-testing-contract-by-the-u-s-department-of-veterans-affairs/
- Katsoulakis E et al. JCO Precis Oncol. 2020;4:PO.19.00118. doi:10.1200/PO.19.00118
- Skoulidis F et al. N Engl J Med. 2021;384(25):2371-2381. doi:10.1056/NEJMoa2103695
- To KKW et al. Front Oncol. 2021;11:635007. doi:10.3389/fonc.2021.635007
- Price MJ et al. JCO Precis Oncol. 2022;6(1):e2100461. doi:10.1200/PO.21.00461
- André T et al; KEYNOTE-177 Investigators. N Engl J Med. 2020;383(23):2207-2218. doi:10.1056/NEJMoa2017699
- Stivala S, Meyer SC. Cancers (Basel). 2021;13(20):5035. doi:10.3390/cancers13205035
- Konteatis Z et al. ACS Med Chem Lett. 2020;11(2):101-107. doi:10.1021/acsmedchemlett.9b00509
- OncoKB™ - MSK's precision oncology knowledge base. OncoKB. Accessed December 22, 2022. https://www.oncokb.org/actionableGenes
- National Library of Medicine, National Center for Biotechnology Information. PubChem compound database. Accessed December 22, 2022. https://pubchem.ncbi.nlm.nih.gov/


Screening Guideline Updates and New Treatments in Colon Cancer
- Ng K et al. JAMA. 2021;325(19):1943-1945. doi:10.1001/jama.2021.4133
- Xie YH et al. Signal Transduct Target Ther. 2020;5(1):22. doi:10.1038/s41392-020-0116-z
- Muller C et al. Cells. 2021;10(5):1018. doi:10.3390/cells10051018
- Clebak KT et al. Am Fam Physician. 2022;105(2):198-200.
- May FP et al. Dig Dis Sci. 2017;62(8):1923-1932. doi:10.1007/s10620-017-4607-x
- May FP et al. Med Care. 2019;57(10):773-780. doi:10.1097/MLR.0000000000001186
- US Department of Veterans Affairs, National Oncology Program Office. National Precision Oncology Program (NPOP). Updated June 24, 2022. Accessed December 14, 2022. http://www.cancer.va.gov/CANCER/NPOP.asp
- André T et al; KEYNOTE-177 Investigators. N Engl J Med. 2020;383(23):2207-2218. doi:10.1056/NEJMoa2017699
- Naidoo M et al. Cancers (Basel). 2021;13(2):346. doi:10.3390/cancers13020346
- Kasi PM et al. BMJ Open. 2021;11(9):e047831. doi:10.1136/bmjopen-2020-047831
- Jin S et al. Proc Natl Acad Sci U S A. 2021;118(5):e2017421118. doi:10.1073/pnas.2017421118
- Ng K et al. JAMA. 2021;325(19):1943-1945. doi:10.1001/jama.2021.4133
- Xie YH et al. Signal Transduct Target Ther. 2020;5(1):22. doi:10.1038/s41392-020-0116-z
- Muller C et al. Cells. 2021;10(5):1018. doi:10.3390/cells10051018
- Clebak KT et al. Am Fam Physician. 2022;105(2):198-200.
- May FP et al. Dig Dis Sci. 2017;62(8):1923-1932. doi:10.1007/s10620-017-4607-x
- May FP et al. Med Care. 2019;57(10):773-780. doi:10.1097/MLR.0000000000001186
- US Department of Veterans Affairs, National Oncology Program Office. National Precision Oncology Program (NPOP). Updated June 24, 2022. Accessed December 14, 2022. http://www.cancer.va.gov/CANCER/NPOP.asp
- André T et al; KEYNOTE-177 Investigators. N Engl J Med. 2020;383(23):2207-2218. doi:10.1056/NEJMoa2017699
- Naidoo M et al. Cancers (Basel). 2021;13(2):346. doi:10.3390/cancers13020346
- Kasi PM et al. BMJ Open. 2021;11(9):e047831. doi:10.1136/bmjopen-2020-047831
- Jin S et al. Proc Natl Acad Sci U S A. 2021;118(5):e2017421118. doi:10.1073/pnas.2017421118
- Ng K et al. JAMA. 2021;325(19):1943-1945. doi:10.1001/jama.2021.4133
- Xie YH et al. Signal Transduct Target Ther. 2020;5(1):22. doi:10.1038/s41392-020-0116-z
- Muller C et al. Cells. 2021;10(5):1018. doi:10.3390/cells10051018
- Clebak KT et al. Am Fam Physician. 2022;105(2):198-200.
- May FP et al. Dig Dis Sci. 2017;62(8):1923-1932. doi:10.1007/s10620-017-4607-x
- May FP et al. Med Care. 2019;57(10):773-780. doi:10.1097/MLR.0000000000001186
- US Department of Veterans Affairs, National Oncology Program Office. National Precision Oncology Program (NPOP). Updated June 24, 2022. Accessed December 14, 2022. http://www.cancer.va.gov/CANCER/NPOP.asp
- André T et al; KEYNOTE-177 Investigators. N Engl J Med. 2020;383(23):2207-2218. doi:10.1056/NEJMoa2017699
- Naidoo M et al. Cancers (Basel). 2021;13(2):346. doi:10.3390/cancers13020346
- Kasi PM et al. BMJ Open. 2021;11(9):e047831. doi:10.1136/bmjopen-2020-047831
- Jin S et al. Proc Natl Acad Sci U S A. 2021;118(5):e2017421118. doi:10.1073/pnas.2017421118
Cancer Data Trends 2023
Federal Practitioner and the Association of VA Hematology/Oncology (AVAHO) present the 2023 edition of Cancer Data Trends (click to view the digital edition). This special issue provides updates on some of the top cancers and related concerns affecting veterans through original infographics and visual storytelling.

In this issue:
- COVID-19 Outcomes in Veterans With Hematologic Cancers
- Promising New Approaches for Testicular and Prostate Cancer
- Screening Guideline Updates and New Treatments in Colon Cancer
- Exposure-Related Cancers: A Look at the PACT Act
- New Classifications and Emerging Treatments in Brain Cancer
- Gender Disparity in Breast Cancer Among US Veterans
- Lung Cancer Screening in Veterans
- Necessary Updates to Skin Cancer Risk Stratification
- Innovation in Cancer Treatment
Federal Practitioner and the Association of VA Hematology/Oncology (AVAHO) present the 2023 edition of Cancer Data Trends (click to view the digital edition). This special issue provides updates on some of the top cancers and related concerns affecting veterans through original infographics and visual storytelling.
In this issue:
- COVID-19 Outcomes in Veterans With Hematologic Cancers
- Promising New Approaches for Testicular and Prostate Cancer
- Screening Guideline Updates and New Treatments in Colon Cancer
- Exposure-Related Cancers: A Look at the PACT Act
- New Classifications and Emerging Treatments in Brain Cancer
- Gender Disparity in Breast Cancer Among US Veterans
- Lung Cancer Screening in Veterans
- Necessary Updates to Skin Cancer Risk Stratification
- Innovation in Cancer Treatment
Federal Practitioner and the Association of VA Hematology/Oncology (AVAHO) present the 2023 edition of Cancer Data Trends (click to view the digital edition). This special issue provides updates on some of the top cancers and related concerns affecting veterans through original infographics and visual storytelling.
In this issue:
- COVID-19 Outcomes in Veterans With Hematologic Cancers
- Promising New Approaches for Testicular and Prostate Cancer
- Screening Guideline Updates and New Treatments in Colon Cancer
- Exposure-Related Cancers: A Look at the PACT Act
- New Classifications and Emerging Treatments in Brain Cancer
- Gender Disparity in Breast Cancer Among US Veterans
- Lung Cancer Screening in Veterans
- Necessary Updates to Skin Cancer Risk Stratification
- Innovation in Cancer Treatment

Promising New Approaches for Testicular and Prostate Cancer
- Risk factors for testicular cancer. American Cancer Society. Updated May 17, 2018. Accessed December 15, 2022. https://www.cancer.org/cancer/testicular-cancer/causes-risks-prevention/risk-factors.html
- Chovanec M, Cheng L. BMJ. 2022;379:e070499. doi:10.1136/bmj-2022-070499
- Tavares NT et al. J Pathol. 2022. doi:10.1002/path.6037
- Bryant AK et al. JAMA Oncol. 2022;e224319. doi:10.1001/jamaoncol.2022.4319
- Kabasakal L et al. Nucl Med Commun. 2017;38(2):149-155. doi:10.1097/MNM.0000000000000617
- Sartor O et al; VISION Investigators. N Engl J Med. 2021;385(12):1091-1103. doi:10.1056/NEJMoa2107322
- Rowe SP et al. Annu Rev Med. 2019;70:461-477. doi:10.1146/annurev-med-062117-073027
- Pomykala KL et al. Eur Urol Oncol. 2022;S2588-9311(22)00177-8. doi:10.1016/j.euo.2022.10.007
- Keam SJ. Mol Diagn Ther. 2022;26(4):467-475. doi:10.1007/s40291-022-00594-2
- Lovejoy LA et al. Mil Med. 2022:usac297. doi:10.1093/milmed/usac297
- Smith ZL et al. Med Clin North Am. 2018;102(2):251-264. doi:10.1016/j.mcna.2017.10.003
- Hohnloser JH et al. Eur J Med Res.1996;1(11):509-514.
- Johns Hopkins Medicine website. Testicular Cancer tumor Markers. Accessed December 2022. https://www.hopkinsmedicine.org/health/conditions-and-diseases/testicular-cancer/testicular-cancer-tumor-markers
- Webber BJ et al. J Occup Environ Med. 2022;64(1):71-78. doi:10.1097/JOM.0000000000002353
- Risk factors for testicular cancer. American Cancer Society. Updated May 17, 2018. Accessed December 15, 2022. https://www.cancer.org/cancer/testicular-cancer/causes-risks-prevention/risk-factors.html
- Chovanec M, Cheng L. BMJ. 2022;379:e070499. doi:10.1136/bmj-2022-070499
- Tavares NT et al. J Pathol. 2022. doi:10.1002/path.6037
- Bryant AK et al. JAMA Oncol. 2022;e224319. doi:10.1001/jamaoncol.2022.4319
- Kabasakal L et al. Nucl Med Commun. 2017;38(2):149-155. doi:10.1097/MNM.0000000000000617
- Sartor O et al; VISION Investigators. N Engl J Med. 2021;385(12):1091-1103. doi:10.1056/NEJMoa2107322
- Rowe SP et al. Annu Rev Med. 2019;70:461-477. doi:10.1146/annurev-med-062117-073027
- Pomykala KL et al. Eur Urol Oncol. 2022;S2588-9311(22)00177-8. doi:10.1016/j.euo.2022.10.007
- Keam SJ. Mol Diagn Ther. 2022;26(4):467-475. doi:10.1007/s40291-022-00594-2
- Lovejoy LA et al. Mil Med. 2022:usac297. doi:10.1093/milmed/usac297
- Smith ZL et al. Med Clin North Am. 2018;102(2):251-264. doi:10.1016/j.mcna.2017.10.003
- Hohnloser JH et al. Eur J Med Res.1996;1(11):509-514.
- Johns Hopkins Medicine website. Testicular Cancer tumor Markers. Accessed December 2022. https://www.hopkinsmedicine.org/health/conditions-and-diseases/testicular-cancer/testicular-cancer-tumor-markers
- Webber BJ et al. J Occup Environ Med. 2022;64(1):71-78. doi:10.1097/JOM.0000000000002353
- Risk factors for testicular cancer. American Cancer Society. Updated May 17, 2018. Accessed December 15, 2022. https://www.cancer.org/cancer/testicular-cancer/causes-risks-prevention/risk-factors.html
- Chovanec M, Cheng L. BMJ. 2022;379:e070499. doi:10.1136/bmj-2022-070499
- Tavares NT et al. J Pathol. 2022. doi:10.1002/path.6037
- Bryant AK et al. JAMA Oncol. 2022;e224319. doi:10.1001/jamaoncol.2022.4319
- Kabasakal L et al. Nucl Med Commun. 2017;38(2):149-155. doi:10.1097/MNM.0000000000000617
- Sartor O et al; VISION Investigators. N Engl J Med. 2021;385(12):1091-1103. doi:10.1056/NEJMoa2107322
- Rowe SP et al. Annu Rev Med. 2019;70:461-477. doi:10.1146/annurev-med-062117-073027
- Pomykala KL et al. Eur Urol Oncol. 2022;S2588-9311(22)00177-8. doi:10.1016/j.euo.2022.10.007
- Keam SJ. Mol Diagn Ther. 2022;26(4):467-475. doi:10.1007/s40291-022-00594-2
- Lovejoy LA et al. Mil Med. 2022:usac297. doi:10.1093/milmed/usac297
- Smith ZL et al. Med Clin North Am. 2018;102(2):251-264. doi:10.1016/j.mcna.2017.10.003
- Hohnloser JH et al. Eur J Med Res.1996;1(11):509-514.
- Johns Hopkins Medicine website. Testicular Cancer tumor Markers. Accessed December 2022. https://www.hopkinsmedicine.org/health/conditions-and-diseases/testicular-cancer/testicular-cancer-tumor-markers
- Webber BJ et al. J Occup Environ Med. 2022;64(1):71-78. doi:10.1097/JOM.0000000000002353