User login
Impact of Diagnostic Testing on Pediatric Patients With Pharyngitis: Evidence From a Large Health Plan
From the Department of Pharmaceutical and Health Economics, University of Southern California, Los Angeles, CA, (Drs. Sangha and McCombs), Department of Pediatrics, Keck School of Medicine, and Department of Clinical Pharmacy, School of Pharmacy, University of Southern California, Los Angeles, CA, (Dr. Steinberg), and Leonard Schaeffer Center for Health Policy and Economics, University of Southern California, Los Angeles, CA (Dr. McCombs).
Objective: The recommended treatment for children and adolescents under 18 years of age who have a positive test for group A Streptococcus (GAS) are antibiotics using the “test and treat” strategy to detect and treat GAS for pediatric pharyngitis. This study used paid claims data to document the extent to which real-world treatment patterns are consistent with these recommendations. We document the factors correlated with testing and treatment, then examine the effects of receiving a GAS test and being treated with an antibiotic impact the likelihood of a revisit for an acute respiratory tract infection within 28 days.
Methods: This retrospective cohort study used Optum Insight Clinformatics data for medical and pharmacy claims from 2011-2013 to identify episodes of care for children and adolescents with pharyngitis around their index visit (± 6 months). The sample population included children and adolescents under 18 years of age with a diagnosis of pharyngitis. Multivariable logistic regression analyses were used to document factors associated with receipt of GAS test and antibiotic treatment. Next, we used logistic regression models to estimate the impact of test and treat recommendation on revisit risk.
Results: There were 24 685 treatment episodes for children and adolescents diagnosed with pharyngitis. Nearly 47% of these episodes included a GAS test and 48% of tested patients were prescribed an antibiotic prescription. Failing to perform a GAS test increased the risk of a revisit within 28 days by 44%. The use of antibiotics by tested and untested patients had no impact on revisit risk.
Conclusion: While the judicious use of antibiotics is important in managing pharyngitis infections and managing complications, the use of rapid diagnostic tools was found to be the determining factor in reducing revisits for pediatric patients with pharyngitis.
Keywords: pediatrics; pharyngitis; respiratory infections; acute infections; diagnostic tests; group A Streptococcus; antibiotics; revisits.
Acute pharyngitis is a common acute respiratory tract infection (ARTI) in children. Group A β-hemolytic streptococci (GABHS) is the most common bacterial etiology for pediatric pharyngitis, accounting for 15% to 30% of cases.1
Beyond clinical assessment, laboratory diagnostic testing generally plays a limited role in guiding appropriate antibiotic prescribing for patients with an ARTI.2,3 Most diagnostic tests require 2 or 3 days to result, incur additional costs, and may delay treatment.4 While these tests do not provide clear and timely guidance on which specific antibiotic is appropriate for ARTI patients, this is not the case for patients with pharyngitis.5,6,7 A rapid diagnostic test exists to identify pharyngitis patients with GABHS which accounts for 1 in 4 children with acute sore throat.1,4,6 Both the American Academy of Pediatrics and the Infectious Diseases Society of America recommend antibiotic treatment for children and adolescents under 18 years of age who have a positive test for group A Streptococcus (GAS).8,9 This “test and treat” protocol has been consistently included in the Healthcare Effectiveness Data and Information Set (HEDIS) standards over time for pediatric pharyngitis patients aged 3 to 18 years before dispensing an antibiotic.10
Sinusitis, pneumonia, and acute otitis media are considered ARTIs where antibiotic treatment is justified. Therefore, pharyngitis of unclear etiology seen with these comorbid infections may not always undergo GAS testing but move directly to the patient being prescribed antibiotics. This analysis enumerates ARTI-related comorbidities present together with the initial coded pharyngitis diagnosis to evaluate their impact on the provider’s decision to test and treat, and on revisit risk.
Antibiotic treatment for GAS patients is likely to eradicate the acute GABHS infection within 10 days. Penicillin and amoxicillin are commonly recommended because of their narrow spectrum of activity, few adverse effects, established efficacy, and modest cost. Alternative antibiotics for patients with penicillin allergy, or with polymicrobial infection seen on culture results, include a first-generation cephalosporin, clindamycin, clarithromycin (Biaxin), or azithromycin (Zithromax).1,8,11 However, while compliance with these HEDIS guidelines has been evaluated, the outcome effects of following the HEDIS “test and treat” recommendations for children with pharyngitis have not been adequately evaluated.
These outcome evaluations have increasing importance as the latest HEDIS survey has shown testing rates in commercial Preferred Provider Organizations (PPO) falling from 86.4% in 2018 to 75.9% in 2019, the lowest rate of testing since 2009, with similar reductions under 80% for Health Maintenance Organizations (HMO).10 While health plans may execute cost-benefit analyses and algorithms to forge best practices for GAS testing in children and adolescents presenting with symptoms of pharyngitis, it is important to regard the wasteful resource utilization and additional cost of revisits that may offset any gains accrued by more focused GAS testing outside the existing clinical guidelines and HEDIS measures. This may be of particular importance in documenting infection and sparing antibiotic therapy in toddlers and younger.
The objective of this study was to investigate the correlation between testing and antibiotic use on the likelihood of a revisit for an acute respiratory tract infection within 28 days. To achieve this objective, this investigation consists of 3 sequential analyses. First, we document the factors associated with the decision to test the patient for a GABHS infection using the GAS test. Next, we document the factors associated with the decision to use an antibiotic to treat the patient as a function of having tested the patient. Finally, we investigate the impact of the testing and treatment decisions on the likelihood of a revisit within 28 days.
Methods
Study design
This was a retrospective cohort study of episodes of treatment for pediatric patients with pharyngitis. Episodes were identified using data derived from the Optum Insight Clinformatics claims database provided to the University of Southern California to facilitate the training of graduate students. These data cover commercially insured patients with both medical and pharmacy benefits. Data were retrieved from the 3-year period spanning 2011-2013. An episode of care was identified based on date of the first (index) outpatient visit for a pharyngitis diagnosis (International Classification of Diseases, Ninth Revision [ICD-9]: 462, 463, 034.0). Outpatient visits were defined by visit setting: ambulatory clinics, physician offices, emergency rooms, and urgent care facilities. Each pharyngitis treatment episode was then screened for at least a 6-month enrollment in a health insurance plan prior and subsequent to the index visit using Optum enrollment data. Finally, eligible treatment episodes were restricted to children and adolescents under 18 years of age, who had an index outpatient visit for a primary diagnosis of acute pharyngitis.
A diagnostic profile was created for each episode using the diagnoses recorded for the index visit. Up to 3 diagnoses may be recorded for any outpatient visit and the first recorded diagnosis was assumed to be the primary diagnosis for that episode. Any secondary diagnoses recorded on the index visit were used to define comorbidities present at the index visit. ARTI-related comorbidities included: acute otitis media (AOM), bronchitis, sinusitis, pneumonia, and upper respiratory infection (URI). Other comorbid medical diagnoses were documented using diagnostic data from the pre-index period. Dichotomous variables for the following categories were created: mental disorders, nervous system disorders, respiratory symptoms, fever, injury and poisoning, other, or no diseases.
Prior visits for other respiratory infections in the previous 90 days were also identified for patients based on their index visit for pharyngitis. Similarly, any subsequent visits, within 28 days of the index visit, were also recorded to measure the health outcome for analysis. Practice settings include physician offices and federally qualified health centers, state and local health clinics, outpatient hospitals facilities, emergency departments, and other outpatient settings such as walk-in retail health clinic or ambulatory centers. Providers include primary care physicians (family practice, pediatricians, internal medicine), specialty care physicians (emergency medicine, preventive medicine), nonphysician providers (nurse practitioners, physician assistants) and other providers (urgent care, acute outpatient care, ambulatory care centers). Seasons of the year were determined based on the index date of the episode to account for possible seasonality in pharyngitis treatment. Lastly, a previous visits variable was created to identify whether the child had nonpharyngitis ARTI visits in the 3 months prior to the index visit.
Demographic variables were created based on enrollment and the socioeconomic data available in the Optum socioeconomic status file. These variables include patient age, race, sex, household income, geographic location, practice setting type, provider specialty, and type of insurance. An estimate of patient household income was based on algorithms using census block groups. Income categories were informed by the federal guidelines for a family of 4. A low-income family was defined as earning less than $50 000; a middle-income family earned between $50 000 and $75 000, and a high-income family earned $75 000 and above.12 Patient insurance type was categorized as HMO, Exclusive Provider Organization (EPO), Point of Service (POS), and PPO. Race was identified as White, Black, Hispanic, and Asian. Patient location was defined according to national census regions.
Outcomes
GAS test
The HEDIS measures for pharyngitis recommend using the GAS test to identify the bacterial etiology of the pharyngitis infection. Patients who received the test were identified based on Current Procedural Terminology (CPT) codes 87070-71, 87081, 87430, 87650-52, and 87880.10
Antibiotic treatment
The pharmacy administrative claims dataset was used to identify study patients who filled a prescription for an antibiotic during their pharyngitis treatment episode. Optum pharmacy data identify the medications received, specifies the date of prescription filling, National Drug Codes, and American Hospital Formulary Service (AHFS) Classification System codes for each medication. We used the AHFS Pharmacologic-Therapeutic classification of antibiotics to create dichotomous variables documenting the antibacterial used by each patient.13 These are categorized under antibacterial including penicillins, cephalosporins (first, second, third, fourth generation cephalosporins), macrolides (first generation and others), tetracyclines, sulfonamides, fluoroquinolones (ciprofloxacin, levofloxacin, moxifloxacin), cephamycin, carbapenems, and β-lactam antibiotics (amoxicillin, amoxicillin/clavulanate, cephalexin, cefuroxime, cefdinir).
Revisits to physician or other provider
Revisits within 28 days were used as the measure of patient outcomes related to testing and filling of an antibiotic prescription for acute pharyngitis. Revisits may also be due to a patient returning for a follow-up, alternative treatment, worsening pharyngitis, or for another ARTI. An ARTI-related revisit also increases total resources used to treat pediatric pharyngitis patients.
Statistical analysis
Logistic regression was used for all 3 analyses conducted in this study. First, we determined the patient and treating physician characteristics that impact the decision to use GAS testing for pharyngitis. Second, we identified those factors that impact the decision to use antibiotic prescriptions among children who were diagnosed with pharyngitis adding in the dichotomous variable indicating if the patient had received a GAS test. Third, we used a logit regression analysis to document if receiving a GAS test and/or an antibiotic impacted the likelihood of a revisit by comparing revisit risk. To estimate the effect of testing and/or antibiotic use, we divided patients into 4 groups based on whether the patient received a GAS test and/or an antibiotic prescription. This specification of the analysis of revisits as an outcome focuses on adherence to HEDIS “test and treat” guidelines10:
- Patients who were not tested yet filled an antibiotic prescription. This decision was likely based on the clinician’s judgment of the patient’s signs and symptoms, and confirmational testing not performed.
- Patients who were not tested and did not fill an antibiotic prescription. Apparently, in the clinician’s judgment the patient’s signs and symptoms were such that the infection did not warrant treatment and the clinical presentation did not necessitate the GAS test to confirm the recorded diagnosis of pharyngitis.
- Patients who were tested and received antibiotic prescription, likely because the test was positive for GABHS.
- Patients who were tested and did not receive antibiotic prescription.
We tested for statistically significant differences in baseline characteristics across these 4 patient groups using t tests for continuous variables and χ2 tests for categorical variables. Odds ratios (OR) and CI were computed for the influential variables included the regression analyses.
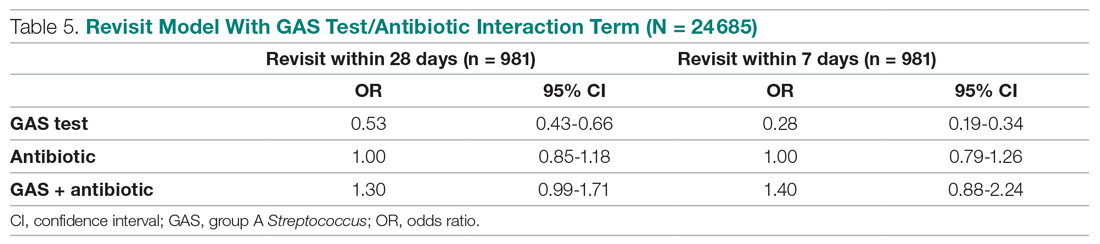
We conducted a sensitivity analysis using a model specification which included the dichotomous variables for testing and for treatment, and the interaction term between these variables to assess if treatment effects varied in tested and untested patients. We also estimated this model of revisit risk using revisits within 7 days as the outcome variable.
All analyses were completed using STATA/IC 13 (StataCorp, College Station, TX).
Results
There were 24 685 treatment episodes for children diagnosed with pharyngitis. Nearly 47% of these episodes included GAS testing and 47% of the tested patients filled an antibiotic prescription. Similarly, 53% of patients were not tested and 49% of untested patients filled an antibiotic prescription. As a result, the 4 groups identified for analysis were evenly distributed: untested and no prescription (26.9%), untested and prescription (26.3%), tested and prescription (21.9%), and tested and no prescription (24.9%) (Figure).
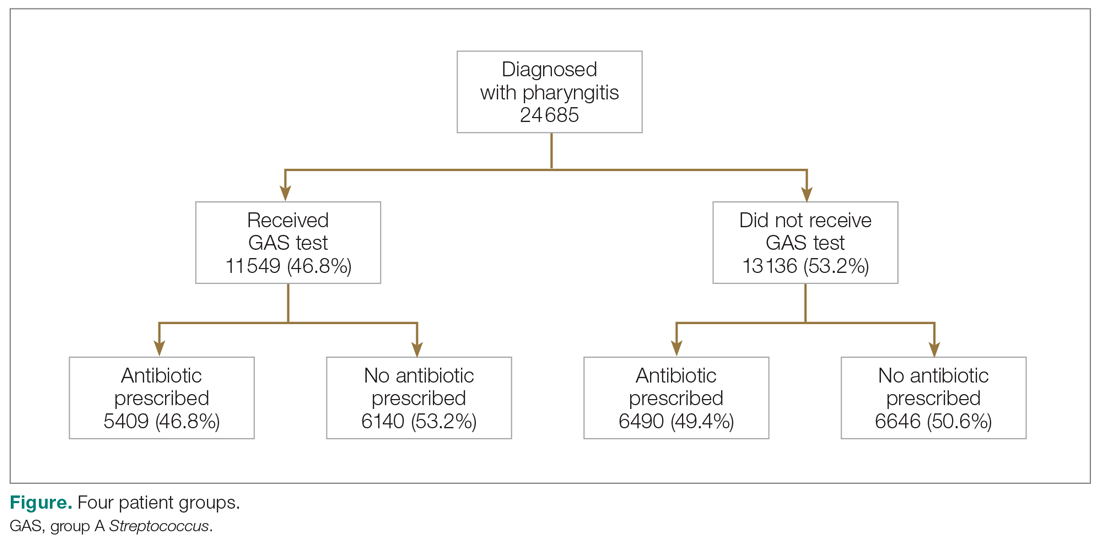
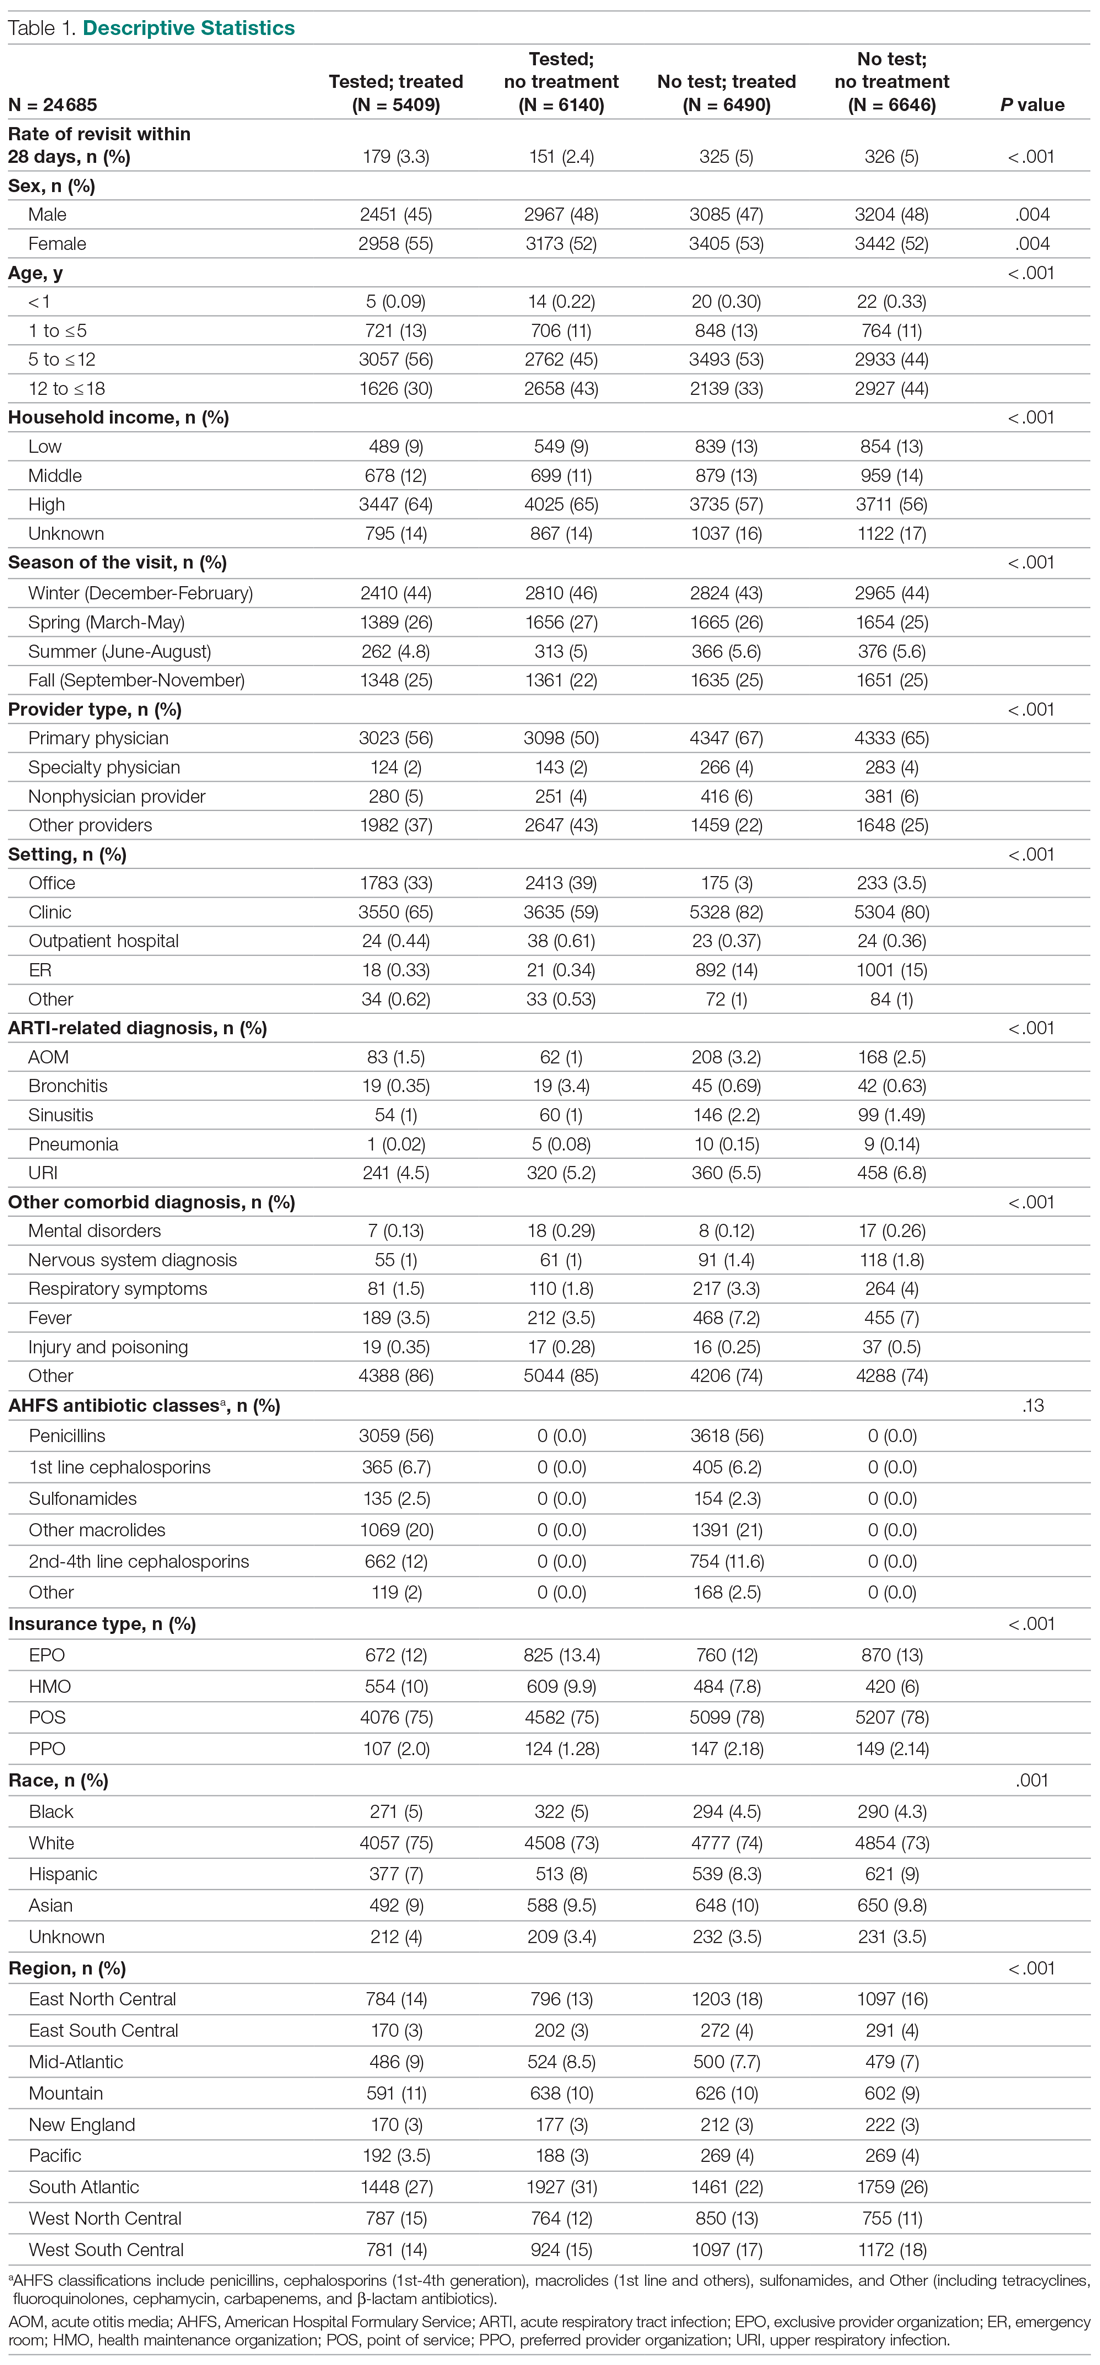
Table 1 presents the descriptive statistics for these 4 patient groups. Note first that the rate of revisits within 28 days is under 5% across all groups. Second, the 2 tested groups have a lower revisit rate than the untested groups: the tested and treated have a revisit rate of 3.3%, and the tested and untreated have a revisit rate of 2.4%, while both the untested groups have a revisit rate of nearly 5%. These small absolute differences in revisit rates across groups were statistically significant.
Factors associated with receiving GAS test
Several factors were found to impact the decision to test (Table 2). Only 9.7% of children were reported to have any ARTI coinfection. As expected, these comorbidities resulted in a significantly lower likelihood of receiving the GAS test: AOM, bronchitis, sinusitis, pneumonia, and URI as comorbid infections had a 48%, 41%, 37%, 63%, and 13% lower likelihood of receiving the GAS test, respectively, than those with no comorbidities. Similarly, children with fever and respiratory symptoms were 35% and 45% less likely to receiving the GAS test, respectively. This is consistent with our expectation that comorbid ARTI infections will lead many providers to forgo testing.
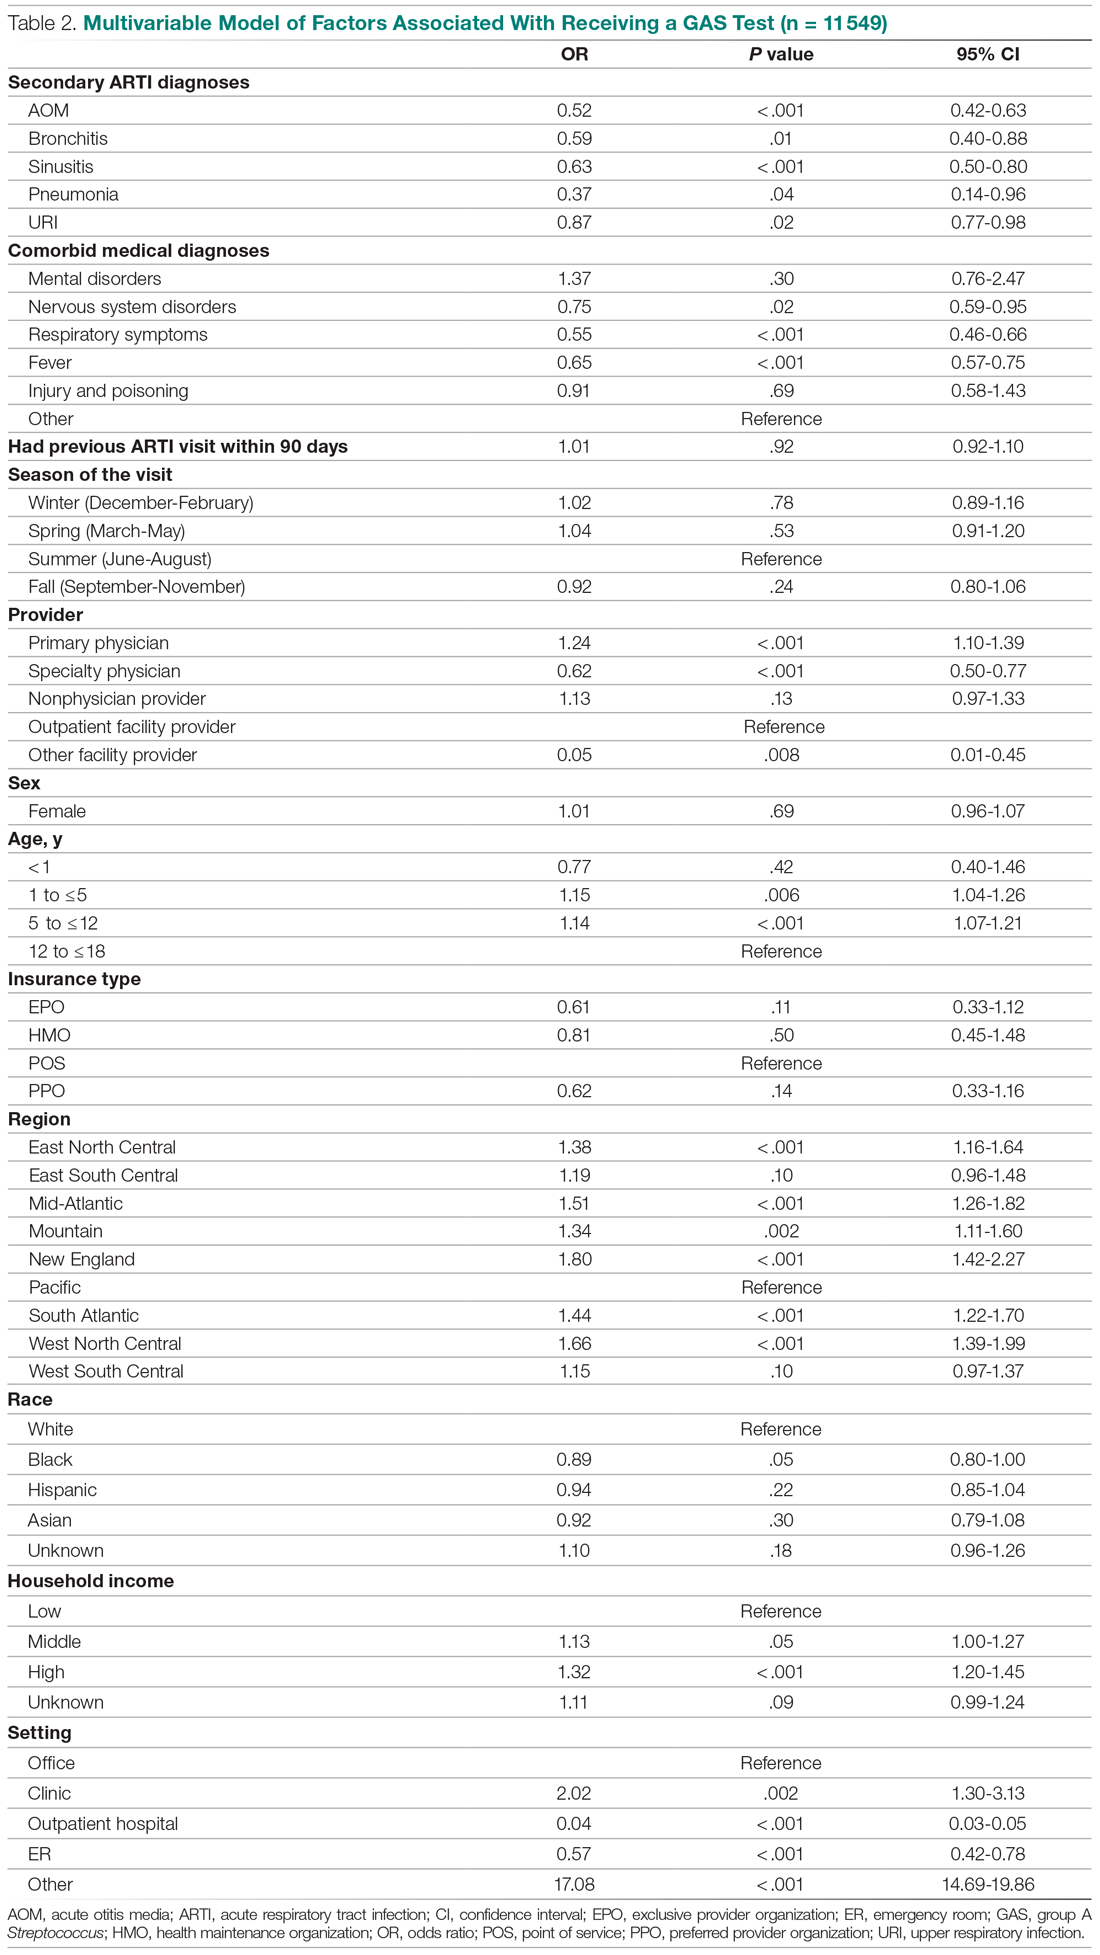
Provider type and patient age also plays a role in receipt of the GAS test. Relative to outpatient facility providers, primary care physicians were 24% more likely and specialty physicians were 38% less likely of employing the GAS test. The child’s age played a significant role in receipt of the GAS test. Children aged 1 to 5 years and 5 to 12 years were 15% and 14% more likely to receive the test compared to children older than 12 years.
Pharyngitis patients have disproportionately higher odds of receiving a GAS test in most regions of the country compared to the Pacific region. For instance, children in the Mid-Atlantic region have 51% higher odds of receiving a GAS test while children in New England have 80% higher odds of receiving the same test.
Black children have 11% lower odds of receiving the GAS test compared to White children. Both middle-income and high-income children have 12% and 32% higher odds of receiving the test compared to low-income children. Compared to office-based visits, children visiting a clinic were twice as likely to receive a GAS test while those seen in the emergency room have 43% lower odds of receiving a GAS test. Hospital outpatient departments, which account for less than 1% of all visits, rarely used a GAS test which could be a statistical artifact due to small sample size. Lastly, insurance and season of the year had no significant impact of receipt of a GAS test.
Factors associated with receiving antibiotic prescription
Surprisingly, receiving the GAS test has a small but insignificant impact on the likelihood that the patient will receive an antibiotic prescription (Table 3) (Adjusted OR = 1.055, P = .07). After controlling for receipt of a GAS test, children with AOM and sinusitis comorbidities have an increased likelihood of being prescribed an antibiotic. Children with URI have a lower likelihood of being prescribed an antibiotic. Additionally, relative to primary care physicians, children visiting nonphysician providers for pharyngitis were more likely to be prescribed an antibiotic.
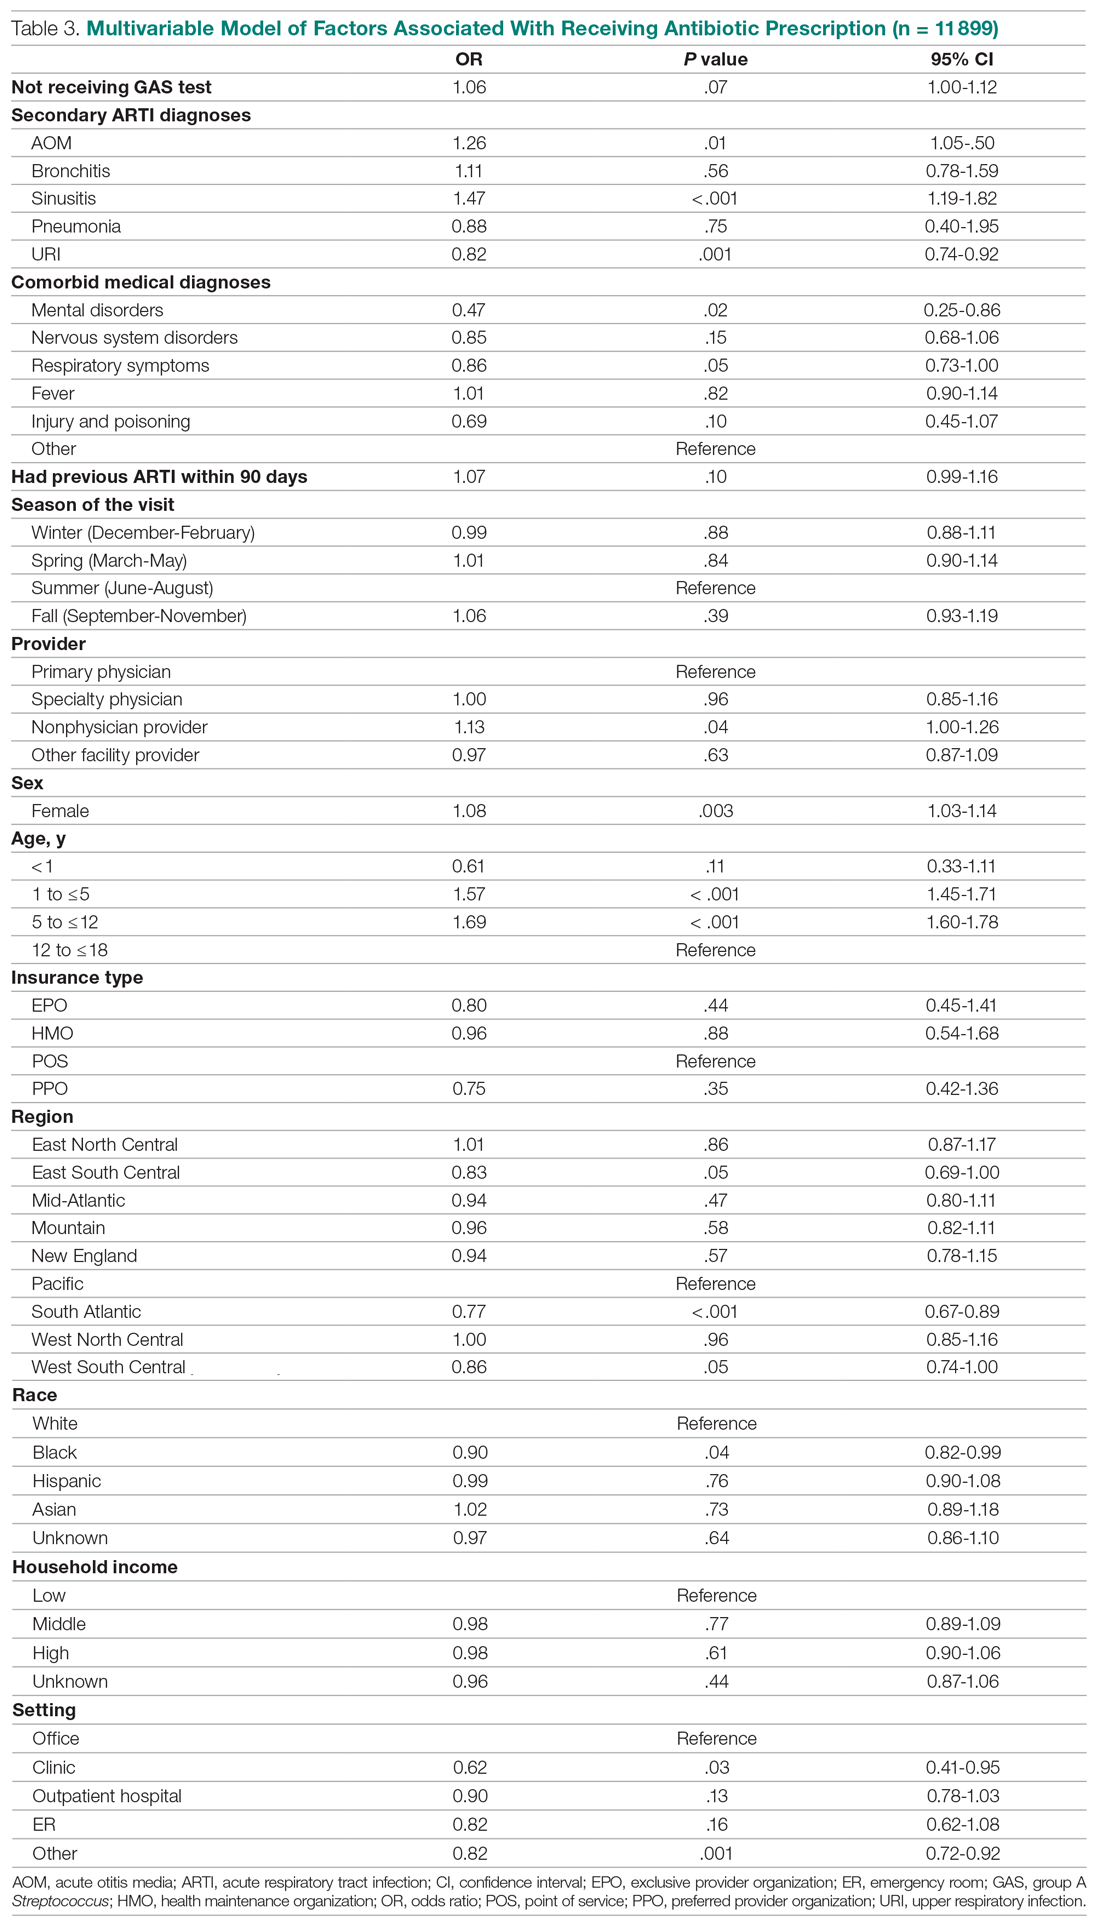
Children under 12 years of age were more likely to use an antibiotic compared to children 12 years and older. Geographically, there is some evidence of regional variation in antibiotic use as well. Children in the south Atlantic, west-south central, and southeast central regions had a significantly lower odds of being prescribed an antibiotic respectively than pharyngitis patients in the Pacific region. Black children had a 10% lower likelihood of being prescribed an antibiotic compared to White children, possibly related to their lower rate of GAS testing. Compared to office-based visits, children visiting a clinic were less likely to use an antibiotic. Household income, insurance type, and season had no significant impact on revisit risk.
Effects of GAS test and antibiotic prescriptions on likelihood of revisits
The multivariate analysis of the risk of a revisit within 28 days is presented in Table 4. Children with pharyngitis who tested and did not receive an antibiotic serve as the reference comparison group for this analysis to illustrate the impact of using the GAS test and treatment with an antibiotic. The results in Table 4 are quite clear: patients who receive the GAS test were significantly less likely to have a revisit within 28 days. Moreover, within the group of patients who were tested, those not receiving an antibiotic, presumedly because their GAS test was negative, experienced the lowest risk of a revisit. This result is consistent with the data in Table 1. Moreover, using an antibiotic had no impact on the likelihood of a revisit in patients not receiving the GAS test. This result is also consistent with Table 1.
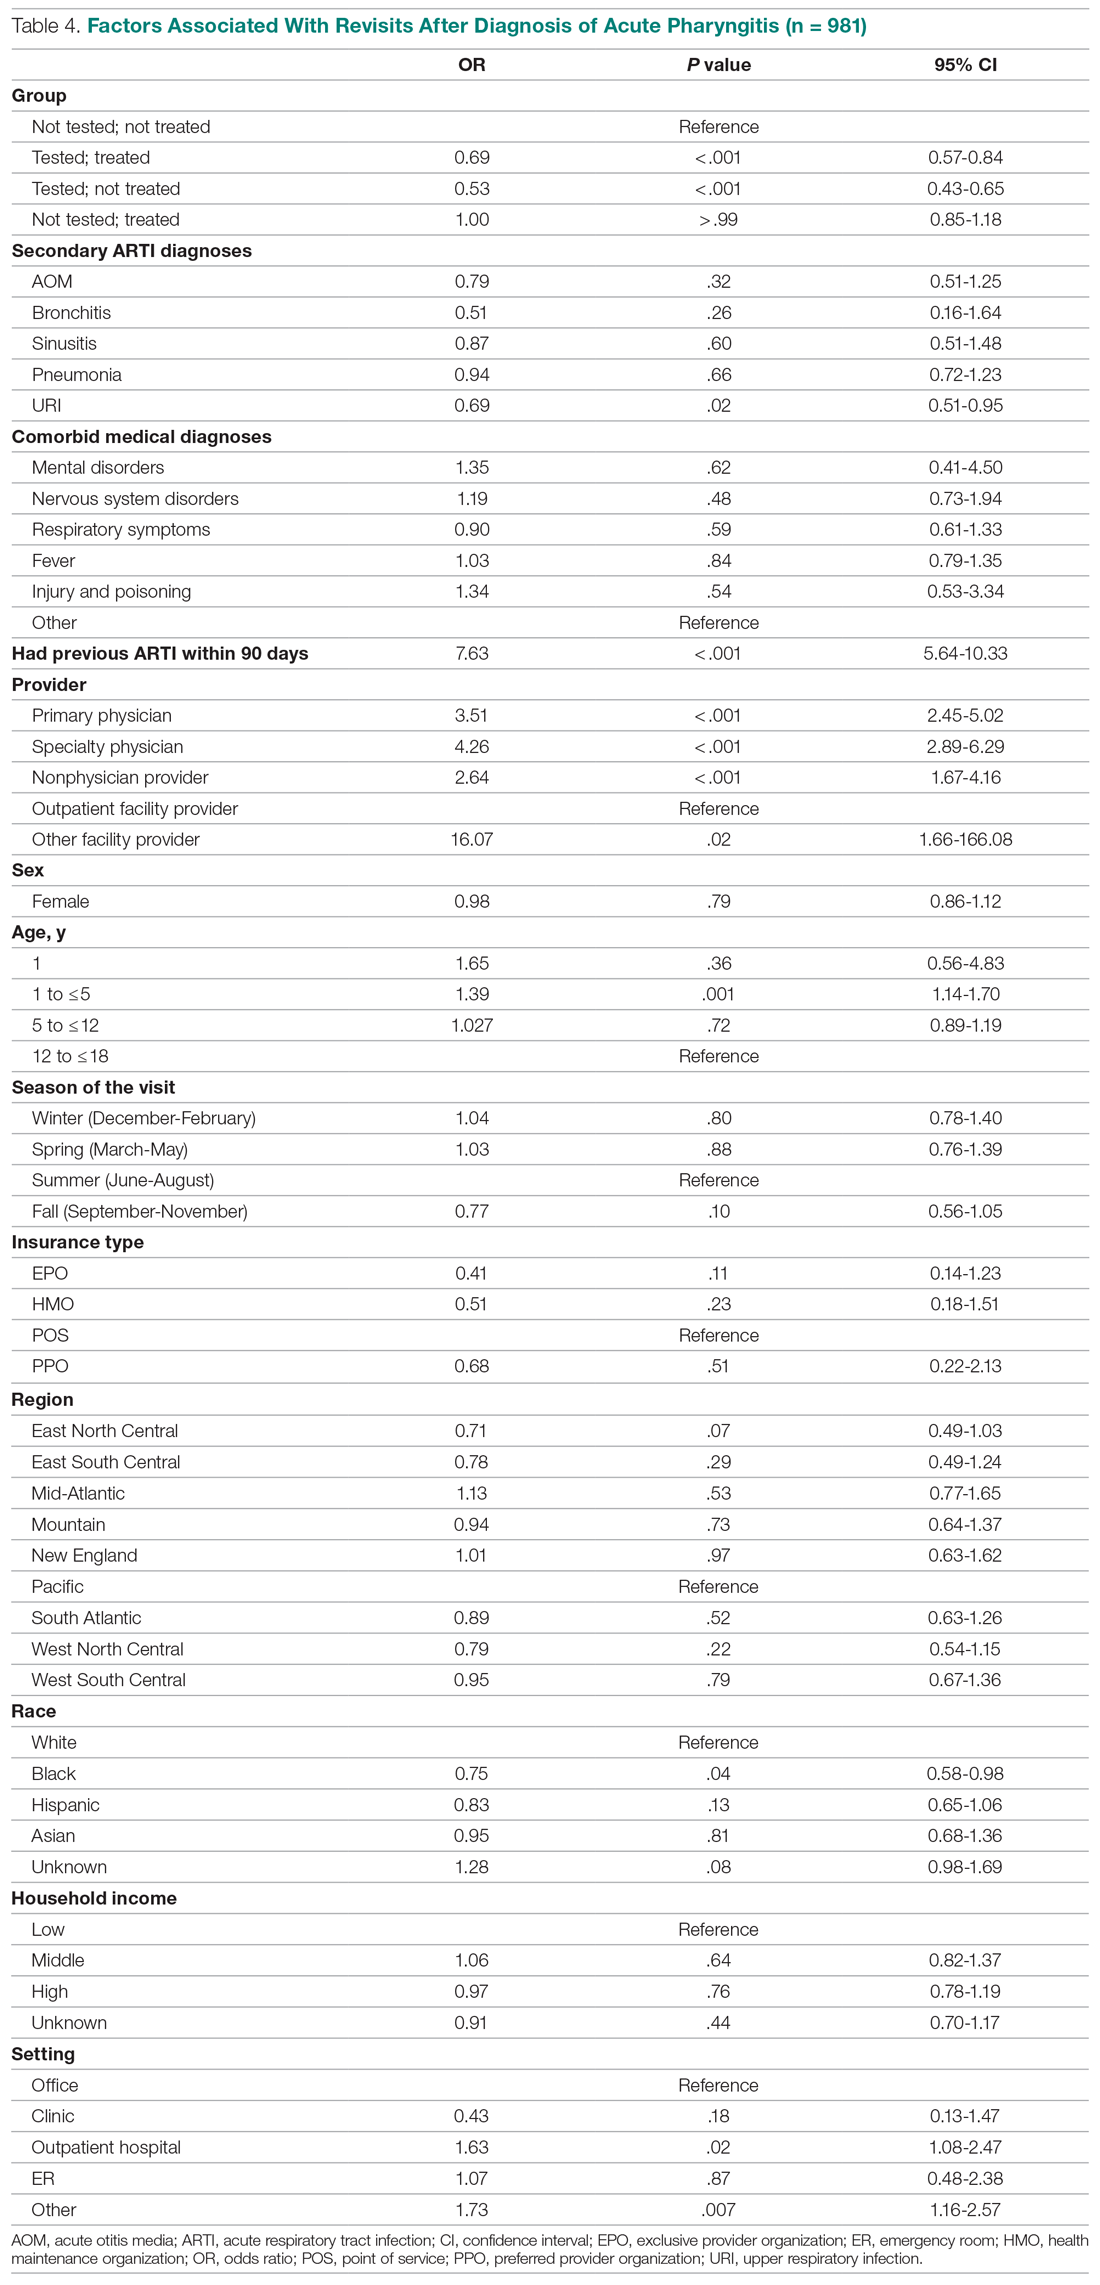
Other results from the analysis of revisit risk may be of interest to clinicians. Pharyngitis patients with a prior episode of treatment within 90 days for an acute respiratory tract infection were more than 7 times more likely to experience a revisit within 28 days of the pharyngitis diagnosis than patients without a history of recent ARTI infections. Age is also a risk factor in likelihood of initiating a revisit. Children under 1 year and children aged 1 to 5 years were more likely to have a revisit than children aged more than 12 years. Compared to White children, Black children were 25% (P = .04) less likely to have a revisit. The care setting also has a significant impact on revisit risk. Children visiting outpatient hospital and other care settings had a significantly higher revisit risk than those visiting a physician’s office. Lastly, household income, geographic region, season, medical comorbidities, gender, and insurance type have no significant impact on revisit risk.
Sensitivity analysis
The results from the analysis of 7-day and 28-day revisit risk are summarized in Table 5. These results indicate that patients who were tested had a more significant decrease in revisit risk at 7 days (72%) than was evident at 28 days (47% reduction). Receiving an antibiotic, with or without the test, had no impact on revisit risk.
Discussion
Published data on revisits for pharyngitis are lacking with the concentration of prior research focused more on systemic complications of undertreated GABHS disease or on identifying carrier status. Our study results suggest that GAS testing is the most important factor in reducing revisit risk. Being prescribed an antibiotic, on its own, does not have a significant impact on the risk of a revisit. However, once the GAS test is used, the decision not to use an antibiotic was correlated with the lowest revisit rate, likely because the source of the pharyngitis infection was viral and more likely to resolve without a revisit. Prior studies have reported variable rates of testing among children with pharyngitis prescribed an antibiotic, ranging from 23% to 91%,14,15 with testing important toward more appropriate antibiotic use.16 More recently, among more than 67 000 patients aged 3 to 21 years presenting with sore throat and receiving a GAS test, 32.6% were positive.17
Our analysis found that more than 46% of pediatric pharyngitis patients were given the rapid GAS test. While this testing rate is substantially lower than HEDIS recommendations and lower than testing rates achieved by several health maintenance organizations,10 it is similar to the 53% of children receiving such testing in a recent National Ambulatory Medical Care Survey.18 Furthermore, we found that when antibiotics are prescribed following a GAS test, the revisit risk is not significantly reduced, possibly because antibiotics lower revisit risk when informed by diagnostic testing tools that determine the infectious organism. This is supported by a similar population analysis in which we observed reduced revisit rates in children with AOM managed with antibiotics within 3 days of index diagnosis.19
Several other factors also affect the likelihood of a child receiving the GAS test. Children aged 1 to 12 years were significantly more likely to receive the GAS test than children over the age of 12. This included children in the 1 to 5 years old bracket who had a 15% higher likelihood of undergoing a GAS test, despite children less than 3 years of age as not recommended targets for GAS testing.20 As expected, children with reported ARTI-associated comorbidities were also less likely to receive a GAS test. Additionally, specialty care physicians were less inclined to implement the GAS test, possibly because of diagnostic confidence without testing or referral after GAS was ruled out. Black and low-income children had statistically lower odds of receiving the test, even after controlling for other factors, and yet were less likely to consume a revisit. As the overall data suggested more revisits in those not tested, further study is needed to examine if race or income discrepancies are equity based. Finally, children in the Pacific region, compared to the rest of the nation, were the least likely to receive a GAS test and yet there were no significant differences in revisit rates by region. Regional differences in antibiotic use were also observed in our study, as has been seen by others.21
After statistically controlling for having received the diagnostic GAS test and filled a prescription for an antibiotic, there are multitude of factors that independently affect the revisit risk, the most important of which if which was a history of an ARTI infection in the prior 90 days. While prior visit history had no impact on the likelihood of being tested or filling an antibiotic, patients with prior visits were more than 7 times more likely to consume a revisit. This was not reflected in nor related to comorbid ARTIs as these patients did not have statistically higher revisits than those with pharyngitis as the sole-coded diagnosis. Moreover, speculation for bacterial etiology of primary or superinfection based on a recent history of ARTI accounting for revisits seems unlikely as it did not yield greater antibiotic use in that group. Further analysis is required to determine the clinical and behavioral factors that promote for prior ARTI history as a major factor in revisit risk after an index visit for pharyngitis.
Children aged between 1 and 5 years, though 15% more likely to be tested than those aged 12 through 17 years, were also 39% more likely to initiate a revisit compared to older children when statistically controlling for other covariates. This perhaps suggests longer illness, wrong diagnosis, delay in appropriate treatment, or more caution by parents and providers in this age group. Justification for testing children less than 3 years of age who are outside of the HEDIS suggested age group, when clinical judgement does not point to another infection source, can result in positivity rates between 22% and 30% as previously observed.22,23 Patients visiting nonphysician providers and outpatient facility providers were less likely to have a revisit than those visiting primary and specialty care physicians, though slightly higher propensity for antibiotic prescriptions was seen for nonphysician providers. Pediatricians have been noted to be less likely to prescribe antibiotics without GAS testing than nonpediatric providers, and more guidelines-compliant in prescribing.24
Recommendations to not test children under 3 years of age are based on the lack of acute rheumatic fever and other complications in this age group together with more frequent viral syndromes. Selectivity in applying clinical criteria to testing can be attempted to separate bacterial from viral illness. Postnasal drainage/rhinorrhea, hoarse voice, and cough have been used successfully to identify those with viral illness and less need for testing, with greater certainty of low risk for GABHS in those over 11 years of age without tonsillar exudates, cervical adenopathy, or fever.17 However, the marginal benefits of those who have all 3 features of viral illness versus none in identifying GAS positivity was 23.3% vs 37.6% - helpful, but certainly not diminishing the need for testing. These constitutional findings of viral URI also do not exclude the GAS carrier state that features these symptoms.25 Others have reinforced the doubt of pharyngeal exudates as the premier diagnostic finding for test-positive GAS.26
This study had several limitations. The Optum claims dataset only contains ICD-9 codes for diagnoses. It does not include data on infection severity and clinical findings related to symptoms, thus empiric treatment warranted based in clinical severity is not assessed. Antibiotics are commonly available as generics and very inexpensive. Patients may fill and pay for these prescriptions directly, in which case, a claim for payment may not be filed with Optum. This could result in an undercount of treated patients in our study.
There is no corresponding problem of missing medical claims for GAS testing which were obtained from the CPT codes within the Optum claims data set. However, we elected not to verify the test results due to these data being missing for 75% of the study population. Nevertheless, this study’s focus was less about justifying antibiotic treatment, but dealt with the outcomes generated by testing and treatment. Toward that end, we used CPT codes to identify a revisit, and while those can at times be affected by financial reimbursement incentives, differences related to revisits in the 4 patient groups should not be subject to bias.
Conclusion
This study used data from real world practices to document the patterns of GAS testing and antibiotic use in pediatric pharyngitis patients. Revisit rates were under 5% for all patient groups and the use of rapid diagnostic tools were found to be the determining factor in further reducing the risk of revisits. This supports the need for compliance with the HEDIS quality metric for pharyngitis to the recommended levels of rapid testing which have been falling in recent years. Use of more accurate antigen and newer molecular detection testing methods may help further delineate important factors in determining pediatric pharyngitis treatment and need for revisits.27
Corresponding author: Jeffrey McCombs, MD, University of Southern California School of Pharmacy, Department of Pharmaceutical and Health Economics, Leonard D. Schaeffer Center for Health Policy & Economics, 635 Downey Way, Verna & Peter Dauterive Hall 310, Los Angeles, CA 90089-3333; [email protected].
Financial disclosures: None.
1. Choby BA. Diagnosis and treatment of streptococcal pharyngitis. Am Fam Physician. 2009;79(5):383-390.
2. Briel M, Schuetz P, Mueller B, et al. Procalcitonin-guided antibiotic use vs a standard approach for acute respiratory tract infections in primary care. Arch of Intern Med. 2008;168(18):2000-2008. doi: 10.1001/archinte.168.18.2000
3. Maltezou HC, Tsagris V, Antoniadou A, et al. Evaluation of a rapid antigen detection test in the diagnosis of streptococcal pharyngitis in children and its impact on antibiotic prescription. J Antimicrob Chemother. 2008;62(6):1407-1412. doi: 10.1093/jac/dkn376
4. Neuner JM, Hamel MB, Phillips RS, et al. Diagnosis and management of adults with pharyngitis: a cost-effectiveness analysis. Ann Intern Med. 2003;139(2):113-122. doi:10.7326/0003-4819-139-2-200307150-00011
5. Gerber MA, Baltimore RS, Eaton CB, et al. Prevention of rheumatic fever and diagnosis and treatment of acute Streptococcal pharyngitis: a scientific statement from the American Heart Association Rheumatic Fever, Endocarditis, and Kawasaki Disease Committee of the Council on Cardiovascular Disease in the Young, the Interdisciplinary Council on Functional Genomics and Translational Biology, and the Interdisciplinary Council on Quality of Care and Outcomes Research: endorsed by the American Academy of Pediatrics. Circulation. 2009;119(11):1541-1551. doi: 10.1161/CIRCULATIONAHA.109.191959
6. Gieseker KE, Roe MH, MacKenzie T, Todd JK. Evaluating the American Academy of Pediatrics diagnostic standard for Streptococcus pyogenes pharyngitis: backup culture versus repeat rapid antigen testing. Pediatrics. 2003;111(6):e666-e670. doi: 10.1542/peds.111.6.e666
7. Shapiro DJ, Lindgren CE, Neuman MI, Fine AM. Viral features and testing for Streptococcal pharyngitis. Pediatrics. 2017;139(5):e20163403. doi: 10.1542/peds.2016-3403
8. Shulman ST, Bisno AL, Clegg H, et al. Clinical practice guideline for the diagnosis and management of group A Streptococcal pharyngitis: 2012 update by the Infectious Diseases Society of America. Clin Infect Dis. 2012;55(10):e86–e102. doi: 10.1093/cid/cis629
9. Mangione-Smith R, McGlynn EA, Elliott MN, et al. Parent expectations for antibiotics, physician-parent communication, and satisfaction. Arch Pediatr Adolesc Med. 2001;155(7):800–806. doi: 10.1001/archpedi.155.7.800
10. Appropriate Testing for Children with Pharyngitis. HEDIS Measures and Technical Resources. National Committee for Quality Assurance. Accessed February 12, 2021. https://www.ncqa.org/hedis/measures/appropriate-testing-for-children-with-pharyngitis/
11. Linder JA, Bates DW, Lee GM, Finkelstein JA. Antibiotic treatment of children with sore throat. JAMA. 2005;294(18):2315-2322. doi: 10.1001/jama.294.18.2315
12. Crimmel BL. Health Insurance Coverage and Income Levels for the US Noninstitutionalized Population Under Age 65, 2001. Medical Expenditure Panel Survey, Agency for Healthcare Research and Quality. 2004. https://meps.ahrq.gov/data_files/publications/st40/stat40.pd
13. AHFS/ASHP. American Hospital Formulary Service Drug Information. 2012. AHFS drug information. 00--. Accessed January 4, 2021.
14. Mainous AG 3rd, Zoorob, RJ, Kohrs FP, Hagen MD. Streptococcal diagnostic testing and antibiotics prescribed for pediatric tonsillopharyngitis. Pediatr Infect Dis J. 1996;15(9):806-810. doi: 10.1097/00006454-199609000-00014
15. Benin AL, Vitkauskas G, Thornquist E, et al. Improving diagnostic testing and reducing overuse of antibiotics for children with pharyngitis: a useful role for the electronic medical record. Pediatr Infect Dis J. 2003;22(12):1043-1047. doi: 10.1097/01.inf.0000100577.76542.af
16. Luo R, Sickler J, Vahidnia F, et al. Diagnosis and Management of Group a Streptococcal Pharyngitis in the United States, 2011-2015. BMC Infect Dis. 2019;19(1):193-201. doi: 10.1186/s12879-019-3835-4
17. Shapiro DJ, Barak-Corren Y, Neuman MI, et al. Identifying Patients at Lowest Risk for Streptococcal Pharyngitis: A National Validation Study. J Pediatr. 2020;220:132-138.e2. doi: 10.1016/j.jpeds.2020.01.030. Epub 2020 Feb 14
18. Shapiro DJ, King LM, Fleming-Dutra KE, et al. Association between use of diagnostic tests and antibiotic prescribing for pharyngitis in the United States. Infect Control Hosp Epidemiol. 2020;41(4):479-481. doi: 10.1017/ice.2020.29
19. Sangha K, Steinberg I, McCombs JS. The impact of antibiotic treatment time and class of antibiotic for acute otitis media infections on the risk of revisits. Abs PDG4. Value in Health. 2019; 22:S163.
20. Ahluwalia T, Jain S, Norton L, Meade J, et al. Reducing Streptococcal Testing in Patients < 3 Years Old in an Emergency Department. Pediatrics. 2019;144(4):e20190174. doi: 10.1542/peds.2019-0174
21. McKay R, Mah A, Law MR, et al. Systematic Review of Factors Associated with Antibiotic Prescribing for Respiratory Tract Infections. Antimicrob Agents Chemother. 2016;60(7):4106-4118. doi: 10.1128/AAC.00209-16
22. Woods WA, Carter CT, Schlager TA. Detection of group A streptococci in children under 3 years of age with pharyngitis. Pediatr Emerg Care. 1999;15(5):338-340. doi: 10.1097/00006565-199910000-00011
23. Mendes N, Miguéis C, Lindo J, et al. Retrospective study of group A Streptococcus oropharyngeal infection diagnosis using a rapid antigenic detection test in a paediatric population from the central region of Portugal. Eur J Clin Microbiol Infect Dis. 2021;40(6):1235-1243. doi: 10.1007/s10096-021-04157-x
24. Frost HM, McLean HQ, Chow BDW. Variability in Antibiotic Prescribing for Upper Respiratory Illnesses by Provider Specialty. J Pediatr. 2018;203:76-85.e8. doi: 10.1016/j.jpeds.2018.07.044.
25. Rick AM, Zaheer HA, Martin JM. Clinical Features of Group A Streptococcus in Children With Pharyngitis: Carriers versus Acute Infection. Pediatr Infect Dis J. 2020;39(6):483-488. doi: 10.1097/INF.0000000000002602
26. Nadeau NL, Fine AM, Kimia A. Improving the prediction of streptococcal pharyngitis; time to move past exudate alone [published online ahead of print, 2020 Aug 16]. Am J Emerg Med. 2020;S0735-6757(20)30709-9. doi: 10.1016/j.ajem.2020.08.023
27. Mustafa Z, Ghaffari M. Diagnostic Methods, Clinical Guidelines, and Antibiotic Treatment for Group A Streptococcal Pharyngitis: A Narrative Review. Front Cell Infect Microbiol. 2020;10:563627. doi: 10.3389/fcimb.2020.563627
From the Department of Pharmaceutical and Health Economics, University of Southern California, Los Angeles, CA, (Drs. Sangha and McCombs), Department of Pediatrics, Keck School of Medicine, and Department of Clinical Pharmacy, School of Pharmacy, University of Southern California, Los Angeles, CA, (Dr. Steinberg), and Leonard Schaeffer Center for Health Policy and Economics, University of Southern California, Los Angeles, CA (Dr. McCombs).
Objective: The recommended treatment for children and adolescents under 18 years of age who have a positive test for group A Streptococcus (GAS) are antibiotics using the “test and treat” strategy to detect and treat GAS for pediatric pharyngitis. This study used paid claims data to document the extent to which real-world treatment patterns are consistent with these recommendations. We document the factors correlated with testing and treatment, then examine the effects of receiving a GAS test and being treated with an antibiotic impact the likelihood of a revisit for an acute respiratory tract infection within 28 days.
Methods: This retrospective cohort study used Optum Insight Clinformatics data for medical and pharmacy claims from 2011-2013 to identify episodes of care for children and adolescents with pharyngitis around their index visit (± 6 months). The sample population included children and adolescents under 18 years of age with a diagnosis of pharyngitis. Multivariable logistic regression analyses were used to document factors associated with receipt of GAS test and antibiotic treatment. Next, we used logistic regression models to estimate the impact of test and treat recommendation on revisit risk.
Results: There were 24 685 treatment episodes for children and adolescents diagnosed with pharyngitis. Nearly 47% of these episodes included a GAS test and 48% of tested patients were prescribed an antibiotic prescription. Failing to perform a GAS test increased the risk of a revisit within 28 days by 44%. The use of antibiotics by tested and untested patients had no impact on revisit risk.
Conclusion: While the judicious use of antibiotics is important in managing pharyngitis infections and managing complications, the use of rapid diagnostic tools was found to be the determining factor in reducing revisits for pediatric patients with pharyngitis.
Keywords: pediatrics; pharyngitis; respiratory infections; acute infections; diagnostic tests; group A Streptococcus; antibiotics; revisits.
Acute pharyngitis is a common acute respiratory tract infection (ARTI) in children. Group A β-hemolytic streptococci (GABHS) is the most common bacterial etiology for pediatric pharyngitis, accounting for 15% to 30% of cases.1
Beyond clinical assessment, laboratory diagnostic testing generally plays a limited role in guiding appropriate antibiotic prescribing for patients with an ARTI.2,3 Most diagnostic tests require 2 or 3 days to result, incur additional costs, and may delay treatment.4 While these tests do not provide clear and timely guidance on which specific antibiotic is appropriate for ARTI patients, this is not the case for patients with pharyngitis.5,6,7 A rapid diagnostic test exists to identify pharyngitis patients with GABHS which accounts for 1 in 4 children with acute sore throat.1,4,6 Both the American Academy of Pediatrics and the Infectious Diseases Society of America recommend antibiotic treatment for children and adolescents under 18 years of age who have a positive test for group A Streptococcus (GAS).8,9 This “test and treat” protocol has been consistently included in the Healthcare Effectiveness Data and Information Set (HEDIS) standards over time for pediatric pharyngitis patients aged 3 to 18 years before dispensing an antibiotic.10
Sinusitis, pneumonia, and acute otitis media are considered ARTIs where antibiotic treatment is justified. Therefore, pharyngitis of unclear etiology seen with these comorbid infections may not always undergo GAS testing but move directly to the patient being prescribed antibiotics. This analysis enumerates ARTI-related comorbidities present together with the initial coded pharyngitis diagnosis to evaluate their impact on the provider’s decision to test and treat, and on revisit risk.
Antibiotic treatment for GAS patients is likely to eradicate the acute GABHS infection within 10 days. Penicillin and amoxicillin are commonly recommended because of their narrow spectrum of activity, few adverse effects, established efficacy, and modest cost. Alternative antibiotics for patients with penicillin allergy, or with polymicrobial infection seen on culture results, include a first-generation cephalosporin, clindamycin, clarithromycin (Biaxin), or azithromycin (Zithromax).1,8,11 However, while compliance with these HEDIS guidelines has been evaluated, the outcome effects of following the HEDIS “test and treat” recommendations for children with pharyngitis have not been adequately evaluated.
These outcome evaluations have increasing importance as the latest HEDIS survey has shown testing rates in commercial Preferred Provider Organizations (PPO) falling from 86.4% in 2018 to 75.9% in 2019, the lowest rate of testing since 2009, with similar reductions under 80% for Health Maintenance Organizations (HMO).10 While health plans may execute cost-benefit analyses and algorithms to forge best practices for GAS testing in children and adolescents presenting with symptoms of pharyngitis, it is important to regard the wasteful resource utilization and additional cost of revisits that may offset any gains accrued by more focused GAS testing outside the existing clinical guidelines and HEDIS measures. This may be of particular importance in documenting infection and sparing antibiotic therapy in toddlers and younger.
The objective of this study was to investigate the correlation between testing and antibiotic use on the likelihood of a revisit for an acute respiratory tract infection within 28 days. To achieve this objective, this investigation consists of 3 sequential analyses. First, we document the factors associated with the decision to test the patient for a GABHS infection using the GAS test. Next, we document the factors associated with the decision to use an antibiotic to treat the patient as a function of having tested the patient. Finally, we investigate the impact of the testing and treatment decisions on the likelihood of a revisit within 28 days.
Methods
Study design
This was a retrospective cohort study of episodes of treatment for pediatric patients with pharyngitis. Episodes were identified using data derived from the Optum Insight Clinformatics claims database provided to the University of Southern California to facilitate the training of graduate students. These data cover commercially insured patients with both medical and pharmacy benefits. Data were retrieved from the 3-year period spanning 2011-2013. An episode of care was identified based on date of the first (index) outpatient visit for a pharyngitis diagnosis (International Classification of Diseases, Ninth Revision [ICD-9]: 462, 463, 034.0). Outpatient visits were defined by visit setting: ambulatory clinics, physician offices, emergency rooms, and urgent care facilities. Each pharyngitis treatment episode was then screened for at least a 6-month enrollment in a health insurance plan prior and subsequent to the index visit using Optum enrollment data. Finally, eligible treatment episodes were restricted to children and adolescents under 18 years of age, who had an index outpatient visit for a primary diagnosis of acute pharyngitis.
A diagnostic profile was created for each episode using the diagnoses recorded for the index visit. Up to 3 diagnoses may be recorded for any outpatient visit and the first recorded diagnosis was assumed to be the primary diagnosis for that episode. Any secondary diagnoses recorded on the index visit were used to define comorbidities present at the index visit. ARTI-related comorbidities included: acute otitis media (AOM), bronchitis, sinusitis, pneumonia, and upper respiratory infection (URI). Other comorbid medical diagnoses were documented using diagnostic data from the pre-index period. Dichotomous variables for the following categories were created: mental disorders, nervous system disorders, respiratory symptoms, fever, injury and poisoning, other, or no diseases.
Prior visits for other respiratory infections in the previous 90 days were also identified for patients based on their index visit for pharyngitis. Similarly, any subsequent visits, within 28 days of the index visit, were also recorded to measure the health outcome for analysis. Practice settings include physician offices and federally qualified health centers, state and local health clinics, outpatient hospitals facilities, emergency departments, and other outpatient settings such as walk-in retail health clinic or ambulatory centers. Providers include primary care physicians (family practice, pediatricians, internal medicine), specialty care physicians (emergency medicine, preventive medicine), nonphysician providers (nurse practitioners, physician assistants) and other providers (urgent care, acute outpatient care, ambulatory care centers). Seasons of the year were determined based on the index date of the episode to account for possible seasonality in pharyngitis treatment. Lastly, a previous visits variable was created to identify whether the child had nonpharyngitis ARTI visits in the 3 months prior to the index visit.
Demographic variables were created based on enrollment and the socioeconomic data available in the Optum socioeconomic status file. These variables include patient age, race, sex, household income, geographic location, practice setting type, provider specialty, and type of insurance. An estimate of patient household income was based on algorithms using census block groups. Income categories were informed by the federal guidelines for a family of 4. A low-income family was defined as earning less than $50 000; a middle-income family earned between $50 000 and $75 000, and a high-income family earned $75 000 and above.12 Patient insurance type was categorized as HMO, Exclusive Provider Organization (EPO), Point of Service (POS), and PPO. Race was identified as White, Black, Hispanic, and Asian. Patient location was defined according to national census regions.
Outcomes
GAS test
The HEDIS measures for pharyngitis recommend using the GAS test to identify the bacterial etiology of the pharyngitis infection. Patients who received the test were identified based on Current Procedural Terminology (CPT) codes 87070-71, 87081, 87430, 87650-52, and 87880.10
Antibiotic treatment
The pharmacy administrative claims dataset was used to identify study patients who filled a prescription for an antibiotic during their pharyngitis treatment episode. Optum pharmacy data identify the medications received, specifies the date of prescription filling, National Drug Codes, and American Hospital Formulary Service (AHFS) Classification System codes for each medication. We used the AHFS Pharmacologic-Therapeutic classification of antibiotics to create dichotomous variables documenting the antibacterial used by each patient.13 These are categorized under antibacterial including penicillins, cephalosporins (first, second, third, fourth generation cephalosporins), macrolides (first generation and others), tetracyclines, sulfonamides, fluoroquinolones (ciprofloxacin, levofloxacin, moxifloxacin), cephamycin, carbapenems, and β-lactam antibiotics (amoxicillin, amoxicillin/clavulanate, cephalexin, cefuroxime, cefdinir).
Revisits to physician or other provider
Revisits within 28 days were used as the measure of patient outcomes related to testing and filling of an antibiotic prescription for acute pharyngitis. Revisits may also be due to a patient returning for a follow-up, alternative treatment, worsening pharyngitis, or for another ARTI. An ARTI-related revisit also increases total resources used to treat pediatric pharyngitis patients.
Statistical analysis
Logistic regression was used for all 3 analyses conducted in this study. First, we determined the patient and treating physician characteristics that impact the decision to use GAS testing for pharyngitis. Second, we identified those factors that impact the decision to use antibiotic prescriptions among children who were diagnosed with pharyngitis adding in the dichotomous variable indicating if the patient had received a GAS test. Third, we used a logit regression analysis to document if receiving a GAS test and/or an antibiotic impacted the likelihood of a revisit by comparing revisit risk. To estimate the effect of testing and/or antibiotic use, we divided patients into 4 groups based on whether the patient received a GAS test and/or an antibiotic prescription. This specification of the analysis of revisits as an outcome focuses on adherence to HEDIS “test and treat” guidelines10:
- Patients who were not tested yet filled an antibiotic prescription. This decision was likely based on the clinician’s judgment of the patient’s signs and symptoms, and confirmational testing not performed.
- Patients who were not tested and did not fill an antibiotic prescription. Apparently, in the clinician’s judgment the patient’s signs and symptoms were such that the infection did not warrant treatment and the clinical presentation did not necessitate the GAS test to confirm the recorded diagnosis of pharyngitis.
- Patients who were tested and received antibiotic prescription, likely because the test was positive for GABHS.
- Patients who were tested and did not receive antibiotic prescription.
We tested for statistically significant differences in baseline characteristics across these 4 patient groups using t tests for continuous variables and χ2 tests for categorical variables. Odds ratios (OR) and CI were computed for the influential variables included the regression analyses.
We conducted a sensitivity analysis using a model specification which included the dichotomous variables for testing and for treatment, and the interaction term between these variables to assess if treatment effects varied in tested and untested patients. We also estimated this model of revisit risk using revisits within 7 days as the outcome variable.
All analyses were completed using STATA/IC 13 (StataCorp, College Station, TX).
Results
There were 24 685 treatment episodes for children diagnosed with pharyngitis. Nearly 47% of these episodes included GAS testing and 47% of the tested patients filled an antibiotic prescription. Similarly, 53% of patients were not tested and 49% of untested patients filled an antibiotic prescription. As a result, the 4 groups identified for analysis were evenly distributed: untested and no prescription (26.9%), untested and prescription (26.3%), tested and prescription (21.9%), and tested and no prescription (24.9%) (Figure).
Table 1 presents the descriptive statistics for these 4 patient groups. Note first that the rate of revisits within 28 days is under 5% across all groups. Second, the 2 tested groups have a lower revisit rate than the untested groups: the tested and treated have a revisit rate of 3.3%, and the tested and untreated have a revisit rate of 2.4%, while both the untested groups have a revisit rate of nearly 5%. These small absolute differences in revisit rates across groups were statistically significant.
Factors associated with receiving GAS test
Several factors were found to impact the decision to test (Table 2). Only 9.7% of children were reported to have any ARTI coinfection. As expected, these comorbidities resulted in a significantly lower likelihood of receiving the GAS test: AOM, bronchitis, sinusitis, pneumonia, and URI as comorbid infections had a 48%, 41%, 37%, 63%, and 13% lower likelihood of receiving the GAS test, respectively, than those with no comorbidities. Similarly, children with fever and respiratory symptoms were 35% and 45% less likely to receiving the GAS test, respectively. This is consistent with our expectation that comorbid ARTI infections will lead many providers to forgo testing.
Provider type and patient age also plays a role in receipt of the GAS test. Relative to outpatient facility providers, primary care physicians were 24% more likely and specialty physicians were 38% less likely of employing the GAS test. The child’s age played a significant role in receipt of the GAS test. Children aged 1 to 5 years and 5 to 12 years were 15% and 14% more likely to receive the test compared to children older than 12 years.
Pharyngitis patients have disproportionately higher odds of receiving a GAS test in most regions of the country compared to the Pacific region. For instance, children in the Mid-Atlantic region have 51% higher odds of receiving a GAS test while children in New England have 80% higher odds of receiving the same test.
Black children have 11% lower odds of receiving the GAS test compared to White children. Both middle-income and high-income children have 12% and 32% higher odds of receiving the test compared to low-income children. Compared to office-based visits, children visiting a clinic were twice as likely to receive a GAS test while those seen in the emergency room have 43% lower odds of receiving a GAS test. Hospital outpatient departments, which account for less than 1% of all visits, rarely used a GAS test which could be a statistical artifact due to small sample size. Lastly, insurance and season of the year had no significant impact of receipt of a GAS test.
Factors associated with receiving antibiotic prescription
Surprisingly, receiving the GAS test has a small but insignificant impact on the likelihood that the patient will receive an antibiotic prescription (Table 3) (Adjusted OR = 1.055, P = .07). After controlling for receipt of a GAS test, children with AOM and sinusitis comorbidities have an increased likelihood of being prescribed an antibiotic. Children with URI have a lower likelihood of being prescribed an antibiotic. Additionally, relative to primary care physicians, children visiting nonphysician providers for pharyngitis were more likely to be prescribed an antibiotic.
Children under 12 years of age were more likely to use an antibiotic compared to children 12 years and older. Geographically, there is some evidence of regional variation in antibiotic use as well. Children in the south Atlantic, west-south central, and southeast central regions had a significantly lower odds of being prescribed an antibiotic respectively than pharyngitis patients in the Pacific region. Black children had a 10% lower likelihood of being prescribed an antibiotic compared to White children, possibly related to their lower rate of GAS testing. Compared to office-based visits, children visiting a clinic were less likely to use an antibiotic. Household income, insurance type, and season had no significant impact on revisit risk.
Effects of GAS test and antibiotic prescriptions on likelihood of revisits
The multivariate analysis of the risk of a revisit within 28 days is presented in Table 4. Children with pharyngitis who tested and did not receive an antibiotic serve as the reference comparison group for this analysis to illustrate the impact of using the GAS test and treatment with an antibiotic. The results in Table 4 are quite clear: patients who receive the GAS test were significantly less likely to have a revisit within 28 days. Moreover, within the group of patients who were tested, those not receiving an antibiotic, presumedly because their GAS test was negative, experienced the lowest risk of a revisit. This result is consistent with the data in Table 1. Moreover, using an antibiotic had no impact on the likelihood of a revisit in patients not receiving the GAS test. This result is also consistent with Table 1.
Other results from the analysis of revisit risk may be of interest to clinicians. Pharyngitis patients with a prior episode of treatment within 90 days for an acute respiratory tract infection were more than 7 times more likely to experience a revisit within 28 days of the pharyngitis diagnosis than patients without a history of recent ARTI infections. Age is also a risk factor in likelihood of initiating a revisit. Children under 1 year and children aged 1 to 5 years were more likely to have a revisit than children aged more than 12 years. Compared to White children, Black children were 25% (P = .04) less likely to have a revisit. The care setting also has a significant impact on revisit risk. Children visiting outpatient hospital and other care settings had a significantly higher revisit risk than those visiting a physician’s office. Lastly, household income, geographic region, season, medical comorbidities, gender, and insurance type have no significant impact on revisit risk.
Sensitivity analysis
The results from the analysis of 7-day and 28-day revisit risk are summarized in Table 5. These results indicate that patients who were tested had a more significant decrease in revisit risk at 7 days (72%) than was evident at 28 days (47% reduction). Receiving an antibiotic, with or without the test, had no impact on revisit risk.
Discussion
Published data on revisits for pharyngitis are lacking with the concentration of prior research focused more on systemic complications of undertreated GABHS disease or on identifying carrier status. Our study results suggest that GAS testing is the most important factor in reducing revisit risk. Being prescribed an antibiotic, on its own, does not have a significant impact on the risk of a revisit. However, once the GAS test is used, the decision not to use an antibiotic was correlated with the lowest revisit rate, likely because the source of the pharyngitis infection was viral and more likely to resolve without a revisit. Prior studies have reported variable rates of testing among children with pharyngitis prescribed an antibiotic, ranging from 23% to 91%,14,15 with testing important toward more appropriate antibiotic use.16 More recently, among more than 67 000 patients aged 3 to 21 years presenting with sore throat and receiving a GAS test, 32.6% were positive.17
Our analysis found that more than 46% of pediatric pharyngitis patients were given the rapid GAS test. While this testing rate is substantially lower than HEDIS recommendations and lower than testing rates achieved by several health maintenance organizations,10 it is similar to the 53% of children receiving such testing in a recent National Ambulatory Medical Care Survey.18 Furthermore, we found that when antibiotics are prescribed following a GAS test, the revisit risk is not significantly reduced, possibly because antibiotics lower revisit risk when informed by diagnostic testing tools that determine the infectious organism. This is supported by a similar population analysis in which we observed reduced revisit rates in children with AOM managed with antibiotics within 3 days of index diagnosis.19
Several other factors also affect the likelihood of a child receiving the GAS test. Children aged 1 to 12 years were significantly more likely to receive the GAS test than children over the age of 12. This included children in the 1 to 5 years old bracket who had a 15% higher likelihood of undergoing a GAS test, despite children less than 3 years of age as not recommended targets for GAS testing.20 As expected, children with reported ARTI-associated comorbidities were also less likely to receive a GAS test. Additionally, specialty care physicians were less inclined to implement the GAS test, possibly because of diagnostic confidence without testing or referral after GAS was ruled out. Black and low-income children had statistically lower odds of receiving the test, even after controlling for other factors, and yet were less likely to consume a revisit. As the overall data suggested more revisits in those not tested, further study is needed to examine if race or income discrepancies are equity based. Finally, children in the Pacific region, compared to the rest of the nation, were the least likely to receive a GAS test and yet there were no significant differences in revisit rates by region. Regional differences in antibiotic use were also observed in our study, as has been seen by others.21
After statistically controlling for having received the diagnostic GAS test and filled a prescription for an antibiotic, there are multitude of factors that independently affect the revisit risk, the most important of which if which was a history of an ARTI infection in the prior 90 days. While prior visit history had no impact on the likelihood of being tested or filling an antibiotic, patients with prior visits were more than 7 times more likely to consume a revisit. This was not reflected in nor related to comorbid ARTIs as these patients did not have statistically higher revisits than those with pharyngitis as the sole-coded diagnosis. Moreover, speculation for bacterial etiology of primary or superinfection based on a recent history of ARTI accounting for revisits seems unlikely as it did not yield greater antibiotic use in that group. Further analysis is required to determine the clinical and behavioral factors that promote for prior ARTI history as a major factor in revisit risk after an index visit for pharyngitis.
Children aged between 1 and 5 years, though 15% more likely to be tested than those aged 12 through 17 years, were also 39% more likely to initiate a revisit compared to older children when statistically controlling for other covariates. This perhaps suggests longer illness, wrong diagnosis, delay in appropriate treatment, or more caution by parents and providers in this age group. Justification for testing children less than 3 years of age who are outside of the HEDIS suggested age group, when clinical judgement does not point to another infection source, can result in positivity rates between 22% and 30% as previously observed.22,23 Patients visiting nonphysician providers and outpatient facility providers were less likely to have a revisit than those visiting primary and specialty care physicians, though slightly higher propensity for antibiotic prescriptions was seen for nonphysician providers. Pediatricians have been noted to be less likely to prescribe antibiotics without GAS testing than nonpediatric providers, and more guidelines-compliant in prescribing.24
Recommendations to not test children under 3 years of age are based on the lack of acute rheumatic fever and other complications in this age group together with more frequent viral syndromes. Selectivity in applying clinical criteria to testing can be attempted to separate bacterial from viral illness. Postnasal drainage/rhinorrhea, hoarse voice, and cough have been used successfully to identify those with viral illness and less need for testing, with greater certainty of low risk for GABHS in those over 11 years of age without tonsillar exudates, cervical adenopathy, or fever.17 However, the marginal benefits of those who have all 3 features of viral illness versus none in identifying GAS positivity was 23.3% vs 37.6% - helpful, but certainly not diminishing the need for testing. These constitutional findings of viral URI also do not exclude the GAS carrier state that features these symptoms.25 Others have reinforced the doubt of pharyngeal exudates as the premier diagnostic finding for test-positive GAS.26
This study had several limitations. The Optum claims dataset only contains ICD-9 codes for diagnoses. It does not include data on infection severity and clinical findings related to symptoms, thus empiric treatment warranted based in clinical severity is not assessed. Antibiotics are commonly available as generics and very inexpensive. Patients may fill and pay for these prescriptions directly, in which case, a claim for payment may not be filed with Optum. This could result in an undercount of treated patients in our study.
There is no corresponding problem of missing medical claims for GAS testing which were obtained from the CPT codes within the Optum claims data set. However, we elected not to verify the test results due to these data being missing for 75% of the study population. Nevertheless, this study’s focus was less about justifying antibiotic treatment, but dealt with the outcomes generated by testing and treatment. Toward that end, we used CPT codes to identify a revisit, and while those can at times be affected by financial reimbursement incentives, differences related to revisits in the 4 patient groups should not be subject to bias.
Conclusion
This study used data from real world practices to document the patterns of GAS testing and antibiotic use in pediatric pharyngitis patients. Revisit rates were under 5% for all patient groups and the use of rapid diagnostic tools were found to be the determining factor in further reducing the risk of revisits. This supports the need for compliance with the HEDIS quality metric for pharyngitis to the recommended levels of rapid testing which have been falling in recent years. Use of more accurate antigen and newer molecular detection testing methods may help further delineate important factors in determining pediatric pharyngitis treatment and need for revisits.27
Corresponding author: Jeffrey McCombs, MD, University of Southern California School of Pharmacy, Department of Pharmaceutical and Health Economics, Leonard D. Schaeffer Center for Health Policy & Economics, 635 Downey Way, Verna & Peter Dauterive Hall 310, Los Angeles, CA 90089-3333; [email protected].
Financial disclosures: None.
1. Choby BA. Diagnosis and treatment of streptococcal pharyngitis. Am Fam Physician. 2009;79(5):383-390.
2. Briel M, Schuetz P, Mueller B, et al. Procalcitonin-guided antibiotic use vs a standard approach for acute respiratory tract infections in primary care. Arch of Intern Med. 2008;168(18):2000-2008. doi: 10.1001/archinte.168.18.2000
3. Maltezou HC, Tsagris V, Antoniadou A, et al. Evaluation of a rapid antigen detection test in the diagnosis of streptococcal pharyngitis in children and its impact on antibiotic prescription. J Antimicrob Chemother. 2008;62(6):1407-1412. doi: 10.1093/jac/dkn376
4. Neuner JM, Hamel MB, Phillips RS, et al. Diagnosis and management of adults with pharyngitis: a cost-effectiveness analysis. Ann Intern Med. 2003;139(2):113-122. doi:10.7326/0003-4819-139-2-200307150-00011
5. Gerber MA, Baltimore RS, Eaton CB, et al. Prevention of rheumatic fever and diagnosis and treatment of acute Streptococcal pharyngitis: a scientific statement from the American Heart Association Rheumatic Fever, Endocarditis, and Kawasaki Disease Committee of the Council on Cardiovascular Disease in the Young, the Interdisciplinary Council on Functional Genomics and Translational Biology, and the Interdisciplinary Council on Quality of Care and Outcomes Research: endorsed by the American Academy of Pediatrics. Circulation. 2009;119(11):1541-1551. doi: 10.1161/CIRCULATIONAHA.109.191959
6. Gieseker KE, Roe MH, MacKenzie T, Todd JK. Evaluating the American Academy of Pediatrics diagnostic standard for Streptococcus pyogenes pharyngitis: backup culture versus repeat rapid antigen testing. Pediatrics. 2003;111(6):e666-e670. doi: 10.1542/peds.111.6.e666
7. Shapiro DJ, Lindgren CE, Neuman MI, Fine AM. Viral features and testing for Streptococcal pharyngitis. Pediatrics. 2017;139(5):e20163403. doi: 10.1542/peds.2016-3403
8. Shulman ST, Bisno AL, Clegg H, et al. Clinical practice guideline for the diagnosis and management of group A Streptococcal pharyngitis: 2012 update by the Infectious Diseases Society of America. Clin Infect Dis. 2012;55(10):e86–e102. doi: 10.1093/cid/cis629
9. Mangione-Smith R, McGlynn EA, Elliott MN, et al. Parent expectations for antibiotics, physician-parent communication, and satisfaction. Arch Pediatr Adolesc Med. 2001;155(7):800–806. doi: 10.1001/archpedi.155.7.800
10. Appropriate Testing for Children with Pharyngitis. HEDIS Measures and Technical Resources. National Committee for Quality Assurance. Accessed February 12, 2021. https://www.ncqa.org/hedis/measures/appropriate-testing-for-children-with-pharyngitis/
11. Linder JA, Bates DW, Lee GM, Finkelstein JA. Antibiotic treatment of children with sore throat. JAMA. 2005;294(18):2315-2322. doi: 10.1001/jama.294.18.2315
12. Crimmel BL. Health Insurance Coverage and Income Levels for the US Noninstitutionalized Population Under Age 65, 2001. Medical Expenditure Panel Survey, Agency for Healthcare Research and Quality. 2004. https://meps.ahrq.gov/data_files/publications/st40/stat40.pd
13. AHFS/ASHP. American Hospital Formulary Service Drug Information. 2012. AHFS drug information. 00--. Accessed January 4, 2021.
14. Mainous AG 3rd, Zoorob, RJ, Kohrs FP, Hagen MD. Streptococcal diagnostic testing and antibiotics prescribed for pediatric tonsillopharyngitis. Pediatr Infect Dis J. 1996;15(9):806-810. doi: 10.1097/00006454-199609000-00014
15. Benin AL, Vitkauskas G, Thornquist E, et al. Improving diagnostic testing and reducing overuse of antibiotics for children with pharyngitis: a useful role for the electronic medical record. Pediatr Infect Dis J. 2003;22(12):1043-1047. doi: 10.1097/01.inf.0000100577.76542.af
16. Luo R, Sickler J, Vahidnia F, et al. Diagnosis and Management of Group a Streptococcal Pharyngitis in the United States, 2011-2015. BMC Infect Dis. 2019;19(1):193-201. doi: 10.1186/s12879-019-3835-4
17. Shapiro DJ, Barak-Corren Y, Neuman MI, et al. Identifying Patients at Lowest Risk for Streptococcal Pharyngitis: A National Validation Study. J Pediatr. 2020;220:132-138.e2. doi: 10.1016/j.jpeds.2020.01.030. Epub 2020 Feb 14
18. Shapiro DJ, King LM, Fleming-Dutra KE, et al. Association between use of diagnostic tests and antibiotic prescribing for pharyngitis in the United States. Infect Control Hosp Epidemiol. 2020;41(4):479-481. doi: 10.1017/ice.2020.29
19. Sangha K, Steinberg I, McCombs JS. The impact of antibiotic treatment time and class of antibiotic for acute otitis media infections on the risk of revisits. Abs PDG4. Value in Health. 2019; 22:S163.
20. Ahluwalia T, Jain S, Norton L, Meade J, et al. Reducing Streptococcal Testing in Patients < 3 Years Old in an Emergency Department. Pediatrics. 2019;144(4):e20190174. doi: 10.1542/peds.2019-0174
21. McKay R, Mah A, Law MR, et al. Systematic Review of Factors Associated with Antibiotic Prescribing for Respiratory Tract Infections. Antimicrob Agents Chemother. 2016;60(7):4106-4118. doi: 10.1128/AAC.00209-16
22. Woods WA, Carter CT, Schlager TA. Detection of group A streptococci in children under 3 years of age with pharyngitis. Pediatr Emerg Care. 1999;15(5):338-340. doi: 10.1097/00006565-199910000-00011
23. Mendes N, Miguéis C, Lindo J, et al. Retrospective study of group A Streptococcus oropharyngeal infection diagnosis using a rapid antigenic detection test in a paediatric population from the central region of Portugal. Eur J Clin Microbiol Infect Dis. 2021;40(6):1235-1243. doi: 10.1007/s10096-021-04157-x
24. Frost HM, McLean HQ, Chow BDW. Variability in Antibiotic Prescribing for Upper Respiratory Illnesses by Provider Specialty. J Pediatr. 2018;203:76-85.e8. doi: 10.1016/j.jpeds.2018.07.044.
25. Rick AM, Zaheer HA, Martin JM. Clinical Features of Group A Streptococcus in Children With Pharyngitis: Carriers versus Acute Infection. Pediatr Infect Dis J. 2020;39(6):483-488. doi: 10.1097/INF.0000000000002602
26. Nadeau NL, Fine AM, Kimia A. Improving the prediction of streptococcal pharyngitis; time to move past exudate alone [published online ahead of print, 2020 Aug 16]. Am J Emerg Med. 2020;S0735-6757(20)30709-9. doi: 10.1016/j.ajem.2020.08.023
27. Mustafa Z, Ghaffari M. Diagnostic Methods, Clinical Guidelines, and Antibiotic Treatment for Group A Streptococcal Pharyngitis: A Narrative Review. Front Cell Infect Microbiol. 2020;10:563627. doi: 10.3389/fcimb.2020.563627
Cost Comparison of 2 Video Laryngoscopes in a Large Academic Center
From the Department of Anesthesiology, Thomas Jefferson University and Hospitals, Sidney Kimmel Medical College, Philadelphia, PA, and Sidney Kimmel Medical College at Thomas Jefferson University, Philadelphia, PA.
Objective: Retrospective study examining hospital cost information of patients requiring endotracheal intubation with video laryngoscopy. Provide a practical cost assessment on use of the McGRATH and GlideScope video laryngoscopes (VLs).
Methods: This study examined 52 hospital locations within a single, large university hospital, with most of those locations being hospital operating rooms. A total of 34 600 endotracheal intubations performed over 24 months, of which 11 345 were video laryngoscopies. Electronic medical records containing demographic data and information related to endotracheal intubation procedures, with monthly breakdowns between GlideScope and McGRATH intubations, were reviewed. Cost information calculated for equipment, blades, batteries, repairs, and subsequent analysis performed to determine cost differences between those 2 instruments during the COVID-19 period.
Results: A total of 5501 video laryngoscopy procedures were performed using the McGRATH VL and 5305 were performed using the GlideScope VL. Costs over 24 months were $181 093 lower (55.5%) for McGRATH compared to GlideScope. The mean (SD) monthly costs for GlideScope blades were $3837 ($1050) and $3236 ($538) for years 1 and 2, respectively, vs $1652 ($663) and $2933 ($585) for McGRATH blades (P < .001). Most total cost differences were attributed to equipment and blade purchases, which were $202 595 (65.0%) higher for GlideScope. During the COVID-19 period, the use of the McGRATH increased to 61% of all video laryngoscopy cases, compared to 37% for GlideScope (P < .001). Blade cost difference for the COVID-19 period was $128 higher for the McGRATH even though 293 more intubations were performed with that device.
Conclusions: Use of the McGRATH resulted in a cost savings of 55% compared to the GlideScope, and its use was highest during the COVID-19 period, which may be explained by its more portable and practical features.
Keywords: video laryngoscope; McGRATH; GlideScope; endotracheal intubation; hospital costs; COVID-19.
Hospitals have come to rely on video laryngoscopes (VLs) for tracheal intubation as necessary tools for better visualization of airways. Modern video laryngoscopy developed in the 2000s1 as a progression from direct laryngoscopy, which began in 1852 when Horace Green used a bent tongue spatula and sunlight to examine a child.2 VLs have seen many improvements and adaptations of their own, resulting in many different styles and types circulating around hospitals. The GlideScope (Verathon Inc, Bothell, WA) and the McGRATH (Medtronic, Minneapolis, MN) are examples of such instruments, which are now widely used in the US and are the 2 VLs of choice at our institution.
A few studies have compared VLs to direct laryngoscopes. In their systematic review, Lewis et al have shown the numerous benefits of using a VL over a direct laryngoscope. Some general conclusions were that the use of video laryngoscopy reduced the number of failed intubations, decreased laryngeal trauma, and provided improved visualizations.3 Other studies have compared the different types of VLs, including the McGRATH and the GlideScope, examining factors such as intubation time and display quality of the image. Two studies found that medical students were equally successful at using both the McGRATH and the GlideScope,4,5 while another study found that care providers using the GlideScope had quicker intubation times.6 Lastly, Savoldelli et al concluded that more providers preferred the McGRATH, which provided better laryngeal views,7 while their subsequent study showed more favorable learning curves of the Airtraq compared to the McGRATH and other VLs.8
Although there have been no reported differences in safety and effectiveness of the McGRATH and GlideScope devices, cost data on the use of these 2 popular laryngoscopes are lacking. Such information is important considering the increasing costs of medical technologies and the significant financial losses experienced by health care systems due to the COVID-19 crisis. The purpose of this retrospective cohort study was to compare the cost efficiency of the McGRATH MAC and GlideScope Core VLs at a large academic center.
Methods
This retrospective study was performed under exemption from the Thomas Jefferson University Institutional Review Board. The primary data sources consisted of hospital electronic patient records (EPIC) and cost information from the device manufacturers and hospital staff. The electronic patient data were provided by the EPIC Enterprise Analytics Business Intelligence group at Thomas Jefferson University Hospital (Center City Campus, Philadelphia, PA), while device costs were obtained from Verathon, Medtronic, and departmental staff responsible for purchasing equipment. Monthly data were obtained over a 24-month period (June 2018 through May 2020) when the McGRATH VL was placed into use in the department of anesthesiology. The 2 types of VLs were made available for use in a total of 52 locations, with the majority being hospital operating rooms.
The following variables were recorded: number of endotracheal intubations performed each month with breakdown between video laryngoscopy and flexible bronchoscopy airways, frequency of use for each type of laryngoscope, blades used, and equipment costs for use of each laryngoscope. Hospital cost estimates for both the McGRATH and GlideScope laryngoscopes included batteries, handles, blades, and the devices themselves. Cost data were also collected on frequency of device failure, maintenance, and replacement of parts and lost equipment.
Analysis
De-identified electronic medical records consisted of nominal and quantitative variables, with demographic data and information related to the endotracheal intubation procedure. All data were in chronological order and sorted by date after which coding was applied, to identify device type and allocate pertinent cost information. Descriptive statistics were reported as mean (SD) and sum for costs; frequency tables were generated for intubation procedures according to device type and time periods. Data were analyzed using the χ2 test, the student t test, and the Wilcoxon Mann-Whitney U test, with a P value set at .05 for statistical significance. SPSS version 26 and GraphPad Prism version 6 were used for all statistical analyses.
Results
A total of 34 600 endotracheal intubations were performed over the 24-month study period, and 11 345 (32.8%) were video laryngoscopy procedures. Out of all video laryngoscopy procedures, 5501 (48.5%) were performed using the McGRATH VL and 5305 (46.8%) were conducted using the GlideScope VL. The difference of 539 (4.8%) cases accounts for flexible bronchoscopy procedures and endotracheal intubations using other video laryngoscopy equipment. The mean (SD) monthly number of video laryngoscopy procedures for the 24 months was 221 (54) and 229 (89) for the GlideScope and McGRATH devices, respectively. Monthly endotracheal intubation distributions over 24 months trended upward for the McGRATH VL and downward for the GlideScope, but there was no statistically significant (P = .71) difference in overall use between the 2 instruments (Figure 1).
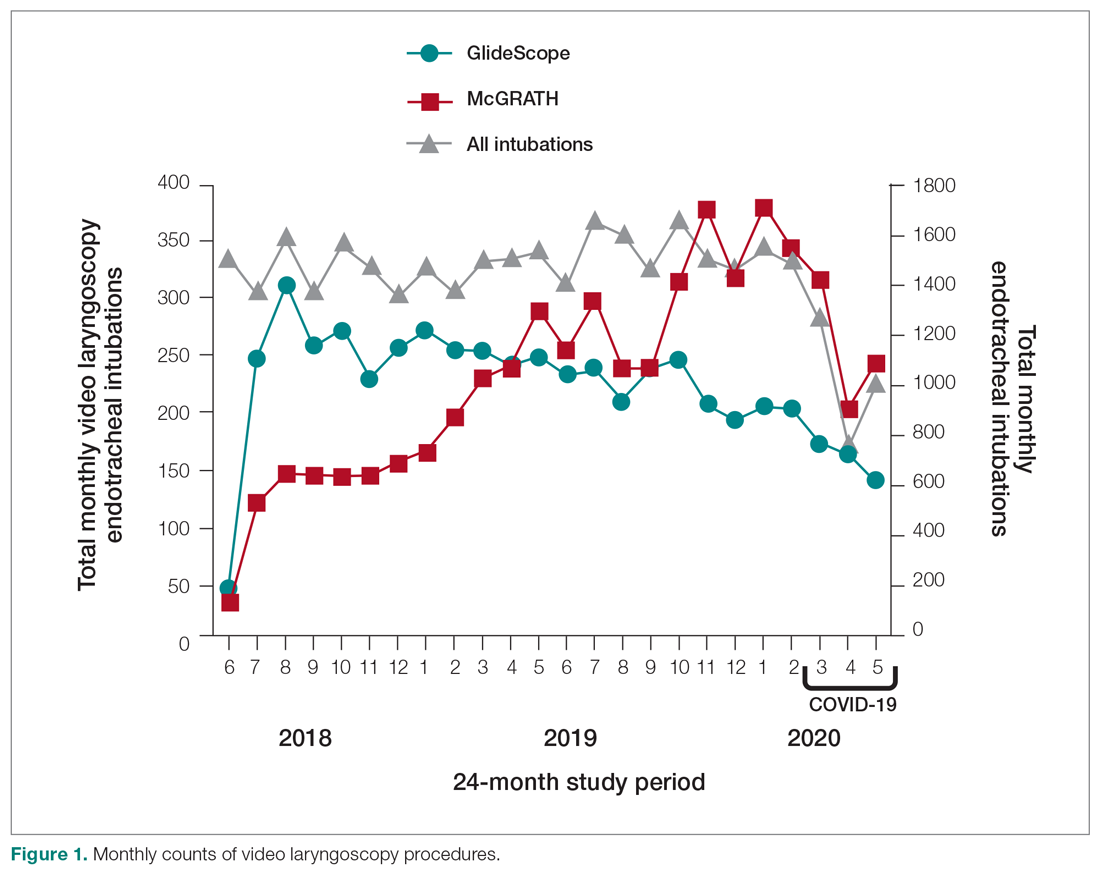
To examine the observed usage trends between the 2 VL during the first and last 12 months, a univariate ANOVA was conducted with the 2 time periods entered as predictors in the model. Video laryngoscopy intubations were performed (P = .001) more frequently with the GlideScope during the first 12 months; however, use of the McGRATH VL increased (P < .001) during the following 12 months compared to GlideScope. The GlideScope accounted for 54% of all VL intubations during the first 12 months, with the McGRATH accounting for 58% of all video laryngoscopy procedures for months 12 to 24. Additionally, the increase in video laryngoscopy procedures with the McGRATH during the last 3 months of the study period was despite an overall reduction in surgical volume due to the COVID-19 crisis, defined for this study as March 1, 2020, to May 31, 2020 (Figure 1). There was a statistically significant (P < .001) difference in the case distribution between use of the McGRATH and GlideScope VL for that period. The anesthesia personnel’s use of the McGRATH VL increased to 61% of all video laryngoscopy cases, compared to 37% for the GlideScope (Figure 2).
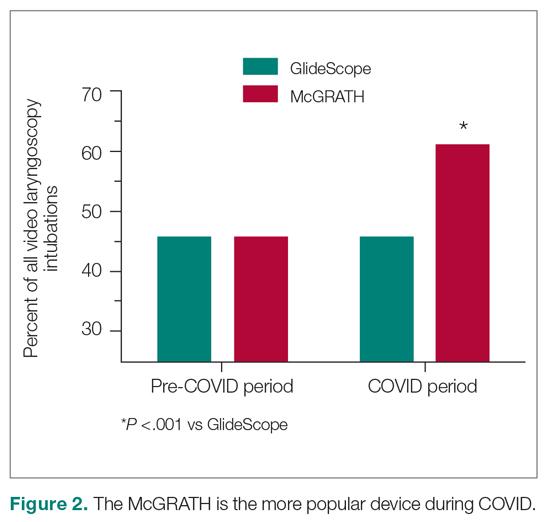
The total costs calculated for equipment, blades, and repairs are presented in Table 1 and yearly total costs are shown in Figure 3. Overall costs were $181 093 lower (55.5%) for the McGRATH VL compared to the GlideScope over the 24-month period. The mean (SD) monthly costs for GlideScope VL blades were $3837 ($1050) and $3236 ($538) for years 1 and 2, respectively, vs $1652 ($663) and $2933 ($585) for the McGRATH VL blades. Most of the total cost differences were attributed to equipment and blade purchases, which were $202 595 (65.0%) higher for the GlideScope compared to the McGRATH VL. The monthly blade costs alone were higher (P < .001) for the GlideScope over the 2-year period; however, the McGRATH VL required use of disposable stylets at a cost of $10 177 for all endotracheal intubations, compared to $700 for the GlideScope device.
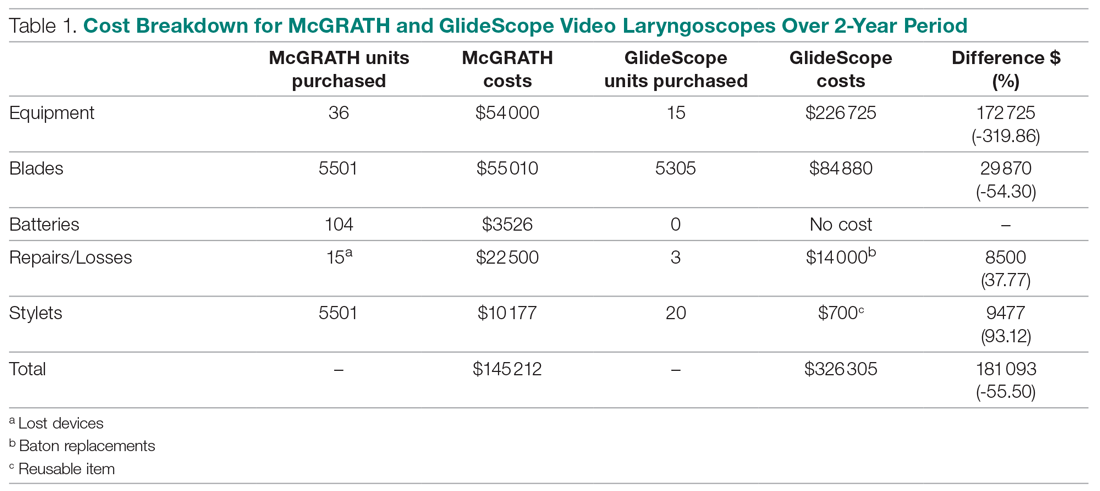
An analysis was performed to determine whether costs differed between those 2 instruments during the COVID-19 period. There was a statistically significant (P < .001) difference in the case distribution between use of the McGRATH and GlideScope VLs during that period. The calculated blade cost difference for the COVID period was $128 higher for the McGRATH even though 293 more intubations were performed with that device (Table 2).
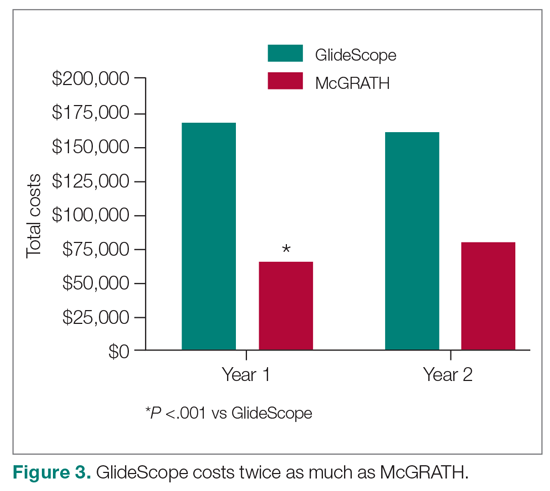
Discussion
We attempted to provide useful cost estimates by presenting pricing data reflecting the approximate cost that most large institutional anesthesia practices would incur for using those 2 specific devices and related peripherals. The main findings of our analysis showed that use of the McGRATH MAC VL resulted in a 55% cost savings compared to the GlideScope, with a similar number of cases performed with each device over the 24-month study period. We believe this represents a substantial savings to the department and institution, which has prompted internal review on the use of video laryngoscopy equipment. None of the McGRATH units failed; however, the GlideScope required 3 baton replacements.
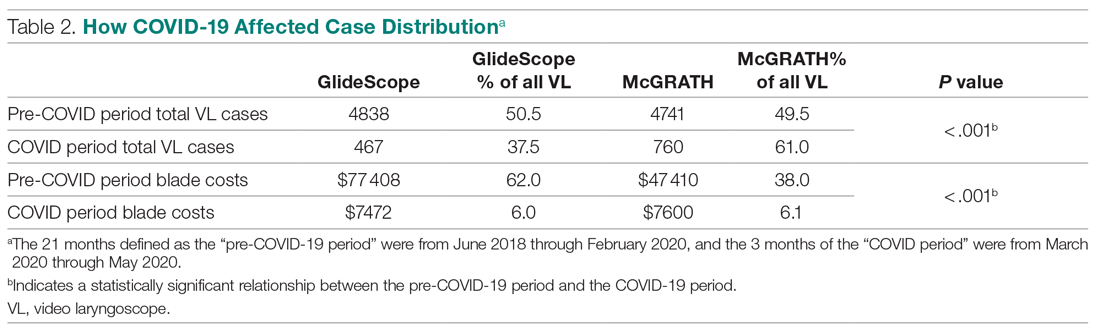
Of note, use of the McGRATH MAC increased during the COVID-19 period, which may be explained by the fact that the operators found it to be a more portable device. Several physicians in the department commented that its smaller size made the McGRATH MAC more practical during the time when a plexiglass box was being used around the patient’s head to shield the intubator from aerosolized viral particles.
Although this study demonstrated the cost-saving value of the McGRATH over the GlideScope, a suggested next step would be to examine resource utilization related to video laryngoscopy use. The more dynamic tracking of the use of these devices should facilitate the assessment of existing related resources and decision making, to optimize the benefits of this initiative. We would anticipate reduced use of anesthesia personnel, such as technicians to assist with the management of this device which could be significant. As new respiratory viruses are appearing each year, video laryngoscopy will continue to gain increasing use in operating rooms and acute care locations. The adding of protective barriers between patients and providers calls for use of the most practical and effective VL devices, to protect personnel who are at high risk of contamination from airway secretions and aerosolized particles.9,10
The COVID-19 pandemic has demonstrated the value of anesthesiology in regards to analyzing and finding solutions to effectively manage infected patients or those suspected of infection in the perioperative environment. Inexpensive products are often avoided because cheaper devices are associated with being of lower quality. However, the association with cost and quality—and the assumption that a higher price is positively correlated with higher quality—is overall inconsistent in the medical literature.11 A more effective or higher quality treatment does not necessarily cost more and may actually end up costing less,12 as was the case in this study. We have been able to directly cut departmental expenses by using a more efficient and cost-effective device for intubations, without compromising safety and efficacy. Future studies should determine whether this significant reduction in costs from video laryngoscopy intubations with the McGRATH VL will be sustained across anesthesiology departments in the Jefferson Health Enterprise Hospitals, or other health systems, as well as its impact on workflow and personnel resources.
This analysis was restricted to one of the campuses of the Jefferson Health Enterprise. However, this is the largest anesthesia practice, encompassing several locations, which should reflect the general practice patterns across other anesthesiology departments in this large institution. The costs for the devices and peripherals may vary across anesthesia practices depending on volume and contracts negotiated with the suppliers. It was not possible to estimate this variability, which could change the total costs by a few percentage points. We recognize that there may be other costs associated with securing the McGRATH VL to prevent loss from theft or misplacement, which were not included in the study. Lastly, the inability to obtain randomized samples for the 2 groups treated with each device opens up the possibility of selection bias. There were, however, multiple intubators who were free to select 1 of the devices for endotracheal intubation, which may have reduced the effect of selection bias.
Conclusion
This study demonstrated that over a 24-month period use of the McGRATH MAC VL resulted in a cost reduction of around 55% compared to using the GlideScope for endotracheal intubation procedures performed at a major academic center. Over the first 3 months of the COVID-19 crisis, which our study included, use of the McGRATH VL increased while GlideScope use decreased. This was most likely related to the portability and smaller size of the McGRATH, which better facilitated intubations of COVID-19 patients.
Acknowledgements: The authors thank Craig Smith, Senior Anesthesia Technician, for his assistance with the cost information and excellent record-keeping related to the use of video laryngoscopes.
Corresponding author: Marc C. Torjman, PhD, Professor, Department of Anesthesiology, Sidney Kimmel Medical College at Thomas Jefferson University, 111 South 11th St, Suite G-8290, Philadelphia, PA 19107; [email protected].
Financial disclosures: Dr. Thaler has served as a consultant for Medtronic since September 2020. He has participated in 2 webinars on the routine use of video laryngoscopy.
Funding: This study was supported by the Department of Anesthesiology at Thomas Jefferson University.
1. Channa AB. Video laryngoscopes. Saudi J Anaesth. 2011;5(4):357-359.
2. Pieters BM, Eindhoven GB, Acott C, Van Zundert AAJ. Pioneers of laryngoscopy: indirect, direct and video laryngoscopy. Anaesth Intensive Care. 2015;43(suppl):4-11.
3. Lewis SR, Butler AR, Parker J, et al. Videolaryngoscopy versus direct laryngoscopy for adult patients requiring tracheal intubation. Cochrane Database Syst Rev. 2016;11(11):CD011136.
4. Kim W, Choi HJ, Lim T, Kang BS. Can the new McGrath laryngoscope rival the GlideScope Ranger portable video laryngoscope? A randomized manikin study. Am J Emerg Med. 2014;32(10):1225-1229.
5. Kim W, Choi HJ, Lim T, et al. Is McGrath MAC better than Glidescope Ranger for novice providers in the simulated difficult airway? A randomized manikin study. Resuscitation. 2014;85(suppl 1):S32.
6. Jeon WJ, Kim KH, Yeom JH, et al. A comparison of the Glidescope to the McGrath videolaryngoscope in patients. Korean J Anesthesiol. 2011;61(1):19-23.
7. Savoldelli GL, Schiffer E, Abegg C, et al. Comparison of the Glidescope, the McGrath, the Airtraq and the Macintosh laryngoscopes in simulated difficult airways. Anaesthesia. 2008;63(12):1358-1364.
8. Savoldelli GL, Schiffer E, Abegg C, et al. Learning curves of the Glidescope, the McGrath and the Airtraq laryngoscopes: a manikin study. Eur J Anaesthesiol. 2009;26(7):554-558.
9. Schumacher J, Arlidge J, Dudley D, et al. The impact of respiratory protective equipment on difficult airway management: a randomised, crossover, simulation study. Anaesthesia. 2020;75(10):1301-1306.
10. De Jong A, Pardo E, Rolle A, et al. Airway management for COVID-19: a move towards universal videolaryngoscope? Lancet Respir Med. 2020;8(6):555.
11. Hussey PS, Wertheimer S, Mehrotra A. The association between health care quality and cost: a systematic review. Ann Intern Med. 2013;158(1):27-34.
12. Mitton C, Dionne F, Peacock S, Sheps S. Quality and cost in healthcare: a relationship worth examining. Appl Health Econ Health Policy. 2006;5(4):201-208.
From the Department of Anesthesiology, Thomas Jefferson University and Hospitals, Sidney Kimmel Medical College, Philadelphia, PA, and Sidney Kimmel Medical College at Thomas Jefferson University, Philadelphia, PA.
Objective: Retrospective study examining hospital cost information of patients requiring endotracheal intubation with video laryngoscopy. Provide a practical cost assessment on use of the McGRATH and GlideScope video laryngoscopes (VLs).
Methods: This study examined 52 hospital locations within a single, large university hospital, with most of those locations being hospital operating rooms. A total of 34 600 endotracheal intubations performed over 24 months, of which 11 345 were video laryngoscopies. Electronic medical records containing demographic data and information related to endotracheal intubation procedures, with monthly breakdowns between GlideScope and McGRATH intubations, were reviewed. Cost information calculated for equipment, blades, batteries, repairs, and subsequent analysis performed to determine cost differences between those 2 instruments during the COVID-19 period.
Results: A total of 5501 video laryngoscopy procedures were performed using the McGRATH VL and 5305 were performed using the GlideScope VL. Costs over 24 months were $181 093 lower (55.5%) for McGRATH compared to GlideScope. The mean (SD) monthly costs for GlideScope blades were $3837 ($1050) and $3236 ($538) for years 1 and 2, respectively, vs $1652 ($663) and $2933 ($585) for McGRATH blades (P < .001). Most total cost differences were attributed to equipment and blade purchases, which were $202 595 (65.0%) higher for GlideScope. During the COVID-19 period, the use of the McGRATH increased to 61% of all video laryngoscopy cases, compared to 37% for GlideScope (P < .001). Blade cost difference for the COVID-19 period was $128 higher for the McGRATH even though 293 more intubations were performed with that device.
Conclusions: Use of the McGRATH resulted in a cost savings of 55% compared to the GlideScope, and its use was highest during the COVID-19 period, which may be explained by its more portable and practical features.
Keywords: video laryngoscope; McGRATH; GlideScope; endotracheal intubation; hospital costs; COVID-19.
Hospitals have come to rely on video laryngoscopes (VLs) for tracheal intubation as necessary tools for better visualization of airways. Modern video laryngoscopy developed in the 2000s1 as a progression from direct laryngoscopy, which began in 1852 when Horace Green used a bent tongue spatula and sunlight to examine a child.2 VLs have seen many improvements and adaptations of their own, resulting in many different styles and types circulating around hospitals. The GlideScope (Verathon Inc, Bothell, WA) and the McGRATH (Medtronic, Minneapolis, MN) are examples of such instruments, which are now widely used in the US and are the 2 VLs of choice at our institution.
A few studies have compared VLs to direct laryngoscopes. In their systematic review, Lewis et al have shown the numerous benefits of using a VL over a direct laryngoscope. Some general conclusions were that the use of video laryngoscopy reduced the number of failed intubations, decreased laryngeal trauma, and provided improved visualizations.3 Other studies have compared the different types of VLs, including the McGRATH and the GlideScope, examining factors such as intubation time and display quality of the image. Two studies found that medical students were equally successful at using both the McGRATH and the GlideScope,4,5 while another study found that care providers using the GlideScope had quicker intubation times.6 Lastly, Savoldelli et al concluded that more providers preferred the McGRATH, which provided better laryngeal views,7 while their subsequent study showed more favorable learning curves of the Airtraq compared to the McGRATH and other VLs.8
Although there have been no reported differences in safety and effectiveness of the McGRATH and GlideScope devices, cost data on the use of these 2 popular laryngoscopes are lacking. Such information is important considering the increasing costs of medical technologies and the significant financial losses experienced by health care systems due to the COVID-19 crisis. The purpose of this retrospective cohort study was to compare the cost efficiency of the McGRATH MAC and GlideScope Core VLs at a large academic center.
Methods
This retrospective study was performed under exemption from the Thomas Jefferson University Institutional Review Board. The primary data sources consisted of hospital electronic patient records (EPIC) and cost information from the device manufacturers and hospital staff. The electronic patient data were provided by the EPIC Enterprise Analytics Business Intelligence group at Thomas Jefferson University Hospital (Center City Campus, Philadelphia, PA), while device costs were obtained from Verathon, Medtronic, and departmental staff responsible for purchasing equipment. Monthly data were obtained over a 24-month period (June 2018 through May 2020) when the McGRATH VL was placed into use in the department of anesthesiology. The 2 types of VLs were made available for use in a total of 52 locations, with the majority being hospital operating rooms.
The following variables were recorded: number of endotracheal intubations performed each month with breakdown between video laryngoscopy and flexible bronchoscopy airways, frequency of use for each type of laryngoscope, blades used, and equipment costs for use of each laryngoscope. Hospital cost estimates for both the McGRATH and GlideScope laryngoscopes included batteries, handles, blades, and the devices themselves. Cost data were also collected on frequency of device failure, maintenance, and replacement of parts and lost equipment.
Analysis
De-identified electronic medical records consisted of nominal and quantitative variables, with demographic data and information related to the endotracheal intubation procedure. All data were in chronological order and sorted by date after which coding was applied, to identify device type and allocate pertinent cost information. Descriptive statistics were reported as mean (SD) and sum for costs; frequency tables were generated for intubation procedures according to device type and time periods. Data were analyzed using the χ2 test, the student t test, and the Wilcoxon Mann-Whitney U test, with a P value set at .05 for statistical significance. SPSS version 26 and GraphPad Prism version 6 were used for all statistical analyses.
Results
A total of 34 600 endotracheal intubations were performed over the 24-month study period, and 11 345 (32.8%) were video laryngoscopy procedures. Out of all video laryngoscopy procedures, 5501 (48.5%) were performed using the McGRATH VL and 5305 (46.8%) were conducted using the GlideScope VL. The difference of 539 (4.8%) cases accounts for flexible bronchoscopy procedures and endotracheal intubations using other video laryngoscopy equipment. The mean (SD) monthly number of video laryngoscopy procedures for the 24 months was 221 (54) and 229 (89) for the GlideScope and McGRATH devices, respectively. Monthly endotracheal intubation distributions over 24 months trended upward for the McGRATH VL and downward for the GlideScope, but there was no statistically significant (P = .71) difference in overall use between the 2 instruments (Figure 1).
To examine the observed usage trends between the 2 VL during the first and last 12 months, a univariate ANOVA was conducted with the 2 time periods entered as predictors in the model. Video laryngoscopy intubations were performed (P = .001) more frequently with the GlideScope during the first 12 months; however, use of the McGRATH VL increased (P < .001) during the following 12 months compared to GlideScope. The GlideScope accounted for 54% of all VL intubations during the first 12 months, with the McGRATH accounting for 58% of all video laryngoscopy procedures for months 12 to 24. Additionally, the increase in video laryngoscopy procedures with the McGRATH during the last 3 months of the study period was despite an overall reduction in surgical volume due to the COVID-19 crisis, defined for this study as March 1, 2020, to May 31, 2020 (Figure 1). There was a statistically significant (P < .001) difference in the case distribution between use of the McGRATH and GlideScope VL for that period. The anesthesia personnel’s use of the McGRATH VL increased to 61% of all video laryngoscopy cases, compared to 37% for the GlideScope (Figure 2).
The total costs calculated for equipment, blades, and repairs are presented in Table 1 and yearly total costs are shown in Figure 3. Overall costs were $181 093 lower (55.5%) for the McGRATH VL compared to the GlideScope over the 24-month period. The mean (SD) monthly costs for GlideScope VL blades were $3837 ($1050) and $3236 ($538) for years 1 and 2, respectively, vs $1652 ($663) and $2933 ($585) for the McGRATH VL blades. Most of the total cost differences were attributed to equipment and blade purchases, which were $202 595 (65.0%) higher for the GlideScope compared to the McGRATH VL. The monthly blade costs alone were higher (P < .001) for the GlideScope over the 2-year period; however, the McGRATH VL required use of disposable stylets at a cost of $10 177 for all endotracheal intubations, compared to $700 for the GlideScope device.
An analysis was performed to determine whether costs differed between those 2 instruments during the COVID-19 period. There was a statistically significant (P < .001) difference in the case distribution between use of the McGRATH and GlideScope VLs during that period. The calculated blade cost difference for the COVID period was $128 higher for the McGRATH even though 293 more intubations were performed with that device (Table 2).
Discussion
We attempted to provide useful cost estimates by presenting pricing data reflecting the approximate cost that most large institutional anesthesia practices would incur for using those 2 specific devices and related peripherals. The main findings of our analysis showed that use of the McGRATH MAC VL resulted in a 55% cost savings compared to the GlideScope, with a similar number of cases performed with each device over the 24-month study period. We believe this represents a substantial savings to the department and institution, which has prompted internal review on the use of video laryngoscopy equipment. None of the McGRATH units failed; however, the GlideScope required 3 baton replacements.
Of note, use of the McGRATH MAC increased during the COVID-19 period, which may be explained by the fact that the operators found it to be a more portable device. Several physicians in the department commented that its smaller size made the McGRATH MAC more practical during the time when a plexiglass box was being used around the patient’s head to shield the intubator from aerosolized viral particles.
Although this study demonstrated the cost-saving value of the McGRATH over the GlideScope, a suggested next step would be to examine resource utilization related to video laryngoscopy use. The more dynamic tracking of the use of these devices should facilitate the assessment of existing related resources and decision making, to optimize the benefits of this initiative. We would anticipate reduced use of anesthesia personnel, such as technicians to assist with the management of this device which could be significant. As new respiratory viruses are appearing each year, video laryngoscopy will continue to gain increasing use in operating rooms and acute care locations. The adding of protective barriers between patients and providers calls for use of the most practical and effective VL devices, to protect personnel who are at high risk of contamination from airway secretions and aerosolized particles.9,10
The COVID-19 pandemic has demonstrated the value of anesthesiology in regards to analyzing and finding solutions to effectively manage infected patients or those suspected of infection in the perioperative environment. Inexpensive products are often avoided because cheaper devices are associated with being of lower quality. However, the association with cost and quality—and the assumption that a higher price is positively correlated with higher quality—is overall inconsistent in the medical literature.11 A more effective or higher quality treatment does not necessarily cost more and may actually end up costing less,12 as was the case in this study. We have been able to directly cut departmental expenses by using a more efficient and cost-effective device for intubations, without compromising safety and efficacy. Future studies should determine whether this significant reduction in costs from video laryngoscopy intubations with the McGRATH VL will be sustained across anesthesiology departments in the Jefferson Health Enterprise Hospitals, or other health systems, as well as its impact on workflow and personnel resources.
This analysis was restricted to one of the campuses of the Jefferson Health Enterprise. However, this is the largest anesthesia practice, encompassing several locations, which should reflect the general practice patterns across other anesthesiology departments in this large institution. The costs for the devices and peripherals may vary across anesthesia practices depending on volume and contracts negotiated with the suppliers. It was not possible to estimate this variability, which could change the total costs by a few percentage points. We recognize that there may be other costs associated with securing the McGRATH VL to prevent loss from theft or misplacement, which were not included in the study. Lastly, the inability to obtain randomized samples for the 2 groups treated with each device opens up the possibility of selection bias. There were, however, multiple intubators who were free to select 1 of the devices for endotracheal intubation, which may have reduced the effect of selection bias.
Conclusion
This study demonstrated that over a 24-month period use of the McGRATH MAC VL resulted in a cost reduction of around 55% compared to using the GlideScope for endotracheal intubation procedures performed at a major academic center. Over the first 3 months of the COVID-19 crisis, which our study included, use of the McGRATH VL increased while GlideScope use decreased. This was most likely related to the portability and smaller size of the McGRATH, which better facilitated intubations of COVID-19 patients.
Acknowledgements: The authors thank Craig Smith, Senior Anesthesia Technician, for his assistance with the cost information and excellent record-keeping related to the use of video laryngoscopes.
Corresponding author: Marc C. Torjman, PhD, Professor, Department of Anesthesiology, Sidney Kimmel Medical College at Thomas Jefferson University, 111 South 11th St, Suite G-8290, Philadelphia, PA 19107; [email protected].
Financial disclosures: Dr. Thaler has served as a consultant for Medtronic since September 2020. He has participated in 2 webinars on the routine use of video laryngoscopy.
Funding: This study was supported by the Department of Anesthesiology at Thomas Jefferson University.
1. Channa AB. Video laryngoscopes. Saudi J Anaesth. 2011;5(4):357-359.
2. Pieters BM, Eindhoven GB, Acott C, Van Zundert AAJ. Pioneers of laryngoscopy: indirect, direct and video laryngoscopy. Anaesth Intensive Care. 2015;43(suppl):4-11.
3. Lewis SR, Butler AR, Parker J, et al. Videolaryngoscopy versus direct laryngoscopy for adult patients requiring tracheal intubation. Cochrane Database Syst Rev. 2016;11(11):CD011136.
4. Kim W, Choi HJ, Lim T, Kang BS. Can the new McGrath laryngoscope rival the GlideScope Ranger portable video laryngoscope? A randomized manikin study. Am J Emerg Med. 2014;32(10):1225-1229.
5. Kim W, Choi HJ, Lim T, et al. Is McGrath MAC better than Glidescope Ranger for novice providers in the simulated difficult airway? A randomized manikin study. Resuscitation. 2014;85(suppl 1):S32.
6. Jeon WJ, Kim KH, Yeom JH, et al. A comparison of the Glidescope to the McGrath videolaryngoscope in patients. Korean J Anesthesiol. 2011;61(1):19-23.
7. Savoldelli GL, Schiffer E, Abegg C, et al. Comparison of the Glidescope, the McGrath, the Airtraq and the Macintosh laryngoscopes in simulated difficult airways. Anaesthesia. 2008;63(12):1358-1364.
8. Savoldelli GL, Schiffer E, Abegg C, et al. Learning curves of the Glidescope, the McGrath and the Airtraq laryngoscopes: a manikin study. Eur J Anaesthesiol. 2009;26(7):554-558.
9. Schumacher J, Arlidge J, Dudley D, et al. The impact of respiratory protective equipment on difficult airway management: a randomised, crossover, simulation study. Anaesthesia. 2020;75(10):1301-1306.
10. De Jong A, Pardo E, Rolle A, et al. Airway management for COVID-19: a move towards universal videolaryngoscope? Lancet Respir Med. 2020;8(6):555.
11. Hussey PS, Wertheimer S, Mehrotra A. The association between health care quality and cost: a systematic review. Ann Intern Med. 2013;158(1):27-34.
12. Mitton C, Dionne F, Peacock S, Sheps S. Quality and cost in healthcare: a relationship worth examining. Appl Health Econ Health Policy. 2006;5(4):201-208.
Practical Application of Self-Determination Theory to Achieve a Reduction in Postoperative Hypothermia Rate: A Quality Improvement Project
From Children’s Health System of Texas, Division of Pediatric Anesthesiology, Dallas, TX (Drs. Sakhai, Bocanegra, Chandran, Kimatian, and Kiss), UT Southwestern Medical Center, Department of Anesthesiology and Pain Management, Dallas, TX (Drs. Bocanegra, Chandran, Kimatian, and Kiss), and UT Southwestern Medical Center, Department of Population and Data Sciences, Dallas, TX (Dr. Reisch).
Objective: Policy-driven changes in medical practice have long been the norm. Seldom are changes in clinical practice sought to be brought about by a person’s tendency toward growth or self‐actualization. Many hospitals have instituted hypothermia bundles to help reduce the incidence of unanticipated postoperative hypothermia. Although successful in the short-term, sustained changes are difficult to maintain. We implemented a quality-improvement project focused on addressing the affective components of self-determination theory (SDT) to create sustainable behavioral change while satisfying providers’ basic psychological needs for autonomy, competence, and relatedness.
Methods: A total of 3 Plan-Do-Study-Act (PDSA) cycles were enacted over the span of 14 months at a major tertiary care pediatric hospital to recruit and motivate anesthesia providers and perioperative team members to reduce the percentage of hypothermic postsurgical patients by 50%. As an optional initial incentive for participation, anesthesiologists would qualify for American Board of Anesthesiology Maintenance of Certification in Anesthesiology (MOCA) Part 4 Quality Improvement credits for monitoring their own temperature data and participating in project-related meetings. Providers were given autonomy to develop a personal plan for achieving the desired goals.
Results: The median rate of hypothermia was reduced from 6.9% to 1.6% in July 2019 and was reduced again in July 2020 to 1.3%, an 81% reduction overall. A low hypothermia rate was successfully maintained for at least 21 subsequent months after participants received their MOCA credits in July 2019.
Conclusions: Using an approach that focused on the elements of competency, autonomy, and relatedness central to the principles of SDT, we observed the development of a new culture of vigilance for prevention of hypothermia that successfully endured beyond the project end date.
Keywords: postoperative hypothermia; self-determination theory; motivation; quality improvement.
Perioperative hypothermia, generally accepted as a core temperature less than 36 °C in clinical practice, is a common complication in the pediatric surgical population and is associated with poor postoperative outcomes.1 Hypothermic patients may develop respiratory depression, hypoglycemia, and metabolic acidosis that may lead to decreased oxygen delivery and end organ tissue hypoxia.2-4 Other potential detrimental effects of failing to maintain normal body temperature are impaired clotting factor enzyme function and platelet dysfunction, increasing the risk for postoperative bleeding.5,6 In addition, there are financial implications when hypothermic patients require care and resources postoperatively because of delayed emergence or shivering.7
The American Society of Anesthesiologists recommends intraoperative temperature monitoring for procedures when clinically significant changes in body temperature are anticipated.8 Maintenance of normothermia in the pediatric population is especially challenging owing to a larger skin-surface area compared with body mass ratio and less subcutaneous fat content than in adults. Preventing postoperative hypothermia starts preoperatively with parental education and can be as simple as covering the child with a blanket and setting the preoperative room to an acceptably warm temperature.9,10 Intraoperatively, maintaining operating room (OR) temperatures at or above 21.1 °C and using active warming devices and radiant warmers when appropriate are important techniques to preserve the child’s body temperature.11,12
Despite the knowledge of these risks and vigilant avoidance of hypothermia, unplanned perioperative hypothermia can occur in up to 70% of surgical patients.1 Beyond the clinical benefits, as health care marches toward a value-based payment methodology, quality indicators such as avoiding hypothermia may be linked directly to payment.
Self-determination theory (SDT) was first developed in 1980 by Deci and Ryan.13 The central premise of the theory states that people develop their full potential if circumstances allow them to satisfy their basic psychological needs: autonomy, competence, and relatedness. Under these conditions, people’s natural inclination toward growth can be realized, and they are more likely to internalize external goals. Under an extrinsic reward system, motivation can waver, as people may perceive rewards as controlling.
Many institutions have implemented hypothermia bundles to help decrease the rate of hypothermic patients, but while initially successful, the effectiveness of these interventions tends to fade over time as participants settle into old, comfortable routines.14 With SDT in mind, we designed our quality-improvement (QI) project with interventions to allow clinicians autonomy without instituting rigid guidelines or punitive actions. We aimed to directly address the affective components central to motivation and engagement so that we could bring about long-term meaningful changes in our practice.
Methods
Setting
The hypothermia QI intervention was instituted at a major tertiary care children’s hospital that performs more than 40 000 pediatric general anesthetics annually. Our division of pediatric anesthesiology consists of 66 fellowship-trained pediatric anesthesiologists, 15 or more rotating trainees per month, 13 anesthesiology assistants, 15 anesthesia technicians, and more than 50 perioperative nurses.
The most frequent pediatric surgeries include, but are not limited to, general surgery, otolaryngology, urology, gastroenterology, plastic surgery, neurosurgery, and dentistry. The surgeries are conducted in the hospital’s main operative floor, which consists of 15 ORs and 2 gastroenterology procedure rooms. Although the implementation of the QI project included several operating sites, we focused on collecting temperature data from surgical patients at our main campus recovery unit. We obtained the patients’ initial temperatures upon arrival to the recovery unit from a retrospective electronic health record review of all patients who underwent anesthesia from January 2016 through April 2021.
Postoperative hypothermia was identified as an area of potential improvement after several patients were reported to be hypothermic upon arrival to the recovery unit in the later part of 2018. Further review revealed significant heterogeneity of practices and lack of standardization of patient-warming methods. By comparing the temperatures pre- and postintervention, we could measure the effectiveness of the QI initiative. Prior to the start of our project, the hypothermia rate in our patient population was not actively tracked, and the effectiveness of our variable practice was not measured.
The cutoff for hypothermia for our QI project was defined as body temperature below 36 °C, since this value has been previously used in the literature and is commonly accepted in anesthesia practice as the delineation for hypothermia in patients undergoing general anesthesia.1
Interventions
This QI project was designed and modeled after the Institute for Healthcare Improvement Model for Improvement.15 Three cycles of Plan-Do-Study-Act (PDSA) were developed and instituted over a 14-month period until December 2019 (Table 1).
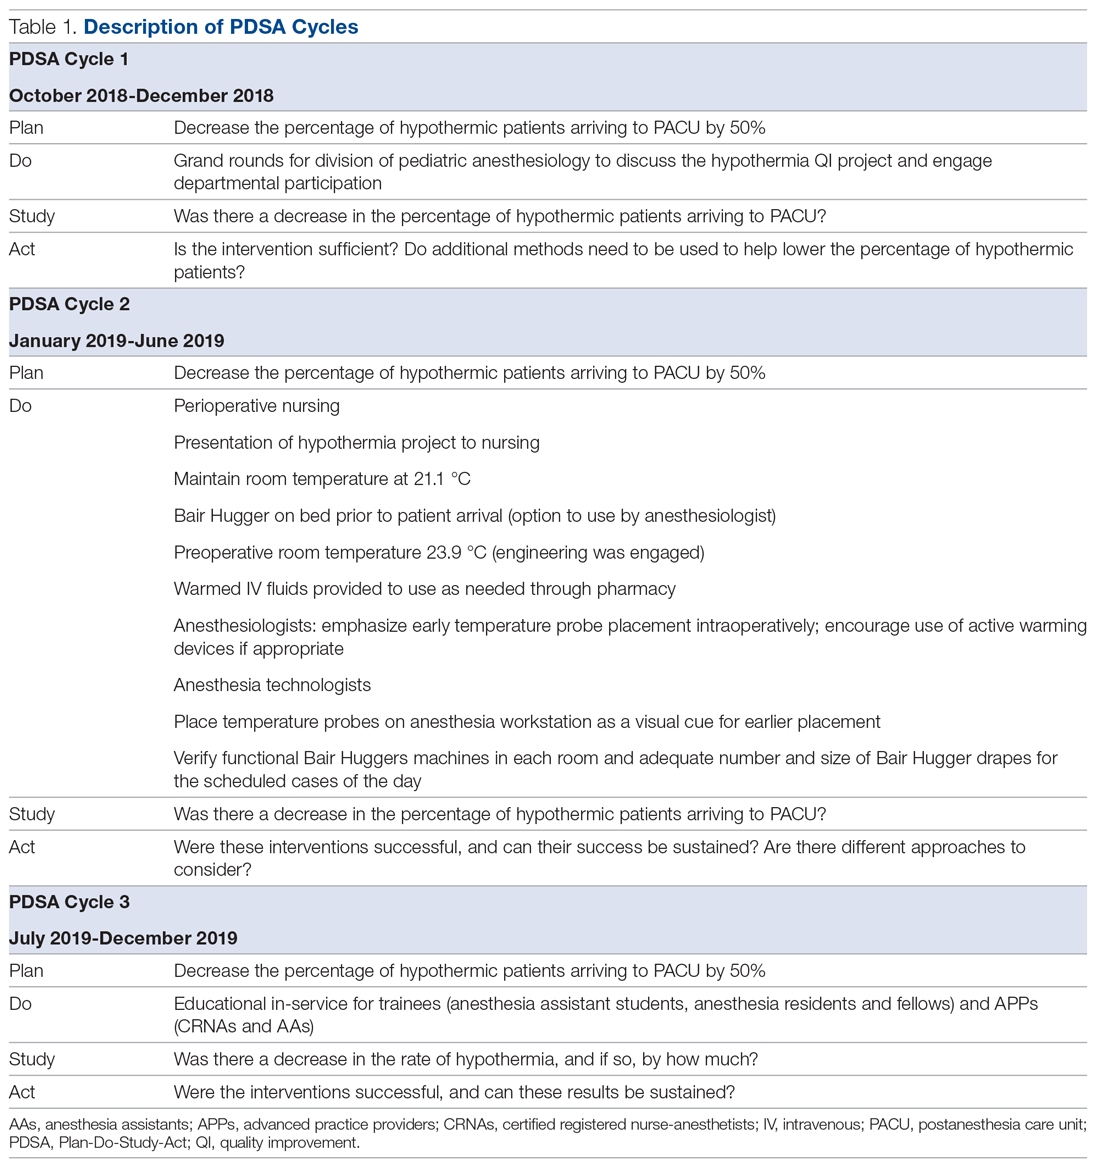
A retrospective review was conducted to determine the percentage of surgical patients arriving to our recovery units with an initial temperature reading of less than 36 °C. A project key driver diagram and smart aim were created and approved by the hospital’s continuing medical education (CME) committee for credit via the American Board of Medical Specialties (ABMS) Multi-Specialty Portfolio Program, Maintenance of Certification in Anesthesiology (MOCA) Part 4.
The first PDSA cycle involved introducing the QI project and sharing the aims of the project at a department grand rounds in the latter part of October 2018. Enrollment to participate in the project was open to all anesthesiologists in the division, and participants could earn up to 20 hours of MOCA Part 4 credits. A spreadsheet was developed and maintained to track each anesthesiologist’s monthly percentage of hypothermic patients. The de-identified patient data were shared with the division via monthly emails. In addition, individual providers with a hypothermic patient in the recovery room received a notification email.
The anesthesiologists participated in the QI project by reviewing their personal percentage of hypothermic patients on an ongoing basis to earn the credit. There was no explicit requirement to decrease their own rate of patients with body temperature less than 36 °C or expectation to achieve a predetermined goal, so the participants could not “fail.”
Because of the large interest in this project, a hypothermia committee was formed that consisted of 36 anesthesiologists. This group reviewed the data and exchanged ideas for improvement in November 2018 as part of the first PDSA cycle. The committee met monthly and was responsible for actively engaging other members of the department and perioperative staff to help in this multidisciplinary effort of combating hypothermia in our surgical pediatric population.
PDSA cycle 2 involved several major initiatives, including direct incorporation of the rest of the perioperative team. The perioperative nursing team was educated on the risks of hypothermia and engaged to take an active role by maintaining the operating suite temperature at 21.1 °C and turning on the Bair Hugger (3M) blanket to 43 °C on the OR bed prior to patient arrival to the OR. Additionally, anesthesia technicians (ATs) were tasked with ensuring an adequate supply of Bair Hugger drapes for all cases of the day. The facility’s engineering team was engaged to move the preoperative room temperature controls away from families (who frequently made the rooms cold) and instead set it at a consistent temperature of 23.9 °C. ATs were also asked to place axillary and nasal temperature probes on the anesthesia workstations as a visual reminder to facilitate temperature monitoring closer to the start of anesthesia (instead of the anesthesia provider having to remember to retrieve a temperature probe out of a drawer and place it on the patient). Furthermore, anesthesiologists were instructed via the aforementioned monthly emails and at monthly department meetings to place the temperature probes as early as possible in order to recognize and respond to intraoperative hypothermia in a timelier manner. Finally, supply chain leaders were informed of our expected increase in the use of the blankets and probes and proportionally increased ordering of these supplies to make sure availability would not present an obstacle.
In PDSA cycle 3, trainees (anesthesia assistant students, anesthesia residents and fellows) and advanced practice providers (APPs) (certified registered nurse-anesthetists [CRNAs] and certified anesthesia assistants [C-AAs]) were informed of the QI project. This initiative was guided toward improving vigilance for hypothermia in the rest of the anesthesia team members. The trainees and APPs usually set up the anesthesia area prior to patient arrival, so their recruitment in support of this effort would ensure appropriate OR temperature, active warming device deployment, and the availability and early placement of the correct temperature probe for the case. To facilitate personal accountability, the trainees and APPs were also emailed their own patients’ rate of hypothermia.
Along the course of the project, quarterly committee meetings and departmental monthly meetings served as venues to express concerns and look for areas of improvement, such as specific patterns or trends leading to hypothermic patients. One specific example was the identification of the gastrointestinal endoscopic patients having a rate of hypothermia that was 2% higher than average. Directed education on the importance of Bair Hugger blankets and using warm intravenous fluids worked well to decrease the rate of hypothermia in these patients. This collection of data was shared at regular intervals during monthly department meetings as well and more frequently using departmental emails. The hospital’s secure intranet SharePoint (Microsoft) site was used to share the data among providers.
Study of the interventions and measures
To study the effectiveness and impact of the project to motivate our anesthesiologists and other team members, we compared the first temperatures obtained in the recovery unit prior to the start of the intervention with those collected after the start of the QI project in November 2018. Because of the variability of temperature monitoring intraoperatively (nasal, axillary, rectal), we decided to use the temperature obtained by the nurse in the recovery room upon the patient’s arrival. Over the years analyzed, the nurse’s technique of measuring the temperature remained consistent. All patient temperature measurements were performed using the TAT-5000 (Exergen Corporation). This temporal artery thermometer has been previously shown to correlate well with bladder temperatures (70% of measurements differ by no more than 0.5 °C, as reported by Langham et al16).
Admittedly, we could not measure the degree of motivation or internalization of the project goals by our cohort, but we could measure the reduction in the rate of hypothermia and subjectively gauge engagement in the project by the various groups of participants and the sustainability of the results. In addition, all participating anesthesiologists received MOCA Part 4 credits in July 2019. We continued our data collection until April 2021 to determine if our project had brought about sustainable changes in practice that would continue past the initial motivator of obtaining CME credit.
Analysis
Data analysis was performed using Excel (Microsoft) and SAS, version 9.4 (SAS Institute).
The median of the monthly percentage of patients with a temperature of less than 36.0 °C was also determined for the preintervention time frame. This served as our baseline hypothermia rate, and we aimed to lower it by 50%. Run charts, a well-described methodology to gauge the effectiveness of the QI project, were constructed with the collected data.17
We performed additional analysis to adjust for different time periods throughout the year. The time period between January 2016 and October 2018 was considered preintervention. We considered November 2018 the start of our intervention, or more specifically, the start of our PDSA cycles. October 2018 was analyzed as part of the preintervention data. To account for seasonal temperature variations, the statistical analysis focused on the comparisons of the same calendar quarters for before and after starting intervention using Wilcoxon Mann-Whitney U tests. To reach an overall conclusion, the probabilities for the 4 quarters were combined for each criterion separately utilizing the Fisher χ2 combined probability method.
The hypothermia QI project was reviewed by the institutional review board and determined to be exempt.
Results
The temperatures of 40 875 patients were available for analysis for the preintervention period between January 2016 and October 2018. The median percentage of patients with temperatures less than 36.0 °C was 6.9% (interquartile range [IQR], 5.8%-8.4%). The highest percentage was in February 2016 (9.9%), and the lowest was in March 2018 (3.4%). Following the start of the first PDSA cycle, the next 6 consecutive rates of hypothermia were below the median preintervention value, and a new median for these percentages was calculated at 3.4% (IQR, 2.6%-4.3%). In July 2019, the proportion of hypothermic patients decreased once more for 6 consecutive months, yielding a new median of 1.6% (IQR, 1.2%-1.8%) and again in July 2020, to yield a median of 1.3% (IQR, 1.2%-1.5%) (Figure). In all, 33 799 patients were analyzed after the start of the project from November 2018 to the end of the data collection period through April 2021.
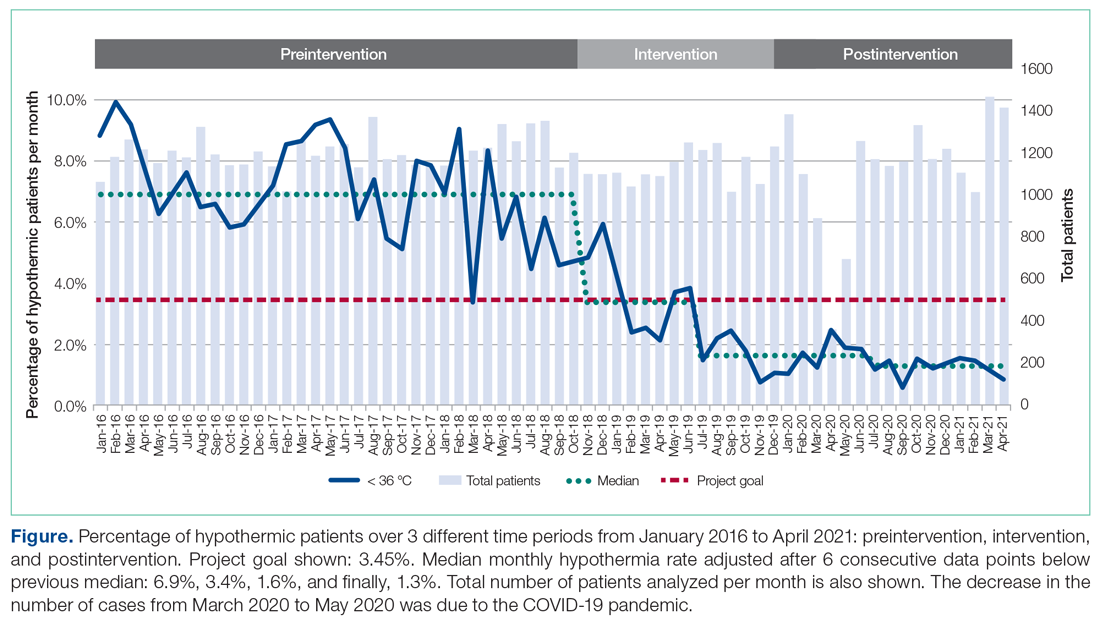
The preintervention monthly rates of hypothermia were compared, quarter to quarter, with those starting in November 2018 using the Wilcoxon Mann-Whitney U test. The decrease in proportion of hypothermic patients after the start of the intervention was statistically significant (P < .001). In addition, the percentage of patients with temperatures greater than 38 °C was not significantly different between the pre- and postintervention time periods (P < .25) (Table 2). The decrease in the number of patients available for analysis from March 2020 to May 2020 was due to the COVID-19 pandemic.
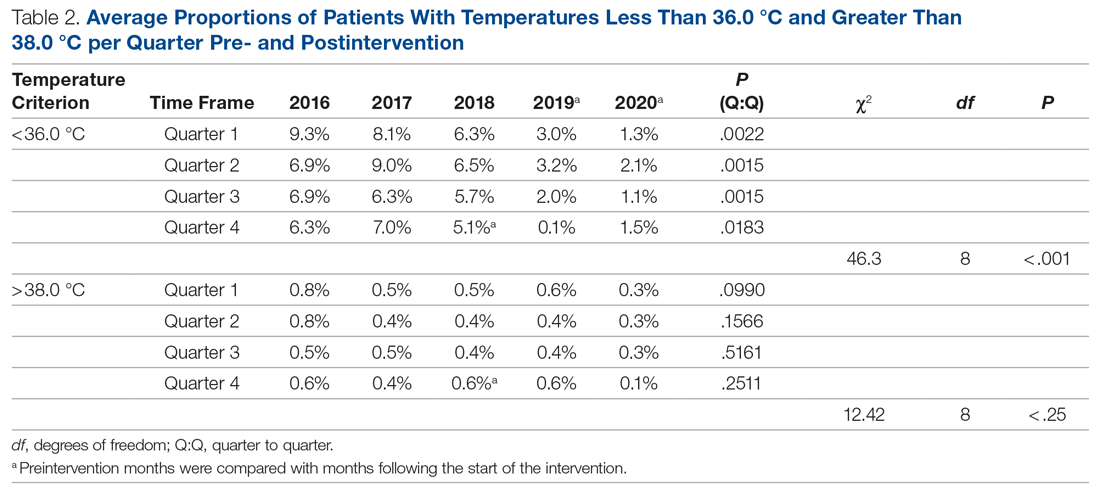
Subjectively, we did not experience any notable resistance to our efforts, and the experience was largely positive for everyone involved. Clinicians identified as having high monthly rates of hypothermia (5% or higher) corrected their numbers the following month after being notified via email or in person.
Discussion
To achieve changes in practice, the health care industry has relied on instituting guidelines, regulations, and policies, often with punitive consequences. We call into question this long-standing framework and propose a novel approach to help evolve the field of QI. Studies in human psychology have long demonstrated the demotivation power of a reward system and the negative response to attempts by authority to use incentives to control or coerce. In our QI project, we instituted 3 PDSA cycles and applied elements from SDT to motivate people’s behaviors. We demonstrate how a new culture focused on maintaining intraoperative normothermia was developed and brought about a measurable and significant decrease in the rate of hypothermia. The relevance of SDT, a widely accepted unifying theory that bridges and links social and personality psychology, should not be understated in health care. Authorities wishing to have long-standing influence should consider a person’s right to make their own decisions and, if possible, a unique way of doing things.
Positively reinforcing behavior has been shown to have a paradoxical effect by dampening an individual’s intrinsic motivation or desire to perform certain tasks.18 Deadlines, surveillance, and authoritative commands are also deterrents.19,20 We focused on providing the tools and information to the clinicians and relied on their innate need for autonomy, growth, and self-actualization to bring about change in clinical practice.21 Group meetings served as a construct for exchanging ideas and to encourage participation, but without the implementation of rigid guidelines or policies. Intraoperative active warming devices and temperature probes were made available, but their use was not mandated. The use of these devices was intentionally not audited to avoid any overbearing control. Providers were, however, given monthly temperature data to help individually assess the effectiveness of their interventions. We did not impose any negative or punitive actions for those clinicians who had high rates of hypothermic patients, and we did not reward those who had low rates of hypothermia. We wanted the participants to feel that the inner self was the source of their behavior, and this was in parallel with their own interests and values. If providers could feel their need for competency could be realized, we hoped they would continue to adhere to the measures we provided to maintain a low rate of hypothermia.
The effectiveness of our efforts was demonstrated by a decrease in the prevalence of postoperative hypothermia in our surgical patients. The initial decrease of the median rate of hypothermia from 6.9% to 3.4% occurred shortly into the start of the first PDSA cycle. The second PDSA cycle started in January 2019 with a multimodal approach and included almost all parties involved in the perioperative care of our surgical patients. Not only was this intervention responsible for a continued downward trend in the percentage of hypothermic patients, but it set the stage for the third and final PDSA cycle, which started in July 2019. The architecture was in place to integrate trainees and APPs to reinforce our initiative. Subsequently, the new median percentage of hypothermic patients was further decreased to an all-time low of 1.6% per month, satisfying and surpassing the goal of the QI project of decreasing the rate of hypothermia by only 50%. Our organization thereafter maintained a monthly hypothermia rate below 2%, except for April 2020, when it reached 2.5%. Our lowest median percentage was obtained after July 2020, reaching 1.3%.
To account for seasonal variations in temperatures and types of surgeries performed, we compared the percentage of hypothermic patients before and after the start of intervention, quarter by quarter. The decrease in the proportion of hypothermic patients after the start of intervention was statistically significant (P < .001). In addition, the data failed to prove any statistical difference for temperatures above 38 °C between the 2 periods, indicating that our interventions did not result in significant overwarming of patients. The clinical implications of decreasing the percentage of hypothermic patients from 6.9% to 1.3% is likely clinically important when considering the large number of patients who undergo surgery at large tertiary care pediatric centers. Even if simple interventions reduce hypothermia in only a handful of patients, routine applications of simple measures to keep patients normothermic is likely best clinical practice.
Anesthesiologists who participated in the hypothermia QI project by tracking the incidence of hypothermia in their patients were able to collect MOCA Part 4 credits in July 2019. There was no requirement for the individual anesthesiologist to reduce the rate of hypothermia or apply any of the encouraged strategies to obtain credit. As previously stated, there were also no rewards for obtaining low hypothermia rates for the providers. The temperature data continued to be collected through April 2021, 21 months after the credits were distributed, to demonstrate a continued, meaningful change, at least in the short-term. While the MOCA Part 4 credits likely served as an initial motivating factor to encourage participation in the QI project, they certainly were not responsible for the sustained low hypothermia rate after July 2019. We showed that the low rate of hypothermia was successfully maintained, indicating that the change in providers’ behavior was independent of the external motivator of obtaining the credit hours. Mere participation in the project by reviewing one’s temperature data was all that was required to obtain the credit. The Organismic Integration Theory, a mini-theory within SDT, best explains this phenomenon by describing any motivated behavior on a continuum ranging from controlled to autonomous.22 Do people perform the task resentfully, on their own volition because they believe it is the correct action, or somewhere in between? We explain the sustained low rates of hypothermia after the MOCA credits were distributed due to a shift to the autonomous end of the continuum with the clinician’s active willingness to meet the challenges and apply intrinsically motivated behaviors to lower the rate of hypothermia. The internalization of external motivators is difficult to prove, but the evidence supports that the methods we used to motivate individuals were effective and have resulted in a significant downward trend in our hypothermia rate.
There are several limitations to our QI project. The first involves the measuring of postoperative temperature in the recovery units. The temperatures were obtained using the same medical-grade infrared thermometer for all the patients, but other variables, such as timing and techniques, were not standardized. Secondly, overall surgical outcomes related to hypothermia were not tracked because we were unable to control for other confounding variables in our large cohort of patients, so we cannot say if the drop in the hypothermia rate had a clinically significant outcome. Thirdly, we propose that SDT offers a compellingly fitting explanation of the psychology of motivation in our efforts, but it may be possible that other theories may offer equally fitting explanations. The ability to measure the degree of motivation is lacking, and we did not explicitly ask participants what their specific source of motivation was. Aside from SDT, the reduction in hypothermia rate could also be attributed to the ease and availability of warming equipment that was made in each OR. This QI project was successfully applied to only 1 institution, so its ability to be widely applicable remains uncertain. In addition, data collection continued during the COVID-19 pandemic when case volumes decreased. However, by June 2020, the number of surgical cases at our institution had largely returned to prepandemic levels. Additional data collection beyond April 2021 would be helpful to determine if the reduction in hypothermia rates is truly sustained.
Conclusion
Overall, the importance of maintaining perioperative normothermia was well disseminated and agreed upon by all departments involved. Despite the limitations of the project, there was a significant reduction in rates of hypothermia, and sustainability of outcomes was consistently demonstrated in the poststudy period.
Using 3 cycles of the PDSA method, we successfully decreased the median rate of postoperative hypothermia in our pediatric surgical population from a preintervention value of 6.9% to 1.3%—a reduction of more than 81.2%. We provided motivation for members of our anesthesiology staff to participate by offering MOCA 2.0 Part 4 credits, but the lower rate of hypothermic patients was maintained for 15 months after the credits were distributed. Over the course of the project, there was a shift in culture, and extra vigilance was given to temperature monitoring and assessment. We attribute this sustained cultural change to the deliberate incorporation of the principles of competency, autonomy, and relatedness central to SDT to the structure of the interventions, avoiding rigid guidelines and pathways in favor of affective engagement to establish intrinsic motivation.
Acknowledgements: The authors thank Joan Reisch, PhD, for her assistance with the statistical analysis.
Corresponding author: Edgar Erold Kiss, MD, 1935 Medical District Dr, Dallas, TX 75235; [email protected].
Financial disclosures: None.
1. Leslie K, Sessler DI. Perioperative hypothermia in the high-risk surgical patient. Best Pract Res Clin Anaesthesiol. 2003;17(4):485-498.
2. Sessler DI. Forced-air warming in infants and children. Paediatr Anaesth. 2013;23(6):467-468.
3. Wetzel RC. Evaluation of children. In: Longnecker DE, Tinker JH, Morgan Jr GE, eds. Principles and Practice of Anesthesiology. 2nd ed. Mosby Publishers; 1999:445-447.
4. Witt L, Dennhardt N, Eich C, et al. Prevention of intraoperative hypothermia in neonates and infants: results of a prospective multicenter observational study with a new forced-air warming system with increased warm air flow. Paediatr Anaesth. 2013;23(6):469-474.
5. Blum R, Cote C. Pediatric equipment. In: Blum R, Cote C, eds. A Practice of Anaesthesia for Infants and Children. Saunders Elsevier; 2009:1099-1101.
6. Doufas AG. Consequences of inadvertent perioperative hypothermia. Best Pract Res Clin Anaesthesiol. 2003;17(4):535-549.
7. Mahoney CB, Odom J. Maintaining intraoperative normothermia: a meta-analysis of outcomes with costs. AANA J. 1999;67(2):155-163.
8. American Society of Anesthesiologists Committee on Standards and Practice Parameters. Standards for Basic Anesthetic Monitoring. Approved by the ASA House of Delegates October 21, 1986; last amended October 20, 2010; last affirmed October 28, 2015.
9. Horn E-P, Bein B, Böhm R, et al. The effect of short time periods of pre-operative warming in the prevention of peri-operative hypothermia. Anaesthesia. 2012;67(6):612-617.
10. Andrzejowski J, Hoyle J, Eapen G, Turnbull D. Effect of prewarming on post-induction core temperature and the incidence of inadvertent perioperative hypothermia in patients undergoing general anaesthesia. Br J Anaesth. 2008;101(5):627-631.
11. Sessler DI. Complications and treatment of mild hypothermia. Anesthesiology. 2001;95(2):531-543.
12. Bräuer A, English MJM, Steinmetz N, et al. Efficacy of forced-air warming systems with full body blankets. Can J Anaesth. 2007;54(1):34-41.
13. Deci EL, Ryan RM. The “what” and “why” of goal pursuits: human needs and the self‐determination of behavior. Psychol Inquiry. 2000;11(4):227-268.
14. Al-Shamari M, Puttha R, Yuen S, et al. G9 Can introduction of a hypothermia bundle reduce hypothermia in the newborns? Arch Dis Childhood. 2019;104(suppl 2):A4.1-A4.
15. Institute for Healthcare Improvement. How to improve. Accessed May 12, 2021. http://www.ihi.org/resources/Pages/HowtoImprove/default.aspx
16. Langham GE, Meheshwari A, You J, et al. Noninvasive temperature monitoring in postanesthesia care units. Anesthesiology. 2009;111(1):90-96.
17. Perla RJ, Provost LP, Murray SK. The run chart: a simple analytical tool for learning from variation in healthcare processes. BMJ Qual Saf. 2011;20(1):46-51.
18. Deci EL. Effects of externally mediated rewards on intrinsic motivation. J Pers Soc Psychol. 1971;18(1):105-115.
19. Deci EL, Koestner R, Ryan RM. A meta-analytic review of experiments examining the effects of extrinsic rewards on intrinsic motivation. Psychol Bull. 1999;125(6):627-668.
20. Deci EL, Koestner R, Ryan RM. The undermining effect is a reality after all—extrinsic rewards, task interest, and self-determination: Reply to Eisenberger, Pierce, and Cameron (1999) and Lepper, Henderlong, and Gingras (1999). Psychol Bull. 1999;125(6):692-700.
21. Maslow A. The Farther Reaches of Human Nature. Viking Press; 1971.
22. Sheldon KM, Prentice M. Self-determination theory as a foundation for personality researchers. J Pers. 2019;87(1):5-14.
From Children’s Health System of Texas, Division of Pediatric Anesthesiology, Dallas, TX (Drs. Sakhai, Bocanegra, Chandran, Kimatian, and Kiss), UT Southwestern Medical Center, Department of Anesthesiology and Pain Management, Dallas, TX (Drs. Bocanegra, Chandran, Kimatian, and Kiss), and UT Southwestern Medical Center, Department of Population and Data Sciences, Dallas, TX (Dr. Reisch).
Objective: Policy-driven changes in medical practice have long been the norm. Seldom are changes in clinical practice sought to be brought about by a person’s tendency toward growth or self‐actualization. Many hospitals have instituted hypothermia bundles to help reduce the incidence of unanticipated postoperative hypothermia. Although successful in the short-term, sustained changes are difficult to maintain. We implemented a quality-improvement project focused on addressing the affective components of self-determination theory (SDT) to create sustainable behavioral change while satisfying providers’ basic psychological needs for autonomy, competence, and relatedness.
Methods: A total of 3 Plan-Do-Study-Act (PDSA) cycles were enacted over the span of 14 months at a major tertiary care pediatric hospital to recruit and motivate anesthesia providers and perioperative team members to reduce the percentage of hypothermic postsurgical patients by 50%. As an optional initial incentive for participation, anesthesiologists would qualify for American Board of Anesthesiology Maintenance of Certification in Anesthesiology (MOCA) Part 4 Quality Improvement credits for monitoring their own temperature data and participating in project-related meetings. Providers were given autonomy to develop a personal plan for achieving the desired goals.
Results: The median rate of hypothermia was reduced from 6.9% to 1.6% in July 2019 and was reduced again in July 2020 to 1.3%, an 81% reduction overall. A low hypothermia rate was successfully maintained for at least 21 subsequent months after participants received their MOCA credits in July 2019.
Conclusions: Using an approach that focused on the elements of competency, autonomy, and relatedness central to the principles of SDT, we observed the development of a new culture of vigilance for prevention of hypothermia that successfully endured beyond the project end date.
Keywords: postoperative hypothermia; self-determination theory; motivation; quality improvement.
Perioperative hypothermia, generally accepted as a core temperature less than 36 °C in clinical practice, is a common complication in the pediatric surgical population and is associated with poor postoperative outcomes.1 Hypothermic patients may develop respiratory depression, hypoglycemia, and metabolic acidosis that may lead to decreased oxygen delivery and end organ tissue hypoxia.2-4 Other potential detrimental effects of failing to maintain normal body temperature are impaired clotting factor enzyme function and platelet dysfunction, increasing the risk for postoperative bleeding.5,6 In addition, there are financial implications when hypothermic patients require care and resources postoperatively because of delayed emergence or shivering.7
The American Society of Anesthesiologists recommends intraoperative temperature monitoring for procedures when clinically significant changes in body temperature are anticipated.8 Maintenance of normothermia in the pediatric population is especially challenging owing to a larger skin-surface area compared with body mass ratio and less subcutaneous fat content than in adults. Preventing postoperative hypothermia starts preoperatively with parental education and can be as simple as covering the child with a blanket and setting the preoperative room to an acceptably warm temperature.9,10 Intraoperatively, maintaining operating room (OR) temperatures at or above 21.1 °C and using active warming devices and radiant warmers when appropriate are important techniques to preserve the child’s body temperature.11,12
Despite the knowledge of these risks and vigilant avoidance of hypothermia, unplanned perioperative hypothermia can occur in up to 70% of surgical patients.1 Beyond the clinical benefits, as health care marches toward a value-based payment methodology, quality indicators such as avoiding hypothermia may be linked directly to payment.
Self-determination theory (SDT) was first developed in 1980 by Deci and Ryan.13 The central premise of the theory states that people develop their full potential if circumstances allow them to satisfy their basic psychological needs: autonomy, competence, and relatedness. Under these conditions, people’s natural inclination toward growth can be realized, and they are more likely to internalize external goals. Under an extrinsic reward system, motivation can waver, as people may perceive rewards as controlling.
Many institutions have implemented hypothermia bundles to help decrease the rate of hypothermic patients, but while initially successful, the effectiveness of these interventions tends to fade over time as participants settle into old, comfortable routines.14 With SDT in mind, we designed our quality-improvement (QI) project with interventions to allow clinicians autonomy without instituting rigid guidelines or punitive actions. We aimed to directly address the affective components central to motivation and engagement so that we could bring about long-term meaningful changes in our practice.
Methods
Setting
The hypothermia QI intervention was instituted at a major tertiary care children’s hospital that performs more than 40 000 pediatric general anesthetics annually. Our division of pediatric anesthesiology consists of 66 fellowship-trained pediatric anesthesiologists, 15 or more rotating trainees per month, 13 anesthesiology assistants, 15 anesthesia technicians, and more than 50 perioperative nurses.
The most frequent pediatric surgeries include, but are not limited to, general surgery, otolaryngology, urology, gastroenterology, plastic surgery, neurosurgery, and dentistry. The surgeries are conducted in the hospital’s main operative floor, which consists of 15 ORs and 2 gastroenterology procedure rooms. Although the implementation of the QI project included several operating sites, we focused on collecting temperature data from surgical patients at our main campus recovery unit. We obtained the patients’ initial temperatures upon arrival to the recovery unit from a retrospective electronic health record review of all patients who underwent anesthesia from January 2016 through April 2021.
Postoperative hypothermia was identified as an area of potential improvement after several patients were reported to be hypothermic upon arrival to the recovery unit in the later part of 2018. Further review revealed significant heterogeneity of practices and lack of standardization of patient-warming methods. By comparing the temperatures pre- and postintervention, we could measure the effectiveness of the QI initiative. Prior to the start of our project, the hypothermia rate in our patient population was not actively tracked, and the effectiveness of our variable practice was not measured.
The cutoff for hypothermia for our QI project was defined as body temperature below 36 °C, since this value has been previously used in the literature and is commonly accepted in anesthesia practice as the delineation for hypothermia in patients undergoing general anesthesia.1
Interventions
This QI project was designed and modeled after the Institute for Healthcare Improvement Model for Improvement.15 Three cycles of Plan-Do-Study-Act (PDSA) were developed and instituted over a 14-month period until December 2019 (Table 1).
A retrospective review was conducted to determine the percentage of surgical patients arriving to our recovery units with an initial temperature reading of less than 36 °C. A project key driver diagram and smart aim were created and approved by the hospital’s continuing medical education (CME) committee for credit via the American Board of Medical Specialties (ABMS) Multi-Specialty Portfolio Program, Maintenance of Certification in Anesthesiology (MOCA) Part 4.
The first PDSA cycle involved introducing the QI project and sharing the aims of the project at a department grand rounds in the latter part of October 2018. Enrollment to participate in the project was open to all anesthesiologists in the division, and participants could earn up to 20 hours of MOCA Part 4 credits. A spreadsheet was developed and maintained to track each anesthesiologist’s monthly percentage of hypothermic patients. The de-identified patient data were shared with the division via monthly emails. In addition, individual providers with a hypothermic patient in the recovery room received a notification email.
The anesthesiologists participated in the QI project by reviewing their personal percentage of hypothermic patients on an ongoing basis to earn the credit. There was no explicit requirement to decrease their own rate of patients with body temperature less than 36 °C or expectation to achieve a predetermined goal, so the participants could not “fail.”
Because of the large interest in this project, a hypothermia committee was formed that consisted of 36 anesthesiologists. This group reviewed the data and exchanged ideas for improvement in November 2018 as part of the first PDSA cycle. The committee met monthly and was responsible for actively engaging other members of the department and perioperative staff to help in this multidisciplinary effort of combating hypothermia in our surgical pediatric population.
PDSA cycle 2 involved several major initiatives, including direct incorporation of the rest of the perioperative team. The perioperative nursing team was educated on the risks of hypothermia and engaged to take an active role by maintaining the operating suite temperature at 21.1 °C and turning on the Bair Hugger (3M) blanket to 43 °C on the OR bed prior to patient arrival to the OR. Additionally, anesthesia technicians (ATs) were tasked with ensuring an adequate supply of Bair Hugger drapes for all cases of the day. The facility’s engineering team was engaged to move the preoperative room temperature controls away from families (who frequently made the rooms cold) and instead set it at a consistent temperature of 23.9 °C. ATs were also asked to place axillary and nasal temperature probes on the anesthesia workstations as a visual reminder to facilitate temperature monitoring closer to the start of anesthesia (instead of the anesthesia provider having to remember to retrieve a temperature probe out of a drawer and place it on the patient). Furthermore, anesthesiologists were instructed via the aforementioned monthly emails and at monthly department meetings to place the temperature probes as early as possible in order to recognize and respond to intraoperative hypothermia in a timelier manner. Finally, supply chain leaders were informed of our expected increase in the use of the blankets and probes and proportionally increased ordering of these supplies to make sure availability would not present an obstacle.
In PDSA cycle 3, trainees (anesthesia assistant students, anesthesia residents and fellows) and advanced practice providers (APPs) (certified registered nurse-anesthetists [CRNAs] and certified anesthesia assistants [C-AAs]) were informed of the QI project. This initiative was guided toward improving vigilance for hypothermia in the rest of the anesthesia team members. The trainees and APPs usually set up the anesthesia area prior to patient arrival, so their recruitment in support of this effort would ensure appropriate OR temperature, active warming device deployment, and the availability and early placement of the correct temperature probe for the case. To facilitate personal accountability, the trainees and APPs were also emailed their own patients’ rate of hypothermia.
Along the course of the project, quarterly committee meetings and departmental monthly meetings served as venues to express concerns and look for areas of improvement, such as specific patterns or trends leading to hypothermic patients. One specific example was the identification of the gastrointestinal endoscopic patients having a rate of hypothermia that was 2% higher than average. Directed education on the importance of Bair Hugger blankets and using warm intravenous fluids worked well to decrease the rate of hypothermia in these patients. This collection of data was shared at regular intervals during monthly department meetings as well and more frequently using departmental emails. The hospital’s secure intranet SharePoint (Microsoft) site was used to share the data among providers.
Study of the interventions and measures
To study the effectiveness and impact of the project to motivate our anesthesiologists and other team members, we compared the first temperatures obtained in the recovery unit prior to the start of the intervention with those collected after the start of the QI project in November 2018. Because of the variability of temperature monitoring intraoperatively (nasal, axillary, rectal), we decided to use the temperature obtained by the nurse in the recovery room upon the patient’s arrival. Over the years analyzed, the nurse’s technique of measuring the temperature remained consistent. All patient temperature measurements were performed using the TAT-5000 (Exergen Corporation). This temporal artery thermometer has been previously shown to correlate well with bladder temperatures (70% of measurements differ by no more than 0.5 °C, as reported by Langham et al16).
Admittedly, we could not measure the degree of motivation or internalization of the project goals by our cohort, but we could measure the reduction in the rate of hypothermia and subjectively gauge engagement in the project by the various groups of participants and the sustainability of the results. In addition, all participating anesthesiologists received MOCA Part 4 credits in July 2019. We continued our data collection until April 2021 to determine if our project had brought about sustainable changes in practice that would continue past the initial motivator of obtaining CME credit.
Analysis
Data analysis was performed using Excel (Microsoft) and SAS, version 9.4 (SAS Institute).
The median of the monthly percentage of patients with a temperature of less than 36.0 °C was also determined for the preintervention time frame. This served as our baseline hypothermia rate, and we aimed to lower it by 50%. Run charts, a well-described methodology to gauge the effectiveness of the QI project, were constructed with the collected data.17
We performed additional analysis to adjust for different time periods throughout the year. The time period between January 2016 and October 2018 was considered preintervention. We considered November 2018 the start of our intervention, or more specifically, the start of our PDSA cycles. October 2018 was analyzed as part of the preintervention data. To account for seasonal temperature variations, the statistical analysis focused on the comparisons of the same calendar quarters for before and after starting intervention using Wilcoxon Mann-Whitney U tests. To reach an overall conclusion, the probabilities for the 4 quarters were combined for each criterion separately utilizing the Fisher χ2 combined probability method.
The hypothermia QI project was reviewed by the institutional review board and determined to be exempt.
Results
The temperatures of 40 875 patients were available for analysis for the preintervention period between January 2016 and October 2018. The median percentage of patients with temperatures less than 36.0 °C was 6.9% (interquartile range [IQR], 5.8%-8.4%). The highest percentage was in February 2016 (9.9%), and the lowest was in March 2018 (3.4%). Following the start of the first PDSA cycle, the next 6 consecutive rates of hypothermia were below the median preintervention value, and a new median for these percentages was calculated at 3.4% (IQR, 2.6%-4.3%). In July 2019, the proportion of hypothermic patients decreased once more for 6 consecutive months, yielding a new median of 1.6% (IQR, 1.2%-1.8%) and again in July 2020, to yield a median of 1.3% (IQR, 1.2%-1.5%) (Figure). In all, 33 799 patients were analyzed after the start of the project from November 2018 to the end of the data collection period through April 2021.
The preintervention monthly rates of hypothermia were compared, quarter to quarter, with those starting in November 2018 using the Wilcoxon Mann-Whitney U test. The decrease in proportion of hypothermic patients after the start of the intervention was statistically significant (P < .001). In addition, the percentage of patients with temperatures greater than 38 °C was not significantly different between the pre- and postintervention time periods (P < .25) (Table 2). The decrease in the number of patients available for analysis from March 2020 to May 2020 was due to the COVID-19 pandemic.
Subjectively, we did not experience any notable resistance to our efforts, and the experience was largely positive for everyone involved. Clinicians identified as having high monthly rates of hypothermia (5% or higher) corrected their numbers the following month after being notified via email or in person.
Discussion
To achieve changes in practice, the health care industry has relied on instituting guidelines, regulations, and policies, often with punitive consequences. We call into question this long-standing framework and propose a novel approach to help evolve the field of QI. Studies in human psychology have long demonstrated the demotivation power of a reward system and the negative response to attempts by authority to use incentives to control or coerce. In our QI project, we instituted 3 PDSA cycles and applied elements from SDT to motivate people’s behaviors. We demonstrate how a new culture focused on maintaining intraoperative normothermia was developed and brought about a measurable and significant decrease in the rate of hypothermia. The relevance of SDT, a widely accepted unifying theory that bridges and links social and personality psychology, should not be understated in health care. Authorities wishing to have long-standing influence should consider a person’s right to make their own decisions and, if possible, a unique way of doing things.
Positively reinforcing behavior has been shown to have a paradoxical effect by dampening an individual’s intrinsic motivation or desire to perform certain tasks.18 Deadlines, surveillance, and authoritative commands are also deterrents.19,20 We focused on providing the tools and information to the clinicians and relied on their innate need for autonomy, growth, and self-actualization to bring about change in clinical practice.21 Group meetings served as a construct for exchanging ideas and to encourage participation, but without the implementation of rigid guidelines or policies. Intraoperative active warming devices and temperature probes were made available, but their use was not mandated. The use of these devices was intentionally not audited to avoid any overbearing control. Providers were, however, given monthly temperature data to help individually assess the effectiveness of their interventions. We did not impose any negative or punitive actions for those clinicians who had high rates of hypothermic patients, and we did not reward those who had low rates of hypothermia. We wanted the participants to feel that the inner self was the source of their behavior, and this was in parallel with their own interests and values. If providers could feel their need for competency could be realized, we hoped they would continue to adhere to the measures we provided to maintain a low rate of hypothermia.
The effectiveness of our efforts was demonstrated by a decrease in the prevalence of postoperative hypothermia in our surgical patients. The initial decrease of the median rate of hypothermia from 6.9% to 3.4% occurred shortly into the start of the first PDSA cycle. The second PDSA cycle started in January 2019 with a multimodal approach and included almost all parties involved in the perioperative care of our surgical patients. Not only was this intervention responsible for a continued downward trend in the percentage of hypothermic patients, but it set the stage for the third and final PDSA cycle, which started in July 2019. The architecture was in place to integrate trainees and APPs to reinforce our initiative. Subsequently, the new median percentage of hypothermic patients was further decreased to an all-time low of 1.6% per month, satisfying and surpassing the goal of the QI project of decreasing the rate of hypothermia by only 50%. Our organization thereafter maintained a monthly hypothermia rate below 2%, except for April 2020, when it reached 2.5%. Our lowest median percentage was obtained after July 2020, reaching 1.3%.
To account for seasonal variations in temperatures and types of surgeries performed, we compared the percentage of hypothermic patients before and after the start of intervention, quarter by quarter. The decrease in the proportion of hypothermic patients after the start of intervention was statistically significant (P < .001). In addition, the data failed to prove any statistical difference for temperatures above 38 °C between the 2 periods, indicating that our interventions did not result in significant overwarming of patients. The clinical implications of decreasing the percentage of hypothermic patients from 6.9% to 1.3% is likely clinically important when considering the large number of patients who undergo surgery at large tertiary care pediatric centers. Even if simple interventions reduce hypothermia in only a handful of patients, routine applications of simple measures to keep patients normothermic is likely best clinical practice.
Anesthesiologists who participated in the hypothermia QI project by tracking the incidence of hypothermia in their patients were able to collect MOCA Part 4 credits in July 2019. There was no requirement for the individual anesthesiologist to reduce the rate of hypothermia or apply any of the encouraged strategies to obtain credit. As previously stated, there were also no rewards for obtaining low hypothermia rates for the providers. The temperature data continued to be collected through April 2021, 21 months after the credits were distributed, to demonstrate a continued, meaningful change, at least in the short-term. While the MOCA Part 4 credits likely served as an initial motivating factor to encourage participation in the QI project, they certainly were not responsible for the sustained low hypothermia rate after July 2019. We showed that the low rate of hypothermia was successfully maintained, indicating that the change in providers’ behavior was independent of the external motivator of obtaining the credit hours. Mere participation in the project by reviewing one’s temperature data was all that was required to obtain the credit. The Organismic Integration Theory, a mini-theory within SDT, best explains this phenomenon by describing any motivated behavior on a continuum ranging from controlled to autonomous.22 Do people perform the task resentfully, on their own volition because they believe it is the correct action, or somewhere in between? We explain the sustained low rates of hypothermia after the MOCA credits were distributed due to a shift to the autonomous end of the continuum with the clinician’s active willingness to meet the challenges and apply intrinsically motivated behaviors to lower the rate of hypothermia. The internalization of external motivators is difficult to prove, but the evidence supports that the methods we used to motivate individuals were effective and have resulted in a significant downward trend in our hypothermia rate.
There are several limitations to our QI project. The first involves the measuring of postoperative temperature in the recovery units. The temperatures were obtained using the same medical-grade infrared thermometer for all the patients, but other variables, such as timing and techniques, were not standardized. Secondly, overall surgical outcomes related to hypothermia were not tracked because we were unable to control for other confounding variables in our large cohort of patients, so we cannot say if the drop in the hypothermia rate had a clinically significant outcome. Thirdly, we propose that SDT offers a compellingly fitting explanation of the psychology of motivation in our efforts, but it may be possible that other theories may offer equally fitting explanations. The ability to measure the degree of motivation is lacking, and we did not explicitly ask participants what their specific source of motivation was. Aside from SDT, the reduction in hypothermia rate could also be attributed to the ease and availability of warming equipment that was made in each OR. This QI project was successfully applied to only 1 institution, so its ability to be widely applicable remains uncertain. In addition, data collection continued during the COVID-19 pandemic when case volumes decreased. However, by June 2020, the number of surgical cases at our institution had largely returned to prepandemic levels. Additional data collection beyond April 2021 would be helpful to determine if the reduction in hypothermia rates is truly sustained.
Conclusion
Overall, the importance of maintaining perioperative normothermia was well disseminated and agreed upon by all departments involved. Despite the limitations of the project, there was a significant reduction in rates of hypothermia, and sustainability of outcomes was consistently demonstrated in the poststudy period.
Using 3 cycles of the PDSA method, we successfully decreased the median rate of postoperative hypothermia in our pediatric surgical population from a preintervention value of 6.9% to 1.3%—a reduction of more than 81.2%. We provided motivation for members of our anesthesiology staff to participate by offering MOCA 2.0 Part 4 credits, but the lower rate of hypothermic patients was maintained for 15 months after the credits were distributed. Over the course of the project, there was a shift in culture, and extra vigilance was given to temperature monitoring and assessment. We attribute this sustained cultural change to the deliberate incorporation of the principles of competency, autonomy, and relatedness central to SDT to the structure of the interventions, avoiding rigid guidelines and pathways in favor of affective engagement to establish intrinsic motivation.
Acknowledgements: The authors thank Joan Reisch, PhD, for her assistance with the statistical analysis.
Corresponding author: Edgar Erold Kiss, MD, 1935 Medical District Dr, Dallas, TX 75235; [email protected].
Financial disclosures: None.
1. Leslie K, Sessler DI. Perioperative hypothermia in the high-risk surgical patient. Best Pract Res Clin Anaesthesiol. 2003;17(4):485-498.
2. Sessler DI. Forced-air warming in infants and children. Paediatr Anaesth. 2013;23(6):467-468.
3. Wetzel RC. Evaluation of children. In: Longnecker DE, Tinker JH, Morgan Jr GE, eds. Principles and Practice of Anesthesiology. 2nd ed. Mosby Publishers; 1999:445-447.
4. Witt L, Dennhardt N, Eich C, et al. Prevention of intraoperative hypothermia in neonates and infants: results of a prospective multicenter observational study with a new forced-air warming system with increased warm air flow. Paediatr Anaesth. 2013;23(6):469-474.
5. Blum R, Cote C. Pediatric equipment. In: Blum R, Cote C, eds. A Practice of Anaesthesia for Infants and Children. Saunders Elsevier; 2009:1099-1101.
6. Doufas AG. Consequences of inadvertent perioperative hypothermia. Best Pract Res Clin Anaesthesiol. 2003;17(4):535-549.
7. Mahoney CB, Odom J. Maintaining intraoperative normothermia: a meta-analysis of outcomes with costs. AANA J. 1999;67(2):155-163.
8. American Society of Anesthesiologists Committee on Standards and Practice Parameters. Standards for Basic Anesthetic Monitoring. Approved by the ASA House of Delegates October 21, 1986; last amended October 20, 2010; last affirmed October 28, 2015.
9. Horn E-P, Bein B, Böhm R, et al. The effect of short time periods of pre-operative warming in the prevention of peri-operative hypothermia. Anaesthesia. 2012;67(6):612-617.
10. Andrzejowski J, Hoyle J, Eapen G, Turnbull D. Effect of prewarming on post-induction core temperature and the incidence of inadvertent perioperative hypothermia in patients undergoing general anaesthesia. Br J Anaesth. 2008;101(5):627-631.
11. Sessler DI. Complications and treatment of mild hypothermia. Anesthesiology. 2001;95(2):531-543.
12. Bräuer A, English MJM, Steinmetz N, et al. Efficacy of forced-air warming systems with full body blankets. Can J Anaesth. 2007;54(1):34-41.
13. Deci EL, Ryan RM. The “what” and “why” of goal pursuits: human needs and the self‐determination of behavior. Psychol Inquiry. 2000;11(4):227-268.
14. Al-Shamari M, Puttha R, Yuen S, et al. G9 Can introduction of a hypothermia bundle reduce hypothermia in the newborns? Arch Dis Childhood. 2019;104(suppl 2):A4.1-A4.
15. Institute for Healthcare Improvement. How to improve. Accessed May 12, 2021. http://www.ihi.org/resources/Pages/HowtoImprove/default.aspx
16. Langham GE, Meheshwari A, You J, et al. Noninvasive temperature monitoring in postanesthesia care units. Anesthesiology. 2009;111(1):90-96.
17. Perla RJ, Provost LP, Murray SK. The run chart: a simple analytical tool for learning from variation in healthcare processes. BMJ Qual Saf. 2011;20(1):46-51.
18. Deci EL. Effects of externally mediated rewards on intrinsic motivation. J Pers Soc Psychol. 1971;18(1):105-115.
19. Deci EL, Koestner R, Ryan RM. A meta-analytic review of experiments examining the effects of extrinsic rewards on intrinsic motivation. Psychol Bull. 1999;125(6):627-668.
20. Deci EL, Koestner R, Ryan RM. The undermining effect is a reality after all—extrinsic rewards, task interest, and self-determination: Reply to Eisenberger, Pierce, and Cameron (1999) and Lepper, Henderlong, and Gingras (1999). Psychol Bull. 1999;125(6):692-700.
21. Maslow A. The Farther Reaches of Human Nature. Viking Press; 1971.
22. Sheldon KM, Prentice M. Self-determination theory as a foundation for personality researchers. J Pers. 2019;87(1):5-14.
Texas doctor stole identities, forged patient records in fraud scheme; more
Doctor guilty of fraud and identity theft gets 7 years in jail
Grigoriy T. Rodonaia, MD, a family physician in Port Neches, Tex., was convicted of 12 counts of healthcare fraud, three counts of aggravated identity theft, and one count of making a false statement toward the end of 2020.
Dr. Rodonaia began his criminal activity in 2015, when he issued more than 600 prescriptions for scar creams using information from more than 140 beneficiaries of TRICARE, a military healthcare program, without their knowledge or consent. Dr. Rodonaia also forged patients’ records to say that he had examined the patients, and he submitted fraudulent records to the Defense Health Agency in response to an audit.
Dr. Rodonaia was sentenced to 7 years in federal prison on June 24, 2021, and was ordered to pay $195,607.76 in restitution.
Psychiatric hospital and nursing staff sued for death of patient
Jeremiah Bagley, 37, died after being restrained by psychiatric nursing staff and injected with an antipsychotic and a sedative at the Rio Grande State Center, in Harlingen, Tex.
An autopsy revealed that Mr. Bagley had several fractured vertebrae, cracked ribs, a lacerated spleen, and multiple contusions on his upper body. The autopsy report lists the cause of death as “excited delirium due to psychosis with restraint-associated blunt force trauma.”
Mr. Bagley’s father filed a lawsuit naming the hospital and 10 employees as defendants, saying that his son’s civil rights were violated. The Texas Supreme Court ruled on April 16, 2021, that the staffers who were charged must submit expert reports, despite the fact that medical malpractice was not alleged. Usually, such a lawsuit would be dismissed because a report was not served by the statutory deadline, but in a 9-0 decision, the high court allowed the case to proceed.
Plaintiff attorney Katie P. Klein told the Claims Journal, “He probably struck someone and everybody got mad and they jumped him. He had four or five people on him, which was not permitted.”
Ob.gyn. gets 59 years in prison
Javaid Perwaiz, MD, a 71-year-old ob/gyn from Chesapeake, Va., was convicted of performing medically unnecessary and irreversible surgeries, including hysterectomies and sterilizations, on multiple patients for more than 10 years.
Karl Schumann, acting special agent in charge of the Federal Bureau of Investigation’s (FBI’s) Norfolk, Va. field office, said in a statement, “With unnecessary, invasive medical procedures, Dr Perwaiz not only caused enduring complications, pain, and anxiety to his patients, but he assaulted the most personal part of their lives and even robbed some of their future.”
Dr. Perwaiz was also convicted of 52 counts of healthcare fraud and of making false statements in late 2020. His fraud allegedly cost insurance programs nearly $21 million. The investigation began in September 2018 after a hospital employee contacted the FBI after suspecting that Dr. Perwaiz was performing unnecessary surgeries. More than 25 former patients testified at the trial, and the court received more than 60 victim impact statements.
Dr. Perwaiz had a long criminal history, according to the New York Times. In 1982, Dr. Perwaiz lost medical privileges at Maryview Hospital, in Portsmouth, Va., because of performing unnecessary surgeries and displaying poor clinical judgment. His medical license was reinstated in 1998.
Doctor who prescribed opioids out of car charged with murder
George M. Blatti, MD, a family physician in New York, was charged with five counts of murder for the opioid-related deaths of his patients and 11 counts of reckless endangerment in the first degree, according to the New York Times. Dr. Blatti’s medical license has been revoked, and he has pleaded not guilty.
Dr. Blatti had been seeing patients and giving prescriptions out of his car in parking lots, where he would prescribe pain medications without examining the patients. Many of these patients were struggling with addiction to opioids or other drugs. The alleged victims — three men and two women, who were between the ages of 30 and 60 — were prescribed 45,000 pills over 4 years, despite the fact that each showed clear signs of addiction, according to prosecutors.
Prosecutors allege that Dr. Blatti knew that several of his patients had died of overdoses, and he ignored pleas from their family members to stop enabling their addictions. They also say he ignored warnings from insurers about excessive opioid prescribing and was questioned by the New York State Office of Professional Medical Conduct about it in 2017.
A version of this article first appeared on Medscape.com.
Many pandemic-driven changes to cancer clinical trials should remain
Many of the changes to cancer clinical trials forced through by the COVID-19 pandemic should remain, as they have made trials “more patient centered and efficient,” according to a group of thought leaders in oncology.
Among the potential improvements were more efficient study enrollment through secure electronic platforms, direct shipment of oral drugs to patients, remote assessment of adverse events, and streamlined data collection.
These changes should be implemented on a permanent basis, the group argues in a commentary published online July 21, 2021, in Cancer Discovery, a journal of the American Association for Cancer Research.
“The ability to distribute oral investigational drugs by mail to patients at their home has probably been the single most impactful change to clinical trial conduct, linked with virtual visits with patients to assess side effects and symptoms,” commented lead author Keith Flaherty, MD, who is director of clinical research at Massachusetts General Hospital, a professor at Harvard Medical School, Boston, and a member of the AACR board of directors.
“This has made it more feasible for patients for whom participation in clinical trials poses a disruption of their ability to work or provide care for family members to participate in trials,” he added in a press statement issued by the AACR.
Pandemic halted many clinical trials
A survey of cancer programs in early 2020 showed that nearly 60% halted screening and/or enrollment for at least some trials because of COVID-19.
“In the spring of 2020, clinical trial conduct halted and then restarted focusing on the bare minimum procedures that first allowed patients continued access to their experimental therapies, and then allowed clinical trial sites and sponsors to collect information on the effects of the therapies,” the authors said.
“The COVID-19–induced changes to clinical trials were a big challenge, probably the largest change in clinical trial conduct since the start of modern oncology clinical testing,” they commented.
“But it also represents an opportunity to rethink the key aspects of clinical trial conduct that are strictly necessary to reach the goal of testing the effectiveness of cancer therapies, and which others are dispensable or provide only minor additional contributions,” they added.
As previously reported at the time by this news organization, efforts to find alternative approaches to conducting trials amid the pandemic led to the emergence of a few “silver linings.”
Key adaptations made to clinical trials and highlighted by the authors include:
- Uptake of remote consenting and telemedicine
- Use of alternative laboratories and imaging centers
- Delivery or administration of investigational drugs at patients’ homes or local clinics
- Commercial attainment of study drugs already approved for other indications
Indeed, the restrictions encountered during the pandemic underscore the importance of designing patient-centered trials versus study site–centered trials, added Antoni Ribas, MD, commentary coauthor and immediate past president of the AACR.
Many of the changes implemented during the pandemic could help increase access for patients living in underserved communities who are underrepresented in clinical trials, he explained.
Harnessing the lessons learned
The authors also recommended the following additional adaptations, which they believe will enhance efficiency and further expand access to clinical trials:
- Incorporating patient-reported outcomes and alternative endpoints in efficacy assessments
- Aiming for 100% remote drug infusions and monitoring
- Increasing funding for clinical trials conducted in underserved communities
- Expanding clinical trial eligibility to include patients with a wide range of comorbidities
- Reducing collection of low-grade adverse events and allowing minor protocol deviations
The group’s recommendations are based on discussions by the AACR COVID-19 and Cancer Task Force, in which they participated.
The American Society of Clinical Oncology is also working to leverage pandemic-related lessons to streamline care and trial planning.
ASCO’s “Road to Recovery” recommendations, published in December 2020, aim to “ensure lessons learned from the COVID-19 experience are used to craft a more equitable, accessible, and efficient clinical research system that protects patient safety, ensures scientific integrity, and maintains data quality,” the authors explained.
Dr. Flaherty and colleagues further underscore the importance of focusing on improvements going forward.
“Guided by lessons learned, many of the remote assessments and trial efficiencies deployed during the pandemic can be preserved and improved upon. We strongly encourage use of these streamlined procedures where appropriate in future prospectively designed cancer clinical trials,” they wrote.
Dr. Flaherty reported receiving personal fees from numerous pharmaceutical companies. Dr. Ribas reported receiving grants from Agilent and Bristol Myers Squibb.
A version of this article first appeared on Medscape.com.
Are you at legal risk for speaking at conferences?
When Jerry Gardner, MD, and a junior colleague received the acceptance notification for their abstract to be presented at Digestive Diseases Week® (DDW) 2021, a clause in the mandatory participation agreement gave Dr. Gardner pause. It required his colleague, as the submitting author, to completely accept any and all legal responsibility for any claims that might arise out of their presentation.

The clause was a red flag to Dr. Gardner, president of Science for Organizations, a Mill Valley, Calif.–based consulting firm. The gastroenterologist and former head of the digestive diseases branch at the National Institute of Diabetes and Digestive and Kidney Diseases – who has made hundreds of presentations and had participated in DDW for 40 years – had never encountered such a broad indemnity clause.
This news organization investigated just how risky it is to make a presentation at a conference – more than a dozen professional societies were contacted. Although DDW declined to discuss its agreement, Houston health care attorney Rachel V. Rose said that Dr. Gardner was smart to be cautious. “I would not sign that agreement. I have never seen anything that broad and all encompassing,” she said.
The DDW requirement “means that participants must put themselves at great potential financial risk in order to present their work,” Dr. Gardner said. He added that he and his colleague would not have submitted an abstract had they known about the indemnification clause up front.
Dr. Gardner advised his colleague not to sign the DDW agreement. She did not, and both missed the meeting.
Speakers ‘have to be careful’
Dr. Gardner may be an exception. How many doctors are willing to forgo a presentation because of a concern about something in an agreement?
John Mandrola, MD, said he operates under the assumption that if he does not sign the agreement, then he won’t be able to give his presentation. He admits that he generally just signs them and is careful with his presentations. “I’ve never really paid much attention to them,” said Dr. Mandrola, a cardiac electrophysiologist in Louisville, Ky., and chief cardiology correspondent for Medscape.
Not everyone takes that approach. “I do think that people read them, but they also take them with a grain of salt,” said E. Magnus Ohman, MBBS, professor of medicine at Duke University, Durham, N.C. He said he’s pragmatic and regards the agreements as a necessary evil in a litigious nation. Speakers “have to be careful, obviously,” Dr. Ohman said in an interview.
Some argue that the requirements are not only fair but also understandable. David Johnson, MD, a former president of the American College of Gastroenterology, said he has never had questions about agreements for meetings he has been involved with. “To me, this is not anything other than standard operating procedure,” he said.
Presenters participate by invitation, noted Dr. Johnson, a professor of medicine and chief of gastroenterology at the Eastern Virginia Medical School, Norfolk, who is a contributor to this news organization. “If they stand up and do something egregious, I would concur that the society should not be liable,” he said.
Big asks, big secrecy
Even for those who generally agree with Dr. Johnson’s position, it may be hard to completely understand what’s at stake without an attorney.
Although many declined to discuss their policies, a handful of professional societies provided their agreements for review. In general, the agreements appear to offer broad protection and rights to the organizers and large liability exposure for the participants. Participants are charged with a wide range of responsibilities, such as ensuring against copyright violations and intellectual property infringement, and that they also agree to unlimited use of their presentations and their name and likeness.
The American Academy of Neurology, which held its meeting virtually in 2021, required participants to indemnify the organization against all “losses, expenses, damages, or liabilities,” including “reasonable attorneys’ fees.” Federal employees, however, could opt out of indemnification.
The American Society of Clinical Oncology said that it does not usually require indemnification from its meeting participants. However, a spokesperson noted that ASCO did require participants at its 2021 virtual meeting to abide by the terms of use for content posted to the ASCO website. Those terms specify that users agree to indemnify ASCO from damages related to posts.
The American Psychiatric Association said it does not require any indemnification but did not make its agreement available. The American Academy of Pediatrics also said it did not require indemnification but would not share its agreement.
An American Diabetes Association spokesperson said that “every association is different in what they ask or require from speakers,” but would not share its requirements.
The American Academy of Family Physicians, the American College of Obstetricians and Gynecologists, the American College of Physicians, and the Endocrine Society all declined to participate.
The organizations that withheld agreements “probably don’t want anybody picking apart their documents,” said Kyle Claussen, CEO of the Resolve Physician Agency, which reviews employment contracts and other contracts for physicians. “The more fair a document, the more likely they would be willing to disclose that, because they have nothing to hide,” he said.
‘It’s all on you’
Requiring indemnification for any and all aspects of a presentation appears to be increasingly common, said the attorneys interviewed for this article. As organizations repackage meeting presentations for sale, they put the content further out into the world and for a longer period, which increases liability exposure.
“If I’m the attorney for DDW, I certainly think I’d want to have this in place,” said Mr. Claussen.
“It’s good business sense for them because it reduces their risk,” said Courtney H. A. Thompson, an attorney with Fredrikson & Byron in Minneapolis, who advises regional and national corporations and ad agencies on advertising, marketing, and trademark law. She also works with clients who speak at meetings and who thus encounter meeting agreements.
Ms. Thompson said indemnity clauses have become fairly common over the past decade, especially as more companies and organizations have sought to protect trademarks, copyrights, and intellectual property and to minimize litigation costs.
A conference organizer “doesn’t want a third party to come after them for intellectual property, privacy, or publicity right infringement based on the participation of the customer or, in this case, the speaker,” said Ms. Thompson.
The agreements also reflect America’s litigation-prone culture.
Dean Fanelli, a patent attorney in the Washington, D.C., office of Cooley LLP, said the agreements he’s been asked to sign as a speaker increasingly seem “overly lawyerly.”
Two decades ago, a speaker might have been asked to sign a paragraph or a one-page form. Now “they often look more like formalized legal agreements,” Mr. Fanelli told this news organization.
The DDW agreement, for instance, ran four pages and contained 21 detailed clauses.
The increasingly complicated agreements “are a little over the top,” said Mr. Fanelli. But as an attorney who works with clients in the pharmaceutical industry, he said he understands that meeting organizers want to protect their rights.
DDW’s main indemnification clause requires the participant to indemnify DDW and its agents, directors, and employees “against any and all claims, demands, causes of action, losses, damages, liabilities, costs, and expenses,” including attorneys’ fees “arising out of a claim, action or proceeding” based on a breach or “alleged breach” by the participant.
“You’re releasing this information to them and then you’re also giving them blanket indemnity back, saying if there’s any type of intellectual property violation on your end – if you’ve included any type of work that’s protected, if this causes any problems – it’s all on you,” said Mr. Claussen.
Other potential pitfalls
Aside from indemnification, participation agreements can contain other potentially worrisome clauses, including onerous terms for cancellation and reuse of content without remuneration.
DDW requires royalty-free licensing of a speaker’s content; the organization can reproduce it in perpetuity without royalties. Many organizations have such a clause in their agreements, including the AAN and the American College of Cardiology.
ASCO’s general authorization form for meeting participants requires that they assign to ASCO rights to their content “perpetually, irrevocably, worldwide and royalty free.” Participants can contact the organization if they seek to opt out, but it’s not clear whether ASCO grants such requests.
Participants in the upcoming American Heart Association annual meeting can deny permission to record their presentation. But if they allow recording and do not agree to assign all rights and copyright ownership to the AHA, the work will be excluded from publication in the meeting program, e-posters, and the meeting supplement in Circulation.
Mr. Claussen said granting royalty-free rights presents a conundrum. Having content reproduced in various formats “might be better for your personal brand,” but it’s not likely to result in any direct compensation and could increase liability exposure, he said.
How presenters must prepare
Mr. Claussen and Ms. Rose said speakers should be vigilant about their own rights and responsibilities, including ensuring that they do not violate copyrights or infringe on intellectual property rights.
“I would recommend that folks be meticulous about what is in their slide deck and materials,” said Ms. Thompson. He said that presenters should be sure they have the right to share material. Technologies crawl the internet seeking out infringement, which often leads to cease and desist letters from attorneys, she said.
It’s better to head off such a letter, Ms. Thompson said. “You need to defend it whether or not it’s a viable claim,” and that can be costly, she said.
Both Ms. Thompson and Mr. Fanelli also warn about disclosing anything that might be considered a trade secret. Many agreements prohibit presenters from engaging in commercial promotion, but if a talk includes information about a drug or device, the manufacturer will want to review the presentation before it’s made public, said Mr. Fanelli.
Many organizations prohibit attendees from photographing, recording, or tweeting at meetings and often require speakers to warn the audience about doing so. DDW goes further by holding presenters liable if someone violates the rule.
“That’s a huge problem,” said Dr. Mandrola. He noted that although it might be easy to police journalists attending a meeting, “it seems hard to enforce that rule amongst just regular attendees.”
Accept or negotiate?
Individuals who submit work to an organization might feel they must sign an agreement as is, especially if they are looking to advance their career or expand knowledge by presenting work at a meeting. But some attorneys said it might be possible to negotiate with meeting organizers.
“My personal opinion is that it never hurts to ask,” said Ms. Thompson. If she were speaking at a legal conference, she would mark up a contract and “see what happens.” The more times pushback is accepted – say, if it works with three out of five speaking engagements – the more it reduces overall liability exposure.
Mr. Fanelli, however, said that although he always reads over an agreement, he typically signs without negotiating. “I don’t usually worry about it because I’m just trying to talk at a particular seminar,” he said.
Prospective presenters “have to weigh that balance – do you want to talk at a seminar, or are you concerned about the legal issues?” said Mr. Fanelli.
If in doubt, talk with a lawyer.
“If you ever have a question on whether or not you should consult an attorney, the answer is always yes,” said Mr. Claussen. It would be “an ounce of prevention,” especially if it’s just a short agreement, he said.
Dr. Ohman, however, said that he believed “it would be fairly costly” and potentially unwieldy. “You can’t litigate everything in life,” he added.
As for Dr. Gardner, he said he would not be as likely to attend DDW in the future if he has to agree to cover any and all liability. “I can’t conceive of ever agreeing to personally indemnify DDW in order to make a presentation at the annual meeting,” he said.
A version of this article first appeared on Medscape.com.
When Jerry Gardner, MD, and a junior colleague received the acceptance notification for their abstract to be presented at Digestive Diseases Week® (DDW) 2021, a clause in the mandatory participation agreement gave Dr. Gardner pause. It required his colleague, as the submitting author, to completely accept any and all legal responsibility for any claims that might arise out of their presentation.
The clause was a red flag to Dr. Gardner, president of Science for Organizations, a Mill Valley, Calif.–based consulting firm. The gastroenterologist and former head of the digestive diseases branch at the National Institute of Diabetes and Digestive and Kidney Diseases – who has made hundreds of presentations and had participated in DDW for 40 years – had never encountered such a broad indemnity clause.
This news organization investigated just how risky it is to make a presentation at a conference – more than a dozen professional societies were contacted. Although DDW declined to discuss its agreement, Houston health care attorney Rachel V. Rose said that Dr. Gardner was smart to be cautious. “I would not sign that agreement. I have never seen anything that broad and all encompassing,” she said.
The DDW requirement “means that participants must put themselves at great potential financial risk in order to present their work,” Dr. Gardner said. He added that he and his colleague would not have submitted an abstract had they known about the indemnification clause up front.
Dr. Gardner advised his colleague not to sign the DDW agreement. She did not, and both missed the meeting.
Speakers ‘have to be careful’
Dr. Gardner may be an exception. How many doctors are willing to forgo a presentation because of a concern about something in an agreement?
John Mandrola, MD, said he operates under the assumption that if he does not sign the agreement, then he won’t be able to give his presentation. He admits that he generally just signs them and is careful with his presentations. “I’ve never really paid much attention to them,” said Dr. Mandrola, a cardiac electrophysiologist in Louisville, Ky., and chief cardiology correspondent for Medscape.
Not everyone takes that approach. “I do think that people read them, but they also take them with a grain of salt,” said E. Magnus Ohman, MBBS, professor of medicine at Duke University, Durham, N.C. He said he’s pragmatic and regards the agreements as a necessary evil in a litigious nation. Speakers “have to be careful, obviously,” Dr. Ohman said in an interview.
Some argue that the requirements are not only fair but also understandable. David Johnson, MD, a former president of the American College of Gastroenterology, said he has never had questions about agreements for meetings he has been involved with. “To me, this is not anything other than standard operating procedure,” he said.
Presenters participate by invitation, noted Dr. Johnson, a professor of medicine and chief of gastroenterology at the Eastern Virginia Medical School, Norfolk, who is a contributor to this news organization. “If they stand up and do something egregious, I would concur that the society should not be liable,” he said.
Big asks, big secrecy
Even for those who generally agree with Dr. Johnson’s position, it may be hard to completely understand what’s at stake without an attorney.
Although many declined to discuss their policies, a handful of professional societies provided their agreements for review. In general, the agreements appear to offer broad protection and rights to the organizers and large liability exposure for the participants. Participants are charged with a wide range of responsibilities, such as ensuring against copyright violations and intellectual property infringement, and that they also agree to unlimited use of their presentations and their name and likeness.
The American Academy of Neurology, which held its meeting virtually in 2021, required participants to indemnify the organization against all “losses, expenses, damages, or liabilities,” including “reasonable attorneys’ fees.” Federal employees, however, could opt out of indemnification.
The American Society of Clinical Oncology said that it does not usually require indemnification from its meeting participants. However, a spokesperson noted that ASCO did require participants at its 2021 virtual meeting to abide by the terms of use for content posted to the ASCO website. Those terms specify that users agree to indemnify ASCO from damages related to posts.
The American Psychiatric Association said it does not require any indemnification but did not make its agreement available. The American Academy of Pediatrics also said it did not require indemnification but would not share its agreement.
An American Diabetes Association spokesperson said that “every association is different in what they ask or require from speakers,” but would not share its requirements.
The American Academy of Family Physicians, the American College of Obstetricians and Gynecologists, the American College of Physicians, and the Endocrine Society all declined to participate.
The organizations that withheld agreements “probably don’t want anybody picking apart their documents,” said Kyle Claussen, CEO of the Resolve Physician Agency, which reviews employment contracts and other contracts for physicians. “The more fair a document, the more likely they would be willing to disclose that, because they have nothing to hide,” he said.
‘It’s all on you’
Requiring indemnification for any and all aspects of a presentation appears to be increasingly common, said the attorneys interviewed for this article. As organizations repackage meeting presentations for sale, they put the content further out into the world and for a longer period, which increases liability exposure.
“If I’m the attorney for DDW, I certainly think I’d want to have this in place,” said Mr. Claussen.
“It’s good business sense for them because it reduces their risk,” said Courtney H. A. Thompson, an attorney with Fredrikson & Byron in Minneapolis, who advises regional and national corporations and ad agencies on advertising, marketing, and trademark law. She also works with clients who speak at meetings and who thus encounter meeting agreements.
Ms. Thompson said indemnity clauses have become fairly common over the past decade, especially as more companies and organizations have sought to protect trademarks, copyrights, and intellectual property and to minimize litigation costs.
A conference organizer “doesn’t want a third party to come after them for intellectual property, privacy, or publicity right infringement based on the participation of the customer or, in this case, the speaker,” said Ms. Thompson.
The agreements also reflect America’s litigation-prone culture.
Dean Fanelli, a patent attorney in the Washington, D.C., office of Cooley LLP, said the agreements he’s been asked to sign as a speaker increasingly seem “overly lawyerly.”
Two decades ago, a speaker might have been asked to sign a paragraph or a one-page form. Now “they often look more like formalized legal agreements,” Mr. Fanelli told this news organization.
The DDW agreement, for instance, ran four pages and contained 21 detailed clauses.
The increasingly complicated agreements “are a little over the top,” said Mr. Fanelli. But as an attorney who works with clients in the pharmaceutical industry, he said he understands that meeting organizers want to protect their rights.
DDW’s main indemnification clause requires the participant to indemnify DDW and its agents, directors, and employees “against any and all claims, demands, causes of action, losses, damages, liabilities, costs, and expenses,” including attorneys’ fees “arising out of a claim, action or proceeding” based on a breach or “alleged breach” by the participant.
“You’re releasing this information to them and then you’re also giving them blanket indemnity back, saying if there’s any type of intellectual property violation on your end – if you’ve included any type of work that’s protected, if this causes any problems – it’s all on you,” said Mr. Claussen.
Other potential pitfalls
Aside from indemnification, participation agreements can contain other potentially worrisome clauses, including onerous terms for cancellation and reuse of content without remuneration.
DDW requires royalty-free licensing of a speaker’s content; the organization can reproduce it in perpetuity without royalties. Many organizations have such a clause in their agreements, including the AAN and the American College of Cardiology.
ASCO’s general authorization form for meeting participants requires that they assign to ASCO rights to their content “perpetually, irrevocably, worldwide and royalty free.” Participants can contact the organization if they seek to opt out, but it’s not clear whether ASCO grants such requests.
Participants in the upcoming American Heart Association annual meeting can deny permission to record their presentation. But if they allow recording and do not agree to assign all rights and copyright ownership to the AHA, the work will be excluded from publication in the meeting program, e-posters, and the meeting supplement in Circulation.
Mr. Claussen said granting royalty-free rights presents a conundrum. Having content reproduced in various formats “might be better for your personal brand,” but it’s not likely to result in any direct compensation and could increase liability exposure, he said.
How presenters must prepare
Mr. Claussen and Ms. Rose said speakers should be vigilant about their own rights and responsibilities, including ensuring that they do not violate copyrights or infringe on intellectual property rights.
“I would recommend that folks be meticulous about what is in their slide deck and materials,” said Ms. Thompson. He said that presenters should be sure they have the right to share material. Technologies crawl the internet seeking out infringement, which often leads to cease and desist letters from attorneys, she said.
It’s better to head off such a letter, Ms. Thompson said. “You need to defend it whether or not it’s a viable claim,” and that can be costly, she said.
Both Ms. Thompson and Mr. Fanelli also warn about disclosing anything that might be considered a trade secret. Many agreements prohibit presenters from engaging in commercial promotion, but if a talk includes information about a drug or device, the manufacturer will want to review the presentation before it’s made public, said Mr. Fanelli.
Many organizations prohibit attendees from photographing, recording, or tweeting at meetings and often require speakers to warn the audience about doing so. DDW goes further by holding presenters liable if someone violates the rule.
“That’s a huge problem,” said Dr. Mandrola. He noted that although it might be easy to police journalists attending a meeting, “it seems hard to enforce that rule amongst just regular attendees.”
Accept or negotiate?
Individuals who submit work to an organization might feel they must sign an agreement as is, especially if they are looking to advance their career or expand knowledge by presenting work at a meeting. But some attorneys said it might be possible to negotiate with meeting organizers.
“My personal opinion is that it never hurts to ask,” said Ms. Thompson. If she were speaking at a legal conference, she would mark up a contract and “see what happens.” The more times pushback is accepted – say, if it works with three out of five speaking engagements – the more it reduces overall liability exposure.
Mr. Fanelli, however, said that although he always reads over an agreement, he typically signs without negotiating. “I don’t usually worry about it because I’m just trying to talk at a particular seminar,” he said.
Prospective presenters “have to weigh that balance – do you want to talk at a seminar, or are you concerned about the legal issues?” said Mr. Fanelli.
If in doubt, talk with a lawyer.
“If you ever have a question on whether or not you should consult an attorney, the answer is always yes,” said Mr. Claussen. It would be “an ounce of prevention,” especially if it’s just a short agreement, he said.
Dr. Ohman, however, said that he believed “it would be fairly costly” and potentially unwieldy. “You can’t litigate everything in life,” he added.
As for Dr. Gardner, he said he would not be as likely to attend DDW in the future if he has to agree to cover any and all liability. “I can’t conceive of ever agreeing to personally indemnify DDW in order to make a presentation at the annual meeting,” he said.
A version of this article first appeared on Medscape.com.
Mayo, Cleveland Clinics top latest U.S. News & World Report hospital rankings
This year’s expanded report debuts new ratings for seven “important procedures and conditions to help patients, in consultation with their doctors, narrow down their choice of hospital based on the specific type of care they need,” Ben Harder, managing editor and chief of health analysis, said in a news release.
With new ratings for myocardial infarction, stroke, hip fracture, and back surgery (spinal fusion), the report now ranks 17 procedures and conditions.
Also new to the 2021 report, which marks the 32nd edition, is a look at racial disparities in health care and the inclusion of health equity measures alongside the hospital rankings.
The new measures examine whether the patients each hospital has treated reflect the racial and ethnic diversity of the surrounding community, among other aspects of health equity.
“At roughly four out of five hospitals, we found that the community’s minority residents were underrepresented among patients receiving services such as joint replacement, cancer surgery and common heart procedures,” Mr. Harder said.
“Against this backdrop, however, we found important exceptions – hospitals that provide care to a disproportionate share of their community’s minority residents. These metrics are just a beginning; we aim to expand on our measurement of health equity in the future,” Mr. Harder added.
Mayo and Cleveland Clinic remain tops
Following the Mayo Clinic, the Cleveland Clinic once again takes the No. 2 spot in the magazine’s latest annual honor roll of best hospitals, which highlights hospitals that deliver exceptional treatment across multiple areas of care.
UCLA Medical Center, Los Angeles, holds the No. 3 spot in 2021. In 2020, UCLA Medical Center and New York–Presbyterian Hospital–Columbia and Cornell, New York, sat in a tie at No. 4.
In 2021, Johns Hopkins Hospital, Baltimore, which held the No. 3 spot in 2020, drops to No. 4, while Massachusetts General Hospital in Boston takes the No. 5 spot, up from No. 6 in 2020.
Rounding out the top 10 (in order) are Cedars-Sinai Medical Center, Los Angeles; New York–Presbyterian Hospital–Columbia and Cornell, New York; NYU Langone Hospitals, New York; UCSF Medical Center, San Francisco; and Northwestern Memorial Hospital, Chicago.
2021-2022 Best Hospitals honor roll
1. Mayo Clinic, Rochester, Minn.
2. Cleveland Clinic, Cleveland
3. UCLA Medical Center, Los Angeles
4. Johns Hopkins Hospital, Baltimore
5. Massachusetts General Hospital, Boston
6. Cedars-Sinai Medical Center, San Francisco
7. New York–Presbyterian Hospital–Columbia and Cornell, New York
8. NYU Langone Hospitals, New York
9. UCSF Medical Center, San Francisco
10. Northwestern Memorial Hospital, Chicago
11. University of Michigan Hospitals–Michigan Medicine, Ann Arbor.
12. Stanford Health Care–Stanford Hospital, Palo Alto, Calif.
13. Hospitals of the University of Pennsylvania–Penn Presbyterian, Philadelphia
14. Brigham and Women’s Hospital, Boston
15. Mayo Clinic–Phoenix, Phoenix
16. Houston Methodist Hospital, Houston
17. (tie) Barnes-Jewish Hospital, St. Louis
17. (tie) Mount Sinai Hospital, New York Rush University Medical Center, Chicago
19. Rush University Medical Center, Chicago
20. Vanderbilt University Medical Center, Nashville, Tenn.
For the 2021-2022 rankings and ratings, the magazine compared more than 4,750 hospitals nationwide in 15 specialties and 17 procedures and conditions.
At least 2,039 hospitals received a high performance rating in at least one of the services rated; 11 hospitals received high performance in all 17. A total of 175 hospitals were nationally ranked in at least one specialty
For specialty rankings, the University of Texas MD Anderson Cancer Center continues to hold the No. 1 spot in cancer care, the Hospital for Special Surgery continues to be No. 1 in orthopedics, and the Cleveland Clinic continues to be No. 1 in cardiology and heart surgery.
Top five for cancer
1. University of Texas MD Anderson Cancer Center, Houston
2. Memorial Sloan Kettering Cancer Center, New York
3. Mayo Clinic, Rochester, Minn.
4. Dana-Farber/Brigham & Women’s Cancer Center, Boston
5. Cleveland Clinic, Cleveland
Top five for cardiology and heart surgery
1. Cleveland Clinic, Cleveland
2. Mayo Clinic, Rochester, Minn.
3. Cedars-Sinai Medical Center, Los Angeles
4. New York–Presbyterian Hospital–Columbia and Cornell, New York
5. NYU Langone Hospitals, New York
Top five for orthopedics
1. Hospital for Special Surgery, New York
2. Mayo Clinic, Rochester, Minn.
3. Cedars-Sinai Medical Center, Los Angeles
4. NYU Langone Orthopedic Hospital, New York
5. UCLA Medical Center, Los Angeles
The magazine noted that data for the 2021-2022 Best Hospitals rankings and ratings were not affected by the COVID-19 pandemic, which began after the end of the data collection period.
The methodologies used in determining the rankings are based largely on objective measures, such as risk-adjusted survival, discharge-to-home rates, volume, and quality of nursing, among other care-related indicators.
The full report is available online.
A version of this article first appeared on Medscape.com.
Is your patient a candidate for Mohs micrographic surgery?
Mohs micrographic surgery (MMS) is a unique dermatologic surgery technique that allows the dermatologist to fill the concomitant roles of surgeon and pathologist. It is utilized for the extirpation of skin malignancy, with an emphasis on tissue preservation and immediate surgical margin evaluation. In MMS, the Mohs surgeon acts as the surgeon for physical removal of the lesion and the pathologist during evaluation of frozen section margins.1
Primary care providers (PCPs) are on the frontlines of management of cutaneous malignancy. Whether referring to Dermatology for biopsy or performing a biopsy themselves, PCPs can assure optimal treatment outcomes by guiding patients to evidence-based treatments, while still respecting the patient’s wishes. In this evidence-based review of the advantages, improved outcomes, and safety of Mohs surgery for the treatment of common and rare skin neoplasms, we provide our primary care colleagues with information on the indications, process (the order in which steps of the procedure are performed), and techniques used for treating cutaneous malignancies with Mohs surgery.
When is Mohs surgery appropriate?
MMS has typically been reserved for treatment of cutaneous malignancy in cosmetically sensitive areas where tissue preservation is key. In 2012, Connolly et al released appropriate use criteria (AUC) for MMS.2 (See “An app that helps clinicians apply the criteria for Mohs surgery.”) Within the AUC, there are 4 major qualitative and quantitative categories when considering referral for MMS:
- area of the body in which the lesion manifests
- the patient’s medical characteristics
- tumor characteristics
- the size of the lesion to be treated.2
Areas of the body are divided into 3 categories by the AUC according to how challenging tumor extirpation is expected to be and how critical tissue preservation is. Areas termed “H” receive the highest score for appropriate Mohs usage, followed by areas “M” and “L.”
SIDEBAR
An app that helps clinicians apply the criteria for Mohs surgery
“Mohs Surgery Appropriate Use Criteria” is a free and easy-to-use smartphone application to help determine whether Mohs micrographic surgery (MMS) is appropriate for a particular patient. Clinicians can enter the details of a recent skin cancer biopsy along with patient information into the app and it will calculate a score automatically categorized into 1 of 3 categories: “appropriate,” “uncertain,” and “not appropriate” for MMS. The clinician can then talk to the patient about a possible referral to a Mohs surgeon, depending on the appropriateness of the procedure for the patient and their tumor.
Patient medical characteristics that should be taken into account when referring for Mohs surgery are the patient’s immune status, genetic syndromes that may predispose the patient to cutaneous malignancies (eg, xeroderma pigmentosa), history of radiation to the area of involvement, and the patient’s history of aggressive cutaneous malignancies.
Tumor characteristics. The most common malignancies treated with MMS include basal cell carcinoma (BCC) and squamous cell carcinoma (SCC). These malignancies are further delineated through histologic evaluation by a pathologist or dermatopathologist. Aggressive features of a BCC on any area of the body that warrant referral to a Mohs surgeon include morpheaform/fibrosing/sclerosing histologic findings, as well as micronodular architecture and perineural invasion. Concerning histologic SCC findings that warrant Mohs surgery through the AUC include sclerosing, basosquamous, and small cell histology, as well as poorly differentiated and/or undifferentiated SCC.
Melanoma in situ and lentigo maligna, which are variants of melanoma limited to the epidermis without invasion into the underlying dermis, are included within the AUC for MMS. For invasive melanoma (melanoma that has invaded into the dermis or subcutaneous tissue), MMS has been shown to have marginal benefit but currently is not included within the AUC.3
Continue to: Due to excellent margin control...
Due to excellent margin control via immediate microscopic evaluation of surgical margins, MMS is an appropriate treatment choice and indicated for many more uncommon cutaneous malignancies, including sebaceous and mucinous carcinoma, microcystic adnexal carcinoma, Merkel cell carcinoma, leiomyosarcoma, dermatofibrosarcoma protuberans, atypical fibroxanthoma, angiosarcoma, and other more rarely encountered clinical malignancies.2
Tumor size. When considering a referral to MMS for cancer extirpation, the size of the tumor does play a role; however, size depends on the type of tumor as well as the location on the body. In general, most skin cancers of any size on the face, perianal area, genitalia, nipples, hands, feet and ankles, or pretibial surface are appropriate for Mohs surgery. Skin cancers on the trunk and extremities are also appropriate if they are above a certain size specified by the AUC. Tumor type and whether they are recurrences also factor into the equation.
Who will do the procedure?
A recent review showed that PCPs were more likely to refer patients to plastic surgery rather than Mohs surgery for skin cancer removal, especially among younger female patients.4 This is likely because of the perception that plastic surgeons do more complex closures and have more experience removing difficult cancers. Interestingly, this same study showed that Mohs surgeons may actually be doing several-fold more complex closures (flaps and grafts) on the nose and ears than plastic surgeons at similar practice settings.4
Aside from Mohs surgeons doing more closures, perhaps the biggest difference between Mohs surgeons and plastic surgeons is the pathology training of the Mohs surgeon. Mohs surgeons evaluate 100% of the tissue margins at the time of the procedure to both ensure complete tumor removal and to preserve as much tumor-free skin as possible, ultimately resulting in decreased recurrences and smaller scars. In contrast, the plastic surgeon’s rigorous training typically does not include extensive dermatopathology training, particularly the pathology of cutaneous neoplasms. Plastic surgeons will often send pathologic specimens for evaluation, meaning patients have to wait for outside histologic confirmation before their wounds can be closed. Additionally, the histologic evaluation is often not a full-margin assessment, as not all labs are equipped for this technique.
Consider early consultation with a Mohs surgeon for tumor extirpation to keep the defect size as small as possible, as MMS does not require taking margins of healthy surrounding tissue, in contrast to wide local excisions (WLEs; FIGURE 1). A smaller initial incision will result in a smaller scar, which is likely to have better cosmetic outcomes and decreased risk for wound infection.

Continue to: Before consultation...
Before consultation, include a picture of the surgical site with the patient’s referral documentation or have the patient present a photo from his or her phone to the Mohs surgeon. (If a camera or cell phone is not available, triangulation of the site’s location using cosmetic landmarks can be documented in the patient’s chart.)
What the patient can expect during preop visits
During an initial consultation, patients can expect an evaluation by the surgeon that will include more photo taking, a discussion of the surgery, and possibly, performance of an in-clinic biopsy of suspicious lesions. Many practices, including the authors’, use a photo capturing add-on for the EMR in the office.5-7
During the consent process, MMS is described to the patient using lay language and, often, pictorial depictions of the procedure. While explaining that the procedure helps preserve healthy tissue and limit the size of the resulting scar, the surgeon will typically manage the expectations of the patient prior to the first incision. Many clinically small lesions can have significant subclinical extension adjacent to, or on top of, cosmetic landmarks, requiring a flap or graft to close the surgical defect with acceptable cosmetic outcomes.8
One more time. Immediately before surgery, the surgeon will again review the procedure with the patient, using photos of the biopsy site taken during the initial consult, in conjunction with patient verification of the biopsy site, to verify the surgical site and confirm that the patient understands and agrees to the surgery.
A look at how Mohs surgery is performed
MMS typically is performed in the outpatient setting but can also be performed in an operating room or outpatient surgical center. MMS can be performed in a nonsterile procedure room with surgeons and assistants typically utilizing clean, nonsterile gloves, although many Mohs surgeons prefer to perform part, or all, of the technique using sterile gloves.9 A recent systematic review and large meta-analysis showed no significant difference in postsurgical site infections when comparing the use of sterile vs nonsterile gloves.10
Continue to: Prior to initial incision...
Prior to initial incision, the site is marked with a surgical pen and given 1-mm margins around the clinically visualized lesion. The site is then cleansed with an antiseptic, typically a chlorhexidine solution. Local anesthesia is employed, most commonly with a 1:100,000 lidocaine and epinephrine injection. Marking of the tumor prior to numbing is imperative, as the boundaries of the tumor are typically obscured when the local cutaneous vasculature constricts and causes visualized blanching of adjacent skin. Many Mohs surgeons perform a brief curettage of the lesion with a nondisposable, dull curette to better define the tumor edges and to debulk any obvious exophytic tumor noted by the naked eye.
Prior to the first incision, the surgical site is scored in a variety of ways in order to properly orient the tissue after it has been removed from the patient. Mohs surgeons have differing opinions on how to score and/or mark the tissue, but a common practice is to make a nick at the 12 o’clock position. Following removal of the first stage, the nick will be visible on both the extirpated tissue and the tissue just above the surgical defect. This prevents potential confusion regarding orientation during tissue processing.
The majority of all WLEs are performed utilizing the scalpel blade at an angle 90° perpendicular to the plane of the skin. In MMS, a signature 45° angle with the tip of the scalpel pointing toward, and the handle pointing away from, the lesion is commonly used in order to bevel the tissue being excised (FIGURE 2). Once the tissue is excised, hemostasis is obtained using electrodessication/electrofulguration or electrocoagulation.

Tissue processing and microscopic evaluation
The technique of beveling allows the epidermis, dermis, and subcutaneous tissue to lie flat on the tissue block, so the Mohs surgeon can evaluate 100% of the excised tissue’s margins. The tissue is transported to a nearby lab for staining and processing. Even if near-perfect beveling is achieved, many stages will require bisecting, quadrissecting, or relaxing cuts in order to allow the margins to lie flat on the tissue block.
Using the scoring system made prior to incision, the tissue is oriented and stained with colored ink. Subsequently, a map is made with sections highlighting the colors used to stain designated areas of the tissue. This step is imperative for orientation during microscopic evaluation. Additionally, the map serves as a guide and log, should a section of the specimen have an involved margin and require another stage.
Continue to: Once fixed to the block...
Once fixed to the block, the tissue is engulfed in appropriate embedding medium and placed within the cryostat. The block is slowly cut to produce several micron-thin wafers of tissue that are then mounted on glass slides and processed with hematoxylin and eosin (H&E) or various stains. The first wafers of tissue that come from the tissue block are those that are closest to the margin that was excised. Thus, 100% of the epidermis and deep margin can be visualized. “Deeper sections” are those that come from deeper cuts within the tissue and are more likely to show the malignant neoplasm.
The evaluation of immediate margins at the very edge of the tissue is in contrast to the technique of “bread-loafing,” which is the standard of evaluating margins after a WLE.11 With this process, the pathologist examines sections that are cut 2- to 4-mm apart. This process only allows the pathologist to examine roughly 1% of the total tissue that was excised, and large variability in cutaneous representation can occur depending on the individual who cuts and processes the tissue.11
Closing the defect
Once the site is deemed clear of residual tumor, the Mohs surgeon approaches the defect and determines the most appropriate way to close the surgical wound. Mohs surgeons are trained to close wounds using a variety of methods, including complex linear closures, flaps, and full-thickness skin grafts. Thoughtful consideration of local anatomy, cosmetic landmarks that may be affected by the closure method, and local tissue laxity are evaluated.
Depending on the location, a secondary intention closure may prove to be just as effective and cosmetically satisfying as a primary intention closure. In light of the many methods of closure, a complex or large surface area defect may better be suited for evaluation and closure by another specialist such as an ENT physician, ophthalmologist, or plastic surgeon.12
Lower recurrence rates for patients who undergo Mohs surgery
As noted earlier, the cutaneous malignancies most commonly treated with MMS are BCCs, followed by SCCs.13 Comparison studies between WLE and MMS show clinically significant differences in terms of recurrence rates between the 2 procedures.
Continue to: For BCCs
For BCCs, recurrence rates for excisions vs MMS are 10% and 1%, respectively.14-16 A randomized trial reviewing 10-year recurrence of primary BCCs on the face showed recurrence rates for MMS of 4.4% compared to 12.2% for WLE.17 This study also showed recurrence rates for recurrent facial BCCs treated with MMS to be 3.9% vs 13.5% for standard WLE.17
SCC. The evidence similarly supports the efficacy of MMS for SCCs. A recent study showed primary T2a tumors had a 1.2% local recurrence rate with Mohs vs a 4% recurrence rate with WLE at an average follow-up of 2.8 years.18 Another study showed that primary tumors that were < 2 cm in diameter had a 5-year cure rate of 99% with Mohs surgery.11
Melanoma in situ. A few studies have shown no clinically significant benefit of MMS compared to WLE when it comes to melanoma in situ.19,20 However, a more recent article by Etzkom et al noted the ability to potentially upstage melanoma in situ and invasive melanoma after reviewing peripheral and deep margins during MMS.21 In this study, the authors uniquely delayed wound closure if upstaging was established and the need for a sentinel lymph node biopsy was warranted. This approach to MMS with delayed closure ultimately paved the way for very low recurrence rates.
CORRESPONDENCE
Andres Garcia, MD, 2612 112th Street, Lubbock, TX 79423; [email protected]
1. Dim-Jamora KC, Perone JB. Management of cutaneous tumors with Mohs micrographic surgery. Semin Plast Surg. 2008;22:247-256.
2. Ad Hoc Task Force, Connolly SM, Baker DR, et al. AAD/ACMS/ASDSA/ASMS 2012 appropriate use criteria for Mohs micrographic surgery: a report of the American Academy of Dermatology, American College of Mohs Surgery, American Society for Dermatologic Surgery Association, and the American Society for Mohs Surgery. J Am Acad Dermatol. 2012;67:531-550. Published correction appears in J Am Acad Dermatol. 2015;72:748.
3. Cheraghlou S, Christensen S, Agogo G, et al. Comparison of survival after Mohs micrographic surgery vs wide margin excision for early-stage invasive melanoma. JAMA Dermatol. 2019;155:1252-1259.
4. Hill D, Kim K, Mansouri B, et al. Quantity and characteristics of flap or graft repairs for skin cancer on the nose or ears: a comparison between Mohs micrographic surgery and plastic surgery. Cutis. 2019;103:284-287.
5. McGinness JL, Goldstein G. The value of preoperative biopsy-site photography for identifying cutaneous lesions. Dermatol Surg. 2010;36:194-197.
6. Ke M, Moul D, Camouse M, et al. Where is it? The utility of biopsy-site photography. Dermatol Surg. 2010;36:198-202.
7. Nijhawan RI, Lee EH, Nehal KS. Biopsy site selfies—a quality improvement pilot study to assist with correct surgical site identification. Dermatol Surg. 2015;41:499-504
8. Breuninger H, Dietz K. Prediction of subclinical tumor infiltration in basal cell carcinoma. J Dermatol Surg Oncol. 1991;17:574-578.
9. Rhinehart BM, Murphy Me, Farley MF, et al. Sterile versus nonsterile gloves during Mohs micrographic surgery: infection rate is not affected. Dermatol Surg. 2006;32:170-176.
10. Brewer JD, Gonzalez AB, Baum CL, et al. Comparison of sterile vs nonsterile gloves in cutaneous surgery and common outpatient dental procedures: a systematic review and meta-analysis. JAMA Dermatol. 2016;152:1008-1014.
11. Shriner DL, McCoy DK, Goldberg DJ, et al. Mohs micrographic surgery. J Am Acad Dermatol. 1998;39:79-97.
12. Gladstone HB, Stewart D. An algorithm for the reconstruction of complex facial defects. Skin Therapy Lett. 2007;12:6-9.
13. Robinson JK. Mohs micrographic surgery. Clin Plast Surg. 1993;20:149-156.
14. Swanson NA. Mohs surgery. Technique, indications, applications, and the future. Arch Dermatol. 1983;119:761-773.
15. Robins P. Chemosurgery: my 15 years of experience. J Dermatol Surg Oncol. 1981;7:779-789.
16. Rowe DE, Carroll RJ, Day CL Jr. Long-term recurrence rates in previously untreated (primary) basal cell carcinoma: implications for patient follow-up. J Dermatol Surg Oncol. 1989;15:315-328.
17. van Loo E, Mosterd K, Krekels GA, et al. Surgical excision versus Mohs’ micrographic surgery for basal cell carcinoma of the face: a randomised clinical trial with 10 year follow-up. Eur J Cancer. 2014;50:3011-3020.
18. Xiong DD, Beal BT, Varra V, et al. Outcomes in intermediate-risk squamous cell carcinomas treated with Mohs micrographic surgery compared with wide local excision. J Am Acad Dermatol. 2020;82: 1195-1204.
19. Trofymenko O, Bordeaux JS, Zeitouni NC. Melanoma of the face and Mohs micrographic surgery: nationwide mortality data analysis. Dermatol Surg. 2018;44:481-492.
20. Nosrati A, Berliner JG, Goel S, et al. Outcomes of melanoma in situ treated with Mohs micrographic surgery compared with wide local excision. JAMA Dermatol. 2017;153:436-441.
21. Etzkom JR, Sobanko JF, Elenitsas R, et al. Low recurrences for in situ and invasive melanomas using Mohs micrographic surgery with melanoma antigen recognized by T cells 1 (MART-1) immunostaining: tissue processing methodology to optimize pathologic and margin assessment. J Am Acad Dermatol. 2015;72:840-850.
Mohs micrographic surgery (MMS) is a unique dermatologic surgery technique that allows the dermatologist to fill the concomitant roles of surgeon and pathologist. It is utilized for the extirpation of skin malignancy, with an emphasis on tissue preservation and immediate surgical margin evaluation. In MMS, the Mohs surgeon acts as the surgeon for physical removal of the lesion and the pathologist during evaluation of frozen section margins.1
Primary care providers (PCPs) are on the frontlines of management of cutaneous malignancy. Whether referring to Dermatology for biopsy or performing a biopsy themselves, PCPs can assure optimal treatment outcomes by guiding patients to evidence-based treatments, while still respecting the patient’s wishes. In this evidence-based review of the advantages, improved outcomes, and safety of Mohs surgery for the treatment of common and rare skin neoplasms, we provide our primary care colleagues with information on the indications, process (the order in which steps of the procedure are performed), and techniques used for treating cutaneous malignancies with Mohs surgery.
When is Mohs surgery appropriate?
MMS has typically been reserved for treatment of cutaneous malignancy in cosmetically sensitive areas where tissue preservation is key. In 2012, Connolly et al released appropriate use criteria (AUC) for MMS.2 (See “An app that helps clinicians apply the criteria for Mohs surgery.”) Within the AUC, there are 4 major qualitative and quantitative categories when considering referral for MMS:
- area of the body in which the lesion manifests
- the patient’s medical characteristics
- tumor characteristics
- the size of the lesion to be treated.2
Areas of the body are divided into 3 categories by the AUC according to how challenging tumor extirpation is expected to be and how critical tissue preservation is. Areas termed “H” receive the highest score for appropriate Mohs usage, followed by areas “M” and “L.”
SIDEBAR
An app that helps clinicians apply the criteria for Mohs surgery
“Mohs Surgery Appropriate Use Criteria” is a free and easy-to-use smartphone application to help determine whether Mohs micrographic surgery (MMS) is appropriate for a particular patient. Clinicians can enter the details of a recent skin cancer biopsy along with patient information into the app and it will calculate a score automatically categorized into 1 of 3 categories: “appropriate,” “uncertain,” and “not appropriate” for MMS. The clinician can then talk to the patient about a possible referral to a Mohs surgeon, depending on the appropriateness of the procedure for the patient and their tumor.
Patient medical characteristics that should be taken into account when referring for Mohs surgery are the patient’s immune status, genetic syndromes that may predispose the patient to cutaneous malignancies (eg, xeroderma pigmentosa), history of radiation to the area of involvement, and the patient’s history of aggressive cutaneous malignancies.
Tumor characteristics. The most common malignancies treated with MMS include basal cell carcinoma (BCC) and squamous cell carcinoma (SCC). These malignancies are further delineated through histologic evaluation by a pathologist or dermatopathologist. Aggressive features of a BCC on any area of the body that warrant referral to a Mohs surgeon include morpheaform/fibrosing/sclerosing histologic findings, as well as micronodular architecture and perineural invasion. Concerning histologic SCC findings that warrant Mohs surgery through the AUC include sclerosing, basosquamous, and small cell histology, as well as poorly differentiated and/or undifferentiated SCC.
Melanoma in situ and lentigo maligna, which are variants of melanoma limited to the epidermis without invasion into the underlying dermis, are included within the AUC for MMS. For invasive melanoma (melanoma that has invaded into the dermis or subcutaneous tissue), MMS has been shown to have marginal benefit but currently is not included within the AUC.3
Continue to: Due to excellent margin control...
Due to excellent margin control via immediate microscopic evaluation of surgical margins, MMS is an appropriate treatment choice and indicated for many more uncommon cutaneous malignancies, including sebaceous and mucinous carcinoma, microcystic adnexal carcinoma, Merkel cell carcinoma, leiomyosarcoma, dermatofibrosarcoma protuberans, atypical fibroxanthoma, angiosarcoma, and other more rarely encountered clinical malignancies.2
Tumor size. When considering a referral to MMS for cancer extirpation, the size of the tumor does play a role; however, size depends on the type of tumor as well as the location on the body. In general, most skin cancers of any size on the face, perianal area, genitalia, nipples, hands, feet and ankles, or pretibial surface are appropriate for Mohs surgery. Skin cancers on the trunk and extremities are also appropriate if they are above a certain size specified by the AUC. Tumor type and whether they are recurrences also factor into the equation.
Who will do the procedure?
A recent review showed that PCPs were more likely to refer patients to plastic surgery rather than Mohs surgery for skin cancer removal, especially among younger female patients.4 This is likely because of the perception that plastic surgeons do more complex closures and have more experience removing difficult cancers. Interestingly, this same study showed that Mohs surgeons may actually be doing several-fold more complex closures (flaps and grafts) on the nose and ears than plastic surgeons at similar practice settings.4
Aside from Mohs surgeons doing more closures, perhaps the biggest difference between Mohs surgeons and plastic surgeons is the pathology training of the Mohs surgeon. Mohs surgeons evaluate 100% of the tissue margins at the time of the procedure to both ensure complete tumor removal and to preserve as much tumor-free skin as possible, ultimately resulting in decreased recurrences and smaller scars. In contrast, the plastic surgeon’s rigorous training typically does not include extensive dermatopathology training, particularly the pathology of cutaneous neoplasms. Plastic surgeons will often send pathologic specimens for evaluation, meaning patients have to wait for outside histologic confirmation before their wounds can be closed. Additionally, the histologic evaluation is often not a full-margin assessment, as not all labs are equipped for this technique.
Consider early consultation with a Mohs surgeon for tumor extirpation to keep the defect size as small as possible, as MMS does not require taking margins of healthy surrounding tissue, in contrast to wide local excisions (WLEs; FIGURE 1). A smaller initial incision will result in a smaller scar, which is likely to have better cosmetic outcomes and decreased risk for wound infection.
Continue to: Before consultation...
Before consultation, include a picture of the surgical site with the patient’s referral documentation or have the patient present a photo from his or her phone to the Mohs surgeon. (If a camera or cell phone is not available, triangulation of the site’s location using cosmetic landmarks can be documented in the patient’s chart.)
What the patient can expect during preop visits
During an initial consultation, patients can expect an evaluation by the surgeon that will include more photo taking, a discussion of the surgery, and possibly, performance of an in-clinic biopsy of suspicious lesions. Many practices, including the authors’, use a photo capturing add-on for the EMR in the office.5-7
During the consent process, MMS is described to the patient using lay language and, often, pictorial depictions of the procedure. While explaining that the procedure helps preserve healthy tissue and limit the size of the resulting scar, the surgeon will typically manage the expectations of the patient prior to the first incision. Many clinically small lesions can have significant subclinical extension adjacent to, or on top of, cosmetic landmarks, requiring a flap or graft to close the surgical defect with acceptable cosmetic outcomes.8
One more time. Immediately before surgery, the surgeon will again review the procedure with the patient, using photos of the biopsy site taken during the initial consult, in conjunction with patient verification of the biopsy site, to verify the surgical site and confirm that the patient understands and agrees to the surgery.
A look at how Mohs surgery is performed
MMS typically is performed in the outpatient setting but can also be performed in an operating room or outpatient surgical center. MMS can be performed in a nonsterile procedure room with surgeons and assistants typically utilizing clean, nonsterile gloves, although many Mohs surgeons prefer to perform part, or all, of the technique using sterile gloves.9 A recent systematic review and large meta-analysis showed no significant difference in postsurgical site infections when comparing the use of sterile vs nonsterile gloves.10
Continue to: Prior to initial incision...
Prior to initial incision, the site is marked with a surgical pen and given 1-mm margins around the clinically visualized lesion. The site is then cleansed with an antiseptic, typically a chlorhexidine solution. Local anesthesia is employed, most commonly with a 1:100,000 lidocaine and epinephrine injection. Marking of the tumor prior to numbing is imperative, as the boundaries of the tumor are typically obscured when the local cutaneous vasculature constricts and causes visualized blanching of adjacent skin. Many Mohs surgeons perform a brief curettage of the lesion with a nondisposable, dull curette to better define the tumor edges and to debulk any obvious exophytic tumor noted by the naked eye.
Prior to the first incision, the surgical site is scored in a variety of ways in order to properly orient the tissue after it has been removed from the patient. Mohs surgeons have differing opinions on how to score and/or mark the tissue, but a common practice is to make a nick at the 12 o’clock position. Following removal of the first stage, the nick will be visible on both the extirpated tissue and the tissue just above the surgical defect. This prevents potential confusion regarding orientation during tissue processing.
The majority of all WLEs are performed utilizing the scalpel blade at an angle 90° perpendicular to the plane of the skin. In MMS, a signature 45° angle with the tip of the scalpel pointing toward, and the handle pointing away from, the lesion is commonly used in order to bevel the tissue being excised (FIGURE 2). Once the tissue is excised, hemostasis is obtained using electrodessication/electrofulguration or electrocoagulation.
Tissue processing and microscopic evaluation
The technique of beveling allows the epidermis, dermis, and subcutaneous tissue to lie flat on the tissue block, so the Mohs surgeon can evaluate 100% of the excised tissue’s margins. The tissue is transported to a nearby lab for staining and processing. Even if near-perfect beveling is achieved, many stages will require bisecting, quadrissecting, or relaxing cuts in order to allow the margins to lie flat on the tissue block.
Using the scoring system made prior to incision, the tissue is oriented and stained with colored ink. Subsequently, a map is made with sections highlighting the colors used to stain designated areas of the tissue. This step is imperative for orientation during microscopic evaluation. Additionally, the map serves as a guide and log, should a section of the specimen have an involved margin and require another stage.
Continue to: Once fixed to the block...
Once fixed to the block, the tissue is engulfed in appropriate embedding medium and placed within the cryostat. The block is slowly cut to produce several micron-thin wafers of tissue that are then mounted on glass slides and processed with hematoxylin and eosin (H&E) or various stains. The first wafers of tissue that come from the tissue block are those that are closest to the margin that was excised. Thus, 100% of the epidermis and deep margin can be visualized. “Deeper sections” are those that come from deeper cuts within the tissue and are more likely to show the malignant neoplasm.
The evaluation of immediate margins at the very edge of the tissue is in contrast to the technique of “bread-loafing,” which is the standard of evaluating margins after a WLE.11 With this process, the pathologist examines sections that are cut 2- to 4-mm apart. This process only allows the pathologist to examine roughly 1% of the total tissue that was excised, and large variability in cutaneous representation can occur depending on the individual who cuts and processes the tissue.11
Closing the defect
Once the site is deemed clear of residual tumor, the Mohs surgeon approaches the defect and determines the most appropriate way to close the surgical wound. Mohs surgeons are trained to close wounds using a variety of methods, including complex linear closures, flaps, and full-thickness skin grafts. Thoughtful consideration of local anatomy, cosmetic landmarks that may be affected by the closure method, and local tissue laxity are evaluated.
Depending on the location, a secondary intention closure may prove to be just as effective and cosmetically satisfying as a primary intention closure. In light of the many methods of closure, a complex or large surface area defect may better be suited for evaluation and closure by another specialist such as an ENT physician, ophthalmologist, or plastic surgeon.12
Lower recurrence rates for patients who undergo Mohs surgery
As noted earlier, the cutaneous malignancies most commonly treated with MMS are BCCs, followed by SCCs.13 Comparison studies between WLE and MMS show clinically significant differences in terms of recurrence rates between the 2 procedures.
Continue to: For BCCs
For BCCs, recurrence rates for excisions vs MMS are 10% and 1%, respectively.14-16 A randomized trial reviewing 10-year recurrence of primary BCCs on the face showed recurrence rates for MMS of 4.4% compared to 12.2% for WLE.17 This study also showed recurrence rates for recurrent facial BCCs treated with MMS to be 3.9% vs 13.5% for standard WLE.17
SCC. The evidence similarly supports the efficacy of MMS for SCCs. A recent study showed primary T2a tumors had a 1.2% local recurrence rate with Mohs vs a 4% recurrence rate with WLE at an average follow-up of 2.8 years.18 Another study showed that primary tumors that were < 2 cm in diameter had a 5-year cure rate of 99% with Mohs surgery.11
Melanoma in situ. A few studies have shown no clinically significant benefit of MMS compared to WLE when it comes to melanoma in situ.19,20 However, a more recent article by Etzkom et al noted the ability to potentially upstage melanoma in situ and invasive melanoma after reviewing peripheral and deep margins during MMS.21 In this study, the authors uniquely delayed wound closure if upstaging was established and the need for a sentinel lymph node biopsy was warranted. This approach to MMS with delayed closure ultimately paved the way for very low recurrence rates.
CORRESPONDENCE
Andres Garcia, MD, 2612 112th Street, Lubbock, TX 79423; [email protected]
1. Dim-Jamora KC, Perone JB. Management of cutaneous tumors with Mohs micrographic surgery. Semin Plast Surg. 2008;22:247-256.
2. Ad Hoc Task Force, Connolly SM, Baker DR, et al. AAD/ACMS/ASDSA/ASMS 2012 appropriate use criteria for Mohs micrographic surgery: a report of the American Academy of Dermatology, American College of Mohs Surgery, American Society for Dermatologic Surgery Association, and the American Society for Mohs Surgery. J Am Acad Dermatol. 2012;67:531-550. Published correction appears in J Am Acad Dermatol. 2015;72:748.
3. Cheraghlou S, Christensen S, Agogo G, et al. Comparison of survival after Mohs micrographic surgery vs wide margin excision for early-stage invasive melanoma. JAMA Dermatol. 2019;155:1252-1259.
4. Hill D, Kim K, Mansouri B, et al. Quantity and characteristics of flap or graft repairs for skin cancer on the nose or ears: a comparison between Mohs micrographic surgery and plastic surgery. Cutis. 2019;103:284-287.
5. McGinness JL, Goldstein G. The value of preoperative biopsy-site photography for identifying cutaneous lesions. Dermatol Surg. 2010;36:194-197.
6. Ke M, Moul D, Camouse M, et al. Where is it? The utility of biopsy-site photography. Dermatol Surg. 2010;36:198-202.
7. Nijhawan RI, Lee EH, Nehal KS. Biopsy site selfies—a quality improvement pilot study to assist with correct surgical site identification. Dermatol Surg. 2015;41:499-504
8. Breuninger H, Dietz K. Prediction of subclinical tumor infiltration in basal cell carcinoma. J Dermatol Surg Oncol. 1991;17:574-578.
9. Rhinehart BM, Murphy Me, Farley MF, et al. Sterile versus nonsterile gloves during Mohs micrographic surgery: infection rate is not affected. Dermatol Surg. 2006;32:170-176.
10. Brewer JD, Gonzalez AB, Baum CL, et al. Comparison of sterile vs nonsterile gloves in cutaneous surgery and common outpatient dental procedures: a systematic review and meta-analysis. JAMA Dermatol. 2016;152:1008-1014.
11. Shriner DL, McCoy DK, Goldberg DJ, et al. Mohs micrographic surgery. J Am Acad Dermatol. 1998;39:79-97.
12. Gladstone HB, Stewart D. An algorithm for the reconstruction of complex facial defects. Skin Therapy Lett. 2007;12:6-9.
13. Robinson JK. Mohs micrographic surgery. Clin Plast Surg. 1993;20:149-156.
14. Swanson NA. Mohs surgery. Technique, indications, applications, and the future. Arch Dermatol. 1983;119:761-773.
15. Robins P. Chemosurgery: my 15 years of experience. J Dermatol Surg Oncol. 1981;7:779-789.
16. Rowe DE, Carroll RJ, Day CL Jr. Long-term recurrence rates in previously untreated (primary) basal cell carcinoma: implications for patient follow-up. J Dermatol Surg Oncol. 1989;15:315-328.
17. van Loo E, Mosterd K, Krekels GA, et al. Surgical excision versus Mohs’ micrographic surgery for basal cell carcinoma of the face: a randomised clinical trial with 10 year follow-up. Eur J Cancer. 2014;50:3011-3020.
18. Xiong DD, Beal BT, Varra V, et al. Outcomes in intermediate-risk squamous cell carcinomas treated with Mohs micrographic surgery compared with wide local excision. J Am Acad Dermatol. 2020;82: 1195-1204.
19. Trofymenko O, Bordeaux JS, Zeitouni NC. Melanoma of the face and Mohs micrographic surgery: nationwide mortality data analysis. Dermatol Surg. 2018;44:481-492.
20. Nosrati A, Berliner JG, Goel S, et al. Outcomes of melanoma in situ treated with Mohs micrographic surgery compared with wide local excision. JAMA Dermatol. 2017;153:436-441.
21. Etzkom JR, Sobanko JF, Elenitsas R, et al. Low recurrences for in situ and invasive melanomas using Mohs micrographic surgery with melanoma antigen recognized by T cells 1 (MART-1) immunostaining: tissue processing methodology to optimize pathologic and margin assessment. J Am Acad Dermatol. 2015;72:840-850.
PRACTICE RECOMMENDATIONS
› Consider Mohs surgery for patients who have lesions located mainly in regions of the face that make excision difficult without significant scarring. A
› Consider Mohs surgery for basal cell carcinoma and squamous cell carcinoma that typically involve (but are not necessarily limited to) the face, as the procedure significantly reduces recurrence rates and leads to cure rates of up to 99%. A
Strength of recommendation (SOR)
A Good-quality patient-oriented evidence
B Inconsistent or limited-quality patient-oriented evidence
C Consensus, usual practice, opinion, disease-oriented evidence, case series

A clarion call for regulating PBMs: Health care groups, states push back on legal challenges
Mark Nelson, PharmD, recalls the anguish when a major pharmacy benefit manager (PBM) moved all veteran patients with prostate cancer at his facility from an effective medication to a pricier alternative therapy. “All of these patients were stable on their therapy and were extremely distraught about their medications being changed,” said Dr. Nelson, CEO of Northwest Medical Specialties in Washington State. While there was no clinical reason to change the medication, “our oncologists had no choice other than to comply,” he said.

It’s unclear why a PBM would switch to a more expensive medication that has no additional clinical benefit, he continued. “Why upset so many veterans? For what reason? We were not given a reason despite our very vocal protest.”
Angus B. Worthing, MD, sees these scenarios unfold every day in his rheumatology practice in the Washington, D.C., area. “In my clinic with 25 doctors, we have three full-time people that only handle PBMs,” he said in an interview. He and others in the medical community, as well as many states, have been pushing back on what they see as efforts by PBMs to raise drug prices and collect the profits at the expense of patients.
PCMA’s challenges against PBM law
The Pharmaceutical Care Management Association (PCMA), a trade group that represents PBMs, has sued at least a half dozen states on their ability to regulate PBMs. However, a landmark case in late 2020 (Pharmaceutical Care Management Association v. Rutledge) set a new precedent. Reversing a lower appeals court decision, the Supreme Court unanimously ruled in favor of allowing states to put in place fair regulation of these entities.
Dr. Worthing and others hope that the medical community and states can leverage this ruling in another lawsuit PCMA brought against North Dakota (PCMA v. Wehbi). PCMA filed this lawsuit in 2017, which challenges two statutes on PBM regulation. The group has issued similar legal challenges in Maine, the District of Columbia, Iowa, Oklahoma, and Arkansas with the Rutledge case.
“PBMs have become massive profit centers while (ironically) increasing patients’ out-of-pocket costs, interfering with doctor-patient relationships, and impairing patient access to appropriate treatment,” according to an amicus brief filed by The Alliance for Transparent & Affordable Prescriptions (ATAP), the Community Oncology Alliance (COA), and American Pharmacies, supporting North Dakota in the Wehbi case.
This is to ensure the case represents the voices of physicians, patients, nurses, and other stakeholders, and underscores PBM abuses, said Dr. Worthing, vice president of ATAP. He also serves as the American College of Rheumatology’s representative on ATAP’s Executive Committee.
PCMA did not respond to requests for comment. Its CEO and president, J.C. Scott, emphasizes that PBMs have a long track record of reducing drug costs for patients and plan sponsors. In 2021, PCMA released 21 policy solutions, a set of industry principles and a three-part policy platform, all with an aim to bring down costs and increase access to pharmaceutical care, according to the organization.
PCMA estimates that the strategies in its platform (updating Medicare Part D, accelerating value-based care, and eliminating anticompetitive ‘pay for delay’ agreements) would save the federal government a maximum of $398.7 billion over 10 years.
According to Wendy Hemmen, senior director with Texas Oncology in Dallas, PBMs do their own unique calculations to arrive at their cost reductions. “Essentially in a PBM, they use things that make their story. Numbers reported to plan sponsors and to the public are not audited and are usually in terms of percentages or a per member per month. Data points are moved around, dropped, or reclassified to make the story that the PBM needs to tell,” Ms. Hemmen said.
Amicus briefs dispute ERISA connection
North Dakota legislation prohibits PBMs from charging copays to patients that exceed the cost of a drug. It also prohibits gag clause provisions that restrict what pharmacists may discuss with patients. PBMs may charge fees based on performance metrics, but they must use nationally recognized metrics. Fees must be disclosed at the point of sale.
In its legal challenges, PCMA has asserted that state laws violate the preemption clause in the Employee Retirement Income Security Act (ERISA). “Federal preemption allows employers flexibility to administer innovative benefit plans in an environment of increasing health care costs. The court’s decision in Rutledge v. PCMA will either uphold or threaten these federal protections,” PCMA asserted in a statement issued in March 2020.
ATAP’s amicus brief, and another one filed by 34 attorneys general that supports the North Dakota statute to regulate PBMs, counter that this isn’t the case.
“First, PBM regulation (in its common and standard form) does not reference ERISA itself. These laws leave all plans on equal footing; they do not single out ERISA plans for preferred or disfavored coverage, and they do not change the playing field for ERISA plans alone ... Second, PBM regulation does not have any prohibited connection with ERISA plans,” noted authors in the ATAP brief.
PCMA has also included Medicare preemption in its arguments against PBM regulation. This is meritless, wrote the state attorneys general. “Medicare preempts state laws only if a Medicare ‘standard’ particularly addresses the subject of state regulation. Because the challenged North Dakota laws do not dictate plan benefits or conflict with a Medicare standard, they are not preempted.”
The auctioning of medications
PBMs in theory could use their market power to drive down costs by extracting discounts from drug makers and pharmacies. In reality, they retain any price concessions and discounts for themselves, ATAP’s brief continued.
A system that PBMs have put into place, called step therapy, is essentially an auction for the preferred spot that will be authorized and covered, Dr. Worthing explained.
PBMs create formularies through this auction. The highest rebate to the PBM earns the top spot in the auction and becomes the preferred drug. “That highest bid gets paid for by passing the cost along to patients and insurance plans, and PBMs pocket the profits. This provides an incentive for pharmaceutical manufacturers to raise prices,” he said.
Dr. Worthing has seen these practices trickle down and affect his patients. “Frequently, the medication I prescribe based on what’s best for the patient based on their disease activity, values, and medical history is often not covered because a different drug or portfolio of drugs has earned the top spot in step therapy. This is an extremely frustrating and cumbersome process that not only delays access to treatments but also provides an incentive for higher drug prices,” he said.
There are other ways in which PBMs get in the way of care, said Ms. Hemmen, whose facility serves complex-care oncology patients.
“PBMs force scripts out of higher-quality pharmacies that preserve unfragmented care. They incentivize plan sponsors to put programs into place that take away patient choice, fragment care, and drive scripts to their own owned pharmacies,” she said.
Rutledge case sets precedent
In the Rutledge case, PCMA had challenged an Arkansas law that forbid PBMs from paying local pharmacies at a lower rate than what the pharmacies were reimbursed to fill prescriptions. Although the 8th Circuit Court of Appeals agreed with PCMA, the Supreme Court ruled in favor of Arkansas in late 2020.
The appeals court also backed PCMA in PCMA v. Wehbi. However, the Supreme Court vacated this decision and remanded it back to the appeals court, asking for a reconsideration in wake of the outcome in Rutledge v. PCMA.
PCMA has argued that Rutledge was a narrow decision, limited to state laws that regulate PBM reimbursements, and that Rutledge has no bearing on North Dakota law.
While it’s unfortunate that PCMA is trying to delay implementation of sensible regulations, “a lot of us are happy that this issue is coming to light,” Dr. Worthing said. “As a rheumatologist and health policy advocate, exposing drug middlemen is the most important bipartisan issue in the country today because it gets at the core of making sure that sick people get access to the medications they need and reducing the budget of insurance carriers, hospitals, and the federal budget.”
The ATAP brief noted that 28 state attorneys general have filed suit against PBMs, “securing settlements compelling PBMs to correct deceptive trade practices.”
Many people at the state and local level were waiting for the Supreme Court to decide on Rutledge before enacting legislation and sensible regulations, and now they can go ahead and do it, said Dr. Worthing. “I expect to see this across the country as states look at budgets, and as patients bring personal stories to light. We look forward to states passing these kinds of laws to regulate PBMs.”
The ACR doesn’t anticipate a ruling in the Wehbi case until the spring of 2022.
Recent laws passed around PBMs and the pharmacy benefit are a good first step in holding PBMs accountable for quality of care and honoring patient choice, Ms. Hemmen said. The laws also begin to address the fiscal manipulations PBMs use to gain advantage and direct scripts to their own coffers, she added. However, this may not have enough teeth. “These state laws are coming from a provider perspective, and they don’t anticipate what PBMs will do in response. The PBMs are going to work around it.”
Mark Nelson, PharmD, recalls the anguish when a major pharmacy benefit manager (PBM) moved all veteran patients with prostate cancer at his facility from an effective medication to a pricier alternative therapy. “All of these patients were stable on their therapy and were extremely distraught about their medications being changed,” said Dr. Nelson, CEO of Northwest Medical Specialties in Washington State. While there was no clinical reason to change the medication, “our oncologists had no choice other than to comply,” he said.
It’s unclear why a PBM would switch to a more expensive medication that has no additional clinical benefit, he continued. “Why upset so many veterans? For what reason? We were not given a reason despite our very vocal protest.”
Angus B. Worthing, MD, sees these scenarios unfold every day in his rheumatology practice in the Washington, D.C., area. “In my clinic with 25 doctors, we have three full-time people that only handle PBMs,” he said in an interview. He and others in the medical community, as well as many states, have been pushing back on what they see as efforts by PBMs to raise drug prices and collect the profits at the expense of patients.
PCMA’s challenges against PBM law
The Pharmaceutical Care Management Association (PCMA), a trade group that represents PBMs, has sued at least a half dozen states on their ability to regulate PBMs. However, a landmark case in late 2020 (Pharmaceutical Care Management Association v. Rutledge) set a new precedent. Reversing a lower appeals court decision, the Supreme Court unanimously ruled in favor of allowing states to put in place fair regulation of these entities.
Dr. Worthing and others hope that the medical community and states can leverage this ruling in another lawsuit PCMA brought against North Dakota (PCMA v. Wehbi). PCMA filed this lawsuit in 2017, which challenges two statutes on PBM regulation. The group has issued similar legal challenges in Maine, the District of Columbia, Iowa, Oklahoma, and Arkansas with the Rutledge case.
“PBMs have become massive profit centers while (ironically) increasing patients’ out-of-pocket costs, interfering with doctor-patient relationships, and impairing patient access to appropriate treatment,” according to an amicus brief filed by The Alliance for Transparent & Affordable Prescriptions (ATAP), the Community Oncology Alliance (COA), and American Pharmacies, supporting North Dakota in the Wehbi case.
This is to ensure the case represents the voices of physicians, patients, nurses, and other stakeholders, and underscores PBM abuses, said Dr. Worthing, vice president of ATAP. He also serves as the American College of Rheumatology’s representative on ATAP’s Executive Committee.
PCMA did not respond to requests for comment. Its CEO and president, J.C. Scott, emphasizes that PBMs have a long track record of reducing drug costs for patients and plan sponsors. In 2021, PCMA released 21 policy solutions, a set of industry principles and a three-part policy platform, all with an aim to bring down costs and increase access to pharmaceutical care, according to the organization.
PCMA estimates that the strategies in its platform (updating Medicare Part D, accelerating value-based care, and eliminating anticompetitive ‘pay for delay’ agreements) would save the federal government a maximum of $398.7 billion over 10 years.
According to Wendy Hemmen, senior director with Texas Oncology in Dallas, PBMs do their own unique calculations to arrive at their cost reductions. “Essentially in a PBM, they use things that make their story. Numbers reported to plan sponsors and to the public are not audited and are usually in terms of percentages or a per member per month. Data points are moved around, dropped, or reclassified to make the story that the PBM needs to tell,” Ms. Hemmen said.
Amicus briefs dispute ERISA connection
North Dakota legislation prohibits PBMs from charging copays to patients that exceed the cost of a drug. It also prohibits gag clause provisions that restrict what pharmacists may discuss with patients. PBMs may charge fees based on performance metrics, but they must use nationally recognized metrics. Fees must be disclosed at the point of sale.
In its legal challenges, PCMA has asserted that state laws violate the preemption clause in the Employee Retirement Income Security Act (ERISA). “Federal preemption allows employers flexibility to administer innovative benefit plans in an environment of increasing health care costs. The court’s decision in Rutledge v. PCMA will either uphold or threaten these federal protections,” PCMA asserted in a statement issued in March 2020.
ATAP’s amicus brief, and another one filed by 34 attorneys general that supports the North Dakota statute to regulate PBMs, counter that this isn’t the case.
“First, PBM regulation (in its common and standard form) does not reference ERISA itself. These laws leave all plans on equal footing; they do not single out ERISA plans for preferred or disfavored coverage, and they do not change the playing field for ERISA plans alone ... Second, PBM regulation does not have any prohibited connection with ERISA plans,” noted authors in the ATAP brief.
PCMA has also included Medicare preemption in its arguments against PBM regulation. This is meritless, wrote the state attorneys general. “Medicare preempts state laws only if a Medicare ‘standard’ particularly addresses the subject of state regulation. Because the challenged North Dakota laws do not dictate plan benefits or conflict with a Medicare standard, they are not preempted.”
The auctioning of medications
PBMs in theory could use their market power to drive down costs by extracting discounts from drug makers and pharmacies. In reality, they retain any price concessions and discounts for themselves, ATAP’s brief continued.
A system that PBMs have put into place, called step therapy, is essentially an auction for the preferred spot that will be authorized and covered, Dr. Worthing explained.
PBMs create formularies through this auction. The highest rebate to the PBM earns the top spot in the auction and becomes the preferred drug. “That highest bid gets paid for by passing the cost along to patients and insurance plans, and PBMs pocket the profits. This provides an incentive for pharmaceutical manufacturers to raise prices,” he said.
Dr. Worthing has seen these practices trickle down and affect his patients. “Frequently, the medication I prescribe based on what’s best for the patient based on their disease activity, values, and medical history is often not covered because a different drug or portfolio of drugs has earned the top spot in step therapy. This is an extremely frustrating and cumbersome process that not only delays access to treatments but also provides an incentive for higher drug prices,” he said.
There are other ways in which PBMs get in the way of care, said Ms. Hemmen, whose facility serves complex-care oncology patients.
“PBMs force scripts out of higher-quality pharmacies that preserve unfragmented care. They incentivize plan sponsors to put programs into place that take away patient choice, fragment care, and drive scripts to their own owned pharmacies,” she said.
Rutledge case sets precedent
In the Rutledge case, PCMA had challenged an Arkansas law that forbid PBMs from paying local pharmacies at a lower rate than what the pharmacies were reimbursed to fill prescriptions. Although the 8th Circuit Court of Appeals agreed with PCMA, the Supreme Court ruled in favor of Arkansas in late 2020.
The appeals court also backed PCMA in PCMA v. Wehbi. However, the Supreme Court vacated this decision and remanded it back to the appeals court, asking for a reconsideration in wake of the outcome in Rutledge v. PCMA.
PCMA has argued that Rutledge was a narrow decision, limited to state laws that regulate PBM reimbursements, and that Rutledge has no bearing on North Dakota law.
While it’s unfortunate that PCMA is trying to delay implementation of sensible regulations, “a lot of us are happy that this issue is coming to light,” Dr. Worthing said. “As a rheumatologist and health policy advocate, exposing drug middlemen is the most important bipartisan issue in the country today because it gets at the core of making sure that sick people get access to the medications they need and reducing the budget of insurance carriers, hospitals, and the federal budget.”
The ATAP brief noted that 28 state attorneys general have filed suit against PBMs, “securing settlements compelling PBMs to correct deceptive trade practices.”
Many people at the state and local level were waiting for the Supreme Court to decide on Rutledge before enacting legislation and sensible regulations, and now they can go ahead and do it, said Dr. Worthing. “I expect to see this across the country as states look at budgets, and as patients bring personal stories to light. We look forward to states passing these kinds of laws to regulate PBMs.”
The ACR doesn’t anticipate a ruling in the Wehbi case until the spring of 2022.
Recent laws passed around PBMs and the pharmacy benefit are a good first step in holding PBMs accountable for quality of care and honoring patient choice, Ms. Hemmen said. The laws also begin to address the fiscal manipulations PBMs use to gain advantage and direct scripts to their own coffers, she added. However, this may not have enough teeth. “These state laws are coming from a provider perspective, and they don’t anticipate what PBMs will do in response. The PBMs are going to work around it.”
‘Gold cards’ allow Texas docs to skip prior authorizations
In what could be a model for other states, Texas has become the first state to exempt physicians from prior authorizations for meeting insurer benchmarks.
The law was passed in June and will take effect in September. It excuses physicians from having to obtain prior authorization if, during the previous 6 months, 90% of their treatments met medical necessity criteria by the health insurer. Through this law, doctors in the state will spend less time getting approvals for treatments for their patients.
Automatic approval of authorizations for treatments – or what the Texas Medical Association calls a “gold card” – “allows patients to get the care they need in a more timely fashion,” says Debra Patt, MD, an Austin, Tex.–based oncologist and former chair of the council on legislation for the TMA.
About 87% of Texas physicians reported a “drastic increase over the past 5 years in the burden of prior authorization on their patients and their practices,” per a 2020 survey by the TMA. Nearly half (48%) of Texas physicians have hired staff whose work focuses on processing requests for prior authorization, according to the survey.

Jack Resneck Jr., MD, a San Francisco–based dermatologist and president-elect of the American Medical Association, said other states have investigated ways to ease the impact of prior authorizations on physicians, but no other state has passed such a law.
Administrative burdens plague physicians around the country. The Medscape Physician Compensation Report 2021 found that physicians spend on average 15.6 hours per week on paperwork and administrative duties.
Better outcomes, less anxiety for patients
Dr. Patt, who testified in support of the law’s passage in the Texas legislature, says automatic approval of authorizations “is better for patients because it reduces their anxiety about whether they’re able to get the treatments they need now, and they will have better outcomes if they’re able to receive more timely care.”
Recently, a chemotherapy treatment Dr. Patt prescribed for one of her patients was not authorized by an insurer. The result is “a lot of anxiety and potentially health problems” for the patient.
She expects that automatic approval for treatments will be based on prescribing patterns during the preceding 6 months. “It means that when I order a test today, the [health insurer] looks back at my record 6 months previously,” she said. Still, Dr. Patt awaits guidance from the Texas Department of Insurance, which regulates health insurers in the state, regarding the law.
Dr. Resneck said the pharmacy counter is where most patients encounter prior authorization delays. “That’s when the pharmacist looks at them and says: ‘Actually, this isn’t covered by your health insurer’s formulary,’ or it isn’t covered fully on their formulary.”
One of Dr. Resneck’s patients had a life-altering case of eczema that lasted many years. Because of the condition, the patient couldn’t work or maintain meaningful bonds with family members. A biologic treatment transformed his patient’s life. The patient was able to return to work and to reengage with family, said Dr. Resneck. But a year after his patient started the treatment, the health insurer wouldn’t authorize the treatment because the patient wasn’t experiencing the same symptoms.
The patient didn’t have the same symptoms because the biologic treatment worked, said Dr. Resneck.
Kristine Grow, a spokesperson for America’s Health Insurance Plans, a national association for health insurers, said: “The use of prior authorization is relatively small – typically, less than 15% – and can help ensure safer opioid prescribing, help prevent dangerous drug interactions, and help protect patients from unnecessary exposure to potentially harmful radiation for inappropriate diagnostic imaging. Numerous studies show that Americans frequently receive inappropriate care, and 25% of unnecessary treatments are associated with complications or adverse events.”
Medical management tools, such as prior authorization, are “an important way” to deliver “safe, high-quality care” to patients, she added.
Potential for harm?
Sadeea Abbasi, MD, a practicing physician at Cedars-Sinai in the gastroenterology clinical office in Santa Monica, Calif., can attest that these practices are harmful for her patients.
“Prior authorization requirements have been on the rise across various medical specialties. For GI, we have seen an increase of required approvals for procedures like upper endoscopy, colonoscopy, and wireless capsule endoscopy and in medications prescribed, including biologic infusions for inflammatory bowel disease.”
Dr. Abbasi added: “One of the largest concerns I have with this growing ‘cost-savings’ trend is the impact it has on clinical outcomes. I have seen patients suffer with symptoms while waiting for a decision on a prior authorization for a medication. My patients have endured confusion and chaos when arriving for imaging appointments, only to learn the insurance has not reached a decision on whether the study is approved. When patients learn their procedure has been delayed, they have to reschedule the appointment, take another day off work, coordinate transportation and most importantly, postpone subsequent treatments to alleviate symptoms.”
According to an AMA survey, almost all physicians (94%) said prior authorization delays care and 79% percent have had patients abandon their recommended treatment because of issues related to prior authorization. This delay causes potentially irreversible damage to patients’ digestive system and increases the likelihood of hospitalization. This is a huge issue for America’s seniors: Medicare Advantage (MA) plans, which represent 24.1 million of the 62 million Medicare beneficiaries, the increase in prior authorization requests has been substantial.
State and federal efforts to curb prior authorization
In addition to efforts to curb prior authorization in other states, the AMA and nearly 300 other stakeholders, including the American Gastroenterological Association, support the Improving Seniors’ Timely Access to Care Act (H.R. 3173). The legislation includes a provision related to “gold carding,” said Robert Mills, an AMA spokesperson.
The bill aims to establish transparency requirements and standards for prior authorization processes related to MA plans. The requirements and standards for MA plans include the following:
- Establishing an electronic prior authorization program that meets specific standards, such as the ability to provide real-time decisions in response to requests for items and services that are routinely approved.
- Publishing on an annual basis specific prior authorization information, including the percentage of requests approved and the average response time.
- Ensuring prior authorization requests are reviewed by qualified medical personnel.
- Meeting standards set by the Centers for Medicare & Medicaid Services related to the quality and timeliness of prior authorization determinations.
This legislation was introduced in the U.S. House of Representatives in May by representatives Suzan DelBene (D-Wash.); Mike Kelly (R-Pa.); Ami Bera, MD (D-Calif.); and Larry Bucshon (R-Ind.), after which it was referred to the House Committee on Energy and Commerce and the House Committee on Ways and Means for consideration.
Gaining support for this legislation is a priority for AGA and as such the legislation will be featured as a top policy request at AGA’s upcoming fall Advocacy Day on Sept. 23. The AGA encourages all physicians to contact their lawmakers, urging for support of the bill in the 117th Congress.
In addition to AGA’s advocacy efforts on prior authorization reform, the Regulatory Relief Coalition, a group of national physician specialty organizations, advocates for regulatory burden reduction in Medicare so that physicians can spend more time treating patients. The physician community has banded together to address prior authorization burdens in our field and improve delivery of patient care. Learn more about prior authorization burdens and the various advocacy efforts being pursued.
With additional reporting by staff from this news organization.
In what could be a model for other states, Texas has become the first state to exempt physicians from prior authorizations for meeting insurer benchmarks.
The law was passed in June and will take effect in September. It excuses physicians from having to obtain prior authorization if, during the previous 6 months, 90% of their treatments met medical necessity criteria by the health insurer. Through this law, doctors in the state will spend less time getting approvals for treatments for their patients.
Automatic approval of authorizations for treatments – or what the Texas Medical Association calls a “gold card” – “allows patients to get the care they need in a more timely fashion,” says Debra Patt, MD, an Austin, Tex.–based oncologist and former chair of the council on legislation for the TMA.
About 87% of Texas physicians reported a “drastic increase over the past 5 years in the burden of prior authorization on their patients and their practices,” per a 2020 survey by the TMA. Nearly half (48%) of Texas physicians have hired staff whose work focuses on processing requests for prior authorization, according to the survey.
Jack Resneck Jr., MD, a San Francisco–based dermatologist and president-elect of the American Medical Association, said other states have investigated ways to ease the impact of prior authorizations on physicians, but no other state has passed such a law.
Administrative burdens plague physicians around the country. The Medscape Physician Compensation Report 2021 found that physicians spend on average 15.6 hours per week on paperwork and administrative duties.
Better outcomes, less anxiety for patients
Dr. Patt, who testified in support of the law’s passage in the Texas legislature, says automatic approval of authorizations “is better for patients because it reduces their anxiety about whether they’re able to get the treatments they need now, and they will have better outcomes if they’re able to receive more timely care.”
Recently, a chemotherapy treatment Dr. Patt prescribed for one of her patients was not authorized by an insurer. The result is “a lot of anxiety and potentially health problems” for the patient.
She expects that automatic approval for treatments will be based on prescribing patterns during the preceding 6 months. “It means that when I order a test today, the [health insurer] looks back at my record 6 months previously,” she said. Still, Dr. Patt awaits guidance from the Texas Department of Insurance, which regulates health insurers in the state, regarding the law.
Dr. Resneck said the pharmacy counter is where most patients encounter prior authorization delays. “That’s when the pharmacist looks at them and says: ‘Actually, this isn’t covered by your health insurer’s formulary,’ or it isn’t covered fully on their formulary.”
One of Dr. Resneck’s patients had a life-altering case of eczema that lasted many years. Because of the condition, the patient couldn’t work or maintain meaningful bonds with family members. A biologic treatment transformed his patient’s life. The patient was able to return to work and to reengage with family, said Dr. Resneck. But a year after his patient started the treatment, the health insurer wouldn’t authorize the treatment because the patient wasn’t experiencing the same symptoms.
The patient didn’t have the same symptoms because the biologic treatment worked, said Dr. Resneck.
Kristine Grow, a spokesperson for America’s Health Insurance Plans, a national association for health insurers, said: “The use of prior authorization is relatively small – typically, less than 15% – and can help ensure safer opioid prescribing, help prevent dangerous drug interactions, and help protect patients from unnecessary exposure to potentially harmful radiation for inappropriate diagnostic imaging. Numerous studies show that Americans frequently receive inappropriate care, and 25% of unnecessary treatments are associated with complications or adverse events.”
Medical management tools, such as prior authorization, are “an important way” to deliver “safe, high-quality care” to patients, she added.
Potential for harm?
Sadeea Abbasi, MD, a practicing physician at Cedars-Sinai in the gastroenterology clinical office in Santa Monica, Calif., can attest that these practices are harmful for her patients.
“Prior authorization requirements have been on the rise across various medical specialties. For GI, we have seen an increase of required approvals for procedures like upper endoscopy, colonoscopy, and wireless capsule endoscopy and in medications prescribed, including biologic infusions for inflammatory bowel disease.”
Dr. Abbasi added: “One of the largest concerns I have with this growing ‘cost-savings’ trend is the impact it has on clinical outcomes. I have seen patients suffer with symptoms while waiting for a decision on a prior authorization for a medication. My patients have endured confusion and chaos when arriving for imaging appointments, only to learn the insurance has not reached a decision on whether the study is approved. When patients learn their procedure has been delayed, they have to reschedule the appointment, take another day off work, coordinate transportation and most importantly, postpone subsequent treatments to alleviate symptoms.”
According to an AMA survey, almost all physicians (94%) said prior authorization delays care and 79% percent have had patients abandon their recommended treatment because of issues related to prior authorization. This delay causes potentially irreversible damage to patients’ digestive system and increases the likelihood of hospitalization. This is a huge issue for America’s seniors: Medicare Advantage (MA) plans, which represent 24.1 million of the 62 million Medicare beneficiaries, the increase in prior authorization requests has been substantial.
State and federal efforts to curb prior authorization
In addition to efforts to curb prior authorization in other states, the AMA and nearly 300 other stakeholders, including the American Gastroenterological Association, support the Improving Seniors’ Timely Access to Care Act (H.R. 3173). The legislation includes a provision related to “gold carding,” said Robert Mills, an AMA spokesperson.
The bill aims to establish transparency requirements and standards for prior authorization processes related to MA plans. The requirements and standards for MA plans include the following:
- Establishing an electronic prior authorization program that meets specific standards, such as the ability to provide real-time decisions in response to requests for items and services that are routinely approved.
- Publishing on an annual basis specific prior authorization information, including the percentage of requests approved and the average response time.
- Ensuring prior authorization requests are reviewed by qualified medical personnel.
- Meeting standards set by the Centers for Medicare & Medicaid Services related to the quality and timeliness of prior authorization determinations.
This legislation was introduced in the U.S. House of Representatives in May by representatives Suzan DelBene (D-Wash.); Mike Kelly (R-Pa.); Ami Bera, MD (D-Calif.); and Larry Bucshon (R-Ind.), after which it was referred to the House Committee on Energy and Commerce and the House Committee on Ways and Means for consideration.
Gaining support for this legislation is a priority for AGA and as such the legislation will be featured as a top policy request at AGA’s upcoming fall Advocacy Day on Sept. 23. The AGA encourages all physicians to contact their lawmakers, urging for support of the bill in the 117th Congress.
In addition to AGA’s advocacy efforts on prior authorization reform, the Regulatory Relief Coalition, a group of national physician specialty organizations, advocates for regulatory burden reduction in Medicare so that physicians can spend more time treating patients. The physician community has banded together to address prior authorization burdens in our field and improve delivery of patient care. Learn more about prior authorization burdens and the various advocacy efforts being pursued.
With additional reporting by staff from this news organization.