User login
Hibernoma
Hibernomas are rare benign soft-tissue tumors originally described as pseudolipomas by Merkel1 in 1906. Gery coined the term hibernoma in 1914, after noting the multivacuolated cytoplasm of the tumor cells and its resemblance to normal brown fat found in hibernating animals.2
Hibernomas represent 2% of all benign fat-containing tumors and are composed of brown adipocytes, which are histologically different from the white fat of lipomas. Hibernomas usually develop between ages 20 and 40 years, and their incidence is slightly higher in males.
Diffusely present in human newborns, brown fat usually regresses by 8 weeks of age.3 Residual brown fat deposits may remain in the neck, axilla, shoulder, thorax, thigh, retroperitoneum, and periscapular/interscapular regions.4 All these vestigial areas are therefore common locations of hibernomas, with the thigh accounting for up to 30% of cases.5 These tumors are seldom identified in the abdomen, popliteal fossa, or even intracranially. Injury to brown fat cells in these locations, either by infection, inflammation, or trauma, is considered a predisposing risk factor for development of hibernomas.6
Clinical Presentation
Clinically, hibernomas present as slow-growing, painless soft-tissue masses. Physical examination usually reveals a palpable, solitary, soft, and rubbery mass within the subcutaneous fat, which is freely mobile and not attached to deep layers. These tumors may rarely produce steroid hormones and result in a paraneoplastic syndrome. Even though these tumors are usually large at presentation, compression of adjacent structures seldom occurs.
Histology and Differential Diagnosis
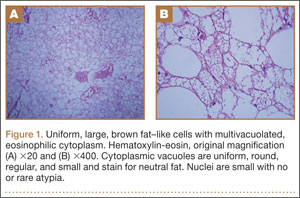
The characteristic hibernoma cell is a multivacuolated adipocyte with centrally located nucleus, indistinct nucleolus, and coarsely granular eosinophilic (or pale) cytoplasm (Figure 1). Cytoplasmic vacuoles are uniform, round, regular, and small and stain for neutral fat. Nuclei are usually small with no or rare atypia. These multivacuolated brown fat–like tumor cells usually stain positive for S100 and CD31, usually stain negative for CD34 and p53, and can show 11q13-21 rearrangements, also seen in lipomas and liposarcomas. Hibernomas have 4 histologic variants: typical (classic), myxoid, lipoma-like, and spindle-cell.5 The typical hibernoma, the most common, contains a varying mixture of brown and white fat cells. The myxoid type, second most common, is composed of hibernoma cells floating in a loose acellular myxoid stroma. The lipoma-like variant consists of a few scattered hibernoma cells in a predominance of white fat cells. The spindle-cell variant, the rarest, has features of typical hibernoma and spindle-cell lipoma.7
Grossly, hibernomas are well encapsulated, soft, and lobular with prominent feeding vessels.8 They typically are tan or brown because of their hypervascularity and abundant mitochondria. Tumor size ranges from 1 to 24 cm (mean, 9.4 cm).9 These tumors are well-defined intermuscular/intramuscular, subcutaneous, or retroperitoneal lesions that tend to grow along fascial planes and displace surrounding structures rather than invade them. Delicate branching capillaries are usually seen within the tumor.
Although rare, hibernoma should be included in the differential diagnosis of lipomatous soft-tissue tumors.10 Imaging findings of hibernoma are not specific; other differential diagnostic considerations for a mass with a signal similar to that of fat or containing large intratumoral vessels include angiolipoma, intramuscular hemangioma with fat, spindle-cell lipoma, pleomorphic lipoma, lipoblastoma, hemangiopericytoma, and hemangioblastoma,11-15 as well as malignant processes, including lipoma-like well-differentiated liposarcoma and myxoid liposarcoma.16 Other entities that should be considered include residual brown fat and rhabdomyoma.
Hibernomas are histologically distinguished from well-differentiated liposarcomas by location (liposarcomas tend to be deep), atypia, presence of a prominent “plexiform” capillary pattern, and specific molecular translocations, including t (12;16). Lipomas have lipocytes that are not multivacuolated, and residual brown fat does not present as a distinct mass. Rhabdomyomas are distinguished by an absence of cytoplasmic lipid vacuoles.
Imaging
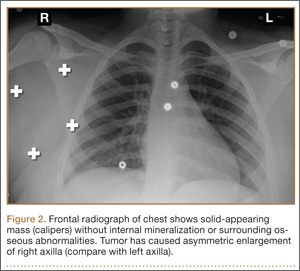
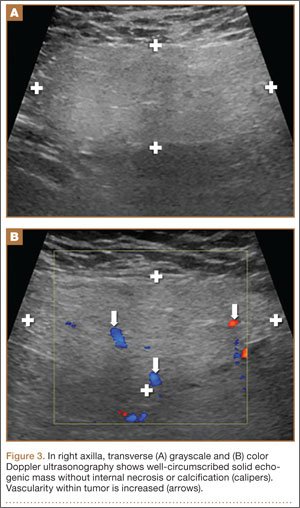
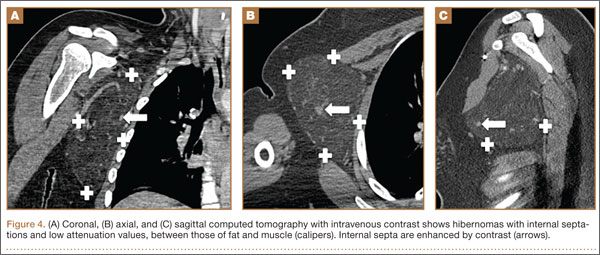
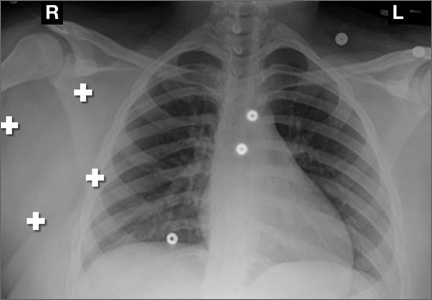
Conventional radiography may show a radiolucent mass without internal mineralization or associated osseous abnormalities4 (Figure 2). Calcifications are notably absent.17 Sonographically, hibernomas are well-circumscribed, solid, hyperechoic masses with increased internal vascular flow on both grayscale and color Doppler sampling; however their appearance is not pathognomonic (Figure 3). Angiography reveals a hypervascular tumor that may have internal arteriovenous shunting.18 Hibernomas have a heterogeneous appearance on computed tomography (CT) and magnetic resonance imaging (MRI) because of the variable distribution of brown fat cells, white fat cells, myxoid material, and spindle cells within the individual tumor subtypes.5 CT of these tumors shows internal septations and low attenuation values, between those of fat and muscle19 (Figure 4). Intravenous contrast enhances internal septa, but enhancement varies from none to intense, and from generalized to focal, depending on internal tumor composition.3,17,20-22
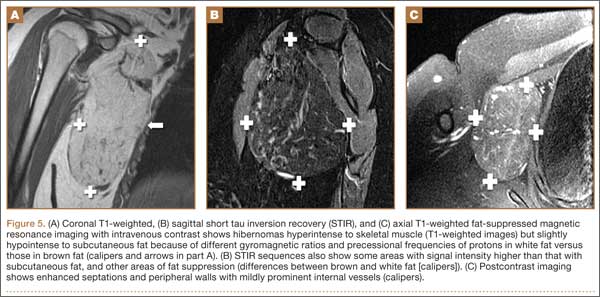
Hibernomas are usually hyperintense to skeletal muscle on T1-weighted MRI but slightly hypointense to subcutaneous fat because of the different gyromagnetic ratios and precessional frequencies of protons in white fat versus those in brown fat17 (Figure 5). Rarely, lesions are isointense to skeletal muscle on T1-weighted images.23 On T2-weighted images, high signal intensity similar to that of subcutaneous fat is typical.24 Flow voids can be readily identified.25 Short tau inversion recovery (STIR) MRI shows some areas with signal intensity higher than that of subcutaneous fat, and other areas of fat suppression.9 Ritchie and colleagues21 reported that hibernomas histologically composed of more than 70% multivacuolated adipocytes tended to have MRI signal characteristics different from those of subcutaneous fat, and those with less than 70% multivacuolated adipocytes tended to have signal characteristics paralleling those of subcutaneous fat. Myxoid hibernomas have higher signal intensity on T2-weighted and STIR MRI because of high water content.17,21,26,27
Hibernomas demonstrate moderate uptake on bone scintigraphy blood pool images and mild uptake on delayed images.4 Positron emission tomography (PET) is useful in differentiating hibernomas from other fat-containing lesions.9 Hibernomas demonstrate intense fluorine-18 fluorodeoxyglucose uptake because, unlike other adipogenic tumors, hibernomas contain abundant mitochondria and are highly metabolically active.28
Treatment and Prognosis
Complete surgical excision is the treatment of choice; given the behavior of the benign tumor, marginal complete excision is considered curative.5 Intralesional excision may be the only option for large tumors that are near nerves or vessels. However, intralesional excision may result in continued growth and local recurrence.
At surgery, these tumors usually are encapsulated and/or adherent to skeletal muscle or bone, without invasion, and easily separated from surrounding soft tissues.29 No specific surgical considerations are required beyond standard oncological principles, including careful dissection of adjacent nerves and vessels, and hemostasis. Hibernomas have the potential for significant bleeding during surgical excision. In this setting, embolization becomes a consideration, given the identification of large intratumoral vessels and the benign course of these lesions.
1. Merkel H. On a pseudolipoma of the breast. Beitr Pathol Anat. 1906;39:152-157.
2. Enzinger FM, Weiss SW. Benign lipomatous tumors. In: Enzinger FM, Weiss SW, eds. Soft Tissue Tumors. 3rd ed. St. Louis, MO: Mosby-Yearbook; 1994:420-423.
3. Alvine G, Rosenthal H, Murphey M, Huntrakoon M. Hibernoma. Skeletal Radiol. 1996;25(5):493-496.
4. Kumazoe H, Nagamatsu Y, Nishi T, Kimura YN, Nakazono T, Kudo S. Dumbbell-shaped thoracic hibernoma: computed tomography and magnetic resonance imaging findings. Jpn J Radiol. 2009;27(1):37-40.
5. Furlong MA, Fanburg-Smith JC, Miettinen M. The morphologic spectrum of hibernoma: a clinicopathologic study of 170 cases. Am J Surg Pathol. 2001;25(6):809-814.
6. Ucak A, Inan K, Onan B, Yilmaz AT. Resection of intrapericardial hibernoma associated with constrictive pericarditis. Interact Cardiovasc Thorac Surg. 2009;9(4):717-719.
7. Tomihama RT, Lindskog DM, Ahrens W, Haims AH. Hibernoma: a case report demonstrating usefulness of MR angiography in characterizing the tumor. Skeletal Radiol. 2007;36(6):541-545.
8. Choi J, Heiner J, Agni R, Hafez GR. Case of the season. Hibernoma. Semin Roentgenol. 2002;37(2):99-101.
9. Craig WD, Fanburg-Smith JC, Henry LR, Guerrero R, Barton JH. Fat-containing lesions of the retroperitoneum: radiologic-pathologic correlation. Radiographics. 2009;29(1):261-290.
10. Vassos N, Lell M, Hohenberger W, Croner RS, Agaimy A. Deep-seated huge hibernoma of soft tissue: a rare differential diagnosis of atypical lipomatous tumor/well differentiated liposarcoma. Int J Clin Exp Pathol. 2013;6(10):2178-2184.
11. Mugel T, Ghossain MA, Guinet C, et al. MR and CT findings in a case of hibernoma of the thigh extending into the pelvis. Eur Radiol. 1998;8(3):476-478.
12. Kallas KM, Vaughan L, Haghighi P, Resnick D. Hibernoma of the left axilla; a case report and review of MR imaging. Skeletal Radiol. 2003;32(5):290-294.
13. Suh JS, Cho J, Lee SH, et al. Alveolar soft part sarcoma: MR and angiographic findings. Skeletal Radiol. 2000;29(12):680-689.
14. De Beuckeleer LH, De Schepper AM, Vandevenne JE, et al. MR imaging of clear cell sarcoma (malignant melanoma of the soft parts): a multicenter correlative MRI-pathology study of 21 cases and literature review. Skeletal Radiol. 2000;29(4):187-195.
15. Chu BC, Terae S, Hida K, Furukawa M, Abe S, Miyasaka K. MR findings in spinal hemangioblastoma: correlation with symptoms and with angiographic and surgical findings. AJNR Am J Neuroradiol. 2001;22(1):206-217.
16. Cypess AM, Lehman S, Williams G, et al. Identification and importance of brown adipose tissue in adult humans. N Engl J Med. 2009;360(15):1509-1517.
17. Anderson SE, Schwab C, Stauffer E, Banic A, Steinbach LS. Hibernoma: imaging characteristics of a rare benign soft tissue tumor. Skeletal Radiol. 2001;30(10):590-595.
18. Angervall L, Nilsson L, Stener B. Microangiographic and histological studies in 2 cases of hibernoma. Cancer. 1964;17:685-692.
19. Sansom HE, Blunt DM, Moskovic EC. Large retroperitoneal hibernoma—CT findings with pathological correlation. Clin Radiol. 1999;54(9):625-627.
20. Dursun M, Agayev A, Bakir B, et al. CT and MR characteristics of hibernoma: six cases. Clin Imaging. 2008;32(1):42-47.
21. Ritchie DA, Aniq H, Davies AM, Mangham DC, Helliwell TR. Hibernoma—correlation of histopathology and magnetic-resonance-imaging features in 10 cases. Skeletal Radiol. 2006;35(8):579-589.
22. Lee JC, Gupta A, Saifuddin A, et al. Hibernoma: MRI features in eight consecutive cases. Clin Radiol. 2006;61(12):1029-1034.
23. Chitoku S, Kawai S, Watabe Y, et al. Intradural spinal hibernoma: case report. Surg Neurol. 1998;49(5):509-513.
24. Baskurt E, Padgett DM, Matsumoto JA. Multiple hibernomas in a 1-month-old female infant. AJNR Am J Neuroradiol. 2004;25(8):1443-1445.
25. da Motta AC, Tunkel DE, Westra WH, Yousem DM. Imaging findings of a hibernoma of the neck. AJNR Am J Neuroradiol. 2006;27(8):1658-1659.
26. Cook MA, Stern M, de Siva RD. MRI of a hibernoma. J Comput Assist Tomogr. 1996;20(2):333-335.
27. Murphey MD, Carroll JF, Flemming DJ, Pope TL, Gannon FH, Kransdorf MJ. From the archives of the AFIP: benign musculoskeletal lipomatous lesions. Radiographics. 2004;24(5):1433-1466.
28. Robison S, Rapmund A, Hemmings C, Fulham M, Barry P. False-positive diagnosis of metastasis on positron emission tomography–computed tomography imaging due to hibernoma. J Clin Oncol. 2009;27(6):994-995.
29. Kallas KM, Vaughan L, Haghighi P, Resnick D. Hibernoma of the left axilla; a case report and review of MR imaging. Skeletal Radiol. 2003;32(5):290-294.
Hibernomas are rare benign soft-tissue tumors originally described as pseudolipomas by Merkel1 in 1906. Gery coined the term hibernoma in 1914, after noting the multivacuolated cytoplasm of the tumor cells and its resemblance to normal brown fat found in hibernating animals.2
Hibernomas represent 2% of all benign fat-containing tumors and are composed of brown adipocytes, which are histologically different from the white fat of lipomas. Hibernomas usually develop between ages 20 and 40 years, and their incidence is slightly higher in males.
Diffusely present in human newborns, brown fat usually regresses by 8 weeks of age.3 Residual brown fat deposits may remain in the neck, axilla, shoulder, thorax, thigh, retroperitoneum, and periscapular/interscapular regions.4 All these vestigial areas are therefore common locations of hibernomas, with the thigh accounting for up to 30% of cases.5 These tumors are seldom identified in the abdomen, popliteal fossa, or even intracranially. Injury to brown fat cells in these locations, either by infection, inflammation, or trauma, is considered a predisposing risk factor for development of hibernomas.6
Clinical Presentation
Clinically, hibernomas present as slow-growing, painless soft-tissue masses. Physical examination usually reveals a palpable, solitary, soft, and rubbery mass within the subcutaneous fat, which is freely mobile and not attached to deep layers. These tumors may rarely produce steroid hormones and result in a paraneoplastic syndrome. Even though these tumors are usually large at presentation, compression of adjacent structures seldom occurs.
Histology and Differential Diagnosis
The characteristic hibernoma cell is a multivacuolated adipocyte with centrally located nucleus, indistinct nucleolus, and coarsely granular eosinophilic (or pale) cytoplasm (Figure 1). Cytoplasmic vacuoles are uniform, round, regular, and small and stain for neutral fat. Nuclei are usually small with no or rare atypia. These multivacuolated brown fat–like tumor cells usually stain positive for S100 and CD31, usually stain negative for CD34 and p53, and can show 11q13-21 rearrangements, also seen in lipomas and liposarcomas. Hibernomas have 4 histologic variants: typical (classic), myxoid, lipoma-like, and spindle-cell.5 The typical hibernoma, the most common, contains a varying mixture of brown and white fat cells. The myxoid type, second most common, is composed of hibernoma cells floating in a loose acellular myxoid stroma. The lipoma-like variant consists of a few scattered hibernoma cells in a predominance of white fat cells. The spindle-cell variant, the rarest, has features of typical hibernoma and spindle-cell lipoma.7
Grossly, hibernomas are well encapsulated, soft, and lobular with prominent feeding vessels.8 They typically are tan or brown because of their hypervascularity and abundant mitochondria. Tumor size ranges from 1 to 24 cm (mean, 9.4 cm).9 These tumors are well-defined intermuscular/intramuscular, subcutaneous, or retroperitoneal lesions that tend to grow along fascial planes and displace surrounding structures rather than invade them. Delicate branching capillaries are usually seen within the tumor.
Although rare, hibernoma should be included in the differential diagnosis of lipomatous soft-tissue tumors.10 Imaging findings of hibernoma are not specific; other differential diagnostic considerations for a mass with a signal similar to that of fat or containing large intratumoral vessels include angiolipoma, intramuscular hemangioma with fat, spindle-cell lipoma, pleomorphic lipoma, lipoblastoma, hemangiopericytoma, and hemangioblastoma,11-15 as well as malignant processes, including lipoma-like well-differentiated liposarcoma and myxoid liposarcoma.16 Other entities that should be considered include residual brown fat and rhabdomyoma.
Hibernomas are histologically distinguished from well-differentiated liposarcomas by location (liposarcomas tend to be deep), atypia, presence of a prominent “plexiform” capillary pattern, and specific molecular translocations, including t (12;16). Lipomas have lipocytes that are not multivacuolated, and residual brown fat does not present as a distinct mass. Rhabdomyomas are distinguished by an absence of cytoplasmic lipid vacuoles.
Imaging
Conventional radiography may show a radiolucent mass without internal mineralization or associated osseous abnormalities4 (Figure 2). Calcifications are notably absent.17 Sonographically, hibernomas are well-circumscribed, solid, hyperechoic masses with increased internal vascular flow on both grayscale and color Doppler sampling; however their appearance is not pathognomonic (Figure 3). Angiography reveals a hypervascular tumor that may have internal arteriovenous shunting.18 Hibernomas have a heterogeneous appearance on computed tomography (CT) and magnetic resonance imaging (MRI) because of the variable distribution of brown fat cells, white fat cells, myxoid material, and spindle cells within the individual tumor subtypes.5 CT of these tumors shows internal septations and low attenuation values, between those of fat and muscle19 (Figure 4). Intravenous contrast enhances internal septa, but enhancement varies from none to intense, and from generalized to focal, depending on internal tumor composition.3,17,20-22
Hibernomas are usually hyperintense to skeletal muscle on T1-weighted MRI but slightly hypointense to subcutaneous fat because of the different gyromagnetic ratios and precessional frequencies of protons in white fat versus those in brown fat17 (Figure 5). Rarely, lesions are isointense to skeletal muscle on T1-weighted images.23 On T2-weighted images, high signal intensity similar to that of subcutaneous fat is typical.24 Flow voids can be readily identified.25 Short tau inversion recovery (STIR) MRI shows some areas with signal intensity higher than that of subcutaneous fat, and other areas of fat suppression.9 Ritchie and colleagues21 reported that hibernomas histologically composed of more than 70% multivacuolated adipocytes tended to have MRI signal characteristics different from those of subcutaneous fat, and those with less than 70% multivacuolated adipocytes tended to have signal characteristics paralleling those of subcutaneous fat. Myxoid hibernomas have higher signal intensity on T2-weighted and STIR MRI because of high water content.17,21,26,27
Hibernomas demonstrate moderate uptake on bone scintigraphy blood pool images and mild uptake on delayed images.4 Positron emission tomography (PET) is useful in differentiating hibernomas from other fat-containing lesions.9 Hibernomas demonstrate intense fluorine-18 fluorodeoxyglucose uptake because, unlike other adipogenic tumors, hibernomas contain abundant mitochondria and are highly metabolically active.28
Treatment and Prognosis
Complete surgical excision is the treatment of choice; given the behavior of the benign tumor, marginal complete excision is considered curative.5 Intralesional excision may be the only option for large tumors that are near nerves or vessels. However, intralesional excision may result in continued growth and local recurrence.
At surgery, these tumors usually are encapsulated and/or adherent to skeletal muscle or bone, without invasion, and easily separated from surrounding soft tissues.29 No specific surgical considerations are required beyond standard oncological principles, including careful dissection of adjacent nerves and vessels, and hemostasis. Hibernomas have the potential for significant bleeding during surgical excision. In this setting, embolization becomes a consideration, given the identification of large intratumoral vessels and the benign course of these lesions.
1. Merkel H. On a pseudolipoma of the breast. Beitr Pathol Anat. 1906;39:152-157.
2. Enzinger FM, Weiss SW. Benign lipomatous tumors. In: Enzinger FM, Weiss SW, eds. Soft Tissue Tumors. 3rd ed. St. Louis, MO: Mosby-Yearbook; 1994:420-423.
3. Alvine G, Rosenthal H, Murphey M, Huntrakoon M. Hibernoma. Skeletal Radiol. 1996;25(5):493-496.
4. Kumazoe H, Nagamatsu Y, Nishi T, Kimura YN, Nakazono T, Kudo S. Dumbbell-shaped thoracic hibernoma: computed tomography and magnetic resonance imaging findings. Jpn J Radiol. 2009;27(1):37-40.
5. Furlong MA, Fanburg-Smith JC, Miettinen M. The morphologic spectrum of hibernoma: a clinicopathologic study of 170 cases. Am J Surg Pathol. 2001;25(6):809-814.
6. Ucak A, Inan K, Onan B, Yilmaz AT. Resection of intrapericardial hibernoma associated with constrictive pericarditis. Interact Cardiovasc Thorac Surg. 2009;9(4):717-719.
7. Tomihama RT, Lindskog DM, Ahrens W, Haims AH. Hibernoma: a case report demonstrating usefulness of MR angiography in characterizing the tumor. Skeletal Radiol. 2007;36(6):541-545.
8. Choi J, Heiner J, Agni R, Hafez GR. Case of the season. Hibernoma. Semin Roentgenol. 2002;37(2):99-101.
9. Craig WD, Fanburg-Smith JC, Henry LR, Guerrero R, Barton JH. Fat-containing lesions of the retroperitoneum: radiologic-pathologic correlation. Radiographics. 2009;29(1):261-290.
10. Vassos N, Lell M, Hohenberger W, Croner RS, Agaimy A. Deep-seated huge hibernoma of soft tissue: a rare differential diagnosis of atypical lipomatous tumor/well differentiated liposarcoma. Int J Clin Exp Pathol. 2013;6(10):2178-2184.
11. Mugel T, Ghossain MA, Guinet C, et al. MR and CT findings in a case of hibernoma of the thigh extending into the pelvis. Eur Radiol. 1998;8(3):476-478.
12. Kallas KM, Vaughan L, Haghighi P, Resnick D. Hibernoma of the left axilla; a case report and review of MR imaging. Skeletal Radiol. 2003;32(5):290-294.
13. Suh JS, Cho J, Lee SH, et al. Alveolar soft part sarcoma: MR and angiographic findings. Skeletal Radiol. 2000;29(12):680-689.
14. De Beuckeleer LH, De Schepper AM, Vandevenne JE, et al. MR imaging of clear cell sarcoma (malignant melanoma of the soft parts): a multicenter correlative MRI-pathology study of 21 cases and literature review. Skeletal Radiol. 2000;29(4):187-195.
15. Chu BC, Terae S, Hida K, Furukawa M, Abe S, Miyasaka K. MR findings in spinal hemangioblastoma: correlation with symptoms and with angiographic and surgical findings. AJNR Am J Neuroradiol. 2001;22(1):206-217.
16. Cypess AM, Lehman S, Williams G, et al. Identification and importance of brown adipose tissue in adult humans. N Engl J Med. 2009;360(15):1509-1517.
17. Anderson SE, Schwab C, Stauffer E, Banic A, Steinbach LS. Hibernoma: imaging characteristics of a rare benign soft tissue tumor. Skeletal Radiol. 2001;30(10):590-595.
18. Angervall L, Nilsson L, Stener B. Microangiographic and histological studies in 2 cases of hibernoma. Cancer. 1964;17:685-692.
19. Sansom HE, Blunt DM, Moskovic EC. Large retroperitoneal hibernoma—CT findings with pathological correlation. Clin Radiol. 1999;54(9):625-627.
20. Dursun M, Agayev A, Bakir B, et al. CT and MR characteristics of hibernoma: six cases. Clin Imaging. 2008;32(1):42-47.
21. Ritchie DA, Aniq H, Davies AM, Mangham DC, Helliwell TR. Hibernoma—correlation of histopathology and magnetic-resonance-imaging features in 10 cases. Skeletal Radiol. 2006;35(8):579-589.
22. Lee JC, Gupta A, Saifuddin A, et al. Hibernoma: MRI features in eight consecutive cases. Clin Radiol. 2006;61(12):1029-1034.
23. Chitoku S, Kawai S, Watabe Y, et al. Intradural spinal hibernoma: case report. Surg Neurol. 1998;49(5):509-513.
24. Baskurt E, Padgett DM, Matsumoto JA. Multiple hibernomas in a 1-month-old female infant. AJNR Am J Neuroradiol. 2004;25(8):1443-1445.
25. da Motta AC, Tunkel DE, Westra WH, Yousem DM. Imaging findings of a hibernoma of the neck. AJNR Am J Neuroradiol. 2006;27(8):1658-1659.
26. Cook MA, Stern M, de Siva RD. MRI of a hibernoma. J Comput Assist Tomogr. 1996;20(2):333-335.
27. Murphey MD, Carroll JF, Flemming DJ, Pope TL, Gannon FH, Kransdorf MJ. From the archives of the AFIP: benign musculoskeletal lipomatous lesions. Radiographics. 2004;24(5):1433-1466.
28. Robison S, Rapmund A, Hemmings C, Fulham M, Barry P. False-positive diagnosis of metastasis on positron emission tomography–computed tomography imaging due to hibernoma. J Clin Oncol. 2009;27(6):994-995.
29. Kallas KM, Vaughan L, Haghighi P, Resnick D. Hibernoma of the left axilla; a case report and review of MR imaging. Skeletal Radiol. 2003;32(5):290-294.
Technique for Lumbar Pedicle Subtraction Osteotomy for Sagittal Plane Deformity in Revision
Pedicle subtraction osteotomies (PSOs) have been used in the treatment of multiple spinal conditions involving a fixed sagittal imbalance, such as degenerative scoliosis, idiopathic scoliosis, posttraumatic deformities, iatrogenic flatback syndrome, and ankylosing spondylitis. The procedure was first described by Thomasen1 for the treatment of ankylosing spondylitis. More recently, multiple centers have reported the expanded use and good success of PSO in the treatment of fixed sagittal imbalance of other etiologies.2,3 According to Bridwell and colleagues,2 lumbar lordosis can be increased 34.1°, and sagittal plumb line can be improved 13.5 cm.
PSO is a complex, extensive surgery most often performed in the revision setting. Multiple authors have described the technique for PSO.4,5 There are significant technical challenges and many complications, including neurologic deficits, pseudarthrosis of adjacent levels, and wound infections.6 Short-term challenges include a large loss of blood, 2.4 L on average, according to Bridwell and colleagues.6 Time of closure of the osteotomy gap is a crucial point in the surgery. Blood loss, often large, slows only after the gap is closed and stabilized.
In this article, we describe a technique in which an additional rod or pedicle screw construct is used at the periosteotomy levels to close the osteotomy gap during PSO and simplify subsequent instrumentation. In addition, we report our experience with the procedure.
Materials and Methods
Seventeen consecutive patients (mean age, 58 years; range, 12-81 years) with fixed sagittal imbalance were treated with lumbar PSO. The indication in all cases was flatback syndrome after previous spinal surgery. Mean follow-up was 13 months. Mean number of prior surgeries was 3. Thirteen PSOs were performed at L3, and 4 were performed at L2.
Radiographic data were collected from before surgery, in the immediate postoperative period, and at final follow-up. All the radiographs were standing films. Established radiographic parameters were measured: thoracic kyphosis from T5 to T12, lumbar lordosis from L1 to S1, PSO angle (1 level above to 1 level below osteotomy level), sagittal plumb line (from center of C7 body to posterosuperior aspect of S1 body), and coronal plumb line (from center of C7 body to center of S1 body).2
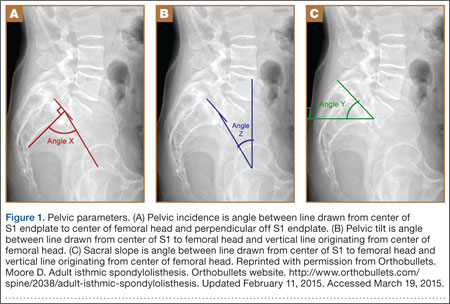
Good clinical outcomes in the treatment of spinal disorders require careful attention to the alignment of the spine in the sagittal plane.7,8 When evaluating the preoperative radiographs, we measured and documented pelvic parameters. Figure 1A shows how pelvic incidence was determined. We measured this as the angle between a line drawn from the center of the S1 endplate to the center of the femoral head and the perpendicular off the S1 endplate. Figure 1B shows pelvic tilt as determined by the angle between a line drawn from the center of S1 to the femoral head and a vertical line originating from the center of the femoral head. Figure 1C shows the sacral slope, which we measured as the angle between a line drawn parallel to the endplate of S1 and its intersection with a horizontal line.
Surgical Technique
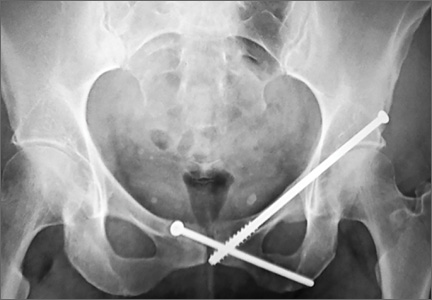
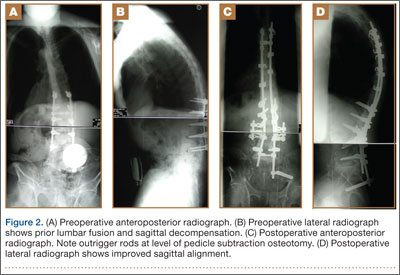
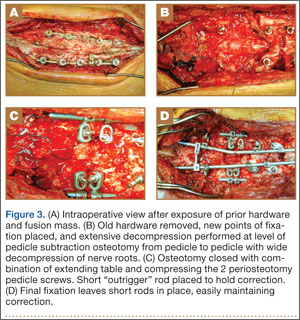
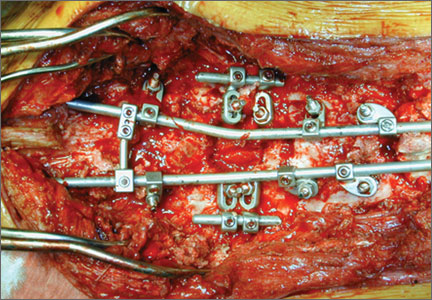
The overall surgical technique for PSO has been well described.4,5 Here we describe the “outrigger” modification to osteotomy closure (Figures 2, 3).
Most of our 17 cases were revisions. In these cases, new fixation points are first established. All fixation points that will be needed for the final fusion are placed. If a pedicle above or below the osteotomy level is not suitable for a screw, it can be skipped.
Wide decompression of the involved level is performed from pedicle to pedicle, ensuring that the nerve roots are completely decompressed. The dissection is then continued around the lateral wall of the vertebral body. While the neural elements are protected with gentle retraction, the pedicle and a portion of the posterior aspect of the vertebral body are removed with a combination of a rongeur and reverse-angle curettes. Resection of the vertebral body can be facilitated by attaching a short rod to the pedicle screws on either side of the osteotomy level and using it to provide gentle distraction.
Once sufficient bone has been removed to close the osteotomy, short rods are placed in the pedicle screws in the level above and the level below the osteotomy site. These rods are attached with offset connectors that allow the rods to be placed lateral to the screws. Before the surgical procedure is started, the patient is positioned on 2 sets of posts separated by the break in the table. The break in the table allows flexion to accommodate the preoperative kyphosis and allows hyperextension to help close the osteotomy site. Now, with the osteotomy site ready for closure, the table is gradually positioned in extension along with a combination of posterior pressure and compression between the pedicle screws above and below the osteotomy. Once the osteotomy is adequately compressed, the short rods are tightened, holding the osteotomy in good position. With the osteotomy held by the short rods and table positioning, decompression of the neural elements is confirmed and hemostasis obtained.
Final instrumentation is then performed with long rods that can bypass the osteotomized levels, allowing for simpler contouring. If desired, a cross connector can be placed between the long rod of the fusion construct and the short rod holding the osteotomy. The rest of the fusion procedure is completed in standard fashion with at least 1 subfascial drain.
Results
Our 17 patients’ results are summarized in the Table. Mean sagittal plumb line improved from 17.7 cm (range, 5.9 to 29 cm) before surgery to 4.5 cm (range, –0.2 to 12.9 cm) after surgery, for a mean improvement of 13.2 cm. At final follow-up, mean sagittal plumb line was 5.1 cm (range, –1.4 to 10.2 cm).
Mean lumbar lordosis improved from 10° (range, –14° to 34°) before surgery to 49° (range, 36° to 63°) after surgery, for a mean improvement of 39°. Mean PSO angle improved from 3° (range, –36° to 23°) before surgery to 41° (range, 25° to 65°) after surgery, for a mean improvement of 38°. At final follow-up, mean lumbar lordosis remained at 47° (range, 26° to 64°), and mean PSO angle was 39° (range, 24° to 59°).
Mean thoracic kyphosis improved from 18° (range, –8° to 52°) before surgery to 30° (range, 3° to 58°) after surgery, for a mean improvement of 12°. At final follow-up, mean thoracic kyphosis was 31° (range, 2° to 57°).
Fourteen patients did not have complications during the study period. Of the 3 patients with complications, 1 had an early infection, treated effectively with irrigation and débridement and intravenous antibiotics; 1 had a late deep infection, treated with multiple débridements, hardware removal, and, eventually, suppressive antibiotics; and 1 had cauda equina syndrome (caused by extensive scar tissue on the dura, which buckled with restoration of lordosis leading to cord compression), treated with duraplasty, which resulted in full neurologic recovery.
Discussion
In the present series of patients, the described technique for facilitating PSO for correction of sagittal imbalance was effective, and complications were similar to those previously reported.
The benefit of the outrigger construct is that it allows controlled compression of the osteotomy site and can be left in place at time of final instrumentation, locking in compression and correction. Other techniques involve removing the temporary rod and replacing it with final instrumentation4,5—an extra step that complicates instrumentation of the additional levels of the fusion construct and possibly adds pedicle screw stress and contributes to loosening when the new rod is reduced to the pedicle screw. The final long rod construct can bypass the osteotomy levels and allow for simpler instrumentation.
Mean age was 58 years in this series versus 52.4 years in the series reported by Bridwell and colleagues.2 Given the higher mean age of our patients, though no objective measures of bone quality were available, this technique is likely applicable to patients with poor bone quality.
The complications we have reported are in line with those reported in previous series, and maintenance of radiographic parameters at final follow-up indicates that this osteotomy technique allows for solid fusion constructs.
The outrigger technique for controlling PSO closure is an effective method that simplifies instrumentation during a complex revision case.
1. Thomasen E. Vertebral osteotomy for correction of kyphosis in ankylosing spondylitis. Clin Orthop. 1985;(194):142-152.
2. Bridwell KH, Lewis SJ, Lenke LG, Baldus C, Blanke K. Pedicle subtraction osteotomy for the treatment of fixed sagittal imbalance. J Bone Joint Surg Am. 2003;85(3):454-463.
3. Berven SH, Deviren V, Smith JA, Emami A, Hu SS, Bradford DS. Management of fixed sagittal plane deformity: results of the transpedicular wedge resection osteotomy. Spine. 2001;26(18):2036-2043.
4. Bridwell KH, Lewis SJ, Rinella A, Lenke LG, Baldus C, Blanke K. Pedicle subtraction osteotomy for the treatment of fixed sagittal imbalance. Surgical technique. J Bone Joint Surg Am. 2004;86(suppl 1):44-50.
5. Wang MY, Berven SH. Lumbar pedicle subtraction osteotomy. Neurosurgery. 2007;60(2 suppl 1):ONS140-ONS146.
6. Bridwell KH, Lewis SJ, Edwards C, et al. Complications and outcomes of pedicle subtraction osteotomies for fixed sagittal imbalance. Spine. 2003;28(18):2093-2101.
7. Vialle R, Levassor N, Rillardon L, Templier A, Skalli W, Guigui P. Radiographic analysis of the sagittal alignment and balance of the spine in asymptomatic subjects. J Bone Joint Surg Am. 2005;87(2):260-267.
8. Schwab F, Lafage V, Patel A, Farcy JP. Sagittal plane considerations and the pelvis in the adult patient. Spine. 2009;34(17):1828-1833.
Pedicle subtraction osteotomies (PSOs) have been used in the treatment of multiple spinal conditions involving a fixed sagittal imbalance, such as degenerative scoliosis, idiopathic scoliosis, posttraumatic deformities, iatrogenic flatback syndrome, and ankylosing spondylitis. The procedure was first described by Thomasen1 for the treatment of ankylosing spondylitis. More recently, multiple centers have reported the expanded use and good success of PSO in the treatment of fixed sagittal imbalance of other etiologies.2,3 According to Bridwell and colleagues,2 lumbar lordosis can be increased 34.1°, and sagittal plumb line can be improved 13.5 cm.
PSO is a complex, extensive surgery most often performed in the revision setting. Multiple authors have described the technique for PSO.4,5 There are significant technical challenges and many complications, including neurologic deficits, pseudarthrosis of adjacent levels, and wound infections.6 Short-term challenges include a large loss of blood, 2.4 L on average, according to Bridwell and colleagues.6 Time of closure of the osteotomy gap is a crucial point in the surgery. Blood loss, often large, slows only after the gap is closed and stabilized.
In this article, we describe a technique in which an additional rod or pedicle screw construct is used at the periosteotomy levels to close the osteotomy gap during PSO and simplify subsequent instrumentation. In addition, we report our experience with the procedure.
Materials and Methods
Seventeen consecutive patients (mean age, 58 years; range, 12-81 years) with fixed sagittal imbalance were treated with lumbar PSO. The indication in all cases was flatback syndrome after previous spinal surgery. Mean follow-up was 13 months. Mean number of prior surgeries was 3. Thirteen PSOs were performed at L3, and 4 were performed at L2.
Radiographic data were collected from before surgery, in the immediate postoperative period, and at final follow-up. All the radiographs were standing films. Established radiographic parameters were measured: thoracic kyphosis from T5 to T12, lumbar lordosis from L1 to S1, PSO angle (1 level above to 1 level below osteotomy level), sagittal plumb line (from center of C7 body to posterosuperior aspect of S1 body), and coronal plumb line (from center of C7 body to center of S1 body).2
Good clinical outcomes in the treatment of spinal disorders require careful attention to the alignment of the spine in the sagittal plane.7,8 When evaluating the preoperative radiographs, we measured and documented pelvic parameters. Figure 1A shows how pelvic incidence was determined. We measured this as the angle between a line drawn from the center of the S1 endplate to the center of the femoral head and the perpendicular off the S1 endplate. Figure 1B shows pelvic tilt as determined by the angle between a line drawn from the center of S1 to the femoral head and a vertical line originating from the center of the femoral head. Figure 1C shows the sacral slope, which we measured as the angle between a line drawn parallel to the endplate of S1 and its intersection with a horizontal line.
Surgical Technique
The overall surgical technique for PSO has been well described.4,5 Here we describe the “outrigger” modification to osteotomy closure (Figures 2, 3).
Most of our 17 cases were revisions. In these cases, new fixation points are first established. All fixation points that will be needed for the final fusion are placed. If a pedicle above or below the osteotomy level is not suitable for a screw, it can be skipped.
Wide decompression of the involved level is performed from pedicle to pedicle, ensuring that the nerve roots are completely decompressed. The dissection is then continued around the lateral wall of the vertebral body. While the neural elements are protected with gentle retraction, the pedicle and a portion of the posterior aspect of the vertebral body are removed with a combination of a rongeur and reverse-angle curettes. Resection of the vertebral body can be facilitated by attaching a short rod to the pedicle screws on either side of the osteotomy level and using it to provide gentle distraction.
Once sufficient bone has been removed to close the osteotomy, short rods are placed in the pedicle screws in the level above and the level below the osteotomy site. These rods are attached with offset connectors that allow the rods to be placed lateral to the screws. Before the surgical procedure is started, the patient is positioned on 2 sets of posts separated by the break in the table. The break in the table allows flexion to accommodate the preoperative kyphosis and allows hyperextension to help close the osteotomy site. Now, with the osteotomy site ready for closure, the table is gradually positioned in extension along with a combination of posterior pressure and compression between the pedicle screws above and below the osteotomy. Once the osteotomy is adequately compressed, the short rods are tightened, holding the osteotomy in good position. With the osteotomy held by the short rods and table positioning, decompression of the neural elements is confirmed and hemostasis obtained.
Final instrumentation is then performed with long rods that can bypass the osteotomized levels, allowing for simpler contouring. If desired, a cross connector can be placed between the long rod of the fusion construct and the short rod holding the osteotomy. The rest of the fusion procedure is completed in standard fashion with at least 1 subfascial drain.
Results
Our 17 patients’ results are summarized in the Table. Mean sagittal plumb line improved from 17.7 cm (range, 5.9 to 29 cm) before surgery to 4.5 cm (range, –0.2 to 12.9 cm) after surgery, for a mean improvement of 13.2 cm. At final follow-up, mean sagittal plumb line was 5.1 cm (range, –1.4 to 10.2 cm).
Mean lumbar lordosis improved from 10° (range, –14° to 34°) before surgery to 49° (range, 36° to 63°) after surgery, for a mean improvement of 39°. Mean PSO angle improved from 3° (range, –36° to 23°) before surgery to 41° (range, 25° to 65°) after surgery, for a mean improvement of 38°. At final follow-up, mean lumbar lordosis remained at 47° (range, 26° to 64°), and mean PSO angle was 39° (range, 24° to 59°).
Mean thoracic kyphosis improved from 18° (range, –8° to 52°) before surgery to 30° (range, 3° to 58°) after surgery, for a mean improvement of 12°. At final follow-up, mean thoracic kyphosis was 31° (range, 2° to 57°).
Fourteen patients did not have complications during the study period. Of the 3 patients with complications, 1 had an early infection, treated effectively with irrigation and débridement and intravenous antibiotics; 1 had a late deep infection, treated with multiple débridements, hardware removal, and, eventually, suppressive antibiotics; and 1 had cauda equina syndrome (caused by extensive scar tissue on the dura, which buckled with restoration of lordosis leading to cord compression), treated with duraplasty, which resulted in full neurologic recovery.
Discussion
In the present series of patients, the described technique for facilitating PSO for correction of sagittal imbalance was effective, and complications were similar to those previously reported.
The benefit of the outrigger construct is that it allows controlled compression of the osteotomy site and can be left in place at time of final instrumentation, locking in compression and correction. Other techniques involve removing the temporary rod and replacing it with final instrumentation4,5—an extra step that complicates instrumentation of the additional levels of the fusion construct and possibly adds pedicle screw stress and contributes to loosening when the new rod is reduced to the pedicle screw. The final long rod construct can bypass the osteotomy levels and allow for simpler instrumentation.
Mean age was 58 years in this series versus 52.4 years in the series reported by Bridwell and colleagues.2 Given the higher mean age of our patients, though no objective measures of bone quality were available, this technique is likely applicable to patients with poor bone quality.
The complications we have reported are in line with those reported in previous series, and maintenance of radiographic parameters at final follow-up indicates that this osteotomy technique allows for solid fusion constructs.
The outrigger technique for controlling PSO closure is an effective method that simplifies instrumentation during a complex revision case.
1. Thomasen E. Vertebral osteotomy for correction of kyphosis in ankylosing spondylitis. Clin Orthop. 1985;(194):142-152.
2. Bridwell KH, Lewis SJ, Lenke LG, Baldus C, Blanke K. Pedicle subtraction osteotomy for the treatment of fixed sagittal imbalance. J Bone Joint Surg Am. 2003;85(3):454-463.
3. Berven SH, Deviren V, Smith JA, Emami A, Hu SS, Bradford DS. Management of fixed sagittal plane deformity: results of the transpedicular wedge resection osteotomy. Spine. 2001;26(18):2036-2043.
4. Bridwell KH, Lewis SJ, Rinella A, Lenke LG, Baldus C, Blanke K. Pedicle subtraction osteotomy for the treatment of fixed sagittal imbalance. Surgical technique. J Bone Joint Surg Am. 2004;86(suppl 1):44-50.
5. Wang MY, Berven SH. Lumbar pedicle subtraction osteotomy. Neurosurgery. 2007;60(2 suppl 1):ONS140-ONS146.
6. Bridwell KH, Lewis SJ, Edwards C, et al. Complications and outcomes of pedicle subtraction osteotomies for fixed sagittal imbalance. Spine. 2003;28(18):2093-2101.
7. Vialle R, Levassor N, Rillardon L, Templier A, Skalli W, Guigui P. Radiographic analysis of the sagittal alignment and balance of the spine in asymptomatic subjects. J Bone Joint Surg Am. 2005;87(2):260-267.
8. Schwab F, Lafage V, Patel A, Farcy JP. Sagittal plane considerations and the pelvis in the adult patient. Spine. 2009;34(17):1828-1833.
Leg-Length Discrepancy After Total Hip Arthroplasty: Comparison of Robot-Assisted Posterior, Fluoroscopy-Guided Anterior, and Conventional Posterior Approaches
Total hip arthroplasty (THA) effectively provides adequate pain relief and favorable outcomes in patients with hip osteoarthritis (OA). However, leg-length discrepancy (LLD) is still a significant cause of morbidity,1 including nerve damage,2,3 low back pain,2,4,5 and abnormal gait.2,6,7 Although most of the LLD values reported in the literature fall under the acceptable threshold of 10 mm,8 some patients report dissatisfaction,9 leading to litigation against orthopedic surgeons.2 However, lower extremity lengthening is sometimes needed to achieve adequate hip joint stability and prevent dislocations.2,10
Several methods have been developed to help surgeons estimate the change in leg length during surgery in an attempt to improve clinical outcomes. Use of guide pins as a reference on the pelvis decreased LLD and improved outcomes in some published studies.11,12 Preoperative templating of implant size, cup position, and level of femoral neck cut is very important in helping minimize clinically significant LLD after THA.2,13,14 Computer-assisted THA has also been introduced to try to improve component positioning, restoration of hip center of rotation, and minimizing of LLD.15-17 However, cost and increased operative time have prevented widespread adoption of computer-assisted surgery in THA.
Proponents of different surgical approaches have argued about the superiority of one approach over another. The posterior approach is the gold standard in THA because it is safe, easy to perform, and, if needed, extensile.11 However, exact determination of the intraoperative 3-dimensional (3-D) orientation of the pelvis, and subsequently of LLD, is challenging when the patient lies in the lateral position. The anterior approach has gained in popularity because of its advantages in accelerating postoperative rehabilitation and decreasing hospital length of stay.18 Placing the patient supine is advantageous because it allows leveling of the pelvis and estimation of LLD (by comparing the positions of the lower extremities).19 The anterior approach also allows for radiographic measurements on the operating table.19,20 However, this approach has a high learning curve21 and is not extensile.21 To date, no study has shown superiority of the anterior approach over either the conventional posterior approach or the robot-assisted posterior approach in minimizing LLD after THA.
We conducted a study to compare LLD in patients who underwent THA performed with a robot-assisted posterior approach (RTHA), a fluoroscopy-guided anterior approach (ATHA), or a conventional posterior approach (PTHA). We hypothesized that, compared with PTHA, both RTHA and ATHA would result in reduced LLD.
Materials and Methods
We reviewed all RTHAs, ATHAs, and PTHAs performed by Dr. Domb between September 2008 and December 2012. Study inclusion criteria were a diagnosis of hip OA and the availability of postoperative supine anteroposterior pelvis radiographs. Exclusion criteria were a diagnosis other than hip OA, missing or improper postoperative radiographs (radiographs with rotated or tilted pelvis),22 and radiographs on which at least one of the lesser trochanters was difficult to define. Of the 155 cases included in the study, 67 were RTHAs, 29 were ATHAs, and 59 were PTHAs.
All patients scheduled for THA underwent preoperative planning; plain radiographs were used to determine component size and position, level of neck cut, and amount of leg lengthening or shortening needed. In all RTHA cases, computed tomography of the involved hip was performed before surgery. The MAKO system (MAKO Surgical Corporation, Davie, Florida) was used to develop a patient-specific 3-D model of the pelvis and proximal femur, and this model was used to guide THA execution. The system was then used to detect patient-specific landmarks during surgery, to register the femur and the acetabulum, and to help determine the position of the pelvis and proximal femur during surgery. This system, which uses a haptic robotic arm that guides acetabular reaming and cup placement, provides feedback regarding cup placement, stem version, leg length, and global offset. Pelvic tilt and rotation were accounted for by the MAKO software, and all provided measurements were made on the coronal (functional) plane of the body, as described by Murray.23 ATHA was performed with the patient in the supine position on a Hana table (Mizuho OSI, Union City, California) with fluoroscopic guidance. PTHA was performed in the conventional way, with the patient in the lateral position.
Radiographic measurements of LLD were made with TraumaCad software (Build 2.2.535.0; Voyant Health, Petah-Tikva, Israel). The accuracy of this software has been studied and reported in the literature.24-26 Radiographs were calibrated using the known size of each femoral head as a marker. The reference on the pelvis was the interobturator line (line tangent to inferior border of obturator foramina), and the reference on the femurs was the most superior and medial aspect of each lesser trochanter. Two lines were drawn, each perpendicular to the interobturator line, starting from the previously defined reference point on each lesser trochanter. The difference in length between these 2 lines was recorded as the LLD. Values were recorded relative to the operative extremity. For example, if the operative extremity was longer than the nonoperative extremity, the LLD was given a positive value.
To eliminate bias and increase measurement accuracy, the study had each of 2 observers collect the LLD data twice, 2 months apart. These observers were blinded to each other’s results and to the type of surgery performed. (Neither observer was Dr. Domb, the senior surgeon.) IBM SPSS Statistics software (Version 20; IBM, Armonk, New York) was used for statistical analysis. Each patient’s 4 measurements were averaged into a single number for LLD, and the absolute LLD values were used in all statistical analyses. Means, standard deviations (SDs), and 95% confidence intervals (CIs) were calculated for LLD in each of the 3 groups. Pearson correlation coefficient was used to determine interobserver and intraobserver reliability. One-way analysis of variance (ANOVA) was used to compare group means for age, body mass index (BMI), and LLD. In each group, number of outliers was determined with outliers set at LLDs of more than 3 mm and more than 5 mm. Fischer exact test was used to compare number of outliers in each group. P < .05 was considered statistically significant.
Results
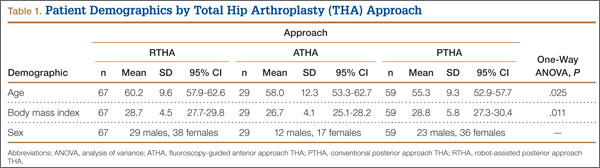
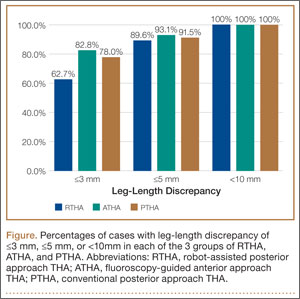
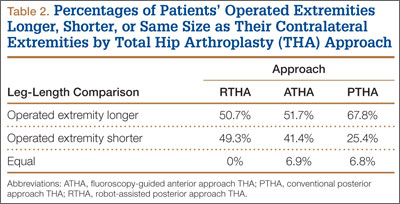
Table 1 lists the demographic data, including age, sex, and BMI, and compares the means. There were strong interobserver and intraobserver correlations for all LLD measurements (r > 0.9; P < .001). Mean (SD) LLD was 2.7 (1.8) mm (95% CI, 2.3-3.2) in the RTHA group, 1.8 (1.6) mm (95% CI, 1.2-2.4) in the ATHA group, and 1.9 (1.6) mm (95% CI, 1.5-2.4) in the PTHA group (P = .01). When LLD of more than 3 mm was set as an outlier, percentage of outliers was 37.3% (RTHA), 17.2% (ATHA), and 22% (PTHA) (P = .06-.78). When LLD of more than 5 mm was set as an outlier, percentage of outliers was 10.4% (RTHA), 6.9% (ATHA), and 8.5% (PTHA) (P = .72 to >.99). No patient in any group had LLD of 10 mm or more (Figure). Table 2 lists percentages of patients’ operated extremities that were longer, shorter, or the same size as their contralateral extremities. Six (9.0%) of the 67 RTHA patients, 4 (13.8%) of the 29 ATHA patients, and 3 (5.1%) of the 59 PTHA patients had a contralateral THA.
Discussion
Our study results showed that RTHA, ATHA, and PTHA were equally effective in minimizing LLD. There was a statistically significant difference in mean LLD among the 3 groups studied. The RTHA group had the largest mean (SD) LLD: 2.7 (1.8) mm. However, statistically significant differences do not always indicate clinical significance.27 Therefore, comparison of the 3 groups’ means is not enough for drawing significant conclusions. The more important point to consider is the number of cases of LLD of 10 mm or more—a discrepancy that would be perceptible to patients and thus become a source of dissatisfaction with painless THA.28 Patients perceive LLD when shortening exceeds 10 mm and lengthening exceeds 6 mm,29 or when LLD is more than 10 mm.16,19,20 Despite significant differences in means, all our cases came in under the 10-mm threshold. When the threshold was decreased to 5 mm (and to 3 mm), there was no statistically significant difference among the groups in the number of cases above the threshold.
LLD remains a source of significant post-THA comorbidity and patient dissatisfaction.1-7,19 Despite surgeons’ efforts to minimize LLD, some patients can detect even a subtle LLD after surgery.1,8,29 Most LLD values reported in the literature fall under the 10-mm threshold.16,19,20 In some cases, however, postoperative LLD is more than 1 cm, enough to prompt litigation against orthopedic surgeons.2 Surgeons have tried to improve LLD with use of multiple techniques, including use of intraoperative measuring devices,30 patient positioning during surgery,20 use of computer-assisted surgery,19 and use of intraoperative fluoroscopy.20
Proponents of computer-assisted THA have argued that this technique improves accuracy in placing the acetabular cup in the safe zone,31 minimizes LLD, and restores femoral offset.32,33 Manzotti and colleagues16 reported on 48 cases of computer-assisted THA matched to 48 cases of conventional THA using the posterior approach. Mean (SD) LLD was 5.06 (2.99) mm in the computer-assisted group and 7.64 (4.36) mm in the conventional group; there was a statistically significant difference in favor of the computer-assisted group (P = .04). However, 5 patients in the computer-assisted group and 13 in the conventional group had LLD of more than 10 mm, and the difference was statistically significant.16 Moreover, the study population was heterogeneous, with 12 patients in both groups having developmental dysplasia as a primary diagnosis.16 All the cases in our study had a diagnosis of OA, and no case had LLD of 10 mm or more.
Several advantages have been proposed for the anterior approach. The supine position (with direct comparison of leg lengths) and the use of fluoroscopy have been described as advantageous in minimizing LLD.20,21 In their study of 494 primary THAs performed with the anterior approach, Matta and colleagues20 reported mean (SD) postoperative LLD of 3 (2) mm (range, 0-26 mm) and concluded that the anterior approach was effective in restoring leg lengths and ensuring proper cup placement while not increasing the dislocation rate. However, they did not compare this approach with others or with computer-assisted THA with respect to LLD.
In another study, Nam and colleagues19 compared LLD after THA performed with 3 different approaches (anterior, conventional posterior, posterior-navigated) and found no statistically significant difference in LLD among the groups. However, LLD was more than 10 mm in 2.2% of anterior cases, 4.4% of conventional posterior cases, and 4.4% of posterior-navigated cases. When 5 mm was used as a cutoff, percentage of patients who were outliers was 31.1% (anterior), 20% (conventional posterior), and 23.3% (navigated-posterior). Our data showed superior results in using 5 mm as a cutoff, with percentage of outliers of 6.9% with ATHA, 8.5% with PTHA, and 10.4% with RTHA. However, Nam and colleagues19 used a larger patient cohort and different techniques for measuring LLD on anteroposterior pelvis radiographs.
The most likely reason that the groups in our study were comparable in terms of LLD accuracy and lack of outliers over the 10-mm cutoff was Dr. Domb’s high accuracy in minimizing LLD using each of the 3 techniques. For ATHA, mean (SD) LLD was 1.8 (1.6) mm (no LLD of ≥10 mm), better than the 3 (2) mm (0.9% with LLD of >10 mm) reported by Matta and colleagues20 and the 3.8 (3.9) mm (2.2% with LLD of >10 mm) reported by Nam and colleagues.19 For PTHA, mean (SD) LLD was 1.9 (1.6) mm (no LLD of ≥10 mm), comparable to some of the best results reported in the literature—for example, the 1 mm (3% with LLD of >10 mm) reported by Woolson and colleagues.34 For RTHA, mean (SD) LLD was 2.7 (1.8) mm (no LLD of ≥10 mm), superior to the 3.9 (2.7) mm (4.4% with LLD of >10 mm) reported by Nam and colleagues19 for posterior-navigated THA and the 5.06 (2.99) mm (10.4% with LLD of >10 mm) reported by Manzotti and colleagues16 for computer-assisted THA.
This study had several notable strengths. All patients had a diagnosis of hip OA and were operated on by a single surgeon. Radiographs were calibrated using the size of the implanted femoral head. Radiographic data were measured using the same technique in all cases and were collected twice by 2 observers (not the senior surgeon) to decrease bias and determine interobserver and intraobserver reliability. In addition, surgeon experience might have played an important role in minimizing LLD regardless of technique and approach used for THA.
Study limitations were different number of cases in each group, lack of matching, lack of clinical follow-up, and lack of long-term assessment of clinical outcomes and complications.
Conclusion
As performed by an experienced surgeon, RTHA, ATHA, and PTHA did not differ in obtaining minimal LLD. All 3 groups had a low frequency of outliers, using thresholds of 3 mm and 5 mm, and no patient in any group had LLD of 10 mm or more. All 3 techniques are effective in achieving accuracy in LLD.
1. Maloney WJ, Keeney JA. Leg length discrepancy after total hip arthroplasty. J Arthroplasty. 2004;19(4 suppl 1):108-110.
2. Clark CR, Huddleston HD, Schoch EP 3rd, Thomas BJ. Leg-length discrepancy after total hip arthroplasty. J Am Acad Orthop Surg. 2006;14(1):38-45.
3. Edwards BN, Tullos HS, Noble PC. Contributory factors and etiology of sciatic nerve palsy in total hip arthroplasty. Clin Orthop. 1987;(218):136-141.
4. Giles LG, Taylor JR. Low-back pain associated with leg length inequality. Spine. 1981;6(5):510-521.
5. Parvizi J, Sharkey PF, Bissett GA, Rothman RH, Hozack WJ. Surgical treatment of limb-length discrepancy following total hip arthroplasty. J Bone Joint Surg Am. 2003;85(12):2310-2317.
6. Edeen J, Sharkey PF, Alexander AH. Clinical significance of leg-length inequality after total hip arthroplasty. Am J Orthop. 1995;24(4):347-351.
7. Gurney B, Mermier C, Robergs R, Gibson A, Rivero D. Effects of limb-length discrepancy on gait economy and lower-extremity muscle activity in older adults. J Bone Joint Surg Am. 2001;83(6):907-915.
8. O’Brien S, Kernohan G, Fitzpatrick C, Hill J, Beverland D. Perception of imposed leg length inequality in normal subjects. Hip Int. 2010;20(4):505-511.
9. Hofmann AA, Skrzynski MC. Leg-length inequality and nerve palsy in total hip arthroplasty: a lawyer awaits! Orthopedics. 2000;23(9):943-944.
10. Miyamoto RG, Kaplan KM, Levine BR, Egol KA, Zuckerman JD. Surgical management of hip fractures: an evidence-based review of the literature. I: femoral neck fractures. J Am Acad Orthop Surg. 2008;16(10):596-607.
11. Ranawat CS, Rao RR, Rodriguez JA, Bhende HS. Correction of limb-length inequality during total hip arthroplasty. J Arthroplasty. 2001;16(6):715-720.
12. McGee HM, Scott JH. A simple method of obtaining equal leg length in total hip arthroplasty. Clin Orthop. 1985;(194):269-270.
13. Della Valle AG, Padgett DE, Salvati EA. Preoperative planning for primary total hip arthroplasty. J Am Acad Orthop Surg. 2005;13(7):455-462.
14. Gonzalez Della Valle A, Slullitel G, Piccaluga F, Salvati EA. The precision and usefulness of preoperative planning for cemented and hybrid primary total hip arthroplasty. J Arthroplasty. 2005;20(1):51-58.
15. Confalonieri N, Manzotti A, Montironi F, Pullen C. Leg length discrepancy, dislocation rate, and offset in total hip replacement using a short modular stem: navigation vs conventional freehand. Orthopedics. 2008;31(10 suppl 1).
16. Manzotti A, Cerveri P, De Momi E, Pullen C, Confalonieri N. Does computer-assisted surgery benefit leg length restoration in total hip replacement? Navigation versus conventional freehand. Int Orthop. 2011;35(1):19-24.
17. Nishio S, Fukunishi S, Fukui T, Fujihara Y, Yoshiya S. Adjustment of leg length using imageless navigation THA software without a femoral tracker. J Orthop Sci. 2011;16(2):171-176.
18. Martin CT, Pugely AJ, Gao Y, Clark CR. A comparison of hospital length of stay and short-term morbidity between the anterior and the posterior approaches to total hip arthroplasty. J Arthroplasty. 2013;28(5):849-854.
19. Nam D, Sculco PK, Abdel MP, Alexiades MM, Figgie MP, Mayman DJ. Leg-length inequalities following THA based on surgical technique. Orthopedics. 2013;36(4):e395-e400.
20. Matta JM, Shahrdar C, Ferguson T. Single-incision anterior approach for total hip arthroplasty on an orthopaedic table. Clin Orthop. 2005;(441):115-124.
21. Yi C, Agudelo JF, Dayton MR, Morgan SJ. Early complications of anterior supine intermuscular total hip arthroplasty. Orthopedics. 2013;36(3):e276-e281.
22. Siebenrock KA, Kalbermatten DF, Ganz R. Effect of pelvic tilt on acetabular retroversion: a study of pelves from cadavers. Clin Orthop. 2003;(407):241-248.
23. Murray DW. The definition and measurement of acetabular orientation. J Bone Joint Surg Br. 1993;75(2):228-232.
24. Kumar PG, Kirmani SJ, Humberg H, Kavarthapu V, Li P. Reproducibility and accuracy of templating uncemented THA with digital radiographic and digital TraumaCad templating software. Orthopedics. 2009;32(11):815.
25. Steinberg EL, Shasha N, Menahem A, Dekel S. Preoperative planning of total hip replacement using the TraumaCad system. Arch Orthop Trauma Surg. 2010;130(12):1429-1432.
26. Westacott DJ, McArthur J, King RJ, Foguet P. Assessment of cup orientation in hip resurfacing: a comparison of TraumaCad and computed tomography. J Orthop Surg Res. 2013;8:8.
27. Copay AG, Subach BR, Glassman SD, Polly DW Jr, Schuler TC. Understanding the minimum clinically important difference: a review of concepts and methods. Spine J. 2007;7(5):541-546.
28. Abraham WD, Dimon JH 3rd. Leg length discrepancy in total hip arthroplasty. Orthop Clin North Am. 1992;23(2):201-209.
29. Konyves A, Bannister GC. The importance of leg length discrepancy after total hip arthroplasty. J Bone Joint Surg Br. 2005;87(2):155-157.
30. Matsuda K, Nakamura S, Matsushita T. A simple method to minimize limb-length discrepancy after hip arthroplasty. Acta Orthop. 2006;77(3):375-379.
31. Haaker RG, Tiedjen K, Ottersbach A, Rubenthaler F, Stockheim M, Stiehl JB. Comparison of conventional versus computer-navigated acetabular component insertion. J Arthroplasty. 2007;22(2):151-159.
32. Renkawitz T, Schuster T, Herold T, et al. Measuring leg length and offset with an imageless navigation system during total hip arthroplasty: is it really accurate? Int J Med Robot. 2009;5(2):192-197.
33. Nakamura N, Sugano N, Nishii T, Kakimoto A, Miki H. A comparison between robotic-assisted and manual implantation of cementless total hip arthroplasty. Clin Orthop. 2010;468(4):1072-1081.
34. Woolson ST, Hartford JM, Sawyer A. Results of a method of leg-length equalization for patients undergoing primary total hip replacement. J Arthroplasty. 1999;14(2):159-164.
Total hip arthroplasty (THA) effectively provides adequate pain relief and favorable outcomes in patients with hip osteoarthritis (OA). However, leg-length discrepancy (LLD) is still a significant cause of morbidity,1 including nerve damage,2,3 low back pain,2,4,5 and abnormal gait.2,6,7 Although most of the LLD values reported in the literature fall under the acceptable threshold of 10 mm,8 some patients report dissatisfaction,9 leading to litigation against orthopedic surgeons.2 However, lower extremity lengthening is sometimes needed to achieve adequate hip joint stability and prevent dislocations.2,10
Several methods have been developed to help surgeons estimate the change in leg length during surgery in an attempt to improve clinical outcomes. Use of guide pins as a reference on the pelvis decreased LLD and improved outcomes in some published studies.11,12 Preoperative templating of implant size, cup position, and level of femoral neck cut is very important in helping minimize clinically significant LLD after THA.2,13,14 Computer-assisted THA has also been introduced to try to improve component positioning, restoration of hip center of rotation, and minimizing of LLD.15-17 However, cost and increased operative time have prevented widespread adoption of computer-assisted surgery in THA.
Proponents of different surgical approaches have argued about the superiority of one approach over another. The posterior approach is the gold standard in THA because it is safe, easy to perform, and, if needed, extensile.11 However, exact determination of the intraoperative 3-dimensional (3-D) orientation of the pelvis, and subsequently of LLD, is challenging when the patient lies in the lateral position. The anterior approach has gained in popularity because of its advantages in accelerating postoperative rehabilitation and decreasing hospital length of stay.18 Placing the patient supine is advantageous because it allows leveling of the pelvis and estimation of LLD (by comparing the positions of the lower extremities).19 The anterior approach also allows for radiographic measurements on the operating table.19,20 However, this approach has a high learning curve21 and is not extensile.21 To date, no study has shown superiority of the anterior approach over either the conventional posterior approach or the robot-assisted posterior approach in minimizing LLD after THA.
We conducted a study to compare LLD in patients who underwent THA performed with a robot-assisted posterior approach (RTHA), a fluoroscopy-guided anterior approach (ATHA), or a conventional posterior approach (PTHA). We hypothesized that, compared with PTHA, both RTHA and ATHA would result in reduced LLD.
Materials and Methods
We reviewed all RTHAs, ATHAs, and PTHAs performed by Dr. Domb between September 2008 and December 2012. Study inclusion criteria were a diagnosis of hip OA and the availability of postoperative supine anteroposterior pelvis radiographs. Exclusion criteria were a diagnosis other than hip OA, missing or improper postoperative radiographs (radiographs with rotated or tilted pelvis),22 and radiographs on which at least one of the lesser trochanters was difficult to define. Of the 155 cases included in the study, 67 were RTHAs, 29 were ATHAs, and 59 were PTHAs.
All patients scheduled for THA underwent preoperative planning; plain radiographs were used to determine component size and position, level of neck cut, and amount of leg lengthening or shortening needed. In all RTHA cases, computed tomography of the involved hip was performed before surgery. The MAKO system (MAKO Surgical Corporation, Davie, Florida) was used to develop a patient-specific 3-D model of the pelvis and proximal femur, and this model was used to guide THA execution. The system was then used to detect patient-specific landmarks during surgery, to register the femur and the acetabulum, and to help determine the position of the pelvis and proximal femur during surgery. This system, which uses a haptic robotic arm that guides acetabular reaming and cup placement, provides feedback regarding cup placement, stem version, leg length, and global offset. Pelvic tilt and rotation were accounted for by the MAKO software, and all provided measurements were made on the coronal (functional) plane of the body, as described by Murray.23 ATHA was performed with the patient in the supine position on a Hana table (Mizuho OSI, Union City, California) with fluoroscopic guidance. PTHA was performed in the conventional way, with the patient in the lateral position.
Radiographic measurements of LLD were made with TraumaCad software (Build 2.2.535.0; Voyant Health, Petah-Tikva, Israel). The accuracy of this software has been studied and reported in the literature.24-26 Radiographs were calibrated using the known size of each femoral head as a marker. The reference on the pelvis was the interobturator line (line tangent to inferior border of obturator foramina), and the reference on the femurs was the most superior and medial aspect of each lesser trochanter. Two lines were drawn, each perpendicular to the interobturator line, starting from the previously defined reference point on each lesser trochanter. The difference in length between these 2 lines was recorded as the LLD. Values were recorded relative to the operative extremity. For example, if the operative extremity was longer than the nonoperative extremity, the LLD was given a positive value.
To eliminate bias and increase measurement accuracy, the study had each of 2 observers collect the LLD data twice, 2 months apart. These observers were blinded to each other’s results and to the type of surgery performed. (Neither observer was Dr. Domb, the senior surgeon.) IBM SPSS Statistics software (Version 20; IBM, Armonk, New York) was used for statistical analysis. Each patient’s 4 measurements were averaged into a single number for LLD, and the absolute LLD values were used in all statistical analyses. Means, standard deviations (SDs), and 95% confidence intervals (CIs) were calculated for LLD in each of the 3 groups. Pearson correlation coefficient was used to determine interobserver and intraobserver reliability. One-way analysis of variance (ANOVA) was used to compare group means for age, body mass index (BMI), and LLD. In each group, number of outliers was determined with outliers set at LLDs of more than 3 mm and more than 5 mm. Fischer exact test was used to compare number of outliers in each group. P < .05 was considered statistically significant.
Results
Table 1 lists the demographic data, including age, sex, and BMI, and compares the means. There were strong interobserver and intraobserver correlations for all LLD measurements (r > 0.9; P < .001). Mean (SD) LLD was 2.7 (1.8) mm (95% CI, 2.3-3.2) in the RTHA group, 1.8 (1.6) mm (95% CI, 1.2-2.4) in the ATHA group, and 1.9 (1.6) mm (95% CI, 1.5-2.4) in the PTHA group (P = .01). When LLD of more than 3 mm was set as an outlier, percentage of outliers was 37.3% (RTHA), 17.2% (ATHA), and 22% (PTHA) (P = .06-.78). When LLD of more than 5 mm was set as an outlier, percentage of outliers was 10.4% (RTHA), 6.9% (ATHA), and 8.5% (PTHA) (P = .72 to >.99). No patient in any group had LLD of 10 mm or more (Figure). Table 2 lists percentages of patients’ operated extremities that were longer, shorter, or the same size as their contralateral extremities. Six (9.0%) of the 67 RTHA patients, 4 (13.8%) of the 29 ATHA patients, and 3 (5.1%) of the 59 PTHA patients had a contralateral THA.
Discussion
Our study results showed that RTHA, ATHA, and PTHA were equally effective in minimizing LLD. There was a statistically significant difference in mean LLD among the 3 groups studied. The RTHA group had the largest mean (SD) LLD: 2.7 (1.8) mm. However, statistically significant differences do not always indicate clinical significance.27 Therefore, comparison of the 3 groups’ means is not enough for drawing significant conclusions. The more important point to consider is the number of cases of LLD of 10 mm or more—a discrepancy that would be perceptible to patients and thus become a source of dissatisfaction with painless THA.28 Patients perceive LLD when shortening exceeds 10 mm and lengthening exceeds 6 mm,29 or when LLD is more than 10 mm.16,19,20 Despite significant differences in means, all our cases came in under the 10-mm threshold. When the threshold was decreased to 5 mm (and to 3 mm), there was no statistically significant difference among the groups in the number of cases above the threshold.
LLD remains a source of significant post-THA comorbidity and patient dissatisfaction.1-7,19 Despite surgeons’ efforts to minimize LLD, some patients can detect even a subtle LLD after surgery.1,8,29 Most LLD values reported in the literature fall under the 10-mm threshold.16,19,20 In some cases, however, postoperative LLD is more than 1 cm, enough to prompt litigation against orthopedic surgeons.2 Surgeons have tried to improve LLD with use of multiple techniques, including use of intraoperative measuring devices,30 patient positioning during surgery,20 use of computer-assisted surgery,19 and use of intraoperative fluoroscopy.20
Proponents of computer-assisted THA have argued that this technique improves accuracy in placing the acetabular cup in the safe zone,31 minimizes LLD, and restores femoral offset.32,33 Manzotti and colleagues16 reported on 48 cases of computer-assisted THA matched to 48 cases of conventional THA using the posterior approach. Mean (SD) LLD was 5.06 (2.99) mm in the computer-assisted group and 7.64 (4.36) mm in the conventional group; there was a statistically significant difference in favor of the computer-assisted group (P = .04). However, 5 patients in the computer-assisted group and 13 in the conventional group had LLD of more than 10 mm, and the difference was statistically significant.16 Moreover, the study population was heterogeneous, with 12 patients in both groups having developmental dysplasia as a primary diagnosis.16 All the cases in our study had a diagnosis of OA, and no case had LLD of 10 mm or more.
Several advantages have been proposed for the anterior approach. The supine position (with direct comparison of leg lengths) and the use of fluoroscopy have been described as advantageous in minimizing LLD.20,21 In their study of 494 primary THAs performed with the anterior approach, Matta and colleagues20 reported mean (SD) postoperative LLD of 3 (2) mm (range, 0-26 mm) and concluded that the anterior approach was effective in restoring leg lengths and ensuring proper cup placement while not increasing the dislocation rate. However, they did not compare this approach with others or with computer-assisted THA with respect to LLD.
In another study, Nam and colleagues19 compared LLD after THA performed with 3 different approaches (anterior, conventional posterior, posterior-navigated) and found no statistically significant difference in LLD among the groups. However, LLD was more than 10 mm in 2.2% of anterior cases, 4.4% of conventional posterior cases, and 4.4% of posterior-navigated cases. When 5 mm was used as a cutoff, percentage of patients who were outliers was 31.1% (anterior), 20% (conventional posterior), and 23.3% (navigated-posterior). Our data showed superior results in using 5 mm as a cutoff, with percentage of outliers of 6.9% with ATHA, 8.5% with PTHA, and 10.4% with RTHA. However, Nam and colleagues19 used a larger patient cohort and different techniques for measuring LLD on anteroposterior pelvis radiographs.
The most likely reason that the groups in our study were comparable in terms of LLD accuracy and lack of outliers over the 10-mm cutoff was Dr. Domb’s high accuracy in minimizing LLD using each of the 3 techniques. For ATHA, mean (SD) LLD was 1.8 (1.6) mm (no LLD of ≥10 mm), better than the 3 (2) mm (0.9% with LLD of >10 mm) reported by Matta and colleagues20 and the 3.8 (3.9) mm (2.2% with LLD of >10 mm) reported by Nam and colleagues.19 For PTHA, mean (SD) LLD was 1.9 (1.6) mm (no LLD of ≥10 mm), comparable to some of the best results reported in the literature—for example, the 1 mm (3% with LLD of >10 mm) reported by Woolson and colleagues.34 For RTHA, mean (SD) LLD was 2.7 (1.8) mm (no LLD of ≥10 mm), superior to the 3.9 (2.7) mm (4.4% with LLD of >10 mm) reported by Nam and colleagues19 for posterior-navigated THA and the 5.06 (2.99) mm (10.4% with LLD of >10 mm) reported by Manzotti and colleagues16 for computer-assisted THA.
This study had several notable strengths. All patients had a diagnosis of hip OA and were operated on by a single surgeon. Radiographs were calibrated using the size of the implanted femoral head. Radiographic data were measured using the same technique in all cases and were collected twice by 2 observers (not the senior surgeon) to decrease bias and determine interobserver and intraobserver reliability. In addition, surgeon experience might have played an important role in minimizing LLD regardless of technique and approach used for THA.
Study limitations were different number of cases in each group, lack of matching, lack of clinical follow-up, and lack of long-term assessment of clinical outcomes and complications.
Conclusion
As performed by an experienced surgeon, RTHA, ATHA, and PTHA did not differ in obtaining minimal LLD. All 3 groups had a low frequency of outliers, using thresholds of 3 mm and 5 mm, and no patient in any group had LLD of 10 mm or more. All 3 techniques are effective in achieving accuracy in LLD.
1. Maloney WJ, Keeney JA. Leg length discrepancy after total hip arthroplasty. J Arthroplasty. 2004;19(4 suppl 1):108-110.
2. Clark CR, Huddleston HD, Schoch EP 3rd, Thomas BJ. Leg-length discrepancy after total hip arthroplasty. J Am Acad Orthop Surg. 2006;14(1):38-45.
3. Edwards BN, Tullos HS, Noble PC. Contributory factors and etiology of sciatic nerve palsy in total hip arthroplasty. Clin Orthop. 1987;(218):136-141.
4. Giles LG, Taylor JR. Low-back pain associated with leg length inequality. Spine. 1981;6(5):510-521.
5. Parvizi J, Sharkey PF, Bissett GA, Rothman RH, Hozack WJ. Surgical treatment of limb-length discrepancy following total hip arthroplasty. J Bone Joint Surg Am. 2003;85(12):2310-2317.
6. Edeen J, Sharkey PF, Alexander AH. Clinical significance of leg-length inequality after total hip arthroplasty. Am J Orthop. 1995;24(4):347-351.
7. Gurney B, Mermier C, Robergs R, Gibson A, Rivero D. Effects of limb-length discrepancy on gait economy and lower-extremity muscle activity in older adults. J Bone Joint Surg Am. 2001;83(6):907-915.
8. O’Brien S, Kernohan G, Fitzpatrick C, Hill J, Beverland D. Perception of imposed leg length inequality in normal subjects. Hip Int. 2010;20(4):505-511.
9. Hofmann AA, Skrzynski MC. Leg-length inequality and nerve palsy in total hip arthroplasty: a lawyer awaits! Orthopedics. 2000;23(9):943-944.
10. Miyamoto RG, Kaplan KM, Levine BR, Egol KA, Zuckerman JD. Surgical management of hip fractures: an evidence-based review of the literature. I: femoral neck fractures. J Am Acad Orthop Surg. 2008;16(10):596-607.
11. Ranawat CS, Rao RR, Rodriguez JA, Bhende HS. Correction of limb-length inequality during total hip arthroplasty. J Arthroplasty. 2001;16(6):715-720.
12. McGee HM, Scott JH. A simple method of obtaining equal leg length in total hip arthroplasty. Clin Orthop. 1985;(194):269-270.
13. Della Valle AG, Padgett DE, Salvati EA. Preoperative planning for primary total hip arthroplasty. J Am Acad Orthop Surg. 2005;13(7):455-462.
14. Gonzalez Della Valle A, Slullitel G, Piccaluga F, Salvati EA. The precision and usefulness of preoperative planning for cemented and hybrid primary total hip arthroplasty. J Arthroplasty. 2005;20(1):51-58.
15. Confalonieri N, Manzotti A, Montironi F, Pullen C. Leg length discrepancy, dislocation rate, and offset in total hip replacement using a short modular stem: navigation vs conventional freehand. Orthopedics. 2008;31(10 suppl 1).
16. Manzotti A, Cerveri P, De Momi E, Pullen C, Confalonieri N. Does computer-assisted surgery benefit leg length restoration in total hip replacement? Navigation versus conventional freehand. Int Orthop. 2011;35(1):19-24.
17. Nishio S, Fukunishi S, Fukui T, Fujihara Y, Yoshiya S. Adjustment of leg length using imageless navigation THA software without a femoral tracker. J Orthop Sci. 2011;16(2):171-176.
18. Martin CT, Pugely AJ, Gao Y, Clark CR. A comparison of hospital length of stay and short-term morbidity between the anterior and the posterior approaches to total hip arthroplasty. J Arthroplasty. 2013;28(5):849-854.
19. Nam D, Sculco PK, Abdel MP, Alexiades MM, Figgie MP, Mayman DJ. Leg-length inequalities following THA based on surgical technique. Orthopedics. 2013;36(4):e395-e400.
20. Matta JM, Shahrdar C, Ferguson T. Single-incision anterior approach for total hip arthroplasty on an orthopaedic table. Clin Orthop. 2005;(441):115-124.
21. Yi C, Agudelo JF, Dayton MR, Morgan SJ. Early complications of anterior supine intermuscular total hip arthroplasty. Orthopedics. 2013;36(3):e276-e281.
22. Siebenrock KA, Kalbermatten DF, Ganz R. Effect of pelvic tilt on acetabular retroversion: a study of pelves from cadavers. Clin Orthop. 2003;(407):241-248.
23. Murray DW. The definition and measurement of acetabular orientation. J Bone Joint Surg Br. 1993;75(2):228-232.
24. Kumar PG, Kirmani SJ, Humberg H, Kavarthapu V, Li P. Reproducibility and accuracy of templating uncemented THA with digital radiographic and digital TraumaCad templating software. Orthopedics. 2009;32(11):815.
25. Steinberg EL, Shasha N, Menahem A, Dekel S. Preoperative planning of total hip replacement using the TraumaCad system. Arch Orthop Trauma Surg. 2010;130(12):1429-1432.
26. Westacott DJ, McArthur J, King RJ, Foguet P. Assessment of cup orientation in hip resurfacing: a comparison of TraumaCad and computed tomography. J Orthop Surg Res. 2013;8:8.
27. Copay AG, Subach BR, Glassman SD, Polly DW Jr, Schuler TC. Understanding the minimum clinically important difference: a review of concepts and methods. Spine J. 2007;7(5):541-546.
28. Abraham WD, Dimon JH 3rd. Leg length discrepancy in total hip arthroplasty. Orthop Clin North Am. 1992;23(2):201-209.
29. Konyves A, Bannister GC. The importance of leg length discrepancy after total hip arthroplasty. J Bone Joint Surg Br. 2005;87(2):155-157.
30. Matsuda K, Nakamura S, Matsushita T. A simple method to minimize limb-length discrepancy after hip arthroplasty. Acta Orthop. 2006;77(3):375-379.
31. Haaker RG, Tiedjen K, Ottersbach A, Rubenthaler F, Stockheim M, Stiehl JB. Comparison of conventional versus computer-navigated acetabular component insertion. J Arthroplasty. 2007;22(2):151-159.
32. Renkawitz T, Schuster T, Herold T, et al. Measuring leg length and offset with an imageless navigation system during total hip arthroplasty: is it really accurate? Int J Med Robot. 2009;5(2):192-197.
33. Nakamura N, Sugano N, Nishii T, Kakimoto A, Miki H. A comparison between robotic-assisted and manual implantation of cementless total hip arthroplasty. Clin Orthop. 2010;468(4):1072-1081.
34. Woolson ST, Hartford JM, Sawyer A. Results of a method of leg-length equalization for patients undergoing primary total hip replacement. J Arthroplasty. 1999;14(2):159-164.
Computer Navigation and Robotics for Total Knee Arthroplasty
Total knee arthroplasty (TKA) is a good surgical option to relieve pain and improve function in patients with osteoarthritis. The goal of surgery is to achieve a well-aligned prosthesis with well-balanced ligaments in order to minimize wear and improve implant survival. Overall, 82% to 89% of patients are satisfied with their outcomes after TKA, with good 10- to 15-year implant survivorship; however, there is still a subset of patients that are unsatisfied. In many cases, patient dissatisfaction is attributed to improper component alignment.1-3 Over the past decade, computer navigation and robotics have been introduced to control surgical variables so as to gain greater consistency in implant placement and postoperative component alignment.
Computer-assisted navigation tools were introduced not only to improve implant alignment but, more importantly, to optimize clinical outcomes. Most studies have demonstrated that the use of navigation is associated with fewer radiographic outliers after TKA.4 Various studies have compared radiographic results of navigated TKA with results of TKA using standard instrumentation.4-7 While long-term studies are necessary, short-term follow-up has shown that computer-assisted TKA can improve alignment, especially in patients with severe deformity.8-10 Currently, there is no definitive consensus that computer-assisted TKA leads to significantly better component alignment or postoperative outcomes due to the fact that many studies are limited by study design or small cohorts. However, the currently published articles support better component alignment and clinical outcomes with computer-assisted TKA. While some argue that the use of computer-assisted surgery is dependent on the user’s experience, computer-assisted surgery can assist less-experienced surgeons to reliably achieve good midterm outcomes with a low complication rate.8,11 Various studies have looked at computer-assisted TKA at midterm follow-up, with no significant differences in clinical outcome between navigated and traditional techniques. However, long-term studies showing the benefits of computer navigation are beginning to emerge. For example, de Steiger and colleagues12 recently found that computer-assisted TKA reduced the overall revision rate for loosening after TKA in patients less than 65 years of age.
While surgical navigation helps improve implant planning, robotic tools have emerged as a tool to help refine surgical execution. Coupled with surgical navigation tools, robotic control of surgical gestures may further enhance precision in implant placement and/or enable novel implant design features. At present, robotic techniques are increasingly used in unicompartmental knee arthroplasty (UKA) and TKA.13 Studies have demonstrated that the robotic tool is 3 times more accurate with 3 times less variability than conventional techniques in UKA.14 The utility of robotic tools for TKA remains unclear. Robotic-driven automatic cutting guides have been shown to reduce time and improve accuracy compared with navigation guides in femoral TKA cutting procedures in a cadaveric model.15 However, robotic-enabled TKA procedures are poorly described at present, and the clinical implications of their proposed improved precision remain unclear.
Computer navigation and robotic tools in TKA hold the promise of enhanced control of surgical variables that influence clinical outcome. The variables that may be impacted by these advanced tools include implant positioning, lower limb alignment, soft-tissue balance, and, potentially, implant design and fixation. At present, these tools have primarily been shown to improve lower limb alignment in TKA. The clinical impact of the enhanced control of this single surgical variable (lower limb alignment) has been muted in short-term and midterm studies. Future studies should be directed at understanding which surgical variable, or combination of variables, it is most essential to precisely control so as to positively impact clinical outcomes. ◾
1. Bourne RB, Chesworth BM, Davis AM, Mahomed NN, Charron KD. Patient satisfaction after total knee arthroplasty: who is satisfied and who is not? Clin Orthop Relat Res. 2010;468(1):57-63.
2. Sharkey PF, Hozack WJ, Rothman RH, Shastri S, Jacoby SM. Insall Award paper. Why are total knee arthroplasties failing today? Clin Orthop Relat Res. 2002;(404):7-13.
3. Emmerson KP, Morgan CG, Pinder IM. Survivorship analysis of the Kinematic Stabilizer total knee replacement: a 10- to 14-year follow-up. J Bone Joint Surg Br. 1996;78(3):441-445.
4. Liow MH, Xia Z, Wong MK, Tay KJ, Yeo SJ, Chin PL. Robot-assisted total knee arthroplasty accurately restores the joint line and mechanical axis. A prospective randomized study. J Arthroplasty. 2014;29(12):2373-2377.
5. Sparmann M, Wolke B, Czupalla H, Banzer D, Zink A. Positioning of total knee arthroplasty with and without navigation support. A prospective, randomized study. J Bone Joint Surg Br. 2003;85(6):830-835.
6. Hoffart HE, Langenstein E, Vasak N. A prospective study comparing the functional outcome of computer-assisted and conventional total knee replacement. J Bone Joint Surg Br. 2012;94(2):194-199.
7. Cip J, Widemschek M, Luegmair M, Sheinkop MB, Benesch T, Martin A. Conventional versus computer-assisted technique for total knee arthroplasty: a minimum of 5-year follow-up of 200 patients in a prospective randomized comparative trial. J Arthroplasty. 2014;29(9):1795-1802.
8. Huang TW, Peng KT, Huang KC, Lee MS, Hsu RW. Differences in component and limb alignment between computer-assisted and conventional surgery total knee arthroplasty. Knee Surg Sports Traumatol Arthrosc. 2014;22(12):2954-2961.
9. Lee CY, Lin SJ, Kuo LT, et al. The benefits of computer-assisted total knee arthroplasty on coronal alignment with marked femoral bowing in Asian patients. J Orthop Surg Res. 2014;9:122.
10. Hernandez-Vaquero D, Noriega-Fernandez A, Fernandez-Carreira JM, Fernandez-Simon JM, Llorens de los Rios J. Computer-assisted surgery improves rotational positioning of the femoral component but not the tibial component in total knee arthroplasty. Knee Surg Sports Traumatol Arthrosc. 2014;22(12):3127-3134.
11. Khakha RS, Chowdhry M, Sivaprakasam M, Kheiran A, Chauhan SK. Radiological and functional outcomes in computer assisted total knee arthroplasty between consultants and trainees - a prospective randomized controlled trial [published online ahead of print March 14, 2015]. J Arthroplasty.
12. de Steiger RN, Liu YL, Graves SE. Computer navigation for total knee arthroplasty reduces revision rate for patients less than sixty-five years of age. J Bone Joint Surg Am. 2015;97(8):635-642.
13. Pearle AD, O’Loughlin PF, Kendoff DO. Robot-assisted unicompartmental knee arthroplasty. J Arthroplasty. 2010;25(2):230-237.
14. Citak M, Suero EM, Citak M, et al. Unicompartmental knee arthroplasty: is robotic technology more accurate than conventional technique? Knee. 2013;20(4):268-271.
15. Koulalis D, O’Loughlin PF, Plaskos C, Kendoff D, Cross MB, Pearle AD. Sequential versus automated cutting guides in computer-assisted total knee arthroplasty. Knee. 2011;18(6):436-442.
Total knee arthroplasty (TKA) is a good surgical option to relieve pain and improve function in patients with osteoarthritis. The goal of surgery is to achieve a well-aligned prosthesis with well-balanced ligaments in order to minimize wear and improve implant survival. Overall, 82% to 89% of patients are satisfied with their outcomes after TKA, with good 10- to 15-year implant survivorship; however, there is still a subset of patients that are unsatisfied. In many cases, patient dissatisfaction is attributed to improper component alignment.1-3 Over the past decade, computer navigation and robotics have been introduced to control surgical variables so as to gain greater consistency in implant placement and postoperative component alignment.
Computer-assisted navigation tools were introduced not only to improve implant alignment but, more importantly, to optimize clinical outcomes. Most studies have demonstrated that the use of navigation is associated with fewer radiographic outliers after TKA.4 Various studies have compared radiographic results of navigated TKA with results of TKA using standard instrumentation.4-7 While long-term studies are necessary, short-term follow-up has shown that computer-assisted TKA can improve alignment, especially in patients with severe deformity.8-10 Currently, there is no definitive consensus that computer-assisted TKA leads to significantly better component alignment or postoperative outcomes due to the fact that many studies are limited by study design or small cohorts. However, the currently published articles support better component alignment and clinical outcomes with computer-assisted TKA. While some argue that the use of computer-assisted surgery is dependent on the user’s experience, computer-assisted surgery can assist less-experienced surgeons to reliably achieve good midterm outcomes with a low complication rate.8,11 Various studies have looked at computer-assisted TKA at midterm follow-up, with no significant differences in clinical outcome between navigated and traditional techniques. However, long-term studies showing the benefits of computer navigation are beginning to emerge. For example, de Steiger and colleagues12 recently found that computer-assisted TKA reduced the overall revision rate for loosening after TKA in patients less than 65 years of age.
While surgical navigation helps improve implant planning, robotic tools have emerged as a tool to help refine surgical execution. Coupled with surgical navigation tools, robotic control of surgical gestures may further enhance precision in implant placement and/or enable novel implant design features. At present, robotic techniques are increasingly used in unicompartmental knee arthroplasty (UKA) and TKA.13 Studies have demonstrated that the robotic tool is 3 times more accurate with 3 times less variability than conventional techniques in UKA.14 The utility of robotic tools for TKA remains unclear. Robotic-driven automatic cutting guides have been shown to reduce time and improve accuracy compared with navigation guides in femoral TKA cutting procedures in a cadaveric model.15 However, robotic-enabled TKA procedures are poorly described at present, and the clinical implications of their proposed improved precision remain unclear.
Computer navigation and robotic tools in TKA hold the promise of enhanced control of surgical variables that influence clinical outcome. The variables that may be impacted by these advanced tools include implant positioning, lower limb alignment, soft-tissue balance, and, potentially, implant design and fixation. At present, these tools have primarily been shown to improve lower limb alignment in TKA. The clinical impact of the enhanced control of this single surgical variable (lower limb alignment) has been muted in short-term and midterm studies. Future studies should be directed at understanding which surgical variable, or combination of variables, it is most essential to precisely control so as to positively impact clinical outcomes. ◾
1. Bourne RB, Chesworth BM, Davis AM, Mahomed NN, Charron KD. Patient satisfaction after total knee arthroplasty: who is satisfied and who is not? Clin Orthop Relat Res. 2010;468(1):57-63.
2. Sharkey PF, Hozack WJ, Rothman RH, Shastri S, Jacoby SM. Insall Award paper. Why are total knee arthroplasties failing today? Clin Orthop Relat Res. 2002;(404):7-13.
3. Emmerson KP, Morgan CG, Pinder IM. Survivorship analysis of the Kinematic Stabilizer total knee replacement: a 10- to 14-year follow-up. J Bone Joint Surg Br. 1996;78(3):441-445.
4. Liow MH, Xia Z, Wong MK, Tay KJ, Yeo SJ, Chin PL. Robot-assisted total knee arthroplasty accurately restores the joint line and mechanical axis. A prospective randomized study. J Arthroplasty. 2014;29(12):2373-2377.
5. Sparmann M, Wolke B, Czupalla H, Banzer D, Zink A. Positioning of total knee arthroplasty with and without navigation support. A prospective, randomized study. J Bone Joint Surg Br. 2003;85(6):830-835.
6. Hoffart HE, Langenstein E, Vasak N. A prospective study comparing the functional outcome of computer-assisted and conventional total knee replacement. J Bone Joint Surg Br. 2012;94(2):194-199.
7. Cip J, Widemschek M, Luegmair M, Sheinkop MB, Benesch T, Martin A. Conventional versus computer-assisted technique for total knee arthroplasty: a minimum of 5-year follow-up of 200 patients in a prospective randomized comparative trial. J Arthroplasty. 2014;29(9):1795-1802.
8. Huang TW, Peng KT, Huang KC, Lee MS, Hsu RW. Differences in component and limb alignment between computer-assisted and conventional surgery total knee arthroplasty. Knee Surg Sports Traumatol Arthrosc. 2014;22(12):2954-2961.
9. Lee CY, Lin SJ, Kuo LT, et al. The benefits of computer-assisted total knee arthroplasty on coronal alignment with marked femoral bowing in Asian patients. J Orthop Surg Res. 2014;9:122.
10. Hernandez-Vaquero D, Noriega-Fernandez A, Fernandez-Carreira JM, Fernandez-Simon JM, Llorens de los Rios J. Computer-assisted surgery improves rotational positioning of the femoral component but not the tibial component in total knee arthroplasty. Knee Surg Sports Traumatol Arthrosc. 2014;22(12):3127-3134.
11. Khakha RS, Chowdhry M, Sivaprakasam M, Kheiran A, Chauhan SK. Radiological and functional outcomes in computer assisted total knee arthroplasty between consultants and trainees - a prospective randomized controlled trial [published online ahead of print March 14, 2015]. J Arthroplasty.
12. de Steiger RN, Liu YL, Graves SE. Computer navigation for total knee arthroplasty reduces revision rate for patients less than sixty-five years of age. J Bone Joint Surg Am. 2015;97(8):635-642.
13. Pearle AD, O’Loughlin PF, Kendoff DO. Robot-assisted unicompartmental knee arthroplasty. J Arthroplasty. 2010;25(2):230-237.
14. Citak M, Suero EM, Citak M, et al. Unicompartmental knee arthroplasty: is robotic technology more accurate than conventional technique? Knee. 2013;20(4):268-271.
15. Koulalis D, O’Loughlin PF, Plaskos C, Kendoff D, Cross MB, Pearle AD. Sequential versus automated cutting guides in computer-assisted total knee arthroplasty. Knee. 2011;18(6):436-442.
Obesity implicated in spinal degeneration
SEATTLE – Heavier individuals are more likely to have degenerative changes of the lumbar spine seen on MRI, according to findings from an analysis of 1,684 patients in the European Genodisc Study.
“BMI [body mass index] is associated with disc herniation and spinal stenosis. It is also associated with disc degeneration, but the coefficient is so small it’s unlikely to be clinically relevant,” lead investigator Dr. Anand Segar reported at the World Congress on Osteoarthritis.
“Age appears to be the most import factor in determining spinal degeneration,” he added. “Interestingly, smoking and work intensity were not associated with any outcomes.”

Although degenerative changes were worse and more prevalent at the lower lumbar levels, the associations of BMI with these changes were actually stronger at the upper three levels, according to Dr. Segar, who is a resident in the Nuffield Department of Orthopaedics, Rheumatology, and Musculoskeletal Sciences at the University of Oxford (England). Thus, “we further add to the thought of an upper spine phenotype, which has been described by other authors, and this needs further investigation,” he maintained.
Session comoderator Dr. Jeffrey N. Katz, professor of orthopedic surgery at Harvard Medical School and codirector of the Brigham Spine Center at Brigham and Women’s Hospital, Boston, asked, “Looking at the upper spine, were you able to exclude the possibility of scoliosis as a reason for transferring load to the upper rather than the lower spine? And in evaluating spinal stenosis and thinking about BMI as your primary predictor, did you make any accommodation for how you dealt with epidural fat in relation to spinal stenosis?”
The investigators did not specifically look at scoliosis, but it was uncommon in the study sample and therefore unlikely to have affected the findings, Dr. Segar replied. Similarly, they did not specifically evaluate epidural fat, “but my understanding from the literature is that epidural fat is not really associated with obesity, ... so I don’t think again it would have changed our results.”
The patients in Genodisc were recruited from tertiary spinal clinics in the United Kingdom, Hungary, Italy, and Slovenia.
They underwent MRI of the lumbar spine, and the scans were evaluated by a musculoskeletal radiologist. Disc degeneration was assessed with the 5-point Pfirrmann grading system, while disc herniation and spinal stenosis were simply scored as present or absent.
On average, the patients studied were 51 years old and had a BMI of 27.2 kg/m2, according to data reported at the meeting, which was sponsored by the Osteoarthritis Research Society International.
Results of multivariate analysis showed that each 5-kg/m2 increase in BMI was associated with a 0.04-unit increase in disc degeneration score, a 19% increase in the odds of disc herniation, and a 24% increase in the odds of spinal stenosis.
For comparison, each 10-year increment in age was associated with a 0.31-unit increase in disc degeneration score, a 30% decrease in the odds of disc herniation, and a more than a doubling of the odds of spinal stenosis.
The impact of BMI on the lumbar spine was greater at the upper three levels, reported Dr. Segar, who disclosed no relevant conflicts of interest. In analyses restricted to those levels, each 5-kg/m2 increase in BMI was associated with a 39% increase in the odds of disc herniation and a 65% increase in the odds of spinal stenosis.
SEATTLE – Heavier individuals are more likely to have degenerative changes of the lumbar spine seen on MRI, according to findings from an analysis of 1,684 patients in the European Genodisc Study.
“BMI [body mass index] is associated with disc herniation and spinal stenosis. It is also associated with disc degeneration, but the coefficient is so small it’s unlikely to be clinically relevant,” lead investigator Dr. Anand Segar reported at the World Congress on Osteoarthritis.
“Age appears to be the most import factor in determining spinal degeneration,” he added. “Interestingly, smoking and work intensity were not associated with any outcomes.”
Although degenerative changes were worse and more prevalent at the lower lumbar levels, the associations of BMI with these changes were actually stronger at the upper three levels, according to Dr. Segar, who is a resident in the Nuffield Department of Orthopaedics, Rheumatology, and Musculoskeletal Sciences at the University of Oxford (England). Thus, “we further add to the thought of an upper spine phenotype, which has been described by other authors, and this needs further investigation,” he maintained.
Session comoderator Dr. Jeffrey N. Katz, professor of orthopedic surgery at Harvard Medical School and codirector of the Brigham Spine Center at Brigham and Women’s Hospital, Boston, asked, “Looking at the upper spine, were you able to exclude the possibility of scoliosis as a reason for transferring load to the upper rather than the lower spine? And in evaluating spinal stenosis and thinking about BMI as your primary predictor, did you make any accommodation for how you dealt with epidural fat in relation to spinal stenosis?”
The investigators did not specifically look at scoliosis, but it was uncommon in the study sample and therefore unlikely to have affected the findings, Dr. Segar replied. Similarly, they did not specifically evaluate epidural fat, “but my understanding from the literature is that epidural fat is not really associated with obesity, ... so I don’t think again it would have changed our results.”
The patients in Genodisc were recruited from tertiary spinal clinics in the United Kingdom, Hungary, Italy, and Slovenia.
They underwent MRI of the lumbar spine, and the scans were evaluated by a musculoskeletal radiologist. Disc degeneration was assessed with the 5-point Pfirrmann grading system, while disc herniation and spinal stenosis were simply scored as present or absent.
On average, the patients studied were 51 years old and had a BMI of 27.2 kg/m2, according to data reported at the meeting, which was sponsored by the Osteoarthritis Research Society International.
Results of multivariate analysis showed that each 5-kg/m2 increase in BMI was associated with a 0.04-unit increase in disc degeneration score, a 19% increase in the odds of disc herniation, and a 24% increase in the odds of spinal stenosis.
For comparison, each 10-year increment in age was associated with a 0.31-unit increase in disc degeneration score, a 30% decrease in the odds of disc herniation, and a more than a doubling of the odds of spinal stenosis.
The impact of BMI on the lumbar spine was greater at the upper three levels, reported Dr. Segar, who disclosed no relevant conflicts of interest. In analyses restricted to those levels, each 5-kg/m2 increase in BMI was associated with a 39% increase in the odds of disc herniation and a 65% increase in the odds of spinal stenosis.
AT OARSI 2015
Key clinical point: Heavier individuals are at increased risk for degenerative changes in the lumbar spine.
Major finding: Each 5-kg/m2 increase in BMI was associated with a 0.04-unit increase in disc degeneration score and with 19% and 24% increases in the odds of disc herniation and spinal stenosis, respectively.
Data source: A cohort study of 1,684 patients recruited from European spine clinics.
Disclosures: Dr. Segar disclosed having no relevant conflicts of interest.

Ultrasound sign could help diagnose giant cell arteritis
MANCHESTER, U.K. – An early halo sign on ultrasound is both diagnostic and prognostic according to the findings of a substudy of the ongoing TABUL trial.
In newly diagnosed giant cell arteritis (GCA), halo on ultrasound was seen in 46% of cases, and its presence correlated significantly with both ischemic symptoms and abnormal physical examination of the temporal arteries.
The finding “supports the early use of the halo as a diagnostic and potentially prognostic marker,” Dr. Raashid Luqmani, professor of rheumatology at the University of Oxford, England, said at the British Society for Rheumatology annual conference.

The halo sign is an abnormal shadow seen around the temporal arteries on ultrasound, Dr. Luqmani explained.
“The value of halo size change over time in individual patients is being investigated as a marker of response to treatment,” he added, noting that the size of the halo decreased rapidly with longer duration of early, high-dose steroid treatment.
The main TABUL (Temporal Artery Biopsy Versus Ultrasound for the Diagnosis of Giant Cell Arteritis) trial is looking at the overall diagnostic performance, accuracy, and cost-effectiveness of ultrasound versus biopsy in patients with newly suspected GCA. A total of 430 patients have been recruited and have undergone a single ultrasound scan of the temporal and axillary arteries followed by temporal artery biopsy within 7 days of commencing steroids.
Clinicians are blinded to the results of the ultrasound scan until 2 weeks after a treatment decision has been made and they intend to start rapid steroid withdrawal. Following this, patients are seen at a 6-month follow-up visit.

The aim of the substudy reported by Dr. Luqmani was to describe the features of the early halo sign in response to steroid therapy and whether it correlated to ischemic symptoms.
A cross-sectional analysis was performed on data from 312 patients to look at the extent of arterial involvement, the maximum thickness of the halo, the duration of steroid treatment when the ultrasound was performed, and what ischemic symptoms were present.
The mean age of the 220 women studied was 72.5 years, and that of the 92 men was 71.2 years.
Most patients had one (30.6%), two (22.2%), or three (13.9%) temporal arterial segments involved, with the remaining third having four or more. Bilateral halos were seen in 30% of patients, temporal or axillary artery halos in 13.5%, and isolated axillary halos in 2.6%.
The fact that 13.5% had both temporal and axillary artery involvement and 2.6% had only isolated axillary halos suggests a role for scanning both the axillary and temporal arteries, Dr. Luqmani suggested.
The likelihood of finding a halo diminished with the duration of steroid therapy, he reported. “Patients who received no steroid therapy had a much bigger halo and it got progressively smaller and significantly less by day 4,” he observed.
“Although there are still some patients who still have a halo at days 5 and 6 of steroid treatment, the likelihood of finding that halo is much, much less,” he added.
Looking at the presence of halo in relation to ischemic symptoms, there did appear to be an association but it was only significant (P < .004) for jaw claudication.
“If you have a patient with newly suspected GCA, you are likely to see a significant halo, but you need to be quick, you need to be seeing that halo within 4 days of starting steroids or evaluating patients who have not had any steroid treatment,” Dr. Luqmani said.
The TABUL study is funded by the U.K. Health Technology Assessment, a program of the National Institute for Health Research,and sponsored by the University of Oxford. Dr. Luqmani had received consulting fees from GlaxoSmithKline, Novartis, Roche, and Pfizer.
MANCHESTER, U.K. – An early halo sign on ultrasound is both diagnostic and prognostic according to the findings of a substudy of the ongoing TABUL trial.
In newly diagnosed giant cell arteritis (GCA), halo on ultrasound was seen in 46% of cases, and its presence correlated significantly with both ischemic symptoms and abnormal physical examination of the temporal arteries.
The finding “supports the early use of the halo as a diagnostic and potentially prognostic marker,” Dr. Raashid Luqmani, professor of rheumatology at the University of Oxford, England, said at the British Society for Rheumatology annual conference.
The halo sign is an abnormal shadow seen around the temporal arteries on ultrasound, Dr. Luqmani explained.
“The value of halo size change over time in individual patients is being investigated as a marker of response to treatment,” he added, noting that the size of the halo decreased rapidly with longer duration of early, high-dose steroid treatment.
The main TABUL (Temporal Artery Biopsy Versus Ultrasound for the Diagnosis of Giant Cell Arteritis) trial is looking at the overall diagnostic performance, accuracy, and cost-effectiveness of ultrasound versus biopsy in patients with newly suspected GCA. A total of 430 patients have been recruited and have undergone a single ultrasound scan of the temporal and axillary arteries followed by temporal artery biopsy within 7 days of commencing steroids.
Clinicians are blinded to the results of the ultrasound scan until 2 weeks after a treatment decision has been made and they intend to start rapid steroid withdrawal. Following this, patients are seen at a 6-month follow-up visit.
The aim of the substudy reported by Dr. Luqmani was to describe the features of the early halo sign in response to steroid therapy and whether it correlated to ischemic symptoms.
A cross-sectional analysis was performed on data from 312 patients to look at the extent of arterial involvement, the maximum thickness of the halo, the duration of steroid treatment when the ultrasound was performed, and what ischemic symptoms were present.
The mean age of the 220 women studied was 72.5 years, and that of the 92 men was 71.2 years.
Most patients had one (30.6%), two (22.2%), or three (13.9%) temporal arterial segments involved, with the remaining third having four or more. Bilateral halos were seen in 30% of patients, temporal or axillary artery halos in 13.5%, and isolated axillary halos in 2.6%.
The fact that 13.5% had both temporal and axillary artery involvement and 2.6% had only isolated axillary halos suggests a role for scanning both the axillary and temporal arteries, Dr. Luqmani suggested.
The likelihood of finding a halo diminished with the duration of steroid therapy, he reported. “Patients who received no steroid therapy had a much bigger halo and it got progressively smaller and significantly less by day 4,” he observed.
“Although there are still some patients who still have a halo at days 5 and 6 of steroid treatment, the likelihood of finding that halo is much, much less,” he added.
Looking at the presence of halo in relation to ischemic symptoms, there did appear to be an association but it was only significant (P < .004) for jaw claudication.
“If you have a patient with newly suspected GCA, you are likely to see a significant halo, but you need to be quick, you need to be seeing that halo within 4 days of starting steroids or evaluating patients who have not had any steroid treatment,” Dr. Luqmani said.
The TABUL study is funded by the U.K. Health Technology Assessment, a program of the National Institute for Health Research,and sponsored by the University of Oxford. Dr. Luqmani had received consulting fees from GlaxoSmithKline, Novartis, Roche, and Pfizer.
AT RHEUMATOLOGY 2015
Key clinical point: The halo sign on ultrasound is a diagnostic and potentially prognostic marker, but its use is limited by the effect of early high-dose steroids from about day 4 onward.
Major finding: Halo on ultrasound was seen in 46% of cases; its presence correlated with both ischemic symptoms and abnormal physical examination of the temporal arteries.
Data source: The TABUL trial, involving 312 patients suspected of giant cell arteritis.
Disclosures: TABUL is funded by the U.K. Health Technology Assessment, a program of the National Institute for Health Research, and sponsored by the University of Oxford. Dr. Luqmani had received consulting fees from GlaxoSmithKline, Novartis, Roche, and Pfizer.
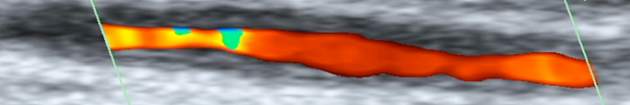
PAS: Swallow test may raise respiratory infection risk in infants
SAN DIEGO– There is no clear clinical benefit to diagnosing and treating infants with abnormal swallowing, according to the results of a video fluoroscopic swallow study (VFSS), and in certain cases, the study could be associated with an increased risk of developing acute respiratory infections (ARI) in these populations.
In a retrospective cohort study, Dr. Eric R. Coon of the University of Utah, Salt Lake City, and his colleagues examined data on all infants aged 12 months or younger who underwent VFSS from 2010 to 2012 at Primary Children’s Hospital in Salt Lake City.
“Providers implicitly believe that infant swallowing abnormalities lead to future respiratory illness,” Dr. Coon said at the annual meeting of the Pediatric Academic Societies. “However, data for that link is limited to descriptive case series, and studies relying on subjective definitions of aspiration that don’t include radiographic confirmation [and] interventions for swallowing abnormalities have not been shown to improve important clinical outcomes.”
The investigators looked at all inpatient, outpatient, and emergency department ARI cases in the Intermountain Healthcare system, a network of 22 hospital centers servicing five states, over the same time period in patients who experienced ARI between their first VFSS and age 3 years. ARI was defined as either bronchiolitis, asthma, pneumonia, or aspiration pneumonia, and was identified via IDC-9 codes.
Out of 576 infants, 199 (34%) exhibited oropharyngeal aspiration, 79 (14%) showed penetration, and 298 (52%)were classified as “normal.” Of the 199 with aspiration, 38 (19%) had thin aspiration and cough, 11 (6%) had thick aspiration and cough, 93 (47%) had thin aspiration and were silent, and 57 (28%) had thick aspiration and were silent.
Those deemed “thick aspiration, silent,” however, averaged 581 days to ARI, the shortest of any cohort, and a mean of 2.39 ARIs per subject. “Thin aspiration, cough” subjects had 638 mean days to ARI and a mean of 1.63 ARIs; “thick aspiration, cough” subjects had a mean of 750 days to ARI and 0.55 mean number of ARIs; and “thin aspiration, silent” had an average of 669 days to ARI and a mean of 1.69 ARIs (P < .05).
Those in the normal, or control, cohort averaged 715 days to ARI and 1.36 ARIs, while those with just penetration averaged 681 days to ARIs and 1.53 ARIs per subject (P < .05).
Cox regression models were used to calculate data time to first ARI, and Poisson regression was used for data on total number of ARIs experienced. Taking into account subject’s age at initial test, presence of complex chronic conditions in each subject, result of VFSS and type of aspiration intervention, silent aspiration with thickened feed yielded a Cox hazard ratio of 1.30 and a Poisson hazard ratio of 1.47, higher than all the others.
“The clinical importance of [VFSS]-detected abnormalities remains unclear, making them high-risk for overdiagnosis,” concluded Dr. Coon, adding that “patients may not experience net benefit, but may in fact be harmed.”
Dr. Coon did not report any relevant financial disclosures.
AT THE PAS ANNUAL MEETING
Key clinical point: Infants with swallowing abnormalities who are tested with video fluoroscopic swallow study are not at any less of a risk to develop an acute respiratory infection, and at least one type of swallowing abnormality poses an increased risk for an ARI.
Major finding: Thirty-four percent of infants demonstrated oropharyngeal aspiration; silent aspiration of thick feeds had the lowest mean days to ARI (581) and highest mean number of ARIs (2.39).
Data source: Retrospective cohort study of 576 infants (age <12 months) during 2010-2012.
Disclosures: Dr. Coon did not report any relevant disclosures.
Recurrent Patellar Tendon Rupture in a Patient After Intramedullary Nailing of the Tibia: Reconstruction Using an Achilles Tendon Allograft
Ruptures of the patellar tendon usually occur in patients under age 40 years, with men having a higher incidence than women.1 History of local steroid injection,2,3 total knee arthroplasty,4-8 anterior cruciate ligament reconstruction with central third patellar tendon autograft,9-11 and a variety of systemic diseases are associated with an increased tendency to rupture.12-15 Primary acute ruptures of the patellar tendon can be difficult to repair because of the quality of remaining tissues. In cases of chronic tendon ruptures subject to delayed treatment, additional complications such as tissue contracture and scar-tissue formation are likely to exist.15-17
Complications after intramedullary (IM) nailing of the tibia include infection, compartment syndrome, deep vein thrombosis, thermal necrosis of the bone with alteration of its endosteal architecture, failure of the hardware, malunion, and nonunion.18 The most common complaint after IM nailing of the tibia is chronic anterior knee pain and symptoms similar to tendonitis; incidences as high as 86% have been reported.18-20 Extensive review of the literature found only 2 reports of patellar tendon rupture after IM nailing of the tibia; both cases used a patellar tendon–splitting approach. The first report described patellar tendon rupture 8 years after IM nailing of the tibia during a forced deep-flexion movement.21 Radiographic examination showed the IM nail positioned proud relative to the tibial plateau, impinging upon the patellar tendon. An intraoperative examination confirmed the radiographic findings and found rupture of the patellar tendon to be consistent with the exposed tip of the IM nail. The second report described patellar tendon rupture 2 months postoperatively in a patient with Ehlers-Danlos syndrome, a hereditary disorder characterized by alterations to muscle/tendon tissue and hyperextensible skin.22
Patellar tendon rupture after IM nailing of the tibia is a rare complication. Patellar tendon re-rupture after primary repair in a patient with history of IM tibial nailing has not been reported. This case outlines the progression of such a patient with a recurrent patellar tendon rupture that was successfully reconstructed using an Achilles tendon allograft. The patient’s surgical history of IM tibial nailing through a mid-patellar tendon–splitting approach 4 years prior to initial tendon rupture is noteworthy and potentially predisposed the patient to injury. The patient provided written informed consent for print and electronic publication of this case report.
Case Report
A 44-year-old woman, 5 ft, 3 in tall, and weighing 129 lb (body mass index, 22.8), with a history of osteoporosis and transverse myelitis, presented with pain and persistent swelling about the left knee. Her baseline ambulatory status required crutches because of decreased sensation and strength in her lower extremity in conjunction with a foot drop; she had mild quadriceps and hamstring muscle weakness but otherwise normal knee function. The patient had been seen 4 years earlier at our facility for IM fixation of a distal tibia fracture through a patellar tendon–splitting approach. The fracture was well healed and showed no signs of complication or nail migration; the nail was not proud.
Initially, the patient was admitted to another hospital through the emergency department for swelling and pain about the left knee. She was believed to have an infection and was placed on antibiotics by the primary care team. An orthopedic evaluation showed induration, edema, and warmth in the patellar tendon region of the left knee. Magnetic resonance imaging (MRI) showed a full-thickness patellar tendon rupture. Aspiration of the knee was performed and cultures were negative; white blood cell, erythrocyte sedimentation rate, and C-reactive protein values were normal. The risks and benefits of various treatments were discussed, and surgical intervention was elected to repair the patellar tendon.
Intraoperative findings showed a massive midsubstance rupture of the patellar tendon, accompanied by medial and lateral retinacular tears and a quadriceps tendon partial rupture; the central aspect of the quadriceps tendon attaching to the patella remained intact. The patella was retracted proximally; no evidence of active infection was present. Good-quality tissue remained attached to both the tibial tuberosity and the inferior pole of the patella. A No. 2 FiberWire suture (Arthrex, Inc, Naples, Florida) was used to run whip stitches in the distal end of the patellar tendon and a second No. 2 FiberWire suture was used to run whip stitches in the proximal aspect of the patellar tendon rupture. The 4 ends of the sutures were tied together, thus re-approximating the distal and proximal ends of the ruptured patellar tendon. No bone drilling was used because the midsubstance tear was amenable to good repair with reasonable expectation of healing based on tissue quality. The quadriceps tendon, which was partially torn, was repaired with a No. 1 Vicryl suture (Ethicon, Somerville, New Jersey). The medial and lateral retinacula were also repaired with a No. 1 Vicryl suture. The suturing scheme effectively re-approximated the knee extensor mechanism, and the patient was placed in a knee immobilizer that permitted no flexion for 6 weeks postoperatively.
After 3 months of gradual improvement with physical therapy, the patient returned for a follow-up visit, concerned that her knee function was beginning to decline. Physical examination showed patella alta with a thinned and diminutive palpable tendon in the patellar tendon region. She was capable of active flexion to 90º and extension to 50º, but beyond 50º, she was unable to actively extend; she was capable of full passive extension. MRI showed a repeat full-thickness patellar tendon tear with retraction from the inferior pole of the patella; previous tears to the quadriceps tendon were healed. Because of the recurrent nature of the injury, the patient’s physical examination, MRI findings, and anticipated poor quality of remaining tendon tissue, patellar tendon reconstruction using a cadaveric Achilles tendon allograft was recommended. The patient chose surgery for potential improvement in knee range of motion, active extension, and ambulation.
The previous anterior midline incision was used and carried down through the subcutaneous tissues where a complete rupture of the patellar tendon was identified. A limited amount of good-quality tendon tissue remained at the medial aspect of the tibial tuberosity. The remaining tissue located at the patella’s inferior pole was nonviable for use in surgical repair. Retinacular contractures were released to bring the patella distally; the trochlear groove was used as the anatomic landmark for the patella resting position. During reconstruction, the knee was placed into 30° of flexion, with the patella located in the trochlear groove, and the cadaveric Achilles tendon was placed on the midline of the patella, where measurements were done to assess proper length and tension (Figure 1).
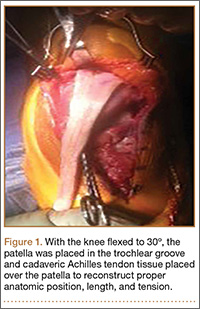
The patient’s remaining native tissue on the medial aspect of the tibial tuberosity was used to augment the Achilles tendon graft medially. The cadaveric Achilles tendon graft was primarily used to replace the central and lateral aspects of the patellar tendon. Additionally, the calcaneal bone segment at the end of the Achilles tendon graft was removed prior to use. Cadaveric and host tissues at the medial aspect of the tibial tuberosity were sutured together with a No. 1 Vicryl suture (Figure 2). The distal aspect of the cadaveric Achilles tendon was used to re-approximate the patient’s native patellar tendon insertion at the tibial tuberosity. To supplement the graft anchor, a Richards metallic ligament staple (Smith & Nephew, Memphis, Tennessee) was used to fix the distal aspect of the Achilles tendon graft into the tibial tuberosity.
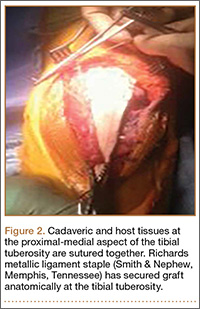
Proper tensioning of the graft was performed by visualizing patella tracking during the arc-of-knee motion and properly suturing the graft to allow for functional range. The proximal aspect of the cadaveric Achilles tendon was sutured into host tissues surrounding the superior pole of the patellar and quadriceps tendon. The edges of the graft were sutured with supplemental No. 1 Vicryl sutures (Figure 3).
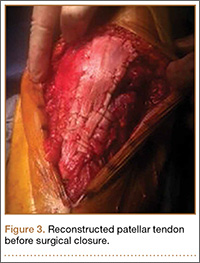
Before surgical closure, knee range of motion was checked and noted to be 0º to 100º. The repaired construct was stable and uncompromised throughout the entire range of motion. Patella tracking was central and significantly improved; knee stability was normal to varus and valgus stress.
The patient was placed in a knee immobilizer for 6 weeks before range of motion was allowed. Seven months postoperatively, the patient returned for a follow-up visit, ambulating with 2 forearm crutches, which was her baseline ambulatory status. Physical examination revealed passive range of motion from 0º to 130º, an extension lag of 10º, and 4/5 quadriceps strength. It was recommended the patient continue physical therapy to improve strength and range of motion.
Conclusion
This is the first report in the literature documenting a recurrent patellar tendon rupture after primary repair in a patient with a history of IM tibial nailing. It is also the first report of a cadaveric Achilles tendon allograft used as a solution to this problem. Complete reconstruction of the patellar tendon using an Achilles tendon allograft is a method commonly used for ruptures after total knee arthroplasty.4-7,23,24 This case report highlights the utility of a cadaveric Achilles tendon in the setting of a recurrent patellar tendon rupture with poor remaining tissue quality.
1. Scott WN, Insall JN. Injuries of the knee. In: Rockwood CA Jr, Green DP, Bucholz RW, eds. Fractures in Adults. 3rd ed. Philadelphia, PA: JB Lippincott; 1991: 1799-1914.
2. Clark SC, Jones MW, Choudhury RR, Smith E. Bilateral patellar tendon rupture secondary to repeated local steroid injections. J Accid Emerg Med. 1995;12(4):300-301.
3. Unverferth LJ, Olix ML. The effect of local steroid injections on tendon. J Sports Med. 1973;1(4):31-37.
4. Cadambi A, Engh GA. Use of a semitendinosus tendon autogenous graft for rupture of the patellar ligament after total knee arthroplasty. A report of seven cases. J Bone Joint Surg Am. 1992;74(7):974-979.
5. Emerson RH Jr, Head WC, Malinin TI. Reconstruction of patellar tendon rupture after total knee arthroplasty with an extensor mechanism allograft. Clin Orthop.1990;(260):154-161.
6. Gustillo RB, Thompson R. Quadriceps and patellar tendon ruptures following total knee arthroplasty. In: Rand JA, Dorr LD, eds. Total Arthroplasty of the Knee: Proceedings of the Knee Society, 1985-1986. Rockville, MD: Aspen; 1987: 41-70.
7. Rand JA, Morrey BF, Bryan RS. Patellar tendon rupture after total knee arthroplasty. Clin Orthop. 1989;(244):233-238.
8. Schoderbek RJ, Brown TE, Mulhall KJ, et al. Extensor mechanism disruption after total knee arthroplasty. Clin Orthop. 2006;446:176-185.
9. Bonamo JJ, Krinik RM, Sporn AA. Rupture of the patellar ligament after use of the central third for anterior cruciate reconstruction. A report of two cases. J Bone Joint Surg Am. 1984;66(8):1294-1297.
10. Marumoto JM, Mitsunaga MM, Richardson AB, Medoff RJ, Mayfield GW. Late patellar tendon ruptures after removal of the central third for anterior cruciate ligament reconstruction. A report of two cases. Am J Sports Med. 1996;24(5):698-701.
11. Mickelsen PL, Morgan SJ, Johnson WA, Ferrari JD. Patellar tendon rupture 3 years after anterior cruciate ligament reconstruction with a central one third bone-patellar tendon-bone graft. Arthroscopy. 2001;17(6):648-652.
12. Morgan J, McCarty DJ. Tendon ruptures in patients with systemic lupus erythematosus treated with corticosteroids. Arthritis Rheum. 1974;17(6):1033-1036.
13. Webb LX, Toby EB. Bilateral rupture of the patellar tendon in an otherwise healthy male patient following minor trauma. J Trauma. 1986;26(11):1045-1048.
14. Greis PE, Holmstrom MC, Lahav A. Surgical treatment options for patella tendon rupture, Part I: Acute. Orthopedics. 2005;28(7):672-679.
15. Greis PE, Lahav A, Holstrom MC. Surgical treatment options for patella tendon rupture, part II: chronic. Orthopedics. 2005;28(8):765-769.
16. Lewis PB, Rue JP, Bach BR Jr. Chronic patellar tendon rupture: surgical reconstruction technique using 2 Achilles tendon allografts. J Knee Surg. 2008;21(12):130-135.
17. McNally PD, Marcelli EA. Achilles tendon allograft of a chronic patellar tendon rupture. Arthroscopy. 1998;14(3):340-344.
18. Katsoulis E, Court-Brown C, Giannoudis PV. Incidence and atieology of anterior knee pain after intramedullary nailing of the femur and tibia. J Bone Joint Surg Br. 2006;88(5):576-580.
19. Brumback RJ, Uwagie-Ero S, Lakatos RP, et al. Intramedullary nailing of femoral shaft fractures. Part II: Fracture-healing with static interlocking fixation. J Bone Joint Surg Am. 1988;70(1):1453-1462.
20. Koval KJ, Clapper MF, Brumback RJ, et al. Complications of reamed intramedullary nailing of the tibia. J Orthop Trauma. 1991;5(2):184-189.
21. Kretzler JE, Curtin SL, Wegner DA, Baumgaertner MR, Galloway MT. Patella tendon rupture: a late complication of a tibial nail. Orthopedics. 1995;18(11):1109-1111.
22. Moroney P, McCarthy T, Borton D. Patellar tendon rupture post reamed intra-medullary tibial nail in a patient with Ehlers-Danlos syndrome. A case report. Eur J Orthop Surg Traumatol. 2004;14(1):50-51.
23. Crossett LS, Sinha RK, Sechriest VF, Rubash HE. Reconstruction of a ruptured patellar tendon with achilles tendon allograft following total knee arthroplasty. J Bone Joint Surg Am. 2002;84(8):1354-1361.
24. Falconiero RP, Pallis MP. Chronic rupture of a patellar tendon: a technique for reconstruction with Achilles allograft. Arthroscopy. 1996;12(5):623-626.
Ruptures of the patellar tendon usually occur in patients under age 40 years, with men having a higher incidence than women.1 History of local steroid injection,2,3 total knee arthroplasty,4-8 anterior cruciate ligament reconstruction with central third patellar tendon autograft,9-11 and a variety of systemic diseases are associated with an increased tendency to rupture.12-15 Primary acute ruptures of the patellar tendon can be difficult to repair because of the quality of remaining tissues. In cases of chronic tendon ruptures subject to delayed treatment, additional complications such as tissue contracture and scar-tissue formation are likely to exist.15-17
Complications after intramedullary (IM) nailing of the tibia include infection, compartment syndrome, deep vein thrombosis, thermal necrosis of the bone with alteration of its endosteal architecture, failure of the hardware, malunion, and nonunion.18 The most common complaint after IM nailing of the tibia is chronic anterior knee pain and symptoms similar to tendonitis; incidences as high as 86% have been reported.18-20 Extensive review of the literature found only 2 reports of patellar tendon rupture after IM nailing of the tibia; both cases used a patellar tendon–splitting approach. The first report described patellar tendon rupture 8 years after IM nailing of the tibia during a forced deep-flexion movement.21 Radiographic examination showed the IM nail positioned proud relative to the tibial plateau, impinging upon the patellar tendon. An intraoperative examination confirmed the radiographic findings and found rupture of the patellar tendon to be consistent with the exposed tip of the IM nail. The second report described patellar tendon rupture 2 months postoperatively in a patient with Ehlers-Danlos syndrome, a hereditary disorder characterized by alterations to muscle/tendon tissue and hyperextensible skin.22
Patellar tendon rupture after IM nailing of the tibia is a rare complication. Patellar tendon re-rupture after primary repair in a patient with history of IM tibial nailing has not been reported. This case outlines the progression of such a patient with a recurrent patellar tendon rupture that was successfully reconstructed using an Achilles tendon allograft. The patient’s surgical history of IM tibial nailing through a mid-patellar tendon–splitting approach 4 years prior to initial tendon rupture is noteworthy and potentially predisposed the patient to injury. The patient provided written informed consent for print and electronic publication of this case report.
Case Report
A 44-year-old woman, 5 ft, 3 in tall, and weighing 129 lb (body mass index, 22.8), with a history of osteoporosis and transverse myelitis, presented with pain and persistent swelling about the left knee. Her baseline ambulatory status required crutches because of decreased sensation and strength in her lower extremity in conjunction with a foot drop; she had mild quadriceps and hamstring muscle weakness but otherwise normal knee function. The patient had been seen 4 years earlier at our facility for IM fixation of a distal tibia fracture through a patellar tendon–splitting approach. The fracture was well healed and showed no signs of complication or nail migration; the nail was not proud.
Initially, the patient was admitted to another hospital through the emergency department for swelling and pain about the left knee. She was believed to have an infection and was placed on antibiotics by the primary care team. An orthopedic evaluation showed induration, edema, and warmth in the patellar tendon region of the left knee. Magnetic resonance imaging (MRI) showed a full-thickness patellar tendon rupture. Aspiration of the knee was performed and cultures were negative; white blood cell, erythrocyte sedimentation rate, and C-reactive protein values were normal. The risks and benefits of various treatments were discussed, and surgical intervention was elected to repair the patellar tendon.
Intraoperative findings showed a massive midsubstance rupture of the patellar tendon, accompanied by medial and lateral retinacular tears and a quadriceps tendon partial rupture; the central aspect of the quadriceps tendon attaching to the patella remained intact. The patella was retracted proximally; no evidence of active infection was present. Good-quality tissue remained attached to both the tibial tuberosity and the inferior pole of the patella. A No. 2 FiberWire suture (Arthrex, Inc, Naples, Florida) was used to run whip stitches in the distal end of the patellar tendon and a second No. 2 FiberWire suture was used to run whip stitches in the proximal aspect of the patellar tendon rupture. The 4 ends of the sutures were tied together, thus re-approximating the distal and proximal ends of the ruptured patellar tendon. No bone drilling was used because the midsubstance tear was amenable to good repair with reasonable expectation of healing based on tissue quality. The quadriceps tendon, which was partially torn, was repaired with a No. 1 Vicryl suture (Ethicon, Somerville, New Jersey). The medial and lateral retinacula were also repaired with a No. 1 Vicryl suture. The suturing scheme effectively re-approximated the knee extensor mechanism, and the patient was placed in a knee immobilizer that permitted no flexion for 6 weeks postoperatively.
After 3 months of gradual improvement with physical therapy, the patient returned for a follow-up visit, concerned that her knee function was beginning to decline. Physical examination showed patella alta with a thinned and diminutive palpable tendon in the patellar tendon region. She was capable of active flexion to 90º and extension to 50º, but beyond 50º, she was unable to actively extend; she was capable of full passive extension. MRI showed a repeat full-thickness patellar tendon tear with retraction from the inferior pole of the patella; previous tears to the quadriceps tendon were healed. Because of the recurrent nature of the injury, the patient’s physical examination, MRI findings, and anticipated poor quality of remaining tendon tissue, patellar tendon reconstruction using a cadaveric Achilles tendon allograft was recommended. The patient chose surgery for potential improvement in knee range of motion, active extension, and ambulation.
The previous anterior midline incision was used and carried down through the subcutaneous tissues where a complete rupture of the patellar tendon was identified. A limited amount of good-quality tendon tissue remained at the medial aspect of the tibial tuberosity. The remaining tissue located at the patella’s inferior pole was nonviable for use in surgical repair. Retinacular contractures were released to bring the patella distally; the trochlear groove was used as the anatomic landmark for the patella resting position. During reconstruction, the knee was placed into 30° of flexion, with the patella located in the trochlear groove, and the cadaveric Achilles tendon was placed on the midline of the patella, where measurements were done to assess proper length and tension (Figure 1).
The patient’s remaining native tissue on the medial aspect of the tibial tuberosity was used to augment the Achilles tendon graft medially. The cadaveric Achilles tendon graft was primarily used to replace the central and lateral aspects of the patellar tendon. Additionally, the calcaneal bone segment at the end of the Achilles tendon graft was removed prior to use. Cadaveric and host tissues at the medial aspect of the tibial tuberosity were sutured together with a No. 1 Vicryl suture (Figure 2). The distal aspect of the cadaveric Achilles tendon was used to re-approximate the patient’s native patellar tendon insertion at the tibial tuberosity. To supplement the graft anchor, a Richards metallic ligament staple (Smith & Nephew, Memphis, Tennessee) was used to fix the distal aspect of the Achilles tendon graft into the tibial tuberosity.
Proper tensioning of the graft was performed by visualizing patella tracking during the arc-of-knee motion and properly suturing the graft to allow for functional range. The proximal aspect of the cadaveric Achilles tendon was sutured into host tissues surrounding the superior pole of the patellar and quadriceps tendon. The edges of the graft were sutured with supplemental No. 1 Vicryl sutures (Figure 3).
Before surgical closure, knee range of motion was checked and noted to be 0º to 100º. The repaired construct was stable and uncompromised throughout the entire range of motion. Patella tracking was central and significantly improved; knee stability was normal to varus and valgus stress.
The patient was placed in a knee immobilizer for 6 weeks before range of motion was allowed. Seven months postoperatively, the patient returned for a follow-up visit, ambulating with 2 forearm crutches, which was her baseline ambulatory status. Physical examination revealed passive range of motion from 0º to 130º, an extension lag of 10º, and 4/5 quadriceps strength. It was recommended the patient continue physical therapy to improve strength and range of motion.
Conclusion
This is the first report in the literature documenting a recurrent patellar tendon rupture after primary repair in a patient with a history of IM tibial nailing. It is also the first report of a cadaveric Achilles tendon allograft used as a solution to this problem. Complete reconstruction of the patellar tendon using an Achilles tendon allograft is a method commonly used for ruptures after total knee arthroplasty.4-7,23,24 This case report highlights the utility of a cadaveric Achilles tendon in the setting of a recurrent patellar tendon rupture with poor remaining tissue quality.
1. Scott WN, Insall JN. Injuries of the knee. In: Rockwood CA Jr, Green DP, Bucholz RW, eds. Fractures in Adults. 3rd ed. Philadelphia, PA: JB Lippincott; 1991: 1799-1914.
2. Clark SC, Jones MW, Choudhury RR, Smith E. Bilateral patellar tendon rupture secondary to repeated local steroid injections. J Accid Emerg Med. 1995;12(4):300-301.
3. Unverferth LJ, Olix ML. The effect of local steroid injections on tendon. J Sports Med. 1973;1(4):31-37.
4. Cadambi A, Engh GA. Use of a semitendinosus tendon autogenous graft for rupture of the patellar ligament after total knee arthroplasty. A report of seven cases. J Bone Joint Surg Am. 1992;74(7):974-979.
5. Emerson RH Jr, Head WC, Malinin TI. Reconstruction of patellar tendon rupture after total knee arthroplasty with an extensor mechanism allograft. Clin Orthop.1990;(260):154-161.
6. Gustillo RB, Thompson R. Quadriceps and patellar tendon ruptures following total knee arthroplasty. In: Rand JA, Dorr LD, eds. Total Arthroplasty of the Knee: Proceedings of the Knee Society, 1985-1986. Rockville, MD: Aspen; 1987: 41-70.
7. Rand JA, Morrey BF, Bryan RS. Patellar tendon rupture after total knee arthroplasty. Clin Orthop. 1989;(244):233-238.
8. Schoderbek RJ, Brown TE, Mulhall KJ, et al. Extensor mechanism disruption after total knee arthroplasty. Clin Orthop. 2006;446:176-185.
9. Bonamo JJ, Krinik RM, Sporn AA. Rupture of the patellar ligament after use of the central third for anterior cruciate reconstruction. A report of two cases. J Bone Joint Surg Am. 1984;66(8):1294-1297.
10. Marumoto JM, Mitsunaga MM, Richardson AB, Medoff RJ, Mayfield GW. Late patellar tendon ruptures after removal of the central third for anterior cruciate ligament reconstruction. A report of two cases. Am J Sports Med. 1996;24(5):698-701.
11. Mickelsen PL, Morgan SJ, Johnson WA, Ferrari JD. Patellar tendon rupture 3 years after anterior cruciate ligament reconstruction with a central one third bone-patellar tendon-bone graft. Arthroscopy. 2001;17(6):648-652.
12. Morgan J, McCarty DJ. Tendon ruptures in patients with systemic lupus erythematosus treated with corticosteroids. Arthritis Rheum. 1974;17(6):1033-1036.
13. Webb LX, Toby EB. Bilateral rupture of the patellar tendon in an otherwise healthy male patient following minor trauma. J Trauma. 1986;26(11):1045-1048.
14. Greis PE, Holmstrom MC, Lahav A. Surgical treatment options for patella tendon rupture, Part I: Acute. Orthopedics. 2005;28(7):672-679.
15. Greis PE, Lahav A, Holstrom MC. Surgical treatment options for patella tendon rupture, part II: chronic. Orthopedics. 2005;28(8):765-769.
16. Lewis PB, Rue JP, Bach BR Jr. Chronic patellar tendon rupture: surgical reconstruction technique using 2 Achilles tendon allografts. J Knee Surg. 2008;21(12):130-135.
17. McNally PD, Marcelli EA. Achilles tendon allograft of a chronic patellar tendon rupture. Arthroscopy. 1998;14(3):340-344.
18. Katsoulis E, Court-Brown C, Giannoudis PV. Incidence and atieology of anterior knee pain after intramedullary nailing of the femur and tibia. J Bone Joint Surg Br. 2006;88(5):576-580.
19. Brumback RJ, Uwagie-Ero S, Lakatos RP, et al. Intramedullary nailing of femoral shaft fractures. Part II: Fracture-healing with static interlocking fixation. J Bone Joint Surg Am. 1988;70(1):1453-1462.
20. Koval KJ, Clapper MF, Brumback RJ, et al. Complications of reamed intramedullary nailing of the tibia. J Orthop Trauma. 1991;5(2):184-189.
21. Kretzler JE, Curtin SL, Wegner DA, Baumgaertner MR, Galloway MT. Patella tendon rupture: a late complication of a tibial nail. Orthopedics. 1995;18(11):1109-1111.
22. Moroney P, McCarthy T, Borton D. Patellar tendon rupture post reamed intra-medullary tibial nail in a patient with Ehlers-Danlos syndrome. A case report. Eur J Orthop Surg Traumatol. 2004;14(1):50-51.
23. Crossett LS, Sinha RK, Sechriest VF, Rubash HE. Reconstruction of a ruptured patellar tendon with achilles tendon allograft following total knee arthroplasty. J Bone Joint Surg Am. 2002;84(8):1354-1361.
24. Falconiero RP, Pallis MP. Chronic rupture of a patellar tendon: a technique for reconstruction with Achilles allograft. Arthroscopy. 1996;12(5):623-626.
Emergency Imaging
Case
A 41-year-old woman presented to the ED with a 3-day history of posterior neck pain that radiated to the occipital region. The patient stated that the day prior to presentation, the pain had worsened to what she rated as a “9” on a pain scale of 0 to 10. The patient’s surgical history included a remote prior cervical fusion at C5-C6. A lateral radiograph of the cervical spine is shown above (Figure 1a).
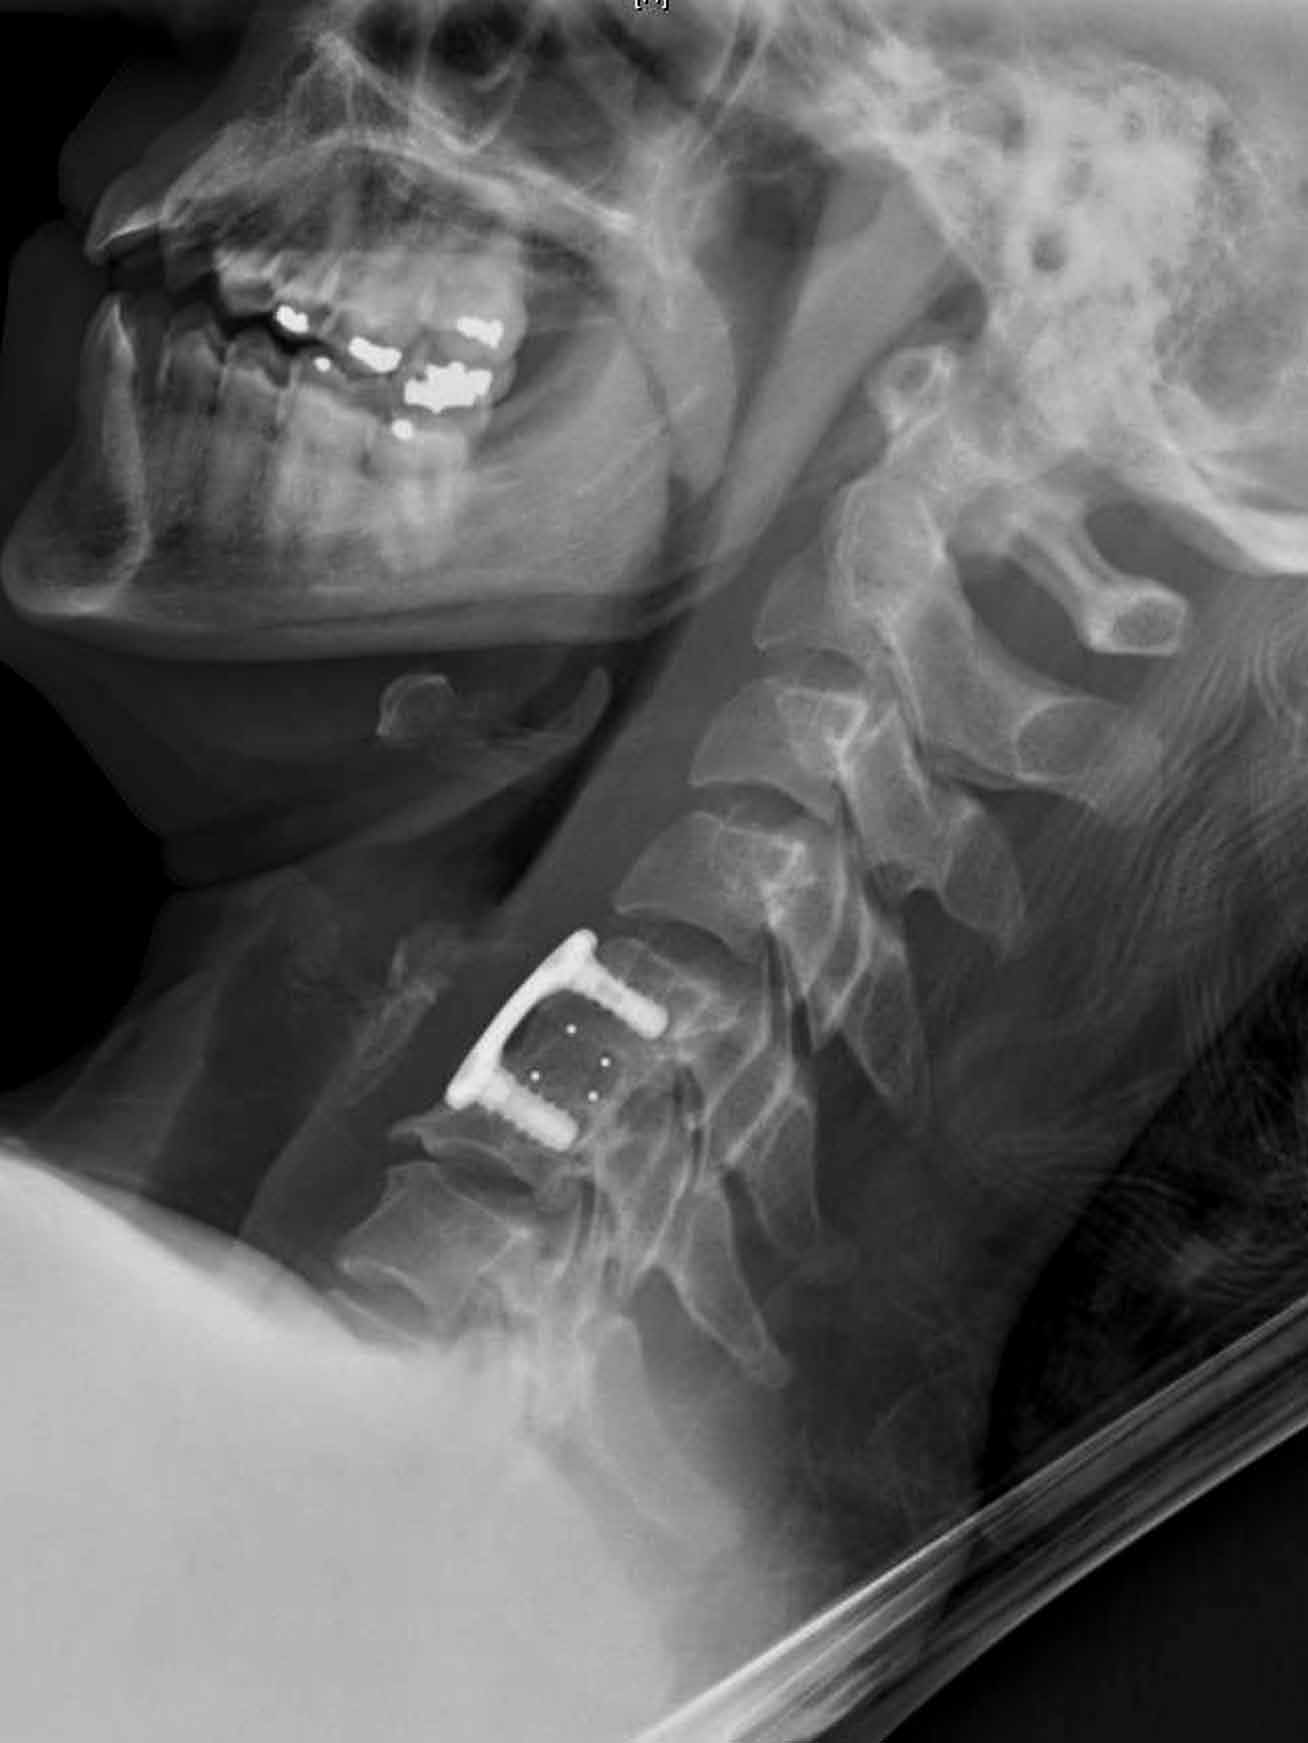
What is the diagnosis? Is additional imaging necessary? If so, why?
Answer
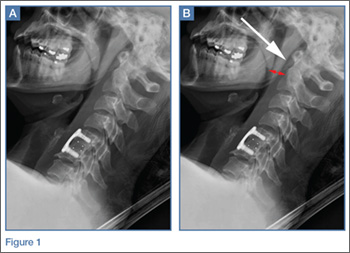
The lateral view of the cervical spine demonstrated soft tissue swelling in the upper prevertebral region (red arrowheads, Figure 1b). (The soft tissues at this level in an adult normally measure less than 3 mm between the airway and the vertebral body.) The radiograph also showed an area of calcification within the prevertebral soft tissues (white arrow, Figure 1b).
The patient denied fevers, chills, dysphagia, visual changes, and nasal congestion. Physical examination demonstrated tenderness to palpation of the posterior neck, but there was no evidence of palpable mass or lymphadenopathy. Neck extension and lateral movement to the left were severely limited due to pain; neck flexion and lateral movement range of motion to the right were mildly decreased due to pain. The physical examination was otherwise normal.
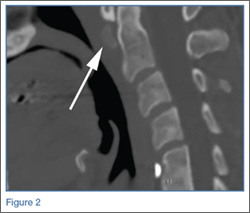
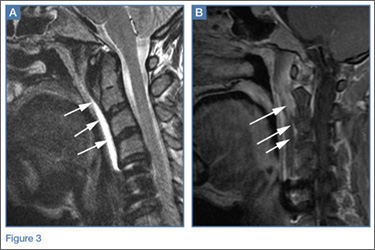
Longus colli (prevertebral) calcific tendinitis is a self-limiting condition that typically lasts 1 to 3 weeks, though it can be very painful during the acute phase.1,2 Treatment is typically conservative, and the patient in this case received a course of oral corticosteroids and nonsteroidal anti-inflammatory drugs to help alleviate the associated inflammation.
Dr Bartolotta is an assistant professor of radiology at Weill Cornell Medical College in New York City and assistant attending radiologist at New York-Presbyterian Hospital/Weill Cornell Medical Center. Dr Baradaran is a resident in the department of radiology at Weill Cornell Medical College in New York City. Dr Hentel is an associate professor of clinical radiology at Weill Cornell Medical College, New York. He is also chief of emergency/musculoskeletal imaging and executive vice-chairman for the department of radiology at New York-Presbyterian Hospital/Weill Cornell Medical Center; and associate editor, imaging, of the EMERGENCY MEDICINE editorial board.
- Coulier B, Macsim M, Desgain O. Retropharyngeal calcific tendinitis--longus colli tendinitis--an unusual cause of acute dysphagia. Emerg Radiol. 2011;18(5):449-451.
- Silva CF, Soffia PS, Pruzzo E. Acute prevertebral calcific tendinitis: a source of non-surgical acute cervical pain. Acta Radiologica. 2014;55(1):91-94.
- Zibis AH, Giannis D, Malizos KN, Kitsioulis P, Arvanitis DL. Acute calcific tendinitis of the longus colli muscle: case report and review of the literature. Eur Spine J. 2013;22(Suppl 3):S434-S438.
Case
A 41-year-old woman presented to the ED with a 3-day history of posterior neck pain that radiated to the occipital region. The patient stated that the day prior to presentation, the pain had worsened to what she rated as a “9” on a pain scale of 0 to 10. The patient’s surgical history included a remote prior cervical fusion at C5-C6. A lateral radiograph of the cervical spine is shown above (Figure 1a).
What is the diagnosis? Is additional imaging necessary? If so, why?
Answer
The lateral view of the cervical spine demonstrated soft tissue swelling in the upper prevertebral region (red arrowheads, Figure 1b). (The soft tissues at this level in an adult normally measure less than 3 mm between the airway and the vertebral body.) The radiograph also showed an area of calcification within the prevertebral soft tissues (white arrow, Figure 1b).
The patient denied fevers, chills, dysphagia, visual changes, and nasal congestion. Physical examination demonstrated tenderness to palpation of the posterior neck, but there was no evidence of palpable mass or lymphadenopathy. Neck extension and lateral movement to the left were severely limited due to pain; neck flexion and lateral movement range of motion to the right were mildly decreased due to pain. The physical examination was otherwise normal.
Longus colli (prevertebral) calcific tendinitis is a self-limiting condition that typically lasts 1 to 3 weeks, though it can be very painful during the acute phase.1,2 Treatment is typically conservative, and the patient in this case received a course of oral corticosteroids and nonsteroidal anti-inflammatory drugs to help alleviate the associated inflammation.
Dr Bartolotta is an assistant professor of radiology at Weill Cornell Medical College in New York City and assistant attending radiologist at New York-Presbyterian Hospital/Weill Cornell Medical Center. Dr Baradaran is a resident in the department of radiology at Weill Cornell Medical College in New York City. Dr Hentel is an associate professor of clinical radiology at Weill Cornell Medical College, New York. He is also chief of emergency/musculoskeletal imaging and executive vice-chairman for the department of radiology at New York-Presbyterian Hospital/Weill Cornell Medical Center; and associate editor, imaging, of the EMERGENCY MEDICINE editorial board.
- Coulier B, Macsim M, Desgain O. Retropharyngeal calcific tendinitis--longus colli tendinitis--an unusual cause of acute dysphagia. Emerg Radiol. 2011;18(5):449-451.
- Silva CF, Soffia PS, Pruzzo E. Acute prevertebral calcific tendinitis: a source of non-surgical acute cervical pain. Acta Radiologica. 2014;55(1):91-94.
- Zibis AH, Giannis D, Malizos KN, Kitsioulis P, Arvanitis DL. Acute calcific tendinitis of the longus colli muscle: case report and review of the literature. Eur Spine J. 2013;22(Suppl 3):S434-S438.
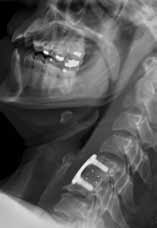
Percutaneous Fixation of Hypertrophic Nonunion of the Inferior Pubic Ramus: A Report of Two Cases and Surgical Technique
Fractures of the superior and inferior pelvic rami are common in pelvic ring injuries.1 These fractures are routinely treated successfully without surgery.2 When the pelvic ring is injured, and ramus fracture or fractures represent a point of instability, surgical fixation can be performed to impart stability and reduce discomfort.3 Patients with pubic ramus fracture(s) have overall greater long-term morbidity and mortality.4 Operative stabilization of the superior pubic ramus can be achieved with open reduction and internal fixation, external fixation, and percutaneous medullary screw fixation.5-8 Inferior ramus fractures are seldom treated directly and acutely with operative reduction and fixation, as the mechanical advantage inferior ramus fixation provides is unknown.
Persistent nonunion of the pelvic ring can cause pain and disability and make reconstruction increasingly difficult.9 Open and percutaneous fixation techniques have been used to address symptomatic nonunions of the superior pubic ramus.9,10 There is limited evidence supporting surgical fixation of the inferior ramus. Open surgical fixation for symptomatic nonunions of the inferior ramus has been described.11,12 The inferior ramus has an osseous fixation pathway (OFP) amenable to percutaneous screw placement.13 Placement of a percutaneous screw in the inferior ramus requires use of preoperative computed tomography (CT) and is technically demanding. Surgeons must understand use of intraoperative fluoroscopy to ensure that the screw is contained within bone and crosses the intended zone of nonunion.
In this article, we report 2 cases of adults with symptomatic hypertrophic nonunions of the inferior ramus, treated with percutaneous screw fixation. Both patients presented with focal groin pain and activity limitations. Each had concurrent ipsilateral hypertrophic nonunions of the superior ramus, treated with percutaneous antegrade intramedullary stabilization. The patients provided written informed consent for print and electronic publication of these case reports.
Case Reports
Case 1
A 45-year-old woman fell from a horse about 8 months before presenting to the orthopedic outpatient clinic. Pelvic radiographs obtained after the fall were negative for fracture, but subsequent pelvic magnetic resonance imaging led to the diagnoses of minimally displaced left superior and inferior pubic ramus fractures and associated right-sided sacral ala fracture. The patient was treated with protected weight-bearing according to symptoms, but increasing activity-related pain and discomfort in the left groin persisted for months after injury. These symptoms were treated with analgesic medication, physical therapy, and chiropractic manipulation. Repeat imaging showed hypertrophic nonunions of the left superior and inferior pubic rami (Figure 1). Findings of the serologic testing performed for infection and metabolic deficiencies were normal at that time. The patient was referred for surgical consultation.
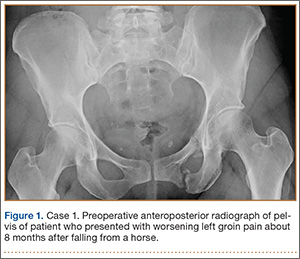
On evaluation, she reported constant pain in the left groin with ambulation. Specifically, squatting, pushing and pulling activities were extremely uncomfortable. She had been unable to return to work either full-time or part-time. On physical examination, she walked with an antalgic gait with a decreased stance phase of the left lower extremity. She had tenderness to palpation medial to the hip joint without evidence of hernia or lymphadenopathy. The pelvis was stable to manual compression testing.
Pelvic CT showed the nonunion site and the osteology of the inferior and superior pubic ramus of the pelvis, as well as minimal displacement and good alignment of the rami.
The patient was placed supine on a flat radiolucent table (Mizuho OSI, Union City, California). Preoperative cephalosporin antibiotics were administered. After induction of general anesthesia, the lumbosacral spine was elevated under 2 folded blankets. Arms were abducted to allow for pelvic imaging, and all bony prominences were padded. A urinary catheter was inserted aseptically to decompress the bladder. The entire abdomen and bilateral flanks were shaved, prepared, and draped in usual sterile fashion. A partially threaded cannulated screw was placed using a percutaneous antegrade technique to address the hypertrophic superior ramus nonunion.
A C-arm fluoroscopy unit (Ziehm, Orlando, Florida) was positioned on the injured side. The surgeon stood on the contralateral side. A pelvic OOOCI (outlet obturator oblique combinative image) of the symphysis pubis was obtained. This view defined the medial and lateral extents of the inferior ramus. A 0.062-in smooth Kirschner wire was used to percutaneously locate an ideal starting point on the cranial aspect of the contralateral superior pubic ramus. The starting point was adjusted on this view until an ideal intended trajectory into the contralateral (affected) inferior pubic ramus was visualized (Figure 2A).
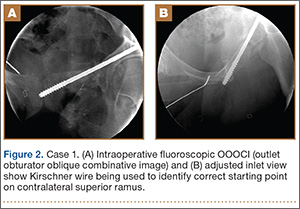
The C-arm beam was then oriented to an “excessive” pelvic inlet view tangential to the posterior cortical surface of the affected inferior pubic ramus (Figure 2B). The tip of the wire was then adjusted to position and aim it slightly anterior to the posterior cortical surface of the affected inferior ramus. The wire was advanced into the bone about 1 cm, and the location and direction of the wire were reconfirmed as accurate.
A vertical skin incision was then made around the wire, and the 4.5-mm cannulated drill was placed over the wire. A soft-tissue protective drill sleeve and oscillating technique were used to protect the soft-tissue anatomy. The trajectory of the drill was again confirmed on pelvic OOOCI and advanced into the bone. The intended path of the drill was from the cranial-medial symphyseal cortex of the contralateral superior ramus, through the symphysis pubis obliquely, and then into the medullary canal of the affected inferior ramus. Frequent biplanar fluoroscopic imaging followed this progression of the drill to the nonunion site. The cannulated drill was then removed and exchanged for a calibrated extra-long 2.5-mm drill bit, placed through the soft-tissue drill sleeve and into the glide hole created by the 4.5-mm cannulated drill. The C-arm unit ensured accurate positioning of the 2.5-mm drill on both pelvic OOOCI and “excessive” inlet view before advancement (Figures 3A, 3B). The 2.5-mm drill was advanced caudally, laterally, and anteriorly in the ramus, past the nonunion site, and then was stopped before it exited the cortex of the ischial tuberosity (Figures 4A, 4B).
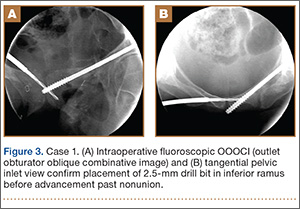
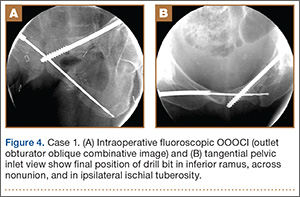
The depth of the drill bit was assessed with a known-length protective drill sleeve and calibrated drill. Alternatively, depth can be assessed with another same-length calibrated drill bit positioned adjacent to the inserted drill bit. A fully threaded, blunt-tipped 4.5-mm cortical screw was then placed through the glide hole. Both fluoroscopic views were used to confirm that the screw followed the same trajectory as the drill. Finally, the screw was again checked on biplanar fluoroscopy to confirm it had remained in the OFP of the inferior ramus (Figures 5A, 5B).
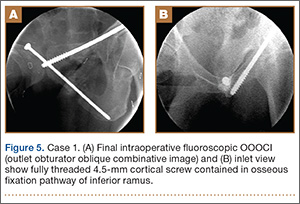
Postoperative pelvic CT confirmed position and length of the screws. The patient was allowed weight-of-limb weight-bearing on her affected side after surgery. She was discharged the first day after surgery and allowed use of oral analgesics. Six weeks after surgery, pelvic radiographs showed partial healing, and she reported symptom relief. Resistive strengthening exercises were instituted, and progressive weight-bearing proceeded to full weight-bearing over the next 6 weeks. The patient reported almost complete relief of pain by 3 months, and she was able to return to work and daily activities without medication. Radiographs showed consolidation of the fractures. She was essentially symptom-free 17 months after surgery (Figure 6).
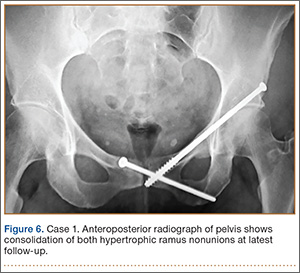
Case 2
An obese 51-year-old woman presented to the orthopedic clinic with a 6-month history of left groin pain that worsened with ambulation. She did not recall a specific injury but acknowledged a history of previous falls. Past medical history was significant for ulcerative colitis/irritable bowel syndrome and degenerative disease in the lumbar spine and right ankle. Previous pelvic radiographs showed no evidence of fracture or abnormality, but radiographs obtained before evaluation in the clinic showed hypertrophic nonunion of the left superior and inferior pubic ramus.
The patient had pain deep in the left groin with weight-bearing. On physical examination, she denied pain with log roll of the left hip or resisted straight leg raise. The pelvis was stable to manual compression. There was no sign of hernia or lymphadenopathy in the region of the left groin.
The patient had obtained a technetium-99 nuclear medicine scan of the pelvis in addition to standard preoperative CT of the nonunion area. The nuclear medicine scan showed uptake in the area of the superior and inferior ramus, and CT confirmed presence of a superior and inferior ramus that would accommodate a medullary screw.
The patient was taken to the operating room, where percutaneous fixation of the left superior and inferior ramus was performed (as described above). The patient was discharged on postoperative day 2 and followed the same weight-bearing protocol that the first patient used.
At 6 weeks, the patient returned to clinic with improved comfort. At 3 months, she denied left groin pain and was limited in activity only by preexisting arthrosis in the left ankle and lumbar spine. She was using a walker only for long distances and was symptom-free 13 months after surgery.
Discussion
Acute surgical fixation of the inferior ramus is seldom performed. The anatomical location of the inferior ramus and the lack of defined criteria for fixation often leave the inferior ramus ignored, unreduced, and without stabilization. In the setting of symptomatic nonunion, open stabilization has been used.11,12 Plate fixation after open débridement of an inferior ramus nonunion requires more extensive dissection and may increase the risk for perioperative infection and hardware prominence compared with an intramedullary implant.14 If plate prominence becomes symptomatic, the plate must be removed in a second surgical procedure. Percutaneous medullary screw fixation avoids the risks of surgical soft-tissue dissection and placement of a surface implant on the bone and reduces the need for a second surgical procedure to remove bothersome hardware. Percutaneous pelvic fixation has been well described and shown to provide stability to the pelvis. It can also be used to treat hypertrophic nonunions of the pelvis when mechanical stability is required for healing.13
In the cases reported here, inferior ramus stabilization was combined with intramedullary fixation of the superior ramus. As each patient had deep groin pain that could not be localized to either ramus, both rami were stabilized after close assessment on preoperative CT. Solitary fixation of the superior ramus may or may not provide stability sufficient for inferior ramus union and should be performed when the OFP of the inferior ramus is unavailable.
The anatomy of the inferior ramus must be carefully reviewed before surgery, as it is seldom encountered in open and percutaneous orthopedic pelvic surgery. The inferior ramus extends from the symphysis pubis to the ischial tuberosity. The ramus is wider medially and thinner laterally near the obturator foramen. The anterior surface of the ramus is flat and concave, whereas the posterior surface is flat and convex. The anatomy of the inferior ramus varies somewhat, and any distortion (eg, fracture, nonunion) of the OFP can render it incapable of accommodating screw fixation.13
Percutaneous placement of a medullary screw in the inferior ramus requires an understanding of the fluoroscopy required. Challenges, including body habitus and unique osseous anatomy, must be recognized. Soft tissues must be protected with a drill sleeve during preparation of the screw pathway, and care must be taken to avoid placing the screw beyond the cortex of the ischial tuberosity. A prominent screw tip can irritate the patient in the hamstrings or while sitting.
Intramedullary screw fixation of the inferior ramus is a technically demanding surgical procedure. Meticulous evaluation of preoperative radiographic studies must accompany strict attention to surgical detail. A misplaced or malpositioned drill bit or screw can injure surrounding neurovascular structures. A screw that does not cross the fracture or is not in the OFP of the inferior ramus will be ineffective and
potentially dangerous.
Conclusion
We have presented a technique for percutaneous screw placement in the inferior ramus. This technique requires an understanding of the anatomy of the inferior ramus and of the intraoperative fluoroscopy required for screw placement. We have used this technique to successfully treat symptomatic hypertrophic nonunions of the inferior ramus that require skeletal stability for healing.
1. Hill RM, Robinson CM, Keating JF. Fractures of the pubic rami. Epidemiology and five-year survival. J Bone Joint Surg Br. 2001;83(8):1141-1144.
2. Matta JM, Dickson KF, Markovich GD. Surgical treatment of pelvic nonunions and malunions. Clin Orthop. 1996;(329):199-206.
3. Barei DP, Shafer BL, Beingessner DM, Gardner MJ, Nork SE, Routt ML. The impact of open reduction internal fixation on acute pain management in unstable pelvic ring injuries. J Trauma. 2010;68(4):949-953.
4. van Dijk WA, Poeze M, van Helden SH, Brink PR, Verbruggen JP. Ten-year mortality among hospitalised patients with fractures of the pubic rami. Injury. 2010;41(4):411-414.
5. Simonian PT, Routt ML Jr, Harrington RM, Tencer AF. Internal fixation of the unstable anterior pelvic ring: a biomechanical comparison of standard plating techniques and the retrograde medullary superior pubic ramus screw. J Orthop Trauma. 1994;8(6):476-482.
6. Routt ML Jr, Simonian PT, Grujic L. The retrograde medullary superior pubic ramus screw for the treatment of anterior pelvic ring disruptions: a new technique. J Orthop Trauma. 1995;9(1):35-44.
7. Matta JM. Indications for anterior fixation of pelvic fractures. Clin Orthop. 1996;(329):88-96.
8. Routt ML Jr, Nork SE, Mills WJ. Percutaneous fixation of pelvic ring disruptions. Clin Orthop. 2000;(375):15-29.
9. Gautier E, Rommens PM, Matta JM. Late reconstruction after pelvic ring injuries. Injury. 1996;27(suppl 2):B39-B46.
10. Altman GT, Altman DT, Routt ML Jr. Symptomatic hypertrophic pubic ramus nonunion treated with a retrograde medullary screw. J Orthop Trauma. 2000;14(8):582-585.
11. Archdeacon MT, Kuhlman G, Kazemi N. Fellow’s Corner: grand rounds from the University of Cincinnati Medical Center—painful superior and inferior pubic rami nonunion. J Orthop Trauma. 2010;24(11):e109-e112.
12. Schofer M, Illian C, Fuchs-Winkelmann S, Kortmann HR. Pseudoarthrosis of anterior pelvic ring fracture [in German]. Unfallchirurg. 2008;111(4):264, 266-267.
13. Bishop JA, Routt ML Jr. Osseous fixation pathways in pelvic and acetabular fracture surgery: osteology, radiology, and clinical applications. J Trauma Acute Care Surg. 2012;72(6):1502-1509.
14. Schmidt AH, Swiontkowski MF. Pathophysiology of infections after internal fixation of fractures. J Am Acad Orthop Surg. 2000;8(5):285-291.
Fractures of the superior and inferior pelvic rami are common in pelvic ring injuries.1 These fractures are routinely treated successfully without surgery.2 When the pelvic ring is injured, and ramus fracture or fractures represent a point of instability, surgical fixation can be performed to impart stability and reduce discomfort.3 Patients with pubic ramus fracture(s) have overall greater long-term morbidity and mortality.4 Operative stabilization of the superior pubic ramus can be achieved with open reduction and internal fixation, external fixation, and percutaneous medullary screw fixation.5-8 Inferior ramus fractures are seldom treated directly and acutely with operative reduction and fixation, as the mechanical advantage inferior ramus fixation provides is unknown.
Persistent nonunion of the pelvic ring can cause pain and disability and make reconstruction increasingly difficult.9 Open and percutaneous fixation techniques have been used to address symptomatic nonunions of the superior pubic ramus.9,10 There is limited evidence supporting surgical fixation of the inferior ramus. Open surgical fixation for symptomatic nonunions of the inferior ramus has been described.11,12 The inferior ramus has an osseous fixation pathway (OFP) amenable to percutaneous screw placement.13 Placement of a percutaneous screw in the inferior ramus requires use of preoperative computed tomography (CT) and is technically demanding. Surgeons must understand use of intraoperative fluoroscopy to ensure that the screw is contained within bone and crosses the intended zone of nonunion.
In this article, we report 2 cases of adults with symptomatic hypertrophic nonunions of the inferior ramus, treated with percutaneous screw fixation. Both patients presented with focal groin pain and activity limitations. Each had concurrent ipsilateral hypertrophic nonunions of the superior ramus, treated with percutaneous antegrade intramedullary stabilization. The patients provided written informed consent for print and electronic publication of these case reports.
Case Reports
Case 1
A 45-year-old woman fell from a horse about 8 months before presenting to the orthopedic outpatient clinic. Pelvic radiographs obtained after the fall were negative for fracture, but subsequent pelvic magnetic resonance imaging led to the diagnoses of minimally displaced left superior and inferior pubic ramus fractures and associated right-sided sacral ala fracture. The patient was treated with protected weight-bearing according to symptoms, but increasing activity-related pain and discomfort in the left groin persisted for months after injury. These symptoms were treated with analgesic medication, physical therapy, and chiropractic manipulation. Repeat imaging showed hypertrophic nonunions of the left superior and inferior pubic rami (Figure 1). Findings of the serologic testing performed for infection and metabolic deficiencies were normal at that time. The patient was referred for surgical consultation.
On evaluation, she reported constant pain in the left groin with ambulation. Specifically, squatting, pushing and pulling activities were extremely uncomfortable. She had been unable to return to work either full-time or part-time. On physical examination, she walked with an antalgic gait with a decreased stance phase of the left lower extremity. She had tenderness to palpation medial to the hip joint without evidence of hernia or lymphadenopathy. The pelvis was stable to manual compression testing.
Pelvic CT showed the nonunion site and the osteology of the inferior and superior pubic ramus of the pelvis, as well as minimal displacement and good alignment of the rami.
The patient was placed supine on a flat radiolucent table (Mizuho OSI, Union City, California). Preoperative cephalosporin antibiotics were administered. After induction of general anesthesia, the lumbosacral spine was elevated under 2 folded blankets. Arms were abducted to allow for pelvic imaging, and all bony prominences were padded. A urinary catheter was inserted aseptically to decompress the bladder. The entire abdomen and bilateral flanks were shaved, prepared, and draped in usual sterile fashion. A partially threaded cannulated screw was placed using a percutaneous antegrade technique to address the hypertrophic superior ramus nonunion.
A C-arm fluoroscopy unit (Ziehm, Orlando, Florida) was positioned on the injured side. The surgeon stood on the contralateral side. A pelvic OOOCI (outlet obturator oblique combinative image) of the symphysis pubis was obtained. This view defined the medial and lateral extents of the inferior ramus. A 0.062-in smooth Kirschner wire was used to percutaneously locate an ideal starting point on the cranial aspect of the contralateral superior pubic ramus. The starting point was adjusted on this view until an ideal intended trajectory into the contralateral (affected) inferior pubic ramus was visualized (Figure 2A).
The C-arm beam was then oriented to an “excessive” pelvic inlet view tangential to the posterior cortical surface of the affected inferior pubic ramus (Figure 2B). The tip of the wire was then adjusted to position and aim it slightly anterior to the posterior cortical surface of the affected inferior ramus. The wire was advanced into the bone about 1 cm, and the location and direction of the wire were reconfirmed as accurate.
A vertical skin incision was then made around the wire, and the 4.5-mm cannulated drill was placed over the wire. A soft-tissue protective drill sleeve and oscillating technique were used to protect the soft-tissue anatomy. The trajectory of the drill was again confirmed on pelvic OOOCI and advanced into the bone. The intended path of the drill was from the cranial-medial symphyseal cortex of the contralateral superior ramus, through the symphysis pubis obliquely, and then into the medullary canal of the affected inferior ramus. Frequent biplanar fluoroscopic imaging followed this progression of the drill to the nonunion site. The cannulated drill was then removed and exchanged for a calibrated extra-long 2.5-mm drill bit, placed through the soft-tissue drill sleeve and into the glide hole created by the 4.5-mm cannulated drill. The C-arm unit ensured accurate positioning of the 2.5-mm drill on both pelvic OOOCI and “excessive” inlet view before advancement (Figures 3A, 3B). The 2.5-mm drill was advanced caudally, laterally, and anteriorly in the ramus, past the nonunion site, and then was stopped before it exited the cortex of the ischial tuberosity (Figures 4A, 4B).
The depth of the drill bit was assessed with a known-length protective drill sleeve and calibrated drill. Alternatively, depth can be assessed with another same-length calibrated drill bit positioned adjacent to the inserted drill bit. A fully threaded, blunt-tipped 4.5-mm cortical screw was then placed through the glide hole. Both fluoroscopic views were used to confirm that the screw followed the same trajectory as the drill. Finally, the screw was again checked on biplanar fluoroscopy to confirm it had remained in the OFP of the inferior ramus (Figures 5A, 5B).
Postoperative pelvic CT confirmed position and length of the screws. The patient was allowed weight-of-limb weight-bearing on her affected side after surgery. She was discharged the first day after surgery and allowed use of oral analgesics. Six weeks after surgery, pelvic radiographs showed partial healing, and she reported symptom relief. Resistive strengthening exercises were instituted, and progressive weight-bearing proceeded to full weight-bearing over the next 6 weeks. The patient reported almost complete relief of pain by 3 months, and she was able to return to work and daily activities without medication. Radiographs showed consolidation of the fractures. She was essentially symptom-free 17 months after surgery (Figure 6).
Case 2
An obese 51-year-old woman presented to the orthopedic clinic with a 6-month history of left groin pain that worsened with ambulation. She did not recall a specific injury but acknowledged a history of previous falls. Past medical history was significant for ulcerative colitis/irritable bowel syndrome and degenerative disease in the lumbar spine and right ankle. Previous pelvic radiographs showed no evidence of fracture or abnormality, but radiographs obtained before evaluation in the clinic showed hypertrophic nonunion of the left superior and inferior pubic ramus.
The patient had pain deep in the left groin with weight-bearing. On physical examination, she denied pain with log roll of the left hip or resisted straight leg raise. The pelvis was stable to manual compression. There was no sign of hernia or lymphadenopathy in the region of the left groin.
The patient had obtained a technetium-99 nuclear medicine scan of the pelvis in addition to standard preoperative CT of the nonunion area. The nuclear medicine scan showed uptake in the area of the superior and inferior ramus, and CT confirmed presence of a superior and inferior ramus that would accommodate a medullary screw.
The patient was taken to the operating room, where percutaneous fixation of the left superior and inferior ramus was performed (as described above). The patient was discharged on postoperative day 2 and followed the same weight-bearing protocol that the first patient used.
At 6 weeks, the patient returned to clinic with improved comfort. At 3 months, she denied left groin pain and was limited in activity only by preexisting arthrosis in the left ankle and lumbar spine. She was using a walker only for long distances and was symptom-free 13 months after surgery.
Discussion
Acute surgical fixation of the inferior ramus is seldom performed. The anatomical location of the inferior ramus and the lack of defined criteria for fixation often leave the inferior ramus ignored, unreduced, and without stabilization. In the setting of symptomatic nonunion, open stabilization has been used.11,12 Plate fixation after open débridement of an inferior ramus nonunion requires more extensive dissection and may increase the risk for perioperative infection and hardware prominence compared with an intramedullary implant.14 If plate prominence becomes symptomatic, the plate must be removed in a second surgical procedure. Percutaneous medullary screw fixation avoids the risks of surgical soft-tissue dissection and placement of a surface implant on the bone and reduces the need for a second surgical procedure to remove bothersome hardware. Percutaneous pelvic fixation has been well described and shown to provide stability to the pelvis. It can also be used to treat hypertrophic nonunions of the pelvis when mechanical stability is required for healing.13
In the cases reported here, inferior ramus stabilization was combined with intramedullary fixation of the superior ramus. As each patient had deep groin pain that could not be localized to either ramus, both rami were stabilized after close assessment on preoperative CT. Solitary fixation of the superior ramus may or may not provide stability sufficient for inferior ramus union and should be performed when the OFP of the inferior ramus is unavailable.
The anatomy of the inferior ramus must be carefully reviewed before surgery, as it is seldom encountered in open and percutaneous orthopedic pelvic surgery. The inferior ramus extends from the symphysis pubis to the ischial tuberosity. The ramus is wider medially and thinner laterally near the obturator foramen. The anterior surface of the ramus is flat and concave, whereas the posterior surface is flat and convex. The anatomy of the inferior ramus varies somewhat, and any distortion (eg, fracture, nonunion) of the OFP can render it incapable of accommodating screw fixation.13
Percutaneous placement of a medullary screw in the inferior ramus requires an understanding of the fluoroscopy required. Challenges, including body habitus and unique osseous anatomy, must be recognized. Soft tissues must be protected with a drill sleeve during preparation of the screw pathway, and care must be taken to avoid placing the screw beyond the cortex of the ischial tuberosity. A prominent screw tip can irritate the patient in the hamstrings or while sitting.
Intramedullary screw fixation of the inferior ramus is a technically demanding surgical procedure. Meticulous evaluation of preoperative radiographic studies must accompany strict attention to surgical detail. A misplaced or malpositioned drill bit or screw can injure surrounding neurovascular structures. A screw that does not cross the fracture or is not in the OFP of the inferior ramus will be ineffective and
potentially dangerous.
Conclusion
We have presented a technique for percutaneous screw placement in the inferior ramus. This technique requires an understanding of the anatomy of the inferior ramus and of the intraoperative fluoroscopy required for screw placement. We have used this technique to successfully treat symptomatic hypertrophic nonunions of the inferior ramus that require skeletal stability for healing.
1. Hill RM, Robinson CM, Keating JF. Fractures of the pubic rami. Epidemiology and five-year survival. J Bone Joint Surg Br. 2001;83(8):1141-1144.
2. Matta JM, Dickson KF, Markovich GD. Surgical treatment of pelvic nonunions and malunions. Clin Orthop. 1996;(329):199-206.
3. Barei DP, Shafer BL, Beingessner DM, Gardner MJ, Nork SE, Routt ML. The impact of open reduction internal fixation on acute pain management in unstable pelvic ring injuries. J Trauma. 2010;68(4):949-953.
4. van Dijk WA, Poeze M, van Helden SH, Brink PR, Verbruggen JP. Ten-year mortality among hospitalised patients with fractures of the pubic rami. Injury. 2010;41(4):411-414.
5. Simonian PT, Routt ML Jr, Harrington RM, Tencer AF. Internal fixation of the unstable anterior pelvic ring: a biomechanical comparison of standard plating techniques and the retrograde medullary superior pubic ramus screw. J Orthop Trauma. 1994;8(6):476-482.
6. Routt ML Jr, Simonian PT, Grujic L. The retrograde medullary superior pubic ramus screw for the treatment of anterior pelvic ring disruptions: a new technique. J Orthop Trauma. 1995;9(1):35-44.
7. Matta JM. Indications for anterior fixation of pelvic fractures. Clin Orthop. 1996;(329):88-96.
8. Routt ML Jr, Nork SE, Mills WJ. Percutaneous fixation of pelvic ring disruptions. Clin Orthop. 2000;(375):15-29.
9. Gautier E, Rommens PM, Matta JM. Late reconstruction after pelvic ring injuries. Injury. 1996;27(suppl 2):B39-B46.
10. Altman GT, Altman DT, Routt ML Jr. Symptomatic hypertrophic pubic ramus nonunion treated with a retrograde medullary screw. J Orthop Trauma. 2000;14(8):582-585.
11. Archdeacon MT, Kuhlman G, Kazemi N. Fellow’s Corner: grand rounds from the University of Cincinnati Medical Center—painful superior and inferior pubic rami nonunion. J Orthop Trauma. 2010;24(11):e109-e112.
12. Schofer M, Illian C, Fuchs-Winkelmann S, Kortmann HR. Pseudoarthrosis of anterior pelvic ring fracture [in German]. Unfallchirurg. 2008;111(4):264, 266-267.
13. Bishop JA, Routt ML Jr. Osseous fixation pathways in pelvic and acetabular fracture surgery: osteology, radiology, and clinical applications. J Trauma Acute Care Surg. 2012;72(6):1502-1509.
14. Schmidt AH, Swiontkowski MF. Pathophysiology of infections after internal fixation of fractures. J Am Acad Orthop Surg. 2000;8(5):285-291.