User login
Where Does the Hospital Belong? Perspectives on Hospital at Home in the 21st Century
From Medically Home Group, Boston, MA.
Brick-and-mortar hospitals in the United States have historically been considered the dominant setting for providing care to patients. The coordination and delivery of care has previously been bound to physical hospitals largely because multidisciplinary services were only accessible in an individual location. While the fundamental make-up of these services remains unchanged, these services are now available in alternate settings. Some of these services include access to a patient care team, supplies, diagnostics, pharmacy, and advanced therapeutic interventions. Presently, the physical environment is becoming increasingly irrelevant as the core of what makes the traditional hospital—the professional staff, collaborative work processes, and the dynamics of the space—have all been translated into a modern digitally integrated environment. The elements necessary to providing safe, effective care in a physical hospital setting are now available in a patient’s home.
Impetus for the Model
As hospitals reconsider how and where they deliver patient care because of limited resources, the hospital-at-home model has gained significant momentum and interest. This model transforms a home into a hospital. The inpatient acute care episode is entirely substituted with an intensive at-home hospital admission enabled by technology, multidisciplinary teams, and ancillary services. Furthermore, patients requiring post-acute support can be transitioned to their next phase of care seamlessly. Given the nationwide nursing shortage, aging population, challenges uncovered by the COVID-19 pandemic, rising hospital costs, nurse/provider burnout related to challenging work environments, and capacity constraints, a shift toward the combination of virtual and in-home care is imperative. The hospital-at-home model has been associated with superior patient outcomes, including reduced risks of delirium, improved functional status, improved patient and family member satisfaction, reduced mortality, reduced readmissions, and significantly lower costs.1 COVID-19 alone has unmasked major facility-based deficiencies and limitations of our health care system. While the pandemic is not the impetus for the hospital-at-home model, the extended stress of this event has created a unique opportunity to reimagine and transform our health care delivery system so that it is less fragmented and more flexible.
Nursing in the Model
Nursing is central to the hospital-at-home model. Virtual nurses provide meticulous care plan oversight, assessment, and documentation across in-home service providers, to ensure holistic, safe, transparent, and continuous progression toward care plan milestones. The virtual nurse monitors patients using in-home technology that is set up at the time of admission. Connecting with patients to verify social and medical needs, the virtual nurse advocates for their patients and uses these technologies to care and deploy on-demand hands-on services to the patient. Service providers such as paramedics, infusion nurses, or home health nurses may be deployed to provide services in the patient’s home. By bringing in supplies, therapeutics, and interdisciplinary team members, the capabilities of a brick-and-mortar hospital are replicated in the home. All actions that occur wherever the patient is receiving care are overseen by professional nursing staff; in short, virtual nurses are the equivalent of bedside nurses in the brick-and-mortar health care facilities.
Potential Benefits
There are many benefits to the hospital-at-home model (Table). This health care model can be particularly helpful for patients who require frequent admission to acute care facilities, and is well suited for patients with a range of conditions, including those with COVID-19, pneumonia, cellulitis, or congestive heart failure. This care model helps eliminate some of the stressors for patients who have chronic illnesses or other conditions that require frequent hospital admissions. Patients can independently recover at home and can also be surrounded by their loved ones and pets while recovering. This care approach additionally eliminates the risk of hospital-acquired infections and injuries. The hospital-at-home model allows for increased mobility,2 as patients are familiar with their surroundings, resulting in reduced onset of delirium. Additionally, patients with improved mobility performance are less likely to experience negative health outcomes.3 There is less chance of sleep disruption as the patient is sleeping in their own bed—no unfamiliar roommate, no call bells or health care personnel frequently coming into the room. The in-home technology set up for remote patient monitoring is designed with the user in mind. Ease of use empowers the patient to collaborate with their care team on their own terms and center the priorities of themselves and their families.

Positive Outcomes
The hospital-at-home model is associated with positive outcomes. The authors of a systematic review identified 10 randomized controlled trials of hospital-at-home programs (with a total of 1372 patients), but were able to obtain data for only 5 of these trials (with a total of 844 patients).4 They found a 38% reduction in 6-month mortality for patients who received hospital care at home, as well as significantly higher patient satisfaction across a range of medical conditions, including patients with cellulitis and community-acquired pneumonia, as well as elderly patients with multiple medical conditions. The authors concluded that hospital care at home was less expensive than admission to an acute care hospital.4 Similarly, a meta-analysis done by Caplan et al5 that included 61 randomized controlled trials concluded that hospital at home is associated with reductions in mortality, readmission rates, and cost, and increases in patient and caregiver satisfaction. Levine et al2 found reduced costs and utilization with home hospitalization compared to in-hospital care, as well as improved patient mobility status.
The home is the ideal place to empower patients and caregivers to engage in self-management.2 Receiving hospital care at home eliminates the need for dealing with transportation arrangements, traffic, road tolls, and time/scheduling constraints, or finding care for a dependent family member, some of the many stressors that may be experienced by patients who require frequent trips to the hospital. For patients who may not be clinically suitable candidates for hospital at home, such as those requiring critical care intervention and support, the brick-and-mortar hospital is still the appropriate site of care. The hospital-at-home model helps prevent bed shortages in brick-and-mortar hospital settings by allowing hospital care at home for patients who meet preset criteria. These patients can be hospitalized in alternative locations such as their own homes or the residence of a friend. This helps increase health system capacity as well as resiliency.
In addition to expanding safe and appropriate treatment spaces, the hospital-at-home model helps increase access to care for patients during nonstandard hours, including weekends, holidays, or when the waiting time in the emergency room is painfully long. Furthermore, providing care in the home gives the clinical team valuable insight into the patient’s daily life and routine. Performing medication reconciliation with the medicine cabinet in sight and dietary education in a patient’s kitchen are powerful touch points.2 For example, a patient with congestive heart failure who must undergo diuresis is much more likely to meet their care goals when their home diet is aligned with the treatment goal. By being able to see exactly what is in a patient’s pantry and fridge, the care team can create a much more tailored approach to sodium intake and fluid management. Providers can create and execute true patient-centric care as they gain direct insight into the patient’s lifestyle, which is clearly valuable when creating care plans for complex chronic health issues.
Challenges to Implementation and Scaling
Although there are clear benefits to hospital at home, how to best implement and scale this model presents a challenge. In addition to educating patients and families about this model of care, health care systems must expand their hospital-at-home programs and provide education about this model to clinical staff and trainees, and insurers must create reimbursement paradigms. Patients meeting eligibility criteria to enroll in hospital at home is the easiest hurdle, as hospital-at-home programs function best when they enroll and service as many patients as possible, including underserved populations.
Upfront Costs and Cost Savings
While there are upfront costs to set up technology and coordinate services, hospital at home also provides significant total cost savings when compared to coordination associated with brick-and-mortar admission. Hospital care accounts for about one-third of total medical expenditures and is a leading cause of debt.2 Eliminating fixed hospital costs such as facility, overhead, and equipment costs through adoption of the hospital-at-home model can lead to a reduction in expenditures. It has been found that fewer laboratory and diagnostic tests are ordered for hospital-at-home patients when compared to similar patients in brick-and-mortar hospital settings, with comparable or better clinical patient outcomes.6 Furthermore, it is estimated that there are cost savings of 19% to 30% when compared to traditional inpatient care.6 Without legislative action, upon the end of the current COVID-19 public health emergency, the Centers for Medicare & Medicaid Service’s Acute Hospital Care at Home waiver will terminate. This could slow down scaling of the model.However, over the past 2 years there has been enough buy-in from major health systems and patients to continue the momentum of the model’s growth. When setting up a hospital-at-home program, it would be wise to consider a few factors: where in the hospital or health system entity structure the hospital-at-home program will reside, which existing resources can be leveraged within the hospital or health system, and what are the state or federal regulatory requirements for such a program. This type of program continues to fill gaps within the US health care system, meeting the needs of widely overlooked populations and increasing access to essential ancillary services.
Conclusion
It is time to consider our bias toward hospital-first options when managing the care needs of our patients. Health care providers have the option to advocate for holistic care, better experience, and better outcomes. Home-based options are safe, equitable, and patient-centric. Increased costs, consumerism, and technology have pushed us to think about alternative approaches to patient care delivery, and the pandemic created a unique opportunity to see just how far the health care system could stretch itself with capacity constraints, insufficient resources, and staff shortages. In light of new possibilities, it is time to reimagine and transform our health care delivery system so that it is unified, seamless, cohesive, and flexible.
Corresponding author: Payal Sharma, DNP, MSN, RN, FNP-BC, CBN; [email protected].
Disclosures: None reported.
1. Cai S, Laurel PA, Makineni R, Marks ML. Evaluation of a hospital-in-home program implemented among veterans. Am J Manag Care. 2017;23(8):482-487.
2. Levine DM, Ouchi K, Blanchfield B, et al. Hospital-level care at home for acutely ill adults: a pilot randomized controlled trial. J Gen Intern Med. 2018;33(5):729-736. doi:10.1007/s11606-018-4307-z
3. Shuman V, Coyle PC, Perera S,et al. Association between improved mobility and distal health outcomes. J Gerontol A Biol Sci Med Sci. 2020;75(12):2412-2417. doi:10.1093/gerona/glaa086
4. Shepperd S, Doll H, Angus RM, et al. Avoiding hospital admission through provision of hospital care at home: a systematic review and meta-analysis of individual patient data. CMAJ. 2009;180(2):175-182. doi:10.1503/cmaj.081491
5. Caplan GA, Sulaiman NS, Mangin DA, et al. A meta-analysis of “hospital in the home”. Med J Aust. 2012;197(9):512-519. doi:10.5694/mja12.10480
6. Hospital at Home. Johns Hopkins Medicine. Healthcare Solutions. Accessed May 20, 2022. https://www.johnshopkinssolutions.com/solution/hospital-at-home/
From Medically Home Group, Boston, MA.
Brick-and-mortar hospitals in the United States have historically been considered the dominant setting for providing care to patients. The coordination and delivery of care has previously been bound to physical hospitals largely because multidisciplinary services were only accessible in an individual location. While the fundamental make-up of these services remains unchanged, these services are now available in alternate settings. Some of these services include access to a patient care team, supplies, diagnostics, pharmacy, and advanced therapeutic interventions. Presently, the physical environment is becoming increasingly irrelevant as the core of what makes the traditional hospital—the professional staff, collaborative work processes, and the dynamics of the space—have all been translated into a modern digitally integrated environment. The elements necessary to providing safe, effective care in a physical hospital setting are now available in a patient’s home.
Impetus for the Model
As hospitals reconsider how and where they deliver patient care because of limited resources, the hospital-at-home model has gained significant momentum and interest. This model transforms a home into a hospital. The inpatient acute care episode is entirely substituted with an intensive at-home hospital admission enabled by technology, multidisciplinary teams, and ancillary services. Furthermore, patients requiring post-acute support can be transitioned to their next phase of care seamlessly. Given the nationwide nursing shortage, aging population, challenges uncovered by the COVID-19 pandemic, rising hospital costs, nurse/provider burnout related to challenging work environments, and capacity constraints, a shift toward the combination of virtual and in-home care is imperative. The hospital-at-home model has been associated with superior patient outcomes, including reduced risks of delirium, improved functional status, improved patient and family member satisfaction, reduced mortality, reduced readmissions, and significantly lower costs.1 COVID-19 alone has unmasked major facility-based deficiencies and limitations of our health care system. While the pandemic is not the impetus for the hospital-at-home model, the extended stress of this event has created a unique opportunity to reimagine and transform our health care delivery system so that it is less fragmented and more flexible.
Nursing in the Model
Nursing is central to the hospital-at-home model. Virtual nurses provide meticulous care plan oversight, assessment, and documentation across in-home service providers, to ensure holistic, safe, transparent, and continuous progression toward care plan milestones. The virtual nurse monitors patients using in-home technology that is set up at the time of admission. Connecting with patients to verify social and medical needs, the virtual nurse advocates for their patients and uses these technologies to care and deploy on-demand hands-on services to the patient. Service providers such as paramedics, infusion nurses, or home health nurses may be deployed to provide services in the patient’s home. By bringing in supplies, therapeutics, and interdisciplinary team members, the capabilities of a brick-and-mortar hospital are replicated in the home. All actions that occur wherever the patient is receiving care are overseen by professional nursing staff; in short, virtual nurses are the equivalent of bedside nurses in the brick-and-mortar health care facilities.
Potential Benefits
There are many benefits to the hospital-at-home model (Table). This health care model can be particularly helpful for patients who require frequent admission to acute care facilities, and is well suited for patients with a range of conditions, including those with COVID-19, pneumonia, cellulitis, or congestive heart failure. This care model helps eliminate some of the stressors for patients who have chronic illnesses or other conditions that require frequent hospital admissions. Patients can independently recover at home and can also be surrounded by their loved ones and pets while recovering. This care approach additionally eliminates the risk of hospital-acquired infections and injuries. The hospital-at-home model allows for increased mobility,2 as patients are familiar with their surroundings, resulting in reduced onset of delirium. Additionally, patients with improved mobility performance are less likely to experience negative health outcomes.3 There is less chance of sleep disruption as the patient is sleeping in their own bed—no unfamiliar roommate, no call bells or health care personnel frequently coming into the room. The in-home technology set up for remote patient monitoring is designed with the user in mind. Ease of use empowers the patient to collaborate with their care team on their own terms and center the priorities of themselves and their families.
Positive Outcomes
The hospital-at-home model is associated with positive outcomes. The authors of a systematic review identified 10 randomized controlled trials of hospital-at-home programs (with a total of 1372 patients), but were able to obtain data for only 5 of these trials (with a total of 844 patients).4 They found a 38% reduction in 6-month mortality for patients who received hospital care at home, as well as significantly higher patient satisfaction across a range of medical conditions, including patients with cellulitis and community-acquired pneumonia, as well as elderly patients with multiple medical conditions. The authors concluded that hospital care at home was less expensive than admission to an acute care hospital.4 Similarly, a meta-analysis done by Caplan et al5 that included 61 randomized controlled trials concluded that hospital at home is associated with reductions in mortality, readmission rates, and cost, and increases in patient and caregiver satisfaction. Levine et al2 found reduced costs and utilization with home hospitalization compared to in-hospital care, as well as improved patient mobility status.
The home is the ideal place to empower patients and caregivers to engage in self-management.2 Receiving hospital care at home eliminates the need for dealing with transportation arrangements, traffic, road tolls, and time/scheduling constraints, or finding care for a dependent family member, some of the many stressors that may be experienced by patients who require frequent trips to the hospital. For patients who may not be clinically suitable candidates for hospital at home, such as those requiring critical care intervention and support, the brick-and-mortar hospital is still the appropriate site of care. The hospital-at-home model helps prevent bed shortages in brick-and-mortar hospital settings by allowing hospital care at home for patients who meet preset criteria. These patients can be hospitalized in alternative locations such as their own homes or the residence of a friend. This helps increase health system capacity as well as resiliency.
In addition to expanding safe and appropriate treatment spaces, the hospital-at-home model helps increase access to care for patients during nonstandard hours, including weekends, holidays, or when the waiting time in the emergency room is painfully long. Furthermore, providing care in the home gives the clinical team valuable insight into the patient’s daily life and routine. Performing medication reconciliation with the medicine cabinet in sight and dietary education in a patient’s kitchen are powerful touch points.2 For example, a patient with congestive heart failure who must undergo diuresis is much more likely to meet their care goals when their home diet is aligned with the treatment goal. By being able to see exactly what is in a patient’s pantry and fridge, the care team can create a much more tailored approach to sodium intake and fluid management. Providers can create and execute true patient-centric care as they gain direct insight into the patient’s lifestyle, which is clearly valuable when creating care plans for complex chronic health issues.
Challenges to Implementation and Scaling
Although there are clear benefits to hospital at home, how to best implement and scale this model presents a challenge. In addition to educating patients and families about this model of care, health care systems must expand their hospital-at-home programs and provide education about this model to clinical staff and trainees, and insurers must create reimbursement paradigms. Patients meeting eligibility criteria to enroll in hospital at home is the easiest hurdle, as hospital-at-home programs function best when they enroll and service as many patients as possible, including underserved populations.
Upfront Costs and Cost Savings
While there are upfront costs to set up technology and coordinate services, hospital at home also provides significant total cost savings when compared to coordination associated with brick-and-mortar admission. Hospital care accounts for about one-third of total medical expenditures and is a leading cause of debt.2 Eliminating fixed hospital costs such as facility, overhead, and equipment costs through adoption of the hospital-at-home model can lead to a reduction in expenditures. It has been found that fewer laboratory and diagnostic tests are ordered for hospital-at-home patients when compared to similar patients in brick-and-mortar hospital settings, with comparable or better clinical patient outcomes.6 Furthermore, it is estimated that there are cost savings of 19% to 30% when compared to traditional inpatient care.6 Without legislative action, upon the end of the current COVID-19 public health emergency, the Centers for Medicare & Medicaid Service’s Acute Hospital Care at Home waiver will terminate. This could slow down scaling of the model.However, over the past 2 years there has been enough buy-in from major health systems and patients to continue the momentum of the model’s growth. When setting up a hospital-at-home program, it would be wise to consider a few factors: where in the hospital or health system entity structure the hospital-at-home program will reside, which existing resources can be leveraged within the hospital or health system, and what are the state or federal regulatory requirements for such a program. This type of program continues to fill gaps within the US health care system, meeting the needs of widely overlooked populations and increasing access to essential ancillary services.
Conclusion
It is time to consider our bias toward hospital-first options when managing the care needs of our patients. Health care providers have the option to advocate for holistic care, better experience, and better outcomes. Home-based options are safe, equitable, and patient-centric. Increased costs, consumerism, and technology have pushed us to think about alternative approaches to patient care delivery, and the pandemic created a unique opportunity to see just how far the health care system could stretch itself with capacity constraints, insufficient resources, and staff shortages. In light of new possibilities, it is time to reimagine and transform our health care delivery system so that it is unified, seamless, cohesive, and flexible.
Corresponding author: Payal Sharma, DNP, MSN, RN, FNP-BC, CBN; [email protected].
Disclosures: None reported.
1. Cai S, Laurel PA, Makineni R, Marks ML. Evaluation of a hospital-in-home program implemented among veterans. Am J Manag Care. 2017;23(8):482-487.
2. Levine DM, Ouchi K, Blanchfield B, et al. Hospital-level care at home for acutely ill adults: a pilot randomized controlled trial. J Gen Intern Med. 2018;33(5):729-736. doi:10.1007/s11606-018-4307-z
3. Shuman V, Coyle PC, Perera S,et al. Association between improved mobility and distal health outcomes. J Gerontol A Biol Sci Med Sci. 2020;75(12):2412-2417. doi:10.1093/gerona/glaa086
4. Shepperd S, Doll H, Angus RM, et al. Avoiding hospital admission through provision of hospital care at home: a systematic review and meta-analysis of individual patient data. CMAJ. 2009;180(2):175-182. doi:10.1503/cmaj.081491
5. Caplan GA, Sulaiman NS, Mangin DA, et al. A meta-analysis of “hospital in the home”. Med J Aust. 2012;197(9):512-519. doi:10.5694/mja12.10480
6. Hospital at Home. Johns Hopkins Medicine. Healthcare Solutions. Accessed May 20, 2022. https://www.johnshopkinssolutions.com/solution/hospital-at-home/
The Intersection of Clinical Quality Improvement Research and Implementation Science
The Institute of Medicine brought much-needed attention to the need for process improvement in medicine with its seminal report To Err Is Human: Building a Safer Health System, which was issued in 1999, leading to the quality movement’s call to close health care performance gaps in Crossing the Quality Chasm: A New Health System for the 21st Century.1,2 Quality improvement science in medicine has evolved over the past 2 decades to include a broad spectrum of approaches, from agile improvement to continuous learning and improvement. Current efforts focus on Lean-based process improvement along with a reduction in variation in clinical practice to align practice with the principles of evidence-based medicine in a patient-centered approach.3 Further, the definition of quality improvement under the Affordable Care Act was framed as an equitable, timely, value-based, patient-centered approach to achieving population-level health goals.4 Thus, the science of quality improvement drives the core principles of care delivery improvement, and the rigorous evidence needed to expand innovation is embedded within the same framework.5,6 In clinical practice, quality improvement projects aim to define gaps and then specific steps are undertaken to improve the evidence-based practice of a specific process. The overarching goal is to enhance the efficacy of the practice by reducing waste within a particular domain. Thus, quality improvement and implementation research eventually unify how clinical practice is advanced concurrently to bridge identified gaps.7
System redesign through a patient-centered framework forms the core of an overarching strategy to support system-level processes. Both require a deep understanding of the fields of quality improvement science and implementation science.8 Furthermore, aligning clinical research needs, system aims, patients’ values, and clinical care give the new design a clear path forward. Patient-centered improvement includes the essential elements of system redesign around human factors, including communication, physical resources, and updated information during episodes of care. The patient-centered improvement design is juxtaposed with care planning and establishing continuum of care processes.9 It is essential to note that safety is rooted within the quality domain as a top priority in medicine.10 The best implementation methods and approaches are discussed and debated, and the improvement progress continues on multiple fronts.11 Patient safety systems are implemented simultaneously during the redesign phase. Moreover, identifying and testing the health care delivery methods in the era of competing strategic priorities to achieve the desirable clinical outcomes highlights the importance of implementation, while contemplating the methods of dissemination, scalability, and sustainability of the best evidence-based clinical practice.
The cycle of quality improvement research completes the system implementation efforts. The conceptual framework of quality improvement includes multiple areas of care and transition, along with applying the best clinical practices in a culture that emphasizes continuous improvement and learning. At the same time, the operating principles should include continuous improvement in a simple and continuous system of learning as a core concept. Our proposed implementation approach involves taking simple and practical steps while separating the process from the outcomes measures, extracting effectiveness throughout the process. It is essential to keep in mind that building a proactive and systematic improvement environment requires a framework for safety, reliability, and effective care, as well as the alignment of the physical system, communication, and professional environment and culture (Figure).

In summary, system design for quality improvement research should incorporate the principles and conceptual framework that embody effective implementation strategies, with a focus on operational and practical steps. Continuous improvement will be reached through the multidimensional development of current health care system metrics and the incorporation of implementation science methods.
Corresponding author: Ebrahim Barkoudah, MD, MPH, Department of Medicine, Brigham and Women’s Hospital, Boston, MA; [email protected]
Disclosures: None reported.
1. Institute of Medicine (US) Committee on Quality of Health Care in America. To Err is Human: Building a Safer Health System. Kohn LT, Corrigan JM, Donaldson MS, editors. Washington (DC): National Academies Press (US); 2000.
2. Institute of Medicine (US) Committee on Quality of Health Care in America. Crossing the Quality Chasm: A New Health System for the 21st Century. Washington (DC): National Academies Press (US); 2001.
3. Berwick DM. The science of improvement. JAMA. 2008;299(10):1182-1184. doi:10.1001/jama.299.10.1182
4. Mazurenko O, Balio CP, Agarwal R, Carroll AE, Menachemi N. The effects of Medicaid expansion under the ACA: a systematic review. Health Affairs. 2018;37(6):944-950. doi: 10.1377/hlthaff.2017.1491
5. Fan E, Needham DM. The science of quality improvement. JAMA. 2008;300(4):390-391. doi:10.1001/jama.300.4.390-b
6. Alexander JA, Hearld LR. The science of quality improvement implementation: developing capacity to make a difference. Med Care. 2011:S6-20. doi:10.1097/MLR.0b013e3181e1709c
7. Rohweder C, Wangen M, Black M, et al. Understanding quality improvement collaboratives through an implementation science lens. Prev Med. 2019;129:105859. doi: 10.1016/j.ypmed.2019.105859
8. Bergeson SC, Dean JD. A systems approach to patient-centered care. JAMA. 2006;296(23):2848-2851. doi:10.1001/jama.296.23.2848
9. Leonard M, Graham S, Bonacum D. The human factor: the critical importance of effective teamwork and communication in providing safe care. Qual Saf Health Care. 2004;13 Suppl 1(Suppl 1):i85-90. doi:10.1136/qhc.13.suppl_1.i85
10. Leape LL, Berwick DM, Bates DW. What practices will most improve safety? Evidence-based medicine meets patient safety. JAMA. 2002;288(4):501-507. doi:10.1001/jama.288.4.501
11. Auerbach AD, Landefeld CS, Shojania KG. The tension between needing to improve care and knowing how to do it. N Engl J Med. 2007;357(6):608-613. doi:10.1056/NEJMsb070738
The Institute of Medicine brought much-needed attention to the need for process improvement in medicine with its seminal report To Err Is Human: Building a Safer Health System, which was issued in 1999, leading to the quality movement’s call to close health care performance gaps in Crossing the Quality Chasm: A New Health System for the 21st Century.1,2 Quality improvement science in medicine has evolved over the past 2 decades to include a broad spectrum of approaches, from agile improvement to continuous learning and improvement. Current efforts focus on Lean-based process improvement along with a reduction in variation in clinical practice to align practice with the principles of evidence-based medicine in a patient-centered approach.3 Further, the definition of quality improvement under the Affordable Care Act was framed as an equitable, timely, value-based, patient-centered approach to achieving population-level health goals.4 Thus, the science of quality improvement drives the core principles of care delivery improvement, and the rigorous evidence needed to expand innovation is embedded within the same framework.5,6 In clinical practice, quality improvement projects aim to define gaps and then specific steps are undertaken to improve the evidence-based practice of a specific process. The overarching goal is to enhance the efficacy of the practice by reducing waste within a particular domain. Thus, quality improvement and implementation research eventually unify how clinical practice is advanced concurrently to bridge identified gaps.7
System redesign through a patient-centered framework forms the core of an overarching strategy to support system-level processes. Both require a deep understanding of the fields of quality improvement science and implementation science.8 Furthermore, aligning clinical research needs, system aims, patients’ values, and clinical care give the new design a clear path forward. Patient-centered improvement includes the essential elements of system redesign around human factors, including communication, physical resources, and updated information during episodes of care. The patient-centered improvement design is juxtaposed with care planning and establishing continuum of care processes.9 It is essential to note that safety is rooted within the quality domain as a top priority in medicine.10 The best implementation methods and approaches are discussed and debated, and the improvement progress continues on multiple fronts.11 Patient safety systems are implemented simultaneously during the redesign phase. Moreover, identifying and testing the health care delivery methods in the era of competing strategic priorities to achieve the desirable clinical outcomes highlights the importance of implementation, while contemplating the methods of dissemination, scalability, and sustainability of the best evidence-based clinical practice.
The cycle of quality improvement research completes the system implementation efforts. The conceptual framework of quality improvement includes multiple areas of care and transition, along with applying the best clinical practices in a culture that emphasizes continuous improvement and learning. At the same time, the operating principles should include continuous improvement in a simple and continuous system of learning as a core concept. Our proposed implementation approach involves taking simple and practical steps while separating the process from the outcomes measures, extracting effectiveness throughout the process. It is essential to keep in mind that building a proactive and systematic improvement environment requires a framework for safety, reliability, and effective care, as well as the alignment of the physical system, communication, and professional environment and culture (Figure).
In summary, system design for quality improvement research should incorporate the principles and conceptual framework that embody effective implementation strategies, with a focus on operational and practical steps. Continuous improvement will be reached through the multidimensional development of current health care system metrics and the incorporation of implementation science methods.
Corresponding author: Ebrahim Barkoudah, MD, MPH, Department of Medicine, Brigham and Women’s Hospital, Boston, MA; [email protected]
Disclosures: None reported.
1. Institute of Medicine (US) Committee on Quality of Health Care in America. To Err is Human: Building a Safer Health System. Kohn LT, Corrigan JM, Donaldson MS, editors. Washington (DC): National Academies Press (US); 2000.
2. Institute of Medicine (US) Committee on Quality of Health Care in America. Crossing the Quality Chasm: A New Health System for the 21st Century. Washington (DC): National Academies Press (US); 2001.
3. Berwick DM. The science of improvement. JAMA. 2008;299(10):1182-1184. doi:10.1001/jama.299.10.1182
4. Mazurenko O, Balio CP, Agarwal R, Carroll AE, Menachemi N. The effects of Medicaid expansion under the ACA: a systematic review. Health Affairs. 2018;37(6):944-950. doi: 10.1377/hlthaff.2017.1491
5. Fan E, Needham DM. The science of quality improvement. JAMA. 2008;300(4):390-391. doi:10.1001/jama.300.4.390-b
6. Alexander JA, Hearld LR. The science of quality improvement implementation: developing capacity to make a difference. Med Care. 2011:S6-20. doi:10.1097/MLR.0b013e3181e1709c
7. Rohweder C, Wangen M, Black M, et al. Understanding quality improvement collaboratives through an implementation science lens. Prev Med. 2019;129:105859. doi: 10.1016/j.ypmed.2019.105859
8. Bergeson SC, Dean JD. A systems approach to patient-centered care. JAMA. 2006;296(23):2848-2851. doi:10.1001/jama.296.23.2848
9. Leonard M, Graham S, Bonacum D. The human factor: the critical importance of effective teamwork and communication in providing safe care. Qual Saf Health Care. 2004;13 Suppl 1(Suppl 1):i85-90. doi:10.1136/qhc.13.suppl_1.i85
10. Leape LL, Berwick DM, Bates DW. What practices will most improve safety? Evidence-based medicine meets patient safety. JAMA. 2002;288(4):501-507. doi:10.1001/jama.288.4.501
11. Auerbach AD, Landefeld CS, Shojania KG. The tension between needing to improve care and knowing how to do it. N Engl J Med. 2007;357(6):608-613. doi:10.1056/NEJMsb070738
A Quantification Method to Compare the Value of Surgery and Palliative Care in Patients With Complex Cardiac Disease: A Concept
From the Department of Cardiothoracic Surgery, Stanford University, Stanford, CA.
Abstract
Complex cardiac patients are often referred for surgery or palliative care based on the risk of perioperative mortality. This decision ignores factors such as quality of life or duration of life in either surgery or the palliative path. Here, we propose a model to numerically assess and compare the value of surgery vs palliation. This model includes quality and duration of life, as well as risk of perioperative mortality, and involves a patient’s preferences in the decision-making process.
For each pathway, surgery or palliative care, a value is calculated and compared to a normal life value (no disease symptoms and normal life expectancy). The formula is adjusted for the risk of operative mortality. The model produces a ratio of the value of surgery to the value of palliative care that signifies the superiority of one or another. This model calculation presents an objective estimated numerical value to compare the value of surgery and palliative care. It can be applied to every decision-making process before surgery. In general, if a procedure has the potential to significantly extend life in a patient who otherwise has a very short life expectancy with palliation only, performing high-risk surgery would be a reasonable option. A model that provides a numerical value for surgery vs palliative care and includes quality and duration of life in each pathway could be a useful tool for cardiac surgeons in decision making regarding high-risk surgery.
Keywords: high-risk surgery, palliative care, quality of life, life expectancy.
Patients with complex cardiovascular disease are occasionally considered inoperable due to the high risk of surgical mortality. When the risk of perioperative mortality (POM) is predicted to be too high, surgical intervention is denied, and patients are often referred to palliative care. The risk of POM in cardiac surgery is often calculated using large-scale databases, such as the Society of Thoracic Surgeons (STS) records. The STS risk models, which are regularly updated, are based on large data sets and incorporate precise statistical methods for risk adjustment.1 In general, these calculators provide a percentage value that defines the magnitude of the risk of death, and then an arbitrary range is selected to categorize the procedure as low, medium, or high risk or inoperable status. The STS database does not set a cutoff point or range to define “operability.” Assigning inoperable status to a certain risk rate is problematic, with many ethical, legal, and moral implications, and for this reason, it has mostly remained undefined. In contrast, the low- and medium-risk ranges are easier to define. Another limitation encountered in the STS database is the lack of risk data for less common but very high-risk procedures, such as a triple valve replacement.
A common example where risk classification has been defined is in patients who are candidates for surgical vs transcatheter aortic valve replacement. Some groups have described a risk of <4% as low risk, 4% to 8% as intermediate risk, >8% as high risk, and >15% as inoperable2; for some other groups, a risk of POM >50% is considered extreme risk or inoperable.3,4 This procedure-specific classification is a useful decision-making tool and helps the surgeon perform an initial risk assessment to allocate a specific patient to a group—operable or nonoperable—only by calculating the risk of surgical death. However, this allocation method does not provide any information on how and when death occurs in either group. These 2 parameters of how and when death occurs define the quality of life (QOL) and the duration of life (DOL), respectively, and together could be considered as the value of life in each pathway. A survivor of a high-risk surgery may benefit from good quality and extended life (a high value), or, on the other end of the spectrum, a high-risk patient who does not undergo surgery is spared the mortality risk of the surgery but dies sooner (low value) with symptoms due to the natural course of the untreated disease.
The central question is, if a surgery is high risk but has the potential of providing a good value (for those who survive it), what QOL and DOL values are acceptable to risk or to justify accepting and proceeding with a risky surgery? Or how high a POM risk is justified to proceed with surgery rather than the alternative palliative care with a certain quality and duration? It is obvious that a decision-making process that is based on POM cannot compare the value of surgery (Vs) and the value of palliation (Vp). Furthermore, it ignores patient preferences and their input, as these are excluded from this decision-making process.
To be able to include QOL and DOL in any decision making, one must precisely describe these parameters. Both QOL and DOL are used for estimation of disease burden by health care administrators, public health experts, insurance agencies, and others. Multiple models have been proposed and used to estimate the overall burden of the disease. Most of the models for this purpose are created for large-scale economic purposes and not for decision making in individual cases.
An important measure is the quality-adjusted life year (QALY). This is an important parameter since it includes both measures of quality and quantity of life.5,6 QALY is a simplified measure to assess the value of health outcomes, and it has been used in economic calculations to assess mainly the cost-effectiveness of various interventions. We sought to evaluate the utility of a similar method in adding further insight into the surgical decision-making process. In this article, we propose a simple model to compare the value of surgery vs palliative care, similar to QALY. This model includes and adjusts for the quality and the quantity of life, in addition to the risk of POM, in the decision-making process for high-risk patients.
The Model
The 2 decision pathways, surgery and palliative care, are compared for their value. We define the value as the product of QOL and DOL in each pathway and use the severity of the symptoms as a surrogate for QOL. If duration and quality were depicted on the x and y axes of a graph (Figure 1), then the area under the curve would represent the collective value in each situation. Figure 2 shows the timeline and the different pathways with each decision. The value in each situation is calculated in relation to the full value, which is represented as the value of normal life (Vn), that is, life without disease and with normal life expectancy. The values of each decision pathway, the value of surgery (Vs) and the value of palliation (Vp), are then compared to define the benefit for each decision as follows:
If Vs/Vp > 1, the benefit is toward surgery;
If Vs/Vp < 1, the benefit is for palliative care.
 and in different disease pathways taken from a single sample")

Definitions
Both quality and duration of life are presented on a 1-10 scale, 1 being the lowest and 10 the highest value, to yield a product with a value of 100 in normal, disease-free life. Any lower value is presented as a percentage to represent the comparison to the full value. QOL is determined by degradation of full quality with the average level of symptoms. DOL is calculated as a lost time (
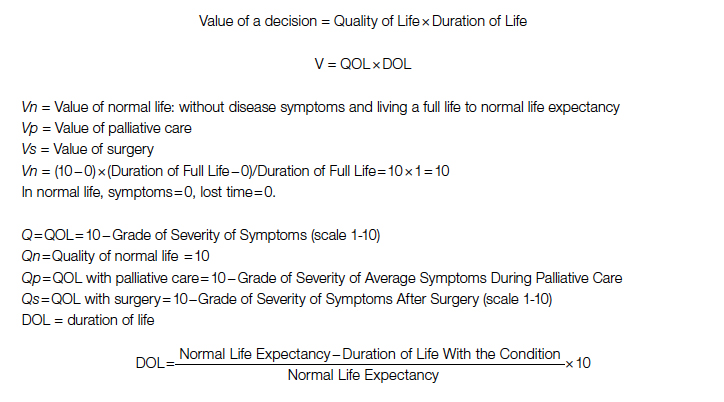
For the DOL under any condition, a 10-year survival rate could be used as a surrogate in this formula. Compared to life expectancy value, using the 10-year survival rate simplifies the calculation since cardiac diseases are more prevalent in older age, close to or beyond the average life expectancy value.
Using the time intervals from the timeline in Figure 2:
dh = time interval from diagnosis to death at life expectancy
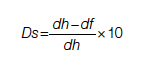
dg = time interval from diagnosis to death after successful surgery
df = time interval from diagnosis to death after palliative care
Duration for palliative care:
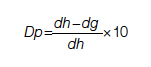
Duration for surgery:
Adjustment: This value is calculated for those who survive the surgery. To adjust for the POM, it is multiplied by the 100 − POM risk.
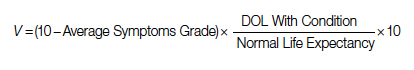
Since value is the base for comparison in this model, and it is the product of 2 equally important factors in the formula (
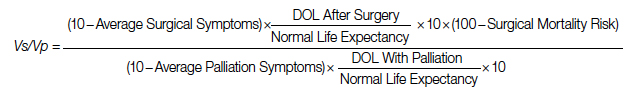
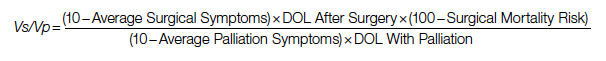
After elimination of normal life expectancy, form the numerator and denominator:
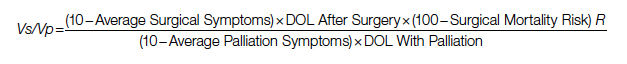
To adjust for surgical outcomes in special circumstances where less than optimal or standard surgical results are expected (eg, in very rare surgeries, limited resource institutions, or suboptimal postoperative surgical care), an optional coefficient R can be added to the numerator (surgical value). This optional coefficient, with values such as 0.8, 0.9 (to degrade the value of surgery) or 1 (standard surgical outcome), adjusts for variability in interinstitutional surgical results or surgeon variability. No coefficient is added to the denominator since palliative care provides minimal differences between clinicians and hospitals. Thus, the final adjusted formula would be as follows:
Example
A 60-year-old patient with a 10% POM risk needs to be allocated to surgical or palliative care. With palliative care, if this patient lived 6 years with average symptoms grade 4, the Vp would be 20; that is, 20% of the normal life value (if he lived 18 years instead without the disease).
Using the formula for calculation of value in each pathway:
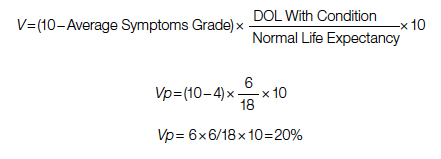
If the same patient undergoes a surgery with a 10% risk of POM, with an average grade 2 related to surgical recovery symptoms for 1 year and then is symptom-free and lives 12 years (instead of 18 years [life expectancy]), his Vs would be 53, or 53% out of the normal life value that is saved if the surgery is 100% successful; adjusted Vs with (chance of survival of 90%) would be 53 × 90% = 48%.
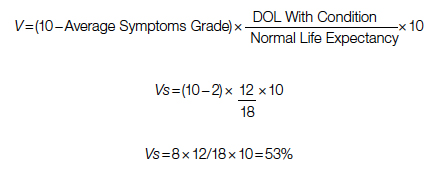
With adjustment of 90% survival chance in surgery, 53 × 90% = 48%. In this example, Vs/Vp = 48/20 = 2.4, showing a significant benefit for surgical care. Notably, the unknown value of normal life expectancy is not needed for the calculation of Vs/Vp, since it is the same in both pathways and it is eliminated by calculation in fraction.
Based on this formula, since the duration of surgical symptoms is short, no matter how severe these are, if the potential duration of life after surgery is high (represented by smaller area under the curve in Figure 1), the numerator becomes larger and the value of the surgery grows. For example, if a patient with a 15% risk of POM, which is generally considered inoperable, lives 5 years, as opposed to 2 years with palliative care with mild symptoms (eg 3/10), Vs/Vp would be 2.7, still showing a significant benefit for surgical care.
Discussion
Any surgical intervention is offered with 2 goals in mind, improving QOL and extending DOL. In a high-risk patient, surgery might be declined due to a high risk of POM, and the patient is offered palliative care, which other than providing symptom relief does not change the course of disease and eventually the patient will die due to the untreated disease. In this decision-making method, mostly completed by a care team only, a potential risk of death due to surgery which possibly could cure the patient is traded for immediate survival; however, the symptomatic course ensues until death. This mostly unilateral decision-making process by a care team, which incorporates minimal input from the patient or ignores patient preferences altogether, is based only on POM risk, and roughly includes a single parameter: years of potential life lost (YPLL). YPLL is a measure of premature mortality, and in the setting of surgical intervention, YPLL is the number of years a patient would lose unless a successful surgery were undertaken. Obviously, patients would live longer if a surgery that was intended to save them failed.
In this article, we proposed a simple method to quantify each decision to decide whether to operate or choose surgical care vs palliative care. Since quality and duration of life are both end factors clinicians and patients aspire to in each decision, they can be considered together as the value of each decision. We believe a numerical framework would provide an objective way to assist both the patient at high risk and the care team in the decision-making process.
The 2 parameters we consider are DOL and QOL. DOL, or survival, can be extracted from large-scale data using statistical methods that have been developed to predict survival under various conditions, such as Kaplan-Meier curves. These methods present the chance of survival in percentages in a defined time frame, such as a 5- or 10-year period.
While the DOL is a numerical parameter and quantifiable, the QOL is a more complex entity. This subjective parameter bears multiple definitions, aspects, and categories, and therefore multiple scales for quantification of QOL have been proposed. These scales have been used extensively for the purpose of health determination in health care policy and economic planning. Most scales acknowledge that QOL is multifactorial and includes interrelated aspects such as mental and socioeconomic factors. We have also noticed that QOL is better determined by the palliative care team than surgeons, so including these care providers in the decision-making process might reduce surgeon bias.
Since our purpose here is only to assist with the decision on medical intervention, we focus on physical QOL. Multiple scales are used to assess health-related QOL, such as the Assessment of Quality of Life (AQoL)-8D,7 EuroQol-5 Dimension (EQ-5D),8 15D,9 and the 36-Item Short Form Survey (SF-36).10 These complex scales are built for systematic reviews, and they are not practical for a clinical user. To simplify and keep this practical, we define QOL by using the severity or grade of symptoms related to the disease the patient has on a scale of 0 to 10. The severity of symptoms can be easily determined using available scales. An applicable scale for this purpose is the Edmonton Symptom Assessment Scale (ESAS), which has been in use for years and has evolved as a useful tool in the medical field.11
Once DOL and QOL are determined on a 1-10 scale, the multiplied value then provides a product that we consider a value. The highest value hoped for in each decision is the achievement of the best QOL and DOL, a value of 100. In Figure 1, a graphic presentation of value in each decision is best seen as the area under the curve. As shown, a successful surgery, even when accompanied by significant symptoms during initial recovery, has a chance (100 – risk of POM%) to gain a larger area under curve (value) by achieving a longer life with no or fewer symptoms. However, in palliative care, progressing disease and even palliated symptoms with a shorter life expectancy impose a large burden on the patient and a much lower value. Note that in this calculation, life expectancy, which is an important but unpredictable factor, is initially included; however, by ratio comparison, it is eliminated, simplifying the calculation further.
Using this formula in different settings reveals that high-risk surgery has a greater potential to reduce YPLL in the general population. Based on this formula, compared to a surgery with potential to significantly extend DOL, a definite shorter and symptomatic life course with palliative care makes it a significantly less favorable option. In fact, in the cardiovascular field, palliative care has minimal or no effect on natural history, as the mechanism of illness is mechanical, such as occlusion of coronary arteries or valve dysfunction, leading eventually to heart failure and death. In a study by Xu et al, although palliative care reduced readmission rates and improved symptoms on a variety of scales, there was no effect on mortality and QOL in patients with heart failure.12
No model in this field has proven to be ideal, and this model bears multiple limitations as well. We have used severity of symptoms as a surrogate for QOL based on the fact that cardiac patients with different pathologies who are untreated will have a common final pathway with development of heart failure symptoms that dictate their QOL. Also, grading QOL is a difficult task at times. Even a model such as QALY, which is one of the most used, is not a perfect model and is not free of problems.6 The difference in surgical results and life expectancy between sexes and ethnic groups might be a source of bias in this formula. Also, multiple factors directly and indirectly affect QOL and DOL and create inaccuracies; therefore, making an exact science from an inexact one naturally relies on multiple assumptions. Although it has previously been shown that most POM occurs in a short period of time after cardiac surgery,13 long-term complications that potentially degrade QOL are not included in this model. By applying this model, one must assume indefinite economic resources. Moreover, applying a single mathematical model in a biologic system and in the general population has intrinsic shortcomings, and it must overlook many other factors (eg, ethical, legal). For example, it will be hard to justify a failed surgery with 15% risk of POM undertaken to eliminate the severe long-lasting symptoms of a disease, while the outcome of a successful surgery with a 20% risk of POM that adds life and quality would be ignored in the current health care system. Thus, regardless of the significant potential, most surgeons would waive a surgery based solely on the percentage rate of POM, perhaps using other terms such as ”peri-nonoperative mortality.”
Conclusion
We have proposed a simple and practical formula for decision making regarding surgical vs palliative care in high-risk patients. By assigning a value that is composed of QOL and DOL in each pathway and including the risk of POM, a ratio of values provides a numerical estimation that can be used to show preference over a specific decision. An advantage of this formula, in addition to presenting an arithmetic value that is easier to understand, is that it can be used in shared decision making with patients. We emphasize that this model is only a preliminary concept at this time and has not been tested or validated for clinical use. Validation of such a model will require extensive work and testing within a large-scale population. We hope that this article will serve as a starting point for the development of other models, and that this formula will become more sophisticated with fewer limitations through larger multidisciplinary efforts in the future.
Corresponding author: Rabin Gerrah, MD, Good Samaritan Regional Medical Center, 3640 NW Samaritan Drive, Suite 100B, Corvallis, OR 97330; [email protected].
Disclosures: None reported.
1. O’Brien SM, Feng L, He X, et al. The Society of Thoracic Surgeons 2018 Adult Cardiac Surgery Risk Models: Part 2-statistical methods and results. Ann Thorac Surg. 2018;105(5):1419-1428. doi: 10.1016/j.athoracsur.2018.03.003
2. Hurtado Rendón IS, Bittenbender P, Dunn JM, Firstenberg MS. Chapter 8: Diagnostic workup and evaluation: eligibility, risk assessment, FDA guidelines. In: Transcatheter Heart Valve Handbook: A Surgeons’ and Interventional Council Review. Akron City Hospital, Summa Health System, Akron, OH.
3. Herrmann HC, Thourani VH, Kodali SK, et al; PARTNER Investigators. One-year clinical outcomes with SAPIEN 3 transcatheter aortic valve replacement in high-risk and inoperable patients with severe aortic stenosis. Circulation. 2016;134:130-140. doi:10.1161/CIRCULATIONAHA
4. Ho C, Argáez C. Transcatheter Aortic Valve Implantation for Patients with Severe Aortic Stenosis at Various Levels of Surgical Risk: A Review of Clinical Effectiveness. Ottawa (ON): Canadian Agency for Drugs and Technologies in Health; March 19, 2018.
5. Rios-Diaz AJ, Lam J, Ramos MS, et al. Global patterns of QALY and DALY use in surgical cost-utility analyses: a systematic review. PLoS One. 2016:10;11:e0148304. doi:10.1371/journal.pone.0148304
6. Prieto L, Sacristán JA. Health, Problems and solutions in calculating quality-adjusted life years (QALYs). Qual Life Outcomes. 2003:19;1:80.
7. Centre for Health Economics. Assessment of Quality of Life. 2014. Accessed May 13, 2022. http://www.aqol.com.au/
8. EuroQol Research Foundation. EQ-5D. Accessed May 13, 2022. https://euroqol.org/
9. 15D Instrument. Accessed May 13, 2022. http://www.15d-instrument.net/15d/
10. Rand Corporation. 36-Item Short Form Survey (SF-36).Accessed May 12, 2022. https://www.rand.org/health-care/surveys_tools/mos/36-item-short-form.html
11. Hui D, Bruera E. The Edmonton Symptom Assessment System 25 years later: past, present, and future developments. J Pain Symptom Manage. 2017:53:630-643. doi:10.1016/j.jpainsymman.2016
12. Xu Z, Chen L, Jin S, Yang B, Chen X, Wu Z. Effect of palliative care for patients with heart failure. Int Heart J. 2018:30;59:503-509. doi:10.1536/ihj.17-289
13. Mazzeffi M, Zivot J, Buchman T, Halkos M. In-hospital mortality after cardiac surgery: patient characteristics, timing, and association with postoperative length of intensive care unit and hospital stay. Ann Thorac Surg. 2014;97:1220-1225. doi:10.1016/j.athoracsur.2013.10.040
From the Department of Cardiothoracic Surgery, Stanford University, Stanford, CA.
Abstract
Complex cardiac patients are often referred for surgery or palliative care based on the risk of perioperative mortality. This decision ignores factors such as quality of life or duration of life in either surgery or the palliative path. Here, we propose a model to numerically assess and compare the value of surgery vs palliation. This model includes quality and duration of life, as well as risk of perioperative mortality, and involves a patient’s preferences in the decision-making process.
For each pathway, surgery or palliative care, a value is calculated and compared to a normal life value (no disease symptoms and normal life expectancy). The formula is adjusted for the risk of operative mortality. The model produces a ratio of the value of surgery to the value of palliative care that signifies the superiority of one or another. This model calculation presents an objective estimated numerical value to compare the value of surgery and palliative care. It can be applied to every decision-making process before surgery. In general, if a procedure has the potential to significantly extend life in a patient who otherwise has a very short life expectancy with palliation only, performing high-risk surgery would be a reasonable option. A model that provides a numerical value for surgery vs palliative care and includes quality and duration of life in each pathway could be a useful tool for cardiac surgeons in decision making regarding high-risk surgery.
Keywords: high-risk surgery, palliative care, quality of life, life expectancy.
Patients with complex cardiovascular disease are occasionally considered inoperable due to the high risk of surgical mortality. When the risk of perioperative mortality (POM) is predicted to be too high, surgical intervention is denied, and patients are often referred to palliative care. The risk of POM in cardiac surgery is often calculated using large-scale databases, such as the Society of Thoracic Surgeons (STS) records. The STS risk models, which are regularly updated, are based on large data sets and incorporate precise statistical methods for risk adjustment.1 In general, these calculators provide a percentage value that defines the magnitude of the risk of death, and then an arbitrary range is selected to categorize the procedure as low, medium, or high risk or inoperable status. The STS database does not set a cutoff point or range to define “operability.” Assigning inoperable status to a certain risk rate is problematic, with many ethical, legal, and moral implications, and for this reason, it has mostly remained undefined. In contrast, the low- and medium-risk ranges are easier to define. Another limitation encountered in the STS database is the lack of risk data for less common but very high-risk procedures, such as a triple valve replacement.
A common example where risk classification has been defined is in patients who are candidates for surgical vs transcatheter aortic valve replacement. Some groups have described a risk of <4% as low risk, 4% to 8% as intermediate risk, >8% as high risk, and >15% as inoperable2; for some other groups, a risk of POM >50% is considered extreme risk or inoperable.3,4 This procedure-specific classification is a useful decision-making tool and helps the surgeon perform an initial risk assessment to allocate a specific patient to a group—operable or nonoperable—only by calculating the risk of surgical death. However, this allocation method does not provide any information on how and when death occurs in either group. These 2 parameters of how and when death occurs define the quality of life (QOL) and the duration of life (DOL), respectively, and together could be considered as the value of life in each pathway. A survivor of a high-risk surgery may benefit from good quality and extended life (a high value), or, on the other end of the spectrum, a high-risk patient who does not undergo surgery is spared the mortality risk of the surgery but dies sooner (low value) with symptoms due to the natural course of the untreated disease.
The central question is, if a surgery is high risk but has the potential of providing a good value (for those who survive it), what QOL and DOL values are acceptable to risk or to justify accepting and proceeding with a risky surgery? Or how high a POM risk is justified to proceed with surgery rather than the alternative palliative care with a certain quality and duration? It is obvious that a decision-making process that is based on POM cannot compare the value of surgery (Vs) and the value of palliation (Vp). Furthermore, it ignores patient preferences and their input, as these are excluded from this decision-making process.
To be able to include QOL and DOL in any decision making, one must precisely describe these parameters. Both QOL and DOL are used for estimation of disease burden by health care administrators, public health experts, insurance agencies, and others. Multiple models have been proposed and used to estimate the overall burden of the disease. Most of the models for this purpose are created for large-scale economic purposes and not for decision making in individual cases.
An important measure is the quality-adjusted life year (QALY). This is an important parameter since it includes both measures of quality and quantity of life.5,6 QALY is a simplified measure to assess the value of health outcomes, and it has been used in economic calculations to assess mainly the cost-effectiveness of various interventions. We sought to evaluate the utility of a similar method in adding further insight into the surgical decision-making process. In this article, we propose a simple model to compare the value of surgery vs palliative care, similar to QALY. This model includes and adjusts for the quality and the quantity of life, in addition to the risk of POM, in the decision-making process for high-risk patients.
The Model
The 2 decision pathways, surgery and palliative care, are compared for their value. We define the value as the product of QOL and DOL in each pathway and use the severity of the symptoms as a surrogate for QOL. If duration and quality were depicted on the x and y axes of a graph (Figure 1), then the area under the curve would represent the collective value in each situation. Figure 2 shows the timeline and the different pathways with each decision. The value in each situation is calculated in relation to the full value, which is represented as the value of normal life (Vn), that is, life without disease and with normal life expectancy. The values of each decision pathway, the value of surgery (Vs) and the value of palliation (Vp), are then compared to define the benefit for each decision as follows:
If Vs/Vp > 1, the benefit is toward surgery;
If Vs/Vp < 1, the benefit is for palliative care.
Definitions
Both quality and duration of life are presented on a 1-10 scale, 1 being the lowest and 10 the highest value, to yield a product with a value of 100 in normal, disease-free life. Any lower value is presented as a percentage to represent the comparison to the full value. QOL is determined by degradation of full quality with the average level of symptoms. DOL is calculated as a lost time (
For the DOL under any condition, a 10-year survival rate could be used as a surrogate in this formula. Compared to life expectancy value, using the 10-year survival rate simplifies the calculation since cardiac diseases are more prevalent in older age, close to or beyond the average life expectancy value.
Using the time intervals from the timeline in Figure 2:
dh = time interval from diagnosis to death at life expectancy
dg = time interval from diagnosis to death after successful surgery
df = time interval from diagnosis to death after palliative care
Duration for palliative care:
Duration for surgery:
Adjustment: This value is calculated for those who survive the surgery. To adjust for the POM, it is multiplied by the 100 − POM risk.
Since value is the base for comparison in this model, and it is the product of 2 equally important factors in the formula (
After elimination of normal life expectancy, form the numerator and denominator:
To adjust for surgical outcomes in special circumstances where less than optimal or standard surgical results are expected (eg, in very rare surgeries, limited resource institutions, or suboptimal postoperative surgical care), an optional coefficient R can be added to the numerator (surgical value). This optional coefficient, with values such as 0.8, 0.9 (to degrade the value of surgery) or 1 (standard surgical outcome), adjusts for variability in interinstitutional surgical results or surgeon variability. No coefficient is added to the denominator since palliative care provides minimal differences between clinicians and hospitals. Thus, the final adjusted formula would be as follows:
Example
A 60-year-old patient with a 10% POM risk needs to be allocated to surgical or palliative care. With palliative care, if this patient lived 6 years with average symptoms grade 4, the Vp would be 20; that is, 20% of the normal life value (if he lived 18 years instead without the disease).
Using the formula for calculation of value in each pathway:
If the same patient undergoes a surgery with a 10% risk of POM, with an average grade 2 related to surgical recovery symptoms for 1 year and then is symptom-free and lives 12 years (instead of 18 years [life expectancy]), his Vs would be 53, or 53% out of the normal life value that is saved if the surgery is 100% successful; adjusted Vs with (chance of survival of 90%) would be 53 × 90% = 48%.
With adjustment of 90% survival chance in surgery, 53 × 90% = 48%. In this example, Vs/Vp = 48/20 = 2.4, showing a significant benefit for surgical care. Notably, the unknown value of normal life expectancy is not needed for the calculation of Vs/Vp, since it is the same in both pathways and it is eliminated by calculation in fraction.
Based on this formula, since the duration of surgical symptoms is short, no matter how severe these are, if the potential duration of life after surgery is high (represented by smaller area under the curve in Figure 1), the numerator becomes larger and the value of the surgery grows. For example, if a patient with a 15% risk of POM, which is generally considered inoperable, lives 5 years, as opposed to 2 years with palliative care with mild symptoms (eg 3/10), Vs/Vp would be 2.7, still showing a significant benefit for surgical care.
Discussion
Any surgical intervention is offered with 2 goals in mind, improving QOL and extending DOL. In a high-risk patient, surgery might be declined due to a high risk of POM, and the patient is offered palliative care, which other than providing symptom relief does not change the course of disease and eventually the patient will die due to the untreated disease. In this decision-making method, mostly completed by a care team only, a potential risk of death due to surgery which possibly could cure the patient is traded for immediate survival; however, the symptomatic course ensues until death. This mostly unilateral decision-making process by a care team, which incorporates minimal input from the patient or ignores patient preferences altogether, is based only on POM risk, and roughly includes a single parameter: years of potential life lost (YPLL). YPLL is a measure of premature mortality, and in the setting of surgical intervention, YPLL is the number of years a patient would lose unless a successful surgery were undertaken. Obviously, patients would live longer if a surgery that was intended to save them failed.
In this article, we proposed a simple method to quantify each decision to decide whether to operate or choose surgical care vs palliative care. Since quality and duration of life are both end factors clinicians and patients aspire to in each decision, they can be considered together as the value of each decision. We believe a numerical framework would provide an objective way to assist both the patient at high risk and the care team in the decision-making process.
The 2 parameters we consider are DOL and QOL. DOL, or survival, can be extracted from large-scale data using statistical methods that have been developed to predict survival under various conditions, such as Kaplan-Meier curves. These methods present the chance of survival in percentages in a defined time frame, such as a 5- or 10-year period.
While the DOL is a numerical parameter and quantifiable, the QOL is a more complex entity. This subjective parameter bears multiple definitions, aspects, and categories, and therefore multiple scales for quantification of QOL have been proposed. These scales have been used extensively for the purpose of health determination in health care policy and economic planning. Most scales acknowledge that QOL is multifactorial and includes interrelated aspects such as mental and socioeconomic factors. We have also noticed that QOL is better determined by the palliative care team than surgeons, so including these care providers in the decision-making process might reduce surgeon bias.
Since our purpose here is only to assist with the decision on medical intervention, we focus on physical QOL. Multiple scales are used to assess health-related QOL, such as the Assessment of Quality of Life (AQoL)-8D,7 EuroQol-5 Dimension (EQ-5D),8 15D,9 and the 36-Item Short Form Survey (SF-36).10 These complex scales are built for systematic reviews, and they are not practical for a clinical user. To simplify and keep this practical, we define QOL by using the severity or grade of symptoms related to the disease the patient has on a scale of 0 to 10. The severity of symptoms can be easily determined using available scales. An applicable scale for this purpose is the Edmonton Symptom Assessment Scale (ESAS), which has been in use for years and has evolved as a useful tool in the medical field.11
Once DOL and QOL are determined on a 1-10 scale, the multiplied value then provides a product that we consider a value. The highest value hoped for in each decision is the achievement of the best QOL and DOL, a value of 100. In Figure 1, a graphic presentation of value in each decision is best seen as the area under the curve. As shown, a successful surgery, even when accompanied by significant symptoms during initial recovery, has a chance (100 – risk of POM%) to gain a larger area under curve (value) by achieving a longer life with no or fewer symptoms. However, in palliative care, progressing disease and even palliated symptoms with a shorter life expectancy impose a large burden on the patient and a much lower value. Note that in this calculation, life expectancy, which is an important but unpredictable factor, is initially included; however, by ratio comparison, it is eliminated, simplifying the calculation further.
Using this formula in different settings reveals that high-risk surgery has a greater potential to reduce YPLL in the general population. Based on this formula, compared to a surgery with potential to significantly extend DOL, a definite shorter and symptomatic life course with palliative care makes it a significantly less favorable option. In fact, in the cardiovascular field, palliative care has minimal or no effect on natural history, as the mechanism of illness is mechanical, such as occlusion of coronary arteries or valve dysfunction, leading eventually to heart failure and death. In a study by Xu et al, although palliative care reduced readmission rates and improved symptoms on a variety of scales, there was no effect on mortality and QOL in patients with heart failure.12
No model in this field has proven to be ideal, and this model bears multiple limitations as well. We have used severity of symptoms as a surrogate for QOL based on the fact that cardiac patients with different pathologies who are untreated will have a common final pathway with development of heart failure symptoms that dictate their QOL. Also, grading QOL is a difficult task at times. Even a model such as QALY, which is one of the most used, is not a perfect model and is not free of problems.6 The difference in surgical results and life expectancy between sexes and ethnic groups might be a source of bias in this formula. Also, multiple factors directly and indirectly affect QOL and DOL and create inaccuracies; therefore, making an exact science from an inexact one naturally relies on multiple assumptions. Although it has previously been shown that most POM occurs in a short period of time after cardiac surgery,13 long-term complications that potentially degrade QOL are not included in this model. By applying this model, one must assume indefinite economic resources. Moreover, applying a single mathematical model in a biologic system and in the general population has intrinsic shortcomings, and it must overlook many other factors (eg, ethical, legal). For example, it will be hard to justify a failed surgery with 15% risk of POM undertaken to eliminate the severe long-lasting symptoms of a disease, while the outcome of a successful surgery with a 20% risk of POM that adds life and quality would be ignored in the current health care system. Thus, regardless of the significant potential, most surgeons would waive a surgery based solely on the percentage rate of POM, perhaps using other terms such as ”peri-nonoperative mortality.”
Conclusion
We have proposed a simple and practical formula for decision making regarding surgical vs palliative care in high-risk patients. By assigning a value that is composed of QOL and DOL in each pathway and including the risk of POM, a ratio of values provides a numerical estimation that can be used to show preference over a specific decision. An advantage of this formula, in addition to presenting an arithmetic value that is easier to understand, is that it can be used in shared decision making with patients. We emphasize that this model is only a preliminary concept at this time and has not been tested or validated for clinical use. Validation of such a model will require extensive work and testing within a large-scale population. We hope that this article will serve as a starting point for the development of other models, and that this formula will become more sophisticated with fewer limitations through larger multidisciplinary efforts in the future.
Corresponding author: Rabin Gerrah, MD, Good Samaritan Regional Medical Center, 3640 NW Samaritan Drive, Suite 100B, Corvallis, OR 97330; [email protected].
Disclosures: None reported.
1. O’Brien SM, Feng L, He X, et al. The Society of Thoracic Surgeons 2018 Adult Cardiac Surgery Risk Models: Part 2-statistical methods and results. Ann Thorac Surg. 2018;105(5):1419-1428. doi: 10.1016/j.athoracsur.2018.03.003
2. Hurtado Rendón IS, Bittenbender P, Dunn JM, Firstenberg MS. Chapter 8: Diagnostic workup and evaluation: eligibility, risk assessment, FDA guidelines. In: Transcatheter Heart Valve Handbook: A Surgeons’ and Interventional Council Review. Akron City Hospital, Summa Health System, Akron, OH.
3. Herrmann HC, Thourani VH, Kodali SK, et al; PARTNER Investigators. One-year clinical outcomes with SAPIEN 3 transcatheter aortic valve replacement in high-risk and inoperable patients with severe aortic stenosis. Circulation. 2016;134:130-140. doi:10.1161/CIRCULATIONAHA
4. Ho C, Argáez C. Transcatheter Aortic Valve Implantation for Patients with Severe Aortic Stenosis at Various Levels of Surgical Risk: A Review of Clinical Effectiveness. Ottawa (ON): Canadian Agency for Drugs and Technologies in Health; March 19, 2018.
5. Rios-Diaz AJ, Lam J, Ramos MS, et al. Global patterns of QALY and DALY use in surgical cost-utility analyses: a systematic review. PLoS One. 2016:10;11:e0148304. doi:10.1371/journal.pone.0148304
6. Prieto L, Sacristán JA. Health, Problems and solutions in calculating quality-adjusted life years (QALYs). Qual Life Outcomes. 2003:19;1:80.
7. Centre for Health Economics. Assessment of Quality of Life. 2014. Accessed May 13, 2022. http://www.aqol.com.au/
8. EuroQol Research Foundation. EQ-5D. Accessed May 13, 2022. https://euroqol.org/
9. 15D Instrument. Accessed May 13, 2022. http://www.15d-instrument.net/15d/
10. Rand Corporation. 36-Item Short Form Survey (SF-36).Accessed May 12, 2022. https://www.rand.org/health-care/surveys_tools/mos/36-item-short-form.html
11. Hui D, Bruera E. The Edmonton Symptom Assessment System 25 years later: past, present, and future developments. J Pain Symptom Manage. 2017:53:630-643. doi:10.1016/j.jpainsymman.2016
12. Xu Z, Chen L, Jin S, Yang B, Chen X, Wu Z. Effect of palliative care for patients with heart failure. Int Heart J. 2018:30;59:503-509. doi:10.1536/ihj.17-289
13. Mazzeffi M, Zivot J, Buchman T, Halkos M. In-hospital mortality after cardiac surgery: patient characteristics, timing, and association with postoperative length of intensive care unit and hospital stay. Ann Thorac Surg. 2014;97:1220-1225. doi:10.1016/j.athoracsur.2013.10.040
Intravenous Immunoglobulin in Treating Nonventilated COVID-19 Patients With Moderate-to-Severe Hypoxia: A Pharmacoeconomic Analysis
From Sharp Memorial Hospital, San Diego, CA (Drs. Poremba, Dehner, Perreiter, Semma, and Mills), Sharp Rees-Stealy Medical Group, San Diego, CA (Dr. Sakoulas), and Collaborative to Halt Antibiotic-Resistant Microbes (CHARM), Department of Pediatrics, University of California San Diego School of Medicine, La Jolla, CA (Dr. Sakoulas).
Abstract
Objective: To compare the costs of hospitalization of patients with moderate-to-severe COVID-19 who received intravenous immunoglobulin (IVIG) with those of patients of similar comorbidity and illness severity who did not.
Design: Analysis 1 was a case-control study of 10 nonventilated, moderately to severely hypoxic patients with COVID-19 who received IVIG (Privigen [CSL Behring]) matched 1:2 with 20 control patients of similar age, body mass index, degree of hypoxemia, and comorbidities. Analysis 2 consisted of patients enrolled in a previously published, randomized, open-label prospective study of 14 patients with COVID-19 receiving standard of care vs 13 patients who received standard of care plus IVIG (Octagam 10% [Octapharma]).
Setting and participants: Patients with COVID-19 with moderate-to-severe hypoxemia hospitalized at a single site located in San Diego, California.
Measurements: Direct cost of hospitalization.
Results: In the first (case-control) population, mean total direct costs, including IVIG, for the treatment group were $21,982 per IVIG-treated case vs $42,431 per case for matched non-IVIG-receiving controls, representing a net cost reduction of $20,449 (48%) per case. For the second (randomized) group, mean total direct costs, including IVIG, for the treatment group were $28,268 per case vs $62,707 per case for untreated controls, representing a net cost reduction of $34,439 (55%) per case. Of the patients who did not receive IVIG, 24% had hospital costs exceeding $80,000; none of the IVIG-treated patients had costs exceeding this amount (P = .016, Fisher exact test).
Conclusion: If allocated early to the appropriate patient type (moderate-to-severe illness without end-organ comorbidities and age <70 years), IVIG can significantly reduce hospital costs in COVID-19 care. More important, in our study it reduced the demand for scarce critical care resources during the COVID-19 pandemic.
Keywords: IVIG, SARS-CoV-2, cost saving, direct hospital costs.
Intravenous immunoglobulin (IVIG) has been available in most hospitals for 4 decades, with broad therapeutic applications in the treatment of Kawasaki disease and a variety of inflammatory, infectious, autoimmune, and viral diseases, via multifactorial mechanisms of immune modulation.1 Reports of COVID-19−associated multisystem inflammatory syndrome in adults and children have supported the use of IVIG in treatment.2,3 Previous studies of IVIG treatment for COVID-19 have produced mixed results. Although retrospective studies have largely been positive,4-8 prospective clinical trials have been mixed, with some favorable results9-11 and another, more recent study showing no benefit.12 However, there is still considerable debate regarding whether some subgroups of patients with COVID-19 may benefit from IVIG; the studies that support this argument, however, have been diluted by broad clinical trials that lack granularity among the heterogeneity of patient characteristics and the timing of IVIG administration.13,14 One study suggests that patients with COVID-19 who may be particularly poised to benefit from IVIG are those who are younger, have fewer comorbidities, and are treated early.8
At our institution, we selectively utilized IVIG to treat patients within 48 hours of rapidly increasing oxygen requirements due to COVID-19, targeting those younger than 70 years, with no previous irreversible end-organ damage, no significant comorbidities (renal failure, heart failure, dementia, active cancer malignancies), and no active treatment for cancer. We analyzed the costs of care of these IVIG (Privigen) recipients and compared them to costs for patients with COVID-19 matched by comorbidities, age, and illness severity who did not receive IVIG. To look for consistency, we examined the cost of care of COVID-19 patients who received IVIG (Octagam) as compared to controls from a previously published pilot trial.10
Methods
Setting and Treatment
All patients in this study were hospitalized at a single site located in San Diego, California. Treatment patients in both cohorts received IVIG 0.5 g/kg adjusted for body weight daily for 3 consecutive days.
Patient Cohort #1: Retrospective Case-Control Trial
Intravenous immunoglobulin (Privigen 10%, CSL Behring) was utilized off-label to treat moderately to severely ill non-intensive care unit (ICU) patients with COVID-19 requiring ≥3 L of oxygen by nasal cannula who were not mechanically ventilated but were considered at high risk for respiratory failure. Preset exclusion criteria for off-label use of IVIG in the treatment of COVID-19 were age >70 years, active malignancy, organ transplant recipient, renal failure, heart failure, or dementia. Controls were obtained from a list of all admitted patients with COVID-19, matched to cases 2:1 on the basis of age (±10 years), body mass index (±1), gender, comorbidities present at admission (eg, hypertension, diabetes mellitus, lung disease, or history of tobacco use), and maximum oxygen requirements within the first 48 hours of admission. In situations where more than 2 potential matched controls were identified for a patient, the 2 controls closest in age to the treatment patient were selected. One IVIG patient was excluded because only 1 matched-age control could be found. Pregnant patients who otherwise fulfilled the criteria for IVIG administration were also excluded from this analysis.
Patient Cohort #2: Prospective, Randomized, Open-Label Trial
Use of IVIG (Octagam 10%, Octapharma) in COVID-19 was studied in a previously published, prospective, open-label randomized trial.10 This pilot trial included 16 IVIG-treated patients and 17 control patients, of which 13 and 14 patients, respectively, had hospital cost data available for analysis.10 Most notably, COVID-19 patients in this study were required to have ≥4 L of oxygen via nasal cannula to maintain arterial oxygen saturationof ≤96%.
Outcomes
Cost data were independently obtained from our finance team, which provided us with the total direct cost and the total pharmaceutical cost associated with each admission. We also compared total length of stay (LOS) and ICU LOS between treatment arms, as these were presumed to be the major drivers of cost difference.
Statistics
Nonparametric comparisons of medians were performed with the Mann-Whitney U test. Comparison of means was done by Student t test. Categorical data were analyzed by Fisher exact test.
This analysis was initiated as an internal quality assessment. It received approval from the Sharp Healthcare Institutional Review Board ([email protected]), and was granted a waiver of subject authorization and consent given the retrospective nature of the study.
Results
Case-Control Analysis
A total of 10 hypoxic patients with COVID-19 received Privigen IVIG outside of clinical trial settings. None of the patients was vaccinated against SARS-CoV-2, as hospitalization occurred prior to vaccine availability. In addition, the original SARS-CoV-2 strain was circulating while these patients were hospitalized, preceding subsequent emerging variants. Oxygen requirements within the first 48 hours ranged from 3 L via nasal cannula to requiring bi-level positive pressure airway therapy with 100% oxygen; median age was 56 years and median Charlson comorbidity index was 1. These 10 patients were each matched to 2 control patients hospitalized during a comparable time period and who, based on oxygen requirements, did not receive IVIG. The 20 control patients had a median age of 58.5 years and a Charlson comorbidity index of 1 (Table 1). Rates of comorbidities, such as hypertension, diabetes mellitus, and obesity, were identical in the 2 groups. None of the patients in either group died during the index hospitalization. Fewer control patients received glucocorticoids, which was reflective of lower illness severity/degree of hypoxia in some controls.

Health care utilization in terms of costs and hospital LOS between the 2 groups are shown in Table 2. The mean total direct hospital cost per case, including IVIG and other drug costs, for the 10 IVIG-treated COVID-19 patients was $21,982 vs $42,431 for the matched controls, a reduction of $20,449 (48%) per case (P = .6187) with IVIG. This difference was heavily driven by 4 control patients (20%) with hospital costs >$80,000, marked by need for ICU transfer, mechanical ventilation during admission, and longer hospital stays. This reduction in progression to mechanical ventilation was consistent with our previously published, open-label, randomized prospective IVIG study, the financial assessment of which is reviewed below. While total direct costs were lower in the treatment arm, the mean drug cost for the treatment arm was $3122 greater than the mean drug cost in the control arm (P = .001622), consistent with the high cost of IVIG therapy (Table 2).
 Recipients vs a Non-IVIG Matched Case-Control Group")
LOS information was obtained, as this was thought to be a primary driver of direct costs. The average LOS in the IVIG arm was 8.4 days, and the average LOS in the control arm was 13.6 days (P = NS). The average ICU LOS in the IVIG arm was 0 days, while the average ICU LOS in the control arm was 5.3 days (P = .04). As with the differences in cost, the differences in LOS were primarily driven by the 4 outlier cases in our control arm, who each had a LOS >25 days, as well as an ICU LOS >20 days.
Randomized, Open-Label, Patient Cohort Analysis
Patient characteristics, LOS, and rates of mechanical ventilation for the IVIG and control patients were previously published and showed a reduction in mechanical ventilation and hospital LOS with IVIG treatment.10 In this group of patients, 1 patient treated with IVIG (6%) and 3 patients not treated with IVIG (18%) died. To determine the consistency of these results from the case-control patients with a set of patients obtained from clinical trial randomization, we examined the health care costs of patients from the prior study.10 As with the case-control group, patients in this portion of the analysis were hospitalized before vaccines were available and prior to any identified variants.
Comparing the hospital cost of the IVIG-treated patients to the control patients from this trial revealed results similar to the matched case-control analysis discussed earlier. Average total direct cost per case, including IVIG, for the IVIG treatment group was $28,268, vs $62,707 per case for non-IVIG controls. This represented a net cost reduction of $34,439 (55%) per case, very similar to that of the prior cohort.
IVIG Reduces Costly Outlier Cases
The case-control and randomized trial groups, yielding a combined 23 IVIG and 34 control patients, showed a median cost per case of $22,578 (range $10,115-$70,929) and $22,645 (range $4723-$279,797) for the IVIG and control groups, respectively. Cases with a cost >$80,000 were 0/23 (0%) vs 8/34 (24%) in the IVIG and control groups, respectively (P = .016, Fisher exact test).
Improving care while simultaneously keeping care costs below reimbursement payment levels received from third-party payers is paramount to the financial survival of health care systems. IVIG appears to do this by reducing the number of patients with COVID-19 who progress to ICU care. We compared the costs of care of our combined case-control and randomized trial cohorts to published data on average reimbursements hospitals receive for COVID-19 care from Medicaid, Medicare, and private insurance (Figure).15 IVIG demonstrated a reduction in cases where costs exceed reimbursement. Indeed, a comparison of net revenue per case of the case-control group showed significantly higher revenue for the IVIG group compared to controls ($52,704 vs $34,712, P = .0338, Table 2).
 and control COVID-19 cases with respect to average reimbursement by Medicaid (solid line, bottom), Medicare (dashed line, middle), and commercial insurance (dotted line, top)")
Discussion
As reflected in at least 1 other study,16 our hospital had been successfully utilizing IVIG in the treatment of viral acute respiratory distress syndrome (ARDS) prior to COVID-19. Therefore, we moved quickly to perform a randomized, open-label pilot study of IVIG (Octagam 10%) in COVID-19, and noted significant clinical benefit that might translate into hospital cost savings.10 Over the course of the pandemic, evidence has accumulated that IVIG may play an important role in COVID-19 therapeutics, as summarized in a recent review.17 However, despite promising but inconsistent results, the relatively high acquisition costs of IVIG raised questions as to its pharmacoeconomic value, particularly with such a high volume of COVID-19 patients with hypoxia, in light of limited clinical data.
COVID-19 therapeutics data can be categorized into either high-quality trials showing marginal benefit for some agents or low-quality trials showing greater benefit for other agents, with IVIG studies falling into the latter category.18 This phenomenon may speak to the pathophysiological heterogeneity of the COVID-19 patient population. High-quality trials enrolling broad patient types lack the granularity to capture and single out relevant patient subsets who would derive maximal therapeutic benefit, with those subsets diluted by other patient types for which no benefit is seen. Meanwhile, the more granular low-quality trials are criticized as underpowered and lacking in translatability to practice.
Positive results from our pilot trial allowed the use of IVIG (Privigen) off-label in hospitalized COVID-19 patients restricted to specific criteria. Patients had to be moderately to severely ill, requiring >3 L of oxygen via nasal cannula; show high risk of clinical deterioration based on respiratory rate and decline in respiratory status; and have underlying comorbidities (such as hypertension, obesity, or diabetes mellitus). However, older patients (>age 70 years) and those with underlying comorbidities marked by organ failure (such as heart failure, renal failure, dementia, or receipt of organ transplant) and active malignancy were excluded, as their clinical outcome in COVID-19 may be considered less modifiable by therapeutics, while simultaneously carrying potentially a higher risk of adverse events from IVIG (volume overload, renal failure). These exclusions are reflected in the overall low Charlson comorbidity index (mean of 1) of the patients in the case-control study arm. As anticipated, we found a net cost reduction: $20,449 (48%) per case among the 10 IVIG-treated patients compared to the 20 matched controls.
We then went back to the patients from the randomized prospective trial and compared costs for the 13 of 16 IVIG patients and 14 of 17 of the control patients for whom data were available. Among untreated controls, we found a net cost reduction of $34,439 (55%) per case. The higher costs seen in the randomized patient cohort compared to the latter case-control group may be due to a combination of the fact that the treated patients had slightly higher comorbidity indices than the case-control group (median Charlson comorbidity index of 2 in both groups) and the fact that they were treated earlier in the pandemic (May/June 2020), as opposed to the case-control group patients, who were treated in November/December 2020.
It was notable that the cost savings across both groups were derived largely from the reduction in the approximately 20% to 25% of control patients who went on to critical illness, including mechanical ventilation, extracorporeal membrane oxygenation (ECMO), and prolonged ICU stays. Indeed, 8 of 34 of the control patients—but none of the 23 IVIG-treated patients—generated hospital costs in excess of $80,000, a difference that was statistically significant even for such a small sample size. Therefore, reducing these very costly outlier events translated into net savings across the board.
In addition to lowering costs, reducing progression to critical illness is extremely important during heavy waves of COVID-19, when the sheer volume of patients results in severe strain due to the relative scarcity of ICU beds, mechanical ventilators, and ECMO. Therefore, reducing the need for these resources would have a vital role that cannot be measured economically.
The major limitations of this study include the small sample size and the potential lack of generalizability of these results to all hospital centers and treating providers. Our group has considerable experience in IVIG utilization in COVID-19 and, as a result, has identified a “sweet spot,” where benefits were seen clinically and economically. However, it remains to be determined whether IVIG will benefit patients with greater illness severity, such as those in the ICU, on mechanical ventilation, or ECMO. Furthermore, while a significant morbidity and mortality burden of COVID-19 rests in extremely elderly patients and those with end-organ comorbidities such as renal failure and heart failure, it is uncertain whether their COVID-19 adverse outcomes can be improved with IVIG or other therapies. We believe such patients may limit the pharmacoeconomic value of IVIG due to their generally poorer prognosis, regardless of intervention. On the other hand, COVID-19 patients who are not that severely ill, with minimal to no hypoxia, generally will do well regardless of therapy. Therefore, IVIG intervention may be an unnecessary treatment expense. Evidence for this was suggested in our pilot trial10 and supported in a recent meta-analysis of IVIG therapy in COVID-19.19
Several other therapeutic options with high acquisition costs have seen an increase in use during the COVID-19 pandemic despite relatively lukewarm data. Remdesivir, the first drug found to have a beneficial effect on hospitalized patients with COVID-19, is priced at $3120 for a complete 5-day treatment course in the United States. This was in line with initial pricing models from the Institute for Clinical and Economic Review (ICER) in May 2020, assuming a mortality benefit with remdesivir use. After the SOLIDARITY trial was published, which showed no mortality benefit associated with remdesivir, ICER updated their pricing models in June 2020 and released a statement that the price of remdesivir was too high to align with demonstrated benefits.20,21 More recent data demonstrate that remdesivir may be beneficial, but only if administered to patients with fewer than 6 days of symptoms.22 However, only a minority of patients present to the hospital early enough in their illness for remdesivir to be beneficial.22
Tocilizumab, an interleukin-6 inhibitor, saw an increase in use during the pandemic. An 800-mg treatment course for COVID-19 costs $3584. The efficacy of this treatment option came into question after the COVACTA trial failed to show a difference in clinical status or mortality in COVID-19 patients who received tocilizumab vs placebo.23,24 A more recent study pointed to a survival benefit of tocilizumab in COVID-19, driven by a very large sample size (>4000), yielding statistically significant, but perhaps clinically less significant, effects on survival.25 This latter study points to the extremely large sample sizes required to capture statistically significant benefits of expensive interventions in COVID-19, which our data demonstrate may benefit only a fraction of patients (20%-25% of patients in the case of IVIG). A more granular clinical assessment of these other interventions is needed to be able to capture the patient subtypes where tocilizumab, remdesivir, and other therapies will be cost effective in the treatment of COVID-19 or other virally mediated cases of ARDS.
Conclusion
While IVIG has a high acquisition cost, the drug’s use in hypoxic COVID-19 patients resulted in reduced costs per COVID-19 case of approximately 50% and use of less critical care resources. The difference was consistent between 2 cohorts (randomized trial vs off-label use in prespecified COVID-19 patient types), IVIG products used (Octagam 10% and Privigen), and time period in the pandemic (waves 1 and 2 in May/June 2020 vs wave 3 in November/December 2020), thereby adjusting for potential differences in circulating viral strains. Furthermore, patients from both groups predated SARS-CoV-2 vaccine availability and major circulating viral variants (eg, delta, omicron), thereby eliminating confounding on outcomes posed by these factors. Control patients’ higher costs of care were driven largely by the approximately 25% of patients who required costly hospital critical care resources, a group mitigated by IVIG. When allocated to the appropriate patient type (patients with moderate-to-severe but not critical illness, <age 70 without preexisting comorbidities of end-organ failure or active cancer), IVIG can reduce hospital costs for COVID-19 care. Identification of specific patient populations where IVIG has the most anticipated benefits in viral illness is needed.
Corresponding author: George Sakoulas, MD, Sharp Rees-Stealy Medical Group, 2020 Genesee Avenue, 2nd Floor, San Diego, CA 92123; [email protected]
Disclosures: Dr Sakoulas has worked as a consultant for Abbvie, Paratek, and Octapharma, has served as a speaker for Abbvie and Paratek, and has received research funding from Octapharma. The other authors did not report any disclosures.
1. Galeotti C, Kaveri SV, Bayry J. IVIG-mediated effector functions in autoimmune and inflammatory diseases. Int Immunol. 2017;29(11):491-498. doi:10.1093/intimm/dxx039
2. Verdoni L, Mazza A, Gervasoni A, et al. An outbreak of severe Kawasaki-like disease at the Italian epicentre of the SARS-CoV-2 epidemic: an observational cohort study. Lancet. 2020;395(10239):1771-1778. doi:10.1016/S0140-6736(20)31103-X
3. Belhadjer Z, Méot M, Bajolle F, et al. Acute heart failure in multisystem inflammatory syndrome in children in the context of global SARS-CoV-2 pandemic. Circulation. 2020;142(5):429-436. doi:10.1161/CIRCULATIONAHA.120.048360
4. Shao Z, Feng Y, Zhong L, et al. Clinical efficacy of intravenous immunoglobulin therapy in critical ill patients with COVID-19: a multicenter retrospective cohort study. Clin Transl Immunology. 2020;9(10):e1192. doi:10.1002/cti2.1192
5. Xie Y, Cao S, Dong H, et al. Effect of regular intravenous immunoglobulin therapy on prognosis of severe pneumonia in patients with COVID-19. J Infect. 2020;81(2):318-356. doi:10.1016/j.jinf.2020.03.044
6. Zhou ZG, Xie SM, Zhang J, et al. Short-term moderate-dose corticosteroid plus immunoglobulin effectively reverses COVID-19 patients who have failed low-dose therapy. Preprints. 2020:2020030065. doi:10.20944/preprints202003.0065.v1
7. Cao W, Liu X, Bai T, et al. High-dose intravenous immunoglobulin as a therapeutic option for deteriorating patients with coronavirus disease 2019. Open Forum Infect Dis. 2020;7(3):ofaa102. doi:10.1093/ofid/ofaa102
8. Cao W, Liu X, Hong K, et al. High-dose intravenous immunoglobulin in severe coronavirus disease 2019: a multicenter retrospective study in China. Front Immunol. 2021;12:627844. doi:10.3389/fimmu.2021.627844
9. Gharebaghi N, Nejadrahim R, Mousavi SJ, Sadat-Ebrahimi SR, Hajizadeh R. The use of intravenous immunoglobulin gamma for the treatment of severe coronavirus disease 2019: a randomized placebo-controlled double-blind clinical trial. BMC Infect Dis. 2020;20(1):786. doi:10.1186/s12879-020-05507-4
10. Sakoulas G, Geriak M, Kullar R, et al. Intravenous immunoglobulin plus methylprednisolone mitigate respiratory morbidity in coronavirus disease 2019. Crit Care Explor. 2020;2(11):e0280. doi:10.1097/CCE.0000000000000280
11. Raman RS, Bhagwan Barge V, Anil Kumar D, et al. A phase II safety and efficacy study on prognosis of moderate pneumonia in coronavirus disease 2019 patients with regular intravenous immunoglobulin therapy. J Infect Dis. 2021;223(9):1538-1543. doi:10.1093/infdis/jiab098
12. Mazeraud A, Jamme M, Mancusi RL, et al. Intravenous immunoglobulins in patients with COVID-19-associated moderate-to-severe acute respiratory distress syndrome (ICAR): multicentre, double-blind, placebo-controlled, phase 3 trial. Lancet Respir Med. 2022;10(2):158-166. doi:10.1016/S2213-2600(21)00440-9
13. Kindgen-Milles D, Feldt T, Jensen BEO, Dimski T, Brandenburger T. Why the application of IVIG might be beneficial in patients with COVID-19. Lancet Respir Med. 2022;10(2):e15. doi:10.1016/S2213-2600(21)00549-X
14. Wilfong EM, Matthay MA. Intravenous immunoglobulin therapy for COVID-19 ARDS. Lancet Respir Med. 2022;10(2):123-125. doi:10.1016/S2213-2600(21)00450-1
15. Bazell C, Kramer M, Mraz M, Silseth S. How much are hospitals paid for inpatient COVID-19 treatment? June 2020. https://us.milliman.com/-/media/milliman/pdfs/articles/how-much-hospitals-paid-for-inpatient-covid19-treatment.ashx
16. Liu X, Cao W, Li T. High-dose intravenous immunoglobulins in the treatment of severe acute viral pneumonia: the known mechanisms and clinical effects. Front Immunol. 2020;11:1660. doi:10.3389/fimmu.2020.01660
17. Danieli MG, Piga MA, Paladini A, et al. Intravenous immunoglobulin as an important adjunct in prevention and therapy of coronavirus 19 disease. Scand J Immunol. 2021;94(5):e13101. doi:10.1111/sji.13101
18. Starshinova A, Malkova A, Zinchenko U, et al. Efficacy of different types of therapy for COVID-19: a comprehensive review. Life (Basel). 2021;11(8):753. doi:10.3390/life11080753
19. Xiang HR, Cheng X, Li Y, Luo WW, Zhang QZ, Peng WX. Efficacy of IVIG (intravenous immunoglobulin) for corona virus disease 2019 (COVID-19): a meta-analysis. Int Immunopharmacol. 2021;96:107732. doi:10.1016/j.intimp.2021.107732
20. ICER’s second update to pricing models of remdesivir for COVID-19. PharmacoEcon Outcomes News. 2020;867(1):2. doi:10.1007/s40274-020-7299-y
21. Pan H, Peto R, Henao-Restrepo AM, et al. Repurposed antiviral drugs for Covid-19—interim WHO solidarity trial results. N Engl J Med. 2021;384(6):497-511. doi:10.1056/NEJMoa2023184
22. Garcia-Vidal C, Alonso R, Camon AM, et al. Impact of remdesivir according to the pre-admission symptom duration in patients with COVID-19. J Antimicrob Chemother. 2021;76(12):3296-3302. doi:10.1093/jac/dkab321
23. Golimumab (Simponi) IV: In combination with methotrexate (MTX) for the treatment of adult patients with moderately to severely active rheumatoid arthritis [Internet]. Canadian Agency for Drugs and Technologies in Health; 2015. Table 1: Cost comparison table for biologic disease-modifying antirheumatic drugs. https://www.ncbi.nlm.nih.gov/books/NBK349397/table/T34/
24. Rosas IO, Bräu N, Waters M, et al. Tocilizumab in hospitalized patients with severe Covid-19 pneumonia. N Engl J Med. 2021;384(16):1503-1516. doi:10.1056/NEJMoa2028700
25. RECOVERY Collaborative Group. Tocilizumab in patients admitted to hospital with COVID-19 (RECOVERY): a randomised, controlled, open-label, platform trial. Lancet. 2021;397(10285):1637-1645. doi:10.1016/S0140-6736(21)00676-0
From Sharp Memorial Hospital, San Diego, CA (Drs. Poremba, Dehner, Perreiter, Semma, and Mills), Sharp Rees-Stealy Medical Group, San Diego, CA (Dr. Sakoulas), and Collaborative to Halt Antibiotic-Resistant Microbes (CHARM), Department of Pediatrics, University of California San Diego School of Medicine, La Jolla, CA (Dr. Sakoulas).
Abstract
Objective: To compare the costs of hospitalization of patients with moderate-to-severe COVID-19 who received intravenous immunoglobulin (IVIG) with those of patients of similar comorbidity and illness severity who did not.
Design: Analysis 1 was a case-control study of 10 nonventilated, moderately to severely hypoxic patients with COVID-19 who received IVIG (Privigen [CSL Behring]) matched 1:2 with 20 control patients of similar age, body mass index, degree of hypoxemia, and comorbidities. Analysis 2 consisted of patients enrolled in a previously published, randomized, open-label prospective study of 14 patients with COVID-19 receiving standard of care vs 13 patients who received standard of care plus IVIG (Octagam 10% [Octapharma]).
Setting and participants: Patients with COVID-19 with moderate-to-severe hypoxemia hospitalized at a single site located in San Diego, California.
Measurements: Direct cost of hospitalization.
Results: In the first (case-control) population, mean total direct costs, including IVIG, for the treatment group were $21,982 per IVIG-treated case vs $42,431 per case for matched non-IVIG-receiving controls, representing a net cost reduction of $20,449 (48%) per case. For the second (randomized) group, mean total direct costs, including IVIG, for the treatment group were $28,268 per case vs $62,707 per case for untreated controls, representing a net cost reduction of $34,439 (55%) per case. Of the patients who did not receive IVIG, 24% had hospital costs exceeding $80,000; none of the IVIG-treated patients had costs exceeding this amount (P = .016, Fisher exact test).
Conclusion: If allocated early to the appropriate patient type (moderate-to-severe illness without end-organ comorbidities and age <70 years), IVIG can significantly reduce hospital costs in COVID-19 care. More important, in our study it reduced the demand for scarce critical care resources during the COVID-19 pandemic.
Keywords: IVIG, SARS-CoV-2, cost saving, direct hospital costs.
Intravenous immunoglobulin (IVIG) has been available in most hospitals for 4 decades, with broad therapeutic applications in the treatment of Kawasaki disease and a variety of inflammatory, infectious, autoimmune, and viral diseases, via multifactorial mechanisms of immune modulation.1 Reports of COVID-19−associated multisystem inflammatory syndrome in adults and children have supported the use of IVIG in treatment.2,3 Previous studies of IVIG treatment for COVID-19 have produced mixed results. Although retrospective studies have largely been positive,4-8 prospective clinical trials have been mixed, with some favorable results9-11 and another, more recent study showing no benefit.12 However, there is still considerable debate regarding whether some subgroups of patients with COVID-19 may benefit from IVIG; the studies that support this argument, however, have been diluted by broad clinical trials that lack granularity among the heterogeneity of patient characteristics and the timing of IVIG administration.13,14 One study suggests that patients with COVID-19 who may be particularly poised to benefit from IVIG are those who are younger, have fewer comorbidities, and are treated early.8
At our institution, we selectively utilized IVIG to treat patients within 48 hours of rapidly increasing oxygen requirements due to COVID-19, targeting those younger than 70 years, with no previous irreversible end-organ damage, no significant comorbidities (renal failure, heart failure, dementia, active cancer malignancies), and no active treatment for cancer. We analyzed the costs of care of these IVIG (Privigen) recipients and compared them to costs for patients with COVID-19 matched by comorbidities, age, and illness severity who did not receive IVIG. To look for consistency, we examined the cost of care of COVID-19 patients who received IVIG (Octagam) as compared to controls from a previously published pilot trial.10
Methods
Setting and Treatment
All patients in this study were hospitalized at a single site located in San Diego, California. Treatment patients in both cohorts received IVIG 0.5 g/kg adjusted for body weight daily for 3 consecutive days.
Patient Cohort #1: Retrospective Case-Control Trial
Intravenous immunoglobulin (Privigen 10%, CSL Behring) was utilized off-label to treat moderately to severely ill non-intensive care unit (ICU) patients with COVID-19 requiring ≥3 L of oxygen by nasal cannula who were not mechanically ventilated but were considered at high risk for respiratory failure. Preset exclusion criteria for off-label use of IVIG in the treatment of COVID-19 were age >70 years, active malignancy, organ transplant recipient, renal failure, heart failure, or dementia. Controls were obtained from a list of all admitted patients with COVID-19, matched to cases 2:1 on the basis of age (±10 years), body mass index (±1), gender, comorbidities present at admission (eg, hypertension, diabetes mellitus, lung disease, or history of tobacco use), and maximum oxygen requirements within the first 48 hours of admission. In situations where more than 2 potential matched controls were identified for a patient, the 2 controls closest in age to the treatment patient were selected. One IVIG patient was excluded because only 1 matched-age control could be found. Pregnant patients who otherwise fulfilled the criteria for IVIG administration were also excluded from this analysis.
Patient Cohort #2: Prospective, Randomized, Open-Label Trial
Use of IVIG (Octagam 10%, Octapharma) in COVID-19 was studied in a previously published, prospective, open-label randomized trial.10 This pilot trial included 16 IVIG-treated patients and 17 control patients, of which 13 and 14 patients, respectively, had hospital cost data available for analysis.10 Most notably, COVID-19 patients in this study were required to have ≥4 L of oxygen via nasal cannula to maintain arterial oxygen saturationof ≤96%.
Outcomes
Cost data were independently obtained from our finance team, which provided us with the total direct cost and the total pharmaceutical cost associated with each admission. We also compared total length of stay (LOS) and ICU LOS between treatment arms, as these were presumed to be the major drivers of cost difference.
Statistics
Nonparametric comparisons of medians were performed with the Mann-Whitney U test. Comparison of means was done by Student t test. Categorical data were analyzed by Fisher exact test.
This analysis was initiated as an internal quality assessment. It received approval from the Sharp Healthcare Institutional Review Board ([email protected]), and was granted a waiver of subject authorization and consent given the retrospective nature of the study.
Results
Case-Control Analysis
A total of 10 hypoxic patients with COVID-19 received Privigen IVIG outside of clinical trial settings. None of the patients was vaccinated against SARS-CoV-2, as hospitalization occurred prior to vaccine availability. In addition, the original SARS-CoV-2 strain was circulating while these patients were hospitalized, preceding subsequent emerging variants. Oxygen requirements within the first 48 hours ranged from 3 L via nasal cannula to requiring bi-level positive pressure airway therapy with 100% oxygen; median age was 56 years and median Charlson comorbidity index was 1. These 10 patients were each matched to 2 control patients hospitalized during a comparable time period and who, based on oxygen requirements, did not receive IVIG. The 20 control patients had a median age of 58.5 years and a Charlson comorbidity index of 1 (Table 1). Rates of comorbidities, such as hypertension, diabetes mellitus, and obesity, were identical in the 2 groups. None of the patients in either group died during the index hospitalization. Fewer control patients received glucocorticoids, which was reflective of lower illness severity/degree of hypoxia in some controls.
Health care utilization in terms of costs and hospital LOS between the 2 groups are shown in Table 2. The mean total direct hospital cost per case, including IVIG and other drug costs, for the 10 IVIG-treated COVID-19 patients was $21,982 vs $42,431 for the matched controls, a reduction of $20,449 (48%) per case (P = .6187) with IVIG. This difference was heavily driven by 4 control patients (20%) with hospital costs >$80,000, marked by need for ICU transfer, mechanical ventilation during admission, and longer hospital stays. This reduction in progression to mechanical ventilation was consistent with our previously published, open-label, randomized prospective IVIG study, the financial assessment of which is reviewed below. While total direct costs were lower in the treatment arm, the mean drug cost for the treatment arm was $3122 greater than the mean drug cost in the control arm (P = .001622), consistent with the high cost of IVIG therapy (Table 2).
LOS information was obtained, as this was thought to be a primary driver of direct costs. The average LOS in the IVIG arm was 8.4 days, and the average LOS in the control arm was 13.6 days (P = NS). The average ICU LOS in the IVIG arm was 0 days, while the average ICU LOS in the control arm was 5.3 days (P = .04). As with the differences in cost, the differences in LOS were primarily driven by the 4 outlier cases in our control arm, who each had a LOS >25 days, as well as an ICU LOS >20 days.
Randomized, Open-Label, Patient Cohort Analysis
Patient characteristics, LOS, and rates of mechanical ventilation for the IVIG and control patients were previously published and showed a reduction in mechanical ventilation and hospital LOS with IVIG treatment.10 In this group of patients, 1 patient treated with IVIG (6%) and 3 patients not treated with IVIG (18%) died. To determine the consistency of these results from the case-control patients with a set of patients obtained from clinical trial randomization, we examined the health care costs of patients from the prior study.10 As with the case-control group, patients in this portion of the analysis were hospitalized before vaccines were available and prior to any identified variants.
Comparing the hospital cost of the IVIG-treated patients to the control patients from this trial revealed results similar to the matched case-control analysis discussed earlier. Average total direct cost per case, including IVIG, for the IVIG treatment group was $28,268, vs $62,707 per case for non-IVIG controls. This represented a net cost reduction of $34,439 (55%) per case, very similar to that of the prior cohort.
IVIG Reduces Costly Outlier Cases
The case-control and randomized trial groups, yielding a combined 23 IVIG and 34 control patients, showed a median cost per case of $22,578 (range $10,115-$70,929) and $22,645 (range $4723-$279,797) for the IVIG and control groups, respectively. Cases with a cost >$80,000 were 0/23 (0%) vs 8/34 (24%) in the IVIG and control groups, respectively (P = .016, Fisher exact test).
Improving care while simultaneously keeping care costs below reimbursement payment levels received from third-party payers is paramount to the financial survival of health care systems. IVIG appears to do this by reducing the number of patients with COVID-19 who progress to ICU care. We compared the costs of care of our combined case-control and randomized trial cohorts to published data on average reimbursements hospitals receive for COVID-19 care from Medicaid, Medicare, and private insurance (Figure).15 IVIG demonstrated a reduction in cases where costs exceed reimbursement. Indeed, a comparison of net revenue per case of the case-control group showed significantly higher revenue for the IVIG group compared to controls ($52,704 vs $34,712, P = .0338, Table 2).
Discussion
As reflected in at least 1 other study,16 our hospital had been successfully utilizing IVIG in the treatment of viral acute respiratory distress syndrome (ARDS) prior to COVID-19. Therefore, we moved quickly to perform a randomized, open-label pilot study of IVIG (Octagam 10%) in COVID-19, and noted significant clinical benefit that might translate into hospital cost savings.10 Over the course of the pandemic, evidence has accumulated that IVIG may play an important role in COVID-19 therapeutics, as summarized in a recent review.17 However, despite promising but inconsistent results, the relatively high acquisition costs of IVIG raised questions as to its pharmacoeconomic value, particularly with such a high volume of COVID-19 patients with hypoxia, in light of limited clinical data.
COVID-19 therapeutics data can be categorized into either high-quality trials showing marginal benefit for some agents or low-quality trials showing greater benefit for other agents, with IVIG studies falling into the latter category.18 This phenomenon may speak to the pathophysiological heterogeneity of the COVID-19 patient population. High-quality trials enrolling broad patient types lack the granularity to capture and single out relevant patient subsets who would derive maximal therapeutic benefit, with those subsets diluted by other patient types for which no benefit is seen. Meanwhile, the more granular low-quality trials are criticized as underpowered and lacking in translatability to practice.
Positive results from our pilot trial allowed the use of IVIG (Privigen) off-label in hospitalized COVID-19 patients restricted to specific criteria. Patients had to be moderately to severely ill, requiring >3 L of oxygen via nasal cannula; show high risk of clinical deterioration based on respiratory rate and decline in respiratory status; and have underlying comorbidities (such as hypertension, obesity, or diabetes mellitus). However, older patients (>age 70 years) and those with underlying comorbidities marked by organ failure (such as heart failure, renal failure, dementia, or receipt of organ transplant) and active malignancy were excluded, as their clinical outcome in COVID-19 may be considered less modifiable by therapeutics, while simultaneously carrying potentially a higher risk of adverse events from IVIG (volume overload, renal failure). These exclusions are reflected in the overall low Charlson comorbidity index (mean of 1) of the patients in the case-control study arm. As anticipated, we found a net cost reduction: $20,449 (48%) per case among the 10 IVIG-treated patients compared to the 20 matched controls.
We then went back to the patients from the randomized prospective trial and compared costs for the 13 of 16 IVIG patients and 14 of 17 of the control patients for whom data were available. Among untreated controls, we found a net cost reduction of $34,439 (55%) per case. The higher costs seen in the randomized patient cohort compared to the latter case-control group may be due to a combination of the fact that the treated patients had slightly higher comorbidity indices than the case-control group (median Charlson comorbidity index of 2 in both groups) and the fact that they were treated earlier in the pandemic (May/June 2020), as opposed to the case-control group patients, who were treated in November/December 2020.
It was notable that the cost savings across both groups were derived largely from the reduction in the approximately 20% to 25% of control patients who went on to critical illness, including mechanical ventilation, extracorporeal membrane oxygenation (ECMO), and prolonged ICU stays. Indeed, 8 of 34 of the control patients—but none of the 23 IVIG-treated patients—generated hospital costs in excess of $80,000, a difference that was statistically significant even for such a small sample size. Therefore, reducing these very costly outlier events translated into net savings across the board.
In addition to lowering costs, reducing progression to critical illness is extremely important during heavy waves of COVID-19, when the sheer volume of patients results in severe strain due to the relative scarcity of ICU beds, mechanical ventilators, and ECMO. Therefore, reducing the need for these resources would have a vital role that cannot be measured economically.
The major limitations of this study include the small sample size and the potential lack of generalizability of these results to all hospital centers and treating providers. Our group has considerable experience in IVIG utilization in COVID-19 and, as a result, has identified a “sweet spot,” where benefits were seen clinically and economically. However, it remains to be determined whether IVIG will benefit patients with greater illness severity, such as those in the ICU, on mechanical ventilation, or ECMO. Furthermore, while a significant morbidity and mortality burden of COVID-19 rests in extremely elderly patients and those with end-organ comorbidities such as renal failure and heart failure, it is uncertain whether their COVID-19 adverse outcomes can be improved with IVIG or other therapies. We believe such patients may limit the pharmacoeconomic value of IVIG due to their generally poorer prognosis, regardless of intervention. On the other hand, COVID-19 patients who are not that severely ill, with minimal to no hypoxia, generally will do well regardless of therapy. Therefore, IVIG intervention may be an unnecessary treatment expense. Evidence for this was suggested in our pilot trial10 and supported in a recent meta-analysis of IVIG therapy in COVID-19.19
Several other therapeutic options with high acquisition costs have seen an increase in use during the COVID-19 pandemic despite relatively lukewarm data. Remdesivir, the first drug found to have a beneficial effect on hospitalized patients with COVID-19, is priced at $3120 for a complete 5-day treatment course in the United States. This was in line with initial pricing models from the Institute for Clinical and Economic Review (ICER) in May 2020, assuming a mortality benefit with remdesivir use. After the SOLIDARITY trial was published, which showed no mortality benefit associated with remdesivir, ICER updated their pricing models in June 2020 and released a statement that the price of remdesivir was too high to align with demonstrated benefits.20,21 More recent data demonstrate that remdesivir may be beneficial, but only if administered to patients with fewer than 6 days of symptoms.22 However, only a minority of patients present to the hospital early enough in their illness for remdesivir to be beneficial.22
Tocilizumab, an interleukin-6 inhibitor, saw an increase in use during the pandemic. An 800-mg treatment course for COVID-19 costs $3584. The efficacy of this treatment option came into question after the COVACTA trial failed to show a difference in clinical status or mortality in COVID-19 patients who received tocilizumab vs placebo.23,24 A more recent study pointed to a survival benefit of tocilizumab in COVID-19, driven by a very large sample size (>4000), yielding statistically significant, but perhaps clinically less significant, effects on survival.25 This latter study points to the extremely large sample sizes required to capture statistically significant benefits of expensive interventions in COVID-19, which our data demonstrate may benefit only a fraction of patients (20%-25% of patients in the case of IVIG). A more granular clinical assessment of these other interventions is needed to be able to capture the patient subtypes where tocilizumab, remdesivir, and other therapies will be cost effective in the treatment of COVID-19 or other virally mediated cases of ARDS.
Conclusion
While IVIG has a high acquisition cost, the drug’s use in hypoxic COVID-19 patients resulted in reduced costs per COVID-19 case of approximately 50% and use of less critical care resources. The difference was consistent between 2 cohorts (randomized trial vs off-label use in prespecified COVID-19 patient types), IVIG products used (Octagam 10% and Privigen), and time period in the pandemic (waves 1 and 2 in May/June 2020 vs wave 3 in November/December 2020), thereby adjusting for potential differences in circulating viral strains. Furthermore, patients from both groups predated SARS-CoV-2 vaccine availability and major circulating viral variants (eg, delta, omicron), thereby eliminating confounding on outcomes posed by these factors. Control patients’ higher costs of care were driven largely by the approximately 25% of patients who required costly hospital critical care resources, a group mitigated by IVIG. When allocated to the appropriate patient type (patients with moderate-to-severe but not critical illness, <age 70 without preexisting comorbidities of end-organ failure or active cancer), IVIG can reduce hospital costs for COVID-19 care. Identification of specific patient populations where IVIG has the most anticipated benefits in viral illness is needed.
Corresponding author: George Sakoulas, MD, Sharp Rees-Stealy Medical Group, 2020 Genesee Avenue, 2nd Floor, San Diego, CA 92123; [email protected]
Disclosures: Dr Sakoulas has worked as a consultant for Abbvie, Paratek, and Octapharma, has served as a speaker for Abbvie and Paratek, and has received research funding from Octapharma. The other authors did not report any disclosures.
1. Galeotti C, Kaveri SV, Bayry J. IVIG-mediated effector functions in autoimmune and inflammatory diseases. Int Immunol. 2017;29(11):491-498. doi:10.1093/intimm/dxx039
2. Verdoni L, Mazza A, Gervasoni A, et al. An outbreak of severe Kawasaki-like disease at the Italian epicentre of the SARS-CoV-2 epidemic: an observational cohort study. Lancet. 2020;395(10239):1771-1778. doi:10.1016/S0140-6736(20)31103-X
3. Belhadjer Z, Méot M, Bajolle F, et al. Acute heart failure in multisystem inflammatory syndrome in children in the context of global SARS-CoV-2 pandemic. Circulation. 2020;142(5):429-436. doi:10.1161/CIRCULATIONAHA.120.048360
4. Shao Z, Feng Y, Zhong L, et al. Clinical efficacy of intravenous immunoglobulin therapy in critical ill patients with COVID-19: a multicenter retrospective cohort study. Clin Transl Immunology. 2020;9(10):e1192. doi:10.1002/cti2.1192
5. Xie Y, Cao S, Dong H, et al. Effect of regular intravenous immunoglobulin therapy on prognosis of severe pneumonia in patients with COVID-19. J Infect. 2020;81(2):318-356. doi:10.1016/j.jinf.2020.03.044
6. Zhou ZG, Xie SM, Zhang J, et al. Short-term moderate-dose corticosteroid plus immunoglobulin effectively reverses COVID-19 patients who have failed low-dose therapy. Preprints. 2020:2020030065. doi:10.20944/preprints202003.0065.v1
7. Cao W, Liu X, Bai T, et al. High-dose intravenous immunoglobulin as a therapeutic option for deteriorating patients with coronavirus disease 2019. Open Forum Infect Dis. 2020;7(3):ofaa102. doi:10.1093/ofid/ofaa102
8. Cao W, Liu X, Hong K, et al. High-dose intravenous immunoglobulin in severe coronavirus disease 2019: a multicenter retrospective study in China. Front Immunol. 2021;12:627844. doi:10.3389/fimmu.2021.627844
9. Gharebaghi N, Nejadrahim R, Mousavi SJ, Sadat-Ebrahimi SR, Hajizadeh R. The use of intravenous immunoglobulin gamma for the treatment of severe coronavirus disease 2019: a randomized placebo-controlled double-blind clinical trial. BMC Infect Dis. 2020;20(1):786. doi:10.1186/s12879-020-05507-4
10. Sakoulas G, Geriak M, Kullar R, et al. Intravenous immunoglobulin plus methylprednisolone mitigate respiratory morbidity in coronavirus disease 2019. Crit Care Explor. 2020;2(11):e0280. doi:10.1097/CCE.0000000000000280
11. Raman RS, Bhagwan Barge V, Anil Kumar D, et al. A phase II safety and efficacy study on prognosis of moderate pneumonia in coronavirus disease 2019 patients with regular intravenous immunoglobulin therapy. J Infect Dis. 2021;223(9):1538-1543. doi:10.1093/infdis/jiab098
12. Mazeraud A, Jamme M, Mancusi RL, et al. Intravenous immunoglobulins in patients with COVID-19-associated moderate-to-severe acute respiratory distress syndrome (ICAR): multicentre, double-blind, placebo-controlled, phase 3 trial. Lancet Respir Med. 2022;10(2):158-166. doi:10.1016/S2213-2600(21)00440-9
13. Kindgen-Milles D, Feldt T, Jensen BEO, Dimski T, Brandenburger T. Why the application of IVIG might be beneficial in patients with COVID-19. Lancet Respir Med. 2022;10(2):e15. doi:10.1016/S2213-2600(21)00549-X
14. Wilfong EM, Matthay MA. Intravenous immunoglobulin therapy for COVID-19 ARDS. Lancet Respir Med. 2022;10(2):123-125. doi:10.1016/S2213-2600(21)00450-1
15. Bazell C, Kramer M, Mraz M, Silseth S. How much are hospitals paid for inpatient COVID-19 treatment? June 2020. https://us.milliman.com/-/media/milliman/pdfs/articles/how-much-hospitals-paid-for-inpatient-covid19-treatment.ashx
16. Liu X, Cao W, Li T. High-dose intravenous immunoglobulins in the treatment of severe acute viral pneumonia: the known mechanisms and clinical effects. Front Immunol. 2020;11:1660. doi:10.3389/fimmu.2020.01660
17. Danieli MG, Piga MA, Paladini A, et al. Intravenous immunoglobulin as an important adjunct in prevention and therapy of coronavirus 19 disease. Scand J Immunol. 2021;94(5):e13101. doi:10.1111/sji.13101
18. Starshinova A, Malkova A, Zinchenko U, et al. Efficacy of different types of therapy for COVID-19: a comprehensive review. Life (Basel). 2021;11(8):753. doi:10.3390/life11080753
19. Xiang HR, Cheng X, Li Y, Luo WW, Zhang QZ, Peng WX. Efficacy of IVIG (intravenous immunoglobulin) for corona virus disease 2019 (COVID-19): a meta-analysis. Int Immunopharmacol. 2021;96:107732. doi:10.1016/j.intimp.2021.107732
20. ICER’s second update to pricing models of remdesivir for COVID-19. PharmacoEcon Outcomes News. 2020;867(1):2. doi:10.1007/s40274-020-7299-y
21. Pan H, Peto R, Henao-Restrepo AM, et al. Repurposed antiviral drugs for Covid-19—interim WHO solidarity trial results. N Engl J Med. 2021;384(6):497-511. doi:10.1056/NEJMoa2023184
22. Garcia-Vidal C, Alonso R, Camon AM, et al. Impact of remdesivir according to the pre-admission symptom duration in patients with COVID-19. J Antimicrob Chemother. 2021;76(12):3296-3302. doi:10.1093/jac/dkab321
23. Golimumab (Simponi) IV: In combination with methotrexate (MTX) for the treatment of adult patients with moderately to severely active rheumatoid arthritis [Internet]. Canadian Agency for Drugs and Technologies in Health; 2015. Table 1: Cost comparison table for biologic disease-modifying antirheumatic drugs. https://www.ncbi.nlm.nih.gov/books/NBK349397/table/T34/
24. Rosas IO, Bräu N, Waters M, et al. Tocilizumab in hospitalized patients with severe Covid-19 pneumonia. N Engl J Med. 2021;384(16):1503-1516. doi:10.1056/NEJMoa2028700
25. RECOVERY Collaborative Group. Tocilizumab in patients admitted to hospital with COVID-19 (RECOVERY): a randomised, controlled, open-label, platform trial. Lancet. 2021;397(10285):1637-1645. doi:10.1016/S0140-6736(21)00676-0
Coronary CT Angiography Compared to Coronary Angiography or Standard of Care in Patients With Intermediate-Risk Stable Chest Pain
Study 1 Overview (SCOT-HEART Investigators)
Objective: To assess cardiovascular mortality and nonfatal myocardial infarction at 5 years in patients with stable chest pain referred to cardiology clinic for management with either standard care plus computed tomography angiography (CTA) or standard care alone.
Design: Multicenter, randomized, open-label prospective study.
Setting and participants: A total of 4146 patients with stable chest pain were randomized to standard care or standard care plus CTA at 12 centers across Scotland and were followed for 5 years.
Main outcome measures: The primary end point was a composite of death from coronary heart disease or nonfatal myocardial infarction. Main secondary end points were nonfatal myocardial infarction, nonfatal stroke, and frequency of invasive coronary angiography (ICA) and coronary revascularization with percutaneous coronary intervention or coronary artery bypass grafting.
Main results: The primary outcome including the composite of cardiovascular death or nonfatal myocardial infarction was lower in the CTA group than in the standard-care group at 2.3% (48 of 2073 patients) vs 3.9% (81 of 2073 patients), respectively (hazard ratio, 0.59; 95% CI, 0.41-0.84; P = .004). Although there was a higher rate of ICA and coronary revascularization in the CTA group than in the standard-care group in the first few months of follow-up, the overall rates were similar at 5 years, with ICA performed in 491 patients and 502 patients in the CTA vs standard-care groups, respectively (hazard ratio, 1.00; 95% CI, 0.88-1.13). Similarly, coronary revascularization was performed in 279 patients in the CTA group and in 267 patients in the standard-care group (hazard ratio, 1.07; 95% CI, 0.91-1.27). There were, however, more preventive therapies initiated in patients in the CTA group than in the standard-care group (odds ratio, 1.40; 95% CI, 1.19-1.65).
Conclusion: In patients with stable chest pain, the use of CTA in addition to standard care resulted in a significantly lower rate of death from coronary heart disease or nonfatal myocardial infarction at 5 years; the main contributor to this outcome was a reduced nonfatal myocardial infarction rate. There was no difference in the rate of coronary angiography or coronary revascularization between the 2 groups at 5 years.
Study 2 Overview (DISCHARGE Trial Group)
Objective: To compare the effectiveness of computed tomography (CT) with ICA as a diagnostic tool in patients with stable chest pain and intermediate pretest probability of coronary artery disease (CAD).
Design: Multicenter, randomized, assessor-blinded pragmatic prospective study.
Setting and participants: A total of 3667 patients with stable chest pain and intermediate pretest probability of CAD were enrolled at 26 centers and randomized into CT or ICA groups. Only 3561 patients were included in the modified intention-to-treat analysis, with 1808 patients and 1753 patients in the CT and ICA groups, respectively.
Main outcome measures: The primary outcome was a composite of cardiovascular death, nonfatal myocardial infarction, and nonfatal stroke over 3.5 years. The main secondary outcomes were major procedure-related complications and patient-reported angina pectoris during the last 4 weeks of follow up.
Main results: The primary outcome occurred in 38 of 1808 patients (2.1%) in the CT group and in 52 of 1753 patients (3.0%) in the ICA group (hazard ratio, 0.70; 95% CI, 0.46-1.07; P = .10). The secondary outcomes showed that major procedure-related complications occurred in 9 patients (0.5%) in the CT group and in 33 patients (1.9%) in the ICA group (hazard ratio, 0.26; 95% CI, 0.13-0.55). Rates of patient-reported angina in the final 4 weeks of follow-up were 8.8% in the CT group and 7.5% in the ICA group (odds ratio, 1.17; 95% CI, 0.92-1.48).
Conclusion: Risk of major adverse cardiovascular events from the primary outcome were similar in both the CT and ICA groups among patients with stable chest pain and intermediate pretest probability of CAD. Patients referred for CT had a lower rate of coronary angiography leading to fewer major procedure-related complications in these patients than in those referred for ICA.
Commentary
Evaluation and treatment of obstructive atherosclerosis is an important part of clinical care in patients presenting with angina symptoms.1 Thus, the initial investigation for patients with suspected obstructive CAD includes ruling out acute coronary syndrome and assessing quality of life.1 The diagnostic test should be tailored to the pretest probability for the diagnosis of obstructive CAD.2
In the United States, stress testing traditionally has been used for the initial assessment in patients with suspected CAD,3 but recently CTA has been utilized more frequently for this purpose. Compared to a stress test, which often helps identify and assess ischemia, CTA can provide anatomical assessment, with higher sensitivity to identify CAD.4 Furthermore, it can distinguish nonobstructive plaques that can be challenging to identify with stress test alone.
Whether CTA is superior to stress testing as the initial assessment for CAD has been debated. The randomized PROMISE trial compared patients with stable angina who underwent functional stress testing or CTA as an initial strategy.5 They reported a similar outcome between the 2 groups at a median follow-up of 2 years. However, in the original SCOT-HEART trial (CT coronary angiography in patients with suspected angina due to coronary heart disease), which was published in the same year as the PROMISE trial, the patients who underwent initial assessment with CTA had a numerically lower composite end point of cardiac death and myocardial infarction at a median follow-up of 1.7 years (1.3% vs 2.0%, P = .053).6
Given this result, the SCOT-HEART investigators extended the follow-up to evaluate the composite end point of death from coronary heart disease or nonfatal myocardial infarction at 5 years.7 This trial enrolled patients who were initially referred to a cardiology clinic for evaluation of chest pain, and they were randomized to standard care plus CTA or standard care alone. At a median duration of 4.8 years, the primary outcome was lower in the CTA group (2.3%, 48 patients) than in the standard-care group (3.9%, 81 patients) (hazard ratio, 0.58; 95% CI, 0.41-0.84; P = .004). Both groups had similar rates of invasive coronary angiography and had similar coronary revascularization rates.
It is hypothesized that this lower rate of nonfatal myocardial infarction in patients with CTA plus standard care is associated with a higher rate of preventive therapies initiated in patients in the CTA-plus-standard-care group compared to standard care alone. However, the difference in the standard-care group should be noted when compared to the PROMISE trial. In the PROMISE trial, the comparator group had predominantly stress imaging (either nuclear stress test or echocardiography), while in the SCOT-HEART trial, the group had predominantly stress electrocardiogram (ECG), and only 10% of the patients underwent stress imaging. It is possible the difference seen in the rate of nonfatal myocardial infarction was due to suboptimal diagnosis of CAD with stress ECG, which has lower sensitivity compared to stress imaging.
The DISCHARGE trial investigated the effectiveness of CTA vs ICA as the initial diagnostic test in the management of patients with stable chest pain and an intermediate pretest probability of obstructive CAD.8 At 3.5 years of follow-up, the primary composite of cardiovascular death, myocardial infarction, or stroke was similar in both groups (2.1% vs 3.0; hazard ratio, 0.70; 95% CI, 0.46-1.07; P = .10). Importantly, as fewer patients underwent ICA, the risk of procedure-related complication was lower in the CTA group than in the ICA group. However, it is important to note that only 25% of the patients diagnosed with obstructive CAD had greater than 50% vessel stenosis, which raises the question of whether an initial invasive strategy is appropriate for this population.
The strengths of these 2 studies include the large number of patients enrolled along with adequate follow-up, 5 years in the SCOT-HEART trial and 3.5 years in the DISCHARGE trial. The 2 studies overall suggest the usefulness of CTA for assessment of CAD. However, the control groups were very different in these 2 trials. In the SCOT-HEART study, the comparator group was primarily assessed by stress ECG, while in the DISCHARGE study, the comparator group was primary assessed by ICA. In the PROMISE trial, the composite end point of death, myocardial infarction, hospitalization for unstable angina, or major procedural complication was similar when the strategy of initial CTA was compared to functional testing with imaging (exercise ECG, nuclear stress testing, or echocardiography).5 Thus, clinical assessment is still needed when clinicians are selecting the appropriate diagnostic test for patients with suspected CAD. The most recent guidelines give similar recommendations for CTA compared to stress imaging.9 Whether further improvement in CTA acquisition or the addition of CT fractional flow reserve can further improve outcomes requires additional study.
Applications for Clinical Practice and System Implementation
In patients with stable chest pain and intermediate pretest probability of CAD, CTA is useful in diagnosis compared to stress ECG and in reducing utilization of low-yield ICA. Whether CTA is more useful compared to the other noninvasive stress imaging modalities in this population requires further study.
Practice Points
- In patients with stable chest pain and intermediate pretest probability of CAD, CTA is useful compared to stress ECG.
- Use of CTA can potentially reduce the use of low-yield coronary angiography.
–Thai Nguyen, MD, Albert Chan, MD, Taishi Hirai, MD
University of Missouri, Columbia, MO
1. Knuuti J, Wijns W, Saraste A, et al. 2019 ESC Guidelines for the diagnosis and management of chronic coronary syndromes. Eur Heart J. 2020;41(3):407-477. doi:10.1093/eurheartj/ehz425
2. Nakano S, Kohsaka S, Chikamori T et al. JCS 2022 guideline focused update on diagnosis and treatment in patients with stable coronary artery disease. Circ J. 2022;86(5):882-915. doi:10.1253/circj.CJ-21-1041.
3. Fihn SD, Gardin JM, Abrams J, et al. 2012 ACCF/AHA/ACP/AATS/PCNA/SCAI/STS Guideline for the diagnosis and management of patients with stable ischemic heart disease: a report of the American College of Cardiology Foundation/American Heart Association Task Force on Practice Guidelines, and the American College of Physicians, American Association for Thoracic Surgery, Preventive Cardiovascular Nurses Association, Society for Cardiovascular Angiography and Interventions, and Society of Thoracic Surgeons. J Am Coll Cardiol. 2012;60(24):e44-e164. doi:10.1016/j.jacc.2012.07.013
4. Arbab-Zadeh A, Di Carli MF, Cerci R, et al. Accuracy of computed tomographic angiography and single-photon emission computed tomography-acquired myocardial perfusion imaging for the diagnosis of coronary artery disease. Circ Cardiovasc Imaging. 2015;8(10):e003533. doi:10.1161/CIRCIMAGING
5. Douglas PS, Hoffmann U, Patel MR, et al. Outcomes of anatomical versus functional testing for coronary artery disease. N Engl J Med. 2015;372(14):1291-300. doi:10.1056/NEJMoa1415516
6. SCOT-HEART investigators. CT coronary angiography in patients with suspected angina due to coronary heart disease (SCOT-HEART): an open-label, parallel-group, multicentre trial. Lancet. 2015;385:2383-2391. doi:10.1016/S0140-6736(15)60291-4
7. SCOT-HEART Investigators, Newby DE, Adamson PD, et al. Coronary CT angiography and 5-year risk of myocardial infarction. N Engl J Med. 2018;379(10):924-933. doi:10.1056/NEJMoa1805971
8. DISCHARGE Trial Group, Maurovich-Horvat P, Bosserdt M, et al. CT or invasive coronary angiography in stable chest pain. N Engl J Med. 2022;386(17):1591-1602. doi:10.1056/NEJMoa2200963
9. Writing Committee Members, Lawton JS, Tamis-Holland JE, et al. 2021 ACC/AHA/SCAI guideline for coronary artery revascularization: a report of the American College of Cardiology/American Heart Association Joint Committee on Clinical Practice Guidelines. J Am Coll Cardiol. 2022;79(2):e21-e129. doi:10.1016/j.jacc.2021.09.006
Study 1 Overview (SCOT-HEART Investigators)
Objective: To assess cardiovascular mortality and nonfatal myocardial infarction at 5 years in patients with stable chest pain referred to cardiology clinic for management with either standard care plus computed tomography angiography (CTA) or standard care alone.
Design: Multicenter, randomized, open-label prospective study.
Setting and participants: A total of 4146 patients with stable chest pain were randomized to standard care or standard care plus CTA at 12 centers across Scotland and were followed for 5 years.
Main outcome measures: The primary end point was a composite of death from coronary heart disease or nonfatal myocardial infarction. Main secondary end points were nonfatal myocardial infarction, nonfatal stroke, and frequency of invasive coronary angiography (ICA) and coronary revascularization with percutaneous coronary intervention or coronary artery bypass grafting.
Main results: The primary outcome including the composite of cardiovascular death or nonfatal myocardial infarction was lower in the CTA group than in the standard-care group at 2.3% (48 of 2073 patients) vs 3.9% (81 of 2073 patients), respectively (hazard ratio, 0.59; 95% CI, 0.41-0.84; P = .004). Although there was a higher rate of ICA and coronary revascularization in the CTA group than in the standard-care group in the first few months of follow-up, the overall rates were similar at 5 years, with ICA performed in 491 patients and 502 patients in the CTA vs standard-care groups, respectively (hazard ratio, 1.00; 95% CI, 0.88-1.13). Similarly, coronary revascularization was performed in 279 patients in the CTA group and in 267 patients in the standard-care group (hazard ratio, 1.07; 95% CI, 0.91-1.27). There were, however, more preventive therapies initiated in patients in the CTA group than in the standard-care group (odds ratio, 1.40; 95% CI, 1.19-1.65).
Conclusion: In patients with stable chest pain, the use of CTA in addition to standard care resulted in a significantly lower rate of death from coronary heart disease or nonfatal myocardial infarction at 5 years; the main contributor to this outcome was a reduced nonfatal myocardial infarction rate. There was no difference in the rate of coronary angiography or coronary revascularization between the 2 groups at 5 years.
Study 2 Overview (DISCHARGE Trial Group)
Objective: To compare the effectiveness of computed tomography (CT) with ICA as a diagnostic tool in patients with stable chest pain and intermediate pretest probability of coronary artery disease (CAD).
Design: Multicenter, randomized, assessor-blinded pragmatic prospective study.
Setting and participants: A total of 3667 patients with stable chest pain and intermediate pretest probability of CAD were enrolled at 26 centers and randomized into CT or ICA groups. Only 3561 patients were included in the modified intention-to-treat analysis, with 1808 patients and 1753 patients in the CT and ICA groups, respectively.
Main outcome measures: The primary outcome was a composite of cardiovascular death, nonfatal myocardial infarction, and nonfatal stroke over 3.5 years. The main secondary outcomes were major procedure-related complications and patient-reported angina pectoris during the last 4 weeks of follow up.
Main results: The primary outcome occurred in 38 of 1808 patients (2.1%) in the CT group and in 52 of 1753 patients (3.0%) in the ICA group (hazard ratio, 0.70; 95% CI, 0.46-1.07; P = .10). The secondary outcomes showed that major procedure-related complications occurred in 9 patients (0.5%) in the CT group and in 33 patients (1.9%) in the ICA group (hazard ratio, 0.26; 95% CI, 0.13-0.55). Rates of patient-reported angina in the final 4 weeks of follow-up were 8.8% in the CT group and 7.5% in the ICA group (odds ratio, 1.17; 95% CI, 0.92-1.48).
Conclusion: Risk of major adverse cardiovascular events from the primary outcome were similar in both the CT and ICA groups among patients with stable chest pain and intermediate pretest probability of CAD. Patients referred for CT had a lower rate of coronary angiography leading to fewer major procedure-related complications in these patients than in those referred for ICA.
Commentary
Evaluation and treatment of obstructive atherosclerosis is an important part of clinical care in patients presenting with angina symptoms.1 Thus, the initial investigation for patients with suspected obstructive CAD includes ruling out acute coronary syndrome and assessing quality of life.1 The diagnostic test should be tailored to the pretest probability for the diagnosis of obstructive CAD.2
In the United States, stress testing traditionally has been used for the initial assessment in patients with suspected CAD,3 but recently CTA has been utilized more frequently for this purpose. Compared to a stress test, which often helps identify and assess ischemia, CTA can provide anatomical assessment, with higher sensitivity to identify CAD.4 Furthermore, it can distinguish nonobstructive plaques that can be challenging to identify with stress test alone.
Whether CTA is superior to stress testing as the initial assessment for CAD has been debated. The randomized PROMISE trial compared patients with stable angina who underwent functional stress testing or CTA as an initial strategy.5 They reported a similar outcome between the 2 groups at a median follow-up of 2 years. However, in the original SCOT-HEART trial (CT coronary angiography in patients with suspected angina due to coronary heart disease), which was published in the same year as the PROMISE trial, the patients who underwent initial assessment with CTA had a numerically lower composite end point of cardiac death and myocardial infarction at a median follow-up of 1.7 years (1.3% vs 2.0%, P = .053).6
Given this result, the SCOT-HEART investigators extended the follow-up to evaluate the composite end point of death from coronary heart disease or nonfatal myocardial infarction at 5 years.7 This trial enrolled patients who were initially referred to a cardiology clinic for evaluation of chest pain, and they were randomized to standard care plus CTA or standard care alone. At a median duration of 4.8 years, the primary outcome was lower in the CTA group (2.3%, 48 patients) than in the standard-care group (3.9%, 81 patients) (hazard ratio, 0.58; 95% CI, 0.41-0.84; P = .004). Both groups had similar rates of invasive coronary angiography and had similar coronary revascularization rates.
It is hypothesized that this lower rate of nonfatal myocardial infarction in patients with CTA plus standard care is associated with a higher rate of preventive therapies initiated in patients in the CTA-plus-standard-care group compared to standard care alone. However, the difference in the standard-care group should be noted when compared to the PROMISE trial. In the PROMISE trial, the comparator group had predominantly stress imaging (either nuclear stress test or echocardiography), while in the SCOT-HEART trial, the group had predominantly stress electrocardiogram (ECG), and only 10% of the patients underwent stress imaging. It is possible the difference seen in the rate of nonfatal myocardial infarction was due to suboptimal diagnosis of CAD with stress ECG, which has lower sensitivity compared to stress imaging.
The DISCHARGE trial investigated the effectiveness of CTA vs ICA as the initial diagnostic test in the management of patients with stable chest pain and an intermediate pretest probability of obstructive CAD.8 At 3.5 years of follow-up, the primary composite of cardiovascular death, myocardial infarction, or stroke was similar in both groups (2.1% vs 3.0; hazard ratio, 0.70; 95% CI, 0.46-1.07; P = .10). Importantly, as fewer patients underwent ICA, the risk of procedure-related complication was lower in the CTA group than in the ICA group. However, it is important to note that only 25% of the patients diagnosed with obstructive CAD had greater than 50% vessel stenosis, which raises the question of whether an initial invasive strategy is appropriate for this population.
The strengths of these 2 studies include the large number of patients enrolled along with adequate follow-up, 5 years in the SCOT-HEART trial and 3.5 years in the DISCHARGE trial. The 2 studies overall suggest the usefulness of CTA for assessment of CAD. However, the control groups were very different in these 2 trials. In the SCOT-HEART study, the comparator group was primarily assessed by stress ECG, while in the DISCHARGE study, the comparator group was primary assessed by ICA. In the PROMISE trial, the composite end point of death, myocardial infarction, hospitalization for unstable angina, or major procedural complication was similar when the strategy of initial CTA was compared to functional testing with imaging (exercise ECG, nuclear stress testing, or echocardiography).5 Thus, clinical assessment is still needed when clinicians are selecting the appropriate diagnostic test for patients with suspected CAD. The most recent guidelines give similar recommendations for CTA compared to stress imaging.9 Whether further improvement in CTA acquisition or the addition of CT fractional flow reserve can further improve outcomes requires additional study.
Applications for Clinical Practice and System Implementation
In patients with stable chest pain and intermediate pretest probability of CAD, CTA is useful in diagnosis compared to stress ECG and in reducing utilization of low-yield ICA. Whether CTA is more useful compared to the other noninvasive stress imaging modalities in this population requires further study.
Practice Points
- In patients with stable chest pain and intermediate pretest probability of CAD, CTA is useful compared to stress ECG.
- Use of CTA can potentially reduce the use of low-yield coronary angiography.
–Thai Nguyen, MD, Albert Chan, MD, Taishi Hirai, MD
University of Missouri, Columbia, MO
1. Knuuti J, Wijns W, Saraste A, et al. 2019 ESC Guidelines for the diagnosis and management of chronic coronary syndromes. Eur Heart J. 2020;41(3):407-477. doi:10.1093/eurheartj/ehz425
2. Nakano S, Kohsaka S, Chikamori T et al. JCS 2022 guideline focused update on diagnosis and treatment in patients with stable coronary artery disease. Circ J. 2022;86(5):882-915. doi:10.1253/circj.CJ-21-1041.
3. Fihn SD, Gardin JM, Abrams J, et al. 2012 ACCF/AHA/ACP/AATS/PCNA/SCAI/STS Guideline for the diagnosis and management of patients with stable ischemic heart disease: a report of the American College of Cardiology Foundation/American Heart Association Task Force on Practice Guidelines, and the American College of Physicians, American Association for Thoracic Surgery, Preventive Cardiovascular Nurses Association, Society for Cardiovascular Angiography and Interventions, and Society of Thoracic Surgeons. J Am Coll Cardiol. 2012;60(24):e44-e164. doi:10.1016/j.jacc.2012.07.013
4. Arbab-Zadeh A, Di Carli MF, Cerci R, et al. Accuracy of computed tomographic angiography and single-photon emission computed tomography-acquired myocardial perfusion imaging for the diagnosis of coronary artery disease. Circ Cardiovasc Imaging. 2015;8(10):e003533. doi:10.1161/CIRCIMAGING
5. Douglas PS, Hoffmann U, Patel MR, et al. Outcomes of anatomical versus functional testing for coronary artery disease. N Engl J Med. 2015;372(14):1291-300. doi:10.1056/NEJMoa1415516
6. SCOT-HEART investigators. CT coronary angiography in patients with suspected angina due to coronary heart disease (SCOT-HEART): an open-label, parallel-group, multicentre trial. Lancet. 2015;385:2383-2391. doi:10.1016/S0140-6736(15)60291-4
7. SCOT-HEART Investigators, Newby DE, Adamson PD, et al. Coronary CT angiography and 5-year risk of myocardial infarction. N Engl J Med. 2018;379(10):924-933. doi:10.1056/NEJMoa1805971
8. DISCHARGE Trial Group, Maurovich-Horvat P, Bosserdt M, et al. CT or invasive coronary angiography in stable chest pain. N Engl J Med. 2022;386(17):1591-1602. doi:10.1056/NEJMoa2200963
9. Writing Committee Members, Lawton JS, Tamis-Holland JE, et al. 2021 ACC/AHA/SCAI guideline for coronary artery revascularization: a report of the American College of Cardiology/American Heart Association Joint Committee on Clinical Practice Guidelines. J Am Coll Cardiol. 2022;79(2):e21-e129. doi:10.1016/j.jacc.2021.09.006
Surgery handoffs still a risky juncture in care – but increasing communication can help
It involved a 70-year-old man who had a history of prostate cancer, obstructive sleep apnea, and hernias. In January, he had a surgery for hernia repair. On the 3rd day after the procedure, he was transferred to the hospital medicine service at about 9 p.m. and was on a patient-controlled pump for pain and had abdominal drains. Because of the extensive surgery and because he had begun to walk shortly after the procedure, he wasn’t on thrombosis prevention medication, Dr. Merli explained at the annual meeting of the American College of Physicians.

The day after his transfer he was walking with a physical therapist when he became short of breath, his oxygen saturation dropped, and his heart rate soared. Bilateral pulmonary emboli were found, along with thrombosis in the right leg.
What was remarkable, Dr. Merli noted, was what the patient’s medical record was lacking.
He added, “I think if we start looking at this at our sites, we may find out that communication needs to be improved, and I believe standardized.”
This situation underscores the continuing need to refine handoffs between surgery and hospital medicine, a point in care that is primed for potential errors, the other panelists noted during the session.
Most important information is often not communicated
A 2010 study in pediatrics that looked at intern-to-intern handoffs found that the most important piece of information wasn’t communicated successfully 60% of the time – in other words, more often than not, the person on the receiving end didn’t really understand that crucial part of the scenario. Since then, the literature has been regularly populated with studies attempting to refine handoff procedures.
Lily Ackermann, MD, hospitalist and clinical associate professor of medicine at Jefferson, said in the session that hospitalists need to be sure to reach out to surgery at important junctures in care.
“I would say the No. 1 biggest mistake we make is not calling the surgery attending directly when clinical questions arise,” she said. “I think this is very important – attending [physician in hospital medicine] to attending [physician in surgery].”
Murray Cohen, MD, director of acute care surgery at Jefferson, said he shared that concern.
“We want to be called, we want to be called for our patients,” he said in the session. “And we’re upset when you don’t call for our patients.”
Hospitalists should discuss blood loss, pain management, management of drains, deep vein thrombosis prevention, nutrition, infectious disease concerns, and timing of vaccines post procedure, Dr. Ackermann said during the presentation,
The panelists also emphasized that understanding the follow-up care that surgery was planning after a procedure is important, and to not just expect surgeons to actively follow a patient. They also reminded hospitalists to look at the wounds and make sure they understand how to handle the wounds going forward. Plus, when transferring a patient to surgery, hospitalists should understand when getting someone to surgery is urgent and not to order unnecessary tests as a formality when time is of the essence, they said.
IPASS: a formalized handoff process
The panelists all spoke highly of a formalized handoff process known as IPASS. This acronym reminds physicians to ask specific questions.
The I represents illness severity and calls for asking: “Is the patient stable or unstable?
The P stands for patient summary and is meant to prompt physicians to seek details about the procedure.
The A is for action list, which is meant to remind the physician to get the post-op plan for neurological, cardiovascular, gastrointestinal, and other areas.
The first S is for situational awareness, and calls for asking: What is the biggest concern over the next 24 hours?
The final S represents synthesis by the receiver, prompting a physician to summarize the information he or she has received about the patient.
Natalie Margules, MD, a clinical instructor and hospitalist at Jefferson who did not present in the session, reiterated the value of the IPASS system. Before it was used for handoffs, she said, “I was never taught anything formalized – basically, just ‘Tell them what’s important.’
Dr. Margules noted that she considers the framework’s call for the synthesis to be one of it most useful parts.
Dr. Merli, Dr. Ackermann, and Dr. Cohen reported no relevant financial disclosures.
It involved a 70-year-old man who had a history of prostate cancer, obstructive sleep apnea, and hernias. In January, he had a surgery for hernia repair. On the 3rd day after the procedure, he was transferred to the hospital medicine service at about 9 p.m. and was on a patient-controlled pump for pain and had abdominal drains. Because of the extensive surgery and because he had begun to walk shortly after the procedure, he wasn’t on thrombosis prevention medication, Dr. Merli explained at the annual meeting of the American College of Physicians.
The day after his transfer he was walking with a physical therapist when he became short of breath, his oxygen saturation dropped, and his heart rate soared. Bilateral pulmonary emboli were found, along with thrombosis in the right leg.
What was remarkable, Dr. Merli noted, was what the patient’s medical record was lacking.
He added, “I think if we start looking at this at our sites, we may find out that communication needs to be improved, and I believe standardized.”
This situation underscores the continuing need to refine handoffs between surgery and hospital medicine, a point in care that is primed for potential errors, the other panelists noted during the session.
Most important information is often not communicated
A 2010 study in pediatrics that looked at intern-to-intern handoffs found that the most important piece of information wasn’t communicated successfully 60% of the time – in other words, more often than not, the person on the receiving end didn’t really understand that crucial part of the scenario. Since then, the literature has been regularly populated with studies attempting to refine handoff procedures.
Lily Ackermann, MD, hospitalist and clinical associate professor of medicine at Jefferson, said in the session that hospitalists need to be sure to reach out to surgery at important junctures in care.
“I would say the No. 1 biggest mistake we make is not calling the surgery attending directly when clinical questions arise,” she said. “I think this is very important – attending [physician in hospital medicine] to attending [physician in surgery].”
Murray Cohen, MD, director of acute care surgery at Jefferson, said he shared that concern.
“We want to be called, we want to be called for our patients,” he said in the session. “And we’re upset when you don’t call for our patients.”
Hospitalists should discuss blood loss, pain management, management of drains, deep vein thrombosis prevention, nutrition, infectious disease concerns, and timing of vaccines post procedure, Dr. Ackermann said during the presentation,
The panelists also emphasized that understanding the follow-up care that surgery was planning after a procedure is important, and to not just expect surgeons to actively follow a patient. They also reminded hospitalists to look at the wounds and make sure they understand how to handle the wounds going forward. Plus, when transferring a patient to surgery, hospitalists should understand when getting someone to surgery is urgent and not to order unnecessary tests as a formality when time is of the essence, they said.
IPASS: a formalized handoff process
The panelists all spoke highly of a formalized handoff process known as IPASS. This acronym reminds physicians to ask specific questions.
The I represents illness severity and calls for asking: “Is the patient stable or unstable?
The P stands for patient summary and is meant to prompt physicians to seek details about the procedure.
The A is for action list, which is meant to remind the physician to get the post-op plan for neurological, cardiovascular, gastrointestinal, and other areas.
The first S is for situational awareness, and calls for asking: What is the biggest concern over the next 24 hours?
The final S represents synthesis by the receiver, prompting a physician to summarize the information he or she has received about the patient.
Natalie Margules, MD, a clinical instructor and hospitalist at Jefferson who did not present in the session, reiterated the value of the IPASS system. Before it was used for handoffs, she said, “I was never taught anything formalized – basically, just ‘Tell them what’s important.’
Dr. Margules noted that she considers the framework’s call for the synthesis to be one of it most useful parts.
Dr. Merli, Dr. Ackermann, and Dr. Cohen reported no relevant financial disclosures.
AT INTERNAL MEDICINE 2022
TAVI device shows less deterioration than surgery 5 years out
Structural aortic valve deterioration (SVD) at 5 years is lower following repair with a contemporary transcatheter implantation (TAVI) device than with surgery, according to a pooled analysis of major trials.
For healthier patients with a relatively long life expectancy, this is important information for deciding whether to undergo TAVI or surgical aortic valve repair (SAVR), Michael J. Reardon, MD, said at the annual scientific sessions of the American College of Cardiology.

“Every week I get this question about which repair is more durable,” said Dr. Reardon, whose study was not only designed to compare device deterioration but to evaluate the effect of SVD on major outcomes.
In this analysis, the rates of SVD were compared for the self-expanding supra-annular CoreValve Evolut device and SAVR. The SVD curves separated within the first year. At 5 years, the differences were highly significant favoring TAVI (2.57% vs. 4.38%; P = .0095).
As part of this analysis, the impact of SVD was also assessed independent of type of repair. At 5 years, those with SVD relative to those without had an approximately twofold increase in all-cause mortality, cardiovascular mortality, and hospitalization of aortic valve worsening. These risks were elevated regardless of type of valve repair.
The data presented by Dr. Reardon can be considered device specific. The earlier PARTNER 2A study comparing older- and newer-generation TAVI devices with SAVR produced a different result. When a second-generation balloon-expandable SAPIEN XT device and a third-generation SAPIEN 3 device were compared with surgery, neither device achieved lower SVD rates relative to SAVR.
In PARTNER 2A, the SVD rate for the older device was nearly three times greater than SAVR (1.61 vs. 0.58 per 100 patient-years). The numerically higher SVD rates for the newer device (0.68 vs. 0.58 per 100 patient-years) was not statistically different, but the TAVI device was not superior.
More than 4,000 patients evaluated at 5 years
In the analysis presented by Dr. Reardon, data were pooled from the randomized CoreValve U.S. High-Risk Pivotal Trial and the SURTAVI Intermediate Risk Trial. Together, these studies randomized 971 patients to surgery and 1,128 patients to TAVI. Data on an additional 2,663 patients treated with the Evolut valve in two registries were added to the randomized trial data, providing data on 4,762 total patients with 5-year follow-up.
SVD was defined by two criteria. The first was a mean gradient increase of at least 10 mm Hg plus a mean overall gradient of at least 20 mm Hg as measured with echocardiography and assessed, when possible, by an independent core laboratory. The second was new-onset or increased intraprosthetic aortic regurgitation of at least moderate severity.
When graphed over time, the SVD curves separated in favor of TAVI after about 6 months of follow-up. The shape of the curves also differed. Unlike the steady rise in SVD observed in the surgery group, the SVD rate in the TAVI group remained below 1% for almost 4 years before beginning to climb.
There was greater relative benefit for the TAVI device in patients with annular diameters of 23 mm or less. Unlike the rise in SVD rates that began about 6 months after SAVR, the SVD rates in the TAVI patients remained at 0% for more than 2 years. At 5 years, the differences remained significant favoring TAVI (1.39% vs. 5.86%; P = .049).
In those with larger annular diameters, there was still a consistently lower SVD rate over time for TAVI relative to SAVR, but the trend for an advantage at 5 years fell just short of significance (2.48% vs. 3.96%; P = .067).
SVD linked to doubling of mortality
SVD worsened outcomes. When all data surgery and TAVI data were pooled, the hazard ratios corresponded with about a doubling of risk for major adverse outcomes, including all-cause mortality (HR, 1.98; P < .001), cardiovascular mortality (HR, 1.82; P = .008), and hospitalization for aortic valve disease or worsening heart failure (HR, 2.11; P = .01). The relative risks were similar in the two treatment groups, including the risk of all-cause mortality (HR, 2.24; P < .001 for TAVI vs. HR, 2.45; P = .002 for SAVR).
The predictors for SVD on multivariate analysis included female sex, increased body surface area, prior percutaneous coronary intervention, and a prior diagnosis of atrial fibrillation.
Design improvements in TAVI devices are likely to explain these results, said Dr. Reardon, chair of cardiovascular research at Houston Methodist Hospital.
“The CoreValve/Evolut supra-annular, self-expanding bioprosthesis is the first and only transcatheter bioprosthesis to demonstrate lower rates of SVD, compared with surgery,” Dr. Reardon said.
This analysis validated the risks posed by the definition of SVD applied in this study, which appears to be a practical tool for tracking valve function and patient risk. Dr. Reardon also said that the study confirms the value of serial Doppler transthoracic echocardiography as a tool for monitoring SVD.
Several experts agreed that this is important new information.
“This is a remarkable series of findings,” said James McClurken, MD, who is a cardiovascular surgeon affiliated with Temple University, Philadelphia, and practices in Doylestown, Penn. By both demonstrating the prognostic importance of SVD and showing differences between the study device and SAVR, this trial will yield practical data to inform patients about relative risks and benefits.

Athena Poppas, MD, the new president of the ACC and a professor of medicine at Brown University, Providence, R.I., called this study “practice changing” for the same reasons. She also thinks it has valuable data for guiding choice of intervention.
Overall, the data are likely to change thinking about the role of TAVI and surgery in younger, fit patients, according to Megan Coylewright, MD, chief of cardiology at Erlanger Cardiology, Chattanooga, Tenn.
“There are patients [in need of aortic valve repair] with a long life expectancy who have been told you have to have a surgical repair because we know they last longer,” she said. Although she said that relative outcomes after longer follow-up remain unknown, “I think this does throw that comment into question.”
Dr. Reardon has financial relationships with Abbott, Boston Scientific, Medtronic, and Gore Medical. Dr. Poppas and McClurken reported no potential financial conflicts of interest. Dr. Coylewright reported financial relationships with Abbott, Alleviant, Boston Scientific, Cardiosmart, Edwards Lifesciences, Medtronic, and Occlutech. The study received financial support from Medtronic.
Structural aortic valve deterioration (SVD) at 5 years is lower following repair with a contemporary transcatheter implantation (TAVI) device than with surgery, according to a pooled analysis of major trials.
For healthier patients with a relatively long life expectancy, this is important information for deciding whether to undergo TAVI or surgical aortic valve repair (SAVR), Michael J. Reardon, MD, said at the annual scientific sessions of the American College of Cardiology.
“Every week I get this question about which repair is more durable,” said Dr. Reardon, whose study was not only designed to compare device deterioration but to evaluate the effect of SVD on major outcomes.
In this analysis, the rates of SVD were compared for the self-expanding supra-annular CoreValve Evolut device and SAVR. The SVD curves separated within the first year. At 5 years, the differences were highly significant favoring TAVI (2.57% vs. 4.38%; P = .0095).
As part of this analysis, the impact of SVD was also assessed independent of type of repair. At 5 years, those with SVD relative to those without had an approximately twofold increase in all-cause mortality, cardiovascular mortality, and hospitalization of aortic valve worsening. These risks were elevated regardless of type of valve repair.
The data presented by Dr. Reardon can be considered device specific. The earlier PARTNER 2A study comparing older- and newer-generation TAVI devices with SAVR produced a different result. When a second-generation balloon-expandable SAPIEN XT device and a third-generation SAPIEN 3 device were compared with surgery, neither device achieved lower SVD rates relative to SAVR.
In PARTNER 2A, the SVD rate for the older device was nearly three times greater than SAVR (1.61 vs. 0.58 per 100 patient-years). The numerically higher SVD rates for the newer device (0.68 vs. 0.58 per 100 patient-years) was not statistically different, but the TAVI device was not superior.
More than 4,000 patients evaluated at 5 years
In the analysis presented by Dr. Reardon, data were pooled from the randomized CoreValve U.S. High-Risk Pivotal Trial and the SURTAVI Intermediate Risk Trial. Together, these studies randomized 971 patients to surgery and 1,128 patients to TAVI. Data on an additional 2,663 patients treated with the Evolut valve in two registries were added to the randomized trial data, providing data on 4,762 total patients with 5-year follow-up.
SVD was defined by two criteria. The first was a mean gradient increase of at least 10 mm Hg plus a mean overall gradient of at least 20 mm Hg as measured with echocardiography and assessed, when possible, by an independent core laboratory. The second was new-onset or increased intraprosthetic aortic regurgitation of at least moderate severity.
When graphed over time, the SVD curves separated in favor of TAVI after about 6 months of follow-up. The shape of the curves also differed. Unlike the steady rise in SVD observed in the surgery group, the SVD rate in the TAVI group remained below 1% for almost 4 years before beginning to climb.
There was greater relative benefit for the TAVI device in patients with annular diameters of 23 mm or less. Unlike the rise in SVD rates that began about 6 months after SAVR, the SVD rates in the TAVI patients remained at 0% for more than 2 years. At 5 years, the differences remained significant favoring TAVI (1.39% vs. 5.86%; P = .049).
In those with larger annular diameters, there was still a consistently lower SVD rate over time for TAVI relative to SAVR, but the trend for an advantage at 5 years fell just short of significance (2.48% vs. 3.96%; P = .067).
SVD linked to doubling of mortality
SVD worsened outcomes. When all data surgery and TAVI data were pooled, the hazard ratios corresponded with about a doubling of risk for major adverse outcomes, including all-cause mortality (HR, 1.98; P < .001), cardiovascular mortality (HR, 1.82; P = .008), and hospitalization for aortic valve disease or worsening heart failure (HR, 2.11; P = .01). The relative risks were similar in the two treatment groups, including the risk of all-cause mortality (HR, 2.24; P < .001 for TAVI vs. HR, 2.45; P = .002 for SAVR).
The predictors for SVD on multivariate analysis included female sex, increased body surface area, prior percutaneous coronary intervention, and a prior diagnosis of atrial fibrillation.
Design improvements in TAVI devices are likely to explain these results, said Dr. Reardon, chair of cardiovascular research at Houston Methodist Hospital.
“The CoreValve/Evolut supra-annular, self-expanding bioprosthesis is the first and only transcatheter bioprosthesis to demonstrate lower rates of SVD, compared with surgery,” Dr. Reardon said.
This analysis validated the risks posed by the definition of SVD applied in this study, which appears to be a practical tool for tracking valve function and patient risk. Dr. Reardon also said that the study confirms the value of serial Doppler transthoracic echocardiography as a tool for monitoring SVD.
Several experts agreed that this is important new information.
“This is a remarkable series of findings,” said James McClurken, MD, who is a cardiovascular surgeon affiliated with Temple University, Philadelphia, and practices in Doylestown, Penn. By both demonstrating the prognostic importance of SVD and showing differences between the study device and SAVR, this trial will yield practical data to inform patients about relative risks and benefits.
Athena Poppas, MD, the new president of the ACC and a professor of medicine at Brown University, Providence, R.I., called this study “practice changing” for the same reasons. She also thinks it has valuable data for guiding choice of intervention.
Overall, the data are likely to change thinking about the role of TAVI and surgery in younger, fit patients, according to Megan Coylewright, MD, chief of cardiology at Erlanger Cardiology, Chattanooga, Tenn.
“There are patients [in need of aortic valve repair] with a long life expectancy who have been told you have to have a surgical repair because we know they last longer,” she said. Although she said that relative outcomes after longer follow-up remain unknown, “I think this does throw that comment into question.”
Dr. Reardon has financial relationships with Abbott, Boston Scientific, Medtronic, and Gore Medical. Dr. Poppas and McClurken reported no potential financial conflicts of interest. Dr. Coylewright reported financial relationships with Abbott, Alleviant, Boston Scientific, Cardiosmart, Edwards Lifesciences, Medtronic, and Occlutech. The study received financial support from Medtronic.
FROM ACC 2022
Hospital factors drive many discharges against medical advice
The analysis found that in about 1 in 5 cases, shortcomings in the quality of care and other factors beyond patients’ control explain why they leave the hospital before completing recommended treatment.
Clinicians may be quick to blame patients for so-called discharges against medical advice (AMA), which comprise up to 2% of hospital admissions and are associated with an increased risk of mortality and readmission. But “we as providers are very much involved in the reasons why these patients left,” Kushinga Bvute, MD, MPH, a second-year internal medicine resident at Florida Atlantic University, Boca Raton, who led the new study, told this news organization. Dr. Bvute and her colleagues presented their findings April 6 at the Society of General Internal Medicine (SGIM) 2022 Annual Meeting, Orlando, Florida.
Dr. Bvute and her colleagues reviewed the records of 548 AMA discharges – out of a total of 354,767 discharges – from Boca Raton Regional Hospital from January 2020 to January 2021. In 44% of cases, patients cited their own reasons for leaving. But in nearly 20% of AMA discharges, the researchers identified factors linked to treatment.
Hospital-related reasons patients cited for leaving AMA were general wait times (3.5%), provider wait times (2.6%), provider care (2.9%), the hospital environment (2.7%), wanting a private room (2%), and seeking medical care elsewhere (6.2%).
Patient-related factors were refusing treatment (27%), feeling better (3.5%), addiction problems (2.9%), financial complications (2.9%), and dependent care (2.4%). Ten (1.8%) eloped, according to the researchers.
Nearly 60% of patients who were discharged AMA were men, with a mean age of 56 years (standard deviation, 19.13). The average stay was 1.64 days.
In roughly one-third of cases, there was no documented reason for the departure – underscoring the need for better reporting, according to the researchers.
To address AMA discharges, hospitals “need to focus on factors they influence, such as high-quality patient care, the hospital environment, and provider-patient relationships,” the researchers report.
New procedures needed
The hospital is working on procedures to ensure that reasons for AMA discharges are documented. The administration also is implementing preventive steps, such as communicating with patients about the risks of leaving and providing discharge plans to reduce the likelihood that a patient will return, Dr. Bvute told this news organization.
Dr. Bvute said the findings should encourage individual clinicians to “remove any stereotypes that sometimes come attached to having those three letters on your charts.”
Data were collected during the COVID-19 pandemic, but Dr. Bvute does not believe that fear of coronavirus exposure drove many patients to leave the hospital prematurely.
The study is notable for approaching AMA discharges from a quality improvement perspective, David Alfandre, MD, MPH, a health care ethicist at the VA National Center for Ethics in Health Care, Washington, D.C., said in an interview.
Dr. Alfandre, who was not involved in the study, said it reflects growing recognition that hospitals can take steps to reduce adverse outcomes associated with AMA discharges. “It’s starting to shift the conversation to saying, this isn’t just the patient’s problem, but this is the health care provider’s problem,” he said.
Dr. Alfandre co-authored a 2021 analysis showing that hospital characteristics account for 7.3% of variation in the probability of a patient being discharged AMA. However, research is needed to identify effective interventions besides the established use of buprenorphine and naloxone for patients with opioid use disorder. “I think everybody recognizes the quality of communication is poor, but that doesn’t really help us operationalize that to know what to do,” he said.
Emily Holmes, MD, MPH, medical director of the Changing Health Outcomes Through Integrated Care Excellence Program at IU Health, Indianapolis, cautioned that data may be biased because defining AMA discharge can be subjective.
Reasons are not consistently documented and can be difficult to capture because they are often multifactorial, Dr. Holmes said. “For example, long wait times are more problematic when a patient is worried about finances and care for a child,” she said.
But Dr. Holmes, who was not involved in the study, said it does encourage clinicians “to think about what we can do systematically to reduce AMA discharges.”
Dr. Bvute, Dr. Alfandre, and Dr. Holmes reported no relevant financial relationships.
A version of this article first appeared on Medscape.com.
FROM SGIM 2022
Aiming for System Improvement While Transitioning to the New Normal
As we transition out of the Omicron surge, the lessons we’ve learned from the prior surges carry forward and add to our knowledge foundation. Medical journals have published numerous research and perspectives manuscripts on all aspects of COVID-19 over the past 2 years, adding much-needed knowledge to our clinical practice during the pandemic. However, the story does not stop there, as the pandemic has impacted the usual, non-COVID-19 clinical care we provide. The value-based health care delivery model accounts for both COVID-19 clinical care and the usual care we provide our patients every day. Clinicians, administrators, and health care workers will need to know how to balance both worlds in the years to come.
In this issue of JCOM, the work of balancing the demands of COVID-19 care with those of system improvement continues. Two original research articles address the former, with Liesching et al1 reporting data on improving clinical outcomes of patients with COVID-19 through acute care oxygen therapies, and Ali et al2 explaining the impact of COVID-19 on STEMI care delivery models. Liesching et al’s study showed that patients admitted for COVID-19 after the first surge were more likely to receive high-flow nasal cannula and had better outcomes, while Ali et al showed that patients with STEMI yet again experienced worse outcomes during the first wave.
On the system improvement front, Cusick et al3 report on a quality improvement (QI) project that addressed acute disease management of heparin-induced thrombocytopenia (HIT) during hospitalization, Sosa et al4 discuss efforts to improve comorbidity capture at their institution, and Uche et al5 present the results of a nonpharmacologic initiative to improve management of chronic pain among veterans. Cusick et al’s QI project showed that a HIT testing strategy could be safely implemented through an evidence-based process to nudge resource utilization using specific management pathways. While capturing and measuring the complexity of diseases and comorbidities can be challenging, accurate capture is essential, as patient acuity has implications for reimbursement and quality comparisons for hospitals and physicians; Sosa et al describe a series of initiatives implemented at their institution that improved comorbidity capture. Furthermore, Uche et al report on a 10-week complementary and integrative health program for veterans with noncancer chronic pain that reduced pain intensity and improved quality of life for its participants. These QI reports show that, though the health care landscape has changed over the past 2 years, the aim remains the same: to provide the best care for patients regardless of the diagnosis, location, or time.
Conducting QI projects during the COVID-19 pandemic has been difficult, especially in terms of implementing consistent processes and management pathways while contending with staff and supply shortages. The pandemic, however, has highlighted the importance of continuing QI efforts, specifically around infectious disease prevention and good clinical practices. Moreover, the recent continuous learning and implementation around COVID-19 patient care has been a significant achievement, as clinicians and administrators worked continuously to understand and improve processes, create a supporting culture, and redesign care delivery on the fly. The management of both COVID-19 care and our usual care QI efforts should incorporate the lessons learned from the pandemic and leverage system redesign for future steps. As we’ve seen, survival in COVID-19 improved dramatically since the beginning of the pandemic, as clinical trials became more adaptive and efficient and system upgrades like telemedicine and digital technologies in the public health response led to major advancements. The work to improve the care provided in the clinic and at the bedside will continue through one collective approach in the new normal.
Corresponding author: Ebrahim Barkoudah, MD, MPH, Department of Medicine Brigham and Women’s Hospital, Boston, MA; [email protected]
1. Liesching TN, Lei Y. Oxygen therapies and clinical outcomes for patients hospitalized with covid-19: first surge vs second surge. J Clin Outcomes Manag. 2022;29(2):58-64. doi:10.12788/jcom.0086
2. Ali SH, Hyer S, Davis K, Murrow JR. Acute STEMI during the COVID-19 pandemic at Piedmont Athens Regional: incidence, clinical characteristics, and outcomes. J Clin Outcomes Manag. 2022;29(2):65-71. doi:10.12788/jcom.0085
3. Cusick A, Hanigan S, Bashaw L, et al. A practical and cost-effective approach to the diagnosis of heparin-induced thrombocytopenia: a single-center quality improvement study. J Clin Outcomes Manag. 2022;29(2):72-77.
4. Sosa MA, Ferreira T, Gershengorn H, et al. Improving hospital metrics through the implementation of a comorbidity capture tool and other quality initiatives. J Clin Outcomes Manag. 2022;29(2):80-87. doi:10.12788/jcom.00885. Uche JU, Jamison M, Waugh S. Evaluation of the Empower Veterans Program for military veterans with chronic pain. J Clin Outcomes Manag. 2022;29(2):88-95. doi:10.12788/jcom.0089
As we transition out of the Omicron surge, the lessons we’ve learned from the prior surges carry forward and add to our knowledge foundation. Medical journals have published numerous research and perspectives manuscripts on all aspects of COVID-19 over the past 2 years, adding much-needed knowledge to our clinical practice during the pandemic. However, the story does not stop there, as the pandemic has impacted the usual, non-COVID-19 clinical care we provide. The value-based health care delivery model accounts for both COVID-19 clinical care and the usual care we provide our patients every day. Clinicians, administrators, and health care workers will need to know how to balance both worlds in the years to come.
In this issue of JCOM, the work of balancing the demands of COVID-19 care with those of system improvement continues. Two original research articles address the former, with Liesching et al1 reporting data on improving clinical outcomes of patients with COVID-19 through acute care oxygen therapies, and Ali et al2 explaining the impact of COVID-19 on STEMI care delivery models. Liesching et al’s study showed that patients admitted for COVID-19 after the first surge were more likely to receive high-flow nasal cannula and had better outcomes, while Ali et al showed that patients with STEMI yet again experienced worse outcomes during the first wave.
On the system improvement front, Cusick et al3 report on a quality improvement (QI) project that addressed acute disease management of heparin-induced thrombocytopenia (HIT) during hospitalization, Sosa et al4 discuss efforts to improve comorbidity capture at their institution, and Uche et al5 present the results of a nonpharmacologic initiative to improve management of chronic pain among veterans. Cusick et al’s QI project showed that a HIT testing strategy could be safely implemented through an evidence-based process to nudge resource utilization using specific management pathways. While capturing and measuring the complexity of diseases and comorbidities can be challenging, accurate capture is essential, as patient acuity has implications for reimbursement and quality comparisons for hospitals and physicians; Sosa et al describe a series of initiatives implemented at their institution that improved comorbidity capture. Furthermore, Uche et al report on a 10-week complementary and integrative health program for veterans with noncancer chronic pain that reduced pain intensity and improved quality of life for its participants. These QI reports show that, though the health care landscape has changed over the past 2 years, the aim remains the same: to provide the best care for patients regardless of the diagnosis, location, or time.
Conducting QI projects during the COVID-19 pandemic has been difficult, especially in terms of implementing consistent processes and management pathways while contending with staff and supply shortages. The pandemic, however, has highlighted the importance of continuing QI efforts, specifically around infectious disease prevention and good clinical practices. Moreover, the recent continuous learning and implementation around COVID-19 patient care has been a significant achievement, as clinicians and administrators worked continuously to understand and improve processes, create a supporting culture, and redesign care delivery on the fly. The management of both COVID-19 care and our usual care QI efforts should incorporate the lessons learned from the pandemic and leverage system redesign for future steps. As we’ve seen, survival in COVID-19 improved dramatically since the beginning of the pandemic, as clinical trials became more adaptive and efficient and system upgrades like telemedicine and digital technologies in the public health response led to major advancements. The work to improve the care provided in the clinic and at the bedside will continue through one collective approach in the new normal.
Corresponding author: Ebrahim Barkoudah, MD, MPH, Department of Medicine Brigham and Women’s Hospital, Boston, MA; [email protected]
1. Liesching TN, Lei Y. Oxygen therapies and clinical outcomes for patients hospitalized with covid-19: first surge vs second surge. J Clin Outcomes Manag. 2022;29(2):58-64. doi:10.12788/jcom.0086
2. Ali SH, Hyer S, Davis K, Murrow JR. Acute STEMI during the COVID-19 pandemic at Piedmont Athens Regional: incidence, clinical characteristics, and outcomes. J Clin Outcomes Manag. 2022;29(2):65-71. doi:10.12788/jcom.0085
3. Cusick A, Hanigan S, Bashaw L, et al. A practical and cost-effective approach to the diagnosis of heparin-induced thrombocytopenia: a single-center quality improvement study. J Clin Outcomes Manag. 2022;29(2):72-77.
4. Sosa MA, Ferreira T, Gershengorn H, et al. Improving hospital metrics through the implementation of a comorbidity capture tool and other quality initiatives. J Clin Outcomes Manag. 2022;29(2):80-87. doi:10.12788/jcom.00885. Uche JU, Jamison M, Waugh S. Evaluation of the Empower Veterans Program for military veterans with chronic pain. J Clin Outcomes Manag. 2022;29(2):88-95. doi:10.12788/jcom.0089
Improving Hospital Metrics Through the Implementation of a Comorbidity Capture Tool and Other Quality Initiatives
From the University of Miami Miller School of Medicine (Drs. Sosa, Ferreira, Gershengorn, Soto, Parekh, and Suarez), and the Quality Department of the University of Miami Hospital and Clinics (Estin Kelly, Ameena Shrestha, Julianne Burgos, and Sandeep Devabhaktuni), Miami, FL.
Abstract
Background: Case mix index (CMI) and expected mortality are determined based on comorbidities. Improving documentation and coding can impact performance indicators. During and prior to 2018, our patient acuity was under-represented, with low expected mortality and CMI. Those metrics motivated our quality team to develop the quality initiatives reported here.
Objectives: We sought to assess the impact of quality initiatives on number of comorbidities, diagnoses, CMI, and expected mortality at the University of Miami Health System.
Design: We conducted an observational study of a series of quality initiatives: (1) education of clinical documentation specialists (CDS) to capture comorbidities (10/2019); (2) facilitating the process for physician query response (2/2020); (3) implementation of computer logic to capture electrolyte disturbances and renal dysfunction (8/2020); (4) development of a tool to capture Elixhauser comorbidities (11/2020); and (5) provider education and electronic health record reviews by the quality team.
Setting and participants: All admissions during 2019 and 2020 at University of Miami Health System. The health system includes 2 academic inpatient facilities, a 560-bed tertiary hospital, and a 40-bed cancer facility. Our hospital is 1 of the 11 PPS-Exempt Cancer Hospitals and is the South Florida’s only NCI-Designated Cancer Center.
Conclusion:
Keywords: PS/QI, coding, case mix index, comorbidities, mortality.
Adoption of comprehensive electronic health record (EHR) systems by US hospitals, defined as an EHR capable of meeting all core meaningful-use metrics including evaluation and tracking of quality metrics, has been steadily increasing.3,4 Many institutions have looked to EHR system transitions as an inflection point to expand clinical documentation improvement (CDI) efforts. Over the past several years, our institution, an academic medical center, has endeavored to fully transition to a comprehensive EHR system (Epic from Epic Systems Corporation). Part of the purpose of this transition was to help study and improve outcomes, reduce readmissions, improve quality of care, and meet performance indicators.
Prior to 2019, our hospital’s patient acuity was low, with a CMI consistently below 2, ranging from 1.81 to 1.99, and an expected mortality consistently below 1.9%, ranging from 1.65% to 1.85%. Our concern that these values underestimated the real severity of illness of our patient population prompted the development of a quality improvement plan. In this report, we describe the processes we undertook to improve documentation and coding of comorbid illness, and report on the impact of these initiatives on performance indicators. We hypothesized that our initiatives would have a significant impact on our ability to capture patient complexity, and thus impact our CMI and expected mortality.
Methods
In the fall of 2019, we embarked on a multifaceted quality improvement project aimed at improving comorbidity capture for patients hospitalized at our institution. The health system includes 2 academic inpatient facilities, a 560-bed tertiary hospital and a 40-bed cancer facility. Since September 2017, we have used Epic as our EHR. In August 2019, we started working with Vizient Clinical Data Base5 to allow benchmarking with peer institutions. We assessed the impact of this initiative with a pre/post study design.
Quality Initiatives
This quality improvement project consisted of a series of 5 targeted interventions coupled with continuous monitoring and education.
1. Comorbidity coding. In October 2019, we met with the clinical documentation specialists (CDS) and the coding team to educate them on the value of coding all comorbidities that have an impact on
2. Physician query. In October 2019, we modified the process for physician query response, allowing physicians to answer queries in the EHR through a reply tool incorporated into the query and accept answers in the body of the Epic message as an active part of the EHR.
3. EHR logic. In August 2020, we developed an EHR smart logic to automatically capture fluid and electrolyte disturbances and renal dysfunction, based on the most recent laboratory values. The logic automatically populated potentially appropriate diagnoses in the assessment and plan of provider notes, which require provider acknowledgment and which providers are able to modify
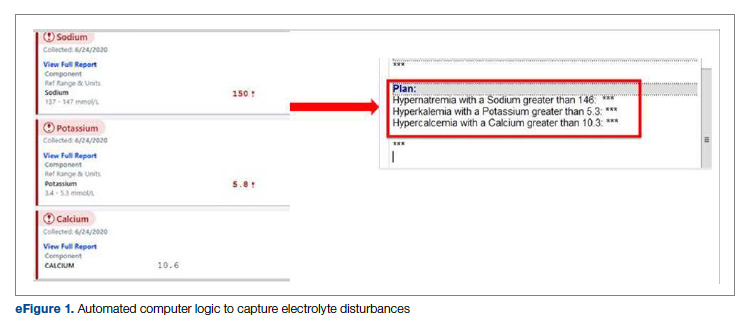
4. Comorbidity capture tool. In November 2020, we developed a standardized tool to allow providers to easily capture Elixhauser comorbidities (eFigure 2). The Elixhauser index is a method for measuring comorbidities based on International Classification of Diseases, Ninth Revision, Clinical Modification and International Classification of Disease, Tenth Revision diagnosis codes found in administrative data1-6 and is used by US News & World Report and Vizient to assess comorbidity burden. Our tool automatically captures diagnoses recorded in previous documentation and allows providers to easily provide the management plan for each; this information is automatically pulled into the provider note.
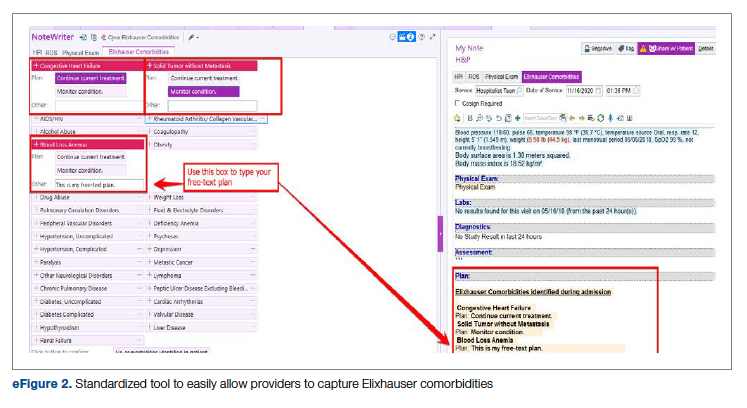
The development of this tool used an existing functionality within the Epic EHR called SmartForms, SmartData Elements, and SmartLinks. The only cost of tool development was the time invested—124 hours inclusive of 4 hours of staff education. Specifically, a panel of experts (including physicians of different specialties, an analyst, and representatives from the quality office) met weekly for 30 minutes per week over 5 weeks to agree on specific clinical criteria and guide the EHR build analyst. Individual panel members confirmed and validated design requirements (in 15 hours over 5 weeks). Our senior clinical analyst II dedicated 80 hours to actual build time, 15 hours to design time, and 25 hours to tailor the function to our institution’s workflow. This tool was introduced in November 2020; completion was optional at the time of hospital admission but mandatory at discharge to ensure compliance.
5. Quality team
Assessment of Quality Initiatives’ Impact
Data on the number of comorbidities and performance indicators were obtained retrospectively. The data included all hospital admissions from 2019 and 2020 divided into 2 periods: pre-intervention from January 1, 2019 through September 30, 2019, and intervention from October 1, 2019 through December 31, 2020. The primary outcome of this observational study was the rate of comorbidity capture during the intervention period. Comorbidity capture was assessed using the Vizient Clinical Data Base (CDB) health care performance tool.5 Vizient CDB uses the Agency for Healthcare Research and Quality Elixhauser index, which includes 29 of the initial 31 comorbidities described by Elixhauser,6 as it combines hypertension with and without complications into one. We secondarily aimed to examine the impact of the quality improvement initiatives on several institutional-level performance indicators, including total number of diagnoses, comorbidities or complications (CC), major comorbidities or complications (MCC), CMI, and expected mortality.
Case mix index is the average Medicare Severity-DRG (MS-DRG) weighted across all hospital discharges (appropriate to their discharge date). The expected mortality represents the average expected number of deaths based on diagnosed conditions, age, and gender within the same time frame, and it is based on coded diagnosis; we obtained the mortality index by dividing the observed mortality by the expected mortality. The Vizient CDB Mortality Risk Adjustment Model was used to assign an expected mortality (0%-100%) to each case based on factors such as demographics, admission type, diagnoses, and procedures.
Standard statistics were used to measure the outcomes. We used Excel to compare pre-intervention and intervention period characteristics and outcomes, using t-testing for continuous variables and Chi-square testing for categorial outcomes. P values <0.05 were considered statistically significant.
The study was reviewed by the institutional review board (IRB) of our institution (IRB ID: 20210070). The IRB determined that the proposed activity was not research involving human subjects, as defined by the Department of Health and Human Services and US Food and Drug Administration regulations, and that IRB review and approval by the organization were not required.
Results
The health system had a total of 33 066 admissions during the study period—13 689 pre-intervention (January 1, 2019 through September 30, 2019) and 19,377 during the intervention period (October 1, 2019 to December 31, 2020). Demographics were similar among the pre-intervention and intervention periods: mean age was 60 years and 61 years, 52% and 51% of patients were male, 72% and 71% were White, and 20% and 19% were Black, respectively (Table 1).
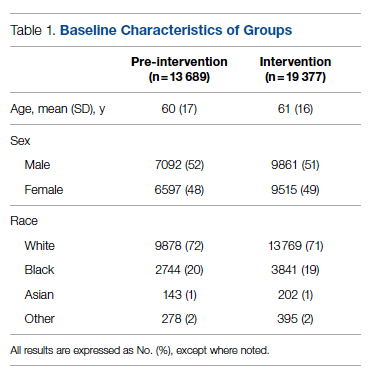
The multifaceted intervention resulted in a significant improvement in the primary outcome: mean comorbidity capture increased from 2.5 (SD, 1.7) before the intervention to 3.1 (SD, 2.0) during the intervention (P < .00001). Secondary outcomes also improved. The mean number of secondary diagnoses for admissions increased from 11.3 (SD, 7.3) prior to the intervention to 18.5 (SD, 10.4) (P < .00001) during the intervention period. The mean CMI increased from 2.1 (SD, 1.9) to 2.4 (SD, 2.2) post intervention (P < .00001), an increase during the intervention period of 14%. The expected mortality increased from 1.8% (SD, 6.1%) to 3.1% (SD, 9.2%) after the intervention (P < .00001) (Table 2).
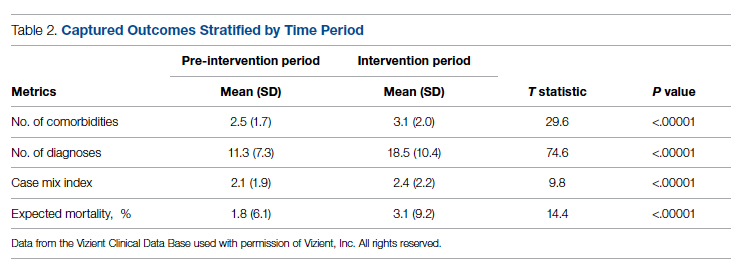
There was an overall observed improvement in percentage of discharges with documented CC and MCC for both surgical and medical specialties. Both CC and MCC increased for surgical specialties, from 54.4% to 68.5%, and for medical specialties, from 68.9% to 76.4%. (Figure 1). The diagnoses that were captured more consistently included deficiency anemia, obesity, diabetes with complications, fluid and electrolyte disorders and renal failure, hypertension, weight loss, depression, and hypothyroidism (Figure 2).
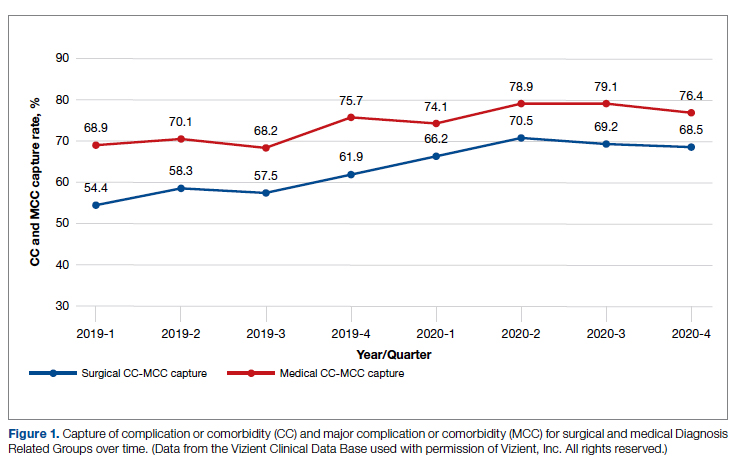
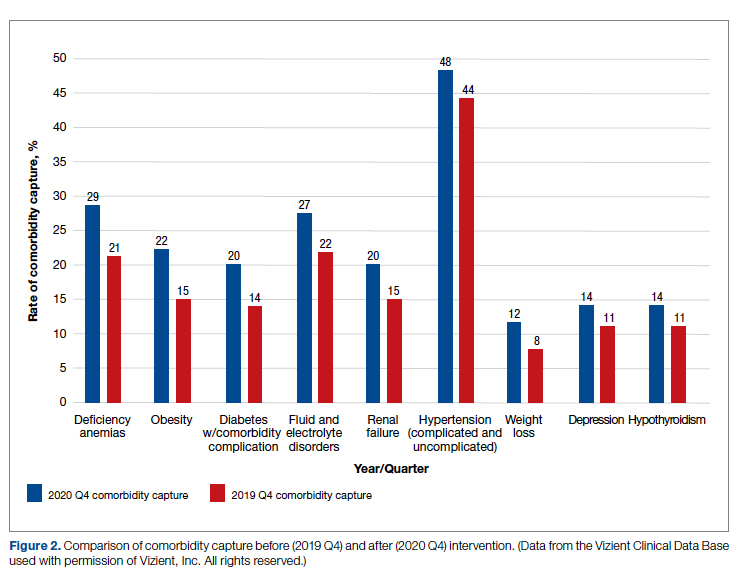
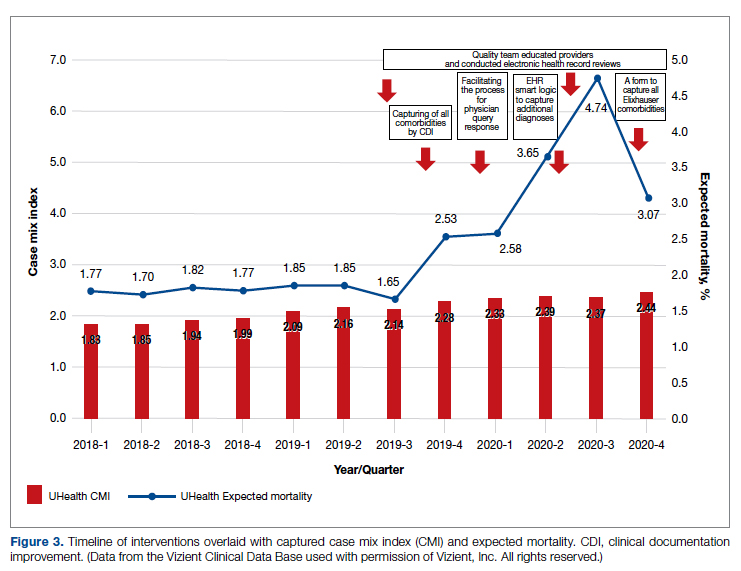
During the 9-month pre-intervention period (January 1 through September 30, 2019), there were 2795 queries, with an agreed volume of 1823; the agreement rate was 65% and the average provider turnaround time was 12.53 days. In the 15-month postintervention period, there were 10 216 queries, with an agreed volume of 6802 at 66%. We created a policy to encourage responses no later than 10 days after the query, and our average turnaround time decreased by more than 50% to 5.86 days. The average number of monthly queries increased by 55%, from an average of 311 monthly queries in the pre-intervention period to an average of 681 per month in the postintervention period. The more common queries that had an impact on CMI included sepsis, antineoplastic chemotherapy–induced pancytopenia, acute posthemorrhagic anemia, malnutrition, hyponatremia, and metabolic encephalopathy.
Discussion
The need for accurate documentation by physicians has been recognized for many years.7
With the growing complexity of the documentation and coding process, it is difficult for clinicians to keep up with the terminology required by the Centers for Medicare and Medicaid Services (CMS). Several different methods to improve documentation have been proposed. Prior interventions to standardize documentation templates in the trauma service have shown improvement in CMI.8 An educational program on coding for internal medicine that included a lecture series and creation of a laminated pocket card listing common CMS diagnoses, CC, and MCC has been implemented, with an improvement in the capture rate of CC and MCC from 42% to 48% and an impact on expected mortality.9 This program resulted in a 30% decrease in the median quarterly mortality index and an increase in CMI from 1.27 to 1.36.
Our results show that there was an increase in comorbidities documentation of admitted patients after all interventions were implemented, more accurately reflecting the complexity of our patient population in a tertiary care academic medical center. Our CMI increased by 14% during the intervention period. The estimated CMI dollar impact increased by 75% from the pre-intervention period (adjusted for PPS-exempt hospital). The hospital-expected mortality increased from 1.77 to 3.07 (peak at 4.74 during third quarter of 2020) during the implementation period, which is a key driver of quality rankings for national outcomes reporting services such as US News & World Report.
There was increased physician satisfaction as a result of the change of functionality of the query response system, and no additional monetary provider incentive for complete documentation was allocated, apart from education and 1:1 support that improved physician engagement. Our next steps include the implementation of an advanced program to concurrently and automatically capture and nudge providers to respond and complete their documentation in real time.
Limitations
The limitations of our study include those inherent to a retrospective review and are associative and observational in nature. Although we used expected mortality and CMI as a surrogate for patient acuity for comparison, there was no way to control for actual changes in patient acuity that contributed to the increase in CMI, although we believe that the population we served and the services provided and their structure did not change significantly during the intervention period. Additionally, the observed increase in CMI during the implementation period may be a result of described variabilities in CMI and would be better studied over a longer period. Also, during the year of our interventions, 2020, we were affected by the COVID-19 pandemic. Patients with COVID-19 are known to carry a lower-than-expected mortality, and that could have had a negative impact on our results. In fact, we did observe a decrease in our expected mortality during the last quarter of 2020, which correlated with one of our regional peaks for COVID-19, and that could be a confounding factor. While the described intervention process is potentially applicable to multiple EHR systems, the exact form to capture the Elixhauser comorbidities was built into the Epic EHR, limiting external applicability of this tool to other EHR software.
Conclusion
A continuous comprehensive series of interventions substantially increased our patient acuity scores. The increased scores have implications for reimbursement and quality comparisons for hospitals and physicians. Our institution can now be stratified more accurately with our peers and other hospitals. Accurate medical record documentation has become increasingly important, but also increasingly complex. Leveraging the EHR through quality initiatives that facilitate the workflow for providers can have an impact on documentation, coding, and ultimately risk-adjusted outcomes data that influence institutional reputation.
Corresponding author: Marie Anne Sosa, MD; 1120 NW 14th St., Suite 809, Miami, FL, 33134; [email protected]
Disclosures: None reported.
doi:10.12788/jcom.0088
1. Elixhauser A, Steiner C, Harris DR, Coffey RM. Comorbidity measures for use with administrative data. Med Care. 1998;36(1):8-27. doi:10.1097/00005650-199801000-00004.
2. Sehgal AR. The role of reputation in U.S. News & World Report’s rankings of the top 50 American hospitals. Ann Intern Med. 2010;152(8):521-525. doi:10.7326/0003-4819-152-8-201004200-00009
3. Jha AK, DesRoches CM, Campbell EG, et al. Use of electronic health records in U.S. hospitals. N Engl J Med. 2009;360(16):1628-1638. doi:10.1056/NEJMsa0900592.
4. Adler-Milstein J, DesRoches CM, Kralovec, et al. Electronic health record adoption in US hospitals: progress continues, but challenges persist. Health Aff (Millwood). 2015;34(12):2174-2180. doi:10.1377/hlthaff.2015.0992
5. Vizient Clinical Data Base/Resource ManagerTM. Irving, TX: Vizient, Inc.; 2019. Accessed March 10, 2022. https://www.vizientinc.com
6. Moore BJ, White S, Washington R, Coenen N, Elixhauser A. Identifying increased risk of readmission and in-hospital mortality using hospital administrative data: the AHRQ Elixhauser Comorbidity Index. Med Care. 2017;55(7):698-705. doi:10.1097/MLR.0000000000000735
7. Payne T. Improving clinical documentation in an EMR world. Healthc Financ Manage. 2010;64(2):70-74.
8. Barnes SL, Waterman M, Macintyre D, Coughenour J, Kessel J. Impact of standardized trauma documentation to the hospital’s bottom line. Surgery. 2010;148(4):793-797. doi:10.1016/j.surg.2010.07.040
9. Spellberg B, Harrington D, Black S, Sue D, Stringer W, Witt M. Capturing the diagnosis: an internal medicine education program to improve documentation. Am J Med. 2013;126(8):739-743.e1. doi:10.1016/j.amjmed.2012.11.035
From the University of Miami Miller School of Medicine (Drs. Sosa, Ferreira, Gershengorn, Soto, Parekh, and Suarez), and the Quality Department of the University of Miami Hospital and Clinics (Estin Kelly, Ameena Shrestha, Julianne Burgos, and Sandeep Devabhaktuni), Miami, FL.
Abstract
Background: Case mix index (CMI) and expected mortality are determined based on comorbidities. Improving documentation and coding can impact performance indicators. During and prior to 2018, our patient acuity was under-represented, with low expected mortality and CMI. Those metrics motivated our quality team to develop the quality initiatives reported here.
Objectives: We sought to assess the impact of quality initiatives on number of comorbidities, diagnoses, CMI, and expected mortality at the University of Miami Health System.
Design: We conducted an observational study of a series of quality initiatives: (1) education of clinical documentation specialists (CDS) to capture comorbidities (10/2019); (2) facilitating the process for physician query response (2/2020); (3) implementation of computer logic to capture electrolyte disturbances and renal dysfunction (8/2020); (4) development of a tool to capture Elixhauser comorbidities (11/2020); and (5) provider education and electronic health record reviews by the quality team.
Setting and participants: All admissions during 2019 and 2020 at University of Miami Health System. The health system includes 2 academic inpatient facilities, a 560-bed tertiary hospital, and a 40-bed cancer facility. Our hospital is 1 of the 11 PPS-Exempt Cancer Hospitals and is the South Florida’s only NCI-Designated Cancer Center.
Conclusion:
Keywords: PS/QI, coding, case mix index, comorbidities, mortality.
Adoption of comprehensive electronic health record (EHR) systems by US hospitals, defined as an EHR capable of meeting all core meaningful-use metrics including evaluation and tracking of quality metrics, has been steadily increasing.3,4 Many institutions have looked to EHR system transitions as an inflection point to expand clinical documentation improvement (CDI) efforts. Over the past several years, our institution, an academic medical center, has endeavored to fully transition to a comprehensive EHR system (Epic from Epic Systems Corporation). Part of the purpose of this transition was to help study and improve outcomes, reduce readmissions, improve quality of care, and meet performance indicators.
Prior to 2019, our hospital’s patient acuity was low, with a CMI consistently below 2, ranging from 1.81 to 1.99, and an expected mortality consistently below 1.9%, ranging from 1.65% to 1.85%. Our concern that these values underestimated the real severity of illness of our patient population prompted the development of a quality improvement plan. In this report, we describe the processes we undertook to improve documentation and coding of comorbid illness, and report on the impact of these initiatives on performance indicators. We hypothesized that our initiatives would have a significant impact on our ability to capture patient complexity, and thus impact our CMI and expected mortality.
Methods
In the fall of 2019, we embarked on a multifaceted quality improvement project aimed at improving comorbidity capture for patients hospitalized at our institution. The health system includes 2 academic inpatient facilities, a 560-bed tertiary hospital and a 40-bed cancer facility. Since September 2017, we have used Epic as our EHR. In August 2019, we started working with Vizient Clinical Data Base5 to allow benchmarking with peer institutions. We assessed the impact of this initiative with a pre/post study design.
Quality Initiatives
This quality improvement project consisted of a series of 5 targeted interventions coupled with continuous monitoring and education.
1. Comorbidity coding. In October 2019, we met with the clinical documentation specialists (CDS) and the coding team to educate them on the value of coding all comorbidities that have an impact on
2. Physician query. In October 2019, we modified the process for physician query response, allowing physicians to answer queries in the EHR through a reply tool incorporated into the query and accept answers in the body of the Epic message as an active part of the EHR.
3. EHR logic. In August 2020, we developed an EHR smart logic to automatically capture fluid and electrolyte disturbances and renal dysfunction, based on the most recent laboratory values. The logic automatically populated potentially appropriate diagnoses in the assessment and plan of provider notes, which require provider acknowledgment and which providers are able to modify
4. Comorbidity capture tool. In November 2020, we developed a standardized tool to allow providers to easily capture Elixhauser comorbidities (eFigure 2). The Elixhauser index is a method for measuring comorbidities based on International Classification of Diseases, Ninth Revision, Clinical Modification and International Classification of Disease, Tenth Revision diagnosis codes found in administrative data1-6 and is used by US News & World Report and Vizient to assess comorbidity burden. Our tool automatically captures diagnoses recorded in previous documentation and allows providers to easily provide the management plan for each; this information is automatically pulled into the provider note.
The development of this tool used an existing functionality within the Epic EHR called SmartForms, SmartData Elements, and SmartLinks. The only cost of tool development was the time invested—124 hours inclusive of 4 hours of staff education. Specifically, a panel of experts (including physicians of different specialties, an analyst, and representatives from the quality office) met weekly for 30 minutes per week over 5 weeks to agree on specific clinical criteria and guide the EHR build analyst. Individual panel members confirmed and validated design requirements (in 15 hours over 5 weeks). Our senior clinical analyst II dedicated 80 hours to actual build time, 15 hours to design time, and 25 hours to tailor the function to our institution’s workflow. This tool was introduced in November 2020; completion was optional at the time of hospital admission but mandatory at discharge to ensure compliance.
5. Quality team
Assessment of Quality Initiatives’ Impact
Data on the number of comorbidities and performance indicators were obtained retrospectively. The data included all hospital admissions from 2019 and 2020 divided into 2 periods: pre-intervention from January 1, 2019 through September 30, 2019, and intervention from October 1, 2019 through December 31, 2020. The primary outcome of this observational study was the rate of comorbidity capture during the intervention period. Comorbidity capture was assessed using the Vizient Clinical Data Base (CDB) health care performance tool.5 Vizient CDB uses the Agency for Healthcare Research and Quality Elixhauser index, which includes 29 of the initial 31 comorbidities described by Elixhauser,6 as it combines hypertension with and without complications into one. We secondarily aimed to examine the impact of the quality improvement initiatives on several institutional-level performance indicators, including total number of diagnoses, comorbidities or complications (CC), major comorbidities or complications (MCC), CMI, and expected mortality.
Case mix index is the average Medicare Severity-DRG (MS-DRG) weighted across all hospital discharges (appropriate to their discharge date). The expected mortality represents the average expected number of deaths based on diagnosed conditions, age, and gender within the same time frame, and it is based on coded diagnosis; we obtained the mortality index by dividing the observed mortality by the expected mortality. The Vizient CDB Mortality Risk Adjustment Model was used to assign an expected mortality (0%-100%) to each case based on factors such as demographics, admission type, diagnoses, and procedures.
Standard statistics were used to measure the outcomes. We used Excel to compare pre-intervention and intervention period characteristics and outcomes, using t-testing for continuous variables and Chi-square testing for categorial outcomes. P values <0.05 were considered statistically significant.
The study was reviewed by the institutional review board (IRB) of our institution (IRB ID: 20210070). The IRB determined that the proposed activity was not research involving human subjects, as defined by the Department of Health and Human Services and US Food and Drug Administration regulations, and that IRB review and approval by the organization were not required.
Results
The health system had a total of 33 066 admissions during the study period—13 689 pre-intervention (January 1, 2019 through September 30, 2019) and 19,377 during the intervention period (October 1, 2019 to December 31, 2020). Demographics were similar among the pre-intervention and intervention periods: mean age was 60 years and 61 years, 52% and 51% of patients were male, 72% and 71% were White, and 20% and 19% were Black, respectively (Table 1).
The multifaceted intervention resulted in a significant improvement in the primary outcome: mean comorbidity capture increased from 2.5 (SD, 1.7) before the intervention to 3.1 (SD, 2.0) during the intervention (P < .00001). Secondary outcomes also improved. The mean number of secondary diagnoses for admissions increased from 11.3 (SD, 7.3) prior to the intervention to 18.5 (SD, 10.4) (P < .00001) during the intervention period. The mean CMI increased from 2.1 (SD, 1.9) to 2.4 (SD, 2.2) post intervention (P < .00001), an increase during the intervention period of 14%. The expected mortality increased from 1.8% (SD, 6.1%) to 3.1% (SD, 9.2%) after the intervention (P < .00001) (Table 2).
There was an overall observed improvement in percentage of discharges with documented CC and MCC for both surgical and medical specialties. Both CC and MCC increased for surgical specialties, from 54.4% to 68.5%, and for medical specialties, from 68.9% to 76.4%. (Figure 1). The diagnoses that were captured more consistently included deficiency anemia, obesity, diabetes with complications, fluid and electrolyte disorders and renal failure, hypertension, weight loss, depression, and hypothyroidism (Figure 2).
During the 9-month pre-intervention period (January 1 through September 30, 2019), there were 2795 queries, with an agreed volume of 1823; the agreement rate was 65% and the average provider turnaround time was 12.53 days. In the 15-month postintervention period, there were 10 216 queries, with an agreed volume of 6802 at 66%. We created a policy to encourage responses no later than 10 days after the query, and our average turnaround time decreased by more than 50% to 5.86 days. The average number of monthly queries increased by 55%, from an average of 311 monthly queries in the pre-intervention period to an average of 681 per month in the postintervention period. The more common queries that had an impact on CMI included sepsis, antineoplastic chemotherapy–induced pancytopenia, acute posthemorrhagic anemia, malnutrition, hyponatremia, and metabolic encephalopathy.
Discussion
The need for accurate documentation by physicians has been recognized for many years.7
With the growing complexity of the documentation and coding process, it is difficult for clinicians to keep up with the terminology required by the Centers for Medicare and Medicaid Services (CMS). Several different methods to improve documentation have been proposed. Prior interventions to standardize documentation templates in the trauma service have shown improvement in CMI.8 An educational program on coding for internal medicine that included a lecture series and creation of a laminated pocket card listing common CMS diagnoses, CC, and MCC has been implemented, with an improvement in the capture rate of CC and MCC from 42% to 48% and an impact on expected mortality.9 This program resulted in a 30% decrease in the median quarterly mortality index and an increase in CMI from 1.27 to 1.36.
Our results show that there was an increase in comorbidities documentation of admitted patients after all interventions were implemented, more accurately reflecting the complexity of our patient population in a tertiary care academic medical center. Our CMI increased by 14% during the intervention period. The estimated CMI dollar impact increased by 75% from the pre-intervention period (adjusted for PPS-exempt hospital). The hospital-expected mortality increased from 1.77 to 3.07 (peak at 4.74 during third quarter of 2020) during the implementation period, which is a key driver of quality rankings for national outcomes reporting services such as US News & World Report.
There was increased physician satisfaction as a result of the change of functionality of the query response system, and no additional monetary provider incentive for complete documentation was allocated, apart from education and 1:1 support that improved physician engagement. Our next steps include the implementation of an advanced program to concurrently and automatically capture and nudge providers to respond and complete their documentation in real time.
Limitations
The limitations of our study include those inherent to a retrospective review and are associative and observational in nature. Although we used expected mortality and CMI as a surrogate for patient acuity for comparison, there was no way to control for actual changes in patient acuity that contributed to the increase in CMI, although we believe that the population we served and the services provided and their structure did not change significantly during the intervention period. Additionally, the observed increase in CMI during the implementation period may be a result of described variabilities in CMI and would be better studied over a longer period. Also, during the year of our interventions, 2020, we were affected by the COVID-19 pandemic. Patients with COVID-19 are known to carry a lower-than-expected mortality, and that could have had a negative impact on our results. In fact, we did observe a decrease in our expected mortality during the last quarter of 2020, which correlated with one of our regional peaks for COVID-19, and that could be a confounding factor. While the described intervention process is potentially applicable to multiple EHR systems, the exact form to capture the Elixhauser comorbidities was built into the Epic EHR, limiting external applicability of this tool to other EHR software.
Conclusion
A continuous comprehensive series of interventions substantially increased our patient acuity scores. The increased scores have implications for reimbursement and quality comparisons for hospitals and physicians. Our institution can now be stratified more accurately with our peers and other hospitals. Accurate medical record documentation has become increasingly important, but also increasingly complex. Leveraging the EHR through quality initiatives that facilitate the workflow for providers can have an impact on documentation, coding, and ultimately risk-adjusted outcomes data that influence institutional reputation.
Corresponding author: Marie Anne Sosa, MD; 1120 NW 14th St., Suite 809, Miami, FL, 33134; [email protected]
Disclosures: None reported.
doi:10.12788/jcom.0088
1. Elixhauser A, Steiner C, Harris DR, Coffey RM. Comorbidity measures for use with administrative data. Med Care. 1998;36(1):8-27. doi:10.1097/00005650-199801000-00004.
2. Sehgal AR. The role of reputation in U.S. News & World Report’s rankings of the top 50 American hospitals. Ann Intern Med. 2010;152(8):521-525. doi:10.7326/0003-4819-152-8-201004200-00009
3. Jha AK, DesRoches CM, Campbell EG, et al. Use of electronic health records in U.S. hospitals. N Engl J Med. 2009;360(16):1628-1638. doi:10.1056/NEJMsa0900592.
4. Adler-Milstein J, DesRoches CM, Kralovec, et al. Electronic health record adoption in US hospitals: progress continues, but challenges persist. Health Aff (Millwood). 2015;34(12):2174-2180. doi:10.1377/hlthaff.2015.0992
5. Vizient Clinical Data Base/Resource ManagerTM. Irving, TX: Vizient, Inc.; 2019. Accessed March 10, 2022. https://www.vizientinc.com
6. Moore BJ, White S, Washington R, Coenen N, Elixhauser A. Identifying increased risk of readmission and in-hospital mortality using hospital administrative data: the AHRQ Elixhauser Comorbidity Index. Med Care. 2017;55(7):698-705. doi:10.1097/MLR.0000000000000735
7. Payne T. Improving clinical documentation in an EMR world. Healthc Financ Manage. 2010;64(2):70-74.
8. Barnes SL, Waterman M, Macintyre D, Coughenour J, Kessel J. Impact of standardized trauma documentation to the hospital’s bottom line. Surgery. 2010;148(4):793-797. doi:10.1016/j.surg.2010.07.040
9. Spellberg B, Harrington D, Black S, Sue D, Stringer W, Witt M. Capturing the diagnosis: an internal medicine education program to improve documentation. Am J Med. 2013;126(8):739-743.e1. doi:10.1016/j.amjmed.2012.11.035