A VA Pittsburgh Healthcare System program to improve control of oral anticancer therapy medications has increased patient adherence, decreased toxicity, and reduced waste.
The availability and popularity of orally administered anticancer therapy has drastically increased in recent years. Currently, there are more than 40 oral anticancer medications on the market in the U.S.; and about 40% of all newly FDA-approved anticancer agents in 2013 and 2014 have been oral agents.1
The use of these agents is often driven by patients. In a review of 103 patients, an overwhelming 90% of patients who were to receive palliative chemotherapy chose oral chemotherapy over IV chemotherapy, assuming equivalent efficacy, toxicity, clinic visits, and blood work schedules. However, 70% of these patients were unwilling to sacrifice any efficacy between IV and oral chemotherapy.2 Several other factors influenced the preference of oral chemotherapy for patients, including convenience, avoidance of central venous catheter placement or need for other IV access, control of the environment in which they receive chemotherapy, and travel considerations.2 In addition to these practical benefits, patients reported a great sense of freedom with oral chemotherapy.3
Although patients may prefer oral anticancer therapies, for providers, several issues exist surrounding the shift in delivery of anticancer therapies from IV to oral therapies. The most significant concern is patient adherence, defined as “the extent to which patients take medications as prescribed by their health care providers.”4
Adherence rates in clinical trials are often excellent; however, real-life adherence rates tend to be less optimal.5 In a study of women receiving 5 years of adjuvant tamoxifen for breast cancer, the researchers determined that patients filled their prescription 87% of the time the first year of treatment. This rate of adherence dramatically decreased to only 50% by year 4.6
These results suggest that a longer duration of treatment can adversely affect adherence. Duration of treatment is of great concern for providers specifically when considering the need for indefinite duration of use of tyrosine kinase inhibitors for the treatment of chronic myeloid leukemia. In 2011, Ibrahim and colleagues showed that imatinib adherence rates of 85% have been directly correlated to the loss of complete cytogenetic response (26.8% vs 1.5%, P = .0002) and lower probability of continuing imatinib (64.5% vs 90.6%, P = .006).7 Whereas several factors are known to influence adherence rates, Marin and colleagues identified the 2 main risk factors for poor adherence to imatinib: younger age and adverse effects (AEs). The median age for patients with adherence rates of 90% was 43.8 years compared with 53.8 years for patients with > 90% adherence rate. Imatinib AEs, such as asthenia, nausea, muscle cramps, and bone or joint pains, also significantly decreased imatinib adherence.8
In addition to concerns for poor therapeutic outcomes and suboptimal toxicity management, lack of adherence to oral anticancer regimens can result in significant waste of medication and increased health care costs. In most situations, IV anticancer treatment cycles are repeated every 1 to 3 weeks and allow the patient more frequent face-to-face interaction with the oncology team. Oral chemotherapy, on the other hand, is traditionally dispensed as a 28- to 30-day supply. This practice often limits the patient’s access to the oncology team for full evaluation of adherence and toxicity, which can lead to oral anticancer therapy waste.
Khandelwal and colleagues investigated the utility of a split-fill to decrease health care costs. In the splitfill process, patients were dispensed only days 1 to 16 of their oral anticancer medication at the initial fill. If the medication was tolerated and the prescribing provider deemed no changes in treatment necessary, the remaining 12 to 14 days of the cycle were then dispensed. Unfortunately, all insurance companies did not authorize the split-fill plan, thus preventing some patients in the study to participate in this cost savings strategy. However, it was determined for the patients who discontinued therapy, about 34% could have reduced wastage had they been on the split-fill plan, resulting in an average direct savings of $934.20 per patient who discontinued use.9
In 2011, the Hematology/Oncology and Pharmacy divisions at the VA Pittsburgh Healthcare System (VAPHS) examined the issues surrounding dispensing and monitoring of oral anticancer therapy. Higher utilization of oral anticancer therapy was identified and in parallel, increasing rates of patient nonadherence, toxicity, and wasted medication. Originally, most providers dispensed oral anticancer therapy as a 1-month supply. However, in efforts to increase adherence, limit toxicity, and avoid medication waste, some oncologists began only dispensing a 1- to 2-week supply of medication per visit. This shift in practice led to a pilot study evaluating the utility of limiting all oral chemotherapy to a 7- to 14-day supply during the first 3 months of treatment.
Pilot Study
The goal of the pilot study was to increase adherence, decrease toxicity, and avoid medication waste. Patients who initiated a new oral anticancer therapy between August 15, 2011, and February 15, 2012, were enrolled in the pilot study. Each patient was to be provided only a 14-day supply of medication at each visit. Patients on concurrent chemoradiotherapy with capecitabine were dispensed only a 7-day supply (as they were at VAPHS daily for radiation) of medication. A pillbox designated for oral anticancer therapy was provided and filled by the clinical pharmacist before leaving the hematology/oncology clinic.
Patients were provided a calendar to record the time and date of their oral anticancer therapy selfadministration. Patients were also asked to record any missed doses and the reasons they missed taking the medication. In addition, patients were counseled on the importance of medication adherence, food-drug and drug-drug interaction, proper storage and administration of medications, and when/who to notify if AEs occurred.
Patients were asked to return the pillboxes to the hematology/oncology clinic for the next refill and meet with the clinical pharmacist. A pill count was performed at each visit in addition to screening for toxicity. If a toxicity was identified, the prescribing provider was contacted for further orders. If no changes were needed, the remaining 14-day supply was dispensed to the patient at that time. Adherence and toxicity were documented in the electronic medical record (EMR) at each visit.
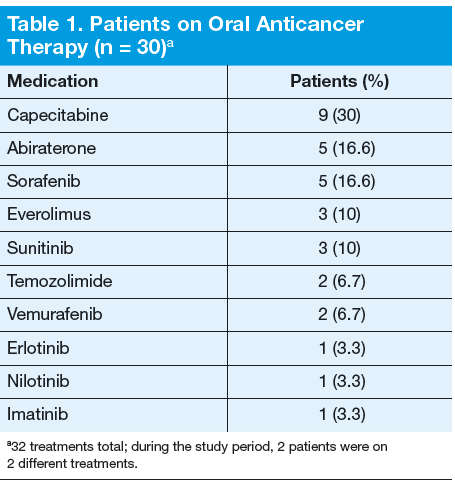
Thirty patients were started on 32 different oral anticancer therapies (Table 1) over the 6 months between August 15, 2011, and February 15, 2012. Patients already initiated on oral anticancer therapy before the start date were not included in this analysis. This number also did not include patients on lenalidomide, because this medication is mailed directly to the patient from a specialty pharmacy. All patients were male; average age was 68 (45-89) years; 83.3% of patients were white; and 83% of patients had a stage IV disease.
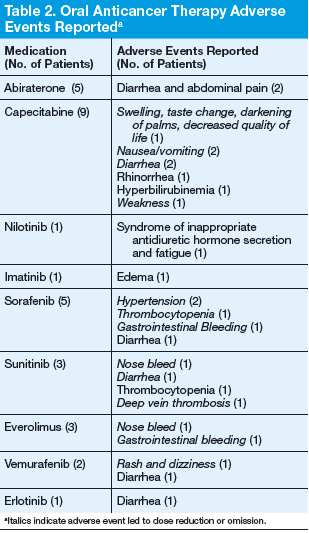
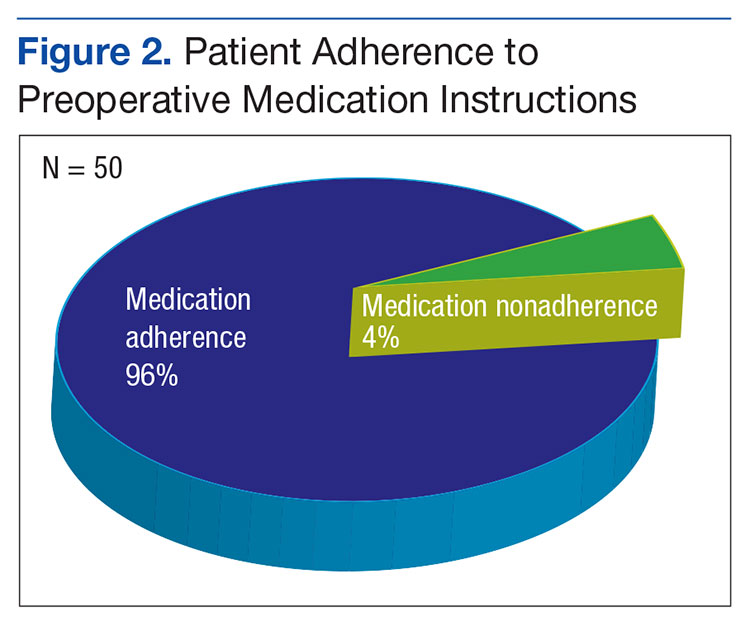
Adherence assessments using pill counts and medication calendars demonstrated that 6% (121/2,037) of doses that were dispensed were not taken. Overall adherence rate was 94%. The average patient adherence rate was 93.2%. Adverse events contributed to 62.8% of doses omitted (Table 2). Some AEs (eg, nausea, vomiting, and hypertension) were deemed preventable or modifiable with better symptom management. However, the majority of AEs that led to dose omission were not preventable.
Ten patients had their treatments discontinued midcycle, leading to 24.7% of missed doses. Adverse events led to 70% of discontinuation, whereas 20% resulted from disease progression. In both cases of disease progression, the patient was given a 30-day supply before the restaging scan, and in both cases this led to oral anticancer therapy waste. An additional 12.3% of doses were omitted due to hospitalization of patients.
Over a 6-month period, an estimated $32,314 was saved under the 14-day dosing pilot. This number was reached by subtracting the number of pills actually dispensed under pilot protocol from the number of pills that would have been dispensed under old dispensing standards (usually 28- to 30-day supply), then multiplying the difference by the cost per pill.
The results of this study were presented to the Pharmacy and Therapeutics Committee and led to the approval to continue with the 14-day dispensing protocol at VAPHS in March 2012. In addition, the pilot served as the backbone for the VHA Guidance on Oral Chemotherapy Dispensing and Monitoring.10 As part of the guidance, a monitoring guide for all the FDA-approved oral anticancer therapies is maintained and available for all VA practitioners to access on the PBM website under the Clinical Guidance subheading.
Current Practice
From the time the original pilot was conducted, the number of available oral anticancer therapies has increased along with the patient volume. Due to these factors and the lack of a dedicated outpatient oncology clinical pharmacist, oncology nurses in the outpatient clinic now direct the education, dispensing, and monitoring of patients on oral chemotherapy.
Treatment Plan
An oral anticancer treatment plan is developed by the oncology physician and entered in the EMR as a progress note titled Treatment Plan. The treatment plan includes, disease, stage, curative vs palliative intent, premedications, oral anticancer medication, dose, route and frequency, cycle length and number of cycles, baseline and continuous monitoring parameters, follow-up with provider, and staging follow-up. Once the oncology clinical pharmacist approves a treatment plan, the oncology nursing staff ensures that all the prechemotherapy laboratory tests are ordered and helps arrange any additional tests needed (echocardiogram, electrocardiogram, etc). After all the prechemotherapy testing is complete, the oncology nurse phones the patientto schedule a date for chemotherapy education and to pick up the first 14-day supply.
Initial Visit
The oncology nurse meets with each patient receiving oral anticancer therapy and provides them with an oncology clinic information packet, which includes chemotherapy education, a medication sheet, questions and answers about chemotherapy, common AEs and ways to manage them, as well as tips for meeting with the nurse and physician. The oncology nurse then reviews the oral anticancer treatment the patient is to receive, including how to administer the medication and timing, whether to take with or without food, common AEs, storage, safe handling, contact name if a toxicity arises, and importance of adherence.
The patient is provided with a pillbox and encouraged to track any missed doses. The oncology nurse then reschedules the patient for the next appointment at the clinic no more than 14 days later. Some treatments require more frequent monitoring and therefore are only dispensed 7 days at a time.
First Follow-up Visit (7-14 days)
At the first follow-up visit, the oncology nurse reviews adherence and toxicity with the patients. If any toxicity is identified, the oncology nurse contacts the oncology physician for additional assessment and orders. If the patient demonstrates adherence and tolerability, an additional 7- to 14-day supply is dispensed and the next appointment is scheduled 7 to 14 days later.
Subsequent Follow-up Visits
The patient continues to follow up at least every 28 days after cycle 1. The oncology nurse practices veterancentered care when trying to determine the appropriate follow-up for each patient. Continuous monitoring of toxicity and adherence occurs at each visit. If toxicity develops, monitoring may be increased at the discretion of the oncology nurse or physician.
Conclusions
Patients at VAPHS have been very receptive to the oral anticancer therapy protocol. Few patients have refused the initial biweekly visits, and many patients appreciate the special attention being focused on their treatment. The facility hopes to be able to expand its oral anticancer monitoring protocol to a telehealth clinic to help reduce the travel time of many patients. Additionally, as the program continues to expand, it is hoped it will be able to support a full-time outpatient oncology clinical pharmacist with a scope of practice to help manage toxicity and continue to improve adherence rates.
Author disclosures
The authors report no actual or potential conflicts of interest with regard to this article.
Disclaimer
The opinions expressed herein are those of the authors and do not necessarily reflect those of Federal Practitioner, Frontline Medical Communications Inc., the U.S. Government, or any of its agencies. This article may discuss unlabeled or investigational use of certain drugs. Please review the complete prescribing information for specific drugs or drug combinations—including indications, contraindications, warnings, and adverse effects—before administering pharmacologic therapy to patients.
1. Center Watch. FDA approved drugs. Center Watch Website. http://www.centerwatch.com/drug-information/fda-approved-drugs/year/2014. Accessed October 24, 2014.
2. Liu G, Franssen E, Fitch Mi, Warner E. Patient preferences for oral versus intravenous palliative chemotherapy. J Clin Oncol. 1997;15(1):110-115.
3. Catania C, Didier F, Leon ME, et al. Perception that oral anticancer treatments are less efficacious: Development of a questionnaire to assess the possible prejudices of patients with cancer. Breast Cancer Res Treat. 2005;92(3):265-272.
4. Kelly A, Agius CR. Improving adherence to endocrine therapies: The role of advanced practice nurses. Oncology (Williston Park). 2006;20(10 Nurse Ed):50-54.
5. Prasad V, Massey PR, Fojo T. Oral anticancer drugs: How limited dosing options and dose reductions may affect outcomes in comparative trials and efficacy in patients. J Clin Oncol. 2014;32(15):1620-1629.
6. Partridge AH, Wang PS, Winer EP, Avorn J. Nonadherence to adjuvant tamoxifen therapy in women with primary breast cancer. J Clin Oncol. 2003;21(4):602-606.
7. Ibrahim A, Eliasson L, Apperley JF, et al. Poor adherence is the main reason for loss of CCyR and imatinib failure for chronic myeloid leukemia patients on longterm therapy. Blood. 2011;117(14):3733-3736.
8. Marin D, Bazeos A, Mahon FX, et al. Adherence is the critical factor for achieving molecular responses in patients with chronic myeloid leukemia who achieve complete cytogenetic responses on imatinib. J Clin Oncol. 2010;28(14):2381-2388.
9. Khandelwal N, Duncan I, Ahmed T, Rubinstein E, Pegus C. Oral chemotherapy program improves adherence and reduces medication wastage and hospital admission. J Natl Compr Canc Netw. 2012;10(5):618-625.
10. Pharmacy Benefits Management Services, Medical Advisory Panel and VISN Pharmacist Executives. VHA guidance on oral anticancer drugs dispensing and monitoring. Washington, DC: Veterans Health Administration, Department of Veterans Affairs; September 2012.
Author and Disclosure Information
Dr. Shields is a hematology/oncology clinical pharmacy specialist in the Department of Pharmacy, Ms. Englert is an outpatient oncology clinic nurse in the Division of Hematology/Oncology, and Dr. Passero is chief of the Hematology/ Oncology Division, all at the VA Pittsburgh Healthcare System in Pennsylvania. Dr. Passero is also the director of the Hematology/Oncology Fellowship Program at the University of Pittsburgh Medical Center.
Dr. Shields is a hematology/oncology clinical pharmacy specialist in the Department of Pharmacy, Ms. Englert is an outpatient oncology clinic nurse in the Division of Hematology/Oncology, and Dr. Passero is chief of the Hematology/ Oncology Division, all at the VA Pittsburgh Healthcare System in Pennsylvania. Dr. Passero is also the director of the Hematology/Oncology Fellowship Program at the University of Pittsburgh Medical Center.
Author and Disclosure Information
Dr. Shields is a hematology/oncology clinical pharmacy specialist in the Department of Pharmacy, Ms. Englert is an outpatient oncology clinic nurse in the Division of Hematology/Oncology, and Dr. Passero is chief of the Hematology/ Oncology Division, all at the VA Pittsburgh Healthcare System in Pennsylvania. Dr. Passero is also the director of the Hematology/Oncology Fellowship Program at the University of Pittsburgh Medical Center.
A VA Pittsburgh Healthcare System program to improve control of oral anticancer therapy medications has increased patient adherence, decreased toxicity, and reduced waste.
A VA Pittsburgh Healthcare System program to improve control of oral anticancer therapy medications has increased patient adherence, decreased toxicity, and reduced waste.
The availability and popularity of orally administered anticancer therapy has drastically increased in recent years. Currently, there are more than 40 oral anticancer medications on the market in the U.S.; and about 40% of all newly FDA-approved anticancer agents in 2013 and 2014 have been oral agents.1
The use of these agents is often driven by patients. In a review of 103 patients, an overwhelming 90% of patients who were to receive palliative chemotherapy chose oral chemotherapy over IV chemotherapy, assuming equivalent efficacy, toxicity, clinic visits, and blood work schedules. However, 70% of these patients were unwilling to sacrifice any efficacy between IV and oral chemotherapy.2 Several other factors influenced the preference of oral chemotherapy for patients, including convenience, avoidance of central venous catheter placement or need for other IV access, control of the environment in which they receive chemotherapy, and travel considerations.2 In addition to these practical benefits, patients reported a great sense of freedom with oral chemotherapy.3
Although patients may prefer oral anticancer therapies, for providers, several issues exist surrounding the shift in delivery of anticancer therapies from IV to oral therapies. The most significant concern is patient adherence, defined as “the extent to which patients take medications as prescribed by their health care providers.”4
Adherence rates in clinical trials are often excellent; however, real-life adherence rates tend to be less optimal.5 In a study of women receiving 5 years of adjuvant tamoxifen for breast cancer, the researchers determined that patients filled their prescription 87% of the time the first year of treatment. This rate of adherence dramatically decreased to only 50% by year 4.6
These results suggest that a longer duration of treatment can adversely affect adherence. Duration of treatment is of great concern for providers specifically when considering the need for indefinite duration of use of tyrosine kinase inhibitors for the treatment of chronic myeloid leukemia. In 2011, Ibrahim and colleagues showed that imatinib adherence rates of 85% have been directly correlated to the loss of complete cytogenetic response (26.8% vs 1.5%, P = .0002) and lower probability of continuing imatinib (64.5% vs 90.6%, P = .006).7 Whereas several factors are known to influence adherence rates, Marin and colleagues identified the 2 main risk factors for poor adherence to imatinib: younger age and adverse effects (AEs). The median age for patients with adherence rates of 90% was 43.8 years compared with 53.8 years for patients with > 90% adherence rate. Imatinib AEs, such as asthenia, nausea, muscle cramps, and bone or joint pains, also significantly decreased imatinib adherence.8
In addition to concerns for poor therapeutic outcomes and suboptimal toxicity management, lack of adherence to oral anticancer regimens can result in significant waste of medication and increased health care costs. In most situations, IV anticancer treatment cycles are repeated every 1 to 3 weeks and allow the patient more frequent face-to-face interaction with the oncology team. Oral chemotherapy, on the other hand, is traditionally dispensed as a 28- to 30-day supply. This practice often limits the patient’s access to the oncology team for full evaluation of adherence and toxicity, which can lead to oral anticancer therapy waste.
Khandelwal and colleagues investigated the utility of a split-fill to decrease health care costs. In the splitfill process, patients were dispensed only days 1 to 16 of their oral anticancer medication at the initial fill. If the medication was tolerated and the prescribing provider deemed no changes in treatment necessary, the remaining 12 to 14 days of the cycle were then dispensed. Unfortunately, all insurance companies did not authorize the split-fill plan, thus preventing some patients in the study to participate in this cost savings strategy. However, it was determined for the patients who discontinued therapy, about 34% could have reduced wastage had they been on the split-fill plan, resulting in an average direct savings of $934.20 per patient who discontinued use.9
In 2011, the Hematology/Oncology and Pharmacy divisions at the VA Pittsburgh Healthcare System (VAPHS) examined the issues surrounding dispensing and monitoring of oral anticancer therapy. Higher utilization of oral anticancer therapy was identified and in parallel, increasing rates of patient nonadherence, toxicity, and wasted medication. Originally, most providers dispensed oral anticancer therapy as a 1-month supply. However, in efforts to increase adherence, limit toxicity, and avoid medication waste, some oncologists began only dispensing a 1- to 2-week supply of medication per visit. This shift in practice led to a pilot study evaluating the utility of limiting all oral chemotherapy to a 7- to 14-day supply during the first 3 months of treatment.
Pilot Study
The goal of the pilot study was to increase adherence, decrease toxicity, and avoid medication waste. Patients who initiated a new oral anticancer therapy between August 15, 2011, and February 15, 2012, were enrolled in the pilot study. Each patient was to be provided only a 14-day supply of medication at each visit. Patients on concurrent chemoradiotherapy with capecitabine were dispensed only a 7-day supply (as they were at VAPHS daily for radiation) of medication. A pillbox designated for oral anticancer therapy was provided and filled by the clinical pharmacist before leaving the hematology/oncology clinic.
Patients were provided a calendar to record the time and date of their oral anticancer therapy selfadministration. Patients were also asked to record any missed doses and the reasons they missed taking the medication. In addition, patients were counseled on the importance of medication adherence, food-drug and drug-drug interaction, proper storage and administration of medications, and when/who to notify if AEs occurred.
Patients were asked to return the pillboxes to the hematology/oncology clinic for the next refill and meet with the clinical pharmacist. A pill count was performed at each visit in addition to screening for toxicity. If a toxicity was identified, the prescribing provider was contacted for further orders. If no changes were needed, the remaining 14-day supply was dispensed to the patient at that time. Adherence and toxicity were documented in the electronic medical record (EMR) at each visit.
Thirty patients were started on 32 different oral anticancer therapies (Table 1) over the 6 months between August 15, 2011, and February 15, 2012. Patients already initiated on oral anticancer therapy before the start date were not included in this analysis. This number also did not include patients on lenalidomide, because this medication is mailed directly to the patient from a specialty pharmacy. All patients were male; average age was 68 (45-89) years; 83.3% of patients were white; and 83% of patients had a stage IV disease.
Adherence assessments using pill counts and medication calendars demonstrated that 6% (121/2,037) of doses that were dispensed were not taken. Overall adherence rate was 94%. The average patient adherence rate was 93.2%. Adverse events contributed to 62.8% of doses omitted (Table 2). Some AEs (eg, nausea, vomiting, and hypertension) were deemed preventable or modifiable with better symptom management. However, the majority of AEs that led to dose omission were not preventable.
Ten patients had their treatments discontinued midcycle, leading to 24.7% of missed doses. Adverse events led to 70% of discontinuation, whereas 20% resulted from disease progression. In both cases of disease progression, the patient was given a 30-day supply before the restaging scan, and in both cases this led to oral anticancer therapy waste. An additional 12.3% of doses were omitted due to hospitalization of patients.
Over a 6-month period, an estimated $32,314 was saved under the 14-day dosing pilot. This number was reached by subtracting the number of pills actually dispensed under pilot protocol from the number of pills that would have been dispensed under old dispensing standards (usually 28- to 30-day supply), then multiplying the difference by the cost per pill.
The results of this study were presented to the Pharmacy and Therapeutics Committee and led to the approval to continue with the 14-day dispensing protocol at VAPHS in March 2012. In addition, the pilot served as the backbone for the VHA Guidance on Oral Chemotherapy Dispensing and Monitoring.10 As part of the guidance, a monitoring guide for all the FDA-approved oral anticancer therapies is maintained and available for all VA practitioners to access on the PBM website under the Clinical Guidance subheading.
Current Practice
From the time the original pilot was conducted, the number of available oral anticancer therapies has increased along with the patient volume. Due to these factors and the lack of a dedicated outpatient oncology clinical pharmacist, oncology nurses in the outpatient clinic now direct the education, dispensing, and monitoring of patients on oral chemotherapy.
Treatment Plan
An oral anticancer treatment plan is developed by the oncology physician and entered in the EMR as a progress note titled Treatment Plan. The treatment plan includes, disease, stage, curative vs palliative intent, premedications, oral anticancer medication, dose, route and frequency, cycle length and number of cycles, baseline and continuous monitoring parameters, follow-up with provider, and staging follow-up. Once the oncology clinical pharmacist approves a treatment plan, the oncology nursing staff ensures that all the prechemotherapy laboratory tests are ordered and helps arrange any additional tests needed (echocardiogram, electrocardiogram, etc). After all the prechemotherapy testing is complete, the oncology nurse phones the patientto schedule a date for chemotherapy education and to pick up the first 14-day supply.
Initial Visit
The oncology nurse meets with each patient receiving oral anticancer therapy and provides them with an oncology clinic information packet, which includes chemotherapy education, a medication sheet, questions and answers about chemotherapy, common AEs and ways to manage them, as well as tips for meeting with the nurse and physician. The oncology nurse then reviews the oral anticancer treatment the patient is to receive, including how to administer the medication and timing, whether to take with or without food, common AEs, storage, safe handling, contact name if a toxicity arises, and importance of adherence.
The patient is provided with a pillbox and encouraged to track any missed doses. The oncology nurse then reschedules the patient for the next appointment at the clinic no more than 14 days later. Some treatments require more frequent monitoring and therefore are only dispensed 7 days at a time.
First Follow-up Visit (7-14 days)
At the first follow-up visit, the oncology nurse reviews adherence and toxicity with the patients. If any toxicity is identified, the oncology nurse contacts the oncology physician for additional assessment and orders. If the patient demonstrates adherence and tolerability, an additional 7- to 14-day supply is dispensed and the next appointment is scheduled 7 to 14 days later.
Subsequent Follow-up Visits
The patient continues to follow up at least every 28 days after cycle 1. The oncology nurse practices veterancentered care when trying to determine the appropriate follow-up for each patient. Continuous monitoring of toxicity and adherence occurs at each visit. If toxicity develops, monitoring may be increased at the discretion of the oncology nurse or physician.
Conclusions
Patients at VAPHS have been very receptive to the oral anticancer therapy protocol. Few patients have refused the initial biweekly visits, and many patients appreciate the special attention being focused on their treatment. The facility hopes to be able to expand its oral anticancer monitoring protocol to a telehealth clinic to help reduce the travel time of many patients. Additionally, as the program continues to expand, it is hoped it will be able to support a full-time outpatient oncology clinical pharmacist with a scope of practice to help manage toxicity and continue to improve adherence rates.
Author disclosures
The authors report no actual or potential conflicts of interest with regard to this article.
Disclaimer
The opinions expressed herein are those of the authors and do not necessarily reflect those of Federal Practitioner, Frontline Medical Communications Inc., the U.S. Government, or any of its agencies. This article may discuss unlabeled or investigational use of certain drugs. Please review the complete prescribing information for specific drugs or drug combinations—including indications, contraindications, warnings, and adverse effects—before administering pharmacologic therapy to patients.
1. Center Watch. FDA approved drugs. Center Watch Website. http://www.centerwatch.com/drug-information/fda-approved-drugs/year/2014. Accessed October 24, 2014.
2. Liu G, Franssen E, Fitch Mi, Warner E. Patient preferences for oral versus intravenous palliative chemotherapy. J Clin Oncol. 1997;15(1):110-115.
3. Catania C, Didier F, Leon ME, et al. Perception that oral anticancer treatments are less efficacious: Development of a questionnaire to assess the possible prejudices of patients with cancer. Breast Cancer Res Treat. 2005;92(3):265-272.
4. Kelly A, Agius CR. Improving adherence to endocrine therapies: The role of advanced practice nurses. Oncology (Williston Park). 2006;20(10 Nurse Ed):50-54.
5. Prasad V, Massey PR, Fojo T. Oral anticancer drugs: How limited dosing options and dose reductions may affect outcomes in comparative trials and efficacy in patients. J Clin Oncol. 2014;32(15):1620-1629.
6. Partridge AH, Wang PS, Winer EP, Avorn J. Nonadherence to adjuvant tamoxifen therapy in women with primary breast cancer. J Clin Oncol. 2003;21(4):602-606.
7. Ibrahim A, Eliasson L, Apperley JF, et al. Poor adherence is the main reason for loss of CCyR and imatinib failure for chronic myeloid leukemia patients on longterm therapy. Blood. 2011;117(14):3733-3736.
8. Marin D, Bazeos A, Mahon FX, et al. Adherence is the critical factor for achieving molecular responses in patients with chronic myeloid leukemia who achieve complete cytogenetic responses on imatinib. J Clin Oncol. 2010;28(14):2381-2388.
9. Khandelwal N, Duncan I, Ahmed T, Rubinstein E, Pegus C. Oral chemotherapy program improves adherence and reduces medication wastage and hospital admission. J Natl Compr Canc Netw. 2012;10(5):618-625.
10. Pharmacy Benefits Management Services, Medical Advisory Panel and VISN Pharmacist Executives. VHA guidance on oral anticancer drugs dispensing and monitoring. Washington, DC: Veterans Health Administration, Department of Veterans Affairs; September 2012.
References
1. Center Watch. FDA approved drugs. Center Watch Website. http://www.centerwatch.com/drug-information/fda-approved-drugs/year/2014. Accessed October 24, 2014.
2. Liu G, Franssen E, Fitch Mi, Warner E. Patient preferences for oral versus intravenous palliative chemotherapy. J Clin Oncol. 1997;15(1):110-115.
3. Catania C, Didier F, Leon ME, et al. Perception that oral anticancer treatments are less efficacious: Development of a questionnaire to assess the possible prejudices of patients with cancer. Breast Cancer Res Treat. 2005;92(3):265-272.
4. Kelly A, Agius CR. Improving adherence to endocrine therapies: The role of advanced practice nurses. Oncology (Williston Park). 2006;20(10 Nurse Ed):50-54.
5. Prasad V, Massey PR, Fojo T. Oral anticancer drugs: How limited dosing options and dose reductions may affect outcomes in comparative trials and efficacy in patients. J Clin Oncol. 2014;32(15):1620-1629.
6. Partridge AH, Wang PS, Winer EP, Avorn J. Nonadherence to adjuvant tamoxifen therapy in women with primary breast cancer. J Clin Oncol. 2003;21(4):602-606.
7. Ibrahim A, Eliasson L, Apperley JF, et al. Poor adherence is the main reason for loss of CCyR and imatinib failure for chronic myeloid leukemia patients on longterm therapy. Blood. 2011;117(14):3733-3736.
8. Marin D, Bazeos A, Mahon FX, et al. Adherence is the critical factor for achieving molecular responses in patients with chronic myeloid leukemia who achieve complete cytogenetic responses on imatinib. J Clin Oncol. 2010;28(14):2381-2388.
9. Khandelwal N, Duncan I, Ahmed T, Rubinstein E, Pegus C. Oral chemotherapy program improves adherence and reduces medication wastage and hospital admission. J Natl Compr Canc Netw. 2012;10(5):618-625.
10. Pharmacy Benefits Management Services, Medical Advisory Panel and VISN Pharmacist Executives. VHA guidance on oral anticancer drugs dispensing and monitoring. Washington, DC: Veterans Health Administration, Department of Veterans Affairs; September 2012.
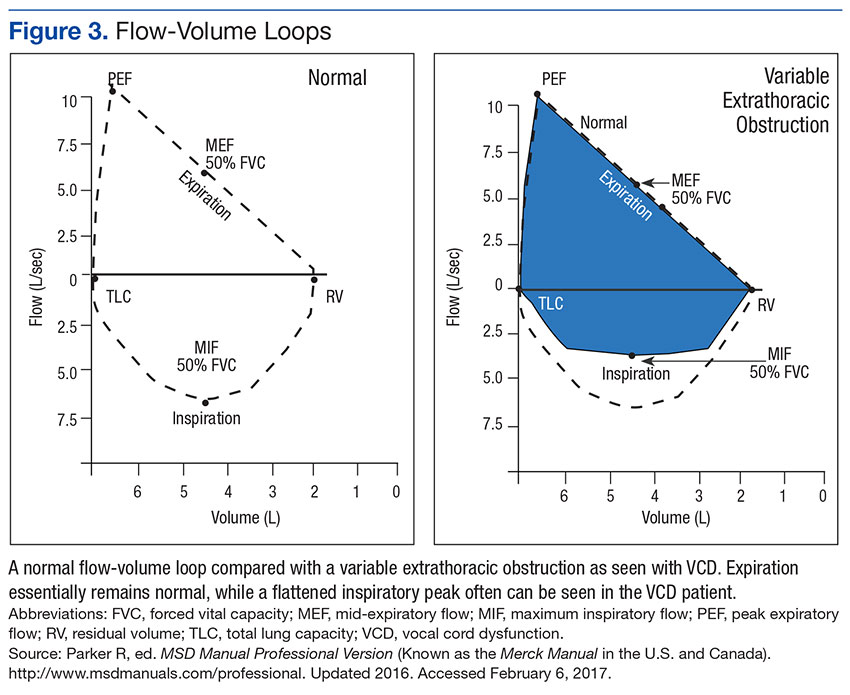
Vocal cord dysfunction (VCD), also known as paradoxical vocal cord movement, is described as paroxysms of glottis obstruction due to true vocal cord adduction.1 Since VCD presents as a constellation of symptoms associated with dyspnea, it often is misdiagnosed as asthma.2 Vocal cord dysfunction often manifests as episodic dyspnea and wheezing, may occur with exercise, and may be minimally responsive to initial therapies. Flattened inspiratory curves may be noted on pulmonary function tests (PFTs), but direct laryngoscopy is the gold standard for diagnosis.3 A cohort of proven patients with VCD with a plateau in the inspiratory curve of PFTs also had a plateau on expiratory phase in 81% of cases.4
The differential diagnosis of patients presenting with upper airway symptoms is broad. It must include VCD, asthma, angioedema, laryngomalacia, vocal cord polyps, vocal cord tumors, and neurologic conditions such as brain stem compression or movement disorders. Essentially, all movement disorders of vocal cords must be considered, and organic causes of this movement disorder can be evaluated by visualization of the vocal cords. Triggers for VCD include exercise, airborne irritants, gastroesophageal reflux disease (GERD), allergic rhinitis, medications, and psychological conditions.5 Additionally, VCD can coexist with asthma, further complicating accurate diagnoses.6
Therapies are reported in case studies, but no large randomized controlled trials exist to evaluate current therapy options. Primary treatments of asthma therapy were largely ineffective, and ideal therapy includes a multidisciplinary approach, including speech therapy to optimize laryngeal control and treatment of all identified laryngeal irritants.6
The prevalence of VCD is unknown, with no prospective cohort studies completed to date and conflicting diagnostic criteria used in many case studies.7 A prevalence of 2.8% was noted in one particular cohort of 1,028 patients admitted to a rehabilitation center in a calendar year with the primary pulmonary diagnosis on admission.6 Females seemed to be affected at a higher ratio than were males, 2 to 3 females per 1 male diagnosis.7
In the military population, certain risk factors were noted in returning deployed members, including anxiety/high stress, exercise, and acute respiratory illnesses.8 In that particular cohort, 72% positive predictive value was noted for VCD if flattened inspiratory flow loops with negative methacholine challenge were present.
Diagnostic criteria are challenging, as symptoms such as dyspnea may be present acutely, last < 2 minutes, be self-limiting, and completely resolve outside of acute events. Stridor may be noted, primarily above the vocal cords, and less audible on chest auscultation.6 A goal of therapy, in addition to dedicated speech pathologist input, is optimizing comedical conditions, including GERD, allergic rhinitis, concomitant asthma, and any psychological diagnoses.9
Athletes are a particular subset of patients with VCD who are crucial to appropriately diagnose, including a detailed history and physical, PFTs, and proceeding to direct laryngoscopy to confirm diagnoses.10 Behavioral management includes rescue breathing techniques, and speech therapy programs focus on relaxation of the larynx and diaphragmatic breathing techniques, with the goal of establishing sense of control during acute events.10 Military service members are expected to operate at a high-intensity level similar to that of athletes, and treatments considered for athletes are applicable to military service members as well. Military strength and cardiovascular standards are measured by a combination of push-ups, sit-ups, and a run test, in addition to waist measurements. Some of the cohort were identified during physical fitness standard failures, usually in the run test, and ultimately received a pulmonology referral for wheezing or dyspnea with exertion. The objective of this retrospective cohort study was to evaluate 100 consecutively diagnosed cases of VCD in a military treatment facility.
Methods
The authors conducted a retrospective chart review of DoD military medical records of outpatient diagnoses in 100 consecutive diagnoses of VCD from January 2011 to February 2014. Institutional review board approval was obtained under Project RSM20130001E by the Exempt Determination Official at Eglin Air Force Base (AFB), Florida.
All cases were identified at time of VCD visualization and were diagnosed with video stroboscopy by speech therapy or by visual laryngoscopy by the otolaryngology or pulmonology departments via direct visualization.
Cases were collected chronologically, and all diagnosed cases at Eglin AFB hospital were included. Follow-up was scheduled with all patients diagnosed in Speech Therapy, and most patients were concurrently treated by Pulmonology or Allergy/Immunology. Pulmonary function tests were obtained in 98 of the 100 diagnosed cases. Patients eligible for care at Eglin AFB included active-duty and Reserve military members plus dependents and retirees.
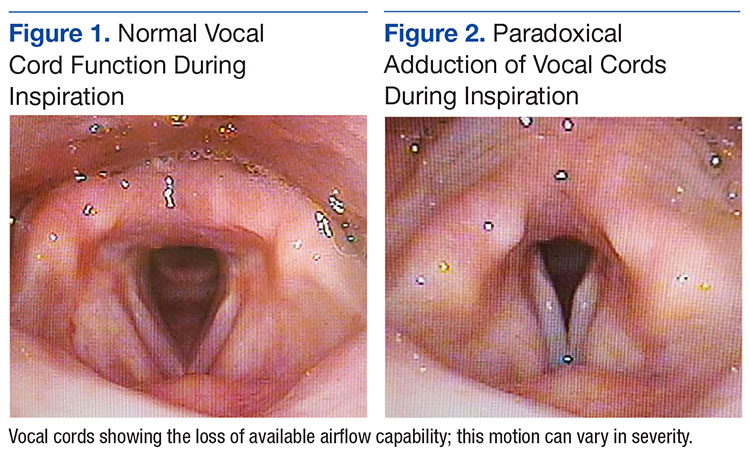
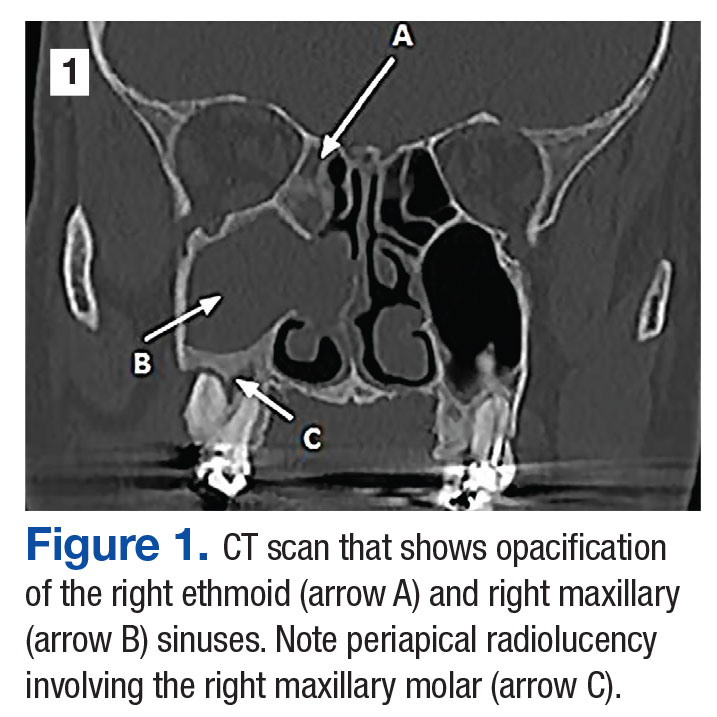
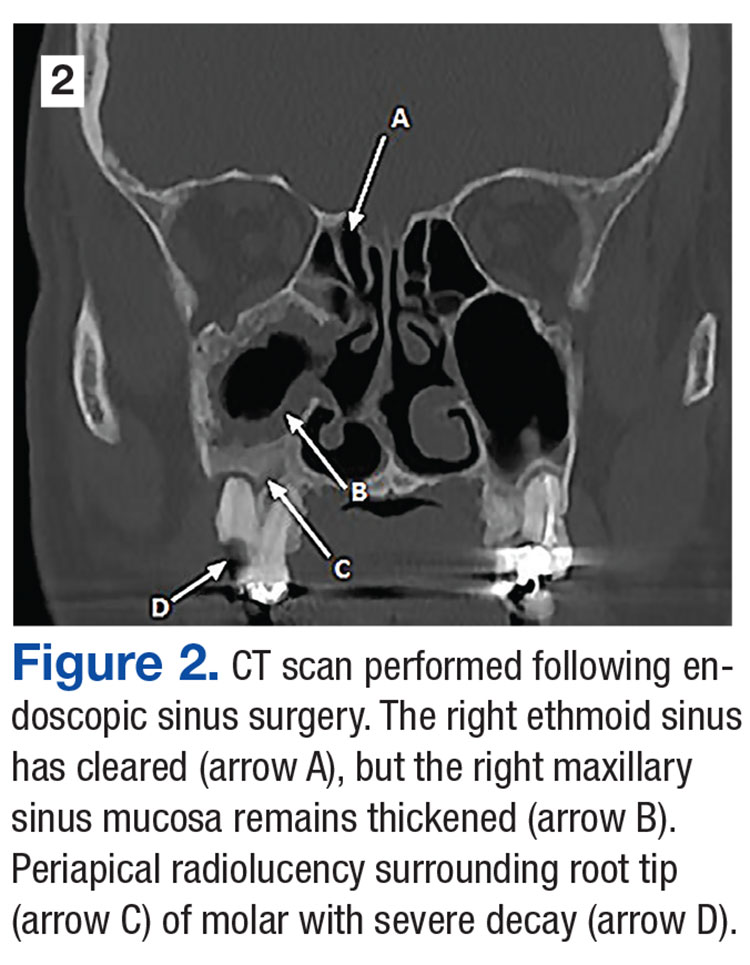
The majority of patients diagnosed in this cohort were seen and diagnosed by Speech Therapy. Video stroboscopy is based on the principle that a movement of an object higher than a certain flicker rate appears to stand still to direct visualization, but with a rate of light exposure and imaging above the flicker rate by video, the true movement of the object can be identified.¹¹ Video stroboscopy is considered highly sensitive for organic disorders of vocal cords, but it is not specific for either organic or dysfunctional disorders.¹¹ It is still the gold standard above direct visualization, as it can detect abnormal movement of vocal cords above the critical rate that the human eye would perceive as not moving due to the frequency of movement (Figures 1 & 2).¹¹
In an older study, laryngoscopy was able to diagnose 100% of patients with symptomatic paradoxical vocal cord movement and additional 60% asymptomatic patients with a constellation of symptoms consistent with paradoxical vocal cord movement.¹²
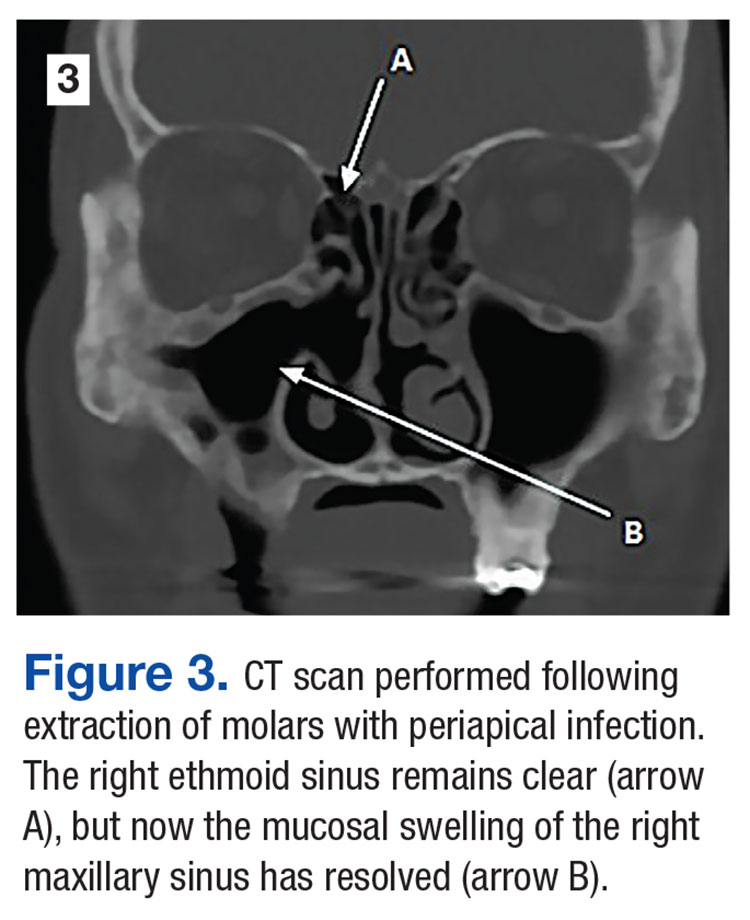
Speech Therapy; Ear, Nose, and Throat (ENT); and Pulmonology may not perform direct visualization in these patients at initial presentation due to other suspected diagnoses. A more common test is the PFT, especially if asthma or other airway tract diseases are suspected (Figure 3).
Patient Descriptions
Study patients were referred for a variety of reasons, often from primary care clinics for concerns for asthma, episodic dyspnea, wheezing, or decreased exercise tolerance thought to be related to pulmonary or allergy causes. Pulmonology worked closely with Speech Therapy and referred VCD cases for speech evaluation, including video stroboscopy. Notably, of the patients in this cohort, although some were suspected to have asthma, those patients were ruled out during part of the pulmonology evaluation, both with PFT testing and methacholine challenges. An asthma diagnosis is important in a military treatment facility, as asthma is often grounds for discharge.
Patients ranged in age from 13 to 68 years, with a median age at 31 years diagnosis. Thirty-nine females and 61 males comprised the total case series. Speech Therapy diagnosed 97 patients, 96 were diagnosed at Eglin AFB hospital via stroboscopy. One patient was diagnosed off-base by Speech Therapy via direct visualization, 1 patient was diagnosed by Pulmonology on-base via direct visualization, and 2 patients were diagnosed by ENT on-base via direct visualization. These patients had direct laryngoscopy completed, often to rule out other organic causes for upper airway disease processes, and were found to have visual paradoxical vocal cord movement. Ninety-eight patients completed PFTs. Several patients were lost to follow-up, as can be common in a military population with frequent moves or members leaving service.
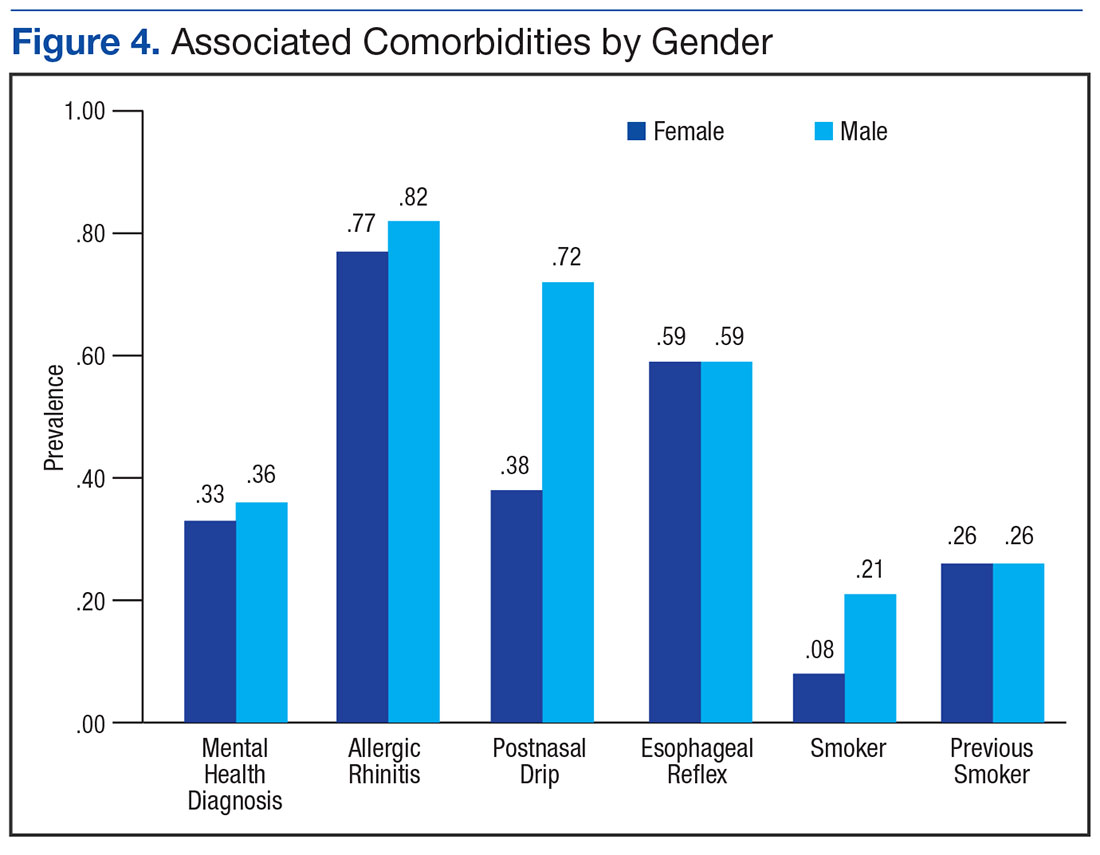
On record review, patient symptoms were present in the range of 2 months to 20 years, with a median duration of symptomatic reports lasting 2 years prior to diagnosis. Common diagnoses prior to visual VCD diagnosis included asthma, exercise-induced asthma, anxiety, and episodic wheezing. Risk factors that were evaluated in this case series included age, sex, body mass index (BMI), GERD, allergic rhinitis, postnasal drip, active smoker, previous smoker, and mental health diagnoses (Figure 4).
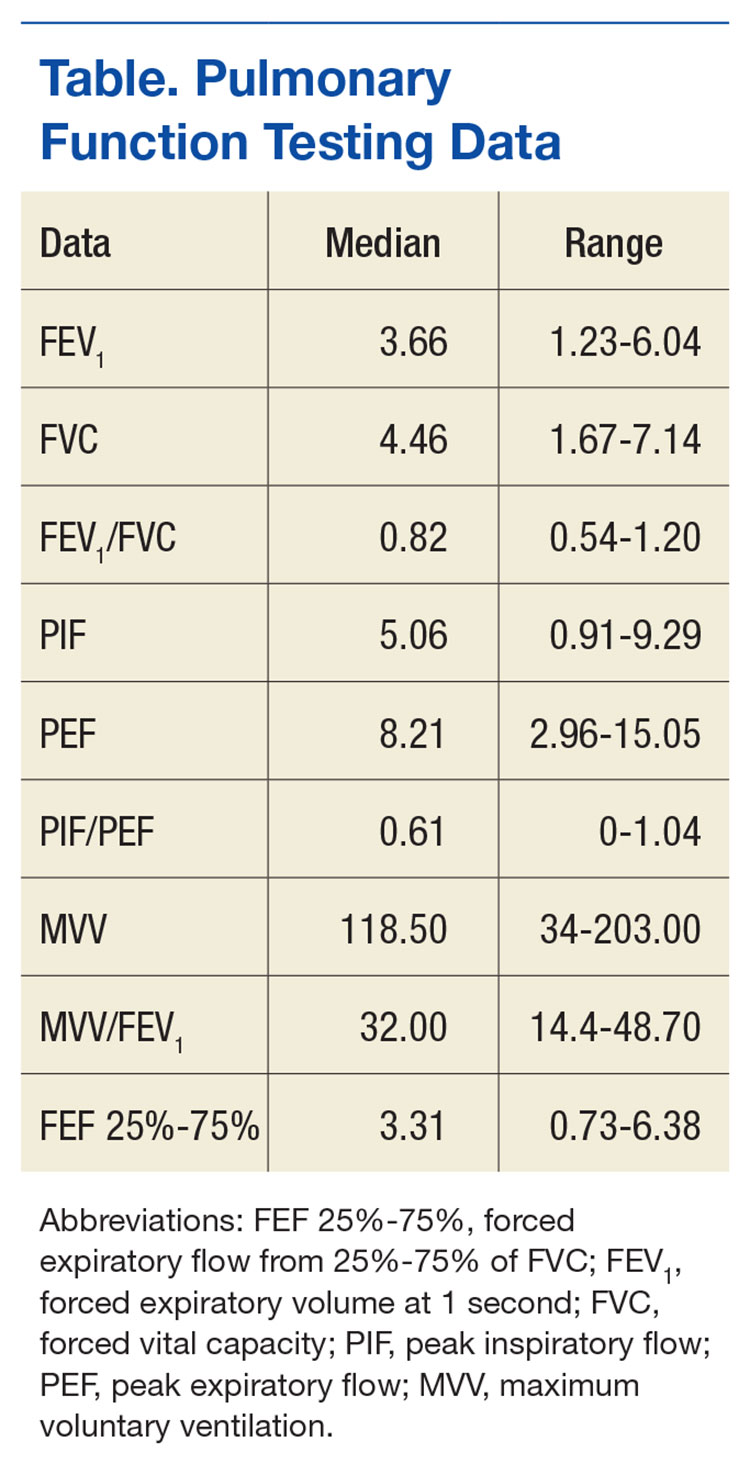
Pulmonary function test results were analyzed on 98 patients, including forced expiratory volume in 1 second (FEV1); forced vital capacity (FVC), FEV1/FVC ratio; peak inspiratory flow (PIF) and peak expiratory flow (PEF)—available in 97 studies; forced expiratory flow (FEF) at 25% to 75% of FVC (FEF 25%-75%)—available in 96 studies; and maximum voluntary ventilation (MVV) and MVV/FEV1 ratio—available in 60 of 98 PFTs.
Interventions
All patients diagnosed by Speech Therapy on-base were provided with laryngeal relaxation techniques, diaphragmatic breathing techniques, and controlled inhale/exhale techniques at time of diagnosis, with frequent follow-up scheduled with Speech Therapy and Pulmonology. All diagnoses potentially contributing to laryngeal irritation were treated, including GERD, allergic rhinitis, smoking cessation, weight loss, and exercise recommendations as needed.
Patients reported improvement on follow-up appointments with Speech Therapy in overall control of symptoms, subjectively categorized as poor improvement, partial improvement, and complete improvement. This was a subjective measurement of improvement and fully dependent on follow-up care and patient reporting for improvement. No predefined number of follow-ups was determined; patients were followed monthly until they declined further care, fully improved, moved out of the military treatment system, or were lost to follow-up.
Treatment included structured Speech Therapy sessions. Response to treatment was subjectively qualified by patient report. Fifteen patients reported complete resolution of symptoms, 57 reported partial improvement, 24 reported poor improvement, and 4 patients were lost to follow-up.
Results
Risk factors for the diagnosis of VCD included possible associations with GERD, allergic rhinitis, smoking, prior smoking, BMI, and mental health diagnoses. Body mass index ranged from 17 to 36 in the case series, with median BMI of 27. Mental health diagnoses were present in 35 patients and included diagnoses of anxiety, depression, and adjustment disorders. Gastroesophageal reflux disease diagnosis was present in 59 of the case series patients, 80 had the diagnosis of allergic rhinitis, 63 were diagnosed with postnasal drip. Sixteen case series patients were current smokers. An additional 26 were previous smokers (at least 100 cigarettes in lifetime) for a total of 42 patients that were current or prior smokers.
The chart review was completed to evaluate for the presence of these diagnoses, which included previous treatments; for example, proton pump inhibitors for GERD, antidepressants for depression, or intranasal steroids for allergic rhinitis. The diagnosis was counted as present if the patient was currently being treated for the particular diagnosis in question.
PFT Data
Data from PFTs were available for 98 of 100 cases diagnosed. Review of data across all 98 patients is noted for median FEV1 of 3.6, a median FVC of 4.5, with ratio of 0.80.
The median PIF was 5.1, and median PEF was 8.2, with a PIF/PEF ratio of 0.62. Mid-flow volumes also were analyzed, and FEF 25% to 75% median was 3.3. For the 60 patients that had minute ventilator volumes calculated, the median MVV was 118.5 L/min and median MVV/FEV1 was 32.0 (Table).
Since PFT values vary according to age, sex, and ethnicity, PFTs were analyzed for percent predicted values based on age, gender, and race. Notably, median values for FEV1, FVC, and PEF were all close to 100% of the predicted value. The MVV percent predicted was available in 60 cases and was 93% of predicted values. The most significant difference from expected values was FEF 25% to 75%, at 84% of expected results.
Flow-volume loop evaluations on the 97 PFTs available were completed, and 58 of the 97 were noted for variable extrathoracic airway obstruction consistent with inspiratory inhibition in the patient population. This is 60% of the available PFTs in this cohort study.
Discussion
This retrospective chart review of 100 consecutive VCD diagnoses in a military treatment facility reinforces many of the findings currently available in the literature. As illustrated in a Chest review article, the diagnosis of VCD on history, physical examination, or PFTs remains ellusive.1 The PFT evaluation contains some subjectivity regarding the flattening of inspiratory flow-volume loops and is not routinely reported in PFT results. In patients diagnosed with VCD, a clear consensus of treatment modalities remains lacking. Modification of risk factors (allergic rhinitis, GERD, smoking cessation, weight loss) assisted in self-reported patient improvement, as did focused speech therapy.
The median age of 31 years, likely reflected the younger military population served at Eglin AFB. Seventy-five of these patients were currently on active duty, 6 were retired from active duty (veterans), and 19 were dependents. The median time of symptoms to diagnosis was 2 years. Prior misdiagnosis with other diseases such as asthma was common. Also, referral to Pulmonology and Speech Therapy was usually completed after failed outpatient primary care management for the alternative diagnoses.
Improvement with therapy was mixed, and during the time of documented follow-up, 72 patients reported complete or partial improvement. Most active-duty patients in the partial improvement category based this subjective reporting on their ability to meet military physical fitness standards.
Previous data suggested a female predominance, but this study population was 61% male. Military populations are about 80% to 85% male, so an increase in male diagnosis is expected.
Many patients in the patient cohort arrived as a result of Pulmonology referrals with a presumptive diagnoses of asthma but were determined not to have asthma through PFT results inconsistent with asthma, no improvement with β-agonist therapies, and negative methacholine challenges (if performed). These results prompted evaluations for other conditions and eventually a VCD diagnosis. As noted, exclusion of asthma is of particular importance in a military population, as medical discharges often are pursued in service members with asthma whether controlled or uncontrolled. Lag time to referral also is possible in failures of military physical, which prompted medical evaluation once several failures had occurred over a 1- to 2-year time frame.
The PFT data evaluation was inconclusive for statistically significant changes when compared with age-matched normal PFT values. This also was noted in previous studies of VCD cases. Most notable was percent predicted values of FEF 25% to 75%, with 84% of expected values. The FEV1, FVC, and PEF all fell within predicted values of normal, despite wide ranges in age, sex, and ethnicity among the subjects. Inspiratory flattening consistent with extrathoracic obstruction was present in 58 of the 97 PFTs available for review at Eglin AFB.
Limitations
Limitations to this retrospective case series are illustrated here. Cases were found only when VCD was diagnosed and coded; and it is the authors’ suspicion that many have been misdiagnosed or improperly treated for asthma or other pulmonary/oropharynx conditions. If providers are not familiar with VCD or if PFT readings do not comment on inspiratory findings, diagnosis is less likely. Some of the authors’ colleagues already have determined that postdeployment prevalence of VCD seems to be elevated.8
This cohort was completed on all patients in a military treatment facility, with 75 active-duty personnel, 6 veterans, and 19 dependents of varying ages. This case series is retrospective and tabulates suspected risk factors; stronger and more informative studies could certainly be completed in prospective studies (although likely difficult with low prevalence) or in treatment comparison studies at the time of diagnosis.
Since the cohort had varied and lengthy time to diagnosis from onset of related symptoms, the treatment patients received prior to diagnosis differed extensively. Diagnosis was completed by numerous primary care managers or other subspecialties prior to arrival to Pulmonology and Speech Therapy at Eglin AFB. Once diagnosed in Speech Therapy, consistent treatment options were provided to patients in accordance with standard of care.
It is the authors’ suspicion that VCD may have a higher prevalence than previously reported in the literature. Military service members are tested annually or biannually on physical fitness standards and are evaluated for medical reasons for recurrent fitness standard failures. This selection of patients is more likely to have a VCD evaluation as part of a comprehensive evaluation than is a healthy adult in a civilian population. A prospective study in military service members would be more fruitful and possibly yield a higher prevalence postdeployment.
Conclusion
Vocal cord dysfunction remains a difficult diagnosis to treat, because multiple comorbidities likely contribute to the diagnosis. This retrospective case series attempted to compile common themes and noted that most of the patients had 2 or more risk factors of smoking, allergic rhinitis, GERD, or mental health diagnoses. A prospective trial would be ideal to evaluate VCD further. A focused trial in the particular communities of athletes or of military service members may be of increased benefit to better define VCD. It is notable that 100 cases were found in a relatively short period for a community hospital, and prevalence may be higher than previously reported.
References
1. Morris MJ, Christopher KL. Diagnostic criteria for the classification of vocal cord dysfunction. Chest. 2010;138(5):1213-1223.
2. National Heart, Lung, and Blood Institute. Expert panel report 3: guidelines for the diagnoses and management of asthma. Full report 2007. https://www.nhlbi.nih.gov/files/docs/guidelines/asthgdln .pdf. Published 2007.Accessed February 1, 2017.
3. Newman KB, Mason UG III, Schmaling KB. Clinical features of vocal cord dysfunction. Am J Respir Crit Care Med. 1995;152(4, pt 1):1382-1386.
4. Sanz Santiago V, López Neyra A, Almería Gil E, Villa Asensi JR. Spirometry patterns in vocal cord dysfunction [in Spanish]. An Pediatr (Barc). 2013;78(3):173-177.
5. Deckert J, Deckert L. Vocal cord dysfunction. Am Fam Physician. 2010;81(2):156-159.
7. Campainha S, Ribeiro C, Guimar M, Lima R. Vocal cord dysfunction: a frequently forgotten entity. Case Rep Pulmonol. 2012;2012:525493.
8. Morris MJ, Oleszewski RT, Sterner JB, Allan PF. Vocal cord dysfunction related to combat deployment. Mil Med. 2013;178(11):1208-1212.
9. Al-Alwan A, Kaminsky D. Vocal cord dysfunction in athletes: clinical presentation and review of the literature. Phys Sportsmed. 2012;40(2):22-27.
10. Kenn K, Schmitz M. Prevalence of vocal cord dysfunction in patients with dyspnea. First prospective clinical study. Am J Respir Crit Care Med. 1997;155:A965.
11. Wendler, J, Nawka, T, Verges, D. Instructional course: videolaryngo-stroboscopy and phonetography—basic tools for diagnostics and documentation in the voice clinic. Poster presented at: 15th European Congress of Oto-Rhino-Laryngology, Head and Neck Surgery; September 11-16, 2004; Rodos-Kos, Greece.
12. Ibrahim WH, Gheriani HA, Almohamed AA, Raza T. Paradoxical vocal cord motion disorder: past, present and future. Postgrad Med J. 2007;83(977):164-172.
Dr. Nolt is a family physician at Joint Base Langley-Eustis in Virginia. Ms. Ennis is a speech language pathologist, and Dr. Ott and Dr. Roman are pulmonologists, all at Eglin Air Force Base in Florida. Dr. Ott is an assistant professor of medicine at F. Edward Herbert School of Medicine at the Uniformed Services University of the Health Sciences.
Author disclosures The authors report no actual or potential conflicts of interest with regard to this article.
Disclaimer The opinions expressed herein are those of the authors and do not necessarily reflect those of Federal Practitioner, Frontline Medical Communications Inc., the U.S. Government, or any of its agencies. This article may discuss unlabeled or investigational use of certain drugs. Please review the complete prescribing information for specific drugs or drug combinations—including indications, contraindications, warnings, and adverse effects—before administering pharmacologic therapy to patients.
Author and Disclosure Information
Dr. Nolt is a family physician at Joint Base Langley-Eustis in Virginia. Ms. Ennis is a speech language pathologist, and Dr. Ott and Dr. Roman are pulmonologists, all at Eglin Air Force Base in Florida. Dr. Ott is an assistant professor of medicine at F. Edward Herbert School of Medicine at the Uniformed Services University of the Health Sciences.
Author disclosures The authors report no actual or potential conflicts of interest with regard to this article.
Disclaimer The opinions expressed herein are those of the authors and do not necessarily reflect those of Federal Practitioner, Frontline Medical Communications Inc., the U.S. Government, or any of its agencies. This article may discuss unlabeled or investigational use of certain drugs. Please review the complete prescribing information for specific drugs or drug combinations—including indications, contraindications, warnings, and adverse effects—before administering pharmacologic therapy to patients.
The authors’ evaluation of vocal cord dysfunction cases reveals that prevalence may be higher than previously reported in the literature.
The authors’ evaluation of vocal cord dysfunction cases reveals that prevalence may be higher than previously reported in the literature.
Vocal cord dysfunction (VCD), also known as paradoxical vocal cord movement, is described as paroxysms of glottis obstruction due to true vocal cord adduction.1 Since VCD presents as a constellation of symptoms associated with dyspnea, it often is misdiagnosed as asthma.2 Vocal cord dysfunction often manifests as episodic dyspnea and wheezing, may occur with exercise, and may be minimally responsive to initial therapies. Flattened inspiratory curves may be noted on pulmonary function tests (PFTs), but direct laryngoscopy is the gold standard for diagnosis.3 A cohort of proven patients with VCD with a plateau in the inspiratory curve of PFTs also had a plateau on expiratory phase in 81% of cases.4
The differential diagnosis of patients presenting with upper airway symptoms is broad. It must include VCD, asthma, angioedema, laryngomalacia, vocal cord polyps, vocal cord tumors, and neurologic conditions such as brain stem compression or movement disorders. Essentially, all movement disorders of vocal cords must be considered, and organic causes of this movement disorder can be evaluated by visualization of the vocal cords. Triggers for VCD include exercise, airborne irritants, gastroesophageal reflux disease (GERD), allergic rhinitis, medications, and psychological conditions.5 Additionally, VCD can coexist with asthma, further complicating accurate diagnoses.6
Therapies are reported in case studies, but no large randomized controlled trials exist to evaluate current therapy options. Primary treatments of asthma therapy were largely ineffective, and ideal therapy includes a multidisciplinary approach, including speech therapy to optimize laryngeal control and treatment of all identified laryngeal irritants.6
The prevalence of VCD is unknown, with no prospective cohort studies completed to date and conflicting diagnostic criteria used in many case studies.7 A prevalence of 2.8% was noted in one particular cohort of 1,028 patients admitted to a rehabilitation center in a calendar year with the primary pulmonary diagnosis on admission.6 Females seemed to be affected at a higher ratio than were males, 2 to 3 females per 1 male diagnosis.7
In the military population, certain risk factors were noted in returning deployed members, including anxiety/high stress, exercise, and acute respiratory illnesses.8 In that particular cohort, 72% positive predictive value was noted for VCD if flattened inspiratory flow loops with negative methacholine challenge were present.
Diagnostic criteria are challenging, as symptoms such as dyspnea may be present acutely, last < 2 minutes, be self-limiting, and completely resolve outside of acute events. Stridor may be noted, primarily above the vocal cords, and less audible on chest auscultation.6 A goal of therapy, in addition to dedicated speech pathologist input, is optimizing comedical conditions, including GERD, allergic rhinitis, concomitant asthma, and any psychological diagnoses.9
Athletes are a particular subset of patients with VCD who are crucial to appropriately diagnose, including a detailed history and physical, PFTs, and proceeding to direct laryngoscopy to confirm diagnoses.10 Behavioral management includes rescue breathing techniques, and speech therapy programs focus on relaxation of the larynx and diaphragmatic breathing techniques, with the goal of establishing sense of control during acute events.10 Military service members are expected to operate at a high-intensity level similar to that of athletes, and treatments considered for athletes are applicable to military service members as well. Military strength and cardiovascular standards are measured by a combination of push-ups, sit-ups, and a run test, in addition to waist measurements. Some of the cohort were identified during physical fitness standard failures, usually in the run test, and ultimately received a pulmonology referral for wheezing or dyspnea with exertion. The objective of this retrospective cohort study was to evaluate 100 consecutively diagnosed cases of VCD in a military treatment facility.
Methods
The authors conducted a retrospective chart review of DoD military medical records of outpatient diagnoses in 100 consecutive diagnoses of VCD from January 2011 to February 2014. Institutional review board approval was obtained under Project RSM20130001E by the Exempt Determination Official at Eglin Air Force Base (AFB), Florida.
All cases were identified at time of VCD visualization and were diagnosed with video stroboscopy by speech therapy or by visual laryngoscopy by the otolaryngology or pulmonology departments via direct visualization.
Cases were collected chronologically, and all diagnosed cases at Eglin AFB hospital were included. Follow-up was scheduled with all patients diagnosed in Speech Therapy, and most patients were concurrently treated by Pulmonology or Allergy/Immunology. Pulmonary function tests were obtained in 98 of the 100 diagnosed cases. Patients eligible for care at Eglin AFB included active-duty and Reserve military members plus dependents and retirees.
The majority of patients diagnosed in this cohort were seen and diagnosed by Speech Therapy. Video stroboscopy is based on the principle that a movement of an object higher than a certain flicker rate appears to stand still to direct visualization, but with a rate of light exposure and imaging above the flicker rate by video, the true movement of the object can be identified.¹¹ Video stroboscopy is considered highly sensitive for organic disorders of vocal cords, but it is not specific for either organic or dysfunctional disorders.¹¹ It is still the gold standard above direct visualization, as it can detect abnormal movement of vocal cords above the critical rate that the human eye would perceive as not moving due to the frequency of movement (Figures 1 & 2).¹¹
In an older study, laryngoscopy was able to diagnose 100% of patients with symptomatic paradoxical vocal cord movement and additional 60% asymptomatic patients with a constellation of symptoms consistent with paradoxical vocal cord movement.¹²
Speech Therapy; Ear, Nose, and Throat (ENT); and Pulmonology may not perform direct visualization in these patients at initial presentation due to other suspected diagnoses. A more common test is the PFT, especially if asthma or other airway tract diseases are suspected (Figure 3).
Patient Descriptions
Study patients were referred for a variety of reasons, often from primary care clinics for concerns for asthma, episodic dyspnea, wheezing, or decreased exercise tolerance thought to be related to pulmonary or allergy causes. Pulmonology worked closely with Speech Therapy and referred VCD cases for speech evaluation, including video stroboscopy. Notably, of the patients in this cohort, although some were suspected to have asthma, those patients were ruled out during part of the pulmonology evaluation, both with PFT testing and methacholine challenges. An asthma diagnosis is important in a military treatment facility, as asthma is often grounds for discharge.
Patients ranged in age from 13 to 68 years, with a median age at 31 years diagnosis. Thirty-nine females and 61 males comprised the total case series. Speech Therapy diagnosed 97 patients, 96 were diagnosed at Eglin AFB hospital via stroboscopy. One patient was diagnosed off-base by Speech Therapy via direct visualization, 1 patient was diagnosed by Pulmonology on-base via direct visualization, and 2 patients were diagnosed by ENT on-base via direct visualization. These patients had direct laryngoscopy completed, often to rule out other organic causes for upper airway disease processes, and were found to have visual paradoxical vocal cord movement. Ninety-eight patients completed PFTs. Several patients were lost to follow-up, as can be common in a military population with frequent moves or members leaving service.
On record review, patient symptoms were present in the range of 2 months to 20 years, with a median duration of symptomatic reports lasting 2 years prior to diagnosis. Common diagnoses prior to visual VCD diagnosis included asthma, exercise-induced asthma, anxiety, and episodic wheezing. Risk factors that were evaluated in this case series included age, sex, body mass index (BMI), GERD, allergic rhinitis, postnasal drip, active smoker, previous smoker, and mental health diagnoses (Figure 4).
Pulmonary function test results were analyzed on 98 patients, including forced expiratory volume in 1 second (FEV1); forced vital capacity (FVC), FEV1/FVC ratio; peak inspiratory flow (PIF) and peak expiratory flow (PEF)—available in 97 studies; forced expiratory flow (FEF) at 25% to 75% of FVC (FEF 25%-75%)—available in 96 studies; and maximum voluntary ventilation (MVV) and MVV/FEV1 ratio—available in 60 of 98 PFTs.
Interventions
All patients diagnosed by Speech Therapy on-base were provided with laryngeal relaxation techniques, diaphragmatic breathing techniques, and controlled inhale/exhale techniques at time of diagnosis, with frequent follow-up scheduled with Speech Therapy and Pulmonology. All diagnoses potentially contributing to laryngeal irritation were treated, including GERD, allergic rhinitis, smoking cessation, weight loss, and exercise recommendations as needed.
Patients reported improvement on follow-up appointments with Speech Therapy in overall control of symptoms, subjectively categorized as poor improvement, partial improvement, and complete improvement. This was a subjective measurement of improvement and fully dependent on follow-up care and patient reporting for improvement. No predefined number of follow-ups was determined; patients were followed monthly until they declined further care, fully improved, moved out of the military treatment system, or were lost to follow-up.
Treatment included structured Speech Therapy sessions. Response to treatment was subjectively qualified by patient report. Fifteen patients reported complete resolution of symptoms, 57 reported partial improvement, 24 reported poor improvement, and 4 patients were lost to follow-up.
Results
Risk factors for the diagnosis of VCD included possible associations with GERD, allergic rhinitis, smoking, prior smoking, BMI, and mental health diagnoses. Body mass index ranged from 17 to 36 in the case series, with median BMI of 27. Mental health diagnoses were present in 35 patients and included diagnoses of anxiety, depression, and adjustment disorders. Gastroesophageal reflux disease diagnosis was present in 59 of the case series patients, 80 had the diagnosis of allergic rhinitis, 63 were diagnosed with postnasal drip. Sixteen case series patients were current smokers. An additional 26 were previous smokers (at least 100 cigarettes in lifetime) for a total of 42 patients that were current or prior smokers.
The chart review was completed to evaluate for the presence of these diagnoses, which included previous treatments; for example, proton pump inhibitors for GERD, antidepressants for depression, or intranasal steroids for allergic rhinitis. The diagnosis was counted as present if the patient was currently being treated for the particular diagnosis in question.
PFT Data
Data from PFTs were available for 98 of 100 cases diagnosed. Review of data across all 98 patients is noted for median FEV1 of 3.6, a median FVC of 4.5, with ratio of 0.80.
The median PIF was 5.1, and median PEF was 8.2, with a PIF/PEF ratio of 0.62. Mid-flow volumes also were analyzed, and FEF 25% to 75% median was 3.3. For the 60 patients that had minute ventilator volumes calculated, the median MVV was 118.5 L/min and median MVV/FEV1 was 32.0 (Table).
Since PFT values vary according to age, sex, and ethnicity, PFTs were analyzed for percent predicted values based on age, gender, and race. Notably, median values for FEV1, FVC, and PEF were all close to 100% of the predicted value. The MVV percent predicted was available in 60 cases and was 93% of predicted values. The most significant difference from expected values was FEF 25% to 75%, at 84% of expected results.
Flow-volume loop evaluations on the 97 PFTs available were completed, and 58 of the 97 were noted for variable extrathoracic airway obstruction consistent with inspiratory inhibition in the patient population. This is 60% of the available PFTs in this cohort study.
Discussion
This retrospective chart review of 100 consecutive VCD diagnoses in a military treatment facility reinforces many of the findings currently available in the literature. As illustrated in a Chest review article, the diagnosis of VCD on history, physical examination, or PFTs remains ellusive.1 The PFT evaluation contains some subjectivity regarding the flattening of inspiratory flow-volume loops and is not routinely reported in PFT results. In patients diagnosed with VCD, a clear consensus of treatment modalities remains lacking. Modification of risk factors (allergic rhinitis, GERD, smoking cessation, weight loss) assisted in self-reported patient improvement, as did focused speech therapy.
The median age of 31 years, likely reflected the younger military population served at Eglin AFB. Seventy-five of these patients were currently on active duty, 6 were retired from active duty (veterans), and 19 were dependents. The median time of symptoms to diagnosis was 2 years. Prior misdiagnosis with other diseases such as asthma was common. Also, referral to Pulmonology and Speech Therapy was usually completed after failed outpatient primary care management for the alternative diagnoses.
Improvement with therapy was mixed, and during the time of documented follow-up, 72 patients reported complete or partial improvement. Most active-duty patients in the partial improvement category based this subjective reporting on their ability to meet military physical fitness standards.
Previous data suggested a female predominance, but this study population was 61% male. Military populations are about 80% to 85% male, so an increase in male diagnosis is expected.
Many patients in the patient cohort arrived as a result of Pulmonology referrals with a presumptive diagnoses of asthma but were determined not to have asthma through PFT results inconsistent with asthma, no improvement with β-agonist therapies, and negative methacholine challenges (if performed). These results prompted evaluations for other conditions and eventually a VCD diagnosis. As noted, exclusion of asthma is of particular importance in a military population, as medical discharges often are pursued in service members with asthma whether controlled or uncontrolled. Lag time to referral also is possible in failures of military physical, which prompted medical evaluation once several failures had occurred over a 1- to 2-year time frame.
The PFT data evaluation was inconclusive for statistically significant changes when compared with age-matched normal PFT values. This also was noted in previous studies of VCD cases. Most notable was percent predicted values of FEF 25% to 75%, with 84% of expected values. The FEV1, FVC, and PEF all fell within predicted values of normal, despite wide ranges in age, sex, and ethnicity among the subjects. Inspiratory flattening consistent with extrathoracic obstruction was present in 58 of the 97 PFTs available for review at Eglin AFB.
Limitations
Limitations to this retrospective case series are illustrated here. Cases were found only when VCD was diagnosed and coded; and it is the authors’ suspicion that many have been misdiagnosed or improperly treated for asthma or other pulmonary/oropharynx conditions. If providers are not familiar with VCD or if PFT readings do not comment on inspiratory findings, diagnosis is less likely. Some of the authors’ colleagues already have determined that postdeployment prevalence of VCD seems to be elevated.8
This cohort was completed on all patients in a military treatment facility, with 75 active-duty personnel, 6 veterans, and 19 dependents of varying ages. This case series is retrospective and tabulates suspected risk factors; stronger and more informative studies could certainly be completed in prospective studies (although likely difficult with low prevalence) or in treatment comparison studies at the time of diagnosis.
Since the cohort had varied and lengthy time to diagnosis from onset of related symptoms, the treatment patients received prior to diagnosis differed extensively. Diagnosis was completed by numerous primary care managers or other subspecialties prior to arrival to Pulmonology and Speech Therapy at Eglin AFB. Once diagnosed in Speech Therapy, consistent treatment options were provided to patients in accordance with standard of care.
It is the authors’ suspicion that VCD may have a higher prevalence than previously reported in the literature. Military service members are tested annually or biannually on physical fitness standards and are evaluated for medical reasons for recurrent fitness standard failures. This selection of patients is more likely to have a VCD evaluation as part of a comprehensive evaluation than is a healthy adult in a civilian population. A prospective study in military service members would be more fruitful and possibly yield a higher prevalence postdeployment.
Conclusion
Vocal cord dysfunction remains a difficult diagnosis to treat, because multiple comorbidities likely contribute to the diagnosis. This retrospective case series attempted to compile common themes and noted that most of the patients had 2 or more risk factors of smoking, allergic rhinitis, GERD, or mental health diagnoses. A prospective trial would be ideal to evaluate VCD further. A focused trial in the particular communities of athletes or of military service members may be of increased benefit to better define VCD. It is notable that 100 cases were found in a relatively short period for a community hospital, and prevalence may be higher than previously reported.
References
1. Morris MJ, Christopher KL. Diagnostic criteria for the classification of vocal cord dysfunction. Chest. 2010;138(5):1213-1223.
2. National Heart, Lung, and Blood Institute. Expert panel report 3: guidelines for the diagnoses and management of asthma. Full report 2007. https://www.nhlbi.nih.gov/files/docs/guidelines/asthgdln .pdf. Published 2007.Accessed February 1, 2017.
3. Newman KB, Mason UG III, Schmaling KB. Clinical features of vocal cord dysfunction. Am J Respir Crit Care Med. 1995;152(4, pt 1):1382-1386.
4. Sanz Santiago V, López Neyra A, Almería Gil E, Villa Asensi JR. Spirometry patterns in vocal cord dysfunction [in Spanish]. An Pediatr (Barc). 2013;78(3):173-177.
5. Deckert J, Deckert L. Vocal cord dysfunction. Am Fam Physician. 2010;81(2):156-159.
7. Campainha S, Ribeiro C, Guimar M, Lima R. Vocal cord dysfunction: a frequently forgotten entity. Case Rep Pulmonol. 2012;2012:525493.
8. Morris MJ, Oleszewski RT, Sterner JB, Allan PF. Vocal cord dysfunction related to combat deployment. Mil Med. 2013;178(11):1208-1212.
9. Al-Alwan A, Kaminsky D. Vocal cord dysfunction in athletes: clinical presentation and review of the literature. Phys Sportsmed. 2012;40(2):22-27.
10. Kenn K, Schmitz M. Prevalence of vocal cord dysfunction in patients with dyspnea. First prospective clinical study. Am J Respir Crit Care Med. 1997;155:A965.
11. Wendler, J, Nawka, T, Verges, D. Instructional course: videolaryngo-stroboscopy and phonetography—basic tools for diagnostics and documentation in the voice clinic. Poster presented at: 15th European Congress of Oto-Rhino-Laryngology, Head and Neck Surgery; September 11-16, 2004; Rodos-Kos, Greece.
12. Ibrahim WH, Gheriani HA, Almohamed AA, Raza T. Paradoxical vocal cord motion disorder: past, present and future. Postgrad Med J. 2007;83(977):164-172.
A55-year-old man who had experienced discolored nasal drainage and mucus plugs in the right side of his nose for 5 years was referred to the ear, nose, and throat clinic. A computerized tomography (CT) scan showed opacification of the right ethmoid and maxillary sinuses and periapical radiolucency in the first and second right maxillary molars (Figure 1).
On physical examination, extensive decay was noted in the teeth corresponding to the periapical lesions. Endoscopic evaluation of the nose revealed mucosal swelling in the right middle meatus and pus draining from the right maxillary sinus ostium.
The patient was treated with antibiotics (amoxicillin and clavulanate; moxifloxacin) and nasal rinses but failed to improve.
As a result, the patient underwent endoscopic sinus surgery. Postoperatively, the patient’s symptoms recurred, and the maxillary sinus was filled with pus. A repeat CT scan showed swelling of the maxillary sinus mucosa (Figure 2, arrow B).
The maxillary molars were considered the source of the persistent sinus infection, and the patient was referred to oral surgery for extraction. Three months after oral surgery, the extraction sites were completely healed, and the right maxillary sinus appeared free of disease endoscopically (Figure 3).
Dental infections should be considered a source of maxillary sinus disease especially in cases of rhinosinusitis that do not resolve with standard medical and surgical management.1,2
References
1 . Wang KL, Nichols BG, Poetker DM, Loehrl TA. Odontogenic sinusitis: a case series studying diagnosis and management. Int Forum Allergy Rhinol. 2015;5(7):597-601.
2. Patel NA, Ferguson BJ. Odontogenic sinusitis: an ancient but under-appreciated cause of maxillary sinusitis. Curr Opin Otolaryngol Head Neck Surg. 2012;20(1):24-28.
Dr. Brown is a physician in the department of surgery, division of ear, nose, and throat, at Carl T. Hayden VA Medical Center in Phoenix, Arizona.
Author disclosures The author reports no actual or potential conflicts of interest with regard to this article.
Disclaimer The opinions expressed herein are those of the author and do not necessarily reflect those of Federal Practitioner, Frontline Medical Communications Inc., the U.S. Government, or any of its agencies.
Author and Disclosure Information
Dr. Brown is a physician in the department of surgery, division of ear, nose, and throat, at Carl T. Hayden VA Medical Center in Phoenix, Arizona.
Author disclosures The author reports no actual or potential conflicts of interest with regard to this article.
Disclaimer The opinions expressed herein are those of the author and do not necessarily reflect those of Federal Practitioner, Frontline Medical Communications Inc., the U.S. Government, or any of its agencies.
A dental infection was the cause of a patient’s persistent sinus infection.
A dental infection was the cause of a patient’s persistent sinus infection.
A55-year-old man who had experienced discolored nasal drainage and mucus plugs in the right side of his nose for 5 years was referred to the ear, nose, and throat clinic. A computerized tomography (CT) scan showed opacification of the right ethmoid and maxillary sinuses and periapical radiolucency in the first and second right maxillary molars (Figure 1).
On physical examination, extensive decay was noted in the teeth corresponding to the periapical lesions. Endoscopic evaluation of the nose revealed mucosal swelling in the right middle meatus and pus draining from the right maxillary sinus ostium.
The patient was treated with antibiotics (amoxicillin and clavulanate; moxifloxacin) and nasal rinses but failed to improve.
As a result, the patient underwent endoscopic sinus surgery. Postoperatively, the patient’s symptoms recurred, and the maxillary sinus was filled with pus. A repeat CT scan showed swelling of the maxillary sinus mucosa (Figure 2, arrow B).
The maxillary molars were considered the source of the persistent sinus infection, and the patient was referred to oral surgery for extraction. Three months after oral surgery, the extraction sites were completely healed, and the right maxillary sinus appeared free of disease endoscopically (Figure 3).
Dental infections should be considered a source of maxillary sinus disease especially in cases of rhinosinusitis that do not resolve with standard medical and surgical management.1,2
References
1 . Wang KL, Nichols BG, Poetker DM, Loehrl TA. Odontogenic sinusitis: a case series studying diagnosis and management. Int Forum Allergy Rhinol. 2015;5(7):597-601.
2. Patel NA, Ferguson BJ. Odontogenic sinusitis: an ancient but under-appreciated cause of maxillary sinusitis. Curr Opin Otolaryngol Head Neck Surg. 2012;20(1):24-28.
About 1 in 4 American adults who say they have good or excellent hearing has hearing damage. According to a Vital Signs report, much of the damage is due to everyday loud sounds, such as leaf blowers, concerts, even portable devices. The rumble of a washing machine approaches the 85 decibels at which extended exposure can cause hearing damage. Sixty seconds of listening to a nearby siren (120 dB) also can cause hearing damage.
CDC researchers analyzed > 3,500 hearing tests conducted on adult participants in the 2012 National Health and Nutrition Examination Survey. Of those participants, 20% who reported no job-related noise exposure nonetheless had hearing damage in a pattern usually caused by noise.
People may delay reporting hearing loss because they don’t know or won’t admit they have a problem, the CDC says. Only 46% of adults who reported having trouble hearing saw a health care provider (HCP) for their hearing in the past 5 years. But chronic noise exposure has been associated with worsening heart disease, increased blood pressure, and other adverse health effects.
The CDC suggests HCPs ask patients (even those as young as 20) about their hearing. For instance, they can ask, “Do you find it difficult to follow a conversation if there is background noise?” and “Can you usually hear and understand what someone says in a normal tone of voice when you can’t see that person’s face?”
At routine health care visits, the CDC suggests HCPs explain to patients how noise exposure can permanently damage hearing. They also suggest recommending earplugs or noise-canceling headphones. About 70% of people exposed to loud noise never or seldom wear hearing protection, CDC says. The CDC suggests advising patients to turn down the volume when watching TV, listening to music, and using earbuds or headphones, as well as asking whether patients are taking medicines that increase the risk of hearing damage. If patients show or report hearing problems, the CDC suggests HCPs examine their hearing or refer them to a hearing specialist.
Data from a recent CDC report shows that about 25% of adults who think they have good hearing have hearing damage.
Data from a recent CDC report shows that about 25% of adults who think they have good hearing have hearing damage.
About 1 in 4 American adults who say they have good or excellent hearing has hearing damage. According to a Vital Signs report, much of the damage is due to everyday loud sounds, such as leaf blowers, concerts, even portable devices. The rumble of a washing machine approaches the 85 decibels at which extended exposure can cause hearing damage. Sixty seconds of listening to a nearby siren (120 dB) also can cause hearing damage.
CDC researchers analyzed > 3,500 hearing tests conducted on adult participants in the 2012 National Health and Nutrition Examination Survey. Of those participants, 20% who reported no job-related noise exposure nonetheless had hearing damage in a pattern usually caused by noise.
People may delay reporting hearing loss because they don’t know or won’t admit they have a problem, the CDC says. Only 46% of adults who reported having trouble hearing saw a health care provider (HCP) for their hearing in the past 5 years. But chronic noise exposure has been associated with worsening heart disease, increased blood pressure, and other adverse health effects.
The CDC suggests HCPs ask patients (even those as young as 20) about their hearing. For instance, they can ask, “Do you find it difficult to follow a conversation if there is background noise?” and “Can you usually hear and understand what someone says in a normal tone of voice when you can’t see that person’s face?”
At routine health care visits, the CDC suggests HCPs explain to patients how noise exposure can permanently damage hearing. They also suggest recommending earplugs or noise-canceling headphones. About 70% of people exposed to loud noise never or seldom wear hearing protection, CDC says. The CDC suggests advising patients to turn down the volume when watching TV, listening to music, and using earbuds or headphones, as well as asking whether patients are taking medicines that increase the risk of hearing damage. If patients show or report hearing problems, the CDC suggests HCPs examine their hearing or refer them to a hearing specialist.
Inefficiencies in the operating room (OR) can occur before, during, and between cases and lead to multiple problems, including delays in the delivery of patient care. They also have a negative financial impact for the institution and cause frustration for surgeons, anesthesiologists, and other OR staff. Ultimately, delays lead to dissatisfaction among patients and health care providers. Operating room efficiency increasingly is becoming a marker of the quality of surgical care.
The Institute of Medicine (IOM) identified timeliness and efficiency as 2 of 6 areas for improvement for U.S. hospitals.1 Organizations such as the Centers for Medicare and Medicaid Services, Agency for Healthcare Research and Quality, IOM, Institute for Healthcare Improvement, The Joint Commission, Leapfrog Group, and National Quality Forum are beginning to monitor patient care workflow in order to improve quality while reducing costs.2
About 187 million Americans take at least 1 prescription drug.3 An estimated 20% to 50% of patients do not take their medications as prescribed and are said to be nonadherent with therapy.4,5 Nonadherence to medication also has been shown to result in increased health risks and costs of up to $290 billion.6 Patients who receive pharmacist services achieve better clinical outcomes for chronic diseases than national standards.7
Among patients with a chronic disease, poor adherence tends to result in poor outcomes and increased medical costs. Yet these are the patients who face the most risks in surgery and require the most preoperative care. Several studies have evaluated the frequency of medication nonadherence prior to surgery and its effect on surgery cancellations. These studies have examined a variety of factors related to patient preoperative education, medications, food intake, bowel prep, etc.
In a VA Puget Sound Health Care System study, 23% of patients undergoing ambulatory surgery were nonadherent to preoperative medication instructions.8 Studies have found that up to 7% of cancellations were impacted by medication nonadherence and preoperative education.9-13 Furthermore, studies using large-scale databases have found medically treatable conditions as a significant source of surgical delay.14 Had these conditions been treated a priori, delay in surgery would not have occurred. Unfortunately, it is not clear whether the delays were the result of missed preoperative checks or medication nonadherence.
Ensuring patient safety, including reducing medical errors and adverse events (AEs), is imperative in the surgical workflow. In 1999, the IOM estimated that medical error was a leading cause of death in the U.S. and resulted in up to 100,000 deaths annually.15
In a retrospective study of 15,000 cases, Gawande and colleagues found that 66% of all AEs were surgical and 54% of these were preventable.16 In addition to improving reporting systems, creating a culture of safety with all members of the health care team and building a partnership with patients during preoperative visits can ensure increased adherence and reduced medication AEs. In a neurosurgical cohort of patients, Bernstein and colleagues found that 85% of patients were subjected to at least 1 error; 10% of the errors were major, and 65% were deemed preventable.17
The purpose of this study is to evaluate whether redundancy built into the patient care protocols prior to surgery helps catch errors as demonstrated in time-out analyses.18 Decreasing these errors would lead to fewer surgical cancellations and medical workup delays. The authors hypothesize that a structured preoperative pharmacologic workup would result in decreased preoperative delay in the surgical workflow.
Methods
The study protocol was reviewed and determined to be a quality improvement/quality assurance initiative, which exempted it from institutional review board or other oversight committee review, at the Minneapolis VA Health Care System. The VA OR Efficiency Task Force identified medication adherence as a possible source of delay. A study therefore was undertaken to determine the adherence rate and how it impacted operative delays. Data were extracted from this study to test the stated hypothesis and compare with historic data.
Fifty consecutive patients undergoing neurosurgical procedures from May 2010 through July 2010 were retrospectively reviewed and evaluated. All patients had a preoperative consultation with a pharmacist and the neurosurgery coordinator who reviewed all medications with the patient and gave specific instructions on which medications should be continued or discontinued prior to the surgery date. This information was documented on the OR Medication Compliance Worksheet and included in the patient’s preoperative chart by the neurosurgery coordinator. On the day of surgery, all active medications on this chart were reviewed with the patient by the anesthesiologist and documented on the OR Medication Compliance Worksheet. The worksheet was then sent to the neurosurgery coordinator for secondary review and analysis.
To evaluate delays, the authors reviewed the patient anesthesiology records. Delays were defined as either cancellations of the case due to medication nonadherence, which would make it unsafe to proceed with surgery, or minor delays due to medication nonadherence, which required further preoperative assessment and workup before proceeding with surgery. Cancelled cases were defined as cases on the final copy of the published OR schedule that did not occur.
Medication Adherence Program
In order to ensure medication adherence prior to surgery there were 5 points of contact with a patient from the time the patient was scheduled for surgery and the date of the surgery (Figure 1):
The coordinator reviewed medications with patient at time of scheduling
A letter was sent with specific instructions about medications
Preoperative medicine clearance
Preoperative neurosurgery appointment
Call from pharmacist 1 week before surgery
Results
The authors reviewed 10 months of the neurosurgical service prior to initiation of the protocol. Of 317 analyzed cases, 30 were delayed/cancelled. Among these, 5 cases with the possibility of a 6th were cancelled due to medication issues. Following the initialization of the study, 50 patients underwent preoperative counseling with the pharmacist and the neurosurgery coordinator and had an OR Medication Compliance Worksheet created.
Review of the OR Medication Compliance Worksheet demonstrated that 2 patients were nonadherent with their medications.
The first patient did not use a prescribed inhaler, and the second patient did not take preoperative pain medication. Review of the anesthesiology records did not document a delay or cancellation in any of the 50 cases. The first patient received a nebulizer treatment prior to surgery, but this did not delay the case. All patients with anticoagulation or antiplatelet prescriptions had discontinued these medications prior to surgery (Figure 2).
Discussion
The OR is one of the most expensive areas in an acute care hospital.2 Cancellations or delays can have significant negative financial implications (about $1,500 per hour of lost revenue).19 In order to improve OR efficiency and reduce preoperative delays, the causes of preoperative delays must be determined.
Some delays and cancellations result from either preoperative or perioperative issues. Prolonged wait time and postponement may cause preoperative delays. Perioperative delays include delays in getting into the OR once the patient has arrived in the hospital as well as delays during the operation. These delays can be due to both human error and system deficiencies.20
One Toronto, Canada study looked at the different etiologies for delays in cranial and spinal procedures and found that equipment failure followed by physical transit into the OR were the top reasons for delays.21 These researchers also found that first cases each day sometimes had a higher incidence of delays than did subsequent cases because several ORs prepare to start simultaneously, which causes an increased demand on hospital support services (eg, registration desk, imaging department, nurses in the patient holding area, or transportation). The number of these support staff remains constant throughout the day, whereas the first-case patients all arrive at about the same time, causing a bottleneck in the early morning. The authors looked at 1 facet of the delay problem as an ongoing analysis for hospital efficiency improvement.
With the implementation of a simple 5-step process, medication adherence was > 90% and the impact of nonadherence on surgical procedure delays was eliminated during the trial period. In this sample, nonadherence did not impact surgery, which resulted in fewer delays and cancellations. The process emphasized repetition and communication, involving 5 reminders between the date of OR scheduling and the date of the actual surgery. The authors found that in this quality improvement study, redundancy in the workflow actually improved the efficiency of the patient’s hospital course.
Within the OR, there are many perspectives to consider for improving OR efficiency. For instance, Archer and colleagues present several distinct perspectives: that of the health care institution, the individual practitioner, the patient, and evidenced-based medicine.2 According to Strum and colleagues, OR inefficiency is the sum of under- and overutilized time and efficiency is highest when OR inefficiency is minimized.22 An OR is considered underutilized when it is staffed at regular wages but not used for surgery, setup, or cleanup. An OR is considered overutilized when the OR staff receives overtime wages, multiplied by the relative cost of overtime compared with straight time. Delayed or cancelled surgeries can result in idle operating room staff, while repeat or correlative studies (ie, electrocardiogram, drug levels) may overutilize support services.
Limitations
This study has obvious limitations due to its small scale. Because the protocol implementation resulted in few delays, a very large cohort would have been necessary to attain statistical power.
Conclusion
By improving OR efficiency and reducing preoperative delays, surgical capacity can be increased.
In this study, the authors demonstrate that with little addition of cost, medication nonadherence can be reduced or eliminated as an issue for surgical delays. With the implementation of the 5-step reminder process as well as the addition of a pharmacist consultation/visit, medication adherence was > 90% among preoperative patients in this small study. With the number of patients with complex medication regimens, increasing medication adherence in the preoperative period is not only important in reducing operative delays, but also an opportunity to ensure the patient is safe and optimally treated. ˜
References
1. Institute of Medicine (US) Committee on Quality of Health Care in America. Crossing the Quality Chasm: A New Health System for the 21st Century. Washing ton, DC: National Academy Press; 2001. https://www.nap.edu/catalog/10027/crossing-the-quality -chasm-a-new-health-system-for-the.
2. Archer T, Macario A. The drive for operating room efficiency will increase quality of patient care. Curr Opin Anaesthesiol. 2006;19(2):171-176.
4. Osterberg L, Blaschke T. Adherence to medication. N Engl J Med. 2005;353(5):487-497.
5. DiMatteo MR. Variations in patients’ adherence to medical recommendations: a quantitative review of 50 years of research. Med Care. 2004;42(3):200-209.
7. Kripalani S, Yao X, Haynes RB. Interventions to enhance medication adherence in chronic medical conditions: a systematic review. Arch Intern Med. 2007;167(6):540-550.
8. Chew JD, Bradley KA, Flum DR, Cornia PB, Koepsell TD. The impact of low health literacy on surgical practice. Am J Surg. 2004;188(3):250-253.
9. van Klei WA, Moons KG, Rutten CL, et al. The effect of outpatient preoperative evaluation of hospital inpatients on cancellation of surgery and length of hospital stay. Anesth Analg. 2002;94(3):644-649.
10. Sanjay P, Dodds A, Miller E, Arumugam PJ, Woodward A. Cancelled elective operations: an observational study from a district general hospital. J Health Organ Manag. 2007;21(1):54-58.
11. Schofield WN, Rubin GL, Piza M, et al. Cancellation of operations on the day of intended surgery at a major Australian referral hospital. Med J Aust. 2005;182(12):612-615.
12. Zafar A, Mufti TS, Griffin S, Ahmed S, Ansari JA. Cancelled elective general surgical operations in Ayub Teaching Hospital. J Ayub Med Coll Abbottabad. 2007;19(3):64-66.
13. Knox M, Myers E, Hurley M. The impact of pre-operative assessment clinics on elective surgical case cancellations. Surgeon. 2009;7(2):76-78.
14. Phruetthiphat OA, Gao Y, Anthony CA, Pugely AJ, Warth LC, Callaghan JJ. Incidence of and preoperative risk factors for surgical delay in primary total hip arthroplasty: analysis from the American College of Surgeons National Surgical Quality Improvement Program. J Arthroplasty. 2016;31(11): 2432-2436.
15. Kohn LT, Corrigan JM, Donaldson MD, eds; Institute of Medicine; Committee on Quality of Health Care in America. To Err Is Human: Building a Safer Health System. Washington, DC: National Academies; 2000. https://www.nap.edu/catalog/9728/to-err-is-human-building-a-safer-health-system.
16. Gawande AA, Thomas EJ, Zinner MJ, Brennan TA. The incidence and nature of surgical adverse events in Colorado and Utah in 1992. Surgery. 1999;126(1):66-75.
17. Bernstein M, Massicotte E, Etchells E. Error in neurosurgery: a prospective pilot study. Can J Neurol Sci. 2001;28(suppl 2):S60.
18. Altpeter T, Luckhardt K, Lewis JN, Harken AH, Polk HC Jr. Expanded surgical time out: a key to real-time data collection and quality improvement. J Am Coll Surg. 2007;204(4):527-532.
19. Dexter F, Marcon E, Epstein RH, Ledolter J. Validation of statistical methods to compare cancellation rates on the day of surgery. Anesth Analg. 2005;101(2):465-473.
20. Etchells E, O’Neill C, Bernstein M. Patient safety in surgery: error detection and prevention. World J Surg. 2003;27(8):936-941.
21. Wong J, Khu KJ, Kaderali Z, Bernstein M. Delays in the operating room: signs of an imperfect system. Can J Surg. 2010;53(3):189-195.
22. Strum DP, Vargas LG, May JH. Surgical subspecialty block utilization and capacity planning: a minimal cost analysis model. Anesthesiology. 1999;90(4):1176-1185.
Dr. Norby is a surgery resident; at the time this article was written, Dr. Kainth was a neurosurgery resident; and Dr. Lam is a professor of neurosurgery; all at the University of Minnesota in Minneapolis. Ms. Ganzel and Ms. Wagner are nurses, and Dr. Lam is the chief of neurosurgery at Minneapolis VAMC. Dr. Kainth is currently a neurosurgeon in private practice.
Author disclosures The authors report no actual or potential conflicts of interest with regard to this article.
Disclaimer The opinions expressed herein are those of the authors and do not necessarily reflect those of Federal Practitioner, Frontline Medical Communications Inc., the U.S. Government, or any of its agencies.
Author and Disclosure Information
Dr. Norby is a surgery resident; at the time this article was written, Dr. Kainth was a neurosurgery resident; and Dr. Lam is a professor of neurosurgery; all at the University of Minnesota in Minneapolis. Ms. Ganzel and Ms. Wagner are nurses, and Dr. Lam is the chief of neurosurgery at Minneapolis VAMC. Dr. Kainth is currently a neurosurgeon in private practice.
Author disclosures The authors report no actual or potential conflicts of interest with regard to this article.
Disclaimer The opinions expressed herein are those of the authors and do not necessarily reflect those of Federal Practitioner, Frontline Medical Communications Inc., the U.S. Government, or any of its agencies.
The implementation of a 5-step reminder process and pharmacist consultation/visit improved medication adherence and reduced operative delays.
The implementation of a 5-step reminder process and pharmacist consultation/visit improved medication adherence and reduced operative delays.
Inefficiencies in the operating room (OR) can occur before, during, and between cases and lead to multiple problems, including delays in the delivery of patient care. They also have a negative financial impact for the institution and cause frustration for surgeons, anesthesiologists, and other OR staff. Ultimately, delays lead to dissatisfaction among patients and health care providers. Operating room efficiency increasingly is becoming a marker of the quality of surgical care.
The Institute of Medicine (IOM) identified timeliness and efficiency as 2 of 6 areas for improvement for U.S. hospitals.1 Organizations such as the Centers for Medicare and Medicaid Services, Agency for Healthcare Research and Quality, IOM, Institute for Healthcare Improvement, The Joint Commission, Leapfrog Group, and National Quality Forum are beginning to monitor patient care workflow in order to improve quality while reducing costs.2
About 187 million Americans take at least 1 prescription drug.3 An estimated 20% to 50% of patients do not take their medications as prescribed and are said to be nonadherent with therapy.4,5 Nonadherence to medication also has been shown to result in increased health risks and costs of up to $290 billion.6 Patients who receive pharmacist services achieve better clinical outcomes for chronic diseases than national standards.7
Among patients with a chronic disease, poor adherence tends to result in poor outcomes and increased medical costs. Yet these are the patients who face the most risks in surgery and require the most preoperative care. Several studies have evaluated the frequency of medication nonadherence prior to surgery and its effect on surgery cancellations. These studies have examined a variety of factors related to patient preoperative education, medications, food intake, bowel prep, etc.
In a VA Puget Sound Health Care System study, 23% of patients undergoing ambulatory surgery were nonadherent to preoperative medication instructions.8 Studies have found that up to 7% of cancellations were impacted by medication nonadherence and preoperative education.9-13 Furthermore, studies using large-scale databases have found medically treatable conditions as a significant source of surgical delay.14 Had these conditions been treated a priori, delay in surgery would not have occurred. Unfortunately, it is not clear whether the delays were the result of missed preoperative checks or medication nonadherence.
Ensuring patient safety, including reducing medical errors and adverse events (AEs), is imperative in the surgical workflow. In 1999, the IOM estimated that medical error was a leading cause of death in the U.S. and resulted in up to 100,000 deaths annually.15
In a retrospective study of 15,000 cases, Gawande and colleagues found that 66% of all AEs were surgical and 54% of these were preventable.16 In addition to improving reporting systems, creating a culture of safety with all members of the health care team and building a partnership with patients during preoperative visits can ensure increased adherence and reduced medication AEs. In a neurosurgical cohort of patients, Bernstein and colleagues found that 85% of patients were subjected to at least 1 error; 10% of the errors were major, and 65% were deemed preventable.17
The purpose of this study is to evaluate whether redundancy built into the patient care protocols prior to surgery helps catch errors as demonstrated in time-out analyses.18 Decreasing these errors would lead to fewer surgical cancellations and medical workup delays. The authors hypothesize that a structured preoperative pharmacologic workup would result in decreased preoperative delay in the surgical workflow.
Methods
The study protocol was reviewed and determined to be a quality improvement/quality assurance initiative, which exempted it from institutional review board or other oversight committee review, at the Minneapolis VA Health Care System. The VA OR Efficiency Task Force identified medication adherence as a possible source of delay. A study therefore was undertaken to determine the adherence rate and how it impacted operative delays. Data were extracted from this study to test the stated hypothesis and compare with historic data.
Fifty consecutive patients undergoing neurosurgical procedures from May 2010 through July 2010 were retrospectively reviewed and evaluated. All patients had a preoperative consultation with a pharmacist and the neurosurgery coordinator who reviewed all medications with the patient and gave specific instructions on which medications should be continued or discontinued prior to the surgery date. This information was documented on the OR Medication Compliance Worksheet and included in the patient’s preoperative chart by the neurosurgery coordinator. On the day of surgery, all active medications on this chart were reviewed with the patient by the anesthesiologist and documented on the OR Medication Compliance Worksheet. The worksheet was then sent to the neurosurgery coordinator for secondary review and analysis.
To evaluate delays, the authors reviewed the patient anesthesiology records. Delays were defined as either cancellations of the case due to medication nonadherence, which would make it unsafe to proceed with surgery, or minor delays due to medication nonadherence, which required further preoperative assessment and workup before proceeding with surgery. Cancelled cases were defined as cases on the final copy of the published OR schedule that did not occur.
Medication Adherence Program
In order to ensure medication adherence prior to surgery there were 5 points of contact with a patient from the time the patient was scheduled for surgery and the date of the surgery (Figure 1):
The coordinator reviewed medications with patient at time of scheduling
A letter was sent with specific instructions about medications
Preoperative medicine clearance
Preoperative neurosurgery appointment
Call from pharmacist 1 week before surgery
Results
The authors reviewed 10 months of the neurosurgical service prior to initiation of the protocol. Of 317 analyzed cases, 30 were delayed/cancelled. Among these, 5 cases with the possibility of a 6th were cancelled due to medication issues. Following the initialization of the study, 50 patients underwent preoperative counseling with the pharmacist and the neurosurgery coordinator and had an OR Medication Compliance Worksheet created.
Review of the OR Medication Compliance Worksheet demonstrated that 2 patients were nonadherent with their medications.
The first patient did not use a prescribed inhaler, and the second patient did not take preoperative pain medication. Review of the anesthesiology records did not document a delay or cancellation in any of the 50 cases. The first patient received a nebulizer treatment prior to surgery, but this did not delay the case. All patients with anticoagulation or antiplatelet prescriptions had discontinued these medications prior to surgery (Figure 2).
Discussion
The OR is one of the most expensive areas in an acute care hospital.2 Cancellations or delays can have significant negative financial implications (about $1,500 per hour of lost revenue).19 In order to improve OR efficiency and reduce preoperative delays, the causes of preoperative delays must be determined.
Some delays and cancellations result from either preoperative or perioperative issues. Prolonged wait time and postponement may cause preoperative delays. Perioperative delays include delays in getting into the OR once the patient has arrived in the hospital as well as delays during the operation. These delays can be due to both human error and system deficiencies.20
One Toronto, Canada study looked at the different etiologies for delays in cranial and spinal procedures and found that equipment failure followed by physical transit into the OR were the top reasons for delays.21 These researchers also found that first cases each day sometimes had a higher incidence of delays than did subsequent cases because several ORs prepare to start simultaneously, which causes an increased demand on hospital support services (eg, registration desk, imaging department, nurses in the patient holding area, or transportation). The number of these support staff remains constant throughout the day, whereas the first-case patients all arrive at about the same time, causing a bottleneck in the early morning. The authors looked at 1 facet of the delay problem as an ongoing analysis for hospital efficiency improvement.
With the implementation of a simple 5-step process, medication adherence was > 90% and the impact of nonadherence on surgical procedure delays was eliminated during the trial period. In this sample, nonadherence did not impact surgery, which resulted in fewer delays and cancellations. The process emphasized repetition and communication, involving 5 reminders between the date of OR scheduling and the date of the actual surgery. The authors found that in this quality improvement study, redundancy in the workflow actually improved the efficiency of the patient’s hospital course.
Within the OR, there are many perspectives to consider for improving OR efficiency. For instance, Archer and colleagues present several distinct perspectives: that of the health care institution, the individual practitioner, the patient, and evidenced-based medicine.2 According to Strum and colleagues, OR inefficiency is the sum of under- and overutilized time and efficiency is highest when OR inefficiency is minimized.22 An OR is considered underutilized when it is staffed at regular wages but not used for surgery, setup, or cleanup. An OR is considered overutilized when the OR staff receives overtime wages, multiplied by the relative cost of overtime compared with straight time. Delayed or cancelled surgeries can result in idle operating room staff, while repeat or correlative studies (ie, electrocardiogram, drug levels) may overutilize support services.
Limitations
This study has obvious limitations due to its small scale. Because the protocol implementation resulted in few delays, a very large cohort would have been necessary to attain statistical power.
Conclusion
By improving OR efficiency and reducing preoperative delays, surgical capacity can be increased.
In this study, the authors demonstrate that with little addition of cost, medication nonadherence can be reduced or eliminated as an issue for surgical delays. With the implementation of the 5-step reminder process as well as the addition of a pharmacist consultation/visit, medication adherence was > 90% among preoperative patients in this small study. With the number of patients with complex medication regimens, increasing medication adherence in the preoperative period is not only important in reducing operative delays, but also an opportunity to ensure the patient is safe and optimally treated. ˜
References
1. Institute of Medicine (US) Committee on Quality of Health Care in America. Crossing the Quality Chasm: A New Health System for the 21st Century. Washing ton, DC: National Academy Press; 2001. https://www.nap.edu/catalog/10027/crossing-the-quality -chasm-a-new-health-system-for-the.
2. Archer T, Macario A. The drive for operating room efficiency will increase quality of patient care. Curr Opin Anaesthesiol. 2006;19(2):171-176.
4. Osterberg L, Blaschke T. Adherence to medication. N Engl J Med. 2005;353(5):487-497.
5. DiMatteo MR. Variations in patients’ adherence to medical recommendations: a quantitative review of 50 years of research. Med Care. 2004;42(3):200-209.
7. Kripalani S, Yao X, Haynes RB. Interventions to enhance medication adherence in chronic medical conditions: a systematic review. Arch Intern Med. 2007;167(6):540-550.
8. Chew JD, Bradley KA, Flum DR, Cornia PB, Koepsell TD. The impact of low health literacy on surgical practice. Am J Surg. 2004;188(3):250-253.
9. van Klei WA, Moons KG, Rutten CL, et al. The effect of outpatient preoperative evaluation of hospital inpatients on cancellation of surgery and length of hospital stay. Anesth Analg. 2002;94(3):644-649.
10. Sanjay P, Dodds A, Miller E, Arumugam PJ, Woodward A. Cancelled elective operations: an observational study from a district general hospital. J Health Organ Manag. 2007;21(1):54-58.
11. Schofield WN, Rubin GL, Piza M, et al. Cancellation of operations on the day of intended surgery at a major Australian referral hospital. Med J Aust. 2005;182(12):612-615.
12. Zafar A, Mufti TS, Griffin S, Ahmed S, Ansari JA. Cancelled elective general surgical operations in Ayub Teaching Hospital. J Ayub Med Coll Abbottabad. 2007;19(3):64-66.
13. Knox M, Myers E, Hurley M. The impact of pre-operative assessment clinics on elective surgical case cancellations. Surgeon. 2009;7(2):76-78.
14. Phruetthiphat OA, Gao Y, Anthony CA, Pugely AJ, Warth LC, Callaghan JJ. Incidence of and preoperative risk factors for surgical delay in primary total hip arthroplasty: analysis from the American College of Surgeons National Surgical Quality Improvement Program. J Arthroplasty. 2016;31(11): 2432-2436.
15. Kohn LT, Corrigan JM, Donaldson MD, eds; Institute of Medicine; Committee on Quality of Health Care in America. To Err Is Human: Building a Safer Health System. Washington, DC: National Academies; 2000. https://www.nap.edu/catalog/9728/to-err-is-human-building-a-safer-health-system.
16. Gawande AA, Thomas EJ, Zinner MJ, Brennan TA. The incidence and nature of surgical adverse events in Colorado and Utah in 1992. Surgery. 1999;126(1):66-75.
17. Bernstein M, Massicotte E, Etchells E. Error in neurosurgery: a prospective pilot study. Can J Neurol Sci. 2001;28(suppl 2):S60.
18. Altpeter T, Luckhardt K, Lewis JN, Harken AH, Polk HC Jr. Expanded surgical time out: a key to real-time data collection and quality improvement. J Am Coll Surg. 2007;204(4):527-532.
19. Dexter F, Marcon E, Epstein RH, Ledolter J. Validation of statistical methods to compare cancellation rates on the day of surgery. Anesth Analg. 2005;101(2):465-473.
20. Etchells E, O’Neill C, Bernstein M. Patient safety in surgery: error detection and prevention. World J Surg. 2003;27(8):936-941.
21. Wong J, Khu KJ, Kaderali Z, Bernstein M. Delays in the operating room: signs of an imperfect system. Can J Surg. 2010;53(3):189-195.
22. Strum DP, Vargas LG, May JH. Surgical subspecialty block utilization and capacity planning: a minimal cost analysis model. Anesthesiology. 1999;90(4):1176-1185.
To the Editor: In their article “A patient with altered mental status and an acid-base disturbance,”1 Drs. Shylaja Mani and Gregory W. Rutecki state that 5-oxoproline or pyroglutamic acidosis is associated with an elevated osmol gap. This is not the case. The cited reference by Tan et al2 describes a patient who most likely had ketoacidosis, perhaps complicated by isopropyl alcohol ingestion.
Those disorders can certainly generate an osmol gap. Although pyroglutamic acidosis was mentioned in the differential diagnosis of that case, that condition was never documented. The accumulation of 5-oxoproline or pyroglutamic acid should not elevate the serum osmolality or generate an osmol gap.
References
Mani S, Rutecki GW. A patient with altered mental status and an acid-base disturbance. Cleve Clin J Med 2017; 84:27–34.
Tan EM, Kalimullah E, Sohail MR, Ramar K. Diagnostic challenge in a patient with severe anion gap metabolic acidosis. Case Rep Crit Care 2015; 2015:272914.
To the Editor: In their article “A patient with altered mental status and an acid-base disturbance,”1 Drs. Shylaja Mani and Gregory W. Rutecki state that 5-oxoproline or pyroglutamic acidosis is associated with an elevated osmol gap. This is not the case. The cited reference by Tan et al2 describes a patient who most likely had ketoacidosis, perhaps complicated by isopropyl alcohol ingestion.
Those disorders can certainly generate an osmol gap. Although pyroglutamic acidosis was mentioned in the differential diagnosis of that case, that condition was never documented. The accumulation of 5-oxoproline or pyroglutamic acid should not elevate the serum osmolality or generate an osmol gap.
References
Mani S, Rutecki GW. A patient with altered mental status and an acid-base disturbance. Cleve Clin J Med 2017; 84:27–34.
Tan EM, Kalimullah E, Sohail MR, Ramar K. Diagnostic challenge in a patient with severe anion gap metabolic acidosis. Case Rep Crit Care 2015; 2015:272914.
References
Mani S, Rutecki GW. A patient with altered mental status and an acid-base disturbance. Cleve Clin J Med 2017; 84:27–34.
Tan EM, Kalimullah E, Sohail MR, Ramar K. Diagnostic challenge in a patient with severe anion gap metabolic acidosis. Case Rep Crit Care 2015; 2015:272914.
In Reply: We thank Dr. Emmett for his insightful comment. He is correct that in the case reported by Tan et al the elevated osmol gap was not a direct result of the patient’s presumed acetaminophen ingestion but more likely another unidentified toxic ingestion. The online version of our article has been modified accordingly (also see page 214 of this issue).
In Reply: We thank Dr. Emmett for his insightful comment. He is correct that in the case reported by Tan et al the elevated osmol gap was not a direct result of the patient’s presumed acetaminophen ingestion but more likely another unidentified toxic ingestion. The online version of our article has been modified accordingly (also see page 214 of this issue).
In Reply: We thank Dr. Emmett for his insightful comment. He is correct that in the case reported by Tan et al the elevated osmol gap was not a direct result of the patient’s presumed acetaminophen ingestion but more likely another unidentified toxic ingestion. The online version of our article has been modified accordingly (also see page 214 of this issue).
Researchers find a faster way to test and diagnose Cushing syndrome by measuring cortisol levels in patient hair samples.
Diagnosing Cushing syndrome (CS) can take 24 hours of complicated and repeated analyses of blood and urine, brain imaging, and tissue samples from sinuses. But that may soon be in the past. The NIH researchers have found that measuring cortisol levels in hair samples can do the same job, faster.
Patients with CS have a high level of cortisol, perhaps from a tumor of the pituitary or adrenal glands or as an adverse effect from medications. In a study, 36 participants—30 with CS, 6 without—provided hair samples divided into 3 equal segments. The researchers found that the segments closest to the scalp had the most cortisol (96.6 ± 267.7 pg/mg for CS patients, vs 14.1 ± 9.2 pg/mg in control patients). Those segments’ cortisol content correlated closest with the majority of the initial biochemical tests, including in blood taken at night (when cortisol levels normally drop).
The study was small, CS is rare, and it’s hard to recruit large numbers of patients. Still, the researchers believe it is the largest of its kind to compare hair cortisol levels with diagnostic tests in patients with CS. “Our results are encouraging,” said Mihail Zilbermint, MD, the study’s senior author, and an endocrinologist at NIH’s Eunice Kennedy Shriver National Institute of Child Health and Human Development. “We are hopeful that hair analysis may ultimately prove useful as a less-invasive screening test for Cushing syndrome or in helping to confirm the diagnosis.” The researchers suggest that the test also is a convenient alternative with the “unique ability” for retrospective evaluation of hypercortisolemia over months.
Researchers find a faster way to test and diagnose Cushing syndrome by measuring cortisol levels in patient hair samples.
Researchers find a faster way to test and diagnose Cushing syndrome by measuring cortisol levels in patient hair samples.
Diagnosing Cushing syndrome (CS) can take 24 hours of complicated and repeated analyses of blood and urine, brain imaging, and tissue samples from sinuses. But that may soon be in the past. The NIH researchers have found that measuring cortisol levels in hair samples can do the same job, faster.
Patients with CS have a high level of cortisol, perhaps from a tumor of the pituitary or adrenal glands or as an adverse effect from medications. In a study, 36 participants—30 with CS, 6 without—provided hair samples divided into 3 equal segments. The researchers found that the segments closest to the scalp had the most cortisol (96.6 ± 267.7 pg/mg for CS patients, vs 14.1 ± 9.2 pg/mg in control patients). Those segments’ cortisol content correlated closest with the majority of the initial biochemical tests, including in blood taken at night (when cortisol levels normally drop).
The study was small, CS is rare, and it’s hard to recruit large numbers of patients. Still, the researchers believe it is the largest of its kind to compare hair cortisol levels with diagnostic tests in patients with CS. “Our results are encouraging,” said Mihail Zilbermint, MD, the study’s senior author, and an endocrinologist at NIH’s Eunice Kennedy Shriver National Institute of Child Health and Human Development. “We are hopeful that hair analysis may ultimately prove useful as a less-invasive screening test for Cushing syndrome or in helping to confirm the diagnosis.” The researchers suggest that the test also is a convenient alternative with the “unique ability” for retrospective evaluation of hypercortisolemia over months.
The care of hospitalized patients requires practitioners from multiple disciplines to assess and communicate the patient’s status in a dynamic manner during hospitalization. Although optimal teamwork is needed for patient care to be delivered reliably and efficiently, care within hospitals is typically delivered in a fragmented manner.1 A bedside model for daily interdisciplinary rounds (IDR) has been proposed as a method to provide a structured process and engage all team members in a patient-centered, system-of-care delivery.2 Specific advantages of convening rounds in the presence of the patient include the ability to directly assess care (eg, presence of a potentially unnecessary urinary catheter), patient engagement in key aspects of their care and disposition, and an increased opportunity for team members to develop a shared understanding of the patient’s views and needs.
Implementing dramatic changes to the workflow of multiple disciplines will require rigorous evidence to support a concerted effort from leadership and buy-in from stakeholders at the front line of patient care. Despite the urgency for evidence, there has been little investigation of this strategy. A systematic review3 identified 30 studies published between 1998 and 2013 addressing interdisciplinary interventions on medical wards, none of which examined a bedside IDR model. In a study performed after the period assessed by the systematic review, Stein et al4 described the restructuring of a medical ward as an accountable care unit (ACU), which included a bedside model for rounds by the interdisciplinary team. The change was associated with decreased mortality and length of stay (LOS), although the study did not isolate the impact of rounds or use a concurrent control group and presented aggregate rather than patient-level outcomes. The lack of convincing data may be a reason bedside rounds are not widely employed by hospitals. To provide high-quality evidence, we performed a large, prospective controlled trial comparing a structured bedside model (mobile interdisciplinary care rounds [MICRO]) with standard rounds.
METHODS
This study took place at the Mount Sinai Hospital, which is a 1171-bed tertiary care academic medical center in New York City, New York. A nonteaching unit offered the ability to use a prospective controlled design. Patients were assigned to the north and the south wings of the unit in a quasi-randomized manner, rather than based on diagnosis or acuity. We transformed IDR to a bedside model on the north side of the unit (MICRO group), while the south side of the unit continued using standard conference room-based IDR (control group). The north and south sides of the unit contain 17 and 14 beds, respectively. During the study period, nurses and hospitalists cared for patients on both sides of the study unit, although on any given day were assigned only patients on 1 side of the unit. The unit uses a clinical microsystem model, which has been defined as “a group of clinicians and staff working together with a shared clinical purpose to provide care for a population of patients,” and has a defined set of characteristics associated with high performance.5,6 Our microsystem model has incorporated features as described by Stein’s ACU model,4 including co-leadership by a hospitalist and a nurse manager, geographic assignment of patients to teams, and unit-level data reports. One hospitalist is assigned geographically to each area of the unit in a 2- to 4-week rotation. Coverage of the unit does not include house staff; patients are primarily assigned to hospitalists working with nurse practitioners. Patients were enrolled prospectively during their initial IDR by a research coordinator. Patient-level data and outcomes were collected prospectively by a research coordinator who attended IDR on the intervention and the control sides of the study unit daily.
Inclusion Criteria
All patients admitted to the medicine service on the study unit were eligible. Patients were greater than 18 years and admitted for an acute medical condition. Patients admitted to another unit and later transferred to the study unit were enrolled at the time of transfer. Patients could be included more than once if hospitalized on the study unit on more than 1 occasion. Most patients were covered by hospitalists, although patients covered by private physicians were included. Patients from other departments, including family medicine, are uncommonly admitted to the unit and were excluded. Patients were also excluded if they were admitted and discharged over the same weekend, because the MICRO rounds occur during weekdays and there was no opportunity to offer the intervention on Saturdays and Sundays.
MICRO Intervention
Interdisciplinary rounds occurred daily at 10:00 am for the control group and at 10:30 am for the MICRO group, and were attended by the hospitalist caring for the majority of patients on the unit, staff nurses, and the unit medical director, nurse manager, social worker, and case manager. Rounds on the control unit focused on the plan of care and disposition but did not follow any set structure and were typically 25 to 30 minutes in duration.
The MICRO rounds occurred at the bedside and followed a structured script (Appendix 1) that was designed to limit discussion of each patient to 3 minutes or less, and included speaking roles for the hospitalist, nurse, and social worker. For private physicians, the nurse practitioner assigned to the patient performed the role of the hospitalist. Rounds were expected to be approximately 50 minutes in duration. Patients were further engaged by asking for their main goal for the day. A patient safety checklist was reviewed. Initially, this task was performed by the nurse manager, who did not verbalize the items unless a deficiency was noted. After 6 months’ experience, this responsibility was given to the staff nurse, who reviewed the checklist verbally as part of the bedside script. Patients were seen daily, including those being discharged later that same day.
Staff and Clinician Education
We developed and implemented a curriculum based on a modified version of the Agency for Healthcare Research and Quality’s TeamStepps® program to ensure that all team members were provided with the basic principles of communication within the healthcare setting. The curriculum consisted of interactive didactics on essential elements of teamwork, including team structure, communication, situation monitoring, and mutual support, as well as the purpose and structure of the MICRO model. The curriculum was delivered to nurses at 3 monthly staff meetings on the study unit and to hospitalists during 3 hospital medicine grand rounds over a 3-month period. Nurses and physicians providing care on both geographic areas of the study unit received the education program because no group of practitioners was designated to only 1 geographic area.
Outcomes
Primary and Secondary Outcomes
The primary outcomes were clinical deterioration (CD) and length of stay. Clinical deterioration was a composite outcome defined a priori as death; escalation of care (ie, transfer to an intensive care unit, intermediate care unit, or teaching unit); or a hospital-acquired complication (ie, venous thromboembolism, fall, stage III-IV pressure ulcer, catheter-associated urinary tract infection, central-line associated bloodstream infection, or Clostridium difficile-associated diarrhea). The LOS was calculated as the mean LOS with outliers excluded (outliers defined as having a LOS 100 days or longer or 2.5 or more standard deviations from the expected LOS).
Process metrics on IDR, such as the duration of rounds, attendance by members of the interdisciplinary team, the percentage of patients discussed, or the effectiveness of communication, were not collected. We assessed patient satisfaction based on the Hospital Consumer Assessment of Healthcare Providers and Systems (HCAHPS) survey.
Patient Safety Culture Survey
To assess the impact on the perceptions of patient safety, we administered the Agency for Healthcare Research and Quality (AHRQ) Hospital Survey on Patient Safety Culture toall staff and clinicians working on both sides of the study unit immediately before and 12 months after implementation of the MICRO model. Results are reported for the AHRQ dimensions that were most relevant to the MICRO intervention: “teamwork within units,” “overall perceptions of safety,” “communication,” “openness,” “overall patient safety grade,” and “handoffs and transitions.” The survey represents pre- and post-comparison. All nurses and hospitalists on both the MICRO and control sides of the study unit had received the TeamStepps curriculum and participated in MICRO rounds by the time of the postintervention survey. We added 3 questions specifically assessing the perception of the efficiency and effectiveness of IDR. Postintervention respondents reflected on their overall impression of IDR, which included their experiences on both sides of the unit, because no group of nurses or hospitalists was exposed only to the MICRO side or the control side of the unit. Responses to survey questions were recorded on a 5-point Likert scale (from “strongly disagree” to “strongly agree” for opinion questions; and “never,” rarely,” sometimes,” “most of the time,” and “always” for frequency questions) and given a score from 1 to 5. The question asking for an overall grade for patient safety was scored from 1 to 5 points corresponding to letter grade choices F, D, C, B, A.
Statistical Analysis
The sample size was based on the estimate of the baseline rate of the primary outcome of CD and the projected decrease by the MICRO intervention. A study using the Global Trigger Tool developed by the Institute for Healthcare Improvement provided a best estimate of 16% as the baseline rate for CD.7 A total of 2000 hospitalizations were planned to be included to have a power of at least 80% to detect a 25% reduction in the annual incidence of CD with a 2-tailed type I error rate of 0.05. Comparisons of dichotomous event rates were made using chi square tests at a 2-tailed level for significance of 0.05. The LOS was analyzed using the nonparametric median test and multivariable regression analysis. We used a generalized linear model with gamma distribution and log link for all analyses of LOS, where LOS was the outcome variable, and intervention vs. control unit type was the predictor variable. Age, sex, race, payer, case mix, and comorbidities defined with the Elixhauser algorithm were used as covariates.8 We used multivariable logistic regression for analysis of CD, where the dependent variable was CD. Predictor variables included intervention, patient age, sex, race, payer, case mix and comorbidities. Patient satisfaction data were compared using the chi square test. The Student t test for dependent means was used to analyze the patient safety culture survey data.
The study protocol was submitted to the Icahn Mount Sinai School of Medicine’s institutional review board and determined to be exempt from full review.
RESULTS
A total of 2005 hospitalizations were included over the 12-month study period, consisting of 1089 hospitalizations in the MICRO group and 916 in the control group. Bedside and standard IDR were completed daily, Monday through Friday without exception. The demographic characteristics and comorbidities were similar for the 2 groups (Table). Hospitalizations of patients who were initially admitted to another unit and subsequently transferred to the study unit accounted for 11.1% of hospitalizations.
Table
Risk-adjusted LOS was similar for the groups (6.6 vs 7.0 days, P = 0.17, for the MICRO and control groups, respectively). On subgroup analysis, a reduction in LOS was noted for patients transferred to the study unit (10.4 vs 14.0 days, P = 0.02, for the MICRO and control groups, respectively). The LOS was unchanged for patients admitted directly to the study unit (6.0 vs 5.8 days, P = 0.93). There was no difference in the incidence of clinical deterioration for the MICRO or control groups (7.7% vs 9.3%, odds ratio, 0.89; 95% confidence interval, 0.61-1.22, P = 0.46).
The finding of a LOS benefit for the MICRO group limited to patients transferred to the study unit prompted a comparison of patients transferred to the study unit and patients directly admitted to the study unit from the emergency department (Appendix 2). Compared to patients admitted directly to the study unit, patients transferred to the study unit were more likely to have Medicaid or no insurance, more likely to be discharged to a facility, had longer LOS, and were more likely to experience CD.
Patient Satisfaction
There were 175 and 140 responses to the HCAHPS survey for the MICRO and the control groups, respectively. Patients in the MICRO group were more likely to report that “doctors, nurses, or other hospital staff talk with you about whether you would have the help you needed when you left the hospital” (88% vs 78%, P = 0.01). Responses for all other HCAHPS items were similar for the 2 groups.
Figure 1
Clinician/Staff Survey
The response rate was 96% (30 nurses and 17 hospitalists) pre-intervention and 100% (30 nurses and 22 hospitalists) postintervention. Hospitalists and nurses gave significantly higher scores for the dimensions “teamwork within units,” “overall perception of patient safety,” and “patient safety grade” on the postintervention survey compared to the pre-intervention survey (Figure 1). Hospitalists and nurses rated the efficiency of IDR and the ability of IDR to identify safety issues higher on the postintervention survey compared to the pre-intervention survey (Figure 2).
Figure 2
DISCUSSION
We transformed daily IDR from a standard conference room model to a structured bedside model with scripted roles, and performed a rigorous comparison using patient-level data. Our finding that transforming daily IDR from a standard conference room model to a bedside model did not significantly reduce LOS suggests either that the model is ineffective or needs to be incorporated into more comprehensive efforts to improve clinical outcomes. Studies suggest that bedside rounding can improve outcomes when implemented in the context of comprehensive restructuring of patient care.4,9 Stein et al.4 have described the reorganization of a medical ward as an “accountable care unit.” The ACU model included daily IDRs at the bedside, as well as geographic-based teams, co-leadership by a hospitalist and nurse manager, and unit-level reporting. Although no definitive conclusions can be drawn based on their descriptive report, transformation of the unit was associated with reduced LOS and mortality. Similarly, Kara et al.9 found that the number of elements of an “accountable care team” model implemented by each unit was associated with greater reductions in LOS and cost. In contrast, our findings of a lack of an effect are consistent with a recent cluster-randomized trial by O’Leary et al,10 which found that implementation of patient-centered bedside rounds did not improve patient satisfaction or perceptions of shared decision-making compared to units using a model of structured IDRs in a conference room setting. It is notable that the control groups in both the O’Leary trial10 and this study did not represent usual care, because these groups featured localization of the clinical teams and high-quality IDR. In our trial, it is plausible that the control side of the unit was functioning at a high level, which would have decreased our ability to further improve outcomes. Whether restructuring unit processes, including implementation of bedside IDR, improves care compared to usual care without these processes is unknown.
We found that the MICRO intervention significantly decreased LOS compared to the control group for patients transferred to the study unit. This analysis was exploratory and the finding was unexpected. Patients were transferred to the study unit from units of higher acuity, and were more likely to have Medicaid or no insurance and be discharged to facilities rather than home, suggesting that these patients had substantial disposition challenges. It is plausible that this is the population for which bedside IDRs may have the greatest impact. This was a secondary analysis, however, and should be considered as hypothesis-generating for future investigations.
Although the impact on outcomes of bedside IDRs is uncertain, potential benefits and practical barriers have been examined. Gonzalo et al.11 surveyed inpatient physicians and nurses at a hospital employing bedside IDRs and found that the benefits ranked the highest were communication, coordination, and teamwork, and the lowest-ranked benefits were related to efficiency and outcomes. The 6 greatest barriers concerned the time required to complete bedside IDR. These results indicate that the time investiture by staff may be a barrier to widespread adoption. More modest changes, such as increasing the structure of standard conference room rounds, may improve care, although the data are mixed. O’Leary et al.12 assessed the value of a structured approach in a conference room setting, which primarily entailed implementing a checklist for newly admitted patients, and found no difference in LOS. Follow-up studies by these investigators found mixed results on the ability of structured IDR to decrease the incidence of adverse events.13,14
The results of our AHRQ survey of patient safety culture found that several important aspects of teamwork and safety were perceived as improved by the intervention, including the “overall grade on patient safety.” Other studies have similarly shown increases in teamwork and safety ratings through redesign of IDR. O’Leary et al.12 surveyed residents and nurses on a unit that implemented a structured, conference room-based IDR and found that providers on the intervention unit rated the teamwork climate higher than providers on the control unit. Our finding that hospitalists and nurses gave higher ratings for IDR being “efficient” and “a good use of my time” on the postintervention survey than the pre-intervention survey suggests that initial concerns about the additional time commitment may be offset by gains in overall efficiency and in development of an environment of enhanced communication, teamwork, and safety.
This study has several limitations. First, the trial may have been underpowered to find small differences between the groups. The trends for decreased LOS and clinical deterioration in the MICRO group may suggest that bedside IDR can provide a small but clinically significant benefit that would be statistically significant only in a larger trial. Second, patients were not randomized to the 2 groups. The impact is diminished, however, because the routine hospital process for assigning patients to the 2 areas in which the groups were located is random and based solely on bed availability. Third, nurses and hospitalists caring for patients in the control group likely experienced improved communication practices from the unit-wide TeamStepps education and from participating in the MICRO protocol when caring for patients on the intervention side of the unit. Fourth, we did not collect data on the effectiveness of communication and are unable to assess the fidelity with which the structured protocol was followed or whether interprofessional communication was fostered or hindered. Lastly, the study was implemented on a nonteaching unit at a single academic medical center. The protocol and the results may not be generalizable to other hospitals or units that include house staff.
In conclusion, transforming IDR from a conference room model to a bedside model did not reduce overall LOS or clinical deterioration on a unit using features of an ACU structure. Although several beneficial effects were noted, including a reduction in LOS for patients transferred to the study unit and higher ratings of the patient safety climate and efficiency of IDR, implementing bedside IDR in this setting has marginal benefit. Future studies should assess whether a comprehensive transformation of the inpatient model of care, including patient-centered bedside IDR, geographic cohorting of teams, and co-leadership, improves outcomes compared to models without these features.
Disclosures
This trial was funded by Medline’s Prevention Above All Discoveries Grant Program. The authors report no financial conflicts of interest.
1. O’Leary KJ, Sehgal NL, Terrell G, Williams MV; High Performance Teams and the Hospital of the Future Project Team. Interdisciplinary teamwork in hospitals: A review and practical recommendations for improvement. J Hosp Med. 2011;7(1):48-54. PubMed 2. Gonzalo JD, Wolpaw DR, Lehman E, Chuang CH. Patient-centered interprofessional collaborative care: factors associated with bedside interprofessional rounds. J Gen Intern Med. 2014;29(7):1040-1047. PubMed 3. Pannick S, Davis R, Ashrafian H, et al. Effects of interdisciplinary team care interventions on general medical wards. A systematic review. JAMA Intern Med. 2015;175(8):1288-1298. PubMed 4. Stein J, Payne C, Methvin A, et al. Reorganizing a hospital ward as an accountable care unit. J Hosp Med. 2015;10(1):36-40. PubMed 5. Mohr J, Batalden P, Barach P. Integrating patient safety into the clinical microsystem. Qual Saf Health Care. 2004;13(suppl 2):ii34-ii38. PubMed 6. Nelson EC, Batalden PB, Huber TP, et al. Microsystems in health care: Part 1. Learning from high-performing front-line clinical units. Jt Comm J Qual Improv. 2002;28:472-493. PubMed 7. Rutberg H, Borgstedt Risberg MB, Sjödahl R, Nordqvist P, Valter L, Nilsson L. Characterisations of adverse events detected in a university hospital: a 4-year study using the Global Trigger Tool method. BMJ Open. 2014;4(5):e004879. PubMed 8. Elixhauser A, Steiner C, Harris DR, Coffey RM. Comorbidity measures for use with administrative data. Med Care. 1998;36(1):8-27. PubMed 9. Kara A, Johnson CS, Nicley A, Niemeier MR, Hui SL. Redesigning accountable care: testing the effectiveness of an accountable care team model. J Hosp Med. 2015;10(12):773-779. PubMed 10. O’Leary KJ, Killarney A, Hansen LO, Jones S, Malladi M, Marks K, et al. Effect of patient-centred bedside rounds on hospitalised patients’ decision control, activation and satisfaction with care. BMJ Qual Saf. 2016;25(12):921-928. PubMed 11. Gonzalo JD, Kuperman E, Lehman E, Haidet P. Bedside interprofessional rounds: perceptions of benefits and barriers by internal medicine nursing staff, attending physicians, and housestaff physicians. J Hosp Med. 2014;9(10):646-651. PubMed 12. O’Leary KJ, Wayne DB, Haviley C, Slade ME, Lee J, Williams MV. Improving teamwork: impact of structured interdisciplinary rounds on a medical teaching unit. J Gen Intern Med. 2010;25:826-832. PubMed 13. O’Leary KJ, Buck R, Fligiel HM, et al. Structured interdisciplinary rounds in a medical teaching unit: improving patient safety. Arch Intern Med. 2011;171(7):678-684. PubMed 14. O’Leary KJ, Creden AJ, Slade ME, et al. Implementation of unit-based interventions to improve teamwork and patient safety on a medical service. Am J Med Qual. 2015;30(5):409-416. PubMed
The care of hospitalized patients requires practitioners from multiple disciplines to assess and communicate the patient’s status in a dynamic manner during hospitalization. Although optimal teamwork is needed for patient care to be delivered reliably and efficiently, care within hospitals is typically delivered in a fragmented manner.1 A bedside model for daily interdisciplinary rounds (IDR) has been proposed as a method to provide a structured process and engage all team members in a patient-centered, system-of-care delivery.2 Specific advantages of convening rounds in the presence of the patient include the ability to directly assess care (eg, presence of a potentially unnecessary urinary catheter), patient engagement in key aspects of their care and disposition, and an increased opportunity for team members to develop a shared understanding of the patient’s views and needs.
Implementing dramatic changes to the workflow of multiple disciplines will require rigorous evidence to support a concerted effort from leadership and buy-in from stakeholders at the front line of patient care. Despite the urgency for evidence, there has been little investigation of this strategy. A systematic review3 identified 30 studies published between 1998 and 2013 addressing interdisciplinary interventions on medical wards, none of which examined a bedside IDR model. In a study performed after the period assessed by the systematic review, Stein et al4 described the restructuring of a medical ward as an accountable care unit (ACU), which included a bedside model for rounds by the interdisciplinary team. The change was associated with decreased mortality and length of stay (LOS), although the study did not isolate the impact of rounds or use a concurrent control group and presented aggregate rather than patient-level outcomes. The lack of convincing data may be a reason bedside rounds are not widely employed by hospitals. To provide high-quality evidence, we performed a large, prospective controlled trial comparing a structured bedside model (mobile interdisciplinary care rounds [MICRO]) with standard rounds.
METHODS
This study took place at the Mount Sinai Hospital, which is a 1171-bed tertiary care academic medical center in New York City, New York. A nonteaching unit offered the ability to use a prospective controlled design. Patients were assigned to the north and the south wings of the unit in a quasi-randomized manner, rather than based on diagnosis or acuity. We transformed IDR to a bedside model on the north side of the unit (MICRO group), while the south side of the unit continued using standard conference room-based IDR (control group). The north and south sides of the unit contain 17 and 14 beds, respectively. During the study period, nurses and hospitalists cared for patients on both sides of the study unit, although on any given day were assigned only patients on 1 side of the unit. The unit uses a clinical microsystem model, which has been defined as “a group of clinicians and staff working together with a shared clinical purpose to provide care for a population of patients,” and has a defined set of characteristics associated with high performance.5,6 Our microsystem model has incorporated features as described by Stein’s ACU model,4 including co-leadership by a hospitalist and a nurse manager, geographic assignment of patients to teams, and unit-level data reports. One hospitalist is assigned geographically to each area of the unit in a 2- to 4-week rotation. Coverage of the unit does not include house staff; patients are primarily assigned to hospitalists working with nurse practitioners. Patients were enrolled prospectively during their initial IDR by a research coordinator. Patient-level data and outcomes were collected prospectively by a research coordinator who attended IDR on the intervention and the control sides of the study unit daily.
Inclusion Criteria
All patients admitted to the medicine service on the study unit were eligible. Patients were greater than 18 years and admitted for an acute medical condition. Patients admitted to another unit and later transferred to the study unit were enrolled at the time of transfer. Patients could be included more than once if hospitalized on the study unit on more than 1 occasion. Most patients were covered by hospitalists, although patients covered by private physicians were included. Patients from other departments, including family medicine, are uncommonly admitted to the unit and were excluded. Patients were also excluded if they were admitted and discharged over the same weekend, because the MICRO rounds occur during weekdays and there was no opportunity to offer the intervention on Saturdays and Sundays.
MICRO Intervention
Interdisciplinary rounds occurred daily at 10:00 am for the control group and at 10:30 am for the MICRO group, and were attended by the hospitalist caring for the majority of patients on the unit, staff nurses, and the unit medical director, nurse manager, social worker, and case manager. Rounds on the control unit focused on the plan of care and disposition but did not follow any set structure and were typically 25 to 30 minutes in duration.
The MICRO rounds occurred at the bedside and followed a structured script (Appendix 1) that was designed to limit discussion of each patient to 3 minutes or less, and included speaking roles for the hospitalist, nurse, and social worker. For private physicians, the nurse practitioner assigned to the patient performed the role of the hospitalist. Rounds were expected to be approximately 50 minutes in duration. Patients were further engaged by asking for their main goal for the day. A patient safety checklist was reviewed. Initially, this task was performed by the nurse manager, who did not verbalize the items unless a deficiency was noted. After 6 months’ experience, this responsibility was given to the staff nurse, who reviewed the checklist verbally as part of the bedside script. Patients were seen daily, including those being discharged later that same day.
Staff and Clinician Education
We developed and implemented a curriculum based on a modified version of the Agency for Healthcare Research and Quality’s TeamStepps® program to ensure that all team members were provided with the basic principles of communication within the healthcare setting. The curriculum consisted of interactive didactics on essential elements of teamwork, including team structure, communication, situation monitoring, and mutual support, as well as the purpose and structure of the MICRO model. The curriculum was delivered to nurses at 3 monthly staff meetings on the study unit and to hospitalists during 3 hospital medicine grand rounds over a 3-month period. Nurses and physicians providing care on both geographic areas of the study unit received the education program because no group of practitioners was designated to only 1 geographic area.
Outcomes
Primary and Secondary Outcomes
The primary outcomes were clinical deterioration (CD) and length of stay. Clinical deterioration was a composite outcome defined a priori as death; escalation of care (ie, transfer to an intensive care unit, intermediate care unit, or teaching unit); or a hospital-acquired complication (ie, venous thromboembolism, fall, stage III-IV pressure ulcer, catheter-associated urinary tract infection, central-line associated bloodstream infection, or Clostridium difficile-associated diarrhea). The LOS was calculated as the mean LOS with outliers excluded (outliers defined as having a LOS 100 days or longer or 2.5 or more standard deviations from the expected LOS).
Process metrics on IDR, such as the duration of rounds, attendance by members of the interdisciplinary team, the percentage of patients discussed, or the effectiveness of communication, were not collected. We assessed patient satisfaction based on the Hospital Consumer Assessment of Healthcare Providers and Systems (HCAHPS) survey.
Patient Safety Culture Survey
To assess the impact on the perceptions of patient safety, we administered the Agency for Healthcare Research and Quality (AHRQ) Hospital Survey on Patient Safety Culture toall staff and clinicians working on both sides of the study unit immediately before and 12 months after implementation of the MICRO model. Results are reported for the AHRQ dimensions that were most relevant to the MICRO intervention: “teamwork within units,” “overall perceptions of safety,” “communication,” “openness,” “overall patient safety grade,” and “handoffs and transitions.” The survey represents pre- and post-comparison. All nurses and hospitalists on both the MICRO and control sides of the study unit had received the TeamStepps curriculum and participated in MICRO rounds by the time of the postintervention survey. We added 3 questions specifically assessing the perception of the efficiency and effectiveness of IDR. Postintervention respondents reflected on their overall impression of IDR, which included their experiences on both sides of the unit, because no group of nurses or hospitalists was exposed only to the MICRO side or the control side of the unit. Responses to survey questions were recorded on a 5-point Likert scale (from “strongly disagree” to “strongly agree” for opinion questions; and “never,” rarely,” sometimes,” “most of the time,” and “always” for frequency questions) and given a score from 1 to 5. The question asking for an overall grade for patient safety was scored from 1 to 5 points corresponding to letter grade choices F, D, C, B, A.
Statistical Analysis
The sample size was based on the estimate of the baseline rate of the primary outcome of CD and the projected decrease by the MICRO intervention. A study using the Global Trigger Tool developed by the Institute for Healthcare Improvement provided a best estimate of 16% as the baseline rate for CD.7 A total of 2000 hospitalizations were planned to be included to have a power of at least 80% to detect a 25% reduction in the annual incidence of CD with a 2-tailed type I error rate of 0.05. Comparisons of dichotomous event rates were made using chi square tests at a 2-tailed level for significance of 0.05. The LOS was analyzed using the nonparametric median test and multivariable regression analysis. We used a generalized linear model with gamma distribution and log link for all analyses of LOS, where LOS was the outcome variable, and intervention vs. control unit type was the predictor variable. Age, sex, race, payer, case mix, and comorbidities defined with the Elixhauser algorithm were used as covariates.8 We used multivariable logistic regression for analysis of CD, where the dependent variable was CD. Predictor variables included intervention, patient age, sex, race, payer, case mix and comorbidities. Patient satisfaction data were compared using the chi square test. The Student t test for dependent means was used to analyze the patient safety culture survey data.
The study protocol was submitted to the Icahn Mount Sinai School of Medicine’s institutional review board and determined to be exempt from full review.
RESULTS
A total of 2005 hospitalizations were included over the 12-month study period, consisting of 1089 hospitalizations in the MICRO group and 916 in the control group. Bedside and standard IDR were completed daily, Monday through Friday without exception. The demographic characteristics and comorbidities were similar for the 2 groups (Table). Hospitalizations of patients who were initially admitted to another unit and subsequently transferred to the study unit accounted for 11.1% of hospitalizations.
Table
Risk-adjusted LOS was similar for the groups (6.6 vs 7.0 days, P = 0.17, for the MICRO and control groups, respectively). On subgroup analysis, a reduction in LOS was noted for patients transferred to the study unit (10.4 vs 14.0 days, P = 0.02, for the MICRO and control groups, respectively). The LOS was unchanged for patients admitted directly to the study unit (6.0 vs 5.8 days, P = 0.93). There was no difference in the incidence of clinical deterioration for the MICRO or control groups (7.7% vs 9.3%, odds ratio, 0.89; 95% confidence interval, 0.61-1.22, P = 0.46).
The finding of a LOS benefit for the MICRO group limited to patients transferred to the study unit prompted a comparison of patients transferred to the study unit and patients directly admitted to the study unit from the emergency department (Appendix 2). Compared to patients admitted directly to the study unit, patients transferred to the study unit were more likely to have Medicaid or no insurance, more likely to be discharged to a facility, had longer LOS, and were more likely to experience CD.
Patient Satisfaction
There were 175 and 140 responses to the HCAHPS survey for the MICRO and the control groups, respectively. Patients in the MICRO group were more likely to report that “doctors, nurses, or other hospital staff talk with you about whether you would have the help you needed when you left the hospital” (88% vs 78%, P = 0.01). Responses for all other HCAHPS items were similar for the 2 groups.
Figure 1
Clinician/Staff Survey
The response rate was 96% (30 nurses and 17 hospitalists) pre-intervention and 100% (30 nurses and 22 hospitalists) postintervention. Hospitalists and nurses gave significantly higher scores for the dimensions “teamwork within units,” “overall perception of patient safety,” and “patient safety grade” on the postintervention survey compared to the pre-intervention survey (Figure 1). Hospitalists and nurses rated the efficiency of IDR and the ability of IDR to identify safety issues higher on the postintervention survey compared to the pre-intervention survey (Figure 2).
Figure 2
DISCUSSION
We transformed daily IDR from a standard conference room model to a structured bedside model with scripted roles, and performed a rigorous comparison using patient-level data. Our finding that transforming daily IDR from a standard conference room model to a bedside model did not significantly reduce LOS suggests either that the model is ineffective or needs to be incorporated into more comprehensive efforts to improve clinical outcomes. Studies suggest that bedside rounding can improve outcomes when implemented in the context of comprehensive restructuring of patient care.4,9 Stein et al.4 have described the reorganization of a medical ward as an “accountable care unit.” The ACU model included daily IDRs at the bedside, as well as geographic-based teams, co-leadership by a hospitalist and nurse manager, and unit-level reporting. Although no definitive conclusions can be drawn based on their descriptive report, transformation of the unit was associated with reduced LOS and mortality. Similarly, Kara et al.9 found that the number of elements of an “accountable care team” model implemented by each unit was associated with greater reductions in LOS and cost. In contrast, our findings of a lack of an effect are consistent with a recent cluster-randomized trial by O’Leary et al,10 which found that implementation of patient-centered bedside rounds did not improve patient satisfaction or perceptions of shared decision-making compared to units using a model of structured IDRs in a conference room setting. It is notable that the control groups in both the O’Leary trial10 and this study did not represent usual care, because these groups featured localization of the clinical teams and high-quality IDR. In our trial, it is plausible that the control side of the unit was functioning at a high level, which would have decreased our ability to further improve outcomes. Whether restructuring unit processes, including implementation of bedside IDR, improves care compared to usual care without these processes is unknown.
We found that the MICRO intervention significantly decreased LOS compared to the control group for patients transferred to the study unit. This analysis was exploratory and the finding was unexpected. Patients were transferred to the study unit from units of higher acuity, and were more likely to have Medicaid or no insurance and be discharged to facilities rather than home, suggesting that these patients had substantial disposition challenges. It is plausible that this is the population for which bedside IDRs may have the greatest impact. This was a secondary analysis, however, and should be considered as hypothesis-generating for future investigations.
Although the impact on outcomes of bedside IDRs is uncertain, potential benefits and practical barriers have been examined. Gonzalo et al.11 surveyed inpatient physicians and nurses at a hospital employing bedside IDRs and found that the benefits ranked the highest were communication, coordination, and teamwork, and the lowest-ranked benefits were related to efficiency and outcomes. The 6 greatest barriers concerned the time required to complete bedside IDR. These results indicate that the time investiture by staff may be a barrier to widespread adoption. More modest changes, such as increasing the structure of standard conference room rounds, may improve care, although the data are mixed. O’Leary et al.12 assessed the value of a structured approach in a conference room setting, which primarily entailed implementing a checklist for newly admitted patients, and found no difference in LOS. Follow-up studies by these investigators found mixed results on the ability of structured IDR to decrease the incidence of adverse events.13,14
The results of our AHRQ survey of patient safety culture found that several important aspects of teamwork and safety were perceived as improved by the intervention, including the “overall grade on patient safety.” Other studies have similarly shown increases in teamwork and safety ratings through redesign of IDR. O’Leary et al.12 surveyed residents and nurses on a unit that implemented a structured, conference room-based IDR and found that providers on the intervention unit rated the teamwork climate higher than providers on the control unit. Our finding that hospitalists and nurses gave higher ratings for IDR being “efficient” and “a good use of my time” on the postintervention survey than the pre-intervention survey suggests that initial concerns about the additional time commitment may be offset by gains in overall efficiency and in development of an environment of enhanced communication, teamwork, and safety.
This study has several limitations. First, the trial may have been underpowered to find small differences between the groups. The trends for decreased LOS and clinical deterioration in the MICRO group may suggest that bedside IDR can provide a small but clinically significant benefit that would be statistically significant only in a larger trial. Second, patients were not randomized to the 2 groups. The impact is diminished, however, because the routine hospital process for assigning patients to the 2 areas in which the groups were located is random and based solely on bed availability. Third, nurses and hospitalists caring for patients in the control group likely experienced improved communication practices from the unit-wide TeamStepps education and from participating in the MICRO protocol when caring for patients on the intervention side of the unit. Fourth, we did not collect data on the effectiveness of communication and are unable to assess the fidelity with which the structured protocol was followed or whether interprofessional communication was fostered or hindered. Lastly, the study was implemented on a nonteaching unit at a single academic medical center. The protocol and the results may not be generalizable to other hospitals or units that include house staff.
In conclusion, transforming IDR from a conference room model to a bedside model did not reduce overall LOS or clinical deterioration on a unit using features of an ACU structure. Although several beneficial effects were noted, including a reduction in LOS for patients transferred to the study unit and higher ratings of the patient safety climate and efficiency of IDR, implementing bedside IDR in this setting has marginal benefit. Future studies should assess whether a comprehensive transformation of the inpatient model of care, including patient-centered bedside IDR, geographic cohorting of teams, and co-leadership, improves outcomes compared to models without these features.
Disclosures
This trial was funded by Medline’s Prevention Above All Discoveries Grant Program. The authors report no financial conflicts of interest.
References
1. O’Leary KJ, Sehgal NL, Terrell G, Williams MV; High Performance Teams and the Hospital of the Future Project Team. Interdisciplinary teamwork in hospitals: A review and practical recommendations for improvement. J Hosp Med. 2011;7(1):48-54. PubMed 2. Gonzalo JD, Wolpaw DR, Lehman E, Chuang CH. Patient-centered interprofessional collaborative care: factors associated with bedside interprofessional rounds. J Gen Intern Med. 2014;29(7):1040-1047. PubMed 3. Pannick S, Davis R, Ashrafian H, et al. Effects of interdisciplinary team care interventions on general medical wards. A systematic review. JAMA Intern Med. 2015;175(8):1288-1298. PubMed 4. Stein J, Payne C, Methvin A, et al. Reorganizing a hospital ward as an accountable care unit. J Hosp Med. 2015;10(1):36-40. PubMed 5. Mohr J, Batalden P, Barach P. Integrating patient safety into the clinical microsystem. Qual Saf Health Care. 2004;13(suppl 2):ii34-ii38. PubMed 6. Nelson EC, Batalden PB, Huber TP, et al. Microsystems in health care: Part 1. Learning from high-performing front-line clinical units. Jt Comm J Qual Improv. 2002;28:472-493. PubMed 7. Rutberg H, Borgstedt Risberg MB, Sjödahl R, Nordqvist P, Valter L, Nilsson L. Characterisations of adverse events detected in a university hospital: a 4-year study using the Global Trigger Tool method. BMJ Open. 2014;4(5):e004879. PubMed 8. Elixhauser A, Steiner C, Harris DR, Coffey RM. Comorbidity measures for use with administrative data. Med Care. 1998;36(1):8-27. PubMed 9. Kara A, Johnson CS, Nicley A, Niemeier MR, Hui SL. Redesigning accountable care: testing the effectiveness of an accountable care team model. J Hosp Med. 2015;10(12):773-779. PubMed 10. O’Leary KJ, Killarney A, Hansen LO, Jones S, Malladi M, Marks K, et al. Effect of patient-centred bedside rounds on hospitalised patients’ decision control, activation and satisfaction with care. BMJ Qual Saf. 2016;25(12):921-928. PubMed 11. Gonzalo JD, Kuperman E, Lehman E, Haidet P. Bedside interprofessional rounds: perceptions of benefits and barriers by internal medicine nursing staff, attending physicians, and housestaff physicians. J Hosp Med. 2014;9(10):646-651. PubMed 12. O’Leary KJ, Wayne DB, Haviley C, Slade ME, Lee J, Williams MV. Improving teamwork: impact of structured interdisciplinary rounds on a medical teaching unit. J Gen Intern Med. 2010;25:826-832. PubMed 13. O’Leary KJ, Buck R, Fligiel HM, et al. Structured interdisciplinary rounds in a medical teaching unit: improving patient safety. Arch Intern Med. 2011;171(7):678-684. PubMed 14. O’Leary KJ, Creden AJ, Slade ME, et al. Implementation of unit-based interventions to improve teamwork and patient safety on a medical service. Am J Med Qual. 2015;30(5):409-416. PubMed
Address for correspondence and reprint requests: Andrew S. Dunn, MD, MPH, Chief, Division of Hospital Medicine, Mount Sinai Health System, 1468 Madison Ave, Box 1087, New York, NY 10029; Telephone: 212-241-2920; Fax: 212-289-6393; E-mail: [email protected]
Content Gating
Gated (full article locked unless allowed per User)