User login
Impact of Displaying Inpatient Pharmaceutical Costs at the Time of Order Entry: Lessons From a Tertiary Care Center
Secondary to rising healthcare costs in the United States, broad efforts are underway to identify and reduce waste in the health system.1,2 A recent systematic review exhibited that many physicians inaccurately estimate the cost of medications.3 Raising awareness of medication costs among prescribers is one potential way to promote high-value care.
Some evidence suggests that cost transparency may help prescribers understand how medication orders drive costs. In a previous study carried out at the Johns Hopkins Hospital, fee data were displayed to providers for diagnostic laboratory tests.4 An 8.6% decrease (95% confidence interval [CI], –8.99% to –8.19%) in test ordering was observed when costs were displayed vs a 5.6% increase (95% CI, 4.90% to 6.39%) in ordering when costs were not displayed during a 6-month intervention period (P < 0.001). Conversely, a similar study that investigated the impact of cost transparency on inpatient imaging utilization did not demonstrate a significant influence of cost display.5 This suggests that cost transparency may work in some areas of care but not in others. A systematic review that investigated price-display interventions for imaging, laboratory studies, and medications reported 10 studies that demonstrated a statistically significant decrease in expenditures without an effect on patient safety.6
Informing prescribers of institution-specific medication costs within and between drug classes may enable the selection of less expensive, therapeutically equivalent drugs. Prior studies investigating the effect of medication cost display were conducted in a variety of patient care settings, including ambulatory clinics,7 urgent care centers,8 and operating rooms,9,10 with some yielding positive results in terms of ordering and cost11,12 and others having no impact.13,14 Currently, there is little evidence specifically addressing the effect of cost display for medications in the inpatient setting.
As part of an institutional initiative to control pharmaceutical expenditures, informational messaging for several high-cost drugs was initiated at our tertiary care hospital in April 2015. The goal of our study was to assess the effect of these medication cost messages on ordering practices. We hypothesized that the display of inpatient pharmaceutical costs at the time of order entry would result in a reduction in ordering.
METHODS
Setting, Intervention, and Participants
As part of an effort to educate prescribers about the high cost of medications, 9 intravenous (IV) medications were selected by the Johns Hopkins Hospital Pharmacy and Therapeutics Committee as targets for drug cost messaging. The intention of the committee was to implement a rapid, low-cost, proof-of-concept, quality-improvement project that was not designed as prospective research. Representatives from the pharmacy and clinicians from relevant clinical areas participated in preimplementation discussions to help identify medications that were subjectively felt to be overused at our institution and potentially modifiable through provider education. The criteria for selecting drug targets included a variety of factors, such as medications infrequently ordered but representing a significant cost per dose (eg, eculizumab and ribavirin), frequently ordered medications with less expensive substitutes (eg, linezolid and voriconazole), and high-cost medications without direct therapeutic alternatives (eg, calcitonin). From April 10, 2015, to October 5, 2015, the computerized Provider Order Entry System (cPOE), Sunrise Clinical Manager (Allscripts Corporation, Chicago, IL), displayed the cost for targeted medications. Seven of the medication alerts also included a reasonable therapeutic alternative and its cost. There were no restrictions placed on ordering; prescribers were able to choose the high-cost medications at their discretion.
Despite the fact that this initiative was not designed as a research project, we felt it was important to formally evaluate the impact of the drug cost messaging effort to inform future quality-improvement interventions. Each medication was compared to its preintervention baseline utilization dating back to January 1, 2013. For the 7 medications with alternatives offered, we also analyzed use of the suggested alternative during these time periods.
Data Sources and Measurement
Our study utilized data obtained from the pharmacy order verification system and the cPOE database. Data were collected over a period of 143 weeks from January 1, 2013, to October 5, 2015, to allow for a baseline period (January 1, 2013, to April 9, 2015) and an intervention period (April 10, 2015, to October 5, 2015). Data elements extracted included drug characteristics (dosage form, route, cost, strength, name, and quantity), patient characteristics (race, gender, and age), clinical setting (facility location, inpatient or outpatient), and billing information (provider name, doses dispensed from pharmacy, order number, revenue or procedure code, record number, date of service, and unique billing number) for each admission. Using these elements, we generated the following 8 variables to use in our analyses: week, month, period identifier, drug name, dosage form, weekly orders, weekly patient days, and number of weekly orders per 10,000 patient days. Average wholesale price (AWP), referred to as medication cost in this manuscript, was used to report all drug costs in all associated cost calculations. While the actual cost of acquisition and price charged to the patient may vary based on several factors, including manufacturer and payer, we chose to use AWP as a generalizable estimate of the cost of acquisition of the drug for the hospital.
Variables
“Week” and “month” were defined as the week and month of our study, respectively. The “period identifier” was a binary variable that identified the time period before and after the intervention. “Weekly orders” was defined as the total number of new orders placed per week for each specified drug included in our study. For example, if a patient received 2 discrete, new orders for a medication in a given week, 2 orders would be counted toward the “weekly orders” variable. “Patient days,” defined as the total number of patients treated at our facility, was summated for each week of our study to yield “weekly patient days.” To derive the “number of weekly orders per 10,000 patient days,” we divided weekly orders by weekly patient days and multiplied the resultant figure by 10,000.
Statistical Analysis

Segmented regression, a form of interrupted time series analysis, is a quasi-experimental design that was used to determine the immediate and sustained effects of the drug cost messages on the rate of medication ordering.15-17 The model enabled the use of comparison groups (alternative medications, as described above) to enhance internal validity.
In time series data, outcomes may not be independent over time. Autocorrelation of the error terms can arise when outcomes are more similar at time points closer together than outcomes at time points further apart. Failure to account for autocorrelation of the error terms may lead to underestimated standard errors. The presence of autocorrelation, assessed by calculating the Durbin-Watson statistic, was significant among our data. To adjust for this, we employed a Prais-Winsten estimation to adjust the error term (εt) calculated in our models.
Two segmented linear regression models were used to estimate trends in ordering before and after the intervention. The presence or absence of a comparator drug determined which model was to be used. When only single medications were under study, as in the case of eculizumab and calcitonin, our regression model was as follows:
Yt = (β0) + (β1)(Timet) + (β2)(Interventiont) + (β3)(Post-Intervention Timet) + (εt)
In our single-drug model, Yt denoted the number of orders per 10,000 patient days at week “t”; Timet was a continuous variable that indicated the number of weeks prior to or after the study intervention (April 10, 2015) and ranged from –116 to 27 weeks. Post-Intervention Timet was a continuous variable that denoted the number of weeks since the start of the intervention and is coded as zero for all time periods prior to the intervention. β0 was the estimated baseline number of orders per 10,000 patient days at the beginning of the study. β1 is the trend of orders per 10,000 patient days per week during the preintervention period; β2 represents an estimate of the change in the number of orders per 10,000 patient days immediately after the intervention; β3 denotes the difference between preintervention and postintervention slopes; and εt is the “error term,” which represents autocorrelation and random variability of the data.
As mentioned previously, alternative dosage forms of 7 medications included in our study were utilized as comparison groups. In these instances (when multiple drugs were included in our analyses), the following regression model was applied:
Y t = ( β 0 ) + ( β 1 )(Time t ) + ( β 2 )(Intervention t ) + ( β 3 )(Post-Intervention Time t ) + ( β 4 )(Cohort) + ( β 5 )(Cohort)(Time t ) + ( β 6 )(Cohort)(Intervention t ) + ( β 7 )(Cohort)(Post-Intervention Time t ) + ( ε t )
Here, 3 coefficients were added (β4-β7) to describe an additional cohort of orders. Cohort, a binary indicator variable, held a value of either 0 or 1 when the model was used to describe the treatment or comparison group, respectively. The coefficients β4-β7 described the treatment group, and β0-β3 described the comparison group. β4 was the difference in the number of baseline orders per 10,000 patient days between treatment and comparison groups; Β5 represented the difference between the estimated ordering trends of treatment and comparison groups; and Β6 indicated the difference in immediate changes in the number of orders per 10,000 patient days in the 2 groups following the intervention.
The number of orders per week was recorded for each medicine, which enabled a large number of data points to be included in our analyses. This allowed for more accurate and stable estimates to be made in our regression model. A total of 143 data points were collected for each study group, 116 before and 27 following each intervention.
All analyses were conducted by using STATA version 13.1 (StataCorp LP, College Station, TX).
RESULTS

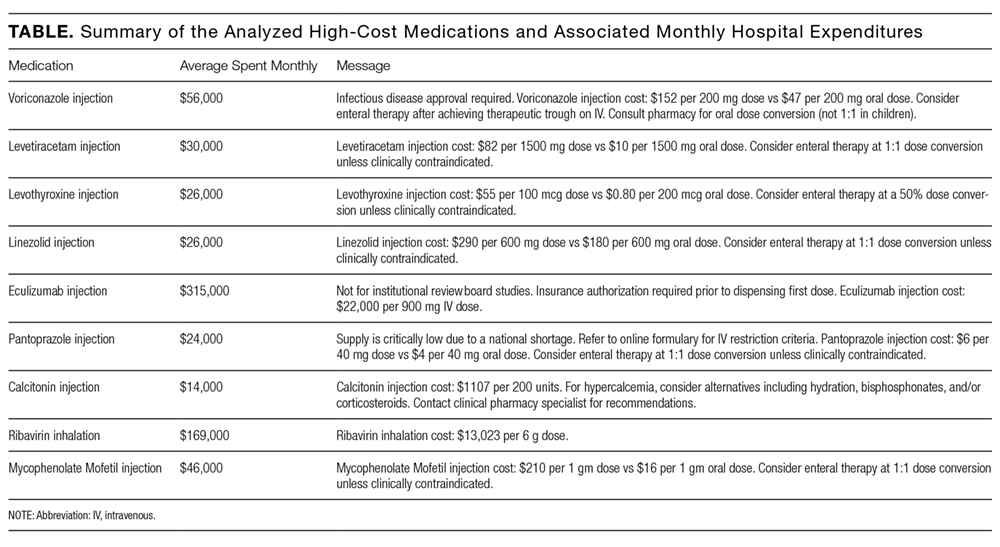
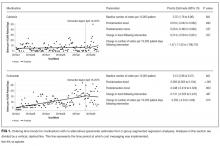
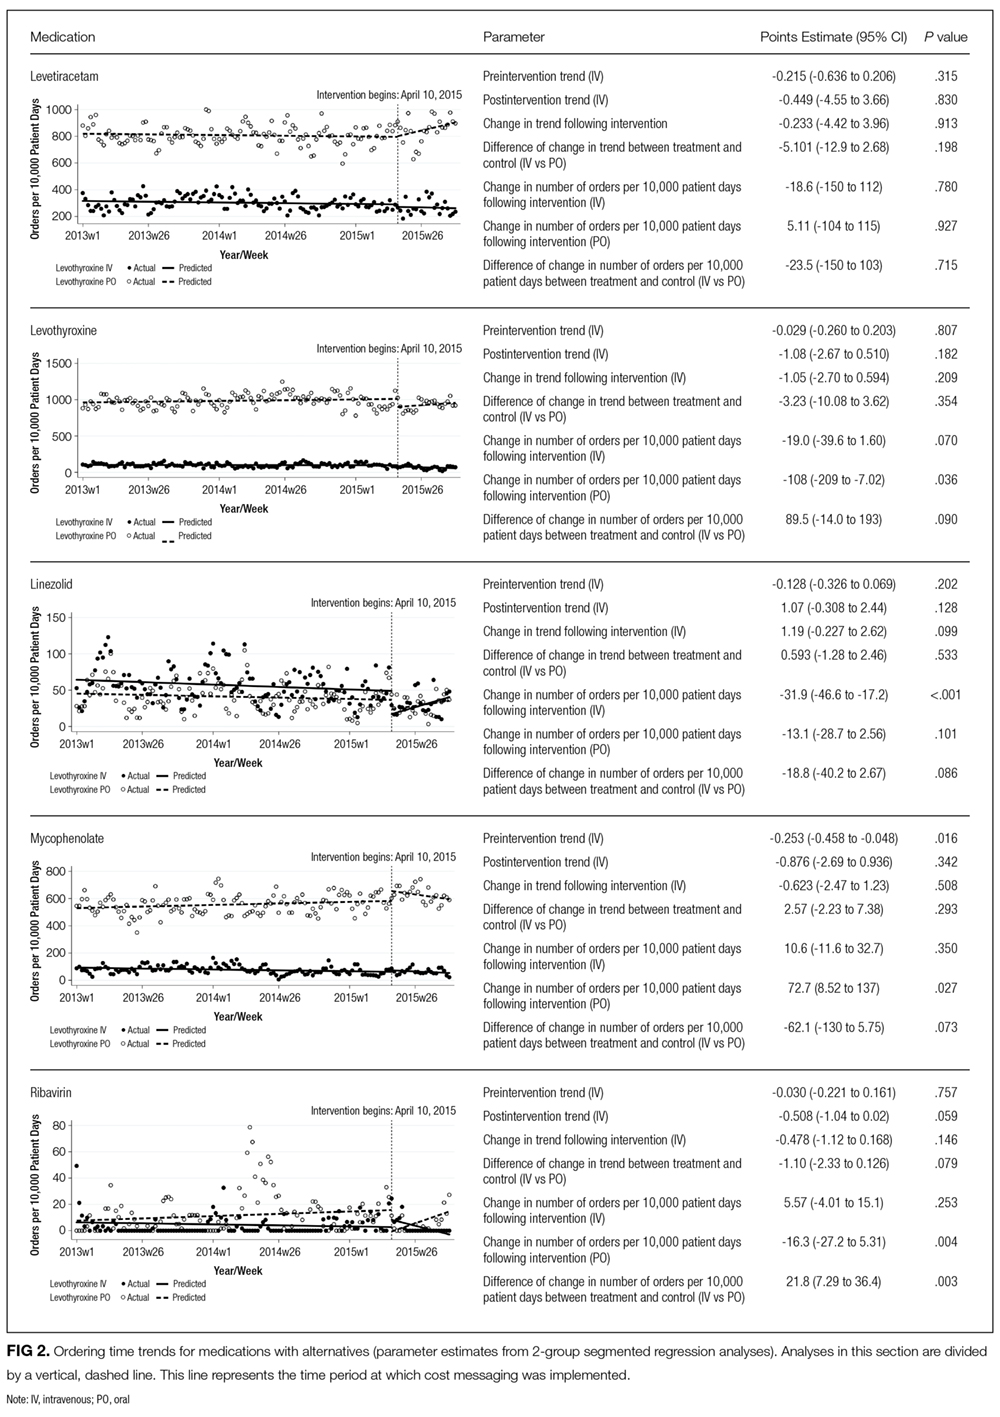
Initial results pertaining to 9 IV medications were examined (Table). Following the implementation of cost messaging, no significant changes were observed in order frequency or trend for IV formulations of eculizumab, calcitonin, levetiracetam, linezolid, mycophenolate, ribavirin, voriconazole, and levothyroxine (Figures 1 and 2). However, a significant decrease in the number of oral ribavirin orders (Figure 2), the control group for the IV form, was observed (–16.3 orders per 10,000 patient days; P = .004; 95% CI, –27.2 to –5.31).
DISCUSSION
Our results suggest that the passive strategy of displaying cost alone was not effective in altering prescriber ordering patterns for the selected medications. This may be due to a lack of awareness regarding direct financial impact on the patient, importance of costs in medical decision-making, or a perceived lack of alternatives or suitability of recommended alternatives. These results may prove valuable to hospital and pharmacy leadership as they develop strategies to curb medication expense.
Changes observed in IV pantoprazole ordering are instructive. Due to a national shortage, the IV form of this medication underwent a restriction, which required approval by the pharmacy prior to dispensing. This restriction was instituted independently of our study and led to a 73% decrease from usage rates prior to policy implementation (Figure 3). Ordering was restricted according to defined criteria for IV use. The restriction did not apply to oral pantoprazole, and no significant change in ordering of the oral formulation was noted during the evaluated period (Figure 3).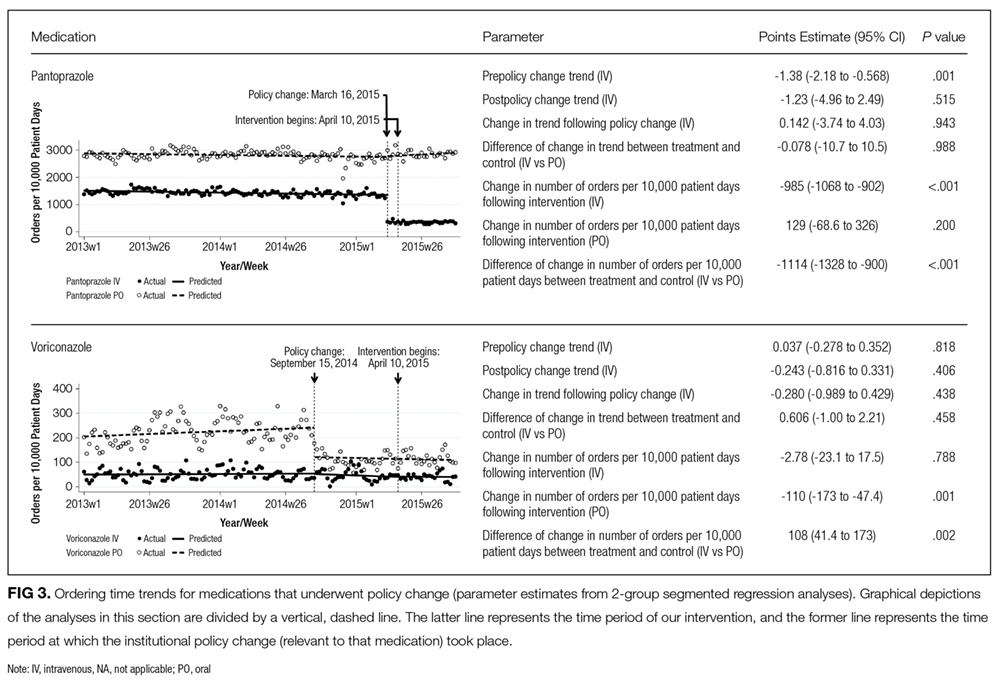
The dramatic effect of policy changes, as observed with pantoprazole and voriconazole, suggests that a more active strategy may have a greater impact on prescriber behavior when it comes to medication ordering in the inpatient setting. It also highlights several potential sources of confounding that may introduce bias to cost-transparency studies.
This study has multiple limitations. First, as with all observational study designs, causation cannot be drawn with certainty from our results. While we were able to compare medications to their preintervention baselines, the data could have been impacted by longitudinal or seasonal trends in medication ordering, which may have been impacted by seasonal variability in disease prevalence, changes in resistance patterns, and annual cycling of house staff in an academic medical center. While there appear to be potential seasonal patterns regarding prescribing patterns for some of the medications included in this analysis, we also believe the linear regressions capture the overall trends in prescribing adequately. Nonstationarity, or trends in the mean and variance of the outcome that are not related to the intervention, may introduce bias in the interpretation of our findings. However, we believe the parameters included in our models, namely the immediate change in the intercept following the intervention and the change in the trend of the rate of prescribing over time from pre- to postintervention, provide substantial protections from faulty interpretation. Our models are limited to the extent that these parameters do not account for nonstationarity. Additionally, we did not collect data on dosing frequency or duration of treatment, which would have been dependent on factors that are not readily quantified, such as indication, clinical rationale, or patient response. Thus, we were not able to evaluate the impact of the intervention on these factors.
Although intended to enhance internal validity, comparison groups were also subject to external influence. For example, we observed a significant, short-lived rise in oral ribavirin (a control medication) ordering during the preintervention baseline period that appeared to be independent of our intervention and may speak to the unaccounted-for longitudinal variability detailed above.
Finally, the clinical indication and setting may be important. Previous studies performed at the same hospital with price displays showed a reduction in laboratory ordering but no change in imaging.18,19 One might speculate that ordering fewer laboratory tests is viewed by providers as eliminating waste rather than choosing a less expensive option to accomplish the same diagnostic task at hand. Therapeutics may be more similar to radiology tests, because patients presumably need the treatment and often do not have the option of simply not ordering without a concerted effort to reevaluate the treatment plan. Additionally, in a tertiary care teaching center such as ours, a junior clinician, oftentimes at the behest of a more senior colleague, enters most orders. In an environment in which the ordering prescriber has more autonomy or when the order is driven by a junior practitioner rather than an attending (such as daily laboratories), results may be different. Additionally, institutions that incentivize prescribers directly to practice cost-conscious care may experience different results from similar interventions.
We conclude that, in the case of medication cost messaging, a strategy of displaying cost information alone was insufficient to affect prescriber ordering behavior. Coupling cost transparency with educational interventions and active stewardship to impact clinical practice is worthy of further study.
Disclosures: The authors state that there were no external sponsors for this work. The Johns Hopkins Hospital and University “funded” this work by paying the salaries of the authors. The author team maintained independence and made all decisions regarding the study design, data collection, data analysis, interpretation of results, writing of the research report, and decision to submit it for publication. Dr. Shermock had full access to all the study data and takes responsibility for the integrity of the data and accuracy of the data analysis.
1. Berwick DM, Hackbarth AD. Eliminating Waste in US Health Care. JAMA. 2012;307(14):1513-1516. PubMed
2. PricewaterhouseCoopers’ Health Research Institute. The Price of Excess: Identifying Waste in Healthcare Spending. http://www.pwc.com/us/en/healthcare/publications/the-price-of-excess.html. Accessed June 17, 2015.
3. Allan GM, Lexchin J, Wiebe N. Physician awareness of drug cost: a systematic review. PLoS Med. 2007;4(9):e283. PubMed
4. Feldman LS, Shihab HM, Thiemann D, et al. Impact of providing fee data on laboratory test ordering: a controlled clinical trial. JAMA Intern Med. 2013;173(10):903-908. PubMed
5. Durand DJ, Feldman LS, Lewin JS, Brotman DJ. Provider cost transparency alone has no impact on inpatient imaging utilization. J Am Coll Radiol. 2013;10(2):108-113. PubMed
6. Silvestri MT, Bongiovanni TR, Glover JG, Gross CP. Impact of price display on provider ordering: A systematic review. J Hosp Med. 2016;11(1):65-76. PubMed
7. Ornstein SM, MacFarlane LL, Jenkins RG, Pan Q, Wager KA. Medication cost information in a computer-based patient record system. Impact on prescribing in a family medicine clinical practice. Arch Fam Med. 1999;8(2):118-121. PubMed
8. Guterman JJ, Chernof BA, Mares B, Gross-Schulman SG, Gan PG, Thomas D. Modifying provider behavior: A low-tech approach to pharmaceutical ordering. J Gen Intern Med. 2002;17(10):792-796. PubMed
9. McNitt JD, Bode ET, Nelson RE. Long-term pharmaceutical cost reduction using a data management system. Anesth Analg. 1998;87(4):837-842. PubMed
10. Horrow JC, Rosenberg H. Price stickers do not alter drug usage. Can J Anaesth. 1994;41(11):1047-1052. PubMed
11. Guterman JJ, Chernof BA, Mares B, Gross-Schulman SG, Gan PG, Thomas D. Modifying provider behavior: A low-tech approach to pharmaceutical ordering. J Gen Intern Med. 2002;17(10):792-796. PubMed
12. McNitt JD, Bode ET, Nelson RE. Long-term pharmaceutical cost reduction using a data management system. Anesth Analg. 1998;87(4):837-842. PubMed
13. Ornstein SM, MacFarlane LL, Jenkins RG, Pan Q, Wager KA. Medication cost information in a computer-based patient record system. Impact on prescribing in a family medicine clinical practice. Arch Fam Med. 1999;8(2):118-121. PubMed
14. Horrow JC, Rosenberg H. Price stickers do not alter drug usage. Can J Anaesth. 1994;41(11):1047-1052. PubMed
15. Jandoc R, Burden AM, Mamdani M, Levesque LE, Cadarette SM. Interrupted time series analysis in drug utilization research is increasing: Systematic review and recommendations. J Clin Epidemiol. 2015;68(8):950-56. PubMed
16. Linden A. Conducting interrupted time-series analysis for single- and multiple-group comparisons. Stata J. 2015;15(2):480-500.
17. Linden A, Adams JL. Applying a propensity score-based weighting model to interrupted time series data: improving causal inference in programme evaluation. J Eval Clin Pract. 2011;17(6):1231-1238. PubMed
18. Feldman LS, Shihab HM, Thiemann D, et al. Impact of providing fee data on laboratory test ordering: a controlled clinical trial. JAMA Intern Med. 2013;173(10):903-908. PubMed
19. Durand DJ, Feldman LS, Lewin JS, Brotman DJ. Provider cost transparency alone has no impact on inpatient imaging utilization. J Am Coll Radiol. 2013;10(2):108-113. PubMed
Secondary to rising healthcare costs in the United States, broad efforts are underway to identify and reduce waste in the health system.1,2 A recent systematic review exhibited that many physicians inaccurately estimate the cost of medications.3 Raising awareness of medication costs among prescribers is one potential way to promote high-value care.
Some evidence suggests that cost transparency may help prescribers understand how medication orders drive costs. In a previous study carried out at the Johns Hopkins Hospital, fee data were displayed to providers for diagnostic laboratory tests.4 An 8.6% decrease (95% confidence interval [CI], –8.99% to –8.19%) in test ordering was observed when costs were displayed vs a 5.6% increase (95% CI, 4.90% to 6.39%) in ordering when costs were not displayed during a 6-month intervention period (P < 0.001). Conversely, a similar study that investigated the impact of cost transparency on inpatient imaging utilization did not demonstrate a significant influence of cost display.5 This suggests that cost transparency may work in some areas of care but not in others. A systematic review that investigated price-display interventions for imaging, laboratory studies, and medications reported 10 studies that demonstrated a statistically significant decrease in expenditures without an effect on patient safety.6
Informing prescribers of institution-specific medication costs within and between drug classes may enable the selection of less expensive, therapeutically equivalent drugs. Prior studies investigating the effect of medication cost display were conducted in a variety of patient care settings, including ambulatory clinics,7 urgent care centers,8 and operating rooms,9,10 with some yielding positive results in terms of ordering and cost11,12 and others having no impact.13,14 Currently, there is little evidence specifically addressing the effect of cost display for medications in the inpatient setting.
As part of an institutional initiative to control pharmaceutical expenditures, informational messaging for several high-cost drugs was initiated at our tertiary care hospital in April 2015. The goal of our study was to assess the effect of these medication cost messages on ordering practices. We hypothesized that the display of inpatient pharmaceutical costs at the time of order entry would result in a reduction in ordering.
METHODS
Setting, Intervention, and Participants
As part of an effort to educate prescribers about the high cost of medications, 9 intravenous (IV) medications were selected by the Johns Hopkins Hospital Pharmacy and Therapeutics Committee as targets for drug cost messaging. The intention of the committee was to implement a rapid, low-cost, proof-of-concept, quality-improvement project that was not designed as prospective research. Representatives from the pharmacy and clinicians from relevant clinical areas participated in preimplementation discussions to help identify medications that were subjectively felt to be overused at our institution and potentially modifiable through provider education. The criteria for selecting drug targets included a variety of factors, such as medications infrequently ordered but representing a significant cost per dose (eg, eculizumab and ribavirin), frequently ordered medications with less expensive substitutes (eg, linezolid and voriconazole), and high-cost medications without direct therapeutic alternatives (eg, calcitonin). From April 10, 2015, to October 5, 2015, the computerized Provider Order Entry System (cPOE), Sunrise Clinical Manager (Allscripts Corporation, Chicago, IL), displayed the cost for targeted medications. Seven of the medication alerts also included a reasonable therapeutic alternative and its cost. There were no restrictions placed on ordering; prescribers were able to choose the high-cost medications at their discretion.
Despite the fact that this initiative was not designed as a research project, we felt it was important to formally evaluate the impact of the drug cost messaging effort to inform future quality-improvement interventions. Each medication was compared to its preintervention baseline utilization dating back to January 1, 2013. For the 7 medications with alternatives offered, we also analyzed use of the suggested alternative during these time periods.
Data Sources and Measurement
Our study utilized data obtained from the pharmacy order verification system and the cPOE database. Data were collected over a period of 143 weeks from January 1, 2013, to October 5, 2015, to allow for a baseline period (January 1, 2013, to April 9, 2015) and an intervention period (April 10, 2015, to October 5, 2015). Data elements extracted included drug characteristics (dosage form, route, cost, strength, name, and quantity), patient characteristics (race, gender, and age), clinical setting (facility location, inpatient or outpatient), and billing information (provider name, doses dispensed from pharmacy, order number, revenue or procedure code, record number, date of service, and unique billing number) for each admission. Using these elements, we generated the following 8 variables to use in our analyses: week, month, period identifier, drug name, dosage form, weekly orders, weekly patient days, and number of weekly orders per 10,000 patient days. Average wholesale price (AWP), referred to as medication cost in this manuscript, was used to report all drug costs in all associated cost calculations. While the actual cost of acquisition and price charged to the patient may vary based on several factors, including manufacturer and payer, we chose to use AWP as a generalizable estimate of the cost of acquisition of the drug for the hospital.
Variables
“Week” and “month” were defined as the week and month of our study, respectively. The “period identifier” was a binary variable that identified the time period before and after the intervention. “Weekly orders” was defined as the total number of new orders placed per week for each specified drug included in our study. For example, if a patient received 2 discrete, new orders for a medication in a given week, 2 orders would be counted toward the “weekly orders” variable. “Patient days,” defined as the total number of patients treated at our facility, was summated for each week of our study to yield “weekly patient days.” To derive the “number of weekly orders per 10,000 patient days,” we divided weekly orders by weekly patient days and multiplied the resultant figure by 10,000.
Statistical Analysis
Segmented regression, a form of interrupted time series analysis, is a quasi-experimental design that was used to determine the immediate and sustained effects of the drug cost messages on the rate of medication ordering.15-17 The model enabled the use of comparison groups (alternative medications, as described above) to enhance internal validity.
In time series data, outcomes may not be independent over time. Autocorrelation of the error terms can arise when outcomes are more similar at time points closer together than outcomes at time points further apart. Failure to account for autocorrelation of the error terms may lead to underestimated standard errors. The presence of autocorrelation, assessed by calculating the Durbin-Watson statistic, was significant among our data. To adjust for this, we employed a Prais-Winsten estimation to adjust the error term (εt) calculated in our models.
Two segmented linear regression models were used to estimate trends in ordering before and after the intervention. The presence or absence of a comparator drug determined which model was to be used. When only single medications were under study, as in the case of eculizumab and calcitonin, our regression model was as follows:
Yt = (β0) + (β1)(Timet) + (β2)(Interventiont) + (β3)(Post-Intervention Timet) + (εt)
In our single-drug model, Yt denoted the number of orders per 10,000 patient days at week “t”; Timet was a continuous variable that indicated the number of weeks prior to or after the study intervention (April 10, 2015) and ranged from –116 to 27 weeks. Post-Intervention Timet was a continuous variable that denoted the number of weeks since the start of the intervention and is coded as zero for all time periods prior to the intervention. β0 was the estimated baseline number of orders per 10,000 patient days at the beginning of the study. β1 is the trend of orders per 10,000 patient days per week during the preintervention period; β2 represents an estimate of the change in the number of orders per 10,000 patient days immediately after the intervention; β3 denotes the difference between preintervention and postintervention slopes; and εt is the “error term,” which represents autocorrelation and random variability of the data.
As mentioned previously, alternative dosage forms of 7 medications included in our study were utilized as comparison groups. In these instances (when multiple drugs were included in our analyses), the following regression model was applied:
Y t = ( β 0 ) + ( β 1 )(Time t ) + ( β 2 )(Intervention t ) + ( β 3 )(Post-Intervention Time t ) + ( β 4 )(Cohort) + ( β 5 )(Cohort)(Time t ) + ( β 6 )(Cohort)(Intervention t ) + ( β 7 )(Cohort)(Post-Intervention Time t ) + ( ε t )
Here, 3 coefficients were added (β4-β7) to describe an additional cohort of orders. Cohort, a binary indicator variable, held a value of either 0 or 1 when the model was used to describe the treatment or comparison group, respectively. The coefficients β4-β7 described the treatment group, and β0-β3 described the comparison group. β4 was the difference in the number of baseline orders per 10,000 patient days between treatment and comparison groups; Β5 represented the difference between the estimated ordering trends of treatment and comparison groups; and Β6 indicated the difference in immediate changes in the number of orders per 10,000 patient days in the 2 groups following the intervention.
The number of orders per week was recorded for each medicine, which enabled a large number of data points to be included in our analyses. This allowed for more accurate and stable estimates to be made in our regression model. A total of 143 data points were collected for each study group, 116 before and 27 following each intervention.
All analyses were conducted by using STATA version 13.1 (StataCorp LP, College Station, TX).
RESULTS
Initial results pertaining to 9 IV medications were examined (Table). Following the implementation of cost messaging, no significant changes were observed in order frequency or trend for IV formulations of eculizumab, calcitonin, levetiracetam, linezolid, mycophenolate, ribavirin, voriconazole, and levothyroxine (Figures 1 and 2). However, a significant decrease in the number of oral ribavirin orders (Figure 2), the control group for the IV form, was observed (–16.3 orders per 10,000 patient days; P = .004; 95% CI, –27.2 to –5.31).
DISCUSSION
Our results suggest that the passive strategy of displaying cost alone was not effective in altering prescriber ordering patterns for the selected medications. This may be due to a lack of awareness regarding direct financial impact on the patient, importance of costs in medical decision-making, or a perceived lack of alternatives or suitability of recommended alternatives. These results may prove valuable to hospital and pharmacy leadership as they develop strategies to curb medication expense.
Changes observed in IV pantoprazole ordering are instructive. Due to a national shortage, the IV form of this medication underwent a restriction, which required approval by the pharmacy prior to dispensing. This restriction was instituted independently of our study and led to a 73% decrease from usage rates prior to policy implementation (Figure 3). Ordering was restricted according to defined criteria for IV use. The restriction did not apply to oral pantoprazole, and no significant change in ordering of the oral formulation was noted during the evaluated period (Figure 3).
The dramatic effect of policy changes, as observed with pantoprazole and voriconazole, suggests that a more active strategy may have a greater impact on prescriber behavior when it comes to medication ordering in the inpatient setting. It also highlights several potential sources of confounding that may introduce bias to cost-transparency studies.
This study has multiple limitations. First, as with all observational study designs, causation cannot be drawn with certainty from our results. While we were able to compare medications to their preintervention baselines, the data could have been impacted by longitudinal or seasonal trends in medication ordering, which may have been impacted by seasonal variability in disease prevalence, changes in resistance patterns, and annual cycling of house staff in an academic medical center. While there appear to be potential seasonal patterns regarding prescribing patterns for some of the medications included in this analysis, we also believe the linear regressions capture the overall trends in prescribing adequately. Nonstationarity, or trends in the mean and variance of the outcome that are not related to the intervention, may introduce bias in the interpretation of our findings. However, we believe the parameters included in our models, namely the immediate change in the intercept following the intervention and the change in the trend of the rate of prescribing over time from pre- to postintervention, provide substantial protections from faulty interpretation. Our models are limited to the extent that these parameters do not account for nonstationarity. Additionally, we did not collect data on dosing frequency or duration of treatment, which would have been dependent on factors that are not readily quantified, such as indication, clinical rationale, or patient response. Thus, we were not able to evaluate the impact of the intervention on these factors.
Although intended to enhance internal validity, comparison groups were also subject to external influence. For example, we observed a significant, short-lived rise in oral ribavirin (a control medication) ordering during the preintervention baseline period that appeared to be independent of our intervention and may speak to the unaccounted-for longitudinal variability detailed above.
Finally, the clinical indication and setting may be important. Previous studies performed at the same hospital with price displays showed a reduction in laboratory ordering but no change in imaging.18,19 One might speculate that ordering fewer laboratory tests is viewed by providers as eliminating waste rather than choosing a less expensive option to accomplish the same diagnostic task at hand. Therapeutics may be more similar to radiology tests, because patients presumably need the treatment and often do not have the option of simply not ordering without a concerted effort to reevaluate the treatment plan. Additionally, in a tertiary care teaching center such as ours, a junior clinician, oftentimes at the behest of a more senior colleague, enters most orders. In an environment in which the ordering prescriber has more autonomy or when the order is driven by a junior practitioner rather than an attending (such as daily laboratories), results may be different. Additionally, institutions that incentivize prescribers directly to practice cost-conscious care may experience different results from similar interventions.
We conclude that, in the case of medication cost messaging, a strategy of displaying cost information alone was insufficient to affect prescriber ordering behavior. Coupling cost transparency with educational interventions and active stewardship to impact clinical practice is worthy of further study.
Disclosures: The authors state that there were no external sponsors for this work. The Johns Hopkins Hospital and University “funded” this work by paying the salaries of the authors. The author team maintained independence and made all decisions regarding the study design, data collection, data analysis, interpretation of results, writing of the research report, and decision to submit it for publication. Dr. Shermock had full access to all the study data and takes responsibility for the integrity of the data and accuracy of the data analysis.
1. Berwick DM, Hackbarth AD. Eliminating Waste in US Health Care. JAMA. 2012;307(14):1513-1516. PubMed
2. PricewaterhouseCoopers’ Health Research Institute. The Price of Excess: Identifying Waste in Healthcare Spending. http://www.pwc.com/us/en/healthcare/publications/the-price-of-excess.html. Accessed June 17, 2015.
3. Allan GM, Lexchin J, Wiebe N. Physician awareness of drug cost: a systematic review. PLoS Med. 2007;4(9):e283. PubMed
4. Feldman LS, Shihab HM, Thiemann D, et al. Impact of providing fee data on laboratory test ordering: a controlled clinical trial. JAMA Intern Med. 2013;173(10):903-908. PubMed
5. Durand DJ, Feldman LS, Lewin JS, Brotman DJ. Provider cost transparency alone has no impact on inpatient imaging utilization. J Am Coll Radiol. 2013;10(2):108-113. PubMed
6. Silvestri MT, Bongiovanni TR, Glover JG, Gross CP. Impact of price display on provider ordering: A systematic review. J Hosp Med. 2016;11(1):65-76. PubMed
7. Ornstein SM, MacFarlane LL, Jenkins RG, Pan Q, Wager KA. Medication cost information in a computer-based patient record system. Impact on prescribing in a family medicine clinical practice. Arch Fam Med. 1999;8(2):118-121. PubMed
8. Guterman JJ, Chernof BA, Mares B, Gross-Schulman SG, Gan PG, Thomas D. Modifying provider behavior: A low-tech approach to pharmaceutical ordering. J Gen Intern Med. 2002;17(10):792-796. PubMed
9. McNitt JD, Bode ET, Nelson RE. Long-term pharmaceutical cost reduction using a data management system. Anesth Analg. 1998;87(4):837-842. PubMed
10. Horrow JC, Rosenberg H. Price stickers do not alter drug usage. Can J Anaesth. 1994;41(11):1047-1052. PubMed
11. Guterman JJ, Chernof BA, Mares B, Gross-Schulman SG, Gan PG, Thomas D. Modifying provider behavior: A low-tech approach to pharmaceutical ordering. J Gen Intern Med. 2002;17(10):792-796. PubMed
12. McNitt JD, Bode ET, Nelson RE. Long-term pharmaceutical cost reduction using a data management system. Anesth Analg. 1998;87(4):837-842. PubMed
13. Ornstein SM, MacFarlane LL, Jenkins RG, Pan Q, Wager KA. Medication cost information in a computer-based patient record system. Impact on prescribing in a family medicine clinical practice. Arch Fam Med. 1999;8(2):118-121. PubMed
14. Horrow JC, Rosenberg H. Price stickers do not alter drug usage. Can J Anaesth. 1994;41(11):1047-1052. PubMed
15. Jandoc R, Burden AM, Mamdani M, Levesque LE, Cadarette SM. Interrupted time series analysis in drug utilization research is increasing: Systematic review and recommendations. J Clin Epidemiol. 2015;68(8):950-56. PubMed
16. Linden A. Conducting interrupted time-series analysis for single- and multiple-group comparisons. Stata J. 2015;15(2):480-500.
17. Linden A, Adams JL. Applying a propensity score-based weighting model to interrupted time series data: improving causal inference in programme evaluation. J Eval Clin Pract. 2011;17(6):1231-1238. PubMed
18. Feldman LS, Shihab HM, Thiemann D, et al. Impact of providing fee data on laboratory test ordering: a controlled clinical trial. JAMA Intern Med. 2013;173(10):903-908. PubMed
19. Durand DJ, Feldman LS, Lewin JS, Brotman DJ. Provider cost transparency alone has no impact on inpatient imaging utilization. J Am Coll Radiol. 2013;10(2):108-113. PubMed
© 2017 Society of Hospital Medicine
Collaboration of the NIH and PHS Commissioned Corps in the International Ebola Clinical Research Response
The Ebola epidemic of 2014-2016 challenged many federal agencies to find creative ways to help address the vexing problems created by the spread of the disease.
The response from the U.S. and the global community took many forms: Not only was there a need for the typical medical care support, but also for basic public health systems to track the spread of disease, provide clean water, and dispose of infectious waste. Because no known preventive vaccines or therapeutics existed for those infected, the recognition of a research component to the response became abundantly clear as the epidemic continued. As a result, the National Institutes of Health (NIH) and the USPHS Commissioned Corps (Corps) serendipitously found themselves allied in a mutually beneficial relationship in the establishment of an Ebola clinical research program in West Africa.
This article describes the events that led to the NIH and Corps participation in the Ebola response, the roles filled by the Corps in supporting the NIH, and the lessons observed from that collaboration. Also presented are considerations regarding preparation of a clinical research response to future outbreaks.
NIH Clinical Research first Response
The 2014-2016 Ebola epidemic in West Africa demonstrated the need for federal agencies to reassess their capacity to respond to global threats to protect the health security of the U.S.1 The outbreak also challenged the U.S. government to mobilize unique resources that matched the need of this international (and domestic) response.
In 2014, President Barack Obama announced that the U.S. would launch a government response to the Ebola effort. Although a comprehensive research and development program already was in place to establish Ebola virus disease (EVD) countermeasures, no FDA-approved diagnostics, therapeutics, or preventive vaccines were readily available. Fortunately, FDA regulations regarding emergency use authorizations allowed for the use of several EVD diagnostics during this outbreak.2 However, the development of drugs and vaccines specific to Ebola had yet to make their way to phase 1 safety studies.
Two vaccine products went into phase 1 studies in the U.S. within months of the declaration of the emergency.3,4 Additionally, the NIH had organized a collaborative effort between the U.S. government and academic community to identify a research strategy for the evaluation of therapeutics.5 Regardless of the state of countermeasures and research proposals, the initial need was for disease control measures and care for Ebola patients. The CDC took the lead in working within the international community to establish an incident management system that could help the impacted countries enact mechanisms to bring the epidemic under control.6
As the epidemic progressed, leaders in the Corps and the NIH responded on pathways that eventually would intersect. One of the unfortunate outcomes of the early efforts of improperly protected health care providers was the unintentional transmission of Ebola.7 The Corps identified the need to provide high-level care to the health care worker community as one incentive to motivate health care workers to volunteer for hazardous duty inside Ebola treatment units (ETUs).8,9 Engulfed in the epidemic response, the U.S. government through the National Security Council and secretary of the Department of Health and Human Services (DHHS) evoked its statutory authority to deploy the Corps (42 U.S. Code 204a).
In the first week of October 2014, the Corps sent an advanced echelon team to assess the situation, partner with key host country and international stakeholders, and begin establishment of the U.S. government’s first ever ETU. With logistics, security, and resource support from the DoD and response coordination from the U.S. Agency for International Development, the Corps then deployed the first of four 70-person team rotations to staff the Monrovia Medical Unit (MMU), an ETU specifically dedicated to the treatment of Ebola-infected health care workers. At the time, it was the only ETU specifically dedicated to health care workers in all of Africa. The MMU operated until May 2015 and provided direct patient care for health care workers with Ebola, malaria, and other illnesses.8,10
In August 2014, representatives from the CDC met with Liberia’s Minister of Health and Social Welfare Walter T. Gwenigale, MD, to discuss the range of available options that could facilitate a better understanding of the prevention and treatment of the disease. This meeting resulted in a letter dated August 22, 2014, from Dr. Gwenigale to then DHHS Sylvia Burwell, requesting a research response. Secretary Burwell responded on October 2, 2014, describing the immediate dispatch of the deputy director for clinical research of the National Institute of Allergy and Infectious Diseases (NIAID) to Liberia to engage in initial discussions with the Liberian minister and other key Liberians involved in the response.
Representatives from the CDC and the commander of the Corps’ Ebola response (and acting deputy surgeon general) were included in those initial meetings, which led to a recognized need for a robust clinical research program of the highest ethical and scientific standards consistent with the expressed requirements of Liberia.11 A second and third trip to Liberia with larger U.S. teams resulted in an agreement signed on November 19, 2014 for the scientific investigation of strategies that tested interventions for treatment, control, and prevention of Ebola.12
The agreement led to the establishment of the Partnership for Research on Ebola Virus in Liberia (PREVAIL) to identify research priorities in a collaborative manner between Liberian and American scientists. The first protocol, a vaccine study, was launched in early February 2015.12 This monumental task involved the support of hundreds of Liberians and dozens of NIH staff who volunteered for rotations to Liberia. Of the 108 volunteers from within the NIH, 18 were PHS officers. Shortly after launching the vaccine study, the next priority was initiating the treatment study. This study was delayed primarily due to ZMapp (Mapp Biopharmaceatical, San Diego,CA) production limitations. ZMapp, a monoclonal antibody cocktail, was the first Ebola therapeutic product to be evaluated in a randomized trial.5,13
During the planning for the study, NIAID staff in Liberia met with Corps staff of the MMU to discuss the logistics associated with implementation of the ZMapp protocol at the MMU. During that meeting, the NIAID deputy director for clinical research expressed interest in obtaining Corps support from outside the NIH to sustain the research effort in West Africa. More specifically, additional pharmacy and laboratory staff were needed to augment NIH research operations. At the time, the MMU commander had recently transitioned from service as the acting surgeon general and was in a unique position to recommend additional Corps resources that could help in the research response.
The February 2015 discussion resulted in the establishment of an NIH/PHS research partnership that continues to exist. This new opportunity was not a significant stretch for the PHS as there was great interest from the Corps for responding to the Ebola crisis. The enthusiasm was consistent with the overall ethos of the Corps, which as a service was composed of highly qualified active-duty, deployable, uniformed, public health professionals who respond to public health crises at home and abroad. To date, 19 Corps officers from outside the NIH have deployed in support of the NIH Ebola clinical research program. An additional 18 Corps officers assigned within the NIH also volunteered for duty in West Africa. Of the 37 Corps officers supporting the NIH clinical research program, 7 served on more than 1 rotation.
Program Expansion
The Ebola clinical research program expanded over time from the initial PREVAIL vaccine study to include studies of therapeutic agents, natural history in Ebola survivors, and an additional vaccine study. The PHS officers have been integral in conducting these studies. The initial study implemented in Liberia, known as PREVAIL I, involved the evaluation of 2 vaccine strategies vs placebo.12,14 In addition to the NIH-based Corps officers supporting the study, the Readiness and Deployment Operations Group (RedDOG) initiated deployments for an additional 2 pharmacy and 7 laboratory officers to support this study. During the deployment, the pharmacists were asked to extend their reach to Sierra Leone and later to Guinea to help establish PREVAIL II, an evaluation of ZMapp in the treatment of Ebola.13 A total of 9 Corps pharmacists, 2 nurses, and 3 physicians deployed to Sierra Leone or Guinea to assist in the PREVAIL II study.
As the epidemic came to an end in Liberia in May 2015, the need for a long-term assessment of Ebola survivors was recognized, resulting in PREVAIL III.15 Noteworthy in the survivor study was an ophthalmic substudy led by a Corps officer assigned to the National Eye Institute.16,17 The survivor study also identified that the persistence of the Ebola virus was longer than previously known and that sexual transmission via semen from infected males remained a potential mode of transmission.18 To address the lingering viral load, a study of an antiviral drug was initiated in Liberia in the summer of 2016, PREVAIL IV.19
Four Corps pharmacists helped train Liberian pharmacists to establish and sustain this randomized, double-blind, placebo-controlled study. Most recently, Corps pharmacists were deployed to support the initiation of the Partnership for Research on Ebola Vaccines (PREVAC), a collaborative partnership with researchers from Liberia, Guinea, and Sierra Leone with cosponsors from the NIH, Institut national de la santé et de la recherche médicale (Inserm) in France, and the London School of Hygiene and Tropical Medicine in the United Kingdom.20
Deployment Procedures

Within a week of the February 2015 initial meeting in Liberia to establish the NIH/PHS collaboration, the NIH deployment team met by phone with the Corps’ RedDOG to discuss initial requirements (eg, number of officers needed, disciplines, time lines, and documentation needed for deployment). These initial discussions resulted in the establishment of more formal processes that evolved over time as the 2 organizations gained experience. Based on the identification of the numbers and types of officers needed, RedDOG used procedures similar to the process for staffing the MMU. A communication went out to the Corps seeking interested officers.
Deployment slots were filled based on the personal availability of the officer and coordination with their immediate supervisor and agency. Officers needed to meet medical clearance requirements and provide current health care provider licensure information. Additional training requirements needed to be completed (eg, U.S. State Department training and good clinical practice [GCP] if not already current). Corps officers also took part in the NIH orientation program for deploying personnel to familiarize them to the situation on the ground in West Africa and the specific clinical research protocols that they would encounter. Given that most of the Corps officers were coming from outside the NIH, the onboarding activities required significant attention to detail as procedures for arranging travel (eg, passport, visa, and airline reservations) and processes for reimbursement of travel/per diem pay differed from more traditional deployments directed through the Corps headquarters.
Commissioned Corps Roles in the Research Response
Whereas the establishment of the research program in Liberia was based primarily on relationships forged over a 2-month period by the NIAID deputy director for clinical research and staff, the extension of the research program into Sierra Leone (March 2015) and Guinea (June 2015) was on a substantially shorter time line. As a result, Corps officers were thrust into roles that immediately employed their leadership and diplomacy skills.
In Sierra Leone and Guinea, the NIAID deputy director for clinical research established initial relationships within the countries. However, Corps officers found themselves in regular interactions with regulators in the Ministry of Health to ensure that applications were complete and import permits for incoming shipments were cleared. Additionally, the research collaboration in Sierra Leone was coordinated through an investigator assigned to a military hospital converted into an ETU. The Corps officers were well suited to maintain and build on that relationship in expanding the protocol to other ETUs throughout Sierra Leone. A site established by the CDC within the Sierra Leone Ministry of Health coordinated ZMapp storage. The Corps officers formed working relationships with the CDC team to establish and improve cold-chain logistics and transportation of the ZMapp to the various ETUs around the country. Corps officers were integral in working with the in-country contract hiring agency. Activities included establishing criteria for clinical research positions, providing input on the interview of respective candidates, and training staff as the team formed. In Sierra Leone, local staff members were hired to work at specific facilities as research coordinators working with the health care delivery teams.
The U.S. team consisted of a physician, nurse research coordinator, and a pharmacist travelling to the sites with a logistics/operations staff member remaining in Freetown.
Fortunately, a Corps nurse on the team had been part of the initial MMU deployment and was trained to work in a special care unit at the NIH for patients with highly contagious infections. This practical experience was essential in the establishment of procedures in a hazardous environment for the administration of the IV ZMapp, monitoring of adverse effects (AEs), provision of medications to mitigate infusion-related reactions, and documentation of those AEs.
The U.S. research team regularly departed Freetown early in the morning 7 days a week with the various supplies needed as they visited up to 4 ETU sites to prepare the ZMapp at the site, await information on any AEs, and collect case report forms (Figures 1 and 2). The ETUs were spread out over a 90-mile radius and could be described as austere platforms for health care delivery.


An additional challenge was dealing with the multinational organizations that staffed the various ETUs. Relief organizations from Italy, the United Kingdom, China, as well as the Sierra Leone military provided the staffing for the 4 ETUs. Regardless of who operated the ETU, the concept of randomization to ZMapp or standard of care required significant tact and diplomacy in communicating the scientific necessity in order to appropriately answer the research question.
As the summer approached in Sierra Leone, the team worked through challenges in the IV administration of ZMapp as the protein structure of the monoclonal antibody had not previously been subjected to West African environmental extremes. A balance between speed of administration to prevent protein aggregation in the heat as opposed to the risk of infusion reactions from a foreign protein required the team to communicate frequently with, the manufacturer of ZMapp, to establish realistic infusion rate tables. Additionally, as the various deployment teams rotated in and out, procedures for establishing continuity of research operations were enacted and improved on with each rotation. Good documentation practices to adequately collect all required study information (eg, recording AEs, deviations, and signatures on various forms) proved critical to continuity of research operations.
In Guinea, not only was there the new wrinkle of working within a country where the primary language was French, but also a French cosponsor, Inserm. The NIAID clinical director capitalized on the research infrastructure established for a recently completed Inserm study of favipiravir in the treatment of Ebola to extend the ZMapp study to Guinea. Fortunately, many of the Inserm staff were bilingual and readily responded to the NIH training on the requirements of the ZMapp protocol. However, procedures for cold-chain storage and transportation needed to be established. In Guinea, the PHS officers were key in establishing access and temperature monitoring procedures for a secure room inside the U.S. embassy. The issues associated with cold-chain procedures in the infrastructure-limited environments of West Africa are substantial and warrant consideration of a stand-alone paper. Corps officers also took part in weekly country-focused team meetings with embassy staff to describe progress with the ZMapp study.
As the epidemic waned and NIH transitioned to the survivor and viral persistence studies, the operational tempo changed to allow Corps officers to take part in more definitive capacity building efforts. An initial PHS volunteer from the FDA accepted a position within NIAID as a clinical research oversight manager for pharmacy operations. This individual deployed on numerous occasions to the 3 affected West African countries to further establish cold-chain processes for pharmaceuticals and biologics. He also worked with a multidisciplinary team to renovate a clinical research facility in a rural setting in Guinea. In Liberia, he coordinated an effort with other Corps officers to provide educational seminars on clinical research principles and drug-specific topics with the University of Liberia School of Pharmacy.
Challenges
In each instance, the partnership experience was not without a few problems. The match of skills between the officers who wanted to help and those needed for the research program did not always coincide. While the Corps has more than 1,200 pharmacy officers on active duty, only a fraction of those have experience conducting FDA-regulated clinical research.
Communication problems and time pressures were also constant companions to both the Corps and the NIH. The Corps was going through the largest international deployment in its history to staff multiple missions (including the primary MMU mission in Liberia). The addition of the NIH partnership, while consistent with the MMU staffing mission, provided even more work for a very limited resource. Communicating to the many Corps officers who wanted to volunteer and keeping deployment time lines on track were a challenge. Complicating the matter was the addition of stray e-mails from well-intentioned NIH and Corps staff who communicated directly with colleagues to encourage participation, not fully understanding the policies and protocol governing the deployment process.
Time was always an issue as the rotation schedules were relatively short and the number of activities to make an officer deployment ready were numerous. Obtaining official passports and visas was a challenge as that activity required coordination with the U.S. Department of State. Airline schedules changed with little or no notice, complicating deployments and returns. As the NIH added additional research studies for which support was required, time lines for studies to start became difficult to predict with certainty due to factors outside the control of the NIH. Recently, additional security training requirements for government workers traveling abroad were instituted, further complicating the process of deploying an officer.
The Corps officers taking part in this research response (which was not consistent with customary deployments from Corps headquarters) necessarily were volunteers from full-time assignments within DHHS, and as such, required the permission of their supervisory chain to volunteer. Regardless of this limitation, there was widespread support for these additional and specific research deployments. Although the use of short-term rotations was not ideal, in the end, the rotation plans worked, and the NIH was able to fulfill its research mission with the support of the Corps.
Lessons Learned/Preparing for the Future
Many lessons have been learned and continue to be learned throughout this research response and NIH/Corps partnership. Effective and frequent communication between the organization requesting Corps officers and the Corps headquarters is crucial. In the initial deployments, officers were deployed from the FDA with the assumption that they would be familiar with FDA-regulated clinical research. This was not always the case. The NIH and Corps headquarters later collaborated to develop a survey to send to Corps officers that was used to identify specific skill sets needed by officers who would be deploying to conduct clinical research. NIH personnel prescreened survey responses to identify and prioritize officers for deployment consideration by the deployment authority. This process resulted in the selection of officers who generally needed less training and guidance.
Effective training in clinical research principles for deployed officers and other staff needs to be developed and made available to all deploying individuals. All clinical research staff are required to have training on GCP, but most GCP training programs focus primarily on the ethical principles of research as outlined by the Declaration of Helsinki, Nuremberg Code, and other documents. Few GCP training programs present adequate information on the hands-on conduct of clinical research, especially research regulated by the FDA and other government bodies and therefore subject to certain strict requirements. Examples of crucial but often overlooked topics are source document retention, good documentation practices, cold-chain principles, and other issues related to the creation and retention of adequate trial records.21
The handoff between returning and deploying officers is crucial. Due to various issues with changing time lines, flights, and administrative processes, it is imperative to plan adequate overlap between returning and deploying officers. Delays in obtaining passports or visas, flight cancellations, and other unforeseen issues may unexpectedly shorten any planned overlap periods. A full workweek is desirable for overlap so that the new officer may experience tasks that occur throughout the week, be introduced to the various team members, and have help if unexpected events occur. A regular staff member should check periodically that proper procedures are being followed, as some information may be missed during each handoff, and consecutive unchecked handoffs could result in large deviations of important procedures. Onboarding and offboarding checklists should be developed and updated regularly to guide the handoff process.
On a larger scale, the respective agencies and other stakeholders involved in planning clinical research for public health emergencies need to be included in regular tabletop training exercises to better understand how to coordinate a response when needed. Additionally, although many of the Corps officers who took part in this deployment served as mentors for others preparing for deployment, establishing a formal roster of experienced officers to support specific roles of this type of response would help serve as a resource center for future deployments. Finally, coordination between any operating division (or agency) and the Corps should be through the established Corps command infrastructure to eliminate miscommunication and complicating deployment processes.22
Conclusion
The increasing connectedness of this world, as demonstrated by the Ebola epidemic, requires that the HHS engage globally to provide international leadership and technical expertise in science, policy, and programs and work in concert with interagency partners.23 The missions of the PHS and NIH intersected in a synergistic manner in the research response to the Ebola epidemic of 2014-2016. The PHS Corps mission includes to “protect, promote, and advance the health and safety of the Nation...through rapid and effective response…and advancement of public health science.”24 The Corps mission directly supported the NIH mission to seek fundamental knowledge about the nature and behavior of living systems and the application of that knowledge to enhance health, lengthen life, and reduce illness and disability.25
The scope and scale of DHHS’s response to the Ebola epidemic was unprecedented. The NIH research program, although successful and an important component, was but a small part in bringing the Ebola crisis to an end. The CDC (including the many Corps officers assigned to that agency) worked successfully with the international community and the host countries to bring the disease under control. The Biological Advanced Research and Development Authority provided expert project management, making vaccines and therapeutics available for research.
The DoD was a partner in the development of countermeasures and phase 1 clinical research programs as well as establishing laboratory facilities in Liberia. The Department of State facilitated the many interactions required for the mobilization of resources into West Africa. The collective efforts of the U.S. government contributed immensely to the protection of U.S. borders and to the successful resolution of the Ebola outbreak of 2014-2016.
1. Bell BP, Damon IK, Jernigan DB, et al. Overview, control strategies, and lessons learned in the CDC response to the 2014-2016 Ebola epidemic. MMWR. 2016;65(suppl 3):4-11.
2. U.S. Food and Drug Administration. Emergency use authorization. https://www.fda.gov/EmergencyPreparedness/Counterterrorism/MedicalCountermeasures/MCMLegalRegulatoryandPolicyFramework/ucm182568.htm#ebola. Updated June 29, 2017. Accessed June 30, 2017.
3. Regules JA, Beigel JH, Paolino KM, et al; for the rVSVΔG-ZEBOV-GP Study Group. A recombinant vesicular stomatitis virus Ebola vaccine. N Engl J Med. 2017;376(4):330-341.
4. Tapia MD, Sow SO, Lyke KE, et al. Use of ChAd3-EBO-Z Ebola virus vaccine in Malian and US adults, and boosting of Malian adults with MVA-BN-Filo: a phase 1, single-blind, randomised trial, a phase 1b, open-label and double-blind, dose-escalation trial, and a nested, randomised, double-blind, placebo-controlled trial. Lancet Infect Dis. 2016;16(1):31-42.
5. Dodd LE, Proschan MA, Neuhaus J, et al. Design of a randomized controlled trial for Ebola virus disease medical countermeasures: PREVAIL II, the Ebola MCM Study. J Infect Dis. 2016;213(12):1906-1913.
6. Brooks JC, Pinto M, Gill A, et al. Incident management systems and building emergency management capacity during the 2014-2016 Ebola epidemic—Liberia, Sierra Leone, and Guinea. MMWR. 2016;65(suppl 3):28-34.
7. Evans DK, Goldstein M, Popova A. Health-care worker mortality and the legacy of the Ebola epidemic. Lancet Glob Health. 2015;3(8):e439-e440.
8. Lushniak BD. The hope multipliers: the U.S. Public Health Service in Monrovia. Public Health Rep. 2015;130(6):562-565.
9. Lushniak BD. Update on the U.S. public health response to the Ebola outbreak. Public Health Rep. 2015;130(2):118-120.
10. Brown-Stephenson J. United States Public Health Service nurses: deployment in global crisis. Online J Issues Nurs. 2017;22(1):6.
11. Lane HC, Marston HD, Fauci AS. Conducting clinical trials in outbreak settings: points to consider. Clin Trials. 2016;13(1):92-95.
12. Kennedy SB, Neaton JD, Lane HC, et al. Implementation of an Ebola virus disease vaccine clinical trial during the Ebola epidemic in Liberia: design, procedures, and challenges. Clin Trials. 2016;13(1):49-56.
13. Davey RT. PREVAIL II: a randomized controlled trial of ZMappTM in acute Ebola virus infection. Paper presented at: Conference on Retroviruses and Opportunistic Infections; February 22-25, 2016; Boston, Massachusetts.
14. Doe-Anderson J, Baseler B, Driscoll P, et al. Beating the odds: successful establishment of a phase II/III clinical research trial in resource-poor Liberia during the largest-ever Ebola outbreak. Contemp Clin Trials Commun. 2016;4:68-73.
15. U.S. National Institutes of Health Clinical Center. Ebola virus disease survivors: clinical and immunologic follow-up. https://clinicaltrials.gov/ct2/show/NCT02431923. Updated June 30, 2017. Accessed July 5, 2017.
16. Jampol LM, Ferris FL III, Bishop RJ. Ebola and the eye. JAMA Ophthalmol. 2015;133(10):1105-1106.
17. Chertow DS, Nath A, Suffredini AF, et al. Severe meningoencephalitis in a case of Ebola virus disease: a case report. Ann Intern Med. 2016;165(4):301-304.
18. Pettitt J, Higgs ES, Fallah MP, Hensley LE. Assessment and optimization of the GeneXpert diagnostic platform for detection of Ebola virus RNA in seminal fluid. J Infect Dis. 2017;215(4):547-553.
19. U.S. National Institutes of Health Clinical Center. GS-5734 to assess the antiviral activity, longer-term clearance of Ebola virus, and safety in male Ebola survivors with evidence of Ebola virus persistence in semen. https://clinicaltrials.gov/show/NCT02818582. Updated June 30, 2017. Accessed July 5, 2017.
20. U.S. National Institutes of Health Clinical Center. Partnership for Research on Ebola VACcinations (PREVAC). https://clinicaltrials.gov/show/NCT02876328. Updated June 28, 2017. Accessed July 5, 2017.
21. Kirchoff MC, Pierson JF. Considerations for use of investigational drugs in public health emergencies. Ther Innov Regul Sci. 2017;51(2):146-152.
22. U.S. Department of Health and Human Services, Office of the Assistant Secretary for Preparedness and Response. U.S. Department of Health and Human Services Ebola response improvement plan (based on lessons learned from the 2014-2016 Ebola epidemic). https://www.phe.gov/Preparedness/respond ers/ebola/Documents/EbolaIP.pdf. Published June 2016. Accessed July 5, 2017.
23. U.S. Department of Health and Human Services, Office of Global Affairs. The Global Strategy of the U.S. Department of Health and Human Services. https://www.hhs.gov/sites/default/files/hhs-global -strategy.pdf. Accessed June 28, 2017.
24. U.S. Department of Health and Human Services. Mission and core values. Commissioned Corps of the U.S. Public Health Service website. https://www .usphs.gov/aboutus/mission.aspx. Updated February 3, 2014. Accessed June 28, 2017.
25. U.S. Department of Health and Human Services. Mission and Goals. National Institutes of Health website. https://www.nih.gov/about-nih/what-we -do/mission-goals. Accessed June 28, 2017.
The Ebola epidemic of 2014-2016 challenged many federal agencies to find creative ways to help address the vexing problems created by the spread of the disease.
The response from the U.S. and the global community took many forms: Not only was there a need for the typical medical care support, but also for basic public health systems to track the spread of disease, provide clean water, and dispose of infectious waste. Because no known preventive vaccines or therapeutics existed for those infected, the recognition of a research component to the response became abundantly clear as the epidemic continued. As a result, the National Institutes of Health (NIH) and the USPHS Commissioned Corps (Corps) serendipitously found themselves allied in a mutually beneficial relationship in the establishment of an Ebola clinical research program in West Africa.
This article describes the events that led to the NIH and Corps participation in the Ebola response, the roles filled by the Corps in supporting the NIH, and the lessons observed from that collaboration. Also presented are considerations regarding preparation of a clinical research response to future outbreaks.
NIH Clinical Research first Response
The 2014-2016 Ebola epidemic in West Africa demonstrated the need for federal agencies to reassess their capacity to respond to global threats to protect the health security of the U.S.1 The outbreak also challenged the U.S. government to mobilize unique resources that matched the need of this international (and domestic) response.
In 2014, President Barack Obama announced that the U.S. would launch a government response to the Ebola effort. Although a comprehensive research and development program already was in place to establish Ebola virus disease (EVD) countermeasures, no FDA-approved diagnostics, therapeutics, or preventive vaccines were readily available. Fortunately, FDA regulations regarding emergency use authorizations allowed for the use of several EVD diagnostics during this outbreak.2 However, the development of drugs and vaccines specific to Ebola had yet to make their way to phase 1 safety studies.
Two vaccine products went into phase 1 studies in the U.S. within months of the declaration of the emergency.3,4 Additionally, the NIH had organized a collaborative effort between the U.S. government and academic community to identify a research strategy for the evaluation of therapeutics.5 Regardless of the state of countermeasures and research proposals, the initial need was for disease control measures and care for Ebola patients. The CDC took the lead in working within the international community to establish an incident management system that could help the impacted countries enact mechanisms to bring the epidemic under control.6
As the epidemic progressed, leaders in the Corps and the NIH responded on pathways that eventually would intersect. One of the unfortunate outcomes of the early efforts of improperly protected health care providers was the unintentional transmission of Ebola.7 The Corps identified the need to provide high-level care to the health care worker community as one incentive to motivate health care workers to volunteer for hazardous duty inside Ebola treatment units (ETUs).8,9 Engulfed in the epidemic response, the U.S. government through the National Security Council and secretary of the Department of Health and Human Services (DHHS) evoked its statutory authority to deploy the Corps (42 U.S. Code 204a).
In the first week of October 2014, the Corps sent an advanced echelon team to assess the situation, partner with key host country and international stakeholders, and begin establishment of the U.S. government’s first ever ETU. With logistics, security, and resource support from the DoD and response coordination from the U.S. Agency for International Development, the Corps then deployed the first of four 70-person team rotations to staff the Monrovia Medical Unit (MMU), an ETU specifically dedicated to the treatment of Ebola-infected health care workers. At the time, it was the only ETU specifically dedicated to health care workers in all of Africa. The MMU operated until May 2015 and provided direct patient care for health care workers with Ebola, malaria, and other illnesses.8,10
In August 2014, representatives from the CDC met with Liberia’s Minister of Health and Social Welfare Walter T. Gwenigale, MD, to discuss the range of available options that could facilitate a better understanding of the prevention and treatment of the disease. This meeting resulted in a letter dated August 22, 2014, from Dr. Gwenigale to then DHHS Sylvia Burwell, requesting a research response. Secretary Burwell responded on October 2, 2014, describing the immediate dispatch of the deputy director for clinical research of the National Institute of Allergy and Infectious Diseases (NIAID) to Liberia to engage in initial discussions with the Liberian minister and other key Liberians involved in the response.
Representatives from the CDC and the commander of the Corps’ Ebola response (and acting deputy surgeon general) were included in those initial meetings, which led to a recognized need for a robust clinical research program of the highest ethical and scientific standards consistent with the expressed requirements of Liberia.11 A second and third trip to Liberia with larger U.S. teams resulted in an agreement signed on November 19, 2014 for the scientific investigation of strategies that tested interventions for treatment, control, and prevention of Ebola.12
The agreement led to the establishment of the Partnership for Research on Ebola Virus in Liberia (PREVAIL) to identify research priorities in a collaborative manner between Liberian and American scientists. The first protocol, a vaccine study, was launched in early February 2015.12 This monumental task involved the support of hundreds of Liberians and dozens of NIH staff who volunteered for rotations to Liberia. Of the 108 volunteers from within the NIH, 18 were PHS officers. Shortly after launching the vaccine study, the next priority was initiating the treatment study. This study was delayed primarily due to ZMapp (Mapp Biopharmaceatical, San Diego,CA) production limitations. ZMapp, a monoclonal antibody cocktail, was the first Ebola therapeutic product to be evaluated in a randomized trial.5,13
During the planning for the study, NIAID staff in Liberia met with Corps staff of the MMU to discuss the logistics associated with implementation of the ZMapp protocol at the MMU. During that meeting, the NIAID deputy director for clinical research expressed interest in obtaining Corps support from outside the NIH to sustain the research effort in West Africa. More specifically, additional pharmacy and laboratory staff were needed to augment NIH research operations. At the time, the MMU commander had recently transitioned from service as the acting surgeon general and was in a unique position to recommend additional Corps resources that could help in the research response.
The February 2015 discussion resulted in the establishment of an NIH/PHS research partnership that continues to exist. This new opportunity was not a significant stretch for the PHS as there was great interest from the Corps for responding to the Ebola crisis. The enthusiasm was consistent with the overall ethos of the Corps, which as a service was composed of highly qualified active-duty, deployable, uniformed, public health professionals who respond to public health crises at home and abroad. To date, 19 Corps officers from outside the NIH have deployed in support of the NIH Ebola clinical research program. An additional 18 Corps officers assigned within the NIH also volunteered for duty in West Africa. Of the 37 Corps officers supporting the NIH clinical research program, 7 served on more than 1 rotation.
Program Expansion
The Ebola clinical research program expanded over time from the initial PREVAIL vaccine study to include studies of therapeutic agents, natural history in Ebola survivors, and an additional vaccine study. The PHS officers have been integral in conducting these studies. The initial study implemented in Liberia, known as PREVAIL I, involved the evaluation of 2 vaccine strategies vs placebo.12,14 In addition to the NIH-based Corps officers supporting the study, the Readiness and Deployment Operations Group (RedDOG) initiated deployments for an additional 2 pharmacy and 7 laboratory officers to support this study. During the deployment, the pharmacists were asked to extend their reach to Sierra Leone and later to Guinea to help establish PREVAIL II, an evaluation of ZMapp in the treatment of Ebola.13 A total of 9 Corps pharmacists, 2 nurses, and 3 physicians deployed to Sierra Leone or Guinea to assist in the PREVAIL II study.
As the epidemic came to an end in Liberia in May 2015, the need for a long-term assessment of Ebola survivors was recognized, resulting in PREVAIL III.15 Noteworthy in the survivor study was an ophthalmic substudy led by a Corps officer assigned to the National Eye Institute.16,17 The survivor study also identified that the persistence of the Ebola virus was longer than previously known and that sexual transmission via semen from infected males remained a potential mode of transmission.18 To address the lingering viral load, a study of an antiviral drug was initiated in Liberia in the summer of 2016, PREVAIL IV.19
Four Corps pharmacists helped train Liberian pharmacists to establish and sustain this randomized, double-blind, placebo-controlled study. Most recently, Corps pharmacists were deployed to support the initiation of the Partnership for Research on Ebola Vaccines (PREVAC), a collaborative partnership with researchers from Liberia, Guinea, and Sierra Leone with cosponsors from the NIH, Institut national de la santé et de la recherche médicale (Inserm) in France, and the London School of Hygiene and Tropical Medicine in the United Kingdom.20
Deployment Procedures
Within a week of the February 2015 initial meeting in Liberia to establish the NIH/PHS collaboration, the NIH deployment team met by phone with the Corps’ RedDOG to discuss initial requirements (eg, number of officers needed, disciplines, time lines, and documentation needed for deployment). These initial discussions resulted in the establishment of more formal processes that evolved over time as the 2 organizations gained experience. Based on the identification of the numbers and types of officers needed, RedDOG used procedures similar to the process for staffing the MMU. A communication went out to the Corps seeking interested officers.
Deployment slots were filled based on the personal availability of the officer and coordination with their immediate supervisor and agency. Officers needed to meet medical clearance requirements and provide current health care provider licensure information. Additional training requirements needed to be completed (eg, U.S. State Department training and good clinical practice [GCP] if not already current). Corps officers also took part in the NIH orientation program for deploying personnel to familiarize them to the situation on the ground in West Africa and the specific clinical research protocols that they would encounter. Given that most of the Corps officers were coming from outside the NIH, the onboarding activities required significant attention to detail as procedures for arranging travel (eg, passport, visa, and airline reservations) and processes for reimbursement of travel/per diem pay differed from more traditional deployments directed through the Corps headquarters.
Commissioned Corps Roles in the Research Response
Whereas the establishment of the research program in Liberia was based primarily on relationships forged over a 2-month period by the NIAID deputy director for clinical research and staff, the extension of the research program into Sierra Leone (March 2015) and Guinea (June 2015) was on a substantially shorter time line. As a result, Corps officers were thrust into roles that immediately employed their leadership and diplomacy skills.
In Sierra Leone and Guinea, the NIAID deputy director for clinical research established initial relationships within the countries. However, Corps officers found themselves in regular interactions with regulators in the Ministry of Health to ensure that applications were complete and import permits for incoming shipments were cleared. Additionally, the research collaboration in Sierra Leone was coordinated through an investigator assigned to a military hospital converted into an ETU. The Corps officers were well suited to maintain and build on that relationship in expanding the protocol to other ETUs throughout Sierra Leone. A site established by the CDC within the Sierra Leone Ministry of Health coordinated ZMapp storage. The Corps officers formed working relationships with the CDC team to establish and improve cold-chain logistics and transportation of the ZMapp to the various ETUs around the country. Corps officers were integral in working with the in-country contract hiring agency. Activities included establishing criteria for clinical research positions, providing input on the interview of respective candidates, and training staff as the team formed. In Sierra Leone, local staff members were hired to work at specific facilities as research coordinators working with the health care delivery teams.
The U.S. team consisted of a physician, nurse research coordinator, and a pharmacist travelling to the sites with a logistics/operations staff member remaining in Freetown.
Fortunately, a Corps nurse on the team had been part of the initial MMU deployment and was trained to work in a special care unit at the NIH for patients with highly contagious infections. This practical experience was essential in the establishment of procedures in a hazardous environment for the administration of the IV ZMapp, monitoring of adverse effects (AEs), provision of medications to mitigate infusion-related reactions, and documentation of those AEs.
The U.S. research team regularly departed Freetown early in the morning 7 days a week with the various supplies needed as they visited up to 4 ETU sites to prepare the ZMapp at the site, await information on any AEs, and collect case report forms (Figures 1 and 2). The ETUs were spread out over a 90-mile radius and could be described as austere platforms for health care delivery.
An additional challenge was dealing with the multinational organizations that staffed the various ETUs. Relief organizations from Italy, the United Kingdom, China, as well as the Sierra Leone military provided the staffing for the 4 ETUs. Regardless of who operated the ETU, the concept of randomization to ZMapp or standard of care required significant tact and diplomacy in communicating the scientific necessity in order to appropriately answer the research question.
As the summer approached in Sierra Leone, the team worked through challenges in the IV administration of ZMapp as the protein structure of the monoclonal antibody had not previously been subjected to West African environmental extremes. A balance between speed of administration to prevent protein aggregation in the heat as opposed to the risk of infusion reactions from a foreign protein required the team to communicate frequently with, the manufacturer of ZMapp, to establish realistic infusion rate tables. Additionally, as the various deployment teams rotated in and out, procedures for establishing continuity of research operations were enacted and improved on with each rotation. Good documentation practices to adequately collect all required study information (eg, recording AEs, deviations, and signatures on various forms) proved critical to continuity of research operations.
In Guinea, not only was there the new wrinkle of working within a country where the primary language was French, but also a French cosponsor, Inserm. The NIAID clinical director capitalized on the research infrastructure established for a recently completed Inserm study of favipiravir in the treatment of Ebola to extend the ZMapp study to Guinea. Fortunately, many of the Inserm staff were bilingual and readily responded to the NIH training on the requirements of the ZMapp protocol. However, procedures for cold-chain storage and transportation needed to be established. In Guinea, the PHS officers were key in establishing access and temperature monitoring procedures for a secure room inside the U.S. embassy. The issues associated with cold-chain procedures in the infrastructure-limited environments of West Africa are substantial and warrant consideration of a stand-alone paper. Corps officers also took part in weekly country-focused team meetings with embassy staff to describe progress with the ZMapp study.
As the epidemic waned and NIH transitioned to the survivor and viral persistence studies, the operational tempo changed to allow Corps officers to take part in more definitive capacity building efforts. An initial PHS volunteer from the FDA accepted a position within NIAID as a clinical research oversight manager for pharmacy operations. This individual deployed on numerous occasions to the 3 affected West African countries to further establish cold-chain processes for pharmaceuticals and biologics. He also worked with a multidisciplinary team to renovate a clinical research facility in a rural setting in Guinea. In Liberia, he coordinated an effort with other Corps officers to provide educational seminars on clinical research principles and drug-specific topics with the University of Liberia School of Pharmacy.
Challenges
In each instance, the partnership experience was not without a few problems. The match of skills between the officers who wanted to help and those needed for the research program did not always coincide. While the Corps has more than 1,200 pharmacy officers on active duty, only a fraction of those have experience conducting FDA-regulated clinical research.
Communication problems and time pressures were also constant companions to both the Corps and the NIH. The Corps was going through the largest international deployment in its history to staff multiple missions (including the primary MMU mission in Liberia). The addition of the NIH partnership, while consistent with the MMU staffing mission, provided even more work for a very limited resource. Communicating to the many Corps officers who wanted to volunteer and keeping deployment time lines on track were a challenge. Complicating the matter was the addition of stray e-mails from well-intentioned NIH and Corps staff who communicated directly with colleagues to encourage participation, not fully understanding the policies and protocol governing the deployment process.
Time was always an issue as the rotation schedules were relatively short and the number of activities to make an officer deployment ready were numerous. Obtaining official passports and visas was a challenge as that activity required coordination with the U.S. Department of State. Airline schedules changed with little or no notice, complicating deployments and returns. As the NIH added additional research studies for which support was required, time lines for studies to start became difficult to predict with certainty due to factors outside the control of the NIH. Recently, additional security training requirements for government workers traveling abroad were instituted, further complicating the process of deploying an officer.
The Corps officers taking part in this research response (which was not consistent with customary deployments from Corps headquarters) necessarily were volunteers from full-time assignments within DHHS, and as such, required the permission of their supervisory chain to volunteer. Regardless of this limitation, there was widespread support for these additional and specific research deployments. Although the use of short-term rotations was not ideal, in the end, the rotation plans worked, and the NIH was able to fulfill its research mission with the support of the Corps.
Lessons Learned/Preparing for the Future
Many lessons have been learned and continue to be learned throughout this research response and NIH/Corps partnership. Effective and frequent communication between the organization requesting Corps officers and the Corps headquarters is crucial. In the initial deployments, officers were deployed from the FDA with the assumption that they would be familiar with FDA-regulated clinical research. This was not always the case. The NIH and Corps headquarters later collaborated to develop a survey to send to Corps officers that was used to identify specific skill sets needed by officers who would be deploying to conduct clinical research. NIH personnel prescreened survey responses to identify and prioritize officers for deployment consideration by the deployment authority. This process resulted in the selection of officers who generally needed less training and guidance.
Effective training in clinical research principles for deployed officers and other staff needs to be developed and made available to all deploying individuals. All clinical research staff are required to have training on GCP, but most GCP training programs focus primarily on the ethical principles of research as outlined by the Declaration of Helsinki, Nuremberg Code, and other documents. Few GCP training programs present adequate information on the hands-on conduct of clinical research, especially research regulated by the FDA and other government bodies and therefore subject to certain strict requirements. Examples of crucial but often overlooked topics are source document retention, good documentation practices, cold-chain principles, and other issues related to the creation and retention of adequate trial records.21
The handoff between returning and deploying officers is crucial. Due to various issues with changing time lines, flights, and administrative processes, it is imperative to plan adequate overlap between returning and deploying officers. Delays in obtaining passports or visas, flight cancellations, and other unforeseen issues may unexpectedly shorten any planned overlap periods. A full workweek is desirable for overlap so that the new officer may experience tasks that occur throughout the week, be introduced to the various team members, and have help if unexpected events occur. A regular staff member should check periodically that proper procedures are being followed, as some information may be missed during each handoff, and consecutive unchecked handoffs could result in large deviations of important procedures. Onboarding and offboarding checklists should be developed and updated regularly to guide the handoff process.
On a larger scale, the respective agencies and other stakeholders involved in planning clinical research for public health emergencies need to be included in regular tabletop training exercises to better understand how to coordinate a response when needed. Additionally, although many of the Corps officers who took part in this deployment served as mentors for others preparing for deployment, establishing a formal roster of experienced officers to support specific roles of this type of response would help serve as a resource center for future deployments. Finally, coordination between any operating division (or agency) and the Corps should be through the established Corps command infrastructure to eliminate miscommunication and complicating deployment processes.22
Conclusion
The increasing connectedness of this world, as demonstrated by the Ebola epidemic, requires that the HHS engage globally to provide international leadership and technical expertise in science, policy, and programs and work in concert with interagency partners.23 The missions of the PHS and NIH intersected in a synergistic manner in the research response to the Ebola epidemic of 2014-2016. The PHS Corps mission includes to “protect, promote, and advance the health and safety of the Nation...through rapid and effective response…and advancement of public health science.”24 The Corps mission directly supported the NIH mission to seek fundamental knowledge about the nature and behavior of living systems and the application of that knowledge to enhance health, lengthen life, and reduce illness and disability.25
The scope and scale of DHHS’s response to the Ebola epidemic was unprecedented. The NIH research program, although successful and an important component, was but a small part in bringing the Ebola crisis to an end. The CDC (including the many Corps officers assigned to that agency) worked successfully with the international community and the host countries to bring the disease under control. The Biological Advanced Research and Development Authority provided expert project management, making vaccines and therapeutics available for research.
The DoD was a partner in the development of countermeasures and phase 1 clinical research programs as well as establishing laboratory facilities in Liberia. The Department of State facilitated the many interactions required for the mobilization of resources into West Africa. The collective efforts of the U.S. government contributed immensely to the protection of U.S. borders and to the successful resolution of the Ebola outbreak of 2014-2016.
1. Bell BP, Damon IK, Jernigan DB, et al. Overview, control strategies, and lessons learned in the CDC response to the 2014-2016 Ebola epidemic. MMWR. 2016;65(suppl 3):4-11.
2. U.S. Food and Drug Administration. Emergency use authorization. https://www.fda.gov/EmergencyPreparedness/Counterterrorism/MedicalCountermeasures/MCMLegalRegulatoryandPolicyFramework/ucm182568.htm#ebola. Updated June 29, 2017. Accessed June 30, 2017.
3. Regules JA, Beigel JH, Paolino KM, et al; for the rVSVΔG-ZEBOV-GP Study Group. A recombinant vesicular stomatitis virus Ebola vaccine. N Engl J Med. 2017;376(4):330-341.
4. Tapia MD, Sow SO, Lyke KE, et al. Use of ChAd3-EBO-Z Ebola virus vaccine in Malian and US adults, and boosting of Malian adults with MVA-BN-Filo: a phase 1, single-blind, randomised trial, a phase 1b, open-label and double-blind, dose-escalation trial, and a nested, randomised, double-blind, placebo-controlled trial. Lancet Infect Dis. 2016;16(1):31-42.
5. Dodd LE, Proschan MA, Neuhaus J, et al. Design of a randomized controlled trial for Ebola virus disease medical countermeasures: PREVAIL II, the Ebola MCM Study. J Infect Dis. 2016;213(12):1906-1913.
6. Brooks JC, Pinto M, Gill A, et al. Incident management systems and building emergency management capacity during the 2014-2016 Ebola epidemic—Liberia, Sierra Leone, and Guinea. MMWR. 2016;65(suppl 3):28-34.
7. Evans DK, Goldstein M, Popova A. Health-care worker mortality and the legacy of the Ebola epidemic. Lancet Glob Health. 2015;3(8):e439-e440.
8. Lushniak BD. The hope multipliers: the U.S. Public Health Service in Monrovia. Public Health Rep. 2015;130(6):562-565.
9. Lushniak BD. Update on the U.S. public health response to the Ebola outbreak. Public Health Rep. 2015;130(2):118-120.
10. Brown-Stephenson J. United States Public Health Service nurses: deployment in global crisis. Online J Issues Nurs. 2017;22(1):6.
11. Lane HC, Marston HD, Fauci AS. Conducting clinical trials in outbreak settings: points to consider. Clin Trials. 2016;13(1):92-95.
12. Kennedy SB, Neaton JD, Lane HC, et al. Implementation of an Ebola virus disease vaccine clinical trial during the Ebola epidemic in Liberia: design, procedures, and challenges. Clin Trials. 2016;13(1):49-56.
13. Davey RT. PREVAIL II: a randomized controlled trial of ZMappTM in acute Ebola virus infection. Paper presented at: Conference on Retroviruses and Opportunistic Infections; February 22-25, 2016; Boston, Massachusetts.
14. Doe-Anderson J, Baseler B, Driscoll P, et al. Beating the odds: successful establishment of a phase II/III clinical research trial in resource-poor Liberia during the largest-ever Ebola outbreak. Contemp Clin Trials Commun. 2016;4:68-73.
15. U.S. National Institutes of Health Clinical Center. Ebola virus disease survivors: clinical and immunologic follow-up. https://clinicaltrials.gov/ct2/show/NCT02431923. Updated June 30, 2017. Accessed July 5, 2017.
16. Jampol LM, Ferris FL III, Bishop RJ. Ebola and the eye. JAMA Ophthalmol. 2015;133(10):1105-1106.
17. Chertow DS, Nath A, Suffredini AF, et al. Severe meningoencephalitis in a case of Ebola virus disease: a case report. Ann Intern Med. 2016;165(4):301-304.
18. Pettitt J, Higgs ES, Fallah MP, Hensley LE. Assessment and optimization of the GeneXpert diagnostic platform for detection of Ebola virus RNA in seminal fluid. J Infect Dis. 2017;215(4):547-553.
19. U.S. National Institutes of Health Clinical Center. GS-5734 to assess the antiviral activity, longer-term clearance of Ebola virus, and safety in male Ebola survivors with evidence of Ebola virus persistence in semen. https://clinicaltrials.gov/show/NCT02818582. Updated June 30, 2017. Accessed July 5, 2017.
20. U.S. National Institutes of Health Clinical Center. Partnership for Research on Ebola VACcinations (PREVAC). https://clinicaltrials.gov/show/NCT02876328. Updated June 28, 2017. Accessed July 5, 2017.
21. Kirchoff MC, Pierson JF. Considerations for use of investigational drugs in public health emergencies. Ther Innov Regul Sci. 2017;51(2):146-152.
22. U.S. Department of Health and Human Services, Office of the Assistant Secretary for Preparedness and Response. U.S. Department of Health and Human Services Ebola response improvement plan (based on lessons learned from the 2014-2016 Ebola epidemic). https://www.phe.gov/Preparedness/respond ers/ebola/Documents/EbolaIP.pdf. Published June 2016. Accessed July 5, 2017.
23. U.S. Department of Health and Human Services, Office of Global Affairs. The Global Strategy of the U.S. Department of Health and Human Services. https://www.hhs.gov/sites/default/files/hhs-global -strategy.pdf. Accessed June 28, 2017.
24. U.S. Department of Health and Human Services. Mission and core values. Commissioned Corps of the U.S. Public Health Service website. https://www .usphs.gov/aboutus/mission.aspx. Updated February 3, 2014. Accessed June 28, 2017.
25. U.S. Department of Health and Human Services. Mission and Goals. National Institutes of Health website. https://www.nih.gov/about-nih/what-we -do/mission-goals. Accessed June 28, 2017.

The Potential Dangers of Treating Chronic Lyme Disease
“Chronic Lyme disease” is sometimes a catchall diagnosis for patients with a wide spectrum of musculoskeletal and neuropsychiatric symptoms, fatigue, and generalized pain. That, in turn, has led to a variety of treatments: courses of antibiotics lasting for months to years, IV infusions of hydrogen peroxide, immunoglobulin therapy, even stem cell transplants. Those treatments, though, may not lead to substantial long-term improvement—in fact, they can be harmful.
Clinicians, health departments, and patients have contacted the CDC reporting life-threatening complications resulting from treatment for chronic Lyme disease, including metastatic bacterial infections, septic shock, Clostridium difficile (C diff) colitis, and abscess. An article in Morbidity and Mortality Weekly Report (MMWR) described 5 cases that “highlight the severity and scope” of adverse effects caused by the use of unproven treatments for chronic Lyme disease.
One patient with fatigue and joint pain, was diagnosed with chronic Lyme disease, babesiosis, and Bartonella infection. When the symptoms worsened despite multiple courses of oral antibiotics, the patient was switched to IV ceftriaxone and cefotaxime. However, the pain did not lessen; the patient became hypotensive and tachycardic and was placed in intensive care. Her condition continued to worsen, and she died. The patient’s death was attributed to septic shock related to central venous catheter–associated bacteremia.
In another case, a woman was first diagnosed with amyotrophic lateral sclerosis, then as a second opinion, with chronic Lyme disease. After 7 months of intensive antimicrobial treatment, the pain improved but she got weaker. She also developed intractable C diff infection that required prolonged treatment. However, the patient died of complications of amyotrophic lateral sclerosis—an example, the researchers say, of a missed opportunity for appropriate treatment due to misdiagnosis.
Antibiotics and immunoglobulin therapies are effective and necessary treatments for many conditions, MMWR emphasized—“however, unnecessary antibiotic and immunoglobulin use provides no benefit to patients while putting them at risk for adverse events.”
Delirium in hospitalized patients: Risks and benefits of antipsychotics
Delirium is common in hospitalized patients and contributes to healthcare costs and poor patient outcomes, including death. Its diagnosis and management remain clinically challenging. Although consensus panel guidelines recommend antipsychotic medications to treat delirium when conservative measures fail, few head-to-head trials have been done to tell us which antipsychotic drug to select, and antipsychotic use poses risks in the elderly.
Here, we review the risks and benefits of using antipsychotic drugs to manage delirium and describe an approach to selecting and using 5 commonly used antipsychotics.
SCOPE OF THE PROBLEM
Delirium is common and serious, affecting 11% to 42% of patients hospitalized on general medical wards.1 The burden to the public and individual patient is extremely high. Delirium has been found to result in an additional $16,303 to $64,421 per delirious patient per year, with a subsequent total 1-year health-attributable cost between $38 billion and $152 billion in the United States.2 Furthermore, many patients who become delirious in the hospital lose their independence and are placed in long-term care facilities.3
Although delirium was originally thought to be a time-limited neurocognitive disorder, recent evidence shows that it persists much longer4 and that some patients never return to their previous level of function, suggesting that a single episode of delirium can significantly alter the course of an underlying dementia with the dramatic initiation of cognitive decline.3 Most alarmingly, delirium is associated with an increased rate of death.1
DSM-5 DEFINITION
According to the Diagnostic and Statistical Manual of Mental Disorders, 5th edition (DSM-5),5 delirium is a neurocognitive disorder characterized by the acute onset of disturbance in attention, awareness, and cognition that fluctuates in severity throughout the day and is the direct physiologic consequence of another medical condition. The cognitive impairment seen in delirium is typically global and can affect memory, orientation, language, visuospatial ability, and perception. Other prominent features include psychomotor disturbance, sleep-cycle derangement, and emotional lability.
The pathogenesis of delirium is not clearly delineated but may relate to cholinergic deficiency and dopaminergic excess.
THE FIRST STEPS: NONPHARMACOLOGIC MANAGEMENT
Inouye3 outlined a general 3-part approach to managing delirium:
Identify and address predisposing factors. All patients found to have an acute change in mental status should be evaluated for the underlying cause, with special attention to the most common causes, ie, infection, metabolic derangement, and substance intoxication and withdrawal. A thorough medication reconciliation should also be done to identify medications with psychoactive or anticholinergic effects.
Provide supportive care, eg, addressing volume and nutritional status, mobilizing the patient early, and giving prophylaxis against deep venous thrombosis.
Manage symptoms. Behavioral strategies should be instituted in every delirious patient and should include frequent reorientation, use of observers, encouragement of family involvement, avoidance of physical restraints and Foley catheters, use of vision and hearing aids, and normalizing the sleep-wake cycle.
ANTIPSYCHOTICS: ARE THEY SAFE AND EFFECTIVE?
The US Food and Drug Administration (FDA) has not approved any medications for delirium. However, multiple consensus statements, including those by the American Psychiatric Association,6 the Canadian Coalition for Seniors’ Mental Health,7 and the UK National Institute for Health and Care Excellence,8 advocate for psychopharmacologic management of delirium symptoms in the following situations:
- The patient is in significant distress from his or her symptoms
- The patient poses a safety risk to self or others
- The patient is impeding essential aspects of his or her medical care.
Guidelines from these organizations recommend antipsychotic medications as the first-line drugs for managing delirium symptoms not caused by substance withdrawal. Nevertheless, the use of antipsychotics in the management of delirium remains controversial. While a number of studies suggest these drugs are beneficial,9–11 others do not.12 These consensus panels advocate for the judicious use of antipsychotics, limited to the specific situations outlined above.
The use of antipsychotics in elderly and medically complex patients poses risks. One of the most significant safety concerns is increased risk of death due to adverse cardiac events caused by prolongation of the QT interval.
Antipsychotics, QT prolongation, and torsades de pointes
Most antipsychotics have the potential to prolong the time of ventricular depolarization and repolarization and the QT interval to some extent, which can lead to torsades de pointes.13 Other risk factors for prolonged QT interval and torsades de pointes include:
- Long QT syndrome (a genetic arrhythmia)
- Female sex
- Old age
- Electrolyte abnormalities (hypokalemia, hypocalcemia, hypomagnesemia)
- Preexisting heart conditions such as bradycardia, left ventricular dysfunction, heart failure, mitral valve prolapse, and previous myocardial infarction
- Medical conditions that cause electrolyte derangements
- Medications, including antiarrhythmics, antibiotics (macrolides, quinolones), antifungals, antimalarials, antiemetics, some opioids (methadone), and most antipsychotics.
Haloperidol. Postmarketing analysis in 2007 found 73 cases of haloperidol-related torsades de pointes. However, many of these were confounded by other QT-prolonging medications and medical conditions.14
The QT-prolonging effect of haloperidol administered orally or intramuscularly is actually quite small. The equivalent oral dose of 15 mg of haloperidol (assuming 50% bioavailability) given orally or intramuscularly increases the corrected QT interval (QTc) by only 7 to 8 milliseconds. But intravenous haloperidol can cause much more significant QT prolongation: 8 of the 11 reported cases of fatal torsades de pointes occurred when haloperidol was given intravenously.14 Therefore, the FDA recommends cardiac monitoring for all patients receiving intravenous haloperidol.
Oral olanzapine, risperidone, and quetiapine prolong the QT interval approximately as much as oral haloperidol.
Aripiprazole has not been associated with significant QT prolongation.13
Atypical antipsychotics and stroke
The FDA has issued multiple warnings for prescribing antipsychotic medications in the elderly. In 2003, it warned prescribers of increased cerebrovascular adverse events, including stroke, in elderly patients with dementia who were treated with an atypical antipsychotic (risperidone, olanzapine, or aripiprazole) vs placebo.15
Atypical antipsychotics and risk of death
In 2005, the FDA issued a black-box warning about increased all-cause mortality risk in patients with dementia treated with atypical antipsychotics for behavioral disturbance (relative risk 1.6–1.7).16
This warning was likely based on a meta-analysis by Schneider et al17 of trials in which patients with dementia were randomized to receive either an atypical antipsychotic or placebo. The death rate was 3.5% in patients treated with an atypical antipsychotic vs 2.3% in patients treated with placebo, indicating a number needed to harm of 100. The most common causes of death were cardiovascular disease and pneumonia. However, the trials in this meta-analysis included only patients who were prescribed atypical antipsychotics for ongoing management of behavioral disturbances due to dementia in either the outpatient or nursing home setting. None of the trials looked at patients who were prescribed atypical antipsychotics for a limited time in a closely monitored inpatient setting.
Effectiveness of antipsychotics
While several studies since the FDA black-box warning have shown that antipsychotics are safe, the efficacy of these drugs in delirium management remains controversial.
In a 2016 meta-analysis, Kishi et al18 found that antipsychotics were superior to placebo in terms of response rate (defined as improvement of delirium severity rating scores), with a number needed to treat of 2.
In contrast, a meta-analysis by Neufeld et al12 found that antipsychotic use was not associated with a change in delirium duration, severity, or length of stay in the hospital or intensive care unit. However, the studies in this meta-analysis varied widely in age range, study design, drug comparison, and treatment strategy (with drugs given as both prophylaxis and treatment). Thus, the results are difficult to interpret.
Kishi et al18 found no difference in the incidence of death, extrapyramidal symptoms, akathisia, or QT prolongation between patients treated with antipsychotic drugs vs placebo.
In a prospective observational study, Hatta et al19 followed 2,453 inpatients who became delirious. Only 22 (0.9%) experienced adverse events attributable to antipsychotic use, the most common being aspiration pneumonia (0.7%), followed by cardiovascular events (0.2%). Notably, no patient died of antipsychotic-related events. In this study, the antipsychotic was stopped as soon as the delirium symptoms resolved, in most cases in 3 to 7 days.
Taken together, these studies indicate that despite the risk of QT prolongation with antipsychotic use and increased rates of morbidity with antipsychotic use in dementia, time-limited management of delirium with antipsychotics is effective9–11 and safe.
SELECTING AND USING ANTIPSYCHOTICS TO TREAT DELIRIUM
Identifying a single preferred agent is difficult, since we lack enough evidence from randomized controlled trials that directly compared the various antipsychotics used in delirium management.
Both typical and atypical antipsychotics are used in clinical practice to manage delirium. The typical antipsychotic most often used is haloperidol, while the most commonly used atypical antipsychotics for delirium include olanzapine, quetiapine, risperidone, and (more recently) aripiprazole.
The American Psychiatric Association guidelines6 suggest using haloperidol because it is the antipsychotic that has been most studied for delirium,20 and we have decades of experience with its use. Despite this, recent prospective studies have suggested that the atypical antipsychotics may be better because they have a faster onset of action and lower incidence of extrapyramidal symptoms.18,21
Because we lack enough head-to-head trials comparing the efficacy of the 5 most commonly used antipsychotics for the management of delirium, and because the prospective trials that do exist show equal efficacy across the antipsychotics studied,22 we suggest considering the unique pharmacologic properties of each drug within the patient’s clinical context when selecting which antipsychotic to use.

Table 123–25 summarizes some key characteristics of the 5 most commonly used antipsychotics.
Haloperidol
Haloperidol, a typical antipsychotic, is a potent antagonist of the dopamine D2 receptor.
Haloperidol has the advantage of having the strongest evidence base for use in delirium. In addition, it is available in oral, intravenous, and intramuscular dosage forms, and it has minimal effects on vital signs, negligible anticholinergic activity, and minimal interactions with other medications.21
Intravenous haloperidol poses a significant risk of QT prolongation and so should be used judiciously in patients with preexisting cardiac conditions or other risk factors for QT prolongation as outlined above, and with careful cardiac monitoring. Parenteral haloperidol is approximately twice as potent as oral haloperidol.
Some evidence suggests a higher risk of acute dystonia and other extrapyramidal symptoms with haloperidol than with the atypical antipsychotics.21,26 In contrast, a 2013 prospective study showed that low doses of haloperidol (< 3.5 mg/day) did not result in a greater frequency of extrapyramidal symptoms.22 Nevertheless, if a patient has a history of extrapyramidal symptoms, haloperidol should likely be avoided in favor of an atypical antipsychotic.
Atypical antipsychotics
Olanzapine, quetiapine, and risperidone are atypical antipsychotics that, like haloperidol, antagonize the dopamine D2 receptor, but also have antagonist action at serotonin, histamine, and alpha-2 receptors. This multireceptor antagonism reduces the risk of extrapyramidal symptoms but increases the risk of orthostatic hypotension.
Quetiapine, in particular, imposes an unacceptably high risk of orthostatic hypotension and so is not recommended for use in delirium in the emergency department.27 Additionally, quetiapine is anticholinergic, raising concerns about constipation and urinary retention.
Although the association between fall risk and antipsychotic use remains controversial,28,29 a study found that olanzapine conferred a lower fall risk than quetiapine and risperidone.30
Of these drugs, only olanzapine is available in an intramuscular dosage form. Both risperidone and olanzapine are available in dissolvable tablets; however, they are not sublingually absorbed.
Randomized controlled trials have shown that olanzapine is effective in managing cancer-related nausea, and therefore it may be useful in managing delirium in oncology patients.31,32
Patients with Parkinson disease are exquisitely sensitive to the antidopaminergic effects of antipsychotics but are also vulnerable to delirium, so they present a unique treatment challenge. The agent of choice in patients with Parkinson disease is quetiapine, as multiple trials have shown it has no effect on the motor symptoms of Parkinson disease (reviewed by Desmarais et al in a systematic meta-analysis33).
Aripiprazole is increasingly used to manage delirium. Its mechanism of action differs from that of the other atypical antipsychotics, as it is a partial dopamine agonist. It is available in oral, orally dissolvable, and intramuscular forms. It appears to be slightly less effective than the other atypical antipsychotics,34 but it may be useful for hypoactive delirium as it is less sedating than the other agents.35 Because its effect on the QT interval is negligible, it may also be favored in patients who have a high baseline QTc or other predisposing factors for torsades de pointes.
BALANCING THE RISKS
Antipsychotic drugs have been shown to be effective and generally safe. Antipsychotics do prolong the QT interval. However, other than with intravenous administration of haloperidol, the absolute effect is minimal. Although large meta-analyses have shown a higher rate of all-cause mortality in elderly outpatients with dementia who are prescribed atypical antipsychotics, an increase in death rates has not been borne out by prospective studies focusing on hospitalized patients who receive low doses of antipsychotics for a limited time.
There are no head-to-head randomized controlled trials comparing the efficacy of all of the 5 most commonly used antipsychotics. Therefore, we suggest considering the unique psychopharmacologic properties of each agent within the patient’s clinical setting, specifically taking into account the risk of cardiac arrhythmia, risk of orthostasis and falls, history of extrapyramidal symptoms, other comorbidities such as Parkinson disease and cancer, and the desired route of administration.
At the time the patient is discharged, we recommend a careful medication reconciliation and discontinuation of the antipsychotic drug once delirium has resolved. Studies show that at least 26% of antipsychotics initiated in the hospital are continued after discharge.36,37
Current delirium consensus statements recommend limiting the use of antipsychotics to target patient distress, impediment of care, or safety, because of the putative risks of antipsychotic use in the elderly. However, a growing body of evidence shows that low-dose, time-limited antipsychotic use is safe and effective in the treatment of delirium. In fact, González et al found that delirium is an independent risk factor for death, and each 48-hour increase in delirium is associated with an increased mortality risk of 11%, suggesting that delay in treating delirium may actually increase the risk of death.38
Therefore, we must balance the risks of prescribing antipsychotics in medically vulnerable patients against the increasing burden of evidence supporting the serious risks of morbidity and mortality of delirium, as well as the costs. Much remains to be studied to optimize antipsychotic use in delirium.
- Siddiqi N, House AO, Holmes JD. Occurrence and outcome of delirium in medical in-patients: a systematic literature review. Age Ageing 2006; 35:350–364.
- Leslie DL, Marcantonio ER, Zhang Y, Leo-Summers L, Inouye SK. One-year health care costs associated with delirium in the elderly population. Arch Intern Med 2008; 168:27–32.
- Inouye SK. Delirium in older persons. N Engl J Med 2006; 354:1157–1165.
- Levkoff SE, Evans DA, Liptzin B, et al. Delirium: the occurrence and persistence of symptoms among elderly hospitalized patients. Arch Intern Med 1992; 152:334–340.
- American Psychiatric Association. Diagnostic and statistical manual of mental disorders. 5th ed. Arlington, VA: American Psychiatric Publishing; 2013.
- Trzepacz P, Breitbart W, Franklin J, Levenson J, Martini DR, Wang P; American Psychiatric Association (APA). Practice guideline for the treatment of patients with delirium. http://psychiatryonline.org/pb/assets/raw/sitewide/practice_guidelines/guidelines/delirium.pdf. Accessed July 13, 2017.
- Canadian Coalition for Seniors’ Mental Health. National guidelines for seniors’ mental health: the assessment and treatment of delirium. http://ccsmh.ca/wp-content/uploads/2016/03/NatlGuideline_Delirium.pdf. Accessed July 13, 2017.
- National Institute for Health and Care Excellence (NICE). Delirium: prevention, diagnosis and management. www.nice.org.uk/guidance/cg103. Accessed July 13, 2017.
- Bourne RS, Tahir TA, Borthwick M, Sampson EL. Drug treatment of delirium: past, present and future. J Psychosom Res 2008; 65:273–282.
- Campbell N, Boustani MA, Ayub A, et al. Pharmacological management of delirium in hospitalized adults—a systematic evidence review. J Gen Intern Med 2009; 24:848–853.
- Devlin JW, Skrobik Y. Antipsychotics for the prevention and treatment of delirium in the intensive care unit: what is their role? Harv Rev Psychiatry 2011; 19:59–67.
- Neufeld KJ, Yue J, Robinson TN, Inouye SK, Needham DM. Antipsychotic medication for prevention and treatment of delirium in hospitalized adults: a systematic review and meta-analysis. J Am Geriatr Soc 2016; 64:705–714.
- Beach SR, Celano MC, Noseworthy PA, Januzzi JL, Huffman JC. QTc prolongation, torsades de pointes, and psychotropic medications. Psychosomatics 2013; 54:1–13.
- US Food and Drug Administration (FDA). Information for healthcare professionals: haloperidol (marketed as Haldol, Haldol decanoate and Haldol lactate). www.fda.gov/Drugs/DrugSafety/ucm085203.htm. Accessed July 13, 2017.
- US Food and Drug Administration Center for Drug Evaluation and Research. Approval package for: Application Number: NDA 20-272/S-033, 20-588/S-021 & 21-444/S-004. www.accessdata.fda.gov/drugsatfda_docs/nda/2003/020588_S021_RISPERDAL_TABLETS.pdf. Accessed July 13, 2017.
- US Food and Drug Administration. Public health advisory: deaths with antipsychotics in elderly patients with behavioral disturbances. www.fda.gov/drugs/drugsafety/postmarketdrugsafetyinformationforpatientsandproviders/ucm053171. Accessed July 13, 2017.
- Schneider LS, Dagerman KS, Insel P. Risk of death with atypical antipsychotic drug treatment for dementia: meta-analysis of randomized placebo-controlled trials. JAMA 2005; 294:1934–1943.
- Kishi T, Hirota T, Matsunaga S, Iwata N. Antipsychotic medications for the treatment of delirium: a systematic review and meta-analysis of randomised controlled trials. J Neurol Neurosurg Psychiatry 2016; 87:767–774.
- Hatta K, Kishi Y, Wada K, et al. Antipsychotics for delirium in the general hospital setting in consecutive 2453 inpatients: a prospective observational study. Int J Geriatr Psychiatry 2014; 29;253–262.
- Breitbart W, Marotta R, Platt MM, et al. A double-blind trial of haloperidol, chlorpromazine, and lorazepam in the treatment of delirium in hospitalized AIDS patients. Am J Psychiatry 1996; 153:231–237.
- Wilson MP, Pepper D, Currier GW, Holloman GH Jr, Feifel D. The psychopharmacology of agitation: consensus statement of the American Association For Emergency Psychiatry Project Beta Psychopharmacology Workgroup. West J Emerg Med 2012; 13:26–34.
- Yoon HJ, Park KM, Choi WJ, et al. Efficacy and safety of haloperidol versus atypical antipsychotic medications in the treatment of delirium. BMC Psychiatry 2013; 13:240.
- American Psychiatric Association. Manual of Clinical Psychopharmacology. 8th ed. Arlington, VA: American Psychiatric Publishing; 2015.
- Conley RR, Kelly DL. Pharmacologic Treatment of Schizophrenia. 3rd ed. West Islip, NY: Professional Communications; 2007.
- American Psychiatric Association (APA). The American Psychiatric Publishing Textbook of Psychosomatic Medicine. Psychiatric Care of the Medically Ill, 2nd ed. Arlington, VA: American Psychiatric Publishing; 2011.
- Boettger S, Jenewein J, Breitbart W. Haloperidol, risperidone, olanzapine and aripiprazole in the management of delirium: a comparison of efficacy, safety, and side effects. Palliat Support Care 2015; 13:1079–1085.
- Currier GW, Trenton AJ, Walsh PG, van Wijngaarden E. A pilot, open-label study of quetiapine for treatment of moderate psychotic agitation in the emergency setting. J Psychiatr Pract 2006; 12:223–228.
- Chatterjee S, Chen H, Johnson ML, Aparasu RR. Risk of falls and fractures in older adults using atypical antipsychotic agents: a propensity score-adjusted, retrospective cohort study. Am J Geriatr Pharmacother 2012; 10:84–94.
- Rigler SK, Shireman TI, Cook-Wiens GJ, et al. Fracture risk in nursing home residents initiating antipsychotic medications. J Am Geriatr Soc 2013; 61: 715–722.
- Bozat-Emre S, Doupe M, Kozyrskyj AL, Grymonpre R, Mahmud SM. Atypical antipsychotic drug use and falls among nursing home residents in Winnipeg, Canada. Int J Geriatr Psychiatry 2015; 30:842–850.
- Navari RM, Gray SE, Kerr AC. Olanzapine versus aprepitant for the prevention of chemotherapy-induced nausea and vomiting: a randomized phase III trial. J Support Oncol 2011; 9:188–195.
- Navari RM. Olanzapine for the prevention and treatment of chronic nausea and chemotherapy-induced nausea and vomiting. Eur J Pharmacol 2014; 722:180–186.
- Desmarais P, Massoud F, Filion J, Nguyen QD, Bajsarowicz P. Quetiapine for psychosis in Parkinson disease and neurodegenerative Parkinsonian disorders: a systematic review. J Geriatr Psychiatry Neurol 2016; 29:227–236.
- Citrome L. Comparison of intramuscular ziprasidone, olanzapine, or aripiprazole for agitation: a quantitative review of efficacy and safety. J Clin Psychiatry 2007; 68:1876–1885.
- Marder SR, McQuade RD, Stock E, et al. Aripiprazole in the treatment of schizophrenia: safety and tolerability in short-term, placebo-controlled trials. Schizophr Res 2003; 61:123–136.
- Loh KP, Ramdass S, Garb JL, et al. Long-term outcomes of elders discharged on antipsychotics. J Hosp Med 2016; 11:550–555.
- Herzig SJ, Rothberg MB, Guess JR, et al. Antipsychotic use in hospitalized adults: rates, indications, and predictors. J Am Geriatr Soc 2016; 64:299–305.
- González M, Martínez G, Calderón J, et al. Impact of delirium on short-term mortality in elderly inpatients: a prospective cohort study. Psychosomatics 2009; 50:234–238.
Delirium is common in hospitalized patients and contributes to healthcare costs and poor patient outcomes, including death. Its diagnosis and management remain clinically challenging. Although consensus panel guidelines recommend antipsychotic medications to treat delirium when conservative measures fail, few head-to-head trials have been done to tell us which antipsychotic drug to select, and antipsychotic use poses risks in the elderly.
Here, we review the risks and benefits of using antipsychotic drugs to manage delirium and describe an approach to selecting and using 5 commonly used antipsychotics.
SCOPE OF THE PROBLEM
Delirium is common and serious, affecting 11% to 42% of patients hospitalized on general medical wards.1 The burden to the public and individual patient is extremely high. Delirium has been found to result in an additional $16,303 to $64,421 per delirious patient per year, with a subsequent total 1-year health-attributable cost between $38 billion and $152 billion in the United States.2 Furthermore, many patients who become delirious in the hospital lose their independence and are placed in long-term care facilities.3
Although delirium was originally thought to be a time-limited neurocognitive disorder, recent evidence shows that it persists much longer4 and that some patients never return to their previous level of function, suggesting that a single episode of delirium can significantly alter the course of an underlying dementia with the dramatic initiation of cognitive decline.3 Most alarmingly, delirium is associated with an increased rate of death.1
DSM-5 DEFINITION
According to the Diagnostic and Statistical Manual of Mental Disorders, 5th edition (DSM-5),5 delirium is a neurocognitive disorder characterized by the acute onset of disturbance in attention, awareness, and cognition that fluctuates in severity throughout the day and is the direct physiologic consequence of another medical condition. The cognitive impairment seen in delirium is typically global and can affect memory, orientation, language, visuospatial ability, and perception. Other prominent features include psychomotor disturbance, sleep-cycle derangement, and emotional lability.
The pathogenesis of delirium is not clearly delineated but may relate to cholinergic deficiency and dopaminergic excess.
THE FIRST STEPS: NONPHARMACOLOGIC MANAGEMENT
Inouye3 outlined a general 3-part approach to managing delirium:
Identify and address predisposing factors. All patients found to have an acute change in mental status should be evaluated for the underlying cause, with special attention to the most common causes, ie, infection, metabolic derangement, and substance intoxication and withdrawal. A thorough medication reconciliation should also be done to identify medications with psychoactive or anticholinergic effects.
Provide supportive care, eg, addressing volume and nutritional status, mobilizing the patient early, and giving prophylaxis against deep venous thrombosis.
Manage symptoms. Behavioral strategies should be instituted in every delirious patient and should include frequent reorientation, use of observers, encouragement of family involvement, avoidance of physical restraints and Foley catheters, use of vision and hearing aids, and normalizing the sleep-wake cycle.
ANTIPSYCHOTICS: ARE THEY SAFE AND EFFECTIVE?
The US Food and Drug Administration (FDA) has not approved any medications for delirium. However, multiple consensus statements, including those by the American Psychiatric Association,6 the Canadian Coalition for Seniors’ Mental Health,7 and the UK National Institute for Health and Care Excellence,8 advocate for psychopharmacologic management of delirium symptoms in the following situations:
- The patient is in significant distress from his or her symptoms
- The patient poses a safety risk to self or others
- The patient is impeding essential aspects of his or her medical care.
Guidelines from these organizations recommend antipsychotic medications as the first-line drugs for managing delirium symptoms not caused by substance withdrawal. Nevertheless, the use of antipsychotics in the management of delirium remains controversial. While a number of studies suggest these drugs are beneficial,9–11 others do not.12 These consensus panels advocate for the judicious use of antipsychotics, limited to the specific situations outlined above.
The use of antipsychotics in elderly and medically complex patients poses risks. One of the most significant safety concerns is increased risk of death due to adverse cardiac events caused by prolongation of the QT interval.
Antipsychotics, QT prolongation, and torsades de pointes
Most antipsychotics have the potential to prolong the time of ventricular depolarization and repolarization and the QT interval to some extent, which can lead to torsades de pointes.13 Other risk factors for prolonged QT interval and torsades de pointes include:
- Long QT syndrome (a genetic arrhythmia)
- Female sex
- Old age
- Electrolyte abnormalities (hypokalemia, hypocalcemia, hypomagnesemia)
- Preexisting heart conditions such as bradycardia, left ventricular dysfunction, heart failure, mitral valve prolapse, and previous myocardial infarction
- Medical conditions that cause electrolyte derangements
- Medications, including antiarrhythmics, antibiotics (macrolides, quinolones), antifungals, antimalarials, antiemetics, some opioids (methadone), and most antipsychotics.
Haloperidol. Postmarketing analysis in 2007 found 73 cases of haloperidol-related torsades de pointes. However, many of these were confounded by other QT-prolonging medications and medical conditions.14
The QT-prolonging effect of haloperidol administered orally or intramuscularly is actually quite small. The equivalent oral dose of 15 mg of haloperidol (assuming 50% bioavailability) given orally or intramuscularly increases the corrected QT interval (QTc) by only 7 to 8 milliseconds. But intravenous haloperidol can cause much more significant QT prolongation: 8 of the 11 reported cases of fatal torsades de pointes occurred when haloperidol was given intravenously.14 Therefore, the FDA recommends cardiac monitoring for all patients receiving intravenous haloperidol.
Oral olanzapine, risperidone, and quetiapine prolong the QT interval approximately as much as oral haloperidol.
Aripiprazole has not been associated with significant QT prolongation.13
Atypical antipsychotics and stroke
The FDA has issued multiple warnings for prescribing antipsychotic medications in the elderly. In 2003, it warned prescribers of increased cerebrovascular adverse events, including stroke, in elderly patients with dementia who were treated with an atypical antipsychotic (risperidone, olanzapine, or aripiprazole) vs placebo.15
Atypical antipsychotics and risk of death
In 2005, the FDA issued a black-box warning about increased all-cause mortality risk in patients with dementia treated with atypical antipsychotics for behavioral disturbance (relative risk 1.6–1.7).16
This warning was likely based on a meta-analysis by Schneider et al17 of trials in which patients with dementia were randomized to receive either an atypical antipsychotic or placebo. The death rate was 3.5% in patients treated with an atypical antipsychotic vs 2.3% in patients treated with placebo, indicating a number needed to harm of 100. The most common causes of death were cardiovascular disease and pneumonia. However, the trials in this meta-analysis included only patients who were prescribed atypical antipsychotics for ongoing management of behavioral disturbances due to dementia in either the outpatient or nursing home setting. None of the trials looked at patients who were prescribed atypical antipsychotics for a limited time in a closely monitored inpatient setting.
Effectiveness of antipsychotics
While several studies since the FDA black-box warning have shown that antipsychotics are safe, the efficacy of these drugs in delirium management remains controversial.
In a 2016 meta-analysis, Kishi et al18 found that antipsychotics were superior to placebo in terms of response rate (defined as improvement of delirium severity rating scores), with a number needed to treat of 2.
In contrast, a meta-analysis by Neufeld et al12 found that antipsychotic use was not associated with a change in delirium duration, severity, or length of stay in the hospital or intensive care unit. However, the studies in this meta-analysis varied widely in age range, study design, drug comparison, and treatment strategy (with drugs given as both prophylaxis and treatment). Thus, the results are difficult to interpret.
Kishi et al18 found no difference in the incidence of death, extrapyramidal symptoms, akathisia, or QT prolongation between patients treated with antipsychotic drugs vs placebo.
In a prospective observational study, Hatta et al19 followed 2,453 inpatients who became delirious. Only 22 (0.9%) experienced adverse events attributable to antipsychotic use, the most common being aspiration pneumonia (0.7%), followed by cardiovascular events (0.2%). Notably, no patient died of antipsychotic-related events. In this study, the antipsychotic was stopped as soon as the delirium symptoms resolved, in most cases in 3 to 7 days.
Taken together, these studies indicate that despite the risk of QT prolongation with antipsychotic use and increased rates of morbidity with antipsychotic use in dementia, time-limited management of delirium with antipsychotics is effective9–11 and safe.
SELECTING AND USING ANTIPSYCHOTICS TO TREAT DELIRIUM
Identifying a single preferred agent is difficult, since we lack enough evidence from randomized controlled trials that directly compared the various antipsychotics used in delirium management.
Both typical and atypical antipsychotics are used in clinical practice to manage delirium. The typical antipsychotic most often used is haloperidol, while the most commonly used atypical antipsychotics for delirium include olanzapine, quetiapine, risperidone, and (more recently) aripiprazole.
The American Psychiatric Association guidelines6 suggest using haloperidol because it is the antipsychotic that has been most studied for delirium,20 and we have decades of experience with its use. Despite this, recent prospective studies have suggested that the atypical antipsychotics may be better because they have a faster onset of action and lower incidence of extrapyramidal symptoms.18,21
Because we lack enough head-to-head trials comparing the efficacy of the 5 most commonly used antipsychotics for the management of delirium, and because the prospective trials that do exist show equal efficacy across the antipsychotics studied,22 we suggest considering the unique pharmacologic properties of each drug within the patient’s clinical context when selecting which antipsychotic to use.
Table 123–25 summarizes some key characteristics of the 5 most commonly used antipsychotics.
Haloperidol
Haloperidol, a typical antipsychotic, is a potent antagonist of the dopamine D2 receptor.
Haloperidol has the advantage of having the strongest evidence base for use in delirium. In addition, it is available in oral, intravenous, and intramuscular dosage forms, and it has minimal effects on vital signs, negligible anticholinergic activity, and minimal interactions with other medications.21
Intravenous haloperidol poses a significant risk of QT prolongation and so should be used judiciously in patients with preexisting cardiac conditions or other risk factors for QT prolongation as outlined above, and with careful cardiac monitoring. Parenteral haloperidol is approximately twice as potent as oral haloperidol.
Some evidence suggests a higher risk of acute dystonia and other extrapyramidal symptoms with haloperidol than with the atypical antipsychotics.21,26 In contrast, a 2013 prospective study showed that low doses of haloperidol (< 3.5 mg/day) did not result in a greater frequency of extrapyramidal symptoms.22 Nevertheless, if a patient has a history of extrapyramidal symptoms, haloperidol should likely be avoided in favor of an atypical antipsychotic.
Atypical antipsychotics
Olanzapine, quetiapine, and risperidone are atypical antipsychotics that, like haloperidol, antagonize the dopamine D2 receptor, but also have antagonist action at serotonin, histamine, and alpha-2 receptors. This multireceptor antagonism reduces the risk of extrapyramidal symptoms but increases the risk of orthostatic hypotension.
Quetiapine, in particular, imposes an unacceptably high risk of orthostatic hypotension and so is not recommended for use in delirium in the emergency department.27 Additionally, quetiapine is anticholinergic, raising concerns about constipation and urinary retention.
Although the association between fall risk and antipsychotic use remains controversial,28,29 a study found that olanzapine conferred a lower fall risk than quetiapine and risperidone.30
Of these drugs, only olanzapine is available in an intramuscular dosage form. Both risperidone and olanzapine are available in dissolvable tablets; however, they are not sublingually absorbed.
Randomized controlled trials have shown that olanzapine is effective in managing cancer-related nausea, and therefore it may be useful in managing delirium in oncology patients.31,32
Patients with Parkinson disease are exquisitely sensitive to the antidopaminergic effects of antipsychotics but are also vulnerable to delirium, so they present a unique treatment challenge. The agent of choice in patients with Parkinson disease is quetiapine, as multiple trials have shown it has no effect on the motor symptoms of Parkinson disease (reviewed by Desmarais et al in a systematic meta-analysis33).
Aripiprazole is increasingly used to manage delirium. Its mechanism of action differs from that of the other atypical antipsychotics, as it is a partial dopamine agonist. It is available in oral, orally dissolvable, and intramuscular forms. It appears to be slightly less effective than the other atypical antipsychotics,34 but it may be useful for hypoactive delirium as it is less sedating than the other agents.35 Because its effect on the QT interval is negligible, it may also be favored in patients who have a high baseline QTc or other predisposing factors for torsades de pointes.
BALANCING THE RISKS
Antipsychotic drugs have been shown to be effective and generally safe. Antipsychotics do prolong the QT interval. However, other than with intravenous administration of haloperidol, the absolute effect is minimal. Although large meta-analyses have shown a higher rate of all-cause mortality in elderly outpatients with dementia who are prescribed atypical antipsychotics, an increase in death rates has not been borne out by prospective studies focusing on hospitalized patients who receive low doses of antipsychotics for a limited time.
There are no head-to-head randomized controlled trials comparing the efficacy of all of the 5 most commonly used antipsychotics. Therefore, we suggest considering the unique psychopharmacologic properties of each agent within the patient’s clinical setting, specifically taking into account the risk of cardiac arrhythmia, risk of orthostasis and falls, history of extrapyramidal symptoms, other comorbidities such as Parkinson disease and cancer, and the desired route of administration.
At the time the patient is discharged, we recommend a careful medication reconciliation and discontinuation of the antipsychotic drug once delirium has resolved. Studies show that at least 26% of antipsychotics initiated in the hospital are continued after discharge.36,37
Current delirium consensus statements recommend limiting the use of antipsychotics to target patient distress, impediment of care, or safety, because of the putative risks of antipsychotic use in the elderly. However, a growing body of evidence shows that low-dose, time-limited antipsychotic use is safe and effective in the treatment of delirium. In fact, González et al found that delirium is an independent risk factor for death, and each 48-hour increase in delirium is associated with an increased mortality risk of 11%, suggesting that delay in treating delirium may actually increase the risk of death.38
Therefore, we must balance the risks of prescribing antipsychotics in medically vulnerable patients against the increasing burden of evidence supporting the serious risks of morbidity and mortality of delirium, as well as the costs. Much remains to be studied to optimize antipsychotic use in delirium.
- Siddiqi N, House AO, Holmes JD. Occurrence and outcome of delirium in medical in-patients: a systematic literature review. Age Ageing 2006; 35:350–364.
- Leslie DL, Marcantonio ER, Zhang Y, Leo-Summers L, Inouye SK. One-year health care costs associated with delirium in the elderly population. Arch Intern Med 2008; 168:27–32.
- Inouye SK. Delirium in older persons. N Engl J Med 2006; 354:1157–1165.
- Levkoff SE, Evans DA, Liptzin B, et al. Delirium: the occurrence and persistence of symptoms among elderly hospitalized patients. Arch Intern Med 1992; 152:334–340.
- American Psychiatric Association. Diagnostic and statistical manual of mental disorders. 5th ed. Arlington, VA: American Psychiatric Publishing; 2013.
- Trzepacz P, Breitbart W, Franklin J, Levenson J, Martini DR, Wang P; American Psychiatric Association (APA). Practice guideline for the treatment of patients with delirium. http://psychiatryonline.org/pb/assets/raw/sitewide/practice_guidelines/guidelines/delirium.pdf. Accessed July 13, 2017.
- Canadian Coalition for Seniors’ Mental Health. National guidelines for seniors’ mental health: the assessment and treatment of delirium. http://ccsmh.ca/wp-content/uploads/2016/03/NatlGuideline_Delirium.pdf. Accessed July 13, 2017.
- National Institute for Health and Care Excellence (NICE). Delirium: prevention, diagnosis and management. www.nice.org.uk/guidance/cg103. Accessed July 13, 2017.
- Bourne RS, Tahir TA, Borthwick M, Sampson EL. Drug treatment of delirium: past, present and future. J Psychosom Res 2008; 65:273–282.
- Campbell N, Boustani MA, Ayub A, et al. Pharmacological management of delirium in hospitalized adults—a systematic evidence review. J Gen Intern Med 2009; 24:848–853.
- Devlin JW, Skrobik Y. Antipsychotics for the prevention and treatment of delirium in the intensive care unit: what is their role? Harv Rev Psychiatry 2011; 19:59–67.
- Neufeld KJ, Yue J, Robinson TN, Inouye SK, Needham DM. Antipsychotic medication for prevention and treatment of delirium in hospitalized adults: a systematic review and meta-analysis. J Am Geriatr Soc 2016; 64:705–714.
- Beach SR, Celano MC, Noseworthy PA, Januzzi JL, Huffman JC. QTc prolongation, torsades de pointes, and psychotropic medications. Psychosomatics 2013; 54:1–13.
- US Food and Drug Administration (FDA). Information for healthcare professionals: haloperidol (marketed as Haldol, Haldol decanoate and Haldol lactate). www.fda.gov/Drugs/DrugSafety/ucm085203.htm. Accessed July 13, 2017.
- US Food and Drug Administration Center for Drug Evaluation and Research. Approval package for: Application Number: NDA 20-272/S-033, 20-588/S-021 & 21-444/S-004. www.accessdata.fda.gov/drugsatfda_docs/nda/2003/020588_S021_RISPERDAL_TABLETS.pdf. Accessed July 13, 2017.
- US Food and Drug Administration. Public health advisory: deaths with antipsychotics in elderly patients with behavioral disturbances. www.fda.gov/drugs/drugsafety/postmarketdrugsafetyinformationforpatientsandproviders/ucm053171. Accessed July 13, 2017.
- Schneider LS, Dagerman KS, Insel P. Risk of death with atypical antipsychotic drug treatment for dementia: meta-analysis of randomized placebo-controlled trials. JAMA 2005; 294:1934–1943.
- Kishi T, Hirota T, Matsunaga S, Iwata N. Antipsychotic medications for the treatment of delirium: a systematic review and meta-analysis of randomised controlled trials. J Neurol Neurosurg Psychiatry 2016; 87:767–774.
- Hatta K, Kishi Y, Wada K, et al. Antipsychotics for delirium in the general hospital setting in consecutive 2453 inpatients: a prospective observational study. Int J Geriatr Psychiatry 2014; 29;253–262.
- Breitbart W, Marotta R, Platt MM, et al. A double-blind trial of haloperidol, chlorpromazine, and lorazepam in the treatment of delirium in hospitalized AIDS patients. Am J Psychiatry 1996; 153:231–237.
- Wilson MP, Pepper D, Currier GW, Holloman GH Jr, Feifel D. The psychopharmacology of agitation: consensus statement of the American Association For Emergency Psychiatry Project Beta Psychopharmacology Workgroup. West J Emerg Med 2012; 13:26–34.
- Yoon HJ, Park KM, Choi WJ, et al. Efficacy and safety of haloperidol versus atypical antipsychotic medications in the treatment of delirium. BMC Psychiatry 2013; 13:240.
- American Psychiatric Association. Manual of Clinical Psychopharmacology. 8th ed. Arlington, VA: American Psychiatric Publishing; 2015.
- Conley RR, Kelly DL. Pharmacologic Treatment of Schizophrenia. 3rd ed. West Islip, NY: Professional Communications; 2007.
- American Psychiatric Association (APA). The American Psychiatric Publishing Textbook of Psychosomatic Medicine. Psychiatric Care of the Medically Ill, 2nd ed. Arlington, VA: American Psychiatric Publishing; 2011.
- Boettger S, Jenewein J, Breitbart W. Haloperidol, risperidone, olanzapine and aripiprazole in the management of delirium: a comparison of efficacy, safety, and side effects. Palliat Support Care 2015; 13:1079–1085.
- Currier GW, Trenton AJ, Walsh PG, van Wijngaarden E. A pilot, open-label study of quetiapine for treatment of moderate psychotic agitation in the emergency setting. J Psychiatr Pract 2006; 12:223–228.
- Chatterjee S, Chen H, Johnson ML, Aparasu RR. Risk of falls and fractures in older adults using atypical antipsychotic agents: a propensity score-adjusted, retrospective cohort study. Am J Geriatr Pharmacother 2012; 10:84–94.
- Rigler SK, Shireman TI, Cook-Wiens GJ, et al. Fracture risk in nursing home residents initiating antipsychotic medications. J Am Geriatr Soc 2013; 61: 715–722.
- Bozat-Emre S, Doupe M, Kozyrskyj AL, Grymonpre R, Mahmud SM. Atypical antipsychotic drug use and falls among nursing home residents in Winnipeg, Canada. Int J Geriatr Psychiatry 2015; 30:842–850.
- Navari RM, Gray SE, Kerr AC. Olanzapine versus aprepitant for the prevention of chemotherapy-induced nausea and vomiting: a randomized phase III trial. J Support Oncol 2011; 9:188–195.
- Navari RM. Olanzapine for the prevention and treatment of chronic nausea and chemotherapy-induced nausea and vomiting. Eur J Pharmacol 2014; 722:180–186.
- Desmarais P, Massoud F, Filion J, Nguyen QD, Bajsarowicz P. Quetiapine for psychosis in Parkinson disease and neurodegenerative Parkinsonian disorders: a systematic review. J Geriatr Psychiatry Neurol 2016; 29:227–236.
- Citrome L. Comparison of intramuscular ziprasidone, olanzapine, or aripiprazole for agitation: a quantitative review of efficacy and safety. J Clin Psychiatry 2007; 68:1876–1885.
- Marder SR, McQuade RD, Stock E, et al. Aripiprazole in the treatment of schizophrenia: safety and tolerability in short-term, placebo-controlled trials. Schizophr Res 2003; 61:123–136.
- Loh KP, Ramdass S, Garb JL, et al. Long-term outcomes of elders discharged on antipsychotics. J Hosp Med 2016; 11:550–555.
- Herzig SJ, Rothberg MB, Guess JR, et al. Antipsychotic use in hospitalized adults: rates, indications, and predictors. J Am Geriatr Soc 2016; 64:299–305.
- González M, Martínez G, Calderón J, et al. Impact of delirium on short-term mortality in elderly inpatients: a prospective cohort study. Psychosomatics 2009; 50:234–238.
KEY POINTS
- Delirium is common in hospitalized patients and often leads to loss of independence and nursing-home placement.
- The first-line treatment is to identify and address predisposing factors, provide supportive care, and manage symptoms through behavioral strategies.
- Most antipsychotic medications can prolong the QT interval and thus pose a risk for torsades de pointes. The effect is greatest with intravenous haloperidol and least with aripiprazole.
- Lacking head-to-head trials of antipsychotics, we suggest selecting the drug based on its pharmacologic properties and the patient’s clinical context.

Necrotizing pancreatitis: Diagnose, treat, consult
Acute pancreatitis accounted for more than 300,000 admissions and $2.6 billion in associated healthcare costs in the United States in 2012.1 First-line management is early aggressive fluid resuscitation and analgesics for pain control. Guidelines recommend estimating the clinical severity of each attack using a validated scoring system such as the Bedside Index of Severity in Acute Pancreatitis.2 Clinically severe pancreatitis is associated with necrosis.
Acute pancreatitis results from inappropriate activation of zymogens and subsequent autodigestion of the pancreas by its own enzymes. Though necrotizing pancreatitis is thought to be an ischemic complication, its pathogenesis is not completely understood. Necrosis increases the morbidity and mortality risk of acute pancreatitis because of its association with organ failure and infectious complications. As such, patients with necrotizing pancreatitis may need admission to the intensive care unit, nutritional support, antibiotics, and radiologic, endoscopic, or surgical interventions.
Here, we review current evidence regarding the diagnosis and management of necrotizing pancreatitis.
PROPER TERMINOLOGY HELPS COLLABORATION
Managing necrotizing pancreatitis requires the combined efforts of internists, gastroenterologists, radiologists, and surgeons. This collaboration is aided by proper terminology.
A classification system was devised in Atlanta, GA, in 1992 to facilitate communication and interdisciplinary collaboration.3 Severe pancreatitis was differentiated from mild by the presence of organ failure or the complications of pseudocyst, necrosis, or abscess.
The original Atlanta classification had several limitations. First, the terminology for fluid collections was ambiguous and frequently misused. Second, the assessment of clinical severity required either the Ranson score or the Acute Physiology and Chronic Health Evaluation II score, both of which are complex and have other limitations. Finally, advances in imaging and treatment have rendered the original Atlanta nomenclature obsolete.
In 2012, the Acute Pancreatitis Classification Working Group issued a revised Atlanta classification that modernized the terminology pertaining to natural history, severity, imaging features, and complications. It divides the natural course of acute pancreatitis into early and late phases.4
Early vs late phase

In the early phase, findings on computed tomography (CT) neither correlate with clinical severity nor alter clinical management.6 Thus, early imaging is not indicated unless there is diagnostic uncertainty, lack of response to appropriate treatment, or sudden deterioration.
Moderate pancreatitis describes patients with pancreatic necrosis with or without transient organ failure (organ dysfunction for ≤ 48 hours).
Severe pancreatitis is defined by pancreatic necrosis and persistent organ dysfunction.4 It may be accompanied by pancreatic and peripancreatic fluid collections; bacteremia and sepsis can occur in association with infection of necrotic collections.
Interstitial edematous pancreatitis vs necrotizing pancreatitis
The revised Atlanta classification maintains the original classification of acute pancreatitis into 2 main categories: interstitial edematous pancreatitis and necrotizing pancreatitis.

Necrotizing pancreatitis is further divided into 3 subtypes based on extent and location of necrosis:
- Parenchymal necrosis alone (5% of cases)
- Necrosis of peripancreatic fat alone (20%)
- Necrosis of both parenchyma and peripancreatic fat (75%).
Peripancreatic involvement is commonly found in the mesentery, peripancreatic and distant retroperitoneum, and lesser sac.
Of the three subtypes, peripancreatic necrosis has the best prognosis. However, all of the subtypes of necrotizing pancreatitis are associated with poorer outcomes than interstitial edematous pancreatitis.
Fluid collections

Acute pancreatic fluid collections contain exclusively nonsolid components without an inflammatory wall and are typically found in the peripancreatic fat. These collections often resolve without intervention as the patient recovers. If they persist beyond 4 weeks and develop a nonepithelialized, fibrous wall, they become pseudocysts. Intervention is generally not recommended for pseudocysts unless they are symptomatic.

ROLE OF IMAGING
Radiographic imaging is not usually necessary to diagnose acute pancreatitis. However, it can be a valuable tool to clarify an ambiguous presentation, determine severity, and identify complications.
The timing and appropriate type of imaging are integral to obtaining useful data. Any imaging obtained in acute pancreatitis to evaluate necrosis should be performed at least 3 to 5 days from the initial symptom onset; if imaging is obtained before 72 hours, necrosis cannot be confidently excluded.8
COMPUTED TOMOGRAPHY
CT is the imaging test of choice when evaluating acute pancreatitis. In addition, almost all percutaneous interventions are performed with CT guidance. The Balthazar score is the most well-known CT severity index. It is calculated based on the degree of inflammation, acute fluid collections, and parenchymal necrosis.9 However, a modified severity index incorporates extrapancreatic complications such as ascites and vascular compromise and was found to more strongly correlate with outcomes than the standard Balthazar score.10
Contrast-enhanced CT is performed in 2 phases:
The pancreatic parenchymal phase
The pancreatic parenchymal or late arterial phase is obtained approximately 40 to 45 seconds after the start of the contrast bolus. It is used to detect necrosis in the early phase of acute pancreatitis and to assess the peripancreatic arteries for pseudoaneurysms in the late phase of acute pancreatitis.11
Pancreatic necrosis appears as an area of decreased parenchymal enhancement, either well-defined or heterogeneous. The normal pancreatic parenchyma has a postcontrast enhancement pattern similar to that of the spleen. Parenchyma that does not enhance to the same degree is considered necrotic. The severity of necrosis is graded based on the percentage of the pancreas involved (< 30%, 30%–50%, or > 50%), and a higher percentage correlates with a worse outcome.12,13
Peripancreatic necrosis is harder to detect, as there is no method to assess fat enhancement as there is with pancreatic parenchymal enhancement. In general, radiologists assume that heterogeneous peripancreatic changes, including areas of fat, fluid, and soft tissue attenuation, are consistent with peripancreatic necrosis. After 7 to 10 days, if these changes become more homogeneous and confluent with a more mass-like process, peripancreatic necrosis can be more confidently identified.12,13
The portal venous phase
The later, portal venous phase of the scan is obtained approximately 70 seconds after the start of the contrast bolus. It is used to detect and characterize fluid collections and venous complications of the disease.
Drawbacks of CT
A drawback of CT is the need for iodinated intravenous contrast media, which in severely ill patients may precipitate or worsen pre-existing acute kidney injury.
Further, several studies have shown that findings on CT rarely alter the management of patients in the early phase of acute pancreatitis and in fact may be an overuse of medical resources.14 Unless there are confounding clinical signs or symptoms, CT should be delayed for at least 72 hours.9,10,14,15
MAGNETIC RESONANCE IMAGING
Magnetic resonance imaging (MRI) is not a first-line imaging test in this disease because it is not as available as CT and takes longer to perform—20 to 30 minutes. The patient must be evaluated for candidacy, as it is difficult for acutely ill patients to tolerate an examination that takes this long and requires them to hold their breath multiple times.
MRI is an appropriate alternative in patients who are pregnant or who have severe iodinated-contrast allergy. While contrast is necessary to detect pancreatic necrosis with CT, MRI can detect necrosis without the need for contrast in patients with acute kidney injury or severe chronic kidney disease. Also, MRI may be better in complicated cases requiring repeated imaging because it does not expose the patient to radiation.
On MRI, pancreatic necrosis appears as a heterogeneous area, owing to its liquid and solid components. Liquid components appear hyperintense, and solid components hypointense, on T2 fluid-weighted imaging. This ability to differentiate the components of a walled-off pancreatic necrosis can be useful in determining whether a collection requires drainage or debridement. MRI is also more sensitive for hemorrhagic complications, best seen on T1 fat-weighted images.12,16
Magnetic resonance cholangiopancreatography is an excellent method for ductal evaluation through heavily T2-weighted imaging. It is more sensitive than CT for detecting common bile duct stones and can also detect pancreatic duct strictures or extravasation into fluid collections.16
SUPPORTIVE MANAGEMENT OF EARLY NECROTIZING PANCREATITIS
In the early phase of necrotizing pancreatitis, management is supportive with the primary aim of preventing intravascular volume depletion. Aggressive fluid resuscitation in the first 48 to 72 hours, pain control, and bowel rest are the mainstays of supportive therapy. Intensive care may be necessary if organ failure and hemodynamic instability accompany necrotizing pancreatitis.
Prophylactic antibiotic and antifungal therapy to prevent infected necrosis has been controversial. Recent studies of its utility have not yielded supportive results, and the American College of Gastroenterology and the Infectious Diseases Society of America no longer recommend it.9,17 These medications should not be given unless concomitant cholangitis or extrapancreatic infection is clinically suspected.
Early enteral nutrition is recommended in patients in whom pancreatitis is predicted to be severe and in those not expected to resume oral intake within 5 to 7 days. Enteral nutrition most commonly involves bedside or endoscopic placement of a nasojejunal feeding tube and collaboration with a nutritionist to determine protein-caloric requirements.
Compared with enteral nutrition, total parenteral nutrition is associated with higher rates of infection, multiorgan dysfunction and failure, and death.18
MANAGING COMPLICATIONS OF PANCREATIC NECROSIS
Necrotizing pancreatitis is a defining complication of acute pancreatitis, and its presence alone indicates greater severity. However, superimposed complications may further worsen outcomes.
Infected pancreatic necrosis
Infection occurs in approximately 20% of patients with necrotizing pancreatitis and confers a mortality rate of 20% to 50%.19 Infected pancreatic necrosis occurs when gut organisms translocate into the nearby necrotic pancreatic and peripancreatic tissue. The most commonly identified organisms include Escherichia coli and Enterococcus species.20
This complication usually manifests 2 to 4 weeks after symptom onset; earlier onset is uncommon to rare. It should be considered when the systemic inflammatory response syndrome persists or recurs after 10 days to 2 weeks. Systemic inflammatory response syndrome is also common in sterile necrotizing pancreatitis and sometimes in interstitial pancreatitis, particularly during the first week. However, its sudden appearance or resurgence, high spiking fevers, or worsening organ failure in the later phase (2–4 weeks) of pancreatitis should heighten suspicion of infected pancreatic necrosis.
Imaging may also help diagnose infection, and the presence of gas within a collection or region of necrosis is highly specific. However, the presence of gas is not completely sensitive for infection, as it is seen in only 12% to 22% of infected cases.
Before minimally invasive techniques became available, the diagnosis of infected pancreatic necrosis was confirmed by percutaneous CT-guided aspiration of the necrotic mass or collection for Gram stain and culture.
Antibiotic therapy is indicated in confirmed or suspected cases of infected pancreatic necrosis. Antibiotics with gram-negative coverage and appropriate penetration such as carbapenems, metronidazole, fluoroquinolones, and selected cephalosporins are most commonly used. Meropenem is the antibiotic of choice at our institution.
CT-guided fine-needle aspiration is often done if suspected infected pancreatic necrosis fails to respond to empiric antibiotic therapy.
Debridement or drainage. Generally, the diagnosis or suspicion of infected pancreatic necrosis (suggestive signs are high fever, elevated white blood cell count, and sepsis) warrants an intervention to debride or drain infected pancreatic tissue and control sepsis.21
While source control is integral to the successful treatment of infected pancreatic necrosis, antibiotic therapy may provide a bridge to intervention for critically ill patients by suppressing bacteremia and subsequent sepsis. A 2013 meta-analysis found that 324 of 409 patients with suspected infected pancreatic necrosis were successfully stabilized with antibiotic treatment.21,22 The trend toward conservative management and promising outcomes with antibiotic therapy alone or with minimally invasive techniques has lessened the need for diagnostic CT-guided fine-needle aspiration.
Hemorrhage
Spontaneous hemorrhage into pancreatic necrosis is a rare but life-threatening complication. Because CT is almost always performed with contrast enhancement, this complication is rarely identified with imaging. The diagnosis is made by noting a drop in hemoglobin and hematocrit.
Hemorrhage into the retroperitoneum or the peritoneal cavity, or both, can occur when an inflammatory process erodes into a nearby artery. Luminal gastrointestinal bleeding can occur from gastric varices arising from splenic vein thrombosis and resulting left-sided portal hypertension, or from pseudoaneurysms. These can also bleed into the pancreatic duct (hemosuccus pancreaticus). Pseudoaneurysm is a later complication that occurs when an arterial wall (most commonly the splenic or gastroduodenal artery) is weakened by pancreatic enzymes.23
Prompt recognition of hemorrhagic events and consultation with an interventional radiologist or surgeon are required to prevent death.
Inflammation and abdominal compartment syndrome
Inflammation from necrotizing pancreatitis can cause further complications by blocking nearby structures. Reported complications include jaundice from biliary compression, hydronephrosis from ureteral compression, bowel obstruction, and gastric outlet obstruction.
Abdominal compartment syndrome is an increasingly recognized complication of acute pancreatitis. Abdominal pressure can rise due to a number of factors, including fluid collections, ascites, ileus, and overly aggressive fluid resuscitation.24 Elevated abdominal pressure is associated with complications such as decreased respiratory compliance, increased peak airway pressure, decreased cardiac preload, hypotension, mesenteric and intestinal ischemia, feeding intolerance, and lower-extremity ischemia and thrombosis.
Patients with necrotizing pancreatitis who have abdominal compartment syndrome have a mortality rate 5 times higher than patients without abdominal compartment syndrome.25
Abdominal pressures should be monitored using a bladder pressure sensor in critically ill or ventilated patients with acute pancreatitis. If the abdominal pressure rises above 20 mm Hg, medical and surgical interventions should be offered in a stepwise fashion to decrease it. Interventions include decompression by nasogastric and rectal tube, sedation or paralysis to relax abdominal wall tension, minimization of intravenous fluids, percutaneous drainage of ascites, and (rarely) surgical midline or subcostal laparotomy.
ROLE OF INTERVENTION
The treatment of necrotizing pancreatitis has changed rapidly, thanks to a growing experience with minimally invasive techniques.
Indications for intervention
Infected pancreatic necrosis is the primary indication for surgical, percutaneous, or endoscopic intervention.
In sterile necrosis, the threshold for intervention is less clear, and intervention is often reserved for patients who fail to clinically improve or who have intractable abdominal pain, gastric outlet obstruction, or fistulating disease.26
In asymptomatic cases, intervention is almost never indicated regardless of the location or size of the necrotic area.
In walled-off pancreatic necrosis, less-invasive and less-morbid interventions such as endoscopic or percutaneous drainage or video-assisted retroperitoneal debridement can be done.
Timing of intervention
In the past, delaying intervention was thought to increase the risk of death. However, multiple studies have found that outcomes are often worse if intervention is done early, likely due to the lack of a fully formed fibrous wall or demarcation of the necrotic area.27
If the patient remains clinically stable, it is best to delay intervention until at least 4 weeks after the index event to achieve optimal outcomes. Delay can often be achieved by antibiotic treatment to suppress bacteremia and endoscopic or percutaneous drainage of infected collections to control sepsis.
Open surgery
The gold-standard intervention for infected pancreatic necrosis or symptomatic sterile walled-off pancreatic necrosis is open necrosectomy. This involves exploratory laparotomy with blunt debridement of all visible necrotic pancreatic tissue.
Methods to facilitate later evacuation of residual infected fluid and debris vary widely. Multiple large-caliber drains can be placed to facilitate irrigation and drainage before closure of the abdominal fascia. As infected pancreatic necrosis carries the risk of contaminating the peritoneal cavity, the skin is often left open to heal by secondary intention. An interventional radiologist is frequently enlisted to place, exchange, or downsize drainage catheters.
Infected pancreatic necrosis or symptomatic sterile walled-off pancreatic necrosis often requires more than one operation to achieve satisfactory debridement.
The goals of open necrosectomy are to remove nonviable tissue and infection, preserve viable pancreatic tissue, eliminate fistulous connections, and minimize damage to local organs and vasculature.
Minimally invasive techniques


Video-assisted retroperitoneal debridement has been described as a hybrid between endoscopic and open retroperitoneal debridement.28 This technique requires first placing a percutaneous catheter into the necrotic area through the left flank to create a retroperitoneal tract. A 5-cm incision is made and the necrotic space is entered using the drain for guidance. Necrotic tissue is carefully debrided under direct vision using a combination of forceps, irrigation, and suction. A laparoscopic port can also be introduced into the incision when the procedure can no longer be continued under direct vision.29,30
Although not all patients are candidates for minimal-access surgery, it remains an evolving surgical option.
Endoscopic transmural debridement is another option for infected pancreatic necrosis and symptomatic walled-off pancreatic necrosis. Depending on the location of the necrotic area, an echoendoscope is passed to either the stomach or duodenum. Guided by endoscopic ultrasonography, a needle is passed into the collection, allowing subsequent fistula creation and stenting for internal drainage or debridement. In the past, this process required several steps, multiple devices, fluoroscopic guidance, and considerable time. But newer endoscopic lumen-apposing metal stents have been developed that can be placed in a single step without fluoroscopy. A slimmer endoscope can then be introduced into the necrotic cavity via the stent, and the necrotic debris can be debrided with endoscopic baskets, snares, forceps, and irrigation.9,31
Similar to surgical necrosectomy, satisfactory debridement is not often obtained with a single procedure; 2 to 5 endoscopic procedures may be needed to achieve resolution. However, the luminal approach in endoscopic necrosectomy avoids the significant morbidity of major abdominal surgery and the potential for pancreaticocutaneous fistulae that may occur with drains.
In a randomized trial comparing endoscopic necrosectomy vs surgical necrosectomy (video-assisted retroperitoneal debridement and exploratory laparotomy),32 endoscopic necrosectomy showed less inflammatory response than surgical necrosectomy and had a lower risk of new-onset organ failure, bleeding, fistula formation, and death.32
Selecting the best intervention for the individual patient
Given the multiple available techniques, selecting the best intervention for individual patients can be challenging. A team approach with input from a gastroenterologist, surgeon, and interventional radiologist is best when determining which technique would best suit each patient.
Surgical necrosectomy is still the treatment of choice for unstable patients with infected pancreatic necrosis or multiple, inaccessible collections, but current evidence suggests a different approach in stable infected pancreatic necrosis and symptomatic sterile walled-off pancreatic necrosis.
The Dutch Pancreatitis Group28 randomized 88 patients with infected pancreatic necrosis or symptomatic walled-off pancreatic necrosis to open necrosectomy or a minimally invasive “step-up” approach consisting of up to 2 percutaneous drainage or endoscopic debridement procedures before escalation to video-assisted retroperitoneal debridement. The step-up approach resulted in lower rates of morbidity and death than surgical necrosectomy as first-line treatment. Furthermore, some patients in the step-up group avoided the need for surgery entirely.30
SUMMING UP
Necrosis significantly increases rates of morbidity and mortality in acute pancreatitis. Hospitalists, general internists, and general surgeons are all on the front lines in identifying severe cases and consulting the appropriate specialists for optimal multidisciplinary care. Selective and appropriate timing of radiologic imaging is key, and a vital tool in the management of necrotizing pancreatitis.
While the primary indication for intervention is infected pancreatic necrosis, additional indications are symptomatic walled-off pancreatic necrosis secondary to intractable abdominal pain, bowel obstruction, and failure to thrive. As a result of improving technology and inpatient care, these patients may present with intractable symptoms in the outpatient setting rather than the inpatient setting. The onus is on the primary care physician to maintain a high level of suspicion and refer these patients to subspecialists as appropriate.
Open surgical necrosectomy remains an important approach for care of infected pancreatic necrosis or patients with intractable symptoms. A step-up approach starting with a minimally invasive procedure and escalating if the initial intervention is unsuccessful is gradually becoming the standard of care.
- Peery AF, Crockett SD, Barritt AS, et al. Burden of gastrointestinal, liver, and pancreatic disease in the United States. Gastroenterology 2015; 149:1731–1741e3.
- Tenner S, Baillie J, DeWitt J, Vege SS; American College of Gastroenterology. American College of Gastroenterology guideline: management of acute pancreatitis. Am J Gastroenterol 2013; 108:1400–1416.
- Bradley EL 3rd. A clinically based classification system for acute pancreatitis. Summary of the International Symposium on Acute Pancreatitis, Atlanta, GA, September 11 through 13, 1992. Arch Surg 1993; 128:586–590.
- Banks PA, Bollen TL, Dervenis C, et al; Acute Pancreatitis Classification Working Group. Classification of acute pancreatitis—2012: revision of the Atlanta classification and definitions by international consensus. Gut 2013; 62:102–111.
- Marshall JC, Cook DJ, Christou NV, Bernard GR, Sprung CL, Sibbald WJ. Multiple organ dysfunction score: a reliable descriptor of a complex clinical outcome. Crit Care Med 1995; 23:1638–1652.
- Kadiyala V, Suleiman SL, McNabb-Baltar J, Wu BU, Banks PA, Singh VK. The Atlanta classification, revised Atlanta classification, and determinant-based classification of acute pancreatitis: which is best at stratifying outcomes? Pancreas 2016; 45:510–515.
- Singh VK, Bollen TL, Wu BU, et al. An assessment of the severity of interstitial pancreatitis. Clin Gastroenterol Hepatol 2011; 9:1098–1103.
- Kotwal V, Talukdar R, Levy M, Vege SS. Role of endoscopic ultrasound during hospitalization for acute pancreatitis. World J Gastroenterol 2010; 16:4888–4891.
- Balthazar EJ. Acute pancreatitis: assessment of severity with clinical and CT evaluation. Radiology 2002; 223:603–613.
- Mortele KJ, Wiesner W, Intriere L, et al. A modified CT severity index for evaluating acute pancreatitis: improved correlation with patient outcome. AJR Am J Roentgenol 2004; 183:1261–1265.
- Verde F, Fishman EK, Johnson PT. Arterial pseudoaneurysms complicating pancreatitis: literature review. J Comput Assist Tomogr 2015; 39:7–12.
- Shyu JY, Sainani NI, Sahni VA, et al. Necrotizing pancreatitis: diagnosis, imaging, and intervention. Radiographics 2014; 34:1218–1239.
- Thoeni RF. The revised Atlanta classification of acute pancreatitis: its importance for the radiologist and its effect on treatment. Radiology 2012; 262:751–764.
- Morgan DE, Ragheb CM, Lockhart ME, Cary B, Fineberg NS, Berland LL. Acute pancreatitis: computed tomography utilization and radiation exposure are related to severity but not patient age. Clin Gastroenterol Hepatol 2010; 8:303–308.
- Vitellas KM, Paulson EK, Enns RA, Keogan MT, Pappas TN. Pancreatitis complicated by gland necrosis: evolution of findings on contrast-enhanced CT. J Comput Assist Tomogr 1999; 23:898–905.
- Stimac D, Miletic D, Radic M, et al. The role of nonenhanced magnetic resonance imaging in the early assessment of acute pancreatitis. Am J Gastroenterol 2007; 102:997–1004.
- Solomkin JS, Mazuski JE, Bradley JS, et al. Diagnosis and management of complicated intra-abdominal infection in adults and children: guidelines by the Surgical Infection Society and the Infectious Diseases Society of America. Surg Infect (Larchmt) 2010; 11:79–109.
- Petrov MS, Kukosh MV, Emelyanov NV. A randomized controlled trial of enteral versus parenteral feeding in patients with predicted severe acute pancreatitis shows a significant reduction in mortality and in infected pancreatic complications with total enteral nutrition. Dig Surg 2006; 23:336–345.
- Petrov MS, Shanbhag S, Chakraborty M, Phillips AR, Windsor JA. Organ failure and infection of pancreatic necrosis as determinants of mortality in patients with acute pancreatitis. Gastroenterology 2010; 139:813–820.
- Villatoro E, Bassi C, Larvin M. Antibiotic therapy for prophylaxis against infection of pancreatic necrosis in acute pancreatitis. Cochrane Database Syst Rev 2006; 4:CD002941.
- Baril NB, Ralls PW, Wren SM, et al. Does an infected peripancreatic fluid collection or abscess mandate operation? Ann Surg 2000; 231:361–367.
- Mouli VP, Sreenivas V, Garg PK. Efficacy of conservative treatment, without necrosectomy, for infected pancreatic necrosis: a systematic review and meta-analysis. Gastroenterology 2013; 144:333–340.e2.
- Kirby JM, Vora P, Midia M, Rawlinson J. Vascular complications of pancreatitis: imaging and intervention. Cardiovasc Intervent Radiol 2008; 31:957–970.
- De Waele JJ, Hoste E, Blot SI, Decruyenaere J, Colardyn F. Intra-abdominal hypertension in patients with severe acute pancreatitis. Crit Care 2005; 9:R452–R457.
- van Brunschot S, Schut AJ, Bouwense SA, et al; Dutch Pancreatitis Study Group. Abdominal compartment syndrome in acute pancreatitis: a systematic review. Pancreas 2014; 43:665–674.
- Bugiantella W, Rondelli F, Boni M, et al. Necrotizing pancreatitis: a review of the interventions. Int J Surg 2016; 28(suppl 1):S163–S171.
- Besselink MG, Verwer TJ, Schoenmaeckers EJ, et al. Timing of surgical intervention in necrotizing pancreatitis. Arch Surg 2007; 142:1194–1201.
- van Santvoort HC, Besselink MG, Horvath KD, et al; Dutch Acute Pancreatis Study Group. Videoscopic assisted retroperitoneal debridement in infected necrotizing pancreatitis. HPB (Oxford) 2007; 9:156–159.
- van Santvoort HC, Besselink MG, Bollen TL, Buskens E, van Ramshorst B, Gooszen HG; Dutch Acute Pancreatitis Study Group. Case-matched comparison of the retroperitoneal approach with laparotomy for necrotizing pancreatitis. World J Surg 2007; 31:1635–1642.
- van Santvoort HC, Besselink MG, Bakker OJ, et al; Dutch Pancreatitis Study Group. A step-up approach or open necrosectomy for necrotizing pancreatitis. N Engl J Med 2010; 362:1491–1502.
- Thompson CC, Kumar N, Slattery J, et al. A standardized method for endoscopic necrosectomy improves complication and mortality rates. Pancreatology 2016; 16:66–72.
- Bakker OJ, van Santvoort HC, van Brunschot S, et al; Dutch Pancreatitis Study Group. Endoscopic transgastric vs surgical necrosectomy for infected necrotizing pancreatitis: a randomized trial. JAMA 2012; 307:1053–1061.
Acute pancreatitis accounted for more than 300,000 admissions and $2.6 billion in associated healthcare costs in the United States in 2012.1 First-line management is early aggressive fluid resuscitation and analgesics for pain control. Guidelines recommend estimating the clinical severity of each attack using a validated scoring system such as the Bedside Index of Severity in Acute Pancreatitis.2 Clinically severe pancreatitis is associated with necrosis.
Acute pancreatitis results from inappropriate activation of zymogens and subsequent autodigestion of the pancreas by its own enzymes. Though necrotizing pancreatitis is thought to be an ischemic complication, its pathogenesis is not completely understood. Necrosis increases the morbidity and mortality risk of acute pancreatitis because of its association with organ failure and infectious complications. As such, patients with necrotizing pancreatitis may need admission to the intensive care unit, nutritional support, antibiotics, and radiologic, endoscopic, or surgical interventions.
Here, we review current evidence regarding the diagnosis and management of necrotizing pancreatitis.
PROPER TERMINOLOGY HELPS COLLABORATION
Managing necrotizing pancreatitis requires the combined efforts of internists, gastroenterologists, radiologists, and surgeons. This collaboration is aided by proper terminology.
A classification system was devised in Atlanta, GA, in 1992 to facilitate communication and interdisciplinary collaboration.3 Severe pancreatitis was differentiated from mild by the presence of organ failure or the complications of pseudocyst, necrosis, or abscess.
The original Atlanta classification had several limitations. First, the terminology for fluid collections was ambiguous and frequently misused. Second, the assessment of clinical severity required either the Ranson score or the Acute Physiology and Chronic Health Evaluation II score, both of which are complex and have other limitations. Finally, advances in imaging and treatment have rendered the original Atlanta nomenclature obsolete.
In 2012, the Acute Pancreatitis Classification Working Group issued a revised Atlanta classification that modernized the terminology pertaining to natural history, severity, imaging features, and complications. It divides the natural course of acute pancreatitis into early and late phases.4
Early vs late phase
In the early phase, findings on computed tomography (CT) neither correlate with clinical severity nor alter clinical management.6 Thus, early imaging is not indicated unless there is diagnostic uncertainty, lack of response to appropriate treatment, or sudden deterioration.
Moderate pancreatitis describes patients with pancreatic necrosis with or without transient organ failure (organ dysfunction for ≤ 48 hours).
Severe pancreatitis is defined by pancreatic necrosis and persistent organ dysfunction.4 It may be accompanied by pancreatic and peripancreatic fluid collections; bacteremia and sepsis can occur in association with infection of necrotic collections.
Interstitial edematous pancreatitis vs necrotizing pancreatitis
The revised Atlanta classification maintains the original classification of acute pancreatitis into 2 main categories: interstitial edematous pancreatitis and necrotizing pancreatitis.
Necrotizing pancreatitis is further divided into 3 subtypes based on extent and location of necrosis:
- Parenchymal necrosis alone (5% of cases)
- Necrosis of peripancreatic fat alone (20%)
- Necrosis of both parenchyma and peripancreatic fat (75%).
Peripancreatic involvement is commonly found in the mesentery, peripancreatic and distant retroperitoneum, and lesser sac.
Of the three subtypes, peripancreatic necrosis has the best prognosis. However, all of the subtypes of necrotizing pancreatitis are associated with poorer outcomes than interstitial edematous pancreatitis.
Fluid collections
Acute pancreatic fluid collections contain exclusively nonsolid components without an inflammatory wall and are typically found in the peripancreatic fat. These collections often resolve without intervention as the patient recovers. If they persist beyond 4 weeks and develop a nonepithelialized, fibrous wall, they become pseudocysts. Intervention is generally not recommended for pseudocysts unless they are symptomatic.
ROLE OF IMAGING
Radiographic imaging is not usually necessary to diagnose acute pancreatitis. However, it can be a valuable tool to clarify an ambiguous presentation, determine severity, and identify complications.
The timing and appropriate type of imaging are integral to obtaining useful data. Any imaging obtained in acute pancreatitis to evaluate necrosis should be performed at least 3 to 5 days from the initial symptom onset; if imaging is obtained before 72 hours, necrosis cannot be confidently excluded.8
COMPUTED TOMOGRAPHY
CT is the imaging test of choice when evaluating acute pancreatitis. In addition, almost all percutaneous interventions are performed with CT guidance. The Balthazar score is the most well-known CT severity index. It is calculated based on the degree of inflammation, acute fluid collections, and parenchymal necrosis.9 However, a modified severity index incorporates extrapancreatic complications such as ascites and vascular compromise and was found to more strongly correlate with outcomes than the standard Balthazar score.10
Contrast-enhanced CT is performed in 2 phases:
The pancreatic parenchymal phase
The pancreatic parenchymal or late arterial phase is obtained approximately 40 to 45 seconds after the start of the contrast bolus. It is used to detect necrosis in the early phase of acute pancreatitis and to assess the peripancreatic arteries for pseudoaneurysms in the late phase of acute pancreatitis.11
Pancreatic necrosis appears as an area of decreased parenchymal enhancement, either well-defined or heterogeneous. The normal pancreatic parenchyma has a postcontrast enhancement pattern similar to that of the spleen. Parenchyma that does not enhance to the same degree is considered necrotic. The severity of necrosis is graded based on the percentage of the pancreas involved (< 30%, 30%–50%, or > 50%), and a higher percentage correlates with a worse outcome.12,13
Peripancreatic necrosis is harder to detect, as there is no method to assess fat enhancement as there is with pancreatic parenchymal enhancement. In general, radiologists assume that heterogeneous peripancreatic changes, including areas of fat, fluid, and soft tissue attenuation, are consistent with peripancreatic necrosis. After 7 to 10 days, if these changes become more homogeneous and confluent with a more mass-like process, peripancreatic necrosis can be more confidently identified.12,13
The portal venous phase
The later, portal venous phase of the scan is obtained approximately 70 seconds after the start of the contrast bolus. It is used to detect and characterize fluid collections and venous complications of the disease.
Drawbacks of CT
A drawback of CT is the need for iodinated intravenous contrast media, which in severely ill patients may precipitate or worsen pre-existing acute kidney injury.
Further, several studies have shown that findings on CT rarely alter the management of patients in the early phase of acute pancreatitis and in fact may be an overuse of medical resources.14 Unless there are confounding clinical signs or symptoms, CT should be delayed for at least 72 hours.9,10,14,15
MAGNETIC RESONANCE IMAGING
Magnetic resonance imaging (MRI) is not a first-line imaging test in this disease because it is not as available as CT and takes longer to perform—20 to 30 minutes. The patient must be evaluated for candidacy, as it is difficult for acutely ill patients to tolerate an examination that takes this long and requires them to hold their breath multiple times.
MRI is an appropriate alternative in patients who are pregnant or who have severe iodinated-contrast allergy. While contrast is necessary to detect pancreatic necrosis with CT, MRI can detect necrosis without the need for contrast in patients with acute kidney injury or severe chronic kidney disease. Also, MRI may be better in complicated cases requiring repeated imaging because it does not expose the patient to radiation.
On MRI, pancreatic necrosis appears as a heterogeneous area, owing to its liquid and solid components. Liquid components appear hyperintense, and solid components hypointense, on T2 fluid-weighted imaging. This ability to differentiate the components of a walled-off pancreatic necrosis can be useful in determining whether a collection requires drainage or debridement. MRI is also more sensitive for hemorrhagic complications, best seen on T1 fat-weighted images.12,16
Magnetic resonance cholangiopancreatography is an excellent method for ductal evaluation through heavily T2-weighted imaging. It is more sensitive than CT for detecting common bile duct stones and can also detect pancreatic duct strictures or extravasation into fluid collections.16
SUPPORTIVE MANAGEMENT OF EARLY NECROTIZING PANCREATITIS
In the early phase of necrotizing pancreatitis, management is supportive with the primary aim of preventing intravascular volume depletion. Aggressive fluid resuscitation in the first 48 to 72 hours, pain control, and bowel rest are the mainstays of supportive therapy. Intensive care may be necessary if organ failure and hemodynamic instability accompany necrotizing pancreatitis.
Prophylactic antibiotic and antifungal therapy to prevent infected necrosis has been controversial. Recent studies of its utility have not yielded supportive results, and the American College of Gastroenterology and the Infectious Diseases Society of America no longer recommend it.9,17 These medications should not be given unless concomitant cholangitis or extrapancreatic infection is clinically suspected.
Early enteral nutrition is recommended in patients in whom pancreatitis is predicted to be severe and in those not expected to resume oral intake within 5 to 7 days. Enteral nutrition most commonly involves bedside or endoscopic placement of a nasojejunal feeding tube and collaboration with a nutritionist to determine protein-caloric requirements.
Compared with enteral nutrition, total parenteral nutrition is associated with higher rates of infection, multiorgan dysfunction and failure, and death.18
MANAGING COMPLICATIONS OF PANCREATIC NECROSIS
Necrotizing pancreatitis is a defining complication of acute pancreatitis, and its presence alone indicates greater severity. However, superimposed complications may further worsen outcomes.
Infected pancreatic necrosis
Infection occurs in approximately 20% of patients with necrotizing pancreatitis and confers a mortality rate of 20% to 50%.19 Infected pancreatic necrosis occurs when gut organisms translocate into the nearby necrotic pancreatic and peripancreatic tissue. The most commonly identified organisms include Escherichia coli and Enterococcus species.20
This complication usually manifests 2 to 4 weeks after symptom onset; earlier onset is uncommon to rare. It should be considered when the systemic inflammatory response syndrome persists or recurs after 10 days to 2 weeks. Systemic inflammatory response syndrome is also common in sterile necrotizing pancreatitis and sometimes in interstitial pancreatitis, particularly during the first week. However, its sudden appearance or resurgence, high spiking fevers, or worsening organ failure in the later phase (2–4 weeks) of pancreatitis should heighten suspicion of infected pancreatic necrosis.
Imaging may also help diagnose infection, and the presence of gas within a collection or region of necrosis is highly specific. However, the presence of gas is not completely sensitive for infection, as it is seen in only 12% to 22% of infected cases.
Before minimally invasive techniques became available, the diagnosis of infected pancreatic necrosis was confirmed by percutaneous CT-guided aspiration of the necrotic mass or collection for Gram stain and culture.
Antibiotic therapy is indicated in confirmed or suspected cases of infected pancreatic necrosis. Antibiotics with gram-negative coverage and appropriate penetration such as carbapenems, metronidazole, fluoroquinolones, and selected cephalosporins are most commonly used. Meropenem is the antibiotic of choice at our institution.
CT-guided fine-needle aspiration is often done if suspected infected pancreatic necrosis fails to respond to empiric antibiotic therapy.
Debridement or drainage. Generally, the diagnosis or suspicion of infected pancreatic necrosis (suggestive signs are high fever, elevated white blood cell count, and sepsis) warrants an intervention to debride or drain infected pancreatic tissue and control sepsis.21
While source control is integral to the successful treatment of infected pancreatic necrosis, antibiotic therapy may provide a bridge to intervention for critically ill patients by suppressing bacteremia and subsequent sepsis. A 2013 meta-analysis found that 324 of 409 patients with suspected infected pancreatic necrosis were successfully stabilized with antibiotic treatment.21,22 The trend toward conservative management and promising outcomes with antibiotic therapy alone or with minimally invasive techniques has lessened the need for diagnostic CT-guided fine-needle aspiration.
Hemorrhage
Spontaneous hemorrhage into pancreatic necrosis is a rare but life-threatening complication. Because CT is almost always performed with contrast enhancement, this complication is rarely identified with imaging. The diagnosis is made by noting a drop in hemoglobin and hematocrit.
Hemorrhage into the retroperitoneum or the peritoneal cavity, or both, can occur when an inflammatory process erodes into a nearby artery. Luminal gastrointestinal bleeding can occur from gastric varices arising from splenic vein thrombosis and resulting left-sided portal hypertension, or from pseudoaneurysms. These can also bleed into the pancreatic duct (hemosuccus pancreaticus). Pseudoaneurysm is a later complication that occurs when an arterial wall (most commonly the splenic or gastroduodenal artery) is weakened by pancreatic enzymes.23
Prompt recognition of hemorrhagic events and consultation with an interventional radiologist or surgeon are required to prevent death.
Inflammation and abdominal compartment syndrome
Inflammation from necrotizing pancreatitis can cause further complications by blocking nearby structures. Reported complications include jaundice from biliary compression, hydronephrosis from ureteral compression, bowel obstruction, and gastric outlet obstruction.
Abdominal compartment syndrome is an increasingly recognized complication of acute pancreatitis. Abdominal pressure can rise due to a number of factors, including fluid collections, ascites, ileus, and overly aggressive fluid resuscitation.24 Elevated abdominal pressure is associated with complications such as decreased respiratory compliance, increased peak airway pressure, decreased cardiac preload, hypotension, mesenteric and intestinal ischemia, feeding intolerance, and lower-extremity ischemia and thrombosis.
Patients with necrotizing pancreatitis who have abdominal compartment syndrome have a mortality rate 5 times higher than patients without abdominal compartment syndrome.25
Abdominal pressures should be monitored using a bladder pressure sensor in critically ill or ventilated patients with acute pancreatitis. If the abdominal pressure rises above 20 mm Hg, medical and surgical interventions should be offered in a stepwise fashion to decrease it. Interventions include decompression by nasogastric and rectal tube, sedation or paralysis to relax abdominal wall tension, minimization of intravenous fluids, percutaneous drainage of ascites, and (rarely) surgical midline or subcostal laparotomy.
ROLE OF INTERVENTION
The treatment of necrotizing pancreatitis has changed rapidly, thanks to a growing experience with minimally invasive techniques.
Indications for intervention
Infected pancreatic necrosis is the primary indication for surgical, percutaneous, or endoscopic intervention.
In sterile necrosis, the threshold for intervention is less clear, and intervention is often reserved for patients who fail to clinically improve or who have intractable abdominal pain, gastric outlet obstruction, or fistulating disease.26
In asymptomatic cases, intervention is almost never indicated regardless of the location or size of the necrotic area.
In walled-off pancreatic necrosis, less-invasive and less-morbid interventions such as endoscopic or percutaneous drainage or video-assisted retroperitoneal debridement can be done.
Timing of intervention
In the past, delaying intervention was thought to increase the risk of death. However, multiple studies have found that outcomes are often worse if intervention is done early, likely due to the lack of a fully formed fibrous wall or demarcation of the necrotic area.27
If the patient remains clinically stable, it is best to delay intervention until at least 4 weeks after the index event to achieve optimal outcomes. Delay can often be achieved by antibiotic treatment to suppress bacteremia and endoscopic or percutaneous drainage of infected collections to control sepsis.
Open surgery
The gold-standard intervention for infected pancreatic necrosis or symptomatic sterile walled-off pancreatic necrosis is open necrosectomy. This involves exploratory laparotomy with blunt debridement of all visible necrotic pancreatic tissue.
Methods to facilitate later evacuation of residual infected fluid and debris vary widely. Multiple large-caliber drains can be placed to facilitate irrigation and drainage before closure of the abdominal fascia. As infected pancreatic necrosis carries the risk of contaminating the peritoneal cavity, the skin is often left open to heal by secondary intention. An interventional radiologist is frequently enlisted to place, exchange, or downsize drainage catheters.
Infected pancreatic necrosis or symptomatic sterile walled-off pancreatic necrosis often requires more than one operation to achieve satisfactory debridement.
The goals of open necrosectomy are to remove nonviable tissue and infection, preserve viable pancreatic tissue, eliminate fistulous connections, and minimize damage to local organs and vasculature.
Minimally invasive techniques
Video-assisted retroperitoneal debridement has been described as a hybrid between endoscopic and open retroperitoneal debridement.28 This technique requires first placing a percutaneous catheter into the necrotic area through the left flank to create a retroperitoneal tract. A 5-cm incision is made and the necrotic space is entered using the drain for guidance. Necrotic tissue is carefully debrided under direct vision using a combination of forceps, irrigation, and suction. A laparoscopic port can also be introduced into the incision when the procedure can no longer be continued under direct vision.29,30
Although not all patients are candidates for minimal-access surgery, it remains an evolving surgical option.
Endoscopic transmural debridement is another option for infected pancreatic necrosis and symptomatic walled-off pancreatic necrosis. Depending on the location of the necrotic area, an echoendoscope is passed to either the stomach or duodenum. Guided by endoscopic ultrasonography, a needle is passed into the collection, allowing subsequent fistula creation and stenting for internal drainage or debridement. In the past, this process required several steps, multiple devices, fluoroscopic guidance, and considerable time. But newer endoscopic lumen-apposing metal stents have been developed that can be placed in a single step without fluoroscopy. A slimmer endoscope can then be introduced into the necrotic cavity via the stent, and the necrotic debris can be debrided with endoscopic baskets, snares, forceps, and irrigation.9,31
Similar to surgical necrosectomy, satisfactory debridement is not often obtained with a single procedure; 2 to 5 endoscopic procedures may be needed to achieve resolution. However, the luminal approach in endoscopic necrosectomy avoids the significant morbidity of major abdominal surgery and the potential for pancreaticocutaneous fistulae that may occur with drains.
In a randomized trial comparing endoscopic necrosectomy vs surgical necrosectomy (video-assisted retroperitoneal debridement and exploratory laparotomy),32 endoscopic necrosectomy showed less inflammatory response than surgical necrosectomy and had a lower risk of new-onset organ failure, bleeding, fistula formation, and death.32
Selecting the best intervention for the individual patient
Given the multiple available techniques, selecting the best intervention for individual patients can be challenging. A team approach with input from a gastroenterologist, surgeon, and interventional radiologist is best when determining which technique would best suit each patient.
Surgical necrosectomy is still the treatment of choice for unstable patients with infected pancreatic necrosis or multiple, inaccessible collections, but current evidence suggests a different approach in stable infected pancreatic necrosis and symptomatic sterile walled-off pancreatic necrosis.
The Dutch Pancreatitis Group28 randomized 88 patients with infected pancreatic necrosis or symptomatic walled-off pancreatic necrosis to open necrosectomy or a minimally invasive “step-up” approach consisting of up to 2 percutaneous drainage or endoscopic debridement procedures before escalation to video-assisted retroperitoneal debridement. The step-up approach resulted in lower rates of morbidity and death than surgical necrosectomy as first-line treatment. Furthermore, some patients in the step-up group avoided the need for surgery entirely.30
SUMMING UP
Necrosis significantly increases rates of morbidity and mortality in acute pancreatitis. Hospitalists, general internists, and general surgeons are all on the front lines in identifying severe cases and consulting the appropriate specialists for optimal multidisciplinary care. Selective and appropriate timing of radiologic imaging is key, and a vital tool in the management of necrotizing pancreatitis.
While the primary indication for intervention is infected pancreatic necrosis, additional indications are symptomatic walled-off pancreatic necrosis secondary to intractable abdominal pain, bowel obstruction, and failure to thrive. As a result of improving technology and inpatient care, these patients may present with intractable symptoms in the outpatient setting rather than the inpatient setting. The onus is on the primary care physician to maintain a high level of suspicion and refer these patients to subspecialists as appropriate.
Open surgical necrosectomy remains an important approach for care of infected pancreatic necrosis or patients with intractable symptoms. A step-up approach starting with a minimally invasive procedure and escalating if the initial intervention is unsuccessful is gradually becoming the standard of care.
- Peery AF, Crockett SD, Barritt AS, et al. Burden of gastrointestinal, liver, and pancreatic disease in the United States. Gastroenterology 2015; 149:1731–1741e3.
- Tenner S, Baillie J, DeWitt J, Vege SS; American College of Gastroenterology. American College of Gastroenterology guideline: management of acute pancreatitis. Am J Gastroenterol 2013; 108:1400–1416.
- Bradley EL 3rd. A clinically based classification system for acute pancreatitis. Summary of the International Symposium on Acute Pancreatitis, Atlanta, GA, September 11 through 13, 1992. Arch Surg 1993; 128:586–590.
- Banks PA, Bollen TL, Dervenis C, et al; Acute Pancreatitis Classification Working Group. Classification of acute pancreatitis—2012: revision of the Atlanta classification and definitions by international consensus. Gut 2013; 62:102–111.
- Marshall JC, Cook DJ, Christou NV, Bernard GR, Sprung CL, Sibbald WJ. Multiple organ dysfunction score: a reliable descriptor of a complex clinical outcome. Crit Care Med 1995; 23:1638–1652.
- Kadiyala V, Suleiman SL, McNabb-Baltar J, Wu BU, Banks PA, Singh VK. The Atlanta classification, revised Atlanta classification, and determinant-based classification of acute pancreatitis: which is best at stratifying outcomes? Pancreas 2016; 45:510–515.
- Singh VK, Bollen TL, Wu BU, et al. An assessment of the severity of interstitial pancreatitis. Clin Gastroenterol Hepatol 2011; 9:1098–1103.
- Kotwal V, Talukdar R, Levy M, Vege SS. Role of endoscopic ultrasound during hospitalization for acute pancreatitis. World J Gastroenterol 2010; 16:4888–4891.
- Balthazar EJ. Acute pancreatitis: assessment of severity with clinical and CT evaluation. Radiology 2002; 223:603–613.
- Mortele KJ, Wiesner W, Intriere L, et al. A modified CT severity index for evaluating acute pancreatitis: improved correlation with patient outcome. AJR Am J Roentgenol 2004; 183:1261–1265.
- Verde F, Fishman EK, Johnson PT. Arterial pseudoaneurysms complicating pancreatitis: literature review. J Comput Assist Tomogr 2015; 39:7–12.
- Shyu JY, Sainani NI, Sahni VA, et al. Necrotizing pancreatitis: diagnosis, imaging, and intervention. Radiographics 2014; 34:1218–1239.
- Thoeni RF. The revised Atlanta classification of acute pancreatitis: its importance for the radiologist and its effect on treatment. Radiology 2012; 262:751–764.
- Morgan DE, Ragheb CM, Lockhart ME, Cary B, Fineberg NS, Berland LL. Acute pancreatitis: computed tomography utilization and radiation exposure are related to severity but not patient age. Clin Gastroenterol Hepatol 2010; 8:303–308.
- Vitellas KM, Paulson EK, Enns RA, Keogan MT, Pappas TN. Pancreatitis complicated by gland necrosis: evolution of findings on contrast-enhanced CT. J Comput Assist Tomogr 1999; 23:898–905.
- Stimac D, Miletic D, Radic M, et al. The role of nonenhanced magnetic resonance imaging in the early assessment of acute pancreatitis. Am J Gastroenterol 2007; 102:997–1004.
- Solomkin JS, Mazuski JE, Bradley JS, et al. Diagnosis and management of complicated intra-abdominal infection in adults and children: guidelines by the Surgical Infection Society and the Infectious Diseases Society of America. Surg Infect (Larchmt) 2010; 11:79–109.
- Petrov MS, Kukosh MV, Emelyanov NV. A randomized controlled trial of enteral versus parenteral feeding in patients with predicted severe acute pancreatitis shows a significant reduction in mortality and in infected pancreatic complications with total enteral nutrition. Dig Surg 2006; 23:336–345.
- Petrov MS, Shanbhag S, Chakraborty M, Phillips AR, Windsor JA. Organ failure and infection of pancreatic necrosis as determinants of mortality in patients with acute pancreatitis. Gastroenterology 2010; 139:813–820.
- Villatoro E, Bassi C, Larvin M. Antibiotic therapy for prophylaxis against infection of pancreatic necrosis in acute pancreatitis. Cochrane Database Syst Rev 2006; 4:CD002941.
- Baril NB, Ralls PW, Wren SM, et al. Does an infected peripancreatic fluid collection or abscess mandate operation? Ann Surg 2000; 231:361–367.
- Mouli VP, Sreenivas V, Garg PK. Efficacy of conservative treatment, without necrosectomy, for infected pancreatic necrosis: a systematic review and meta-analysis. Gastroenterology 2013; 144:333–340.e2.
- Kirby JM, Vora P, Midia M, Rawlinson J. Vascular complications of pancreatitis: imaging and intervention. Cardiovasc Intervent Radiol 2008; 31:957–970.
- De Waele JJ, Hoste E, Blot SI, Decruyenaere J, Colardyn F. Intra-abdominal hypertension in patients with severe acute pancreatitis. Crit Care 2005; 9:R452–R457.
- van Brunschot S, Schut AJ, Bouwense SA, et al; Dutch Pancreatitis Study Group. Abdominal compartment syndrome in acute pancreatitis: a systematic review. Pancreas 2014; 43:665–674.
- Bugiantella W, Rondelli F, Boni M, et al. Necrotizing pancreatitis: a review of the interventions. Int J Surg 2016; 28(suppl 1):S163–S171.
- Besselink MG, Verwer TJ, Schoenmaeckers EJ, et al. Timing of surgical intervention in necrotizing pancreatitis. Arch Surg 2007; 142:1194–1201.
- van Santvoort HC, Besselink MG, Horvath KD, et al; Dutch Acute Pancreatis Study Group. Videoscopic assisted retroperitoneal debridement in infected necrotizing pancreatitis. HPB (Oxford) 2007; 9:156–159.
- van Santvoort HC, Besselink MG, Bollen TL, Buskens E, van Ramshorst B, Gooszen HG; Dutch Acute Pancreatitis Study Group. Case-matched comparison of the retroperitoneal approach with laparotomy for necrotizing pancreatitis. World J Surg 2007; 31:1635–1642.
- van Santvoort HC, Besselink MG, Bakker OJ, et al; Dutch Pancreatitis Study Group. A step-up approach or open necrosectomy for necrotizing pancreatitis. N Engl J Med 2010; 362:1491–1502.
- Thompson CC, Kumar N, Slattery J, et al. A standardized method for endoscopic necrosectomy improves complication and mortality rates. Pancreatology 2016; 16:66–72.
- Bakker OJ, van Santvoort HC, van Brunschot S, et al; Dutch Pancreatitis Study Group. Endoscopic transgastric vs surgical necrosectomy for infected necrotizing pancreatitis: a randomized trial. JAMA 2012; 307:1053–1061.
KEY POINTS
- Selective and appropriate timing of radiologic imaging is vital in managing necrotizing pancreatitis. Protocols are valuable tools.
- While the primary indication for debridement and drainage in necrotizing pancreatitis is infection, other indications are symptomatic walled-off pancreatic necrosis, intractable abdominal pain, bowel obstruction, and failure to thrive.
- Open surgical necrosectomy remains an important treatment for infected pancreatic necrosis or intractable symptoms.
- A “step-up” approach starting with a minimally invasive procedure and escalating if the initial intervention is unsuccessful is gradually becoming the standard of care.
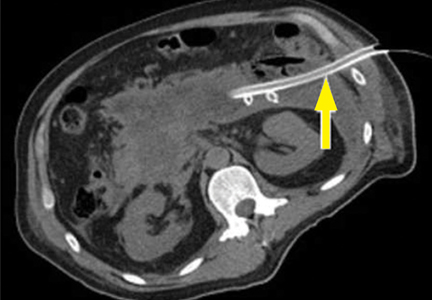
Reducing Readmissions or Length of Stay—Which Is More Important?
Whether robbing banks or reducing healthcare spending, it makes sense to go where the money is. In the case of healthcare, 32% of spending goes to inpatient care, so hospitals represent a logical target for cost-reduction efforts. Because most hospital costs are fixed, there are basically 2 approaches to reducing spending—shorten length of stay or keep patients out of the hospital altogether. The government has tried both, using the power of financial incentives to spur adoption.
Faced with soaring hospital costs in the 1980s, Medicare introduced its prospective payment system, offering hospitals a fixed payment for each specific Diagnosis-Related Group. Hospitals responded by discharging patients sooner, with a resultant rise in admissions to skilled nursing facilities (SNFs) and rapid growth of the home care industry. Length of stay fell dramatically, dropping 9% in 1984 alone.1 It continued to decline through the 1990s, falling by almost 20% between 1993 and 2000. In the following decade, despite the rise of hospital medicine, the rate of decrease slowed to 0.2% per year.2
Attention then turned to readmissions. In 2008, the Medicare Payment Advisory Committee proposed that hospitals with high risk-adjusted readmission rates receive lower payments, arguing that readmissions accounted for $15 billion in Medicare spending and that many were preventable. Thus the Hospital Readmissions Reduction Program was born, introducing readmission penalties in 2012.
Numerous interventions emerged from government and nongovernment parties to reduce readmissions. Many used intensive transitional care programs focusing on early follow-up or medication safety, and some even went as far as providing transitional housing.3 Shortly after passage of the Affordable Care Act, readmission rates fell rapidly. Within a few years, however, the rate of decline slowed dramatically and may have reached a plateau.4 Many have argued that only a small proportion of readmissions are preventable and that there are more direct ways to promote improved discharge planning without diverting resources from other areas.5 It seems that readmissions may not be feasibly reduced much further.
With the advent of accountable care organizations, health systems are now turning their focus to the small population of patients who consume a disproportionate share of healthcare dollars. Because the top 1% of patients—so-called super-utilizers—account for 21% of spending, efforts to reduce their utilization could produce outsized returns.6 Initial anecdotal reports described patients with complex physical, behavior, and social needs receiving fragmented care resulting in myriad expensive admissions. The response comprised teams of social workers and community health workers coupled with robust primary care, formulating individualized solutions. However, data supporting the effectiveness of this common-sense approach are lacking. In addition, our understanding of high-cost patients is evolving. For one thing, being a super-utilizer is often temporary, as just over one-quarter are still in that category a year later.7 Moreover, not all high-cost patients are frequently admitted.8
In this issue of The Journal of Hospital Medicine, Wick et al.9 provide additional insight into high utilizers of hospital services. The authors compare definitions of high utilizers based on cost, number of admissions, or cumulative length of stay over one year. Only 10 percent of high utilizers met all 3 definitions. The overlap between high utilizers by cost and length of stay was twice the overlap between high utilizers by number of admissions and either group. This finding is not surprising because hospitals have high fixed costs, so total cost tends to mirror length of stay.
The study was performed in Canada, and the overlap among these groups may be different in the US. The Canadian patients were hospitalized less frequently than their American counterparts, perhaps reflecting better access to primary care in the Canadian system. Regardless, Wick et al.9 add to the growing literature suggesting that the terms “high utilization” and “high cost” do not always describe the same population. This finding is important because strategies aimed at patients who are frequently admitted may not be effective for those who generate the highest costs. In trying to reduce overall costs, it may be time to revisit length of stay.
Given the long history of prospective payment in the US and the stagnation in length of stay over the past decade, it is reasonable to wonder whether further reductions are possible. In the study by Wick et al.,9 patients with longer lengths of stay were discharged to long-term care facilities. This observation is consistent with others’ reports. Studies of delays in care show that at least 10% of all hospital days can be attributed to delays in discharge, especially to SNFs. In the most recent study, 11% of hospital days were deemed unnecessary by hospitalists, with one-third of those delays due to lack of availability at an extended care facility.10 Six years earlier, Carey et al. found that 13.5% of inpatient days were unnecessary, with more than 60% of delays attributable to waiting for discharge to a SNF.11
How, then, might we curtail unnecessary waiting, and whose job is it to solve the problem? The prospective payment system should reward hospitals for eliminating waiting—particularly those hospitals operating at capacity, for which the opportunity costs of occupied beds are most acute. Hospitalists, per se, have no incentive to discharge patients who are waiting; these patients are easy to round on, rarely have emergencies, and generate daily bills. Even when hospitalists are employed by the hospital and incentives for both are aligned, hospitalists may still be powerless to discharge waiting patients, summon busy consultants, or create extra slots in the endoscopy suite.
The move to value at the system level may offer hope. As health systems become responsible for the total cost of care, their focus must shift from the individual areas where care is provided to the transitions of care between treatment areas. It is in these transitions that US healthcare has failed most spectacularly, and consequently, it is where the greatest opportunity lies.
To date, most discharge interventions have focused on communication, with a goal of improving patient safety and, to a lesser extent, preventing readmissions. Partnering with SNFs can reduce the rate of readmissions,12 but for the most part, the incentives for hospitals and post-acute care facilities remain misaligned. Because post-acute care facilities are paid per diem, they have little incentive to reduce patients’ stays or to admit new patients, who are more expensive to care for than existing ones. Physicians round on SNF patients infrequently and have no incentive to discharge patients, exacerbating the problem. Because post-acute care represents a growing proportion of costs for both medical and surgical patients, health systems will need to either have their own facilities or enter into contracts that align the incentives.
What can hospitalists do? As the predominant coordinators of hospitalized patients’ care both for medical and surgical teams, hospitalists meaningfully impact readmissions and lengths of stay through the care they provide.13 More important, as their roles in optimizing hospital throughput14 continue to expand, hospitalists are perhaps best positioned to observe a diverse range of inefficiencies and inadequacies in inpatient practice and translate those observations into new systems of care. Through thoughtful participation in hospital operations, administration, and health services research, hospitalists hold the key to improving the value of care we provide.
Disclosure
Nothing to report.
1. Davis C, Rhodes DJ. The impact of DRGs on the cost and quality of health care in the United States. Health Policy. 1988;9(2):117-131. PubMed
2. Healthcare Cost and Utilization Project (HCUP). Statistical Brief #180. Overview of Hospital Stays in the United States, 2012. Available at: https://www.hcup-us.ahrq.gov/reports/statbriefs/sb180-Hospitalizations-United-States-2012.pdf. Accessed July 17, 2017.
3. Kansagara D, Chiovaro JC, Kagen D, et al. So many options, where do we start? An overview of the care transitions literature. J Hosp Med. 2016;11(3):221-230. PubMed
4. Zuckerman RB, Sheingold SH, Orav EJ, Ruhter J, Epstein AM. Readmissions, observation, and the Hospital Readmissions Reduction Program. N Engl J Med. 2016;374(16):1543-1551. PubMed
5. Joynt KE, Jha AK. Thirty-day readmissions—truth and consequences. N Engl J Med. 2012;366(15):1366-1369. PubMed
6. Stanton MW, Rutherford MK. Research in Action: The high concentration of U.S. health care expenditures. Agency for Healthcare Research and Quality. Available at: https://meps.ahrq.gov/data_files/publications/ra19/ra19.pdf. Accessed July 17, 2017.
7. Johnson TL, Rinehart DJ, Durfee J, et al. For many patients who use large amounts of health care services, the need is intense yet temporary. Health Aff (Millwood). 2015;34(8):1312-1319. PubMed
8. Lee NS, Whitman N, Vakharia N, PhD GB, Rothberg MB. High-cost patients: hot-spotters don’t explain the half of it. J Gen Intern Med. 2017;32(1):28-34. PubMed
9. Wick JP, Hemmelgarn BR,Manns BJ, et al. Comparison of methods to define high use of inpatient services using population-based data. J Hosp Med. 2017;12(8):596-602. PubMed
10. Kim CS, Hart AL, Paretti RF, et al. Excess hospitalization days in an academic medical center: perceptions of hospitalists and discharge planners. Am J Manag Care. 2011;17(2):e34-42. PubMed
11. Carey MR, Sheth H, Braithwaite RS. A prospective study of reasons for prolonged hospitalizations on a general medicine teaching service. J Gen Intern Med. 2005;20(2):108-115. PubMed
12. Kim LD, Kou L, Hu B, Gorodeski EZ, Rothberg MB. Impact of a connected care model on 30-day readmission rates from skilled nursing facilities. J Hosp Med. 2017;12(4):238-244. PubMed
13. Southern WN, Berger MA, Bellin EY, Hailpern SM, Arnsten JH. Hospitalist care and length of stay in patients requiring complex discharge planning and close clinical monitoring. Arch Intern Med. 2007;167(17):1869-1874. PubMed
14. Chadaga SR, Maher MP, Maller N, et al. Evolving practice of hospital medicine and its impact on hospital throughput and efficiencies. J Hosp Med. 2012;7(8):649-654. PubMed
Whether robbing banks or reducing healthcare spending, it makes sense to go where the money is. In the case of healthcare, 32% of spending goes to inpatient care, so hospitals represent a logical target for cost-reduction efforts. Because most hospital costs are fixed, there are basically 2 approaches to reducing spending—shorten length of stay or keep patients out of the hospital altogether. The government has tried both, using the power of financial incentives to spur adoption.
Faced with soaring hospital costs in the 1980s, Medicare introduced its prospective payment system, offering hospitals a fixed payment for each specific Diagnosis-Related Group. Hospitals responded by discharging patients sooner, with a resultant rise in admissions to skilled nursing facilities (SNFs) and rapid growth of the home care industry. Length of stay fell dramatically, dropping 9% in 1984 alone.1 It continued to decline through the 1990s, falling by almost 20% between 1993 and 2000. In the following decade, despite the rise of hospital medicine, the rate of decrease slowed to 0.2% per year.2
Attention then turned to readmissions. In 2008, the Medicare Payment Advisory Committee proposed that hospitals with high risk-adjusted readmission rates receive lower payments, arguing that readmissions accounted for $15 billion in Medicare spending and that many were preventable. Thus the Hospital Readmissions Reduction Program was born, introducing readmission penalties in 2012.
Numerous interventions emerged from government and nongovernment parties to reduce readmissions. Many used intensive transitional care programs focusing on early follow-up or medication safety, and some even went as far as providing transitional housing.3 Shortly after passage of the Affordable Care Act, readmission rates fell rapidly. Within a few years, however, the rate of decline slowed dramatically and may have reached a plateau.4 Many have argued that only a small proportion of readmissions are preventable and that there are more direct ways to promote improved discharge planning without diverting resources from other areas.5 It seems that readmissions may not be feasibly reduced much further.
With the advent of accountable care organizations, health systems are now turning their focus to the small population of patients who consume a disproportionate share of healthcare dollars. Because the top 1% of patients—so-called super-utilizers—account for 21% of spending, efforts to reduce their utilization could produce outsized returns.6 Initial anecdotal reports described patients with complex physical, behavior, and social needs receiving fragmented care resulting in myriad expensive admissions. The response comprised teams of social workers and community health workers coupled with robust primary care, formulating individualized solutions. However, data supporting the effectiveness of this common-sense approach are lacking. In addition, our understanding of high-cost patients is evolving. For one thing, being a super-utilizer is often temporary, as just over one-quarter are still in that category a year later.7 Moreover, not all high-cost patients are frequently admitted.8
In this issue of The Journal of Hospital Medicine, Wick et al.9 provide additional insight into high utilizers of hospital services. The authors compare definitions of high utilizers based on cost, number of admissions, or cumulative length of stay over one year. Only 10 percent of high utilizers met all 3 definitions. The overlap between high utilizers by cost and length of stay was twice the overlap between high utilizers by number of admissions and either group. This finding is not surprising because hospitals have high fixed costs, so total cost tends to mirror length of stay.
The study was performed in Canada, and the overlap among these groups may be different in the US. The Canadian patients were hospitalized less frequently than their American counterparts, perhaps reflecting better access to primary care in the Canadian system. Regardless, Wick et al.9 add to the growing literature suggesting that the terms “high utilization” and “high cost” do not always describe the same population. This finding is important because strategies aimed at patients who are frequently admitted may not be effective for those who generate the highest costs. In trying to reduce overall costs, it may be time to revisit length of stay.
Given the long history of prospective payment in the US and the stagnation in length of stay over the past decade, it is reasonable to wonder whether further reductions are possible. In the study by Wick et al.,9 patients with longer lengths of stay were discharged to long-term care facilities. This observation is consistent with others’ reports. Studies of delays in care show that at least 10% of all hospital days can be attributed to delays in discharge, especially to SNFs. In the most recent study, 11% of hospital days were deemed unnecessary by hospitalists, with one-third of those delays due to lack of availability at an extended care facility.10 Six years earlier, Carey et al. found that 13.5% of inpatient days were unnecessary, with more than 60% of delays attributable to waiting for discharge to a SNF.11
How, then, might we curtail unnecessary waiting, and whose job is it to solve the problem? The prospective payment system should reward hospitals for eliminating waiting—particularly those hospitals operating at capacity, for which the opportunity costs of occupied beds are most acute. Hospitalists, per se, have no incentive to discharge patients who are waiting; these patients are easy to round on, rarely have emergencies, and generate daily bills. Even when hospitalists are employed by the hospital and incentives for both are aligned, hospitalists may still be powerless to discharge waiting patients, summon busy consultants, or create extra slots in the endoscopy suite.
The move to value at the system level may offer hope. As health systems become responsible for the total cost of care, their focus must shift from the individual areas where care is provided to the transitions of care between treatment areas. It is in these transitions that US healthcare has failed most spectacularly, and consequently, it is where the greatest opportunity lies.
To date, most discharge interventions have focused on communication, with a goal of improving patient safety and, to a lesser extent, preventing readmissions. Partnering with SNFs can reduce the rate of readmissions,12 but for the most part, the incentives for hospitals and post-acute care facilities remain misaligned. Because post-acute care facilities are paid per diem, they have little incentive to reduce patients’ stays or to admit new patients, who are more expensive to care for than existing ones. Physicians round on SNF patients infrequently and have no incentive to discharge patients, exacerbating the problem. Because post-acute care represents a growing proportion of costs for both medical and surgical patients, health systems will need to either have their own facilities or enter into contracts that align the incentives.
What can hospitalists do? As the predominant coordinators of hospitalized patients’ care both for medical and surgical teams, hospitalists meaningfully impact readmissions and lengths of stay through the care they provide.13 More important, as their roles in optimizing hospital throughput14 continue to expand, hospitalists are perhaps best positioned to observe a diverse range of inefficiencies and inadequacies in inpatient practice and translate those observations into new systems of care. Through thoughtful participation in hospital operations, administration, and health services research, hospitalists hold the key to improving the value of care we provide.
Disclosure
Nothing to report.
1. Davis C, Rhodes DJ. The impact of DRGs on the cost and quality of health care in the United States. Health Policy. 1988;9(2):117-131. PubMed
2. Healthcare Cost and Utilization Project (HCUP). Statistical Brief #180. Overview of Hospital Stays in the United States, 2012. Available at: https://www.hcup-us.ahrq.gov/reports/statbriefs/sb180-Hospitalizations-United-States-2012.pdf. Accessed July 17, 2017.
3. Kansagara D, Chiovaro JC, Kagen D, et al. So many options, where do we start? An overview of the care transitions literature. J Hosp Med. 2016;11(3):221-230. PubMed
4. Zuckerman RB, Sheingold SH, Orav EJ, Ruhter J, Epstein AM. Readmissions, observation, and the Hospital Readmissions Reduction Program. N Engl J Med. 2016;374(16):1543-1551. PubMed
5. Joynt KE, Jha AK. Thirty-day readmissions—truth and consequences. N Engl J Med. 2012;366(15):1366-1369. PubMed
6. Stanton MW, Rutherford MK. Research in Action: The high concentration of U.S. health care expenditures. Agency for Healthcare Research and Quality. Available at: https://meps.ahrq.gov/data_files/publications/ra19/ra19.pdf. Accessed July 17, 2017.
7. Johnson TL, Rinehart DJ, Durfee J, et al. For many patients who use large amounts of health care services, the need is intense yet temporary. Health Aff (Millwood). 2015;34(8):1312-1319. PubMed
8. Lee NS, Whitman N, Vakharia N, PhD GB, Rothberg MB. High-cost patients: hot-spotters don’t explain the half of it. J Gen Intern Med. 2017;32(1):28-34. PubMed
9. Wick JP, Hemmelgarn BR,Manns BJ, et al. Comparison of methods to define high use of inpatient services using population-based data. J Hosp Med. 2017;12(8):596-602. PubMed
10. Kim CS, Hart AL, Paretti RF, et al. Excess hospitalization days in an academic medical center: perceptions of hospitalists and discharge planners. Am J Manag Care. 2011;17(2):e34-42. PubMed
11. Carey MR, Sheth H, Braithwaite RS. A prospective study of reasons for prolonged hospitalizations on a general medicine teaching service. J Gen Intern Med. 2005;20(2):108-115. PubMed
12. Kim LD, Kou L, Hu B, Gorodeski EZ, Rothberg MB. Impact of a connected care model on 30-day readmission rates from skilled nursing facilities. J Hosp Med. 2017;12(4):238-244. PubMed
13. Southern WN, Berger MA, Bellin EY, Hailpern SM, Arnsten JH. Hospitalist care and length of stay in patients requiring complex discharge planning and close clinical monitoring. Arch Intern Med. 2007;167(17):1869-1874. PubMed
14. Chadaga SR, Maher MP, Maller N, et al. Evolving practice of hospital medicine and its impact on hospital throughput and efficiencies. J Hosp Med. 2012;7(8):649-654. PubMed
© 2017 Society of Hospital Medicine
Continued Learning in Supporting Value-Based Decision Making
Physicians, researchers, and policymakers aspire to improve the value of healthcare, with reduced overall costs of care and improved outcomes. An important component of increasing healthcare costs in the United States is the rising cost of prescription medications, accounting for an estimated 17% of all spending in healthcare services.1 One potentially modifiable driver of low-value prescribing is poor awareness of medication cost.2 While displaying price to the ordering physician has reduced laboratory order volume and associated testing costs,3,4 applying cost transparency to medication ordering has produced variable results, perhaps reflecting conceptual differences in decision making regarding diagnosis and treatment.4-6
In this issue of the Journal of Hospital Medicine, Conway et al.7 performed a retrospective analysis applying interrupted times series models to measure the impact of passive cost display on the ordering frequency of 9 high-cost intravenous (IV) or inhaled medications that were identified as likely overused. For 7 of the IV medications, lower-cost oral alternatives were available; 2 study medications had no clear therapeutic alternatives. It was expected that lower-cost oral alternatives would have a concomitant increase in ordering rate as the order rate of the study medications decreased (eg, oral linezolid use would increase as IV linezolid use decreased). Order rate was the primary outcome, reported each week as treatment orders per 10,000 patient days, and was compared for both the pre- and postimplementation time periods. The particular methodology of segmented regressions allowed the research team to control for preintervention trends in medication ordering, as well as to analyze both immediate and delayed effects of the cost-display intervention. The research team framed the cost display as a passive approach. The intervention displayed average wholesale cost data and lower-cost oral alternatives on the ordering screen, which did not significantly reduce the ordering rate. Over the course of the study, outside influences led to 2 more active approaches to higher-cost medications, and Conway et al. wisely measured their effect as well. Specifically, the IV pantoprazole ordering rate decreased after restrictions secondary to a national medication shortage, and the oral voriconazole ordering rate decreased following an oncology order set change from oral voriconazole to oral posaconazole. These ordering-rate decreases were not temporally related to the implementation of the cost display intervention.
It is important to note several limitations of this study, some of which the authors discuss in the manuscript. Because 2 of the medications studied (eculizumab and calcitonin) do not have direct therapeutic alternatives, it is not surprising that price display alone would have no effect. The ordering providers who received this cost information had a more complex decision to make than they would in a scenario with a lower-cost alternative, essentially requiring them to ask “Does this patient need this class of medications at all?” rather than simply, “Is a lower-cost alternative appropriate?” Similarly, choosing medication alternatives that would require different routes of administration (ie, IV and oral) may have limited the effectiveness of a price intervention, given that factors such as illness severity also may influence the decision between IV and oral agents. Thus, the lack of an effect for the price display intervention for these specific medications may not be generalizable to all other medication decisions. Additionally, this manuscript offers limited data on the context in which the intervention was implemented and what adaptations, if any, were made based on early findings. The results may have varied greatly based on the visual design and how the cost display was presented within the electronic medical record. The wider organizational context may also have affected the intervention’s impact. A cost-display intervention appearing in isolation could understandably have a different impact, compared with an intervention within the context of a broader cost/value curriculum directed at house staff and faculty.
In summary, Conway et al. found that just displaying cost data did little to change prescribing patterns, but that more active approaches were quite efficacious. So where does this leave value-minded hospitalists looking to reduce overuse? Relatedly, what are the next steps for research and improvement science? We think there are 3 key strategic areas on which to focus. First, behavioral economics offers a critically important middle ground between the passive approaches studied here and more heavy-handed approaches that may limit provider autonomy, such as restricting drug use at the formulary.8 An improved choice architecture that presents the preferred higher-value option as the default selection may result in improved adoption of the high-value choice while also preserving provider autonomy and expertise required when clinical circumstances make the higher-cost drug the better choice.9,10 The second consideration is to minimize ethical tensions between cost displays that discourage use and a provider’s belief that a treatment is beneficial. Using available ethical frameworks for high-value care that engage both patient and societal concerns may help us choose and design interventions with more successful outcomes.11 Finally, research has shown that providers have poor knowledge of both cost and the relative benefits and harms of treatments and testing.12 Thus, the third opportunity for improvement is to provide appropriate clinical information (ie, relative therapeutic equivalency or adverse effects in alternative therapies) to support decision making at the point of order entry. Encouraging data already exists regarding how drug facts boxes can help patients understand benefits and side effects.13 A similar approach may aid physicians and may prove an easier task than improving patient understanding, given physicians’ substantial existing knowledge. These strategies may help guide providers to make a more informed value determination and obviate some ethical concerns related to clinical decisions based on cost alone. Despite their negative results, Conway et al.7 provided additional evidence that influencing complex decision making is not easy. However, we believe that continuing research into the factors that lead to successful value interventions has incredible potential for supporting high-value decision making in the future.
Disclosure
Nothing to report.
1. Kesselheim AS, Avorn J, Sarpatwari A. The high cost of prescription drugs in the United States: origins and prospects for reform. JAMA. 2016;316(8):858-871. PubMed
2. Allan GM, Lexchin J, Wiebe N. Physician awareness of drug cost: a systematic review. PLoS Med. 2007;4(9):e283. PubMed
3. Feldman LS, Shihab HM, Thiemann D, et al. Impact of providing fee data on laboratory test ordering: a controlled clinical trial. JAMA Intern Med. 2013;173(10):903-908. PubMed
4. Silvestri MT, Bongiovanni TR, Glover JG, Gross CP. Impact of price display on provider ordering: a systematic review. J Hosp Med. 2016;11(1):65-76. PubMed
5. Guterman JJ, Chernof BA, Mares B, Gross-Schulman SG, Gan PG, Thomas D. Modifying provider behavior: a low-tech approach to pharmaceutical ordering. J Gen Intern Med. 2002;17(10):792-796. PubMed
6. Goetz C, Rotman SR, Hartoularos G, Bishop TF. The effect of charge display on cost of care and physician practice behaviors: a systematic review. J Gen Intern Med. 2015;30(6):835-842. PubMed
7. Conway SJ, Brotman DJ, Merola D, et al. Impact of displaying inpatient pharmaceutical costs at the time of order entry: lessons from a tertiary care center. J Hosp Med. 2017;12(8):639-645. PubMed
8. Thaler RH, Sunstein CR. Nudge: improving decisions about health, wealth, and happiness. New Haven: Yale University Press: 2008.
9. Halpern SD, Ubel PA, Asch DA. Harnessing the power of default options to improve health care. N Engl J Med. 2007;357(13):1340-1344. PubMed
10. Dexter PR, Perkins S, Overhage JM, Maharry K, Kohler RB, McDonald CJ. A computerized reminder system to increase the use of preventive care for hospitalized patients. N Engl J Med. 2001;345(13):965-970. PubMed
11. DeCamp M, Tilburt JC. Ethics and high-value care. J Med Ethics. 2017;43(5):307-309. PubMed
12. Hoffmann TC, Del Mar C. Clinicians’ expectations of the benefits and harms of treatments, screening, and tests: a systematic review. JAMA Intern Med. 2017;177(3):407-419. PubMed
13. Schwartz LM, Woloshin S, Welch HG. Using a drug facts box to communicate drug benefits and harms: two randomized trials. Ann Intern Med. 2009;150(8):516-527. PubMed
Physicians, researchers, and policymakers aspire to improve the value of healthcare, with reduced overall costs of care and improved outcomes. An important component of increasing healthcare costs in the United States is the rising cost of prescription medications, accounting for an estimated 17% of all spending in healthcare services.1 One potentially modifiable driver of low-value prescribing is poor awareness of medication cost.2 While displaying price to the ordering physician has reduced laboratory order volume and associated testing costs,3,4 applying cost transparency to medication ordering has produced variable results, perhaps reflecting conceptual differences in decision making regarding diagnosis and treatment.4-6
In this issue of the Journal of Hospital Medicine, Conway et al.7 performed a retrospective analysis applying interrupted times series models to measure the impact of passive cost display on the ordering frequency of 9 high-cost intravenous (IV) or inhaled medications that were identified as likely overused. For 7 of the IV medications, lower-cost oral alternatives were available; 2 study medications had no clear therapeutic alternatives. It was expected that lower-cost oral alternatives would have a concomitant increase in ordering rate as the order rate of the study medications decreased (eg, oral linezolid use would increase as IV linezolid use decreased). Order rate was the primary outcome, reported each week as treatment orders per 10,000 patient days, and was compared for both the pre- and postimplementation time periods. The particular methodology of segmented regressions allowed the research team to control for preintervention trends in medication ordering, as well as to analyze both immediate and delayed effects of the cost-display intervention. The research team framed the cost display as a passive approach. The intervention displayed average wholesale cost data and lower-cost oral alternatives on the ordering screen, which did not significantly reduce the ordering rate. Over the course of the study, outside influences led to 2 more active approaches to higher-cost medications, and Conway et al. wisely measured their effect as well. Specifically, the IV pantoprazole ordering rate decreased after restrictions secondary to a national medication shortage, and the oral voriconazole ordering rate decreased following an oncology order set change from oral voriconazole to oral posaconazole. These ordering-rate decreases were not temporally related to the implementation of the cost display intervention.
It is important to note several limitations of this study, some of which the authors discuss in the manuscript. Because 2 of the medications studied (eculizumab and calcitonin) do not have direct therapeutic alternatives, it is not surprising that price display alone would have no effect. The ordering providers who received this cost information had a more complex decision to make than they would in a scenario with a lower-cost alternative, essentially requiring them to ask “Does this patient need this class of medications at all?” rather than simply, “Is a lower-cost alternative appropriate?” Similarly, choosing medication alternatives that would require different routes of administration (ie, IV and oral) may have limited the effectiveness of a price intervention, given that factors such as illness severity also may influence the decision between IV and oral agents. Thus, the lack of an effect for the price display intervention for these specific medications may not be generalizable to all other medication decisions. Additionally, this manuscript offers limited data on the context in which the intervention was implemented and what adaptations, if any, were made based on early findings. The results may have varied greatly based on the visual design and how the cost display was presented within the electronic medical record. The wider organizational context may also have affected the intervention’s impact. A cost-display intervention appearing in isolation could understandably have a different impact, compared with an intervention within the context of a broader cost/value curriculum directed at house staff and faculty.
In summary, Conway et al. found that just displaying cost data did little to change prescribing patterns, but that more active approaches were quite efficacious. So where does this leave value-minded hospitalists looking to reduce overuse? Relatedly, what are the next steps for research and improvement science? We think there are 3 key strategic areas on which to focus. First, behavioral economics offers a critically important middle ground between the passive approaches studied here and more heavy-handed approaches that may limit provider autonomy, such as restricting drug use at the formulary.8 An improved choice architecture that presents the preferred higher-value option as the default selection may result in improved adoption of the high-value choice while also preserving provider autonomy and expertise required when clinical circumstances make the higher-cost drug the better choice.9,10 The second consideration is to minimize ethical tensions between cost displays that discourage use and a provider’s belief that a treatment is beneficial. Using available ethical frameworks for high-value care that engage both patient and societal concerns may help us choose and design interventions with more successful outcomes.11 Finally, research has shown that providers have poor knowledge of both cost and the relative benefits and harms of treatments and testing.12 Thus, the third opportunity for improvement is to provide appropriate clinical information (ie, relative therapeutic equivalency or adverse effects in alternative therapies) to support decision making at the point of order entry. Encouraging data already exists regarding how drug facts boxes can help patients understand benefits and side effects.13 A similar approach may aid physicians and may prove an easier task than improving patient understanding, given physicians’ substantial existing knowledge. These strategies may help guide providers to make a more informed value determination and obviate some ethical concerns related to clinical decisions based on cost alone. Despite their negative results, Conway et al.7 provided additional evidence that influencing complex decision making is not easy. However, we believe that continuing research into the factors that lead to successful value interventions has incredible potential for supporting high-value decision making in the future.
Disclosure
Nothing to report.
1. Kesselheim AS, Avorn J, Sarpatwari A. The high cost of prescription drugs in the United States: origins and prospects for reform. JAMA. 2016;316(8):858-871. PubMed
2. Allan GM, Lexchin J, Wiebe N. Physician awareness of drug cost: a systematic review. PLoS Med. 2007;4(9):e283. PubMed
3. Feldman LS, Shihab HM, Thiemann D, et al. Impact of providing fee data on laboratory test ordering: a controlled clinical trial. JAMA Intern Med. 2013;173(10):903-908. PubMed
4. Silvestri MT, Bongiovanni TR, Glover JG, Gross CP. Impact of price display on provider ordering: a systematic review. J Hosp Med. 2016;11(1):65-76. PubMed
5. Guterman JJ, Chernof BA, Mares B, Gross-Schulman SG, Gan PG, Thomas D. Modifying provider behavior: a low-tech approach to pharmaceutical ordering. J Gen Intern Med. 2002;17(10):792-796. PubMed
6. Goetz C, Rotman SR, Hartoularos G, Bishop TF. The effect of charge display on cost of care and physician practice behaviors: a systematic review. J Gen Intern Med. 2015;30(6):835-842. PubMed
7. Conway SJ, Brotman DJ, Merola D, et al. Impact of displaying inpatient pharmaceutical costs at the time of order entry: lessons from a tertiary care center. J Hosp Med. 2017;12(8):639-645. PubMed
8. Thaler RH, Sunstein CR. Nudge: improving decisions about health, wealth, and happiness. New Haven: Yale University Press: 2008.
9. Halpern SD, Ubel PA, Asch DA. Harnessing the power of default options to improve health care. N Engl J Med. 2007;357(13):1340-1344. PubMed
10. Dexter PR, Perkins S, Overhage JM, Maharry K, Kohler RB, McDonald CJ. A computerized reminder system to increase the use of preventive care for hospitalized patients. N Engl J Med. 2001;345(13):965-970. PubMed
11. DeCamp M, Tilburt JC. Ethics and high-value care. J Med Ethics. 2017;43(5):307-309. PubMed
12. Hoffmann TC, Del Mar C. Clinicians’ expectations of the benefits and harms of treatments, screening, and tests: a systematic review. JAMA Intern Med. 2017;177(3):407-419. PubMed
13. Schwartz LM, Woloshin S, Welch HG. Using a drug facts box to communicate drug benefits and harms: two randomized trials. Ann Intern Med. 2009;150(8):516-527. PubMed
© 2017 Society of Hospital Medicine
The Impact of Checklists on Inpatient Safety Outcomes: A Systematic Review of Randomized Controlled Trials
In response to widely publicized reports highlighting the challenges of suboptimal quality of healthcare, improving patient safety has been a leading healthcare initiative for more than 10 years.1-4 Numerous strategies to improve patient safety have been proposed,5-9 but improvements have been limited, which raises questions about whether the right approaches are being employed.10,11
Checklists have served as a foundation for the standardization and safety of aviation and nuclear power12,13 and are advocated as simple and effective instruments for ensuring safe care.7,14,15 Systematic reviews of observational studies suggest that checklists can reduce medical errors and adverse events,15-19 but these reviews are at risk of bias due to the limitations of observational methods. Furthermore, discordant results of recent high-profile evaluations of the World Health Organization (WHO) Surgical Safety Checklist highlight the need for checklist evaluations using rigorous study designs.20-22 Therefore, we sought to conduct a systematic review of RCTs (randomized controlled trials) to determine whether checklists, as a type of decision-support tool, are effective at improving patient safety outcomes in hospitalized patients.
METHODS
The study protocol was registered with the PROSPERO Register of Systematic Reviews (registration number: CRD42016037441) and developed according to the Preferred Reporting Items in Systematic Reviews and Meta-analyses (PRISMA) statement.23
Search Strategy
On December 8, 2016, we systematically searched Ovid MEDLINE, Ovid EMBASE, PubMed, and the Cochrane Central Register of Controlled Trials. The search was performed using no language or publication date restrictions and included 2 groups of terms (key words with similar characteristics): ‘checklists’ and ‘patient outcomes assessment’. We restricted our search to patient outcomes because these are more patient-oriented than the proximal processes of care that may not translate into outcomes. The search was restricted to RCTs using the Cochrane Highly Sensitive Search Strategy for Identifying Randomized Trials from the Cochrane Collaborative.24 The MEDLINE search strategy is depicted in Appendix I (Supplementary File 1). Reference lists of included articles were manually searched for additional publications. The search strategy was designed with the help of an information scientist (DL). EndNote X7 (Thomas Reuters, Philadelphia, PA, USA) was the reference software used for the management of citations.
Eligibility Criteria
We selected all studies reporting patient safety outcomes of a checklist intervention, using the following inclusion criteria: 1) acute care hospital inpatient population, 2) checklist intervention, 3) contain a control group (ie, no checklist), 4) report one or more patient safety outcome, as defined by the authors (eg, medical errors, adverse events, mortality), and 5) RCT design. We restricted our focus to inpatient populations given the heterogeneity of illness and patient care between acute and community settings. We defined a checklist as a tool that details the essential steps of a task, requiring the target provider to indicate whether an item was completed or not.1,7 Tools that included only 1 item (eg, electronic prompts) or did not require acknowledgement of the items (eg, guidelines) were excluded. We defined patient safety outcomes as the authors’ definition of patient safety (eg, medical error, adverse event, provider compliance with safety regulations).
Study Selection
Two reviewers (JMB, GW) independently, and in duplicate, reviewed the titles and abstracts of the retrieved citations against the eligibility criteria. The same 2 reviewers subsequently reviewed the full text of relevant articles for inclusion. Eligibility disagreements were resolved by consensus. A Kappa statistic was calculated for reviewer agreement of full-text screening.25 Reviewers were not blinded to author or journal names.26
Data Extraction
The structured data extraction form was calibrated using the first 2 articles. The 2 reviewers (JMB, GW) independently, and in duplicate, extracted data from included studies on the study characteristics, setting, study population, sample size, intervention used, outcomes examined, analytic method, and study quality. The data extraction form is depicted in Appendix II (Supplementary File 2). Coding discrepancies were resolved by consensus.
Quality Assessment
The 2 reviewers (JMB, GW) extracted data on study quality independently and in duplicate using 2 approaches. First, reviewers assessed study quality using a component method derived from the Cochrane Collaboration criteria.24 For each included study, the reviewers documented if the authors had adequately described inclusion/exclusion criteria, randomization, allocation concealment, blinding of participants/outcome assessors, attrition, cross over, baseline characteristics, and power calculation. Second, the reviewers calculated and reported the Jadad score for each included study, a validated assessment scale that assigns points (1 to 5) based on randomization, blinding, and attrition.27
Analysis
Owing to the heterogeneity of the data and the small number of studies that satisfied the inclusion criteria, the data were analyzed using guidelines for the narrative synthesis of a systematic review.28 Descriptive statistical findings from each included study were reported. The DerSimonian and Laird method for random-effects models was used to calculate a pooled estimate of 30-day all-cause mortality from the raw data available from a subset of studies (number of events, study population).29 Stata SE version 13.1 (Stata Corp, LP, College Station, TX) was used to perform the statistical analyses.
RESULTS
The literature search identified 11,225 unique citations from which 83 abstracts were eligible for full-text review. We identified 9 full-text articles for inclusion in the review (Figure 1 [Supplementary File 3]). The main reasons for citation exclusion during the full-text review were that the study design was not an RCT (39%) or there was no checklist intervention (34%
Study Characteristics
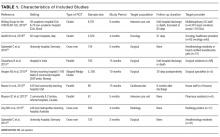

Characteristics of the included studies are summarized in Tables 1 and 2. Six of the studies were conducted in at least 1teaching hospital.30-35 The studies varied in target populations for both the checklist user and patients. The outcomes reported varied; 3 studies examined 30-day mortality,21,30,36 4 studies examined hospital length of stay,21,30,33,36 and 2 studies reported user compliance with the checklist.21,31 Five of the studies reported patient outcomes,21,30,33,35,36 and 5 studies reported provider-level outcomes related to patient safety (eg, compliance with checklist items such as communication of medications, isolation precautions, etc.).31-34,37
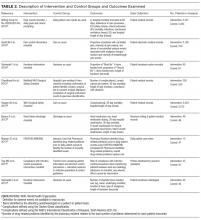
Description of Checklists

Supplementary File 4 (Table 3) provides a detailed breakdown of the checklists’ purpose and components. Six of the checklists were designed to directly reduce patient safety events,21,30,33,35-37 whereas 3 of the checklists were designed to indirectly reduce patient safety events by increasing compliance with processes of care.31,32,34 Six checklists were constructed and pilot tested by the research team conducting the RCT30-35 and the 3 remaining studies used modified versions of previously validated checklists.21,36,37 The number of items included in the checklist ranged from 2 to 54.
Impact of the Checklist
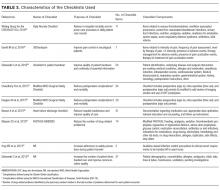
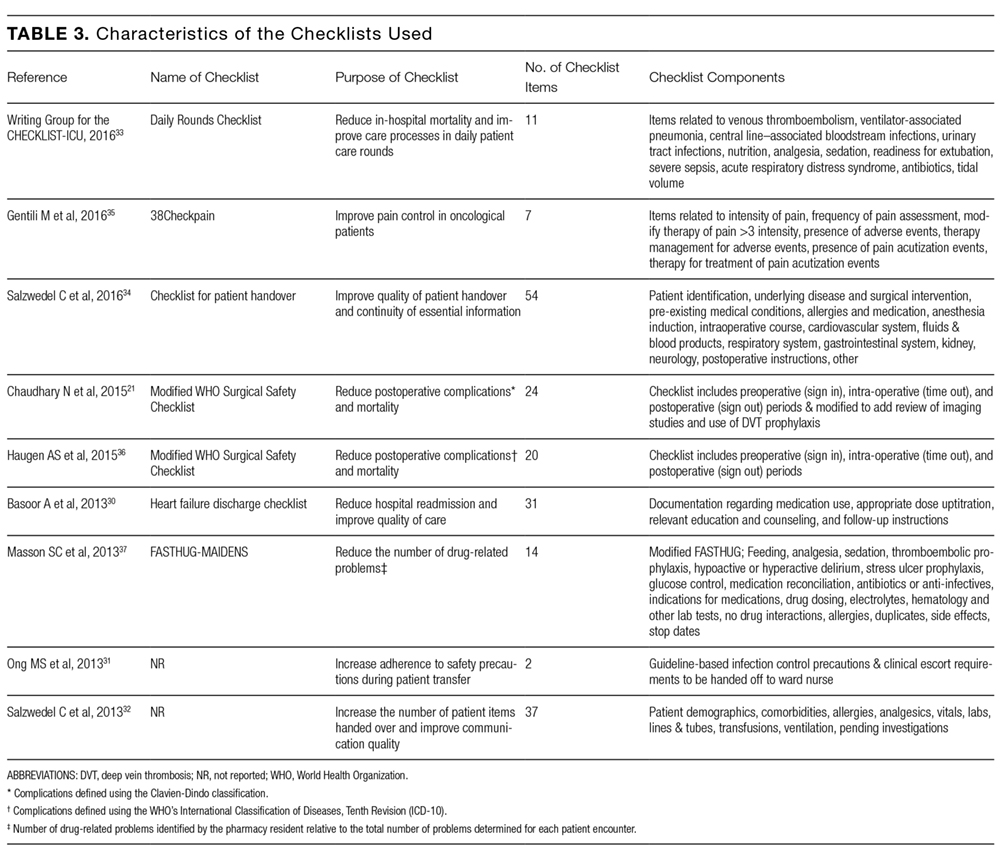
Table 4 summarizes the adverse events, medical errors, resource utilization and/or compliance reported for each checklist. Chaudhary et al. reported significant decreases in Grade III (requiring intervention)38 and IV (life-threatening)38 postoperative complications (23% v. 33%, P = 0.04) and 30-day mortality (5.7% vs 10.0%, P = 0.04) for patients assigned to the Modified WHO Surgical Safety Checklist compared to controls.21 Conversely, Haugen et al. reported a nonsignificant reduction in 30-day mortality between the WHO Surgical Safety Checklist group and controls (1.0% vs 1.6%, P = 0.151).36 Bassor et al. reported no significant difference in 30-day hospital readmission for decompensated heart failure for the heart failure discharge checklist group when compared to controls (6% vs. 4%, P = NS); however, an exploratory analysis that excluded patients who died during the follow-up period found a significant difference in 30-day readmission rates (2% vs. 20%, P = 0.02).30 Gentili et al. reported a higher proportion of patients with pain control in the checklist group compared to the controls (67.6% vs. 54.8%), as well as fewer incidents of analgesic therapy–related uncontrolled adverse events (25.9% vs. 49.9%); however, the statistical significance of these differences were not reported.35 The Writing Group for CHECKLIST-ICU reported no significant difference for in-hospital mortality between the checklist and control groups (adjusted odds ratio [AOR] 1.02, 95% CI, 0.82-1.26, P = 0.88), nor for the secondary clinical outcomes examined (Table 4).33 However, there was a significant difference between the checklist group and control group for 3 of the 7 outcomes related to processes of patient care, including a reduction in the use of both urinary catheters (adjusted rate ratio [ARR] 0.86, 95% CI, 0.80-0.93, P < 0.001) and central venous catheters (ARR 0.90, 95% CI 0.83-0.98, P = 0.02). Masson et al. reported that when using the FASTHUG-MAIDENS checklist, more drug-related problems were identified by pharmacy residents (in relation to the number identified by the ICU pharmacist) both per patient encounter (P = 0.008) and overall (P < 0.001).37 Ong et al. reported higher rates of compliance with isolation precautions for infectious diseases in the checklist group (71% vs. 38%, P < 0.01); however, compliance with the checklist was low (40%) and qualitative analyses found participants were dissatisfied with the checklist.31 Salzwedel et al. reported the number of items handed over by anesthesia residents postoperatively to be higher in the checklist group than the control group (48.7% vs. 32.4%, P < 0.001).32 In a more recent study, Salzwedel et al. reported that proportion of items deemed by the attending anesthesiologist as “must be handed over” were more often actually handed over by the anesthesia residents assigned to the checklist group when compared to controls (87.1% vs. 75.0%, P = 0.005).34
30-day Mortality
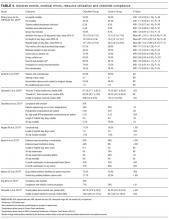
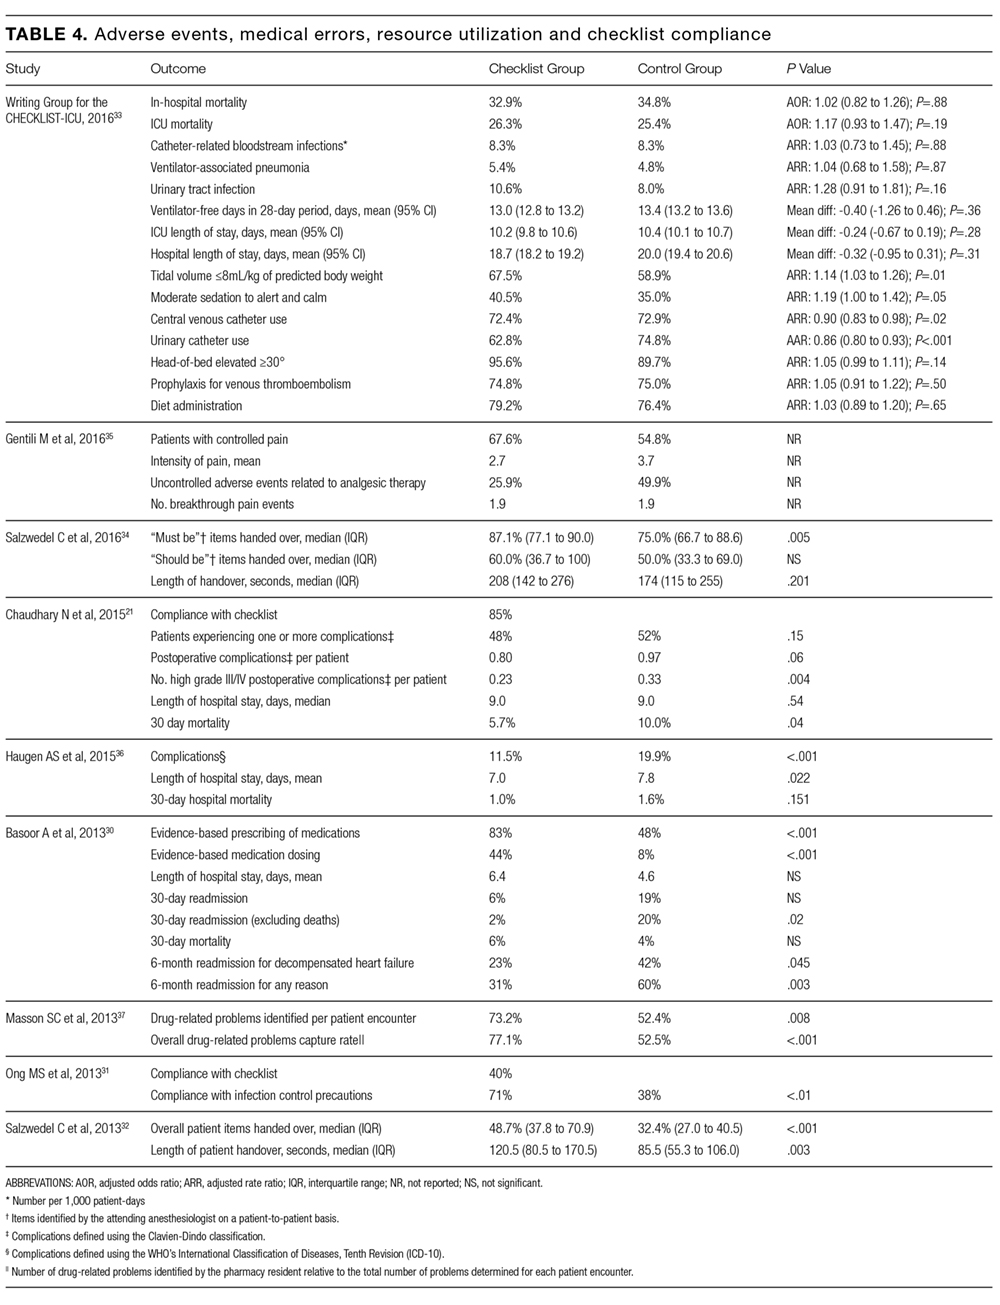
A random-effects model pooling data from the 3 studies that reported data for 30-day all cause mortality suggested a significant reduction with use of a checklist (OR 0.60, 95% CI, 0.41-0.89; P = 0.01, I2 = 0.0%, P = 0.573).
Study Quality
Supplementary File 5 (Table 5) summarizes the quality assessment of the 9 studies. The clarity of description for each intervention varied. All studies reported inclusion/exclusion criteria and randomization procedures. Three studies indicated that outcome assessors were blinded to intervention allocation;32,34,36 while this was unclear in 2 studies.21,30 Three studies reported baseline characteristics.21,30,36 Two studies reported power calculations;33,37 however, one study had a sample size that was less than that required to achieve the target power.37 The Jadad scores ranged from 1to 5.
DISCUSSION
This systematic review identified 9 RCTs that examined the impact of a checklist on patient safety outcomes in hospitalized patients. The studies employed checklists with different purposes and elements and measured different patient safety outcomes. The methodological quality of the included studies was moderate. In aggregate, the results suggest that checklists may be effective at improving patient safety outcomes, but the small number of moderate quality studies and the heterogeneity of interventions and outcome measures suggests that there is an urgent need for further evaluation.
The most important observation from our systematic review is the paucity of high quality evidence evaluating checklists’ impact on patient safety outcomes in acute inpatient care. The implementation of checklists is increasingly common as they are relatively low cost to develop and implement, and intuitively make sense. This is particularly true in an era of increasing efforts to standardize care as a means for improving quality and minimizing cost (ie, previous systematic reviews cite 38 unique studies).39 However, implementation of an inadequately tested checklist risks unintended consequences (eg, inefficient resource utilization).18 The small number of RCTs identified might be owing to quality improvement efforts traditionally focusing on ‘real life’ applicability over rigorous research methodology.40 The translation of evidence into clinical practice is known to be slow;41 however, these more rigorous methodologies reduce the risk of biases and generate high-quality evidence, which help to fulfill the necessity to identify best practices while avoiding these unintended consequences.
The studies varied both in the approaches used to develop checklists and in the number of items included (ranging from 2 to 54). What is the optimal method for developing a checklist and how does this impact their effectiveness?42 The answers to these questions are not known. However, this review highlights some important issues to consider when developing a checklist. As the number of items or complexity of a task increases, our ability to efficiently perform the task without aid decreases.43-45 As such, a well-designed checklist should detail explicit instructions on the what, where, when, and how of a given task in a fashion that ensures a consistent accuracy for completing the work.5 It is recommended that construction of a checklist follow the principles of human factors engineering: engage stakeholders and human factors experts in the design; are developed based on user needs and realities; list items in order of importance; are concise and subgroup sections of checklists by task or chronological order; ensure usability and evaluate potential negative consequences (eg time to complete); are pilot tested and validated before implementation; are updated as needed based the on generation of new findings or changes in operational procedures.46 These general principles of human factors engineering46 provide a practical approach for the development and evaluation of a checklist. In addition, standardization of operational definitions (ie, process, outcome, compliance) is important for study replication and robust meta-analyses.
Checklists used in aviation are perhaps best known12 and the evidence of their effectiveness is derived from the attribution of aviation errors to incomplete checklists.12 Although more recently implemented in medicine, checklists have the potential to guide the successful completion of complex tasks in healthcare.7 Systematic reviews of observational studies have been conducted for specific checklists (eg, WHO Surgical Safety Checklist) and for select patient populations (eg, surgical patients), and the number of included studies ranges from 7-27 (n = 38 unique studies).15,16,18,19 For example, Gillespie et al. in a systematic review and meta-analysis reported the implementation of Surgical Safety Checklists to be associated with a reduction in postoperative complications (relative risk [RR] 0.63, 95% CI, 0.58-0.72, P = < 0.001), but not mortality (RR 1.03, 95% CI, 0.73-1.4, P = 0.857).19 Similarly, Treadwell et al. reported in a systematic review of Surgical Safety Checklists that while data are promising, more evaluation of their impact on clinical outcomes is needed.18 These recommendations are nicely illustrated by Urbach et al.’s20 and O’Leary et al.’s47 evaluations of the mandatory adoption of Surgical Safety Checklists across all hospitals in Ontario, Canada, which respectively demonstrated no significant reductions in 30-day perioperatively conplications for both adult (OR 0.97, 95% CI, 0.90-1.03, P = 0.29) and pediatric (AOR 1.01, 95% CI, 0.90-1.14, P = 0.9) patients. These data not only highlight the need for further evaluation of checklists but are also a reminder that checklists and their associated implementation strategies are complex interventions for which there may be important differences between the efficacy reported in clinical trials and the effectiveness reported in implementation studies.48 This all suggests that if checklists are to be effective in improving patient safety, process evaluations of implementation49 and realist reviews of published studies50 may be important to determine optimal approaches for implementation. We believe that, based on the limited currently available evidence, there is urgency for further robust evaluations of checklists before their widespread implementation. If effective, they should be widely implemented. If ineffective, they should be abandoned to minimize unintended consequences and inefficient use of resources.
There are 4 primary limitations to this review that should be considered when interpreting the findings. First, the RCT design is not the study design employed by most quality improvement initiatives.40 While some quality improvement experts may argue that an RCT design is insufficiently flexible for applied settings, it does minimize the risk of biased assessments of intervention effectiveness. Second, our search strategy included an RCT filter. The filter helped restrict the number of citations to be reviewed (n = 11,225) but could have resulted in improperly indexed studies being excluded. To guard against this risk, we used the validated Cochrane Highly Sensitive Search Strategy for Identifying Randomized Trials,24 reviewed reference lists of citations included in the review, and solicited suggestions for missing studies from quality improvement experts. Third, our review was restricted to hospitalized patients. Although the studies evaluated commonly reported safety outcomes across patients with diverse clinical conditions, care settings, and providers that broadly reflect hospital-based care, evaluations of checklists in additional patient and provider groups are needed (eg, hospitalists). Furthermore, the effectiveness of checklists for improving patient safety outcomes in outpatients is important; however, the organizational and patient characteristics of these 2 settings (hospitalized vs outpatient) are sufficiently different to warrant separate systematic reviews. Finally, owing to the heterogeneity of the checklists used and outcomes measured, we were unable to perform a robust meta-analysis. Heterogeneity, combined with the small number of studies identified in our search, prevented us from applying statistical methods to assess for publication bias. This limitation of our systematic review highlights an important gap in the literature and emphasizes the importance of additional primary research to evaluate checklists.
In summary, we identified few RCTs that examined checklists designed to improve patient safety outcomes. The small number of existing studies suggests that checklists may improve patient safety outcomes; however, these observations were not reported for all outcomes examined and the studies were heterogeneous and of limited methodological quality. There is an urgent need for high-quality evaluations of the effectiveness of patient safety checklists in inpatient healthcare settings to substantiate their perceived benefits.
Acknowledgments
We would like to thank Diane Lorenzetti for her help with the development of the search strategy.
Disclosure: The authors have no known conflicts of interest to declare.
Jamie Boyd was supported by a W21C – Alberta Innovates-Health Solutions (AIHS) Collaborative Research and Innovation Opportunities (CRIO) Health Services Research graduate studentship. Guosong Wu was supported by a Western Regional Training Centre (WRTC) for Health Services Research graduate studentship. Dr. Stelfox was supported by a Population Health Investigator Award from Alberta Innovates Health Solutions.
Authors’ Contributions
HTS was responsible for the study’s conception. All 3 authors contributed to the study’s design and interpretation. JB and GW were responsible for searching the literature, reviewing abstracts, selecting full-text articles and critically appraising them. All 3 authors performed the analyses. JB drafted the manuscript and all 3 authors assisted in the successive revisions of the final manuscript. All authors have read and approved the final manuscript.
1. World Health Organization. Patient safety. Available at: http://www.who.int/patientsafety/about/en/. Accessed June 21, 2016.
2. Institute of Medicine. To err is human: Building a safer health system. In: Kohn L, Corrigan J, Donaldson M, eds. Institute of Medicine-Committee on Quality of Health Care in America. Washington DC: National Academy Press; 1999:86-101. PubMed
3. Institute of Medicine Committee on the Quality of Health Care in America. Crossing the quality chasm: A new health system for the 21st century. Washington DC: National Academy Press; 2001. PubMed
4. Stelfox HT, Palmisani S, Scurlock C, Orav EJ, Bates DW. The “to err is human” report and the patient safety literature. Qual Saf Health Care. 2006; 15(3):174-178. PubMed
5. Winters BD, Gurses AP, Lehmann H, Sexton JB, Rampersad CJ, Pronovost, PJ. Clinical review: Checklists - translating evidence into practice. Crit Care. 2009; 13(6):210. PubMed
6. Ely EW, Bennett PA, Bowton DL, Murphy SM, Florance AM, Haponik EF. Large scale implementation of a respiratory therapist-driven protocol for ventilator weaning. Am J Respir Crit Care Med. 1999; 159(2):439-446. PubMed
7. Gawande A. The checklist manifesto: How to get things right. Great Britain: Profile Books LTD; 2010.
8. Pronovost P, Vohr E. Safe patients, smart hospitals. New York, NY: Hudson Street Press; 2010.
9. Hughes RG. Advances in patient safety: Tools and strategies for quality improvement and patient safety. In: Hughes RG, ed. Patient safety and quality: An evidence-based handbook for nurses. Rockville (MD): Agency for Healthcare Research and Quality (US); 2008. PubMed
10. Henriksen K, Oppenheimer C, Leape LL, et al. Envisioning patient safety in the year 2025: Eight perspectives. In: Henriksen K, Battles JB, Keyes MA, et al., eds. Advances in patient safety: New directions and alternative approaches. Rockville, MD: Agency for Healthcare Research and Quality; 2008. PubMed
11. Gaba DM, Howard SK. Patient safety: Fatigue among clinicians and the safety of patients. N Engl J Med. 2002; 347(16):1249-1255. PubMed
12. Degani A, Wiener EL. Cockpit checklists: Concepts, design, and use. Human Factors: The Journal of the Human Factors and Ergonomics Society 1993; 35(2):345-359.
13. Swain AD, Guttmann HE. Handbook of human reliability analysis with emphasis on nuclear power plant applications: Final report. Washington, DC: U.S. Nuclear Regulatroy Commission; 1983.
14. de Vries EN, Prins HA, Crolla RM, et al. Effect of a comprehensive surgical safety system on patient outcomes. N Engl J Med. 2010; 363(20):1928-1937. PubMed
15. Bergs J, Hellings J, Cleemput I, et al. Systematic review and meta-analysis of the effect of the world health organization surgical safety checklist on postoperative complications. Br J Surg. 2014; 101(3):150-158. PubMed
16. Pucher PH, Johnston MJ, Aggarwal R, Arora S, Darzi A. Effectiveness of interventions to improve patient handover in surgery: A systematic review. Surgery. 2015; 158(1):85-95. PubMed
17. Bergs J, Lambrechts F, Simons P, et al. Barriers and facilitators related to the implementation of surgical safety checklists: A systematic review of the qualitative evidence. BMJ Qual Saf. 2015; 23(12):776-786. PubMed
18. Treadwell JR, Lucas S, Tsou AY. Surgical checklists: A systematic review of impacts and implementation. BMJ Qual Saf. 2014; 23(4):299-318. PubMed
19. Gillespie BM, Chaboyer W, Thalib L, John M, Fairweather N, Slater K. Effect of using a safety checklist on patient complications after surgery: A systematic review and meta-analysis. Anesthesiology. 2014; 120(6):1380-1389. PubMed
20. Reames BN, Krell RW, Campbell DA Jr, Dimick JB. A checklist-based intervention to improve surgical outcomes in michigan: Evaluation of the keystone surgery program. JAMA Surg. 2015; 150(3):208-215. PubMed
21. Chaudhary N, Varma V, Kapoor S, Mehta N, Kumaran V, Nundy S. Implementation of a surgical safety checklist and postoperative outcomes: A prospective randomized controlled study. J Gastrointest Surg. 2015; 19(5):935-942. PubMed
22. Reames BN, Krell RW, Campbell DA, Jr., Dimick JB. A checklist-based intervention to improve surgical outcomes in Michigan: Evaluation of the Keystone Surgery program. JAMA surgery. 2015; 150(3):208-215. PubMed
23. Liberati A, Altman DG, Tetzlaff J, et al. The prisma statement for reporting systematic reviews and meta-analyses of studies that evaluate health care interventions: Explanation and elaboration. Ann Intern Med. 2009; 151(4):W65-94. PubMed
24. The Cochrane Collaboration. Cochrane handbook for systematic reviews of interventions, version 5.1.0. Oxford, UK: The Cochrane Collaboration, 2011.
25. Landis JR, Koch GG. The measurement of observer agreement for categorical data. Biometrics. 1977; 33(1):159-174. PubMed
26. Berlin JA. Does blinding of readers affect the results of meta-analyses? University of pennsylvania meta-analysis blinding study group. Lancet 1997;350(9072):185-186. PubMed
27. Jadad AR, Moore RA, Carroll D, et al. Assessing the quality of reports of randomized clinical trials: Is blinding necessary? Control Clin Trials 1996;17(1):1-12. PubMed
28. Popay J, Roberts H, Sowden A, et al. Guidance on the conduct of narrative synthesis in systematic reviews: A product form the esrc methods programme. Available at: https://www.researchgate.net/profile/Mark_Rodgers4/publication/233866356_Guidance_on_the_conduct_of_narrative_synthesis_in_systematic_reviews_A_product_from_the_ESRC_Methods_Programme/links/02e7e5231e8f3a6183000000.pdf. Accessed June 17, 2016.
29. DerSimonian R, Laird N. Meta-analysis in clinical trials. Control Clin Trials. 1986; 7(3):177-188. PubMed
30. Basoor A, Doshi NC, Cotant JF, et al. Decreased readmissions and improved quality of care with the use of an inexpensive checklist in heart failure. Congest Heart Fail. 2013; 19(4):200-206. PubMed
31. Ong MS, Magrabi F, Post J, et al. Communication interventions to improve adherence to infection control precautions: A randomised crossover trial. BMC Infect Dis. 2013; 13:72. PubMed
32. Salzwedel C, Bartz HJ, Kuhnelt I, et al. The effect of a checklist on the quality of post-anaesthesia patient handover: A randomized controlled trial. Int J Qual Health Care. 2013; 25(2):176-181.
33. Implement Sci. 50. Rycroft-Malone J, McCormack B, Hutchinson AM, et al. Realist synthesis: Illustrating the method for implementation research. 2008; 337.BMJ. PubMed
49. Craig P, Dieppe P, Macintyre S, et al. Developing and evaluating complex interventions: The new medical research council guidance. 2014; 9(9):e108585.PloS one. PubMed
48. Gagliardi AR, Straus SE, Shojania KG, Urbach DR. Multiple interacting factors influence adherence, and outcomes associated with surgical safety checklists: A qualitative study.
2016; 188(9):E191-E198.CMAJ. PubMed
47. O’Leary JD, Wijeysundera DN, Crawford MW. Effect of surgical safety checklists on pediatric surgical complications in Ontario. Rockville, MD: Agency for Healthcare Research and Quality; 2013.Human factors and ergonomics. Making health care safer ii: An updated critical analysis of the evidence for patient safety practices. PubMed
46. Carayon P, Xie A, Kianfar SH. 2005; 16(1):70-76.Psychol Sci. 2004; 30(4):689-707.
45. Halford GS, Baker R, McCredden JE, Bain JD. How many variables can humans process? J Exp Psychol Hum Percept Perform. PubMed
44. Oberauer K, Kliegl R. Simultaneous cognitive operations in working memory after dual-task practice. 1956; 63(2):81-97.Psychol Rev. PubMed
43. Miller GA. The magical number seven plus or minus two: Some limits on our capacity for processing information. 2008; 20(1):22-30.Int J Qual Health Care. PubMed
42. Hales B, Terblanche M, Fowler R, Sibbald W. Development of medical checklists for improved quality of patient care. 2011; 104(12):510-520.J R Soc Med. PubMed
41. Morris ZS, Wooding S, Grant J. The answer is 17 years, what is the question: Understanding time lags in translational research. 2015; 24(5):325-336.BMJ Qual Saf. PubMed
40. Portela MC, Pronovost PJ, Woodcock T, Carter P, Dixon-Woods M. How to study improvement interventions: A brief overview of possible study types. Washington (DC): National Academies Press (US); 2013.Best care at lower cost: The path to continuously learning health care in america. PubMed
39. Institute of Medicine. Committee on the learning health care system in America. In: Smith M, Saunders R, Stuckhardt L, et al., eds. 2004; 240(2):205-213.Ann Surg. PubMed
38. Dindo D, Demartines N, Clavien P-A. Classification of surgical complications: A new proposal with evaluation in a cohort of 6336 patients and results of a survey. 2013; 66(3):157-162.Can J Hosp Pharm. PubMed
37. Masson SC, Mabasa VH, Malyuk DL, Perrott JL. Validity evidence for fasthug-maidens, a mnemonic for identifying drug-related problems in the intensive care unit. 2015; 261(5):821-828.Ann Surg. PubMed
36. Haugen AS, Softeland E, Almeland SK, et al. Effect of the world health organization checklist on patient outcomes: A stepped wedge cluster randomized controlled trial.
2016; 12(2):199-205.Future Oncol. PubMed
35. Gentili M, Clerico M, Spizzichino M, Fanelli G. Use of a checklist to improve pain control in hospitalized cancer patients: the 38Checkpain project. 2016; 32:170-174.J Crit Care. PubMed
34. Salzwedel C, Mai V, Punke MA, Kluge S, Reuter DA. The effect of a checklist on the quality of patient handover from the operating room to the intensive care unit: A randomized controlled trial. 2016; 315(14):1480-1490.JAMA. PubMed
33. The Writing Group for CHECKLIST-ICU, Cavalcanti AB, Bozza FA, et al. Effect of a Quality Improvement Intervention With Daily Round Checklists, Goal Setting, and Clinician Prompting on Mortality of Critically Ill Patients: A Randomized Clinical Trial. PubMed
In response to widely publicized reports highlighting the challenges of suboptimal quality of healthcare, improving patient safety has been a leading healthcare initiative for more than 10 years.1-4 Numerous strategies to improve patient safety have been proposed,5-9 but improvements have been limited, which raises questions about whether the right approaches are being employed.10,11
Checklists have served as a foundation for the standardization and safety of aviation and nuclear power12,13 and are advocated as simple and effective instruments for ensuring safe care.7,14,15 Systematic reviews of observational studies suggest that checklists can reduce medical errors and adverse events,15-19 but these reviews are at risk of bias due to the limitations of observational methods. Furthermore, discordant results of recent high-profile evaluations of the World Health Organization (WHO) Surgical Safety Checklist highlight the need for checklist evaluations using rigorous study designs.20-22 Therefore, we sought to conduct a systematic review of RCTs (randomized controlled trials) to determine whether checklists, as a type of decision-support tool, are effective at improving patient safety outcomes in hospitalized patients.
METHODS
The study protocol was registered with the PROSPERO Register of Systematic Reviews (registration number: CRD42016037441) and developed according to the Preferred Reporting Items in Systematic Reviews and Meta-analyses (PRISMA) statement.23
Search Strategy
On December 8, 2016, we systematically searched Ovid MEDLINE, Ovid EMBASE, PubMed, and the Cochrane Central Register of Controlled Trials. The search was performed using no language or publication date restrictions and included 2 groups of terms (key words with similar characteristics): ‘checklists’ and ‘patient outcomes assessment’. We restricted our search to patient outcomes because these are more patient-oriented than the proximal processes of care that may not translate into outcomes. The search was restricted to RCTs using the Cochrane Highly Sensitive Search Strategy for Identifying Randomized Trials from the Cochrane Collaborative.24 The MEDLINE search strategy is depicted in Appendix I (Supplementary File 1). Reference lists of included articles were manually searched for additional publications. The search strategy was designed with the help of an information scientist (DL). EndNote X7 (Thomas Reuters, Philadelphia, PA, USA) was the reference software used for the management of citations.
Eligibility Criteria
We selected all studies reporting patient safety outcomes of a checklist intervention, using the following inclusion criteria: 1) acute care hospital inpatient population, 2) checklist intervention, 3) contain a control group (ie, no checklist), 4) report one or more patient safety outcome, as defined by the authors (eg, medical errors, adverse events, mortality), and 5) RCT design. We restricted our focus to inpatient populations given the heterogeneity of illness and patient care between acute and community settings. We defined a checklist as a tool that details the essential steps of a task, requiring the target provider to indicate whether an item was completed or not.1,7 Tools that included only 1 item (eg, electronic prompts) or did not require acknowledgement of the items (eg, guidelines) were excluded. We defined patient safety outcomes as the authors’ definition of patient safety (eg, medical error, adverse event, provider compliance with safety regulations).
Study Selection
Two reviewers (JMB, GW) independently, and in duplicate, reviewed the titles and abstracts of the retrieved citations against the eligibility criteria. The same 2 reviewers subsequently reviewed the full text of relevant articles for inclusion. Eligibility disagreements were resolved by consensus. A Kappa statistic was calculated for reviewer agreement of full-text screening.25 Reviewers were not blinded to author or journal names.26
Data Extraction
The structured data extraction form was calibrated using the first 2 articles. The 2 reviewers (JMB, GW) independently, and in duplicate, extracted data from included studies on the study characteristics, setting, study population, sample size, intervention used, outcomes examined, analytic method, and study quality. The data extraction form is depicted in Appendix II (Supplementary File 2). Coding discrepancies were resolved by consensus.
Quality Assessment
The 2 reviewers (JMB, GW) extracted data on study quality independently and in duplicate using 2 approaches. First, reviewers assessed study quality using a component method derived from the Cochrane Collaboration criteria.24 For each included study, the reviewers documented if the authors had adequately described inclusion/exclusion criteria, randomization, allocation concealment, blinding of participants/outcome assessors, attrition, cross over, baseline characteristics, and power calculation. Second, the reviewers calculated and reported the Jadad score for each included study, a validated assessment scale that assigns points (1 to 5) based on randomization, blinding, and attrition.27
Analysis
Owing to the heterogeneity of the data and the small number of studies that satisfied the inclusion criteria, the data were analyzed using guidelines for the narrative synthesis of a systematic review.28 Descriptive statistical findings from each included study were reported. The DerSimonian and Laird method for random-effects models was used to calculate a pooled estimate of 30-day all-cause mortality from the raw data available from a subset of studies (number of events, study population).29 Stata SE version 13.1 (Stata Corp, LP, College Station, TX) was used to perform the statistical analyses.
RESULTS
The literature search identified 11,225 unique citations from which 83 abstracts were eligible for full-text review. We identified 9 full-text articles for inclusion in the review (Figure 1 [Supplementary File 3]). The main reasons for citation exclusion during the full-text review were that the study design was not an RCT (39%) or there was no checklist intervention (34%
Study Characteristics
Characteristics of the included studies are summarized in Tables 1 and 2. Six of the studies were conducted in at least 1teaching hospital.30-35 The studies varied in target populations for both the checklist user and patients. The outcomes reported varied; 3 studies examined 30-day mortality,21,30,36 4 studies examined hospital length of stay,21,30,33,36 and 2 studies reported user compliance with the checklist.21,31 Five of the studies reported patient outcomes,21,30,33,35,36 and 5 studies reported provider-level outcomes related to patient safety (eg, compliance with checklist items such as communication of medications, isolation precautions, etc.).31-34,37
Description of Checklists
Supplementary File 4 (Table 3) provides a detailed breakdown of the checklists’ purpose and components. Six of the checklists were designed to directly reduce patient safety events,21,30,33,35-37 whereas 3 of the checklists were designed to indirectly reduce patient safety events by increasing compliance with processes of care.31,32,34 Six checklists were constructed and pilot tested by the research team conducting the RCT30-35 and the 3 remaining studies used modified versions of previously validated checklists.21,36,37 The number of items included in the checklist ranged from 2 to 54.
Impact of the Checklist
Table 4 summarizes the adverse events, medical errors, resource utilization and/or compliance reported for each checklist. Chaudhary et al. reported significant decreases in Grade III (requiring intervention)38 and IV (life-threatening)38 postoperative complications (23% v. 33%, P = 0.04) and 30-day mortality (5.7% vs 10.0%, P = 0.04) for patients assigned to the Modified WHO Surgical Safety Checklist compared to controls.21 Conversely, Haugen et al. reported a nonsignificant reduction in 30-day mortality between the WHO Surgical Safety Checklist group and controls (1.0% vs 1.6%, P = 0.151).36 Bassor et al. reported no significant difference in 30-day hospital readmission for decompensated heart failure for the heart failure discharge checklist group when compared to controls (6% vs. 4%, P = NS); however, an exploratory analysis that excluded patients who died during the follow-up period found a significant difference in 30-day readmission rates (2% vs. 20%, P = 0.02).30 Gentili et al. reported a higher proportion of patients with pain control in the checklist group compared to the controls (67.6% vs. 54.8%), as well as fewer incidents of analgesic therapy–related uncontrolled adverse events (25.9% vs. 49.9%); however, the statistical significance of these differences were not reported.35 The Writing Group for CHECKLIST-ICU reported no significant difference for in-hospital mortality between the checklist and control groups (adjusted odds ratio [AOR] 1.02, 95% CI, 0.82-1.26, P = 0.88), nor for the secondary clinical outcomes examined (Table 4).33 However, there was a significant difference between the checklist group and control group for 3 of the 7 outcomes related to processes of patient care, including a reduction in the use of both urinary catheters (adjusted rate ratio [ARR] 0.86, 95% CI, 0.80-0.93, P < 0.001) and central venous catheters (ARR 0.90, 95% CI 0.83-0.98, P = 0.02). Masson et al. reported that when using the FASTHUG-MAIDENS checklist, more drug-related problems were identified by pharmacy residents (in relation to the number identified by the ICU pharmacist) both per patient encounter (P = 0.008) and overall (P < 0.001).37 Ong et al. reported higher rates of compliance with isolation precautions for infectious diseases in the checklist group (71% vs. 38%, P < 0.01); however, compliance with the checklist was low (40%) and qualitative analyses found participants were dissatisfied with the checklist.31 Salzwedel et al. reported the number of items handed over by anesthesia residents postoperatively to be higher in the checklist group than the control group (48.7% vs. 32.4%, P < 0.001).32 In a more recent study, Salzwedel et al. reported that proportion of items deemed by the attending anesthesiologist as “must be handed over” were more often actually handed over by the anesthesia residents assigned to the checklist group when compared to controls (87.1% vs. 75.0%, P = 0.005).34
30-day Mortality
A random-effects model pooling data from the 3 studies that reported data for 30-day all cause mortality suggested a significant reduction with use of a checklist (OR 0.60, 95% CI, 0.41-0.89; P = 0.01, I2 = 0.0%, P = 0.573).
Study Quality
Supplementary File 5 (Table 5) summarizes the quality assessment of the 9 studies. The clarity of description for each intervention varied. All studies reported inclusion/exclusion criteria and randomization procedures. Three studies indicated that outcome assessors were blinded to intervention allocation;32,34,36 while this was unclear in 2 studies.21,30 Three studies reported baseline characteristics.21,30,36 Two studies reported power calculations;33,37 however, one study had a sample size that was less than that required to achieve the target power.37 The Jadad scores ranged from 1to 5.
DISCUSSION
This systematic review identified 9 RCTs that examined the impact of a checklist on patient safety outcomes in hospitalized patients. The studies employed checklists with different purposes and elements and measured different patient safety outcomes. The methodological quality of the included studies was moderate. In aggregate, the results suggest that checklists may be effective at improving patient safety outcomes, but the small number of moderate quality studies and the heterogeneity of interventions and outcome measures suggests that there is an urgent need for further evaluation.
The most important observation from our systematic review is the paucity of high quality evidence evaluating checklists’ impact on patient safety outcomes in acute inpatient care. The implementation of checklists is increasingly common as they are relatively low cost to develop and implement, and intuitively make sense. This is particularly true in an era of increasing efforts to standardize care as a means for improving quality and minimizing cost (ie, previous systematic reviews cite 38 unique studies).39 However, implementation of an inadequately tested checklist risks unintended consequences (eg, inefficient resource utilization).18 The small number of RCTs identified might be owing to quality improvement efforts traditionally focusing on ‘real life’ applicability over rigorous research methodology.40 The translation of evidence into clinical practice is known to be slow;41 however, these more rigorous methodologies reduce the risk of biases and generate high-quality evidence, which help to fulfill the necessity to identify best practices while avoiding these unintended consequences.
The studies varied both in the approaches used to develop checklists and in the number of items included (ranging from 2 to 54). What is the optimal method for developing a checklist and how does this impact their effectiveness?42 The answers to these questions are not known. However, this review highlights some important issues to consider when developing a checklist. As the number of items or complexity of a task increases, our ability to efficiently perform the task without aid decreases.43-45 As such, a well-designed checklist should detail explicit instructions on the what, where, when, and how of a given task in a fashion that ensures a consistent accuracy for completing the work.5 It is recommended that construction of a checklist follow the principles of human factors engineering: engage stakeholders and human factors experts in the design; are developed based on user needs and realities; list items in order of importance; are concise and subgroup sections of checklists by task or chronological order; ensure usability and evaluate potential negative consequences (eg time to complete); are pilot tested and validated before implementation; are updated as needed based the on generation of new findings or changes in operational procedures.46 These general principles of human factors engineering46 provide a practical approach for the development and evaluation of a checklist. In addition, standardization of operational definitions (ie, process, outcome, compliance) is important for study replication and robust meta-analyses.
Checklists used in aviation are perhaps best known12 and the evidence of their effectiveness is derived from the attribution of aviation errors to incomplete checklists.12 Although more recently implemented in medicine, checklists have the potential to guide the successful completion of complex tasks in healthcare.7 Systematic reviews of observational studies have been conducted for specific checklists (eg, WHO Surgical Safety Checklist) and for select patient populations (eg, surgical patients), and the number of included studies ranges from 7-27 (n = 38 unique studies).15,16,18,19 For example, Gillespie et al. in a systematic review and meta-analysis reported the implementation of Surgical Safety Checklists to be associated with a reduction in postoperative complications (relative risk [RR] 0.63, 95% CI, 0.58-0.72, P = < 0.001), but not mortality (RR 1.03, 95% CI, 0.73-1.4, P = 0.857).19 Similarly, Treadwell et al. reported in a systematic review of Surgical Safety Checklists that while data are promising, more evaluation of their impact on clinical outcomes is needed.18 These recommendations are nicely illustrated by Urbach et al.’s20 and O’Leary et al.’s47 evaluations of the mandatory adoption of Surgical Safety Checklists across all hospitals in Ontario, Canada, which respectively demonstrated no significant reductions in 30-day perioperatively conplications for both adult (OR 0.97, 95% CI, 0.90-1.03, P = 0.29) and pediatric (AOR 1.01, 95% CI, 0.90-1.14, P = 0.9) patients. These data not only highlight the need for further evaluation of checklists but are also a reminder that checklists and their associated implementation strategies are complex interventions for which there may be important differences between the efficacy reported in clinical trials and the effectiveness reported in implementation studies.48 This all suggests that if checklists are to be effective in improving patient safety, process evaluations of implementation49 and realist reviews of published studies50 may be important to determine optimal approaches for implementation. We believe that, based on the limited currently available evidence, there is urgency for further robust evaluations of checklists before their widespread implementation. If effective, they should be widely implemented. If ineffective, they should be abandoned to minimize unintended consequences and inefficient use of resources.
There are 4 primary limitations to this review that should be considered when interpreting the findings. First, the RCT design is not the study design employed by most quality improvement initiatives.40 While some quality improvement experts may argue that an RCT design is insufficiently flexible for applied settings, it does minimize the risk of biased assessments of intervention effectiveness. Second, our search strategy included an RCT filter. The filter helped restrict the number of citations to be reviewed (n = 11,225) but could have resulted in improperly indexed studies being excluded. To guard against this risk, we used the validated Cochrane Highly Sensitive Search Strategy for Identifying Randomized Trials,24 reviewed reference lists of citations included in the review, and solicited suggestions for missing studies from quality improvement experts. Third, our review was restricted to hospitalized patients. Although the studies evaluated commonly reported safety outcomes across patients with diverse clinical conditions, care settings, and providers that broadly reflect hospital-based care, evaluations of checklists in additional patient and provider groups are needed (eg, hospitalists). Furthermore, the effectiveness of checklists for improving patient safety outcomes in outpatients is important; however, the organizational and patient characteristics of these 2 settings (hospitalized vs outpatient) are sufficiently different to warrant separate systematic reviews. Finally, owing to the heterogeneity of the checklists used and outcomes measured, we were unable to perform a robust meta-analysis. Heterogeneity, combined with the small number of studies identified in our search, prevented us from applying statistical methods to assess for publication bias. This limitation of our systematic review highlights an important gap in the literature and emphasizes the importance of additional primary research to evaluate checklists.
In summary, we identified few RCTs that examined checklists designed to improve patient safety outcomes. The small number of existing studies suggests that checklists may improve patient safety outcomes; however, these observations were not reported for all outcomes examined and the studies were heterogeneous and of limited methodological quality. There is an urgent need for high-quality evaluations of the effectiveness of patient safety checklists in inpatient healthcare settings to substantiate their perceived benefits.
Acknowledgments
We would like to thank Diane Lorenzetti for her help with the development of the search strategy.
Disclosure: The authors have no known conflicts of interest to declare.
Jamie Boyd was supported by a W21C – Alberta Innovates-Health Solutions (AIHS) Collaborative Research and Innovation Opportunities (CRIO) Health Services Research graduate studentship. Guosong Wu was supported by a Western Regional Training Centre (WRTC) for Health Services Research graduate studentship. Dr. Stelfox was supported by a Population Health Investigator Award from Alberta Innovates Health Solutions.
Authors’ Contributions
HTS was responsible for the study’s conception. All 3 authors contributed to the study’s design and interpretation. JB and GW were responsible for searching the literature, reviewing abstracts, selecting full-text articles and critically appraising them. All 3 authors performed the analyses. JB drafted the manuscript and all 3 authors assisted in the successive revisions of the final manuscript. All authors have read and approved the final manuscript.
1. World Health Organization. Patient safety. Available at: http://www.who.int/patientsafety/about/en/. Accessed June 21, 2016.
2. Institute of Medicine. To err is human: Building a safer health system. In: Kohn L, Corrigan J, Donaldson M, eds. Institute of Medicine-Committee on Quality of Health Care in America. Washington DC: National Academy Press; 1999:86-101. PubMed
3. Institute of Medicine Committee on the Quality of Health Care in America. Crossing the quality chasm: A new health system for the 21st century. Washington DC: National Academy Press; 2001. PubMed
4. Stelfox HT, Palmisani S, Scurlock C, Orav EJ, Bates DW. The “to err is human” report and the patient safety literature. Qual Saf Health Care. 2006; 15(3):174-178. PubMed
5. Winters BD, Gurses AP, Lehmann H, Sexton JB, Rampersad CJ, Pronovost, PJ. Clinical review: Checklists - translating evidence into practice. Crit Care. 2009; 13(6):210. PubMed
6. Ely EW, Bennett PA, Bowton DL, Murphy SM, Florance AM, Haponik EF. Large scale implementation of a respiratory therapist-driven protocol for ventilator weaning. Am J Respir Crit Care Med. 1999; 159(2):439-446. PubMed
7. Gawande A. The checklist manifesto: How to get things right. Great Britain: Profile Books LTD; 2010.
8. Pronovost P, Vohr E. Safe patients, smart hospitals. New York, NY: Hudson Street Press; 2010.
9. Hughes RG. Advances in patient safety: Tools and strategies for quality improvement and patient safety. In: Hughes RG, ed. Patient safety and quality: An evidence-based handbook for nurses. Rockville (MD): Agency for Healthcare Research and Quality (US); 2008. PubMed
10. Henriksen K, Oppenheimer C, Leape LL, et al. Envisioning patient safety in the year 2025: Eight perspectives. In: Henriksen K, Battles JB, Keyes MA, et al., eds. Advances in patient safety: New directions and alternative approaches. Rockville, MD: Agency for Healthcare Research and Quality; 2008. PubMed
11. Gaba DM, Howard SK. Patient safety: Fatigue among clinicians and the safety of patients. N Engl J Med. 2002; 347(16):1249-1255. PubMed
12. Degani A, Wiener EL. Cockpit checklists: Concepts, design, and use. Human Factors: The Journal of the Human Factors and Ergonomics Society 1993; 35(2):345-359.
13. Swain AD, Guttmann HE. Handbook of human reliability analysis with emphasis on nuclear power plant applications: Final report. Washington, DC: U.S. Nuclear Regulatroy Commission; 1983.
14. de Vries EN, Prins HA, Crolla RM, et al. Effect of a comprehensive surgical safety system on patient outcomes. N Engl J Med. 2010; 363(20):1928-1937. PubMed
15. Bergs J, Hellings J, Cleemput I, et al. Systematic review and meta-analysis of the effect of the world health organization surgical safety checklist on postoperative complications. Br J Surg. 2014; 101(3):150-158. PubMed
16. Pucher PH, Johnston MJ, Aggarwal R, Arora S, Darzi A. Effectiveness of interventions to improve patient handover in surgery: A systematic review. Surgery. 2015; 158(1):85-95. PubMed
17. Bergs J, Lambrechts F, Simons P, et al. Barriers and facilitators related to the implementation of surgical safety checklists: A systematic review of the qualitative evidence. BMJ Qual Saf. 2015; 23(12):776-786. PubMed
18. Treadwell JR, Lucas S, Tsou AY. Surgical checklists: A systematic review of impacts and implementation. BMJ Qual Saf. 2014; 23(4):299-318. PubMed
19. Gillespie BM, Chaboyer W, Thalib L, John M, Fairweather N, Slater K. Effect of using a safety checklist on patient complications after surgery: A systematic review and meta-analysis. Anesthesiology. 2014; 120(6):1380-1389. PubMed
20. Reames BN, Krell RW, Campbell DA Jr, Dimick JB. A checklist-based intervention to improve surgical outcomes in michigan: Evaluation of the keystone surgery program. JAMA Surg. 2015; 150(3):208-215. PubMed
21. Chaudhary N, Varma V, Kapoor S, Mehta N, Kumaran V, Nundy S. Implementation of a surgical safety checklist and postoperative outcomes: A prospective randomized controlled study. J Gastrointest Surg. 2015; 19(5):935-942. PubMed
22. Reames BN, Krell RW, Campbell DA, Jr., Dimick JB. A checklist-based intervention to improve surgical outcomes in Michigan: Evaluation of the Keystone Surgery program. JAMA surgery. 2015; 150(3):208-215. PubMed
23. Liberati A, Altman DG, Tetzlaff J, et al. The prisma statement for reporting systematic reviews and meta-analyses of studies that evaluate health care interventions: Explanation and elaboration. Ann Intern Med. 2009; 151(4):W65-94. PubMed
24. The Cochrane Collaboration. Cochrane handbook for systematic reviews of interventions, version 5.1.0. Oxford, UK: The Cochrane Collaboration, 2011.
25. Landis JR, Koch GG. The measurement of observer agreement for categorical data. Biometrics. 1977; 33(1):159-174. PubMed
26. Berlin JA. Does blinding of readers affect the results of meta-analyses? University of pennsylvania meta-analysis blinding study group. Lancet 1997;350(9072):185-186. PubMed
27. Jadad AR, Moore RA, Carroll D, et al. Assessing the quality of reports of randomized clinical trials: Is blinding necessary? Control Clin Trials 1996;17(1):1-12. PubMed
28. Popay J, Roberts H, Sowden A, et al. Guidance on the conduct of narrative synthesis in systematic reviews: A product form the esrc methods programme. Available at: https://www.researchgate.net/profile/Mark_Rodgers4/publication/233866356_Guidance_on_the_conduct_of_narrative_synthesis_in_systematic_reviews_A_product_from_the_ESRC_Methods_Programme/links/02e7e5231e8f3a6183000000.pdf. Accessed June 17, 2016.
29. DerSimonian R, Laird N. Meta-analysis in clinical trials. Control Clin Trials. 1986; 7(3):177-188. PubMed
30. Basoor A, Doshi NC, Cotant JF, et al. Decreased readmissions and improved quality of care with the use of an inexpensive checklist in heart failure. Congest Heart Fail. 2013; 19(4):200-206. PubMed
31. Ong MS, Magrabi F, Post J, et al. Communication interventions to improve adherence to infection control precautions: A randomised crossover trial. BMC Infect Dis. 2013; 13:72. PubMed
32. Salzwedel C, Bartz HJ, Kuhnelt I, et al. The effect of a checklist on the quality of post-anaesthesia patient handover: A randomized controlled trial. Int J Qual Health Care. 2013; 25(2):176-181.
33. Implement Sci. 50. Rycroft-Malone J, McCormack B, Hutchinson AM, et al. Realist synthesis: Illustrating the method for implementation research. 2008; 337.BMJ. PubMed
49. Craig P, Dieppe P, Macintyre S, et al. Developing and evaluating complex interventions: The new medical research council guidance. 2014; 9(9):e108585.PloS one. PubMed
48. Gagliardi AR, Straus SE, Shojania KG, Urbach DR. Multiple interacting factors influence adherence, and outcomes associated with surgical safety checklists: A qualitative study.
2016; 188(9):E191-E198.CMAJ. PubMed
47. O’Leary JD, Wijeysundera DN, Crawford MW. Effect of surgical safety checklists on pediatric surgical complications in Ontario. Rockville, MD: Agency for Healthcare Research and Quality; 2013.Human factors and ergonomics. Making health care safer ii: An updated critical analysis of the evidence for patient safety practices. PubMed
46. Carayon P, Xie A, Kianfar SH. 2005; 16(1):70-76.Psychol Sci. 2004; 30(4):689-707.
45. Halford GS, Baker R, McCredden JE, Bain JD. How many variables can humans process? J Exp Psychol Hum Percept Perform. PubMed
44. Oberauer K, Kliegl R. Simultaneous cognitive operations in working memory after dual-task practice. 1956; 63(2):81-97.Psychol Rev. PubMed
43. Miller GA. The magical number seven plus or minus two: Some limits on our capacity for processing information. 2008; 20(1):22-30.Int J Qual Health Care. PubMed
42. Hales B, Terblanche M, Fowler R, Sibbald W. Development of medical checklists for improved quality of patient care. 2011; 104(12):510-520.J R Soc Med. PubMed
41. Morris ZS, Wooding S, Grant J. The answer is 17 years, what is the question: Understanding time lags in translational research. 2015; 24(5):325-336.BMJ Qual Saf. PubMed
40. Portela MC, Pronovost PJ, Woodcock T, Carter P, Dixon-Woods M. How to study improvement interventions: A brief overview of possible study types. Washington (DC): National Academies Press (US); 2013.Best care at lower cost: The path to continuously learning health care in america. PubMed
39. Institute of Medicine. Committee on the learning health care system in America. In: Smith M, Saunders R, Stuckhardt L, et al., eds. 2004; 240(2):205-213.Ann Surg. PubMed
38. Dindo D, Demartines N, Clavien P-A. Classification of surgical complications: A new proposal with evaluation in a cohort of 6336 patients and results of a survey. 2013; 66(3):157-162.Can J Hosp Pharm. PubMed
37. Masson SC, Mabasa VH, Malyuk DL, Perrott JL. Validity evidence for fasthug-maidens, a mnemonic for identifying drug-related problems in the intensive care unit. 2015; 261(5):821-828.Ann Surg. PubMed
36. Haugen AS, Softeland E, Almeland SK, et al. Effect of the world health organization checklist on patient outcomes: A stepped wedge cluster randomized controlled trial.
2016; 12(2):199-205.Future Oncol. PubMed
35. Gentili M, Clerico M, Spizzichino M, Fanelli G. Use of a checklist to improve pain control in hospitalized cancer patients: the 38Checkpain project. 2016; 32:170-174.J Crit Care. PubMed
34. Salzwedel C, Mai V, Punke MA, Kluge S, Reuter DA. The effect of a checklist on the quality of patient handover from the operating room to the intensive care unit: A randomized controlled trial. 2016; 315(14):1480-1490.JAMA. PubMed
33. The Writing Group for CHECKLIST-ICU, Cavalcanti AB, Bozza FA, et al. Effect of a Quality Improvement Intervention With Daily Round Checklists, Goal Setting, and Clinician Prompting on Mortality of Critically Ill Patients: A Randomized Clinical Trial. PubMed
© 2017 Society of Hospital Medicine
Can’t Shake This Feeling
The approach to clinical conundrums by an expert clinician is revealed through the presentation of an actual patient’s case in an approach typical of a morning report. Similarly to patient care, sequential pieces of information are provided to the clinician, who is unfamiliar with the case. The focus is on the thought processes of both the clinical team caring for the patient and the discussant.
A 78-year-old woman presented to her primary care physician with a 2-month history of progressive leg weakness. She reported walking difficulty caused by occasional “buckling” of the knees.
The knee buckling may be a clue to the quadriceps muscle weakness. The quadriceps straightens and locks the knee when the foot is being planted. Weakness of this muscle can result in the knee giving way. Isolated quadriceps weakness, which is uncommon, typically is caused by lower motor neuron issues, such as femoral neuropathy, L4–L5 radiculopathy, lumbosacral plexopathy, and primary muscle diseases, including inclusion body myositis.
The patient had diabetes mellitus and hypertension. Her medications were insulin glargine, metformin, glipizide, lisinopril, atorvastatin, and aspirin, and she was taking vitamin D and calcium. None of these was recently changed or added. Aside from having the weakness, the patient was in her usual state of health and had no other complaints. She denied weight changes, fevers, night sweats, and fatigue. She was widowed, lived with her daughter, had no pets, never used tobacco, and did not drink alcohol or use illicit drugs. There was no family history of neuromuscular disorders, and both of her parents died of natural causes at advanced ages.
The physical examination revealed no knee deformities, and the patient had good active range of motion of both knees and normal strength throughout her limbs. Plain radiographs of the knees showed mild medial compartment osteoarthritis. The patient was advised to stop atorvastatin.
Patients who take atorvastatin and other statins (3-hydroxy-3-methyl-glutaryl-co-enzyme A reductase inhibitors) can experience a spectrum of muscle disease, from myalgias and weakness to (rare) overt myositis with rhabdomyolysis. Statin-induced myopathy tends to affect larger proximal muscles, can occur at any time during the period the medication is being used, and usually resolves within weeks after discontinuation. Given this patient’s preserved strength, it was reasonable to manage her conservatively.
One month later, she presented to another hospital’s emergency department with increasing weakness in the lower extremities and new loss of balance requiring use of a walker for ambulation. She thought the weakness was confined to her legs and was affecting her thigh muscles more than her calves or feet. She reported fatigue, decreased appetite, and an unintentional 15-pound weight loss. She denied diarrhea, back pain, bowel and bladder function problems, sensation changes, myalgias, and arthralgias. She reported no swallowing or vision problems, rashes, Raynaud disease symptoms, photosensitivity, dry eyes or mouth, recent falls or trauma, fevers, night sweats, recent illness, or travel.
On physical examination, the patient’s temperature was 98.2°F, blood pressure 120/84 mm Hg, pulse 73 beats per minute, respiratory rate 16 breaths per minute, and oxygen saturation 99% with ambient air. The patient was obese and not in distress. She was alert, oriented, and able to follow multistep instructions. Cranial nerve examination was normal. The patient had mild weakness in her bilateral deltoids and bilateral hip flexors but full strength in all other muscle groups. Deep tendon reflexes were normal in the biceps and patella and reduced in the ankles. The Babinski sign was absent. Throughout the lower extremities, sensation was intact to light touch; there was no saddle anesthesia. Finger–nose–finger testing showed slight dysmetria in the left upper extremity. Because of her imbalance, the patient needed help to stand up; once upright, though, she was able to take 3 steps forward and backward with use of a walker. Her stride length was diminished, and her gait unsteady and wide based.
Serum chemistry panel was normal, creatinine level 0.47 mg/dL, and albumin level 4.0 g/dL. White blood cell (WBC) count was 8100/mm3, hemoglobin level 12 g/dL, and platelet count 287,000/mm3. Alanine aminotransferase (ALT) level was 74 U/L (reference range, 0-36 U/L), alkaline phosphatase level 41 U/L (reference range, 37-117 U/L), and total bilirubin level 0.4 mg/dL (reference range, 0.2-1.2 mg/dL). Prothrombin time and thyrotropin were normal. Creatine kinase (CK) level was 2328 U/L (reference range, <200 U/L). Erythrocyte sedimentation rate was 17 mm/h, and C-reactive protein level 0.1 mg/L. Urinalysis (dipstick testing) detected no myoglobin, and there were no casts. Plain radiograph of the chest was normal.
The elevated CK indicates muscle disease, and, in the absence of other findings of liver disease, the ALT elevation likely has a muscle origin as well. The differential diagnosis for elevated CK includes myopathy caused either by infection, trauma, ischemia, or a toxin (medication included) or by a hereditary, metabolic, endocrinologic, or inflammatory disorder. There is no history of trauma, strenuous exertion, or muscle toxin other than the statin, and the progression of symptoms after medication discontinuation argues against statin myopathy. The laboratory test results rule out derangement of potassium, calcium, phosphorus, magnesium, vitamin D, or thyroid function as the cause of the myopathy. The absence of fever, absence of diffuse organ involvement, and normal inflammatory markers point away from a systemic infection or vasculitis. The inflammatory myopathies dermatomyositis and polymyositis classically produce proximal muscle weakness and are possibilities in this case, but one would expect the inflammatory markers to be elevated in these conditions. Malignancy related to dermatomyositis or to paraneoplastic syndrome may account for the myopathy.
The data provided do not identify a unifying diagnosis. To look for an inflammatory myopathy, such as dermatomyositis or polymyositis, it is reasonable to perform electromyography (EMG) to delineate the location of muscle involvement and identify a site for tissue biopsy. As no obvious toxins or metabolic conditions explain the dysmetria, magnetic resonance imaging (MRI) of the brain should be performed to evaluate for lesions in the cerebellum.
The patient was admitted to the hospital. On T2-weighted and FLAIR (fluid attenuation inversion recovery) sequences, MRI of the brain showed a few scattered subcortical and periventricular white matter hyperintense foci bilaterally. Antibodies to human immunodeficiency virus 1 and 2, and Treponema pallidum immunoglobulins G and M, were not detected. Serum levels of lactate dehydrogenase, vitamin B 12 , angiotensin-converting enzyme, antinuclear antibody, rheumatoid factor, and anti–cyclic citrullinated peptide IgG were normal.
The brain imaging excludes a space-occupying lesion in the cerebellum but does not identify the cause of dysmetria. Toxic-metabolic conditions, such as alcohol toxicity, vitamin B12 deficiency, anoxia, and toxicity of certain medications, may impair cerebellar function (MRI findings may be normal), but none of these is present. Other disorders that attack the central nervous system (CNS) (again, brain imaging may show minimal abnormalities) include infections, early-stage neurodegenerative illnesses, and antibody-associated disorders (eg, autoimmune diseases, postinfectious and paraneoplastic conditions).
Four days after intravenous fluids were started, the patient’s CK level improved, but her weakness persisted. There was no evidence of peripheral neuropathy on lower extremity nerve conduction studies. EMG revealed few fibrillations and positive sharp waves in proximal limb muscles and thoracic paraspinal muscles. Deltoid, biceps, and tensor fasciae latae showed shorter duration complex motor units with early recruitment. The patient declined muscle biopsy. A rheumatologist was consulted, and prednisone 60 mg/d was started for possible inflammatory myopathy. The patient was discharged to a skilled nursing facility for physical therapy.
The fibrillations and positive sharp waves on EMG can be seen in both neuropathy (from denervation) and myopathy. The normal nerve conduction studies make localization to the nerve unlikely. In addition, the shorter duration motor units with early recruitment on EMG are characteristic of a myopathy. Despite the ongoing myopathy, the improved CK level suggests the muscle disease is playing a minimal role in the patient’s current illness. Prescribing corticosteroids for a presumed inflammatory myopathy without a clear diagnosis is risky, as steroids may render subsequent biopsy results unreliable, may themselves cause myopathy, and expose the patient to the side effects of immunosuppression.
One month later, the patient saw her rheumatologist. Although she had tapered the prednisone down to 10 mg/d, she had not returned to baseline strength, was still using a walker, and reported increased difficulty keeping her head raised. She also noted 2 new symptoms: speech slurring and, in both hands, a tremor that made it difficult to hold objects.
Examination revealed a fine tremor in both arms. There were no skin lesions, and the joints were normal. The patient was oriented to name, place, and date. Memory testing was 3 for 3 on register but 0 for 3 on recall. She was unable to perform serial 7s and able to spell backward only 3 of the 5 letters in the word world . Speech was dysarthric and scanning in quality. On extraocular movements, she demonstrated poor smooth pursuit. Examination of the head and neck was significant for nearly constant head titubation and weak neck flexors. Upper extremity strength was normal. Mild weakness was noted in both hip flexors. Deep tendon reflexes were preserved except at the ankle, where they were reduced. Finger–nose–finger testing revealed marked dysmetria, more pronounced on the left, and there was mild bilateral heel-to-shin dysmetria.
Diffuse myopathy cannot account for the patient’s impaired cognition or progressive cerebellar findings, which now include head titubation and scanning speech. As more than a month has elapsed since the brain imaging was performed, MRI could be repeated for evidence of infection, malignancy, inflammation, or demyelination. More important, lumbar puncture is indicated to exclude infection and, with flow cytometry, cytology, and measurement of oligoclonal bands and IgG index, to assess for autoimmune or paraneoplastic antibody-mediated disorders.
The patient was readmitted. On repeat brain MRI, there were no new significant findings. Complete blood cell count and chemistry panel results were unremarkable. Erythrocyte sedimentation rate and C-reactive protein level remained normal. CK level was 451 U/L, and ALT level 29 U/L.
Lumbar puncture was performed. Opening pressure was 14.5 cm of water, and cerebrospinal fluid (CSF) was clear and colorless. There were 3 red blood cells/mm 3 and no WBCs. Glucose level was 94 mg/dL, and protein level 74 mg/dL. CSF IgG synthesis rate was normal, flow cytometry revealed no abnormal clonal populations, and cytology was negative for malignancy. Two unique oligoclonal bands were found in the CSF.
The absence of WBCs in the CSF excludes CNS infection. The patient’s main problem is an inflammatory CNS process as defined by presence of oligoclonal bands in the CSF, compared with their absence in the serum. Autoimmune, neoplastic, and paraneoplastic disorders could explain these bands. There was no evidence of systemic autoimmune illness. The patient has not had a recent infection that could result in postinfectious demyelination, and her clinical and imaging features are not suggestive of a demyelinating disorder, such as multiple sclerosis. Of the neoplastic possibilities, lymphoma with CNS involvement may be difficult to detect initially; this diagnosis, however, is not supported by the unremarkable MRI, flow cytometry, and cytology findings. In paraneoplastic syndromes, the CSF may include antibodies that react to antigens in the brain or cerebellum.
At this point, evaluation for malignancy should involve mammography, imaging of the chest, abdomen, and pelvis, and colorectal screening. Testing should also include measurement of serum and CSF autoantibodies associated with paraneoplastic cerebellar degeneration. The expanding list of paraneoplastic antibodies that may attack the cerebellum includes anti-Hu (often associated with small cell lung cancer), anti-Yo (associated with ovarian or breast cancer), anti-aquaporin 4, antibodies to the voltage-gated potassium channel, and anti–glutamic acid decarboxylase (anti-GAD).
Mammography and breast examination findings were normal. Computed tomography (CT) of the chest showed no adenopathy, nodules, or masses. Abdomen CT showed nonspecific prominence of the gallbladder wall. Flexible sigmoidoscopy revealed no masses, only thickened folds in the sigmoid colon; results of multiple colon biopsy tests were normal. Carcinoembryonic antigen level was 2.0 μg/L, and CA-125 level 5 U/mL. Serum GAD-65 antibodies were elevated (>30 nmol/L).
Anti-GAD is mostly known as the antibody associated with type 1 diabetes mellitus (T1DM). In rare instances, even in patients without a history of diabetes, anti-GAD antibodies may lead to an autoimmune attack on the brain, particularly the cerebellum, as part of an idiopathic autoimmune disorder or as a paraneoplastic syndrome. In either case, treatment involves corticosteroids, intravenous Ig, or plasma exchange. When the autoimmune attack is associated with malignancy, treatment response is poorer, unless the malignancy is successfully managed. The next steps are intravenous Ig or plasma exchange and positron emission tomography–CT (PET-CT) assessing for an underlying neoplasm that may have been too small to be detected with routine CT.
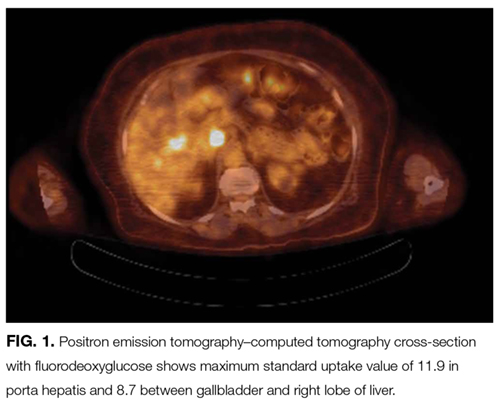
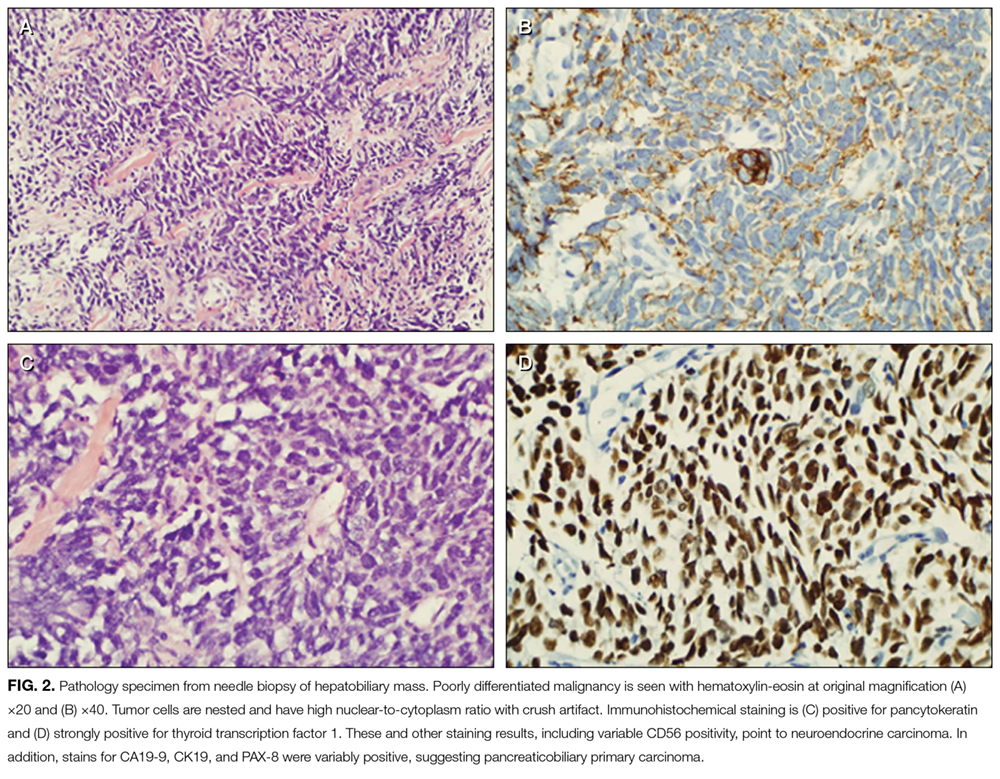
DISCUSSION
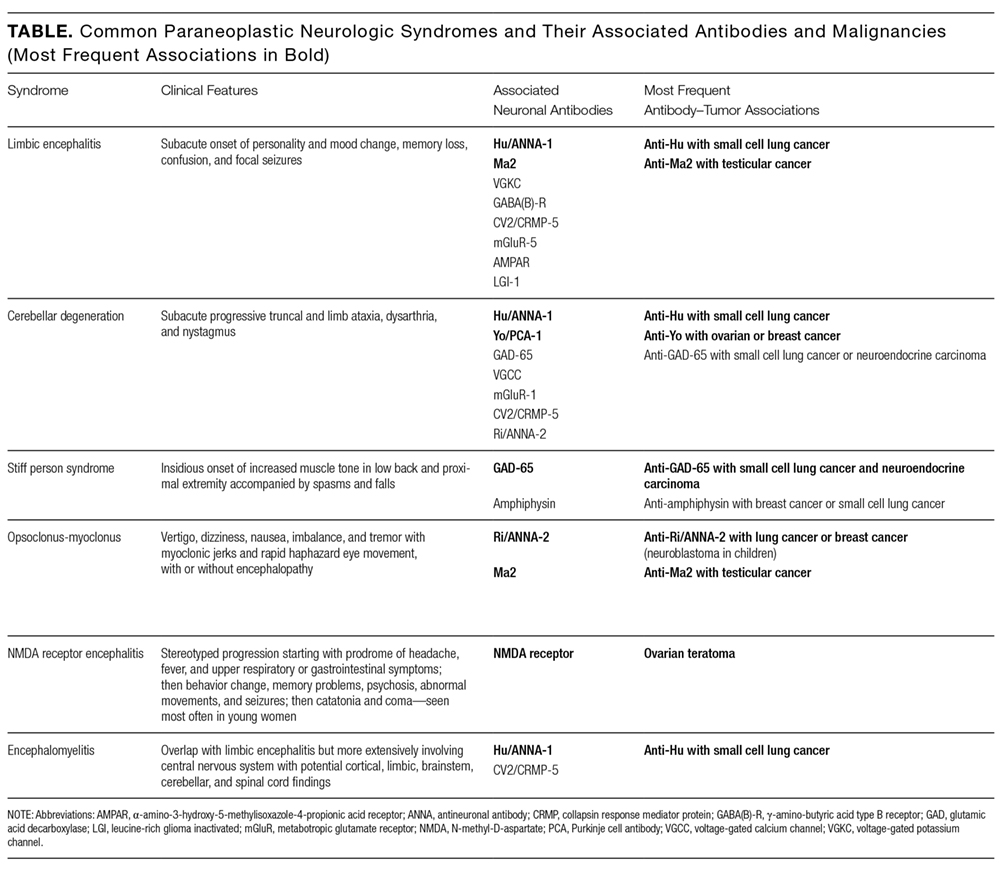
When clinical, MRI, and CSF findings suggest PNS, the next step in establishing the diagnosis is testing for neuronal antibodies. Testing should be performed for a comprehensive panel of antibodies in both serum and CSF.3,4 Testing for a single antibody can miss potential cases because various syndromes may be associated with multiple antibodies. In addition, presence of multiple antibodies (vs a single antibody) is a better predictor of cancer type.5,6 Sensitivity can be optimized by examining both serum and CSF, as in some cases, the antibody is identified in only one of these fluids.7,8 An identified antibody predicts the underlying malignancies most likely involved. For example, presence of anti-Hu antibodies is associated most often with small cell lung cancer, whereas presence of anti-Yo antibodies correlates with cancers of the breast, ovary, and lung. When the evaluation does not identify an underlying malignancy and PNS is suspected, PET-CT can be successfully used to detect an occult malignancy in 20% to 56% of patients.8-10
According to reports, at least 17 autoantibodies, including classic Purkinje cell cytoplasmic antibody type 1 (anti-Yo), antineuronal nuclear antibody type 1 (anti-Hu), and GAD-65 antibody, attack antigens in the cerebellum.11 GAD-65, an enzyme expressed in the brain and pancreatic β cells, is a soluble synaptic protein that produces the inhibitory neurotransmitter γ-amino-butyric acid (GABA).12 Inhibition of GAD-65 in cerebellar tissue leads to decreased expression of GABA, resulting in extensive cerebellar deficits, such as those in the present case. Anti-GAD-65 antibodies have been associated with various disease processes. For example, anti-GAD-65 is found in the serum of 80% of patients with insulin-dependent T1DM.13 GAD-65 antibodies may also be detected in patients with stiff person syndrome (Table) and in patients with cerebellar ataxia caused by a paraneoplastic or autoimmune syndrome.14,15
Paraneoplastic anti-GAD cerebellar ataxia is very rare. It occurs at a median age of 60 years, affects men more often than women, and has an extremely poor prognosis.11,16 Underlying cancers identified in patients with this ataxia include solid organ tumors, lymphoma, and neuroendocrine carcinoma.17 The present case of anti-GAD-65 cerebellar ataxia is the first reported in a patient with biliary tract neuroendocrine carcinoma. Given the rarity of the disease and the advanced stage of illness when the condition is detected, optimal treatment is unknown. As extrapolated from management of other PNSs, recommended treatments are intravenous Ig, plasma exchange, steroids, and other immunosuppressants, as well as control of the underlying neoplasm.11
The discussant in this case couldn’t shake the feeling that there was more to the patient’s illness than statin or inflammatory myopathy. It was the patient’s shaking itself—the dysmetric limb and truncal titubation—that provided a clue to the cerebellar localization and ultimately led to the discovery of a paraneoplastic disorder linked to anatomically remote neuroendocrine cancer.
KEY TEACHING POINTS
- The differential diagnosis for cerebellar deficits associated with normal brain MRI includes infection, toxic-metabolic insults (alcohol toxicity, vitamin B12 deficiency, medication toxicity), anoxia, early neurodegenerative illness, and antibody-mediated disorders, such as autoimmune, postinfectious, and paraneoplastic syndromes.
- Hospitalists should suspect a PNS when a patient with known cancer develops unexplained neurologic deficits or when evaluation for neurologic symptoms identifies an inflammatory CSF profile that cannot be explained by a demyelinating disorder or an infection.
- Hospitalists should familiarize themselves with the classic PNS presentations, including limbic encephalitis, cerebellar degeneration, stiff person syndrome, opsoclonus-myoclonus, NMDA receptor encephalitis, and encephalomyelitis.
- Suspicion for PNS may be confirmed by the presence of paraneoplastic antibodies in CSF or serum. When routine evaluation fails to identify cancer, PET-CT should be performed.
Disclosure
Nothing to report.
1. Darnell RB, Posner JB. Paraneoplastic syndromes and the nervous system. N Engl J Med. 2003;3(4):287-288. PubMed
2. Psimaras D, Carpentier AF, Rossi C; PNS Euronetwork. Cerebrospinal fluid study in paraneoplastic syndromes. J Neurol Neurosurg Psychiatry. 2010;81(1):42-45. PubMed
3. Lancaster E, Damlau J. Neuronal autoantigens—pathogenesis, associated disorders and antibody testing. Nat Rev Neurol. 2012;8(7):380-390. PubMed
4. McKeon A. Paraneoplastic and other autoimmune disorders of the central nervous system. Neurohospitalist. 2012;3(2):53-64. PubMed
5. Kannoth S. Paraneoplastic neurologic syndrome: a practical approach. Ann Indian Acad Neurol. 2012;15(1):6-12. PubMed
6. Hoftberger R, Rosenfeld MR, Dalmau J. Update on neurological paraneoplastic syndromes. Curr Opin Oncol. 2015;27(6):489-495. PubMed
7. McKeon A, Pittock SJ, Lennon VA. CSF complements serum for evaluating paraneoplastic antibodies and NMO-IgG. Neurology. 2011;76(12):1108-1110. PubMed
8. McKeon A, Apiwattanakul M, Lachance DH, et al. Positron emission tomography–computed tomography in paraneoplastic neurologic disorders: systematic analysis and review. Arch Neurol. 2010;67(3):322-329. PubMed
9. Titulaer MJ, Soffietti R, Dalmau J, et al; European Federation of Neurological Societies. Screening for tumours in paraneoplastic syndromes: report of an EFNS task force. Eur J Neurol. 2011;18(1):19-e3. PubMed
10. Basu S, Alavi A. Role of FDG-PET in the clinical management of paraneoplastic neurological syndrome: detection of the underlying malignancy and the brain PET-MRI correlates. Mol Imaging Biol. 2008;10(3):131-137. PubMed
11. Jones AL, Flanagan EP, Pittock SJ, et al. Responses to and outcomes of treatment of autoimmune cerebellar ataxia in adults. JAMA Neurol. 2015;72(11):1304-1312. PubMed
12. Tohid H. Anti-glutamic acid decarboxylase antibody positive neurological syndromes. Neurosciences. 2016;21(3):215-222. PubMed
13. Asakura T, Yoshida S, Maeshima A, et al. Small cell lung cancer expressing glutamate decarboxylase with latent autoimmune diabetes in adults. Intern Med. 2015;54(23):3035-3037. PubMed
14. Agarwal P, Ichaporia N. Glutamic acid decarboxylase antibody-positive paraneoplastic stiff limb syndrome associated with carcinoma of the breast. Neurol India. 2010;58(3):449-451. PubMed
15. Duddy ME, Baker MR. Stiff person syndrome. Front Neurol Neurosci. 2009;26:147-165. PubMed
16. Ariño H, Höftberger R, Gresa-Arribas N, et al. Paraneoplastic neurological syndromes and glutamic acid decarboxylase antibodies. JAMA Neurol. 2015;72(8):874-881. PubMed
17. Hernandez-Echebarria L, Saiz A, Ares A, et al. Paraneoplastic encephalomyelitis associated with pancreatic tumor and anti-GAD antibodies. Neurology. 2006;66(3):450-451. PubMed
The approach to clinical conundrums by an expert clinician is revealed through the presentation of an actual patient’s case in an approach typical of a morning report. Similarly to patient care, sequential pieces of information are provided to the clinician, who is unfamiliar with the case. The focus is on the thought processes of both the clinical team caring for the patient and the discussant.
A 78-year-old woman presented to her primary care physician with a 2-month history of progressive leg weakness. She reported walking difficulty caused by occasional “buckling” of the knees.
The knee buckling may be a clue to the quadriceps muscle weakness. The quadriceps straightens and locks the knee when the foot is being planted. Weakness of this muscle can result in the knee giving way. Isolated quadriceps weakness, which is uncommon, typically is caused by lower motor neuron issues, such as femoral neuropathy, L4–L5 radiculopathy, lumbosacral plexopathy, and primary muscle diseases, including inclusion body myositis.
The patient had diabetes mellitus and hypertension. Her medications were insulin glargine, metformin, glipizide, lisinopril, atorvastatin, and aspirin, and she was taking vitamin D and calcium. None of these was recently changed or added. Aside from having the weakness, the patient was in her usual state of health and had no other complaints. She denied weight changes, fevers, night sweats, and fatigue. She was widowed, lived with her daughter, had no pets, never used tobacco, and did not drink alcohol or use illicit drugs. There was no family history of neuromuscular disorders, and both of her parents died of natural causes at advanced ages.
The physical examination revealed no knee deformities, and the patient had good active range of motion of both knees and normal strength throughout her limbs. Plain radiographs of the knees showed mild medial compartment osteoarthritis. The patient was advised to stop atorvastatin.
Patients who take atorvastatin and other statins (3-hydroxy-3-methyl-glutaryl-co-enzyme A reductase inhibitors) can experience a spectrum of muscle disease, from myalgias and weakness to (rare) overt myositis with rhabdomyolysis. Statin-induced myopathy tends to affect larger proximal muscles, can occur at any time during the period the medication is being used, and usually resolves within weeks after discontinuation. Given this patient’s preserved strength, it was reasonable to manage her conservatively.
One month later, she presented to another hospital’s emergency department with increasing weakness in the lower extremities and new loss of balance requiring use of a walker for ambulation. She thought the weakness was confined to her legs and was affecting her thigh muscles more than her calves or feet. She reported fatigue, decreased appetite, and an unintentional 15-pound weight loss. She denied diarrhea, back pain, bowel and bladder function problems, sensation changes, myalgias, and arthralgias. She reported no swallowing or vision problems, rashes, Raynaud disease symptoms, photosensitivity, dry eyes or mouth, recent falls or trauma, fevers, night sweats, recent illness, or travel.
On physical examination, the patient’s temperature was 98.2°F, blood pressure 120/84 mm Hg, pulse 73 beats per minute, respiratory rate 16 breaths per minute, and oxygen saturation 99% with ambient air. The patient was obese and not in distress. She was alert, oriented, and able to follow multistep instructions. Cranial nerve examination was normal. The patient had mild weakness in her bilateral deltoids and bilateral hip flexors but full strength in all other muscle groups. Deep tendon reflexes were normal in the biceps and patella and reduced in the ankles. The Babinski sign was absent. Throughout the lower extremities, sensation was intact to light touch; there was no saddle anesthesia. Finger–nose–finger testing showed slight dysmetria in the left upper extremity. Because of her imbalance, the patient needed help to stand up; once upright, though, she was able to take 3 steps forward and backward with use of a walker. Her stride length was diminished, and her gait unsteady and wide based.
Serum chemistry panel was normal, creatinine level 0.47 mg/dL, and albumin level 4.0 g/dL. White blood cell (WBC) count was 8100/mm3, hemoglobin level 12 g/dL, and platelet count 287,000/mm3. Alanine aminotransferase (ALT) level was 74 U/L (reference range, 0-36 U/L), alkaline phosphatase level 41 U/L (reference range, 37-117 U/L), and total bilirubin level 0.4 mg/dL (reference range, 0.2-1.2 mg/dL). Prothrombin time and thyrotropin were normal. Creatine kinase (CK) level was 2328 U/L (reference range, <200 U/L). Erythrocyte sedimentation rate was 17 mm/h, and C-reactive protein level 0.1 mg/L. Urinalysis (dipstick testing) detected no myoglobin, and there were no casts. Plain radiograph of the chest was normal.
The elevated CK indicates muscle disease, and, in the absence of other findings of liver disease, the ALT elevation likely has a muscle origin as well. The differential diagnosis for elevated CK includes myopathy caused either by infection, trauma, ischemia, or a toxin (medication included) or by a hereditary, metabolic, endocrinologic, or inflammatory disorder. There is no history of trauma, strenuous exertion, or muscle toxin other than the statin, and the progression of symptoms after medication discontinuation argues against statin myopathy. The laboratory test results rule out derangement of potassium, calcium, phosphorus, magnesium, vitamin D, or thyroid function as the cause of the myopathy. The absence of fever, absence of diffuse organ involvement, and normal inflammatory markers point away from a systemic infection or vasculitis. The inflammatory myopathies dermatomyositis and polymyositis classically produce proximal muscle weakness and are possibilities in this case, but one would expect the inflammatory markers to be elevated in these conditions. Malignancy related to dermatomyositis or to paraneoplastic syndrome may account for the myopathy.
The data provided do not identify a unifying diagnosis. To look for an inflammatory myopathy, such as dermatomyositis or polymyositis, it is reasonable to perform electromyography (EMG) to delineate the location of muscle involvement and identify a site for tissue biopsy. As no obvious toxins or metabolic conditions explain the dysmetria, magnetic resonance imaging (MRI) of the brain should be performed to evaluate for lesions in the cerebellum.
The patient was admitted to the hospital. On T2-weighted and FLAIR (fluid attenuation inversion recovery) sequences, MRI of the brain showed a few scattered subcortical and periventricular white matter hyperintense foci bilaterally. Antibodies to human immunodeficiency virus 1 and 2, and Treponema pallidum immunoglobulins G and M, were not detected. Serum levels of lactate dehydrogenase, vitamin B 12 , angiotensin-converting enzyme, antinuclear antibody, rheumatoid factor, and anti–cyclic citrullinated peptide IgG were normal.
The brain imaging excludes a space-occupying lesion in the cerebellum but does not identify the cause of dysmetria. Toxic-metabolic conditions, such as alcohol toxicity, vitamin B12 deficiency, anoxia, and toxicity of certain medications, may impair cerebellar function (MRI findings may be normal), but none of these is present. Other disorders that attack the central nervous system (CNS) (again, brain imaging may show minimal abnormalities) include infections, early-stage neurodegenerative illnesses, and antibody-associated disorders (eg, autoimmune diseases, postinfectious and paraneoplastic conditions).
Four days after intravenous fluids were started, the patient’s CK level improved, but her weakness persisted. There was no evidence of peripheral neuropathy on lower extremity nerve conduction studies. EMG revealed few fibrillations and positive sharp waves in proximal limb muscles and thoracic paraspinal muscles. Deltoid, biceps, and tensor fasciae latae showed shorter duration complex motor units with early recruitment. The patient declined muscle biopsy. A rheumatologist was consulted, and prednisone 60 mg/d was started for possible inflammatory myopathy. The patient was discharged to a skilled nursing facility for physical therapy.
The fibrillations and positive sharp waves on EMG can be seen in both neuropathy (from denervation) and myopathy. The normal nerve conduction studies make localization to the nerve unlikely. In addition, the shorter duration motor units with early recruitment on EMG are characteristic of a myopathy. Despite the ongoing myopathy, the improved CK level suggests the muscle disease is playing a minimal role in the patient’s current illness. Prescribing corticosteroids for a presumed inflammatory myopathy without a clear diagnosis is risky, as steroids may render subsequent biopsy results unreliable, may themselves cause myopathy, and expose the patient to the side effects of immunosuppression.
One month later, the patient saw her rheumatologist. Although she had tapered the prednisone down to 10 mg/d, she had not returned to baseline strength, was still using a walker, and reported increased difficulty keeping her head raised. She also noted 2 new symptoms: speech slurring and, in both hands, a tremor that made it difficult to hold objects.
Examination revealed a fine tremor in both arms. There were no skin lesions, and the joints were normal. The patient was oriented to name, place, and date. Memory testing was 3 for 3 on register but 0 for 3 on recall. She was unable to perform serial 7s and able to spell backward only 3 of the 5 letters in the word world . Speech was dysarthric and scanning in quality. On extraocular movements, she demonstrated poor smooth pursuit. Examination of the head and neck was significant for nearly constant head titubation and weak neck flexors. Upper extremity strength was normal. Mild weakness was noted in both hip flexors. Deep tendon reflexes were preserved except at the ankle, where they were reduced. Finger–nose–finger testing revealed marked dysmetria, more pronounced on the left, and there was mild bilateral heel-to-shin dysmetria.
Diffuse myopathy cannot account for the patient’s impaired cognition or progressive cerebellar findings, which now include head titubation and scanning speech. As more than a month has elapsed since the brain imaging was performed, MRI could be repeated for evidence of infection, malignancy, inflammation, or demyelination. More important, lumbar puncture is indicated to exclude infection and, with flow cytometry, cytology, and measurement of oligoclonal bands and IgG index, to assess for autoimmune or paraneoplastic antibody-mediated disorders.
The patient was readmitted. On repeat brain MRI, there were no new significant findings. Complete blood cell count and chemistry panel results were unremarkable. Erythrocyte sedimentation rate and C-reactive protein level remained normal. CK level was 451 U/L, and ALT level 29 U/L.
Lumbar puncture was performed. Opening pressure was 14.5 cm of water, and cerebrospinal fluid (CSF) was clear and colorless. There were 3 red blood cells/mm 3 and no WBCs. Glucose level was 94 mg/dL, and protein level 74 mg/dL. CSF IgG synthesis rate was normal, flow cytometry revealed no abnormal clonal populations, and cytology was negative for malignancy. Two unique oligoclonal bands were found in the CSF.
The absence of WBCs in the CSF excludes CNS infection. The patient’s main problem is an inflammatory CNS process as defined by presence of oligoclonal bands in the CSF, compared with their absence in the serum. Autoimmune, neoplastic, and paraneoplastic disorders could explain these bands. There was no evidence of systemic autoimmune illness. The patient has not had a recent infection that could result in postinfectious demyelination, and her clinical and imaging features are not suggestive of a demyelinating disorder, such as multiple sclerosis. Of the neoplastic possibilities, lymphoma with CNS involvement may be difficult to detect initially; this diagnosis, however, is not supported by the unremarkable MRI, flow cytometry, and cytology findings. In paraneoplastic syndromes, the CSF may include antibodies that react to antigens in the brain or cerebellum.
At this point, evaluation for malignancy should involve mammography, imaging of the chest, abdomen, and pelvis, and colorectal screening. Testing should also include measurement of serum and CSF autoantibodies associated with paraneoplastic cerebellar degeneration. The expanding list of paraneoplastic antibodies that may attack the cerebellum includes anti-Hu (often associated with small cell lung cancer), anti-Yo (associated with ovarian or breast cancer), anti-aquaporin 4, antibodies to the voltage-gated potassium channel, and anti–glutamic acid decarboxylase (anti-GAD).
Mammography and breast examination findings were normal. Computed tomography (CT) of the chest showed no adenopathy, nodules, or masses. Abdomen CT showed nonspecific prominence of the gallbladder wall. Flexible sigmoidoscopy revealed no masses, only thickened folds in the sigmoid colon; results of multiple colon biopsy tests were normal. Carcinoembryonic antigen level was 2.0 μg/L, and CA-125 level 5 U/mL. Serum GAD-65 antibodies were elevated (>30 nmol/L).
Anti-GAD is mostly known as the antibody associated with type 1 diabetes mellitus (T1DM). In rare instances, even in patients without a history of diabetes, anti-GAD antibodies may lead to an autoimmune attack on the brain, particularly the cerebellum, as part of an idiopathic autoimmune disorder or as a paraneoplastic syndrome. In either case, treatment involves corticosteroids, intravenous Ig, or plasma exchange. When the autoimmune attack is associated with malignancy, treatment response is poorer, unless the malignancy is successfully managed. The next steps are intravenous Ig or plasma exchange and positron emission tomography–CT (PET-CT) assessing for an underlying neoplasm that may have been too small to be detected with routine CT.
DISCUSSION
When clinical, MRI, and CSF findings suggest PNS, the next step in establishing the diagnosis is testing for neuronal antibodies. Testing should be performed for a comprehensive panel of antibodies in both serum and CSF.3,4 Testing for a single antibody can miss potential cases because various syndromes may be associated with multiple antibodies. In addition, presence of multiple antibodies (vs a single antibody) is a better predictor of cancer type.5,6 Sensitivity can be optimized by examining both serum and CSF, as in some cases, the antibody is identified in only one of these fluids.7,8 An identified antibody predicts the underlying malignancies most likely involved. For example, presence of anti-Hu antibodies is associated most often with small cell lung cancer, whereas presence of anti-Yo antibodies correlates with cancers of the breast, ovary, and lung. When the evaluation does not identify an underlying malignancy and PNS is suspected, PET-CT can be successfully used to detect an occult malignancy in 20% to 56% of patients.8-10
According to reports, at least 17 autoantibodies, including classic Purkinje cell cytoplasmic antibody type 1 (anti-Yo), antineuronal nuclear antibody type 1 (anti-Hu), and GAD-65 antibody, attack antigens in the cerebellum.11 GAD-65, an enzyme expressed in the brain and pancreatic β cells, is a soluble synaptic protein that produces the inhibitory neurotransmitter γ-amino-butyric acid (GABA).12 Inhibition of GAD-65 in cerebellar tissue leads to decreased expression of GABA, resulting in extensive cerebellar deficits, such as those in the present case. Anti-GAD-65 antibodies have been associated with various disease processes. For example, anti-GAD-65 is found in the serum of 80% of patients with insulin-dependent T1DM.13 GAD-65 antibodies may also be detected in patients with stiff person syndrome (Table) and in patients with cerebellar ataxia caused by a paraneoplastic or autoimmune syndrome.14,15
Paraneoplastic anti-GAD cerebellar ataxia is very rare. It occurs at a median age of 60 years, affects men more often than women, and has an extremely poor prognosis.11,16 Underlying cancers identified in patients with this ataxia include solid organ tumors, lymphoma, and neuroendocrine carcinoma.17 The present case of anti-GAD-65 cerebellar ataxia is the first reported in a patient with biliary tract neuroendocrine carcinoma. Given the rarity of the disease and the advanced stage of illness when the condition is detected, optimal treatment is unknown. As extrapolated from management of other PNSs, recommended treatments are intravenous Ig, plasma exchange, steroids, and other immunosuppressants, as well as control of the underlying neoplasm.11
The discussant in this case couldn’t shake the feeling that there was more to the patient’s illness than statin or inflammatory myopathy. It was the patient’s shaking itself—the dysmetric limb and truncal titubation—that provided a clue to the cerebellar localization and ultimately led to the discovery of a paraneoplastic disorder linked to anatomically remote neuroendocrine cancer.
KEY TEACHING POINTS
- The differential diagnosis for cerebellar deficits associated with normal brain MRI includes infection, toxic-metabolic insults (alcohol toxicity, vitamin B12 deficiency, medication toxicity), anoxia, early neurodegenerative illness, and antibody-mediated disorders, such as autoimmune, postinfectious, and paraneoplastic syndromes.
- Hospitalists should suspect a PNS when a patient with known cancer develops unexplained neurologic deficits or when evaluation for neurologic symptoms identifies an inflammatory CSF profile that cannot be explained by a demyelinating disorder or an infection.
- Hospitalists should familiarize themselves with the classic PNS presentations, including limbic encephalitis, cerebellar degeneration, stiff person syndrome, opsoclonus-myoclonus, NMDA receptor encephalitis, and encephalomyelitis.
- Suspicion for PNS may be confirmed by the presence of paraneoplastic antibodies in CSF or serum. When routine evaluation fails to identify cancer, PET-CT should be performed.
Disclosure
Nothing to report.
1. Darnell RB, Posner JB. Paraneoplastic syndromes and the nervous system. N Engl J Med. 2003;3(4):287-288. PubMed
2. Psimaras D, Carpentier AF, Rossi C; PNS Euronetwork. Cerebrospinal fluid study in paraneoplastic syndromes. J Neurol Neurosurg Psychiatry. 2010;81(1):42-45. PubMed
3. Lancaster E, Damlau J. Neuronal autoantigens—pathogenesis, associated disorders and antibody testing. Nat Rev Neurol. 2012;8(7):380-390. PubMed
4. McKeon A. Paraneoplastic and other autoimmune disorders of the central nervous system. Neurohospitalist. 2012;3(2):53-64. PubMed
5. Kannoth S. Paraneoplastic neurologic syndrome: a practical approach. Ann Indian Acad Neurol. 2012;15(1):6-12. PubMed
6. Hoftberger R, Rosenfeld MR, Dalmau J. Update on neurological paraneoplastic syndromes. Curr Opin Oncol. 2015;27(6):489-495. PubMed
7. McKeon A, Pittock SJ, Lennon VA. CSF complements serum for evaluating paraneoplastic antibodies and NMO-IgG. Neurology. 2011;76(12):1108-1110. PubMed
8. McKeon A, Apiwattanakul M, Lachance DH, et al. Positron emission tomography–computed tomography in paraneoplastic neurologic disorders: systematic analysis and review. Arch Neurol. 2010;67(3):322-329. PubMed
9. Titulaer MJ, Soffietti R, Dalmau J, et al; European Federation of Neurological Societies. Screening for tumours in paraneoplastic syndromes: report of an EFNS task force. Eur J Neurol. 2011;18(1):19-e3. PubMed
10. Basu S, Alavi A. Role of FDG-PET in the clinical management of paraneoplastic neurological syndrome: detection of the underlying malignancy and the brain PET-MRI correlates. Mol Imaging Biol. 2008;10(3):131-137. PubMed
11. Jones AL, Flanagan EP, Pittock SJ, et al. Responses to and outcomes of treatment of autoimmune cerebellar ataxia in adults. JAMA Neurol. 2015;72(11):1304-1312. PubMed
12. Tohid H. Anti-glutamic acid decarboxylase antibody positive neurological syndromes. Neurosciences. 2016;21(3):215-222. PubMed
13. Asakura T, Yoshida S, Maeshima A, et al. Small cell lung cancer expressing glutamate decarboxylase with latent autoimmune diabetes in adults. Intern Med. 2015;54(23):3035-3037. PubMed
14. Agarwal P, Ichaporia N. Glutamic acid decarboxylase antibody-positive paraneoplastic stiff limb syndrome associated with carcinoma of the breast. Neurol India. 2010;58(3):449-451. PubMed
15. Duddy ME, Baker MR. Stiff person syndrome. Front Neurol Neurosci. 2009;26:147-165. PubMed
16. Ariño H, Höftberger R, Gresa-Arribas N, et al. Paraneoplastic neurological syndromes and glutamic acid decarboxylase antibodies. JAMA Neurol. 2015;72(8):874-881. PubMed
17. Hernandez-Echebarria L, Saiz A, Ares A, et al. Paraneoplastic encephalomyelitis associated with pancreatic tumor and anti-GAD antibodies. Neurology. 2006;66(3):450-451. PubMed
© 2017 Society of Hospital Medicine
Caring Wisely: A Program to Support Frontline Clinicians and Staff in Improving Healthcare Delivery and Reducing Costs
© 2017 Society of Hospital Medicine
Strategies are needed to empower frontline clinicians to work with organizational leadership to reduce healthcare costs and improve high-value care. Caring Wisely® is a program developed by the University of California, San Francisco’s (UCSF) Center for Healthcare Value (CHV), aimed at engaging frontline clinicians and staff, connecting them with implementation experts, and supporting the development of targeted interventions to improve value. Financial savings from the program more than cover program costs. Caring Wisely® provides an institutional model for implementing robust interventions to address areas of low-value care.
Launched in 2013, the annual Caring Wisely® program consists of 3 stages for identifying projects that meet the following criteria:
- Potential to measurably reduce UCSF Health’s costs of care without transferring costs to patients, insurers, or other providers
- Plan for ensuring that health outcomes are maintained or improved
- Envision disseminating the intervention within and beyond UCSF
- Demonstrate commitment and engagement of clinical leadership and frontline staff.
The first stage is the Ideas Contest, a UCSF Health-wide call (to learn more about UCSF Health: https://www.ucsf.edu/sites/default/files/052516_About_UCSF.pdf) to identify areas that may be targeted to reduce unnecessary services, inefficiencies, and healthcare costs. We use a crowdsourcing platform—Open Proposals—to solicit the best ideas from frontline clinicians and staff.1 Open Proposals is a secure, web-based platform for transparent and collaborative proposal development that displays threads of comments, responses, and revisions, and allows submissions to be “liked.” Open Proposals is managed by the UCSF Clinical and Translational Science Institute, funded by the National Center for Advancing Translational Sciences (Grant Number UL1 TR000004) at the National Institutes of Health. Using institutional e-mail lists for faculty, staff and residents, as well as described at monthly managers and directors meetings, the Ideas Contest is announced each year by the Chief Medical Officer and the CHV leadership. The Caring Wisely® Executive Steering Committee, which consists of CHV and senior UCSF Health system leaders, selects the top 5-10 ideas based on the above criteria. Each winning idea receives a $100 gift certificate for a popular restaurant in San Francisco, and the list of winners is announced to the entire UCSF community.
The second stage is the Request for Proposals. The Caring Wisely® program solicits proposals that outline implementation plans to target specific areas identified through the Ideas Contest. Finalists from the Ideas Contest are encouraged to submit proposals that address the problem they identified, but anyone affiliated with UCSF Health may submit a proposal on a winning idea. There is an approximately 4-week open submission period during which applicants submit brief 2-page proposals on the Open Proposal platform. This is followed by a period of optimization that leverages the social media aspect of the Open Proposals platform in which the UCSF Health community asks clarifying questions, make suggestions, and modifications can be made to the proposals. All submissions receive written feedback from at least one Steering Committee member. In addition, the Caring Wisely® Director directly invites relevant UCSF colleagues, administrators, or program leaders to comment on proposals and make suggestions for improvement. Plans for assessing financial and health care delivery impacts are developed in collaboration with the UCSF Health Finance department. UCSF Health managers and leaders who are stakeholders in project proposal areas are consulted to provide input and finalize proposal plans, including the identification of existing personnel who can support and drive the project forward. Proposers use this feedback to revise their applications throughout this stage.
The third stage is Project Implementation. The Caring Wisely® Executive Steering Committee selects up to 3 winners from the submitted proposals. Using the program criteria above, each project is scored independently, discussed in committee, and rescored to identify the top proposals. Each selected project receives a maximum budget of $50,000 that can be used for project materials, activities, and salary support for project leaders or staff. In addition to funding, each project team receives input from the implementation science team to co-develop and implement the intervention with a goal of creating a first-test-of-change within 3-6 months. A key feature of Caring Wisely® is the partnership between project teams and the Caring Wisely® implementation team, which includes a director, program manager, data analysts, and implementation scientists (Table 1).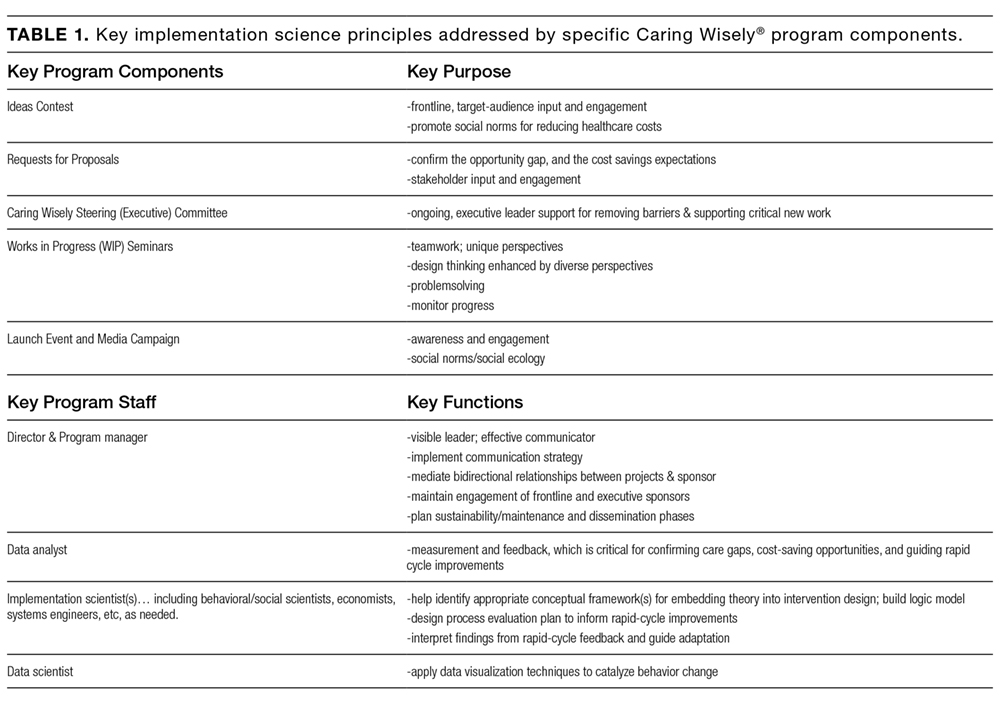
The $150,000 administrative budget for the Caring Wisely® program provides 20% support of the medical director, 50% support of a program manager/analyst, and 10% support of an implementation scientist. Approximately 5% support is donated from additional senior implementation scientists and various UCSF Health experts based on project needs. To make most efficient use of the Caring Wisely® program staff time with the project teams, there is a weekly 60-90 minute works-in-progress session attended by all 3 teams with a rotating schedule for lead presenter during the first 6 months; these meetings occur every 2-3 weeks during the second 6 months. Caring Wisely® program staff and the implementation scientist are also available for 1:1 meetings as needed. The Caring Wisely® Executive Steering Committee is not paid and meets for 90 minutes quarterly. Custom reports and modifications of the electronic health record are provided by the UCSF Health clinical informatics department as part of their operating budget.
The collaboration between the project teams and the implementation science team is guided by the Consolidated Framework for Implementation Research (CFIR)2 and PRECEDE-PROCEED model—a logic model and evaluation tool that is based on a composite of individual behavior change theory and social ecology.3 Table 2 illustrates how we weave PRECEDE-PROCEED and Plan-Do-Study-Act frameworks into project design and strategy. Each funded team is required to submit an end-of-year progress report.
Cost and cost savings estimates were based on administrative financial data obtained through the assistance of the Decision Support Services unit of the Finance Department of UCSF Health. All costs reflect direct institutional costs, rather than charges. For some projects, costs are directly available through computerized dashboards that provide year-to-year comparisons of specific costs of materials, supplies, and services (eg, blood transfusion reduction, surgical supplies project, OR efficiency program). This same dashboard also allows calculation of CMI-adjusted direct costs of hospital care by service line, as used in the perioperative pathways program evaluation. In other cases, the Decision Support Services and/or Caring Wisely® program manager created custom cost reports based on the key performance indicator (eg, nebulizer therapy costs consist of medication costs plus respiratory therapist time; CT scan utilization for suspected pulmonary embolus in emergency department; and antimicrobial utilization for suspected neonatal sepsis).
Ongoing monitoring and sustainability of Caring Wisely® projects is supported by the Caring Wisely® program leaders. Monitoring of ongoing cost savings is based on automated service-line level dashboards related to cost, utilization, and quality outcomes with quarterly updates provided to the Caring Wisely® Steering Committee. Depending on the project or program, appropriate UCSF Health senior leaders determine the level of support within their departments that is required to sustain the program(s). Ongoing monitoring of each program is also included in the strategic deployment visibility room with regular rounding by senior health system executives.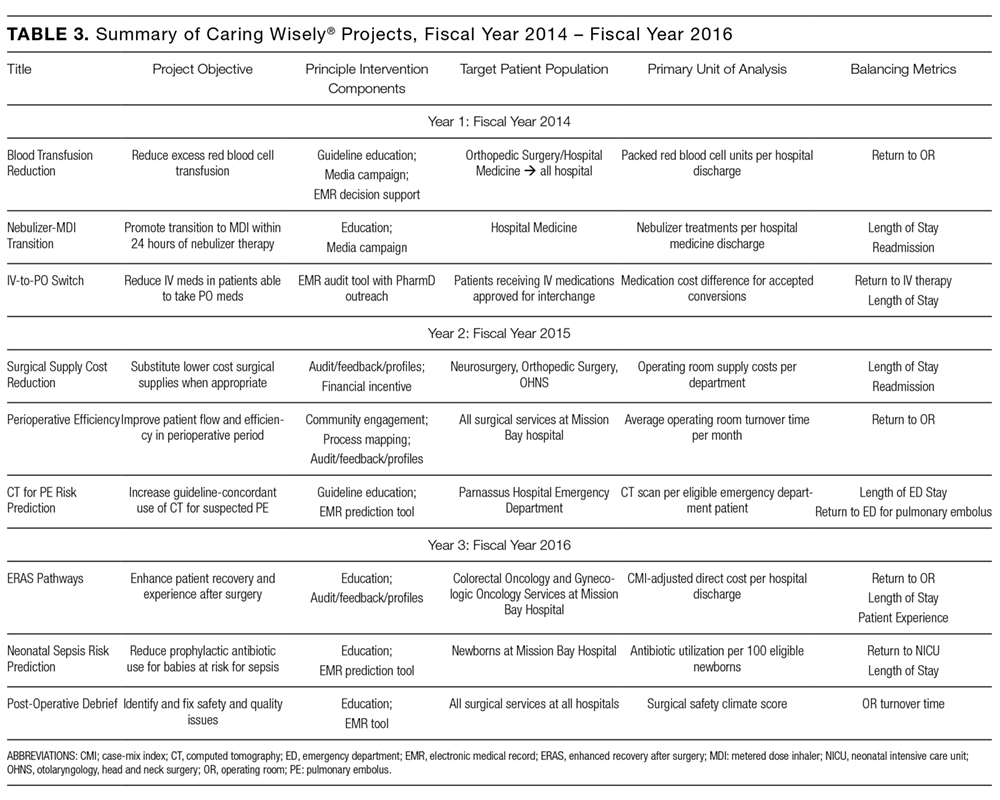
Since 2013, there have been 3 complete Caring Wisely® cycles. The Ideas Contest generated more than 75 ideas in each of the past 3 cycles, ranging from eliminating redundant laboratory or radiological studies to reducing linen and food waste. We received between 13-20 full proposals in each of the request for proposal stages, and 9 projects have been implemented, 3 in each year. Funded projects have been led by a variety of individuals including physicians, nurses, pharmacists, administrators and residents, and topics have ranged from reducing overutilization of tests, supplies and treatments, to improving patient throughput during the perioperative period (Table 3). Estimated cumulative savings to date from Caring Wisely® projects has exceeded $4 million, based on the four projects shown in Table 4. The IV-to-PO switch program and the neonatal sepsis risk prediction project (Table 3) have been successful in reducing unnecessary utilization, but cost and savings estimates are not yet finalized. Three funded projects were equivocal in cost savings but were successful in their primary aims: (1) increasing the appropriateness of CT scan ordering for suspected pulmonary embolus; (2) shortening operating room turnover times; and (3) implementing a postoperative debrief program for the systematic documentation of safety events, waste, and inefficiencies related to surgery.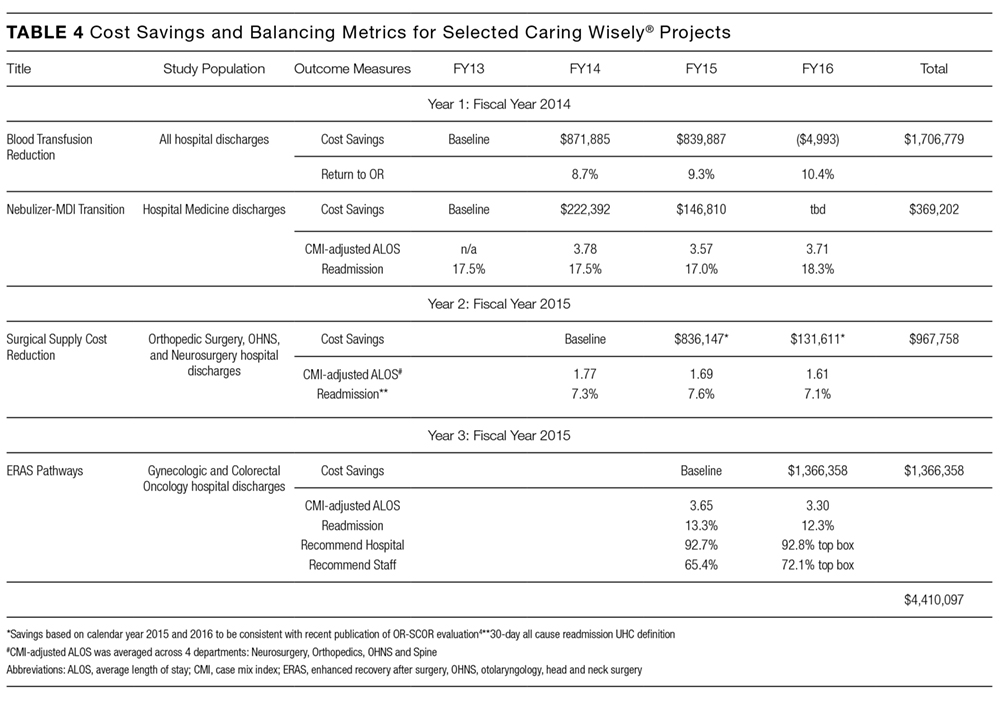
We developed an innovative program that reduces hospital costs through crowdsourcing of ideas from frontline clinicians and staff, and by connecting these ideas to project and implementation science teams. At a time when healthcare costs have reached unsustainable levels, the Caring Wisely® program provides a process for healthcare personnel to make a positive impact on healthcare costs in areas under their direct control. Through the Open Proposals platform, we have tapped a growing desire among frontline providers to reduce medical waste.
A key criterion for the Caring Wisely® program is to propose changes that reduce cost without adversely affect healthcare quality or outcomes. While this is an important consideration in selecting projects, there is limited power to detect many of the most clinically relevant outcomes. We find this acceptable because many of the sponsored Caring Wisely® project goals were to increase compliance with evidence-based practice guidelines and reduce harms associated with unnecessary treatments (eg, blood transfusion, nebulizer therapy, CT scan, antimicrobial therapy). Selected balancing metrics for each project are reported by established quality and safety programs at UCSF Health, but we acknowledge that many factors that can affect these clinical outcomes are not related to the cost-reduction intervention and are not possible to control outside of a clinical research study. Therefore, any response to changes in these outcome and balancing measures requires further analysis beyond the Caring Wisely® project alone.
We believe one of the key factors in the success of the Caring Wisely® program is the application of implementation science principles to the intervention design strategies (Table 1). These principles included stakeholder engagement, behavior change theory, market (target audience) segmentation, and process measurement and feedback. Because we are conducting this program in an academic health center, resident and fellow education and engagement are also critical to success. In each project, we utilize the PRECEDE model as a guide to ensure that each intervention design includes complementary elements of effective behavior change, intended to increase awareness and motivation to change, to make change “easy,” and to reinforce change(Table 2).3
The Caring Wisely® program—itself a multifaceted intervention—embodies the same PRECEDE dimensions we apply to each specific project. The Ideas Contest serves as a tool for increasing awareness, attitudes, and motivation across the clinical enterprise for reducing healthcare costs. The support provided to the project teams by the Caring Wisely® program is an enabling factor that makes it “easier” for frontline teams to design and implement interventions with a greater likelihood of achieving early success. Timely measurement and feedback of results to the hospital leadership and broadcasting to the larger community reinforces the support of the program at both the leadership and frontline levels.
Collaboration between project teams and the Caring Wisely® program also provides frontline clinicians and staff with practical experience and lessons that they can apply to future improvement work. Project teams learn implementation science principles such as constructing a pragmatic theoretical framework to guide implementation design using CFIR model.2 Incorporating multiple, rapid-cycle tests of change allows teams to modify and adapt final interventions as they learn how the target audience and environment responds to specific intervention components. Access to real-time, actionable data and a data analyst is essential to rapid cycle adaptation that allows teams to focus on specific units or providers. We also find that cross-fertilization between project teams working in different areas helps to share resources and minimize duplication of efforts from the clinical and staff champions. Partnering with UCSF Health system leaders at every phase of project development—from proposal selection, development, and final evaluation of results—enhances sustainable transition of successful projects into clinical operations.
The costs and coordination for the first cycle of Caring Wisely® were supported by the UCSF Center for Healthcare Value. Upon completion of the evaluation of the first cycle, UCSF Health agreed to fund the program going forward, with the expectation that Caring Wisely would continue to achieve direct cost-savings for the organization. The Caring Wisely team provides a final report each year detailing the impact of each project on utilization and associated costs. Currently, program costs are approximately $150,000 for the Caring Wisely program leaders, staff, and other resources, and $50,000 for each of 3 projects for a total program cost of $300,000 per year. Projects included in the first three cycles have already saved more than $4 million, representing a strong return on investment. This program could be a model for other academic health centers to engage frontline clinicians and staff in addressing healthcare costs, and lends itself to being scaled-up into a multi-system collaborative.
LIST OF ABBREVIATIONS
UCSF—University of California, San Francisco; PRECEDE—Predisposing, Reinforcing, and Enabling Constructs in Educational Diagnosis and Evaluation; PROCEED—Policy, Regulatory and Organizational Constructs in Educational and Environmental Development
Acknowledgments
Other participants in blood transfusion reduction project (D. Johnson, K. Curcione); IV-to-PO Switch (C. Tsourounis, A. Pollock); Surgical Supply Cost Reduction (C. Zygourakis); Perioperative Efficiency (L. Hampson); CT for PE Risk Prediction (E. Weber); ERAS Pathways (L. Chen); Neonatal Sepsis Risk Prediction (T. Newman); Post-Operative Debrief (S. Imershein). Caring Wisely Executive Steering Committee (J. Adler, S. Antrum, A Auerbach, J. Bennan, M. Blum, C. Ritchie, C. Tsourounis). This Center for Healthcare Value is funded in part by a grant from the Grove Foundation. We appreciate additional review and comments to the manuscript provided by George Sawaya and Adams Dudley.
Disclosures
Christopher Moriates has accepted royalties from McGraw-Hill for textbook, Understanding Value-Based Healthcare. Alvin Rajkomar has received fees as a research adviser from Google, Inc.
1. Kahlon M, Yuan L, Gologorskaya O, Johnston SC. Crowdsourcing the CTSA innovation mission. Clin Transl Sci. 2014;7:89-92. PubMed
2. Damschroder LJ, Aron DC, Keith RE, Kirsh SR, Alexander JA, Lowery JC. Fostering implementation of health services research findings into practice: a consolidated framework for advancing implementation science. Implement Sci. 2009;4:50. PubMed
3. Green LW and Kreuter. Health Program Planning: An Educational and Ecological Approach. 4th Ed. McGraw-Hill. New York, NY. 2005.
4. Zygourakis CC, Valencia V, Moriates C et al. Association between surgeon scorecard use and operating room costs. JAMA Surg. 2016 Dec 7. doi: 10.1001/jamasurg.2016.4674. [Epub ahead of print] PubMed
© 2017 Society of Hospital Medicine
Strategies are needed to empower frontline clinicians to work with organizational leadership to reduce healthcare costs and improve high-value care. Caring Wisely® is a program developed by the University of California, San Francisco’s (UCSF) Center for Healthcare Value (CHV), aimed at engaging frontline clinicians and staff, connecting them with implementation experts, and supporting the development of targeted interventions to improve value. Financial savings from the program more than cover program costs. Caring Wisely® provides an institutional model for implementing robust interventions to address areas of low-value care.
Launched in 2013, the annual Caring Wisely® program consists of 3 stages for identifying projects that meet the following criteria:
- Potential to measurably reduce UCSF Health’s costs of care without transferring costs to patients, insurers, or other providers
- Plan for ensuring that health outcomes are maintained or improved
- Envision disseminating the intervention within and beyond UCSF
- Demonstrate commitment and engagement of clinical leadership and frontline staff.
The first stage is the Ideas Contest, a UCSF Health-wide call (to learn more about UCSF Health: https://www.ucsf.edu/sites/default/files/052516_About_UCSF.pdf) to identify areas that may be targeted to reduce unnecessary services, inefficiencies, and healthcare costs. We use a crowdsourcing platform—Open Proposals—to solicit the best ideas from frontline clinicians and staff.1 Open Proposals is a secure, web-based platform for transparent and collaborative proposal development that displays threads of comments, responses, and revisions, and allows submissions to be “liked.” Open Proposals is managed by the UCSF Clinical and Translational Science Institute, funded by the National Center for Advancing Translational Sciences (Grant Number UL1 TR000004) at the National Institutes of Health. Using institutional e-mail lists for faculty, staff and residents, as well as described at monthly managers and directors meetings, the Ideas Contest is announced each year by the Chief Medical Officer and the CHV leadership. The Caring Wisely® Executive Steering Committee, which consists of CHV and senior UCSF Health system leaders, selects the top 5-10 ideas based on the above criteria. Each winning idea receives a $100 gift certificate for a popular restaurant in San Francisco, and the list of winners is announced to the entire UCSF community.
The second stage is the Request for Proposals. The Caring Wisely® program solicits proposals that outline implementation plans to target specific areas identified through the Ideas Contest. Finalists from the Ideas Contest are encouraged to submit proposals that address the problem they identified, but anyone affiliated with UCSF Health may submit a proposal on a winning idea. There is an approximately 4-week open submission period during which applicants submit brief 2-page proposals on the Open Proposal platform. This is followed by a period of optimization that leverages the social media aspect of the Open Proposals platform in which the UCSF Health community asks clarifying questions, make suggestions, and modifications can be made to the proposals. All submissions receive written feedback from at least one Steering Committee member. In addition, the Caring Wisely® Director directly invites relevant UCSF colleagues, administrators, or program leaders to comment on proposals and make suggestions for improvement. Plans for assessing financial and health care delivery impacts are developed in collaboration with the UCSF Health Finance department. UCSF Health managers and leaders who are stakeholders in project proposal areas are consulted to provide input and finalize proposal plans, including the identification of existing personnel who can support and drive the project forward. Proposers use this feedback to revise their applications throughout this stage.
The third stage is Project Implementation. The Caring Wisely® Executive Steering Committee selects up to 3 winners from the submitted proposals. Using the program criteria above, each project is scored independently, discussed in committee, and rescored to identify the top proposals. Each selected project receives a maximum budget of $50,000 that can be used for project materials, activities, and salary support for project leaders or staff. In addition to funding, each project team receives input from the implementation science team to co-develop and implement the intervention with a goal of creating a first-test-of-change within 3-6 months. A key feature of Caring Wisely® is the partnership between project teams and the Caring Wisely® implementation team, which includes a director, program manager, data analysts, and implementation scientists (Table 1).
The $150,000 administrative budget for the Caring Wisely® program provides 20% support of the medical director, 50% support of a program manager/analyst, and 10% support of an implementation scientist. Approximately 5% support is donated from additional senior implementation scientists and various UCSF Health experts based on project needs. To make most efficient use of the Caring Wisely® program staff time with the project teams, there is a weekly 60-90 minute works-in-progress session attended by all 3 teams with a rotating schedule for lead presenter during the first 6 months; these meetings occur every 2-3 weeks during the second 6 months. Caring Wisely® program staff and the implementation scientist are also available for 1:1 meetings as needed. The Caring Wisely® Executive Steering Committee is not paid and meets for 90 minutes quarterly. Custom reports and modifications of the electronic health record are provided by the UCSF Health clinical informatics department as part of their operating budget.
The collaboration between the project teams and the implementation science team is guided by the Consolidated Framework for Implementation Research (CFIR)2 and PRECEDE-PROCEED model—a logic model and evaluation tool that is based on a composite of individual behavior change theory and social ecology.3 Table 2 illustrates how we weave PRECEDE-PROCEED and Plan-Do-Study-Act frameworks into project design and strategy. Each funded team is required to submit an end-of-year progress report.
Cost and cost savings estimates were based on administrative financial data obtained through the assistance of the Decision Support Services unit of the Finance Department of UCSF Health. All costs reflect direct institutional costs, rather than charges. For some projects, costs are directly available through computerized dashboards that provide year-to-year comparisons of specific costs of materials, supplies, and services (eg, blood transfusion reduction, surgical supplies project, OR efficiency program). This same dashboard also allows calculation of CMI-adjusted direct costs of hospital care by service line, as used in the perioperative pathways program evaluation. In other cases, the Decision Support Services and/or Caring Wisely® program manager created custom cost reports based on the key performance indicator (eg, nebulizer therapy costs consist of medication costs plus respiratory therapist time; CT scan utilization for suspected pulmonary embolus in emergency department; and antimicrobial utilization for suspected neonatal sepsis).
Ongoing monitoring and sustainability of Caring Wisely® projects is supported by the Caring Wisely® program leaders. Monitoring of ongoing cost savings is based on automated service-line level dashboards related to cost, utilization, and quality outcomes with quarterly updates provided to the Caring Wisely® Steering Committee. Depending on the project or program, appropriate UCSF Health senior leaders determine the level of support within their departments that is required to sustain the program(s). Ongoing monitoring of each program is also included in the strategic deployment visibility room with regular rounding by senior health system executives.
Since 2013, there have been 3 complete Caring Wisely® cycles. The Ideas Contest generated more than 75 ideas in each of the past 3 cycles, ranging from eliminating redundant laboratory or radiological studies to reducing linen and food waste. We received between 13-20 full proposals in each of the request for proposal stages, and 9 projects have been implemented, 3 in each year. Funded projects have been led by a variety of individuals including physicians, nurses, pharmacists, administrators and residents, and topics have ranged from reducing overutilization of tests, supplies and treatments, to improving patient throughput during the perioperative period (Table 3). Estimated cumulative savings to date from Caring Wisely® projects has exceeded $4 million, based on the four projects shown in Table 4. The IV-to-PO switch program and the neonatal sepsis risk prediction project (Table 3) have been successful in reducing unnecessary utilization, but cost and savings estimates are not yet finalized. Three funded projects were equivocal in cost savings but were successful in their primary aims: (1) increasing the appropriateness of CT scan ordering for suspected pulmonary embolus; (2) shortening operating room turnover times; and (3) implementing a postoperative debrief program for the systematic documentation of safety events, waste, and inefficiencies related to surgery.
We developed an innovative program that reduces hospital costs through crowdsourcing of ideas from frontline clinicians and staff, and by connecting these ideas to project and implementation science teams. At a time when healthcare costs have reached unsustainable levels, the Caring Wisely® program provides a process for healthcare personnel to make a positive impact on healthcare costs in areas under their direct control. Through the Open Proposals platform, we have tapped a growing desire among frontline providers to reduce medical waste.
A key criterion for the Caring Wisely® program is to propose changes that reduce cost without adversely affect healthcare quality or outcomes. While this is an important consideration in selecting projects, there is limited power to detect many of the most clinically relevant outcomes. We find this acceptable because many of the sponsored Caring Wisely® project goals were to increase compliance with evidence-based practice guidelines and reduce harms associated with unnecessary treatments (eg, blood transfusion, nebulizer therapy, CT scan, antimicrobial therapy). Selected balancing metrics for each project are reported by established quality and safety programs at UCSF Health, but we acknowledge that many factors that can affect these clinical outcomes are not related to the cost-reduction intervention and are not possible to control outside of a clinical research study. Therefore, any response to changes in these outcome and balancing measures requires further analysis beyond the Caring Wisely® project alone.
We believe one of the key factors in the success of the Caring Wisely® program is the application of implementation science principles to the intervention design strategies (Table 1). These principles included stakeholder engagement, behavior change theory, market (target audience) segmentation, and process measurement and feedback. Because we are conducting this program in an academic health center, resident and fellow education and engagement are also critical to success. In each project, we utilize the PRECEDE model as a guide to ensure that each intervention design includes complementary elements of effective behavior change, intended to increase awareness and motivation to change, to make change “easy,” and to reinforce change(Table 2).3
The Caring Wisely® program—itself a multifaceted intervention—embodies the same PRECEDE dimensions we apply to each specific project. The Ideas Contest serves as a tool for increasing awareness, attitudes, and motivation across the clinical enterprise for reducing healthcare costs. The support provided to the project teams by the Caring Wisely® program is an enabling factor that makes it “easier” for frontline teams to design and implement interventions with a greater likelihood of achieving early success. Timely measurement and feedback of results to the hospital leadership and broadcasting to the larger community reinforces the support of the program at both the leadership and frontline levels.
Collaboration between project teams and the Caring Wisely® program also provides frontline clinicians and staff with practical experience and lessons that they can apply to future improvement work. Project teams learn implementation science principles such as constructing a pragmatic theoretical framework to guide implementation design using CFIR model.2 Incorporating multiple, rapid-cycle tests of change allows teams to modify and adapt final interventions as they learn how the target audience and environment responds to specific intervention components. Access to real-time, actionable data and a data analyst is essential to rapid cycle adaptation that allows teams to focus on specific units or providers. We also find that cross-fertilization between project teams working in different areas helps to share resources and minimize duplication of efforts from the clinical and staff champions. Partnering with UCSF Health system leaders at every phase of project development—from proposal selection, development, and final evaluation of results—enhances sustainable transition of successful projects into clinical operations.
The costs and coordination for the first cycle of Caring Wisely® were supported by the UCSF Center for Healthcare Value. Upon completion of the evaluation of the first cycle, UCSF Health agreed to fund the program going forward, with the expectation that Caring Wisely would continue to achieve direct cost-savings for the organization. The Caring Wisely team provides a final report each year detailing the impact of each project on utilization and associated costs. Currently, program costs are approximately $150,000 for the Caring Wisely program leaders, staff, and other resources, and $50,000 for each of 3 projects for a total program cost of $300,000 per year. Projects included in the first three cycles have already saved more than $4 million, representing a strong return on investment. This program could be a model for other academic health centers to engage frontline clinicians and staff in addressing healthcare costs, and lends itself to being scaled-up into a multi-system collaborative.
LIST OF ABBREVIATIONS
UCSF—University of California, San Francisco; PRECEDE—Predisposing, Reinforcing, and Enabling Constructs in Educational Diagnosis and Evaluation; PROCEED—Policy, Regulatory and Organizational Constructs in Educational and Environmental Development
Acknowledgments
Other participants in blood transfusion reduction project (D. Johnson, K. Curcione); IV-to-PO Switch (C. Tsourounis, A. Pollock); Surgical Supply Cost Reduction (C. Zygourakis); Perioperative Efficiency (L. Hampson); CT for PE Risk Prediction (E. Weber); ERAS Pathways (L. Chen); Neonatal Sepsis Risk Prediction (T. Newman); Post-Operative Debrief (S. Imershein). Caring Wisely Executive Steering Committee (J. Adler, S. Antrum, A Auerbach, J. Bennan, M. Blum, C. Ritchie, C. Tsourounis). This Center for Healthcare Value is funded in part by a grant from the Grove Foundation. We appreciate additional review and comments to the manuscript provided by George Sawaya and Adams Dudley.
Disclosures
Christopher Moriates has accepted royalties from McGraw-Hill for textbook, Understanding Value-Based Healthcare. Alvin Rajkomar has received fees as a research adviser from Google, Inc.
1. Kahlon M, Yuan L, Gologorskaya O, Johnston SC. Crowdsourcing the CTSA innovation mission. Clin Transl Sci. 2014;7:89-92. PubMed
2. Damschroder LJ, Aron DC, Keith RE, Kirsh SR, Alexander JA, Lowery JC. Fostering implementation of health services research findings into practice: a consolidated framework for advancing implementation science. Implement Sci. 2009;4:50. PubMed
3. Green LW and Kreuter. Health Program Planning: An Educational and Ecological Approach. 4th Ed. McGraw-Hill. New York, NY. 2005.
4. Zygourakis CC, Valencia V, Moriates C et al. Association between surgeon scorecard use and operating room costs. JAMA Surg. 2016 Dec 7. doi: 10.1001/jamasurg.2016.4674. [Epub ahead of print] PubMed