User login
Ammonia Levels and Hepatic Encephalopathy in Patients with Known Chronic Liver Disease
© 2017 Society of Hospital Medicine
The “Things We Do for No Reason” series reviews practices which have become common parts of hospital care but which may provide little value to our patients. Practices reviewed in the TWDFNR series do not represent “black and white” conclusions or clinical practice standards, but are meant as a starting place for research and active discussions among hospitalists and patients. We invite you to be part of that discussion. https://www.choosingwisely.org/
Ammonia is predominantly generated in the gut by intestinal bacteria and enzymes and detoxified primarily in the liver. Since the 1930s, ammonia has been identified as the principal culprit in hepatic encephalopathy (HE). Many physicians utilize serum ammonia to diagnose, assess severity, and determine the resolution of HE in patients with chronic liver disease (CLD) despite research showing that ammonia levels are unhelpful in all of these clinical circumstances. HE in patients with CLD is a clinical diagnosis of exclusion that should not be based on ammonia levels.
CASE PRESENTATION
A 62-year-old man diagnosed with cirrhosis due to Hepatitis C and alcoholism was brought to the emergency department for alteration in mentation. He had scant melenic stools 5 days preceding his admission and did not exhibit overt signs or symptoms of infection. His systemic examination was normal except for somnolence, disorientation to space and time, asterixis, and ascites. His lab parameters were within normal limits except for an elevated blood urea nitrogen and thrombocytopenia. His blood cultures did not grow any organisms, and paracentesis ruled out spontaneous bacterial peritonitis. During his hospital stay, he underwent esophageal variceal banding and was effectively managed with lactulose and rifaximin. The patient was alert, fully oriented, and without asterixis at the time of discharge 6 days later. Would an elevated venous ammonia level at admission alter management? If the ammonia level was elevated, would serial ammonia measurements affect management?
BACKGROUND


The colonic microbiome produces ammonia from dietary nitrogen. In health, approximately 85% of it is detoxified by the liver and excreted as urea in urine, while muscle and brain tissue metabolize the remaining 15%. The process of transamination and the urea cycle prevents this metabolic product from accumulating in the body. The elevated levels of nitrogenous toxins, including ammonia, in the systemic circulation of patients with CLD occur due to hepatocellular dysfunction and/or portosystemic shunting. This hyperammonemia is compounded by reduced peripheral metabolism of ammonia by muscle as a consequence of cachexia and muscle atrophy. Astrocytes synthesize glutamine excessively in the setting of hyperammonemia, resulting in astrocyte swelling and the generation of reactive oxygen species. Astrocyte swelling, free radical generation, and increased inhibitory function of gamma-Aminobutyric Acid result in cerebral dysfunction.1,2 HE manifests as a broad spectrum of neurological or psychiatric abnormalities ranging from subclinical alterations to coma and was commonly graded on the West Haven Criteria (WHC) of 0 to 4 (Table).3 The Grade 0 from the previous WHC, referenced in many trials included in this article, has been replaced with minimal HE in the newly updated WHC by the American Association for the Study of Liver Diseases and the European Association for the Study of the Liver.4,5
WHY YOU MIGHT THINK AMMONIA LEVELS HELP TO GUIDE TREATMENT OF HE IN PATIENTS WITH CLD
The ammonia hypothesis posits that ammonia is key in the pathogenesis of HE.6-10 Some of the common precipitants of HE—gastrointestinal bleeding, infection, and renal failure—promote hyperammonemia.11 HE is treated with nonabsorbable disaccharides (lactulose and lactitol) and rifaximin, which reduce the serum concentration of ammonia. Given these associations between HE and ammonia, physicians have for decades tested serum ammonia levels to diagnose HE and chart its resolution. In a study conducted by the Bavarian Society of Gastroenterology,12 60% of the respondents to an anonymous questionnaire regularly performed ammonia analysis in all their patients with liver cirrhosis, believing that it efficiently diagnosed HE.
WHY SERUM AMMONIA LEVELS DO NOT HELP IN THE DIAGNOSIS OR MANAGEMENT OF HE IN CLD PATIENTS
Accuracy of Serum Ammonia
Multiple factors affect the accuracy of ammonia levels. First, fist clenching or the use of a tourniquet during the process of phlebotomy can falsely increase ammonia levels.13 Second, some authors have argued that the source of the ammonia sample matters. Kramer et al.14 reported that partial pressure of ammonia correlated closely with the degree of clinical and electrophysiological abnormalities of HE. However, Nicolao et al.15 and Ong et al.16 showed that the blood ammonia levels, whether measured by total venous, total arterial, or partial pressure methods, were equivalent. Third, ammonia levels are dependent on the time to processing of the specimen. Inaccurate results may occur if the blood sample is not immediately placed on ice after collection or if it is not centrifuged within 15 minutes of collection.17,18
Ammonia Levels and Diagnosis of HE
Even with proper collection and processing, ammonia levels in patients with CLD do not reliably diagnose HE. Gundling et al.19 determined the sensitivity and specificity of venous ammonia levels ≥ 55 µmol/L to diagnose HE to be 47.2% and 78.3%, respectively, by using a gold standard of the WHC and the critical flicker frequency test (a psychophysiologic test). The positive predictive and negative predictive values of ammonia were 77.3% and 48.6%, with an overall diagnostic accuracy of 59.3%. Approximately 60% of the patients with Grade 3 WHC HE had a normal ammonia level in this study. Ong et al16 found that only 31% of patients with CLD and no evidence of HE had a normal ammonia level.In other words, CLD patients with normal ammonia levels can have HE, and patients with elevated ammonia levels may have normal cognitive functioning.
Furthermore, ammonia levels are not a valid tool to diagnose HE even with an oral glutamine challenge.20 Most importantly, HE is a clinical diagnosis reached following the exclusion of other likely causes of cerebral dysfunction, independent of the ammonia level.
Ammonia Levels and Staging HE
The grading of HE was introduced to assess the response to an intervention in patients with HE enrolled in clinical trials.21 Tools like the WHC (Table) categorize the severity of HE. Nicolao et al.15 noted significant overlap in the levels of ammonia between patients with HE Grades 1 and 2 when compared with patients with Grades 3 and 4. This considerable overlap in levels of ammonia was more evident among patients with Grades 0 to 2 per Ong’s study.16 Most importantly, hospitalists do not need ammonia levels to determine that a patient has HE Grade 3 or HE Grade 4 symptoms, as the stage is graded on clinical grounds only. Once other causes for cerebral dysfunction have been ruled out, the ammonia level does not add to the clinical picture.
Serial Ammonia Levels and Resolution of HE
If the ammonia hypothesis is the sole explanation for the pathogenesis of HE, then the resolution of HE symptoms should be associated with normalization of ammonia levels. Physicians have commonly followed ammonia levels serially throughout a hospital stay. Nicolao et al.15 evaluated the association of ammonia with HE. They noted that some of the CLD patients had unchanged or increasing levels of ammonia despite overt neurological improvement from their HE.15 Some have argued that the normalization of ammonia levels lag behind the clinical improvement by 48 hours after resolution of symptoms. In the Nicolao et al.15 study, ammonia levels for almost all of the patients did not normalize 48 hours after resolution of neurologic symptoms. Moreover, 29% of the patients were noted to have higher venous ammonia levels 48 hours after the resolution of neurologic symptoms.15 These data underscore why serial measurements of ammonia in patients with CLD are not useful. For patients with overt symptoms, clinicians can determine improvement based on serial exams.
RECOMMENDATIONS
- HE is a diagnosis of exclusion and is made on clinical grounds.
- Do not check serum ammonia levels in patients with CLD to diagnose HE, to assess the severity of HE, or to determine whether HE is resolving.
- Use your clinical evaluation to determine the severity and course of HE.
- Treatment should be tailored according to clinical findings, not ammonia levels.
CONCLUSION
The attraction of the ammonia theory to explain HE continues to lead physicians to check and follow blood ammonia levels in patients with CLD and suspected HE. However, ammonia measurement, as in the clinical vignette, should be replaced by a thorough clinical evaluation to rule out other causes for altered mental status. Serial exams of the patient should guide management, not ammonia levels.
Disclosure
The authors report no conflicts of interest.
Do you think this is a low-value practice? Is this truly a “Thing We Do for No Reason”? Let us know what you do in your practice and propose ideas for other “Things We Do for No Reason” topics. Please join in the conversation online at Twitter (#TWDFNR)/Facebook, and don’t forget to “Like It” on Facebook or retweet it on Twitter.
1. Tapper EB, Jiang ZG, Patwardhan VR. Refining the ammonia hypothesis: A physiology-driven approach to the treatment of hepatic encephalopathy. Mayo Clin Proc. 2015;90:646-658. PubMed
2. Parekh PJ, Balart LA. Ammonia and Its Role in the Pathogenesis of Hepatic Encephalopathy. Clin Liver Dis. 2015;19:529-537. PubMed
3. Blei AT, Córdoba J. Hepatic Encephalopathy. Am J Gastroenterol. 2001;96:1968-1976. PubMed
4. Vilstrup H, Amodio P, Bajaj J, et al. Hepatic encephalopathy in chronic liver disease: 2014 Practice Guideline by the American Association for the Study Of Liver Diseases and the European Association for the Study of the Liver. Hepatology. 2014;60:715-735. PubMed
5. Bajaj JS, Cordoba J, Mullen KD, et al. Review Article: the design of clinical trials in Hepatic Encephalopathy - an International Society for Hepatic Encephalopathy and Nitrogen Metabolism (ISHEN) consensus statement. Aliment Pharmacol Ther. 2011;33:739-747. PubMed
6. Ahboucha S, Butterworth RF. Pathophysiology of hepatic encephalopathy: A new look at GABA from the molecular standpoint. Metab Brain Dis. 2004;19:331-343. PubMed
7. Butterworth RF. Pathophysiology of Hepatic Encephalopathy: A New Look at Ammonia. 2003;17:1-7. PubMed
8. Schafer DF, Fowler JM, Munson PJ, Thakur AK, Waggoner JG, Jones EA. Gamma-aminobutyric acid and benzodiazepine receptors in an animal model of fulminant hepatic failure. J Lab Clin Med. 1983;102:870-880. PubMed
9. Michalak A, Rose C, Butterworth J, Butterworth RF. Neuroactive amino acids and glutamate (NMDA) receptors in frontal cortex of rats with experimental acute liver failure. Hepatology. 1996;24:908-13. PubMed
10. Bassett ML, Mullen KD, Scholz B, Fenstermacher JD, Jones EA. Increased brain uptake of gamma-aminobutyric acid in a rabbit model of hepatic encephalopathy. Gastroenterology. 1990;98:747-757. PubMed
11. Clay AS, Hainline BE. Hyperammonemia in the ICU. Chest. 2007;132:1368-1378. PubMed
12. Gundling F, Seidl H, Schmidt T, Schepp W. Blood ammonia level in liver cirrhosis: a conditio sine qua non to confirm hepatic encephalopathy? Eur J Gastroenterol Hepatol. 2008;20:246-247. PubMed
13. Stahl J. Studies of the Blood Ammonia in Liver Disease: Its Diagnostic, Prognostic and Therapeutic Significance. Ann Intern Med. 1963;58:1–24. PubMed
14. Kramer L, Tribl B, Gendo A, et al. Partial pressure of ammonia versus ammonia in hepatic encephalopathy. Hepatology. 2000;31:30-34. PubMed
15. Nicolao F, Masini A, Manuela M, Attili AF, Riggio O. Role of determination of partial pressure of ammonia in cirrhotic patients with or without hepatic encephalopathy. J Hepatol. 2003;38:441-446. PubMed
16. Ong JP, Aggarwal A, Krieger D, et al. Correlation between ammonia levels and the severity of hepatic encephalopathy. Am J Med. 2003;114:188-193. PubMed
17. Da Fonseca-Wollheim F. Preanalytical increase of ammonia in blood specimens from healthy subjects. Clin Chem. 1990;36:1483-1487. PubMed
18. Howanitz JH, Howanitz PJ, Skrodzki CA, Iwanski JA. Influences of specimen processing and storage conditions on results for plasma ammonia. Clin Chem. 1984;30:906-908. PubMed
19. Gundling F, Zelihic E, Seidl H, et al. How to diagnose hepatic encephalopathy in the emergency department. Ann Hepatol. 2013;12:108-114. PubMed
20. Ditisheim S, Giostra E, Burkhard PR, et al. A capillary blood ammonia bedside test following glutamine load to improve the diagnosis of hepatic encephalopathy in cirrhosis. BMC Gastroenterol. 2011;11:134. PubMed
21. Conn HO, Leevy CM, Vlahcevic ZR, et al. Comparison of lactulose and neomycin in the treatment of chronic portal-systemic encephalopathy. A double blind controlled trial. Gastroenterology. 1977;72:573-583. PubMed
© 2017 Society of Hospital Medicine
The “Things We Do for No Reason” series reviews practices which have become common parts of hospital care but which may provide little value to our patients. Practices reviewed in the TWDFNR series do not represent “black and white” conclusions or clinical practice standards, but are meant as a starting place for research and active discussions among hospitalists and patients. We invite you to be part of that discussion. https://www.choosingwisely.org/
Ammonia is predominantly generated in the gut by intestinal bacteria and enzymes and detoxified primarily in the liver. Since the 1930s, ammonia has been identified as the principal culprit in hepatic encephalopathy (HE). Many physicians utilize serum ammonia to diagnose, assess severity, and determine the resolution of HE in patients with chronic liver disease (CLD) despite research showing that ammonia levels are unhelpful in all of these clinical circumstances. HE in patients with CLD is a clinical diagnosis of exclusion that should not be based on ammonia levels.
CASE PRESENTATION
A 62-year-old man diagnosed with cirrhosis due to Hepatitis C and alcoholism was brought to the emergency department for alteration in mentation. He had scant melenic stools 5 days preceding his admission and did not exhibit overt signs or symptoms of infection. His systemic examination was normal except for somnolence, disorientation to space and time, asterixis, and ascites. His lab parameters were within normal limits except for an elevated blood urea nitrogen and thrombocytopenia. His blood cultures did not grow any organisms, and paracentesis ruled out spontaneous bacterial peritonitis. During his hospital stay, he underwent esophageal variceal banding and was effectively managed with lactulose and rifaximin. The patient was alert, fully oriented, and without asterixis at the time of discharge 6 days later. Would an elevated venous ammonia level at admission alter management? If the ammonia level was elevated, would serial ammonia measurements affect management?
BACKGROUND
The colonic microbiome produces ammonia from dietary nitrogen. In health, approximately 85% of it is detoxified by the liver and excreted as urea in urine, while muscle and brain tissue metabolize the remaining 15%. The process of transamination and the urea cycle prevents this metabolic product from accumulating in the body. The elevated levels of nitrogenous toxins, including ammonia, in the systemic circulation of patients with CLD occur due to hepatocellular dysfunction and/or portosystemic shunting. This hyperammonemia is compounded by reduced peripheral metabolism of ammonia by muscle as a consequence of cachexia and muscle atrophy. Astrocytes synthesize glutamine excessively in the setting of hyperammonemia, resulting in astrocyte swelling and the generation of reactive oxygen species. Astrocyte swelling, free radical generation, and increased inhibitory function of gamma-Aminobutyric Acid result in cerebral dysfunction.1,2 HE manifests as a broad spectrum of neurological or psychiatric abnormalities ranging from subclinical alterations to coma and was commonly graded on the West Haven Criteria (WHC) of 0 to 4 (Table).3 The Grade 0 from the previous WHC, referenced in many trials included in this article, has been replaced with minimal HE in the newly updated WHC by the American Association for the Study of Liver Diseases and the European Association for the Study of the Liver.4,5
WHY YOU MIGHT THINK AMMONIA LEVELS HELP TO GUIDE TREATMENT OF HE IN PATIENTS WITH CLD
The ammonia hypothesis posits that ammonia is key in the pathogenesis of HE.6-10 Some of the common precipitants of HE—gastrointestinal bleeding, infection, and renal failure—promote hyperammonemia.11 HE is treated with nonabsorbable disaccharides (lactulose and lactitol) and rifaximin, which reduce the serum concentration of ammonia. Given these associations between HE and ammonia, physicians have for decades tested serum ammonia levels to diagnose HE and chart its resolution. In a study conducted by the Bavarian Society of Gastroenterology,12 60% of the respondents to an anonymous questionnaire regularly performed ammonia analysis in all their patients with liver cirrhosis, believing that it efficiently diagnosed HE.
WHY SERUM AMMONIA LEVELS DO NOT HELP IN THE DIAGNOSIS OR MANAGEMENT OF HE IN CLD PATIENTS
Accuracy of Serum Ammonia
Multiple factors affect the accuracy of ammonia levels. First, fist clenching or the use of a tourniquet during the process of phlebotomy can falsely increase ammonia levels.13 Second, some authors have argued that the source of the ammonia sample matters. Kramer et al.14 reported that partial pressure of ammonia correlated closely with the degree of clinical and electrophysiological abnormalities of HE. However, Nicolao et al.15 and Ong et al.16 showed that the blood ammonia levels, whether measured by total venous, total arterial, or partial pressure methods, were equivalent. Third, ammonia levels are dependent on the time to processing of the specimen. Inaccurate results may occur if the blood sample is not immediately placed on ice after collection or if it is not centrifuged within 15 minutes of collection.17,18
Ammonia Levels and Diagnosis of HE
Even with proper collection and processing, ammonia levels in patients with CLD do not reliably diagnose HE. Gundling et al.19 determined the sensitivity and specificity of venous ammonia levels ≥ 55 µmol/L to diagnose HE to be 47.2% and 78.3%, respectively, by using a gold standard of the WHC and the critical flicker frequency test (a psychophysiologic test). The positive predictive and negative predictive values of ammonia were 77.3% and 48.6%, with an overall diagnostic accuracy of 59.3%. Approximately 60% of the patients with Grade 3 WHC HE had a normal ammonia level in this study. Ong et al16 found that only 31% of patients with CLD and no evidence of HE had a normal ammonia level.In other words, CLD patients with normal ammonia levels can have HE, and patients with elevated ammonia levels may have normal cognitive functioning.
Furthermore, ammonia levels are not a valid tool to diagnose HE even with an oral glutamine challenge.20 Most importantly, HE is a clinical diagnosis reached following the exclusion of other likely causes of cerebral dysfunction, independent of the ammonia level.
Ammonia Levels and Staging HE
The grading of HE was introduced to assess the response to an intervention in patients with HE enrolled in clinical trials.21 Tools like the WHC (Table) categorize the severity of HE. Nicolao et al.15 noted significant overlap in the levels of ammonia between patients with HE Grades 1 and 2 when compared with patients with Grades 3 and 4. This considerable overlap in levels of ammonia was more evident among patients with Grades 0 to 2 per Ong’s study.16 Most importantly, hospitalists do not need ammonia levels to determine that a patient has HE Grade 3 or HE Grade 4 symptoms, as the stage is graded on clinical grounds only. Once other causes for cerebral dysfunction have been ruled out, the ammonia level does not add to the clinical picture.
Serial Ammonia Levels and Resolution of HE
If the ammonia hypothesis is the sole explanation for the pathogenesis of HE, then the resolution of HE symptoms should be associated with normalization of ammonia levels. Physicians have commonly followed ammonia levels serially throughout a hospital stay. Nicolao et al.15 evaluated the association of ammonia with HE. They noted that some of the CLD patients had unchanged or increasing levels of ammonia despite overt neurological improvement from their HE.15 Some have argued that the normalization of ammonia levels lag behind the clinical improvement by 48 hours after resolution of symptoms. In the Nicolao et al.15 study, ammonia levels for almost all of the patients did not normalize 48 hours after resolution of neurologic symptoms. Moreover, 29% of the patients were noted to have higher venous ammonia levels 48 hours after the resolution of neurologic symptoms.15 These data underscore why serial measurements of ammonia in patients with CLD are not useful. For patients with overt symptoms, clinicians can determine improvement based on serial exams.
RECOMMENDATIONS
- HE is a diagnosis of exclusion and is made on clinical grounds.
- Do not check serum ammonia levels in patients with CLD to diagnose HE, to assess the severity of HE, or to determine whether HE is resolving.
- Use your clinical evaluation to determine the severity and course of HE.
- Treatment should be tailored according to clinical findings, not ammonia levels.
CONCLUSION
The attraction of the ammonia theory to explain HE continues to lead physicians to check and follow blood ammonia levels in patients with CLD and suspected HE. However, ammonia measurement, as in the clinical vignette, should be replaced by a thorough clinical evaluation to rule out other causes for altered mental status. Serial exams of the patient should guide management, not ammonia levels.
Disclosure
The authors report no conflicts of interest.
Do you think this is a low-value practice? Is this truly a “Thing We Do for No Reason”? Let us know what you do in your practice and propose ideas for other “Things We Do for No Reason” topics. Please join in the conversation online at Twitter (#TWDFNR)/Facebook, and don’t forget to “Like It” on Facebook or retweet it on Twitter.
1. Tapper EB, Jiang ZG, Patwardhan VR. Refining the ammonia hypothesis: A physiology-driven approach to the treatment of hepatic encephalopathy. Mayo Clin Proc. 2015;90:646-658. PubMed
2. Parekh PJ, Balart LA. Ammonia and Its Role in the Pathogenesis of Hepatic Encephalopathy. Clin Liver Dis. 2015;19:529-537. PubMed
3. Blei AT, Córdoba J. Hepatic Encephalopathy. Am J Gastroenterol. 2001;96:1968-1976. PubMed
4. Vilstrup H, Amodio P, Bajaj J, et al. Hepatic encephalopathy in chronic liver disease: 2014 Practice Guideline by the American Association for the Study Of Liver Diseases and the European Association for the Study of the Liver. Hepatology. 2014;60:715-735. PubMed
5. Bajaj JS, Cordoba J, Mullen KD, et al. Review Article: the design of clinical trials in Hepatic Encephalopathy - an International Society for Hepatic Encephalopathy and Nitrogen Metabolism (ISHEN) consensus statement. Aliment Pharmacol Ther. 2011;33:739-747. PubMed
6. Ahboucha S, Butterworth RF. Pathophysiology of hepatic encephalopathy: A new look at GABA from the molecular standpoint. Metab Brain Dis. 2004;19:331-343. PubMed
7. Butterworth RF. Pathophysiology of Hepatic Encephalopathy: A New Look at Ammonia. 2003;17:1-7. PubMed
8. Schafer DF, Fowler JM, Munson PJ, Thakur AK, Waggoner JG, Jones EA. Gamma-aminobutyric acid and benzodiazepine receptors in an animal model of fulminant hepatic failure. J Lab Clin Med. 1983;102:870-880. PubMed
9. Michalak A, Rose C, Butterworth J, Butterworth RF. Neuroactive amino acids and glutamate (NMDA) receptors in frontal cortex of rats with experimental acute liver failure. Hepatology. 1996;24:908-13. PubMed
10. Bassett ML, Mullen KD, Scholz B, Fenstermacher JD, Jones EA. Increased brain uptake of gamma-aminobutyric acid in a rabbit model of hepatic encephalopathy. Gastroenterology. 1990;98:747-757. PubMed
11. Clay AS, Hainline BE. Hyperammonemia in the ICU. Chest. 2007;132:1368-1378. PubMed
12. Gundling F, Seidl H, Schmidt T, Schepp W. Blood ammonia level in liver cirrhosis: a conditio sine qua non to confirm hepatic encephalopathy? Eur J Gastroenterol Hepatol. 2008;20:246-247. PubMed
13. Stahl J. Studies of the Blood Ammonia in Liver Disease: Its Diagnostic, Prognostic and Therapeutic Significance. Ann Intern Med. 1963;58:1–24. PubMed
14. Kramer L, Tribl B, Gendo A, et al. Partial pressure of ammonia versus ammonia in hepatic encephalopathy. Hepatology. 2000;31:30-34. PubMed
15. Nicolao F, Masini A, Manuela M, Attili AF, Riggio O. Role of determination of partial pressure of ammonia in cirrhotic patients with or without hepatic encephalopathy. J Hepatol. 2003;38:441-446. PubMed
16. Ong JP, Aggarwal A, Krieger D, et al. Correlation between ammonia levels and the severity of hepatic encephalopathy. Am J Med. 2003;114:188-193. PubMed
17. Da Fonseca-Wollheim F. Preanalytical increase of ammonia in blood specimens from healthy subjects. Clin Chem. 1990;36:1483-1487. PubMed
18. Howanitz JH, Howanitz PJ, Skrodzki CA, Iwanski JA. Influences of specimen processing and storage conditions on results for plasma ammonia. Clin Chem. 1984;30:906-908. PubMed
19. Gundling F, Zelihic E, Seidl H, et al. How to diagnose hepatic encephalopathy in the emergency department. Ann Hepatol. 2013;12:108-114. PubMed
20. Ditisheim S, Giostra E, Burkhard PR, et al. A capillary blood ammonia bedside test following glutamine load to improve the diagnosis of hepatic encephalopathy in cirrhosis. BMC Gastroenterol. 2011;11:134. PubMed
21. Conn HO, Leevy CM, Vlahcevic ZR, et al. Comparison of lactulose and neomycin in the treatment of chronic portal-systemic encephalopathy. A double blind controlled trial. Gastroenterology. 1977;72:573-583. PubMed
Impact of a Safety Huddle–Based Intervention on Monitor Alarm Rates in Low-Acuity Pediatric Intensive Care Unit Patients
BACKGROUND
Physiologic monitors are intended to prevent cardiac and respiratory arrest by generating alarms to alert clinicians to signs of instability. To minimize the probability that monitors will miss signs of deterioration, alarm algorithms and default parameters are often set to maximize sensitivity while sacrificing specificity.1 As a result, monitors generate large numbers of nonactionable alarms—alarms that are either invalid and do not accurately represent the physiologic status of the patient or are valid but do not warrant clinical intervention.2 Prior research has demonstrated that the pediatric intensive care unit (PICU) is responsible for a higher proportion of alarms than pediatric wards3 and a large proportion of these alarms, 87% - 97%, are nonactionable.4-8 In national surveys of healthcare staff, respondents report that high alarm rates interrupt patient care and can lead clinicians to disable alarms entirely.9 Recent research has supported this, demonstrating that nurses who are exposed to higher numbers of alarms have slower response times to alarms.4,10 In an attempt to mitigate safety risks, the Joint Commission in 2012 issued recommendations for hospitals to (a) establish guidelines for tailoring alarm settings and limits for individual patients and (b) identify situations in which alarms are not clinically necessary.11
In order to address these recommendations within our PICU, we sought to evaluate the impact of a focused physiologic monitor alarm reduction intervention integrated into safety huddles. Safety huddles are brief, structured discussions among physicians, nurses, and other staff aiming to identify safety concerns.12 Huddles offer an appropriate forum for reviewing alarm data and identifying patients whose high alarm rates may necessitate safe tailoring of alarm limits. Pilot data demonstrating high alarm rates among low-acuity PICU patients led us to hypothesize that low-acuity, high-alarm PICU patients would be a safe and effective target for an alarm huddle-based intervention.
In this study, we aimed to measure the impact of a structured safety huddle review of low-acuity PICU patients with high rates of priority alarms who were randomized to intervention compared with other low-acuity, high-alarm, concurrent, and historical control patients in the PICU.
METHODS
Study Definitions
Priority alarm activation rate. We conceptualized priority alarms as any alarm for a clinical condition that requires a timely response to determine if intervention is necessary to save a patient’s life,4 yet little empirical data support its existence in the hospital. We operationally defined these alarms on the General Electric Solar physiologic monitoring devices as any potentially life-threatening events including lethal arrhythmias (asystole, ventricular tachycardia, and ventricular fibrillation) and alarms for vital signs (heart rate, respiratory rate, and oxygen saturation) outside of the set parameter limits. These alarms produced audible tones in the patient room and automatically sent text messages to the nurse’s phone and had the potential to contribute to alarm fatigue regardless of the nurse’s location.
High-alarm patients. High-alarm patients were those who had more than 40 priority alarms in the preceding 4 hours, representing the top 20% of alarm rates in the PICU according to prior quality improvement projects completed in our PICU.
Low-acuity patients. Prior to and during this study, patient acuity was determined using the OptiLink Patient Classification System (OptiLink Healthcare Management Systems, Inc.; Tigard, OR; www.optilinkhealthcare.com; see Appendix 1) for the PICU twice daily. Low-acuity patients comprised on average 16% of the PICU patients.
Setting and Subjects
This study was performed in the PICU at The Children’s Hospital of Philadelphia.
The PICU is made up of 3 separate wings: east, south, and west. Bed availability was the only factor determining patient placement on the east, south, or west wing; the physical bed location was not preferentially assigned based on diagnosis or disease severity. The east wing was the intervention unit where the huddles occurred.
The PICU is composed of 3 different geographical teams. Two of the teams are composed of 4 to 5 pediatric or emergency medicine residents, 1 fellow, and 1 attending covering the south and west wings. The third team, located on the east wing, is composed of 1 to 2 pediatric residents, 2 to 3 nurse practitioners, 1 fellow, and 1 attending. Bedside family-centered rounds are held at each patient room, with the bedside nurse participating by reading a nursing rounding script that includes vital signs, vascular access, continuous medications, and additional questions or concerns.
Control subjects were any monitored patients on any of the 3 wings of the PICU between April 1, 2015, and October 31, 2015. The control patients were in 2 categories: historical controls from April 1, 2015, to May 31, 2015, and concurrent controls from June 1, 2015, to October 31, 2015, who were located anywhere in the PICU. On each nonholiday weekday beginning June 1, 2015, we randomly selected up to 2 patients to receive the intervention. These were high-alarm, low-acuity patients on the east wing to be discussed in the daily morning huddle. If more than 2 high-alarm, low-acuity patients were eligible for intervention, they were randomly selected by using the RAND function in Microsoft Excel. The other low-acuity, high-alarm patients in the PICU were included as control patients. Patients were eligible for the study if they were present for the 4 hours prior to huddle and present past noon on the day of huddle. If patients met criteria as high-alarm, low-acuity patients on multiple days, they could be enrolled as intervention or control patients multiple times. Patients’ alarm rates were calculated by dividing the number of alarms by their length of stay to the minute. There was no adjustment made for patients enrolled more than once.
Human Subjects Protection
The Institutional Review Board of The Children’s Hospital of Philadelphia approved this study with a waiver of informed consent.
Alarm Capture
We used BedMasterEx (Excel Medical Electronics; Jupiter, FL, http://excel-medical.com/products/bedmaster-ex) software connected to the General Electric monitor network to measure alarm rates. The software captured, in near real time, every alarm that occurred on every monitor in the PICU. Alarm rates over the preceding 4 hours for all PICU patients were exported and summarized by alarm type and level as set by hospital policy (crisis, warning, advisory, and system warning). Crisis and warning alarms were included as they represented potential life-threatening events meeting the definition of priority alarms. Physicians used an order within the PICU admission order-set to order monitoring based on preset age parameters (see online Appendix 1 for default settings). Physician orders were required for nurses to change alarm parameters. Daily electrode changes to reduce false alarms were standard of care.
Primary Outcome
The primary outcome was the change in priority alarm activation rate (the number of priority alarms per day) from prehuddle period (24 hours before morning huddle) to posthuddle period (the 24 hours following morning huddle) for intervention cases as compared with controls.
Primary Intervention
The intervention consisted of integrating a short script to facilitate the discussion of the alarm data during existing safety huddle and rounding workflows. The discussion and subsequent workflow proceeded as follows: A member of the research team who was not involved in patient care brought an alarm data sheet for each randomly selected intervention patient on the east wing to each safety huddle. The huddles were attended by the outgoing night charge nurse, the day charge nurse, and all bedside nurses working on the east wing that day. The alarm data sheet provided to the charge nurse displayed data on the 1 to 2 alarm parameters (respiratory rate, heart rate, or pulse oximetry) that generated the highest number of alarms. The charge nurse listed the high-alarm patients by room number during huddle, and the alarm data sheet was given to the bedside nurse responsible for the patient to facilitate further scripted discussion during bedside rounds with patient-specific information to reduce the alarm rates of individual patients throughout the adjustment of physiologic monitor parameters (see Appendix 2 for sample data sheet and script).
Data Collection
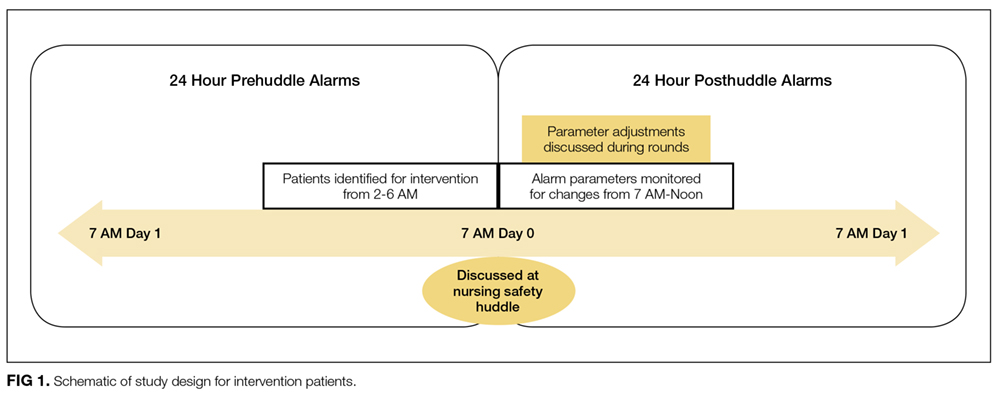
Intervention patients were high-alarm, low-acuity patients on the east wing from June 1, 2015, through October 31, 2015. Two months of baseline data were gathered prior to intervention on all 3 wings; therefore, control patients were high-alarm, low-acuity patients throughout the PICU from April 1, 2015, to May 31, 2015, as historical controls and from June 1, 2015, to October 31, 2015, as concurrent controls. Alarm rates for the 24 hours prior to huddle and the 24 hours following huddle were collected and analyzed. See Figure 1 for schematic of study design.
We collected data on patient characteristics, including patient location, age, sex, and intervention date. Information regarding changes to monitor alarm parameters for both intervention and control patients during the posthuddle period (the period following morning huddle until noon on intervention day) was also collected. We monitored for code blue events and unexpected changes in acuity until discharge or transfer out of the PICU.
Data Analysis
We compared the priority alarm activation rates of individual patients in the 24 hours before and the 24 hours after the huddle intervention and contrasted the differences in rates between intervention and control patients, both concurrent and historical controls. We also divided the intervention and control groups into 2 additional groups each—those patients whose alarm parameters were changed, compared with those whose parameters did not change. We evaluated for possible contamination by comparing alarm rates of historical and concurrent controls, as well as evaluating alarm rates by location. We used mixed-effects regression models to evaluate the effect of the intervention and control type (historical or concurrent) on alarm rates, adjusted for patient age and sex. Analysis was performed using Stata version 10.3 (StataCorp, LLC, College Station, TX) and SAS version 9.4 (SAS Institute Inc., Cary, NC).
RESULTS
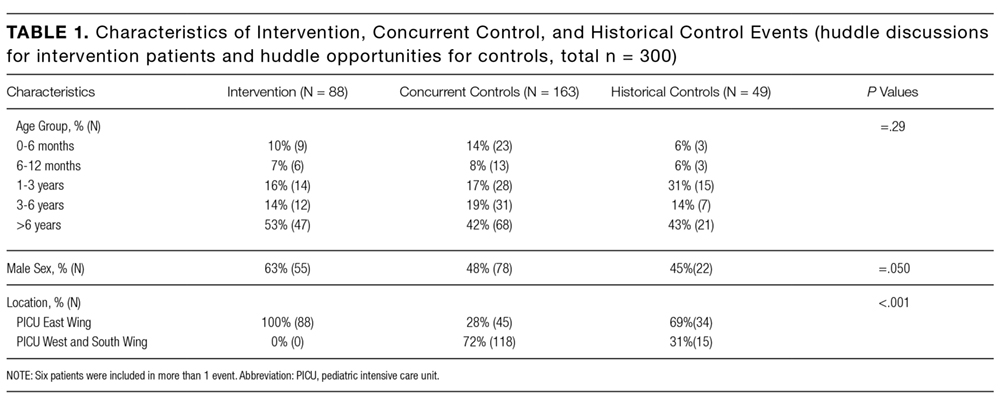
Because patients could be enrolled more than once, we refer to the instances when they were included in the study as “events” (huddle discussions for intervention patients and huddle opportunities for controls) below. We identified 49 historical control events between April 1, 2015, and May 31, 2015. During the intervention period, we identified 88 intervention events and 163 concurrent control events between June 1, 2015, and October 31, 2015 (total n = 300; see Table 1 for event characteristics). A total of 6 patients were enrolled more than once as either intervention or control patients.
UNADJUSTED ANALYSIS OF CHANGES IN ALARM RATES
The average priority alarm activation rate for intervention patients was 433 alarms (95% confidence interval [CI], 392-472) per day in the 24 hours leading up to the intervention and 223 alarms (95% CI, 182-265) per day in the 24 hours following the intervention, a 48.5% unadjusted decrease (95% CI, 38.1%-58.9%). In contrast, priority alarm activation rates for concurrent control patients averaged 412 alarms (95% CI, 383-442) per day in the 24 hours leading up to the morning huddle and 323 alarms (95% CI, 270-375) per day in the 24 hours following huddle, a 21.6% unadjusted decrease (95% CI, 15.3%-27.9%). For historical controls, priority alarm activation rates averaged 369 alarms (95% CI, 339-399) per day in the 24 hours leading up to the morning huddle and 242 alarms (95% CI, 164-320) per day in the 24 hours following huddle, a 34.4% unadjusted decrease (95% CI, 13.5%-55.0%). When we compared historical versus concurrent controls in the unadjusted analysis, concurrent controls had 37 more alarms per day (95% CI, 59 fewer to 134 more; P = 0.45) than historical controls. There was no significant difference between concurrent and historical controls, demonstrating no evidence of contamination.
Adjusted Analysis of Changes in Alarm Rates
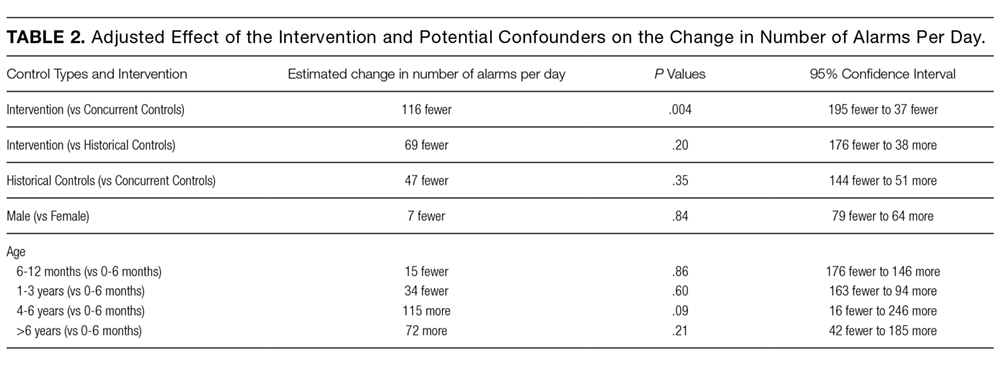
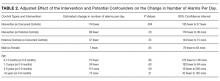
The overall estimate of the effect of the intervention adjusted for age and sex compared with concurrent controls was a reduction of 116 priority alarms per day (95% CI, 37-194; P = 0.004, Table 2). The adjusted percent decrease was 29.0% (95% CI, 12.1%-46.0%). There were no unexpected changes in patient acuity or code blue events related to the intervention.
Fidelity Analysis
We tracked changes in alarm parameter settings for evidence of intervention fidelity to determine if the team carried out the recommendations made. We found that 42% of intervention patients and 24% of combined control patients had alarm parameters changed during the posthuddle period (P = 0.002).
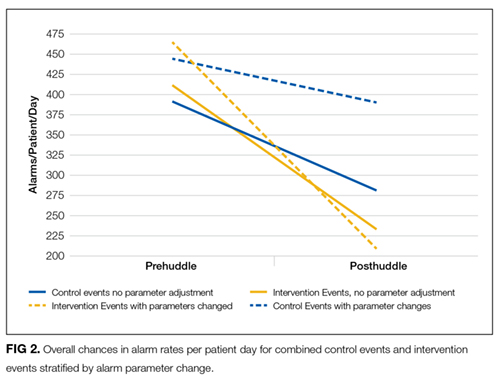
For those intervention patients who had parameters changed during the posthuddle period (N = 37), the mean effect was greater at a 54.9% decrease (95% CI, 38.8%-70.8%) in priority alarms as compared with control patients who had parameters adjusted during the posthuddle period (n = 50), having a mean decrease of only 12.2% (95% CI, –18.1%-42.3%). There was a 43.2% decrease (95% CI, 29.3%-57.0%) for intervention patients who were discussed but did not have parameters adjusted during the time window of observation (n = 51), as compared with combined control patients who did not have parameters adjusted (N = 162) who had a 28.1% decrease (95% CI, 16.8%-39.1%); see Figure 2.
This study is the first to demonstrate a successful and safe intervention to reduce the alarm rates of PICU patients. In addition, we observed a more significant reduction in priority alarm activation rates for intervention patients who had their alarm parameters changed during the monitored time period, leading us to hypothesize that providing patient-specific data regarding types of alarms was a key component of the intervention.
In control patients, we observed a reduction in alarm rates over time as well. There are 2 potential explanations for this. First, it is possible that as patients stabilize in the PICU, their vital signs become less extreme and generate fewer alarms even if the alarm parameters are not changed. The second is that parameters were changed within or outside of the time windows during which we evaluated for alarm parameter changes. Nevertheless, the decline over time observed in the intervention patients was greater than in both control groups. This change was even more noticeable in the intervention patients who had their alarm parameters changed during the posthuddle period as compared with controls who had their alarm parameters changed following the posthuddle period. This may have been due to the data provided during the huddle intervention, pointing the team to the cause of the high alarm rate.
Prior successful research regarding reduction of pediatric alarms has often shown decreased use of physiological monitors as 1 approach to reducing unnecessary alarms. The single prior pediatric alarm intervention study conducted on a pediatric ward involved instituting a cardiac monitor care process that included the ordering of age-based parameters, daily replacement of electrodes, individualized assessment of parameters, and a reliable method to discontinue monitoring.13 Because most patients in the PICU are critically ill, the reliance on monitor discontinuation as a main approach to decreasing alarms is not feasible in this setting. Instead, the use of targeted alarm parameter adjustments for low-acuity patients demonstrated a safe and feasible approach to decreasing alarms in PICU patients. The daily electrode change and age-based parameters were already in place at our institution.
There are a few limitations to this study. First, we focused only on low-acuity PICU patients. We believe that focusing on low-acuity patients allows for reduction in nonactionable alarms with limited potential for adverse events; however, this approach excludes many critically ill patients who might be at highest risk for harm from alarm fatigue if important alarms are ignored. Second, many of our patients were not present for the full 24 hours pre- and posthuddle due to their low acuity limiting our ability to follow alarm rates over time. Third, changes in alarm parameters were only monitored for a set period of 5 hours following the huddle to determine the effect of the recommended rounding script on changes to alarms. It is possible the changes to alarm parameters outside of the observed posthuddle period affected the alarm rates of both intervention and control patients. Lastly, the balancing metrics of unexpected changes in OptiLink status and code blue events are rare events, and therefore we may have been underpowered to find them. The effects of the huddle intervention on safety huddle length and rounding length were not measured.
CONCLUSION
Integrating a data-driven monitor alarm discussion into safety huddles was a safe and effective approach to reduce alarms in low-acuity, high-alarm PICU patients. Innovative approaches to make data-driven alarm decisions using informatics tools integrated into monitoring systems and electronic health records have the potential to facilitate cost-effective spread of this intervention.
Disclosure
This work was supported by a pilot grant from the Center for Pediatric Clinical Effectiveness, The Children’s Hospital of Philadelphia. Dr. Bonafide is supported by a Mentored Patient-Oriented Research Career Development Award from the National Heart, Lung, and Blood Institute of the National Institutes of Health under Award Number K23HL116427. The content is solely the responsibility of the authors and does not necessarily represent the official views of the funding organizations or employers. The funding organizations had no role in the design, preparation, review, or approval of this paper, nor the decision to submit for publication.
1. Drew BJ, Califf RM, Funk M, et al. Practice standards for electrocardiographic monitoring in hospital settings: An American Heart Association scientific statement from the councils on cardiovascular nursing, clinical cardiology, and cardiovascular disease in the young. Circulation. 2004;110(17):2721-2746; DOI:10.1161/01.CIR.0000145144.56673.59. PubMed
2. Paine CW, Goel V V, Ely E, et al. Systematic Review of Physiologic Monitor Alarm Characteristics and Pragmatic Interventions to Reduce Alarm Frequency. J Hosp Med. 2016;11(2):136-144; DOI:10.1002/jhm.2520. PubMed
3. Schondelmeyer AC, Bonafide CP, Goel V V, et al. The frequency of physiologic monitor alarms in a children’s hospital. J Hosp Med. 2016;11(11):796-798; DOI:10.1002/jhm.2612. PubMed
4. Bonafide CP, Lin R, Zander M, et al. Association between exposure to nonactionable physiologic monitor alarms and response time in a children’s hospital. J Hosp Med. 2015;10(6):345-351; DOI:10.1002/jhm.2331. PubMed
5. Lawless ST. Crying wolf: false alarms in a pediatric intensive care unit. Crit Care Med. 1994;22(6):981-985; DOI:10.1016/0025-326X(92)90542-E. PubMed
6. Tsien CL, Fackler JC. Poor prognosis for existing monitors in the intensive care unit. Crit Care Med. 1997;25(4):614-619 DOI:10.1097/00003246-199704000-00010. PubMed
7. Talley LB, Hooper J, Jacobs B, et al. Cardiopulmonary monitors and clinically significant events in critically ill children. Biomed Instrum Technol. 2011;45(SPRING):38-45; DOI:10.2345/0899-8205-45.s1.38. PubMed
8. Rosman EC, Blaufox AD, Menco A, Trope R, Seiden HS. What are we missing? Arrhythmia detection in the pediatric intensive care unit. J Pediatr. 2013;163(2):511-514; DOI:10.1016/j.jpeds.2013.01.053. PubMed
9. Korniewicz DM, Clark T, David Y. A national online survey on the effectiveness of clinical alarms. Am J Crit Care. 2008;17(1):36-41; DOI:17/1/36 [pii]. PubMed
10. Voepel-Lewis T, Parker ML, Burke CN, et al. Pulse oximetry desaturation alarms on a general postoperative adult unit: A prospective observational study of nurse response time. Int J Nurs Stud. 2013;50(10):1351-1358; DOI:10.1016/j.ijnurstu.2013.02.006. PubMed
11. Joint Commission on Accreditation of Healthcare Organizations. Medical device alarm safety in hospitals. Sentin Event Alert. 2012:1-3. PubMed
12. Goldenhar LM, Brady PW, Sutcliffe KM, Muething SE, Anderson JM. Huddling for high reliability and situation awareness. BMJ Qual Saf. 2013;22:899-906; DOI:10.1136/bmjqs-2012-001467. PubMed
13. Dandoy CE, Davies SM, Flesch L, et al. A Team-Based Approach to Reducing Cardiac Monitor Alarms. Pediatrics. 2014;134(6):E1686-E1694. DOI: 10.1542/peds.2014-1162. PubMed
BACKGROUND
Physiologic monitors are intended to prevent cardiac and respiratory arrest by generating alarms to alert clinicians to signs of instability. To minimize the probability that monitors will miss signs of deterioration, alarm algorithms and default parameters are often set to maximize sensitivity while sacrificing specificity.1 As a result, monitors generate large numbers of nonactionable alarms—alarms that are either invalid and do not accurately represent the physiologic status of the patient or are valid but do not warrant clinical intervention.2 Prior research has demonstrated that the pediatric intensive care unit (PICU) is responsible for a higher proportion of alarms than pediatric wards3 and a large proportion of these alarms, 87% - 97%, are nonactionable.4-8 In national surveys of healthcare staff, respondents report that high alarm rates interrupt patient care and can lead clinicians to disable alarms entirely.9 Recent research has supported this, demonstrating that nurses who are exposed to higher numbers of alarms have slower response times to alarms.4,10 In an attempt to mitigate safety risks, the Joint Commission in 2012 issued recommendations for hospitals to (a) establish guidelines for tailoring alarm settings and limits for individual patients and (b) identify situations in which alarms are not clinically necessary.11
In order to address these recommendations within our PICU, we sought to evaluate the impact of a focused physiologic monitor alarm reduction intervention integrated into safety huddles. Safety huddles are brief, structured discussions among physicians, nurses, and other staff aiming to identify safety concerns.12 Huddles offer an appropriate forum for reviewing alarm data and identifying patients whose high alarm rates may necessitate safe tailoring of alarm limits. Pilot data demonstrating high alarm rates among low-acuity PICU patients led us to hypothesize that low-acuity, high-alarm PICU patients would be a safe and effective target for an alarm huddle-based intervention.
In this study, we aimed to measure the impact of a structured safety huddle review of low-acuity PICU patients with high rates of priority alarms who were randomized to intervention compared with other low-acuity, high-alarm, concurrent, and historical control patients in the PICU.
METHODS
Study Definitions
Priority alarm activation rate. We conceptualized priority alarms as any alarm for a clinical condition that requires a timely response to determine if intervention is necessary to save a patient’s life,4 yet little empirical data support its existence in the hospital. We operationally defined these alarms on the General Electric Solar physiologic monitoring devices as any potentially life-threatening events including lethal arrhythmias (asystole, ventricular tachycardia, and ventricular fibrillation) and alarms for vital signs (heart rate, respiratory rate, and oxygen saturation) outside of the set parameter limits. These alarms produced audible tones in the patient room and automatically sent text messages to the nurse’s phone and had the potential to contribute to alarm fatigue regardless of the nurse’s location.
High-alarm patients. High-alarm patients were those who had more than 40 priority alarms in the preceding 4 hours, representing the top 20% of alarm rates in the PICU according to prior quality improvement projects completed in our PICU.
Low-acuity patients. Prior to and during this study, patient acuity was determined using the OptiLink Patient Classification System (OptiLink Healthcare Management Systems, Inc.; Tigard, OR; www.optilinkhealthcare.com; see Appendix 1) for the PICU twice daily. Low-acuity patients comprised on average 16% of the PICU patients.
Setting and Subjects
This study was performed in the PICU at The Children’s Hospital of Philadelphia.
The PICU is made up of 3 separate wings: east, south, and west. Bed availability was the only factor determining patient placement on the east, south, or west wing; the physical bed location was not preferentially assigned based on diagnosis or disease severity. The east wing was the intervention unit where the huddles occurred.
The PICU is composed of 3 different geographical teams. Two of the teams are composed of 4 to 5 pediatric or emergency medicine residents, 1 fellow, and 1 attending covering the south and west wings. The third team, located on the east wing, is composed of 1 to 2 pediatric residents, 2 to 3 nurse practitioners, 1 fellow, and 1 attending. Bedside family-centered rounds are held at each patient room, with the bedside nurse participating by reading a nursing rounding script that includes vital signs, vascular access, continuous medications, and additional questions or concerns.
Control subjects were any monitored patients on any of the 3 wings of the PICU between April 1, 2015, and October 31, 2015. The control patients were in 2 categories: historical controls from April 1, 2015, to May 31, 2015, and concurrent controls from June 1, 2015, to October 31, 2015, who were located anywhere in the PICU. On each nonholiday weekday beginning June 1, 2015, we randomly selected up to 2 patients to receive the intervention. These were high-alarm, low-acuity patients on the east wing to be discussed in the daily morning huddle. If more than 2 high-alarm, low-acuity patients were eligible for intervention, they were randomly selected by using the RAND function in Microsoft Excel. The other low-acuity, high-alarm patients in the PICU were included as control patients. Patients were eligible for the study if they were present for the 4 hours prior to huddle and present past noon on the day of huddle. If patients met criteria as high-alarm, low-acuity patients on multiple days, they could be enrolled as intervention or control patients multiple times. Patients’ alarm rates were calculated by dividing the number of alarms by their length of stay to the minute. There was no adjustment made for patients enrolled more than once.
Human Subjects Protection
The Institutional Review Board of The Children’s Hospital of Philadelphia approved this study with a waiver of informed consent.
Alarm Capture
We used BedMasterEx (Excel Medical Electronics; Jupiter, FL, http://excel-medical.com/products/bedmaster-ex) software connected to the General Electric monitor network to measure alarm rates. The software captured, in near real time, every alarm that occurred on every monitor in the PICU. Alarm rates over the preceding 4 hours for all PICU patients were exported and summarized by alarm type and level as set by hospital policy (crisis, warning, advisory, and system warning). Crisis and warning alarms were included as they represented potential life-threatening events meeting the definition of priority alarms. Physicians used an order within the PICU admission order-set to order monitoring based on preset age parameters (see online Appendix 1 for default settings). Physician orders were required for nurses to change alarm parameters. Daily electrode changes to reduce false alarms were standard of care.
Primary Outcome
The primary outcome was the change in priority alarm activation rate (the number of priority alarms per day) from prehuddle period (24 hours before morning huddle) to posthuddle period (the 24 hours following morning huddle) for intervention cases as compared with controls.
Primary Intervention
The intervention consisted of integrating a short script to facilitate the discussion of the alarm data during existing safety huddle and rounding workflows. The discussion and subsequent workflow proceeded as follows: A member of the research team who was not involved in patient care brought an alarm data sheet for each randomly selected intervention patient on the east wing to each safety huddle. The huddles were attended by the outgoing night charge nurse, the day charge nurse, and all bedside nurses working on the east wing that day. The alarm data sheet provided to the charge nurse displayed data on the 1 to 2 alarm parameters (respiratory rate, heart rate, or pulse oximetry) that generated the highest number of alarms. The charge nurse listed the high-alarm patients by room number during huddle, and the alarm data sheet was given to the bedside nurse responsible for the patient to facilitate further scripted discussion during bedside rounds with patient-specific information to reduce the alarm rates of individual patients throughout the adjustment of physiologic monitor parameters (see Appendix 2 for sample data sheet and script).
Data Collection
Intervention patients were high-alarm, low-acuity patients on the east wing from June 1, 2015, through October 31, 2015. Two months of baseline data were gathered prior to intervention on all 3 wings; therefore, control patients were high-alarm, low-acuity patients throughout the PICU from April 1, 2015, to May 31, 2015, as historical controls and from June 1, 2015, to October 31, 2015, as concurrent controls. Alarm rates for the 24 hours prior to huddle and the 24 hours following huddle were collected and analyzed. See Figure 1 for schematic of study design.
We collected data on patient characteristics, including patient location, age, sex, and intervention date. Information regarding changes to monitor alarm parameters for both intervention and control patients during the posthuddle period (the period following morning huddle until noon on intervention day) was also collected. We monitored for code blue events and unexpected changes in acuity until discharge or transfer out of the PICU.
Data Analysis
We compared the priority alarm activation rates of individual patients in the 24 hours before and the 24 hours after the huddle intervention and contrasted the differences in rates between intervention and control patients, both concurrent and historical controls. We also divided the intervention and control groups into 2 additional groups each—those patients whose alarm parameters were changed, compared with those whose parameters did not change. We evaluated for possible contamination by comparing alarm rates of historical and concurrent controls, as well as evaluating alarm rates by location. We used mixed-effects regression models to evaluate the effect of the intervention and control type (historical or concurrent) on alarm rates, adjusted for patient age and sex. Analysis was performed using Stata version 10.3 (StataCorp, LLC, College Station, TX) and SAS version 9.4 (SAS Institute Inc., Cary, NC).
RESULTS
Because patients could be enrolled more than once, we refer to the instances when they were included in the study as “events” (huddle discussions for intervention patients and huddle opportunities for controls) below. We identified 49 historical control events between April 1, 2015, and May 31, 2015. During the intervention period, we identified 88 intervention events and 163 concurrent control events between June 1, 2015, and October 31, 2015 (total n = 300; see Table 1 for event characteristics). A total of 6 patients were enrolled more than once as either intervention or control patients.
UNADJUSTED ANALYSIS OF CHANGES IN ALARM RATES
The average priority alarm activation rate for intervention patients was 433 alarms (95% confidence interval [CI], 392-472) per day in the 24 hours leading up to the intervention and 223 alarms (95% CI, 182-265) per day in the 24 hours following the intervention, a 48.5% unadjusted decrease (95% CI, 38.1%-58.9%). In contrast, priority alarm activation rates for concurrent control patients averaged 412 alarms (95% CI, 383-442) per day in the 24 hours leading up to the morning huddle and 323 alarms (95% CI, 270-375) per day in the 24 hours following huddle, a 21.6% unadjusted decrease (95% CI, 15.3%-27.9%). For historical controls, priority alarm activation rates averaged 369 alarms (95% CI, 339-399) per day in the 24 hours leading up to the morning huddle and 242 alarms (95% CI, 164-320) per day in the 24 hours following huddle, a 34.4% unadjusted decrease (95% CI, 13.5%-55.0%). When we compared historical versus concurrent controls in the unadjusted analysis, concurrent controls had 37 more alarms per day (95% CI, 59 fewer to 134 more; P = 0.45) than historical controls. There was no significant difference between concurrent and historical controls, demonstrating no evidence of contamination.
Adjusted Analysis of Changes in Alarm Rates
The overall estimate of the effect of the intervention adjusted for age and sex compared with concurrent controls was a reduction of 116 priority alarms per day (95% CI, 37-194; P = 0.004, Table 2). The adjusted percent decrease was 29.0% (95% CI, 12.1%-46.0%). There were no unexpected changes in patient acuity or code blue events related to the intervention.
Fidelity Analysis
We tracked changes in alarm parameter settings for evidence of intervention fidelity to determine if the team carried out the recommendations made. We found that 42% of intervention patients and 24% of combined control patients had alarm parameters changed during the posthuddle period (P = 0.002).
For those intervention patients who had parameters changed during the posthuddle period (N = 37), the mean effect was greater at a 54.9% decrease (95% CI, 38.8%-70.8%) in priority alarms as compared with control patients who had parameters adjusted during the posthuddle period (n = 50), having a mean decrease of only 12.2% (95% CI, –18.1%-42.3%). There was a 43.2% decrease (95% CI, 29.3%-57.0%) for intervention patients who were discussed but did not have parameters adjusted during the time window of observation (n = 51), as compared with combined control patients who did not have parameters adjusted (N = 162) who had a 28.1% decrease (95% CI, 16.8%-39.1%); see Figure 2.
This study is the first to demonstrate a successful and safe intervention to reduce the alarm rates of PICU patients. In addition, we observed a more significant reduction in priority alarm activation rates for intervention patients who had their alarm parameters changed during the monitored time period, leading us to hypothesize that providing patient-specific data regarding types of alarms was a key component of the intervention.
In control patients, we observed a reduction in alarm rates over time as well. There are 2 potential explanations for this. First, it is possible that as patients stabilize in the PICU, their vital signs become less extreme and generate fewer alarms even if the alarm parameters are not changed. The second is that parameters were changed within or outside of the time windows during which we evaluated for alarm parameter changes. Nevertheless, the decline over time observed in the intervention patients was greater than in both control groups. This change was even more noticeable in the intervention patients who had their alarm parameters changed during the posthuddle period as compared with controls who had their alarm parameters changed following the posthuddle period. This may have been due to the data provided during the huddle intervention, pointing the team to the cause of the high alarm rate.
Prior successful research regarding reduction of pediatric alarms has often shown decreased use of physiological monitors as 1 approach to reducing unnecessary alarms. The single prior pediatric alarm intervention study conducted on a pediatric ward involved instituting a cardiac monitor care process that included the ordering of age-based parameters, daily replacement of electrodes, individualized assessment of parameters, and a reliable method to discontinue monitoring.13 Because most patients in the PICU are critically ill, the reliance on monitor discontinuation as a main approach to decreasing alarms is not feasible in this setting. Instead, the use of targeted alarm parameter adjustments for low-acuity patients demonstrated a safe and feasible approach to decreasing alarms in PICU patients. The daily electrode change and age-based parameters were already in place at our institution.
There are a few limitations to this study. First, we focused only on low-acuity PICU patients. We believe that focusing on low-acuity patients allows for reduction in nonactionable alarms with limited potential for adverse events; however, this approach excludes many critically ill patients who might be at highest risk for harm from alarm fatigue if important alarms are ignored. Second, many of our patients were not present for the full 24 hours pre- and posthuddle due to their low acuity limiting our ability to follow alarm rates over time. Third, changes in alarm parameters were only monitored for a set period of 5 hours following the huddle to determine the effect of the recommended rounding script on changes to alarms. It is possible the changes to alarm parameters outside of the observed posthuddle period affected the alarm rates of both intervention and control patients. Lastly, the balancing metrics of unexpected changes in OptiLink status and code blue events are rare events, and therefore we may have been underpowered to find them. The effects of the huddle intervention on safety huddle length and rounding length were not measured.
CONCLUSION
Integrating a data-driven monitor alarm discussion into safety huddles was a safe and effective approach to reduce alarms in low-acuity, high-alarm PICU patients. Innovative approaches to make data-driven alarm decisions using informatics tools integrated into monitoring systems and electronic health records have the potential to facilitate cost-effective spread of this intervention.
Disclosure
This work was supported by a pilot grant from the Center for Pediatric Clinical Effectiveness, The Children’s Hospital of Philadelphia. Dr. Bonafide is supported by a Mentored Patient-Oriented Research Career Development Award from the National Heart, Lung, and Blood Institute of the National Institutes of Health under Award Number K23HL116427. The content is solely the responsibility of the authors and does not necessarily represent the official views of the funding organizations or employers. The funding organizations had no role in the design, preparation, review, or approval of this paper, nor the decision to submit for publication.
1. Drew BJ, Califf RM, Funk M, et al. Practice standards for electrocardiographic monitoring in hospital settings: An American Heart Association scientific statement from the councils on cardiovascular nursing, clinical cardiology, and cardiovascular disease in the young. Circulation. 2004;110(17):2721-2746; DOI:10.1161/01.CIR.0000145144.56673.59. PubMed
2. Paine CW, Goel V V, Ely E, et al. Systematic Review of Physiologic Monitor Alarm Characteristics and Pragmatic Interventions to Reduce Alarm Frequency. J Hosp Med. 2016;11(2):136-144; DOI:10.1002/jhm.2520. PubMed
3. Schondelmeyer AC, Bonafide CP, Goel V V, et al. The frequency of physiologic monitor alarms in a children’s hospital. J Hosp Med. 2016;11(11):796-798; DOI:10.1002/jhm.2612. PubMed
4. Bonafide CP, Lin R, Zander M, et al. Association between exposure to nonactionable physiologic monitor alarms and response time in a children’s hospital. J Hosp Med. 2015;10(6):345-351; DOI:10.1002/jhm.2331. PubMed
5. Lawless ST. Crying wolf: false alarms in a pediatric intensive care unit. Crit Care Med. 1994;22(6):981-985; DOI:10.1016/0025-326X(92)90542-E. PubMed
6. Tsien CL, Fackler JC. Poor prognosis for existing monitors in the intensive care unit. Crit Care Med. 1997;25(4):614-619 DOI:10.1097/00003246-199704000-00010. PubMed
7. Talley LB, Hooper J, Jacobs B, et al. Cardiopulmonary monitors and clinically significant events in critically ill children. Biomed Instrum Technol. 2011;45(SPRING):38-45; DOI:10.2345/0899-8205-45.s1.38. PubMed
8. Rosman EC, Blaufox AD, Menco A, Trope R, Seiden HS. What are we missing? Arrhythmia detection in the pediatric intensive care unit. J Pediatr. 2013;163(2):511-514; DOI:10.1016/j.jpeds.2013.01.053. PubMed
9. Korniewicz DM, Clark T, David Y. A national online survey on the effectiveness of clinical alarms. Am J Crit Care. 2008;17(1):36-41; DOI:17/1/36 [pii]. PubMed
10. Voepel-Lewis T, Parker ML, Burke CN, et al. Pulse oximetry desaturation alarms on a general postoperative adult unit: A prospective observational study of nurse response time. Int J Nurs Stud. 2013;50(10):1351-1358; DOI:10.1016/j.ijnurstu.2013.02.006. PubMed
11. Joint Commission on Accreditation of Healthcare Organizations. Medical device alarm safety in hospitals. Sentin Event Alert. 2012:1-3. PubMed
12. Goldenhar LM, Brady PW, Sutcliffe KM, Muething SE, Anderson JM. Huddling for high reliability and situation awareness. BMJ Qual Saf. 2013;22:899-906; DOI:10.1136/bmjqs-2012-001467. PubMed
13. Dandoy CE, Davies SM, Flesch L, et al. A Team-Based Approach to Reducing Cardiac Monitor Alarms. Pediatrics. 2014;134(6):E1686-E1694. DOI: 10.1542/peds.2014-1162. PubMed
© 2017 Society of Hospital Medicine
A Contemporary Assessment of Mechanical Complication Rates and Trainee Perceptions of Central Venous Catheter Insertion
Central venous catheter (CVC) placement is commonly performed in emergency and critical care settings for parenteral access, central monitoring, and hemodialysis. Although potentially lifesaving CVC insertion is associated with immediate risks including injury to nerves, vessels, and lungs.1-3 These “insertion-related complications” are of particular interest for several reasons. First, the frequency of such complications varies widely, with published rates between 1.4% and 33.2%.2-7 Reasons for such variation include differences in study definitions of complications (eg, pneumothorax and tip position),2,5 setting of CVC placement (eg, intensive care unit [ICU] vs emergency room), timing of placement (eg, elective vs emergent), differences in technique, and type of operator (eg, experienced vs learner). Thus, the precise incidence of such events in modern-day training settings with use of ultrasound guidance remains uncertain. Second, mechanical complications might be preventable with adequate training and supervision. Indeed, studies using simulation-based mastery techniques have demonstrated a reduction in rates of complications following intensive training.8 Finally, understanding risk factors associated with insertion complications might inform preventative strategies and improve patient safety.9-11
Few studies to date have examined trainees’ perceptions on CVC training, experience, supervision, and ability to recognize and prevent mechanical complications. While research investigating effects of simulation training has accumulated, most focus on successful completion of the procedure or individual procedural steps with little emphasis on operator perceptions.12-14 In addition, while multiple studies have shown that unsuccessful line attempts are a risk factor for CVC complications,3,4,7,15 there is very little known about trainee behavior and perceptions regarding unsuccessful line placement. CVC simulation trainings often assume successful completion of the procedure and do not address the crucial postprocedure steps that should be undertaken if a procedure is unsuccessful. For these reasons, we developed a survey to specifically examine trainee experience with CVC placement, supervision, postprocedural behavior, and attitudes regarding unsuccessful line placement.
Therefore, we designed a study with 2 specific goals: The first is to perform a contemporary analysis of CVC mechanical complication rate at an academic teaching institution and identify potential risk factors associated with these complications. Second, we sought to determine trainee perceptions regarding CVC complication experience, prevention, procedural supervision, and perceptions surrounding unsuccessful line placement.
METHODS
Design and Setting
We conducted a single-center retrospective review of nontunneled acute CVC procedures between June 1, 2014, and May 1, 2015, at the University of Michigan Health System (UMHS). UMHS is a tertiary care referral center with over 900 inpatient beds, including 99 ICU beds.
All residents in internal medicine, surgery, anesthesia, and emergency medicine receive mandatory education in CVC placement that includes an online training module and simulation-based training with competency assessment. Use of real-time ultrasound guidance is considered the standard of care for CVC placement.
Data Collection
Inpatient procedure notes were electronically searched for terms indicating CVC placement. This was performed by using our hospital’s Data Office for Clinical and Translational Research using the Electronic Medical Record Search Engine tool. Please see the supplemental materials for the full list of search terms. We electronically extracted data, including date of procedure, gender, and most recent body mass index (BMI), within 1 year prior to note. Acute Physiology and Chronic Health Evaluation III (APACHE III) data are tracked for all patients on admission to ICU; this was collected when available. Charts were then manually reviewed to collect additional data, including international normalized ratio (INR), platelet count, lactate level on the day of CVC placement, anticoagulant use (actively prescribed coumadin, therapeutic enoxaparin, therapeutic unfractionated heparin, or direct oral anticoagulant), ventilator or noninvasive positive pressure ventilation (NIPPV) at time of CVC placement, and vasopressor requirement within 24 hours of CVC placement. The procedure note was reviewed to gather information about site of CVC placement, size and type of catheter, number of attempts, procedural success, training level of the operator, and attending presence. Small bore CVCs were defined as 7 French (Fr) or lower. Large bore CVCs were defined as >7 Fr; this includes dialysis catheters, Cordis catheters (Cordis, Fremont, CA), and cooling catheters. The times of the procedure note and postprocedure chest x-ray (CXR) were recorded, including whether the CVC was placed on a weekend (Friday 7
Primary Outcome
The primary outcome was the rate of severe mechanical complications related to CVC placement. Similar to prior studies,2 we defined severe mechanical complications as arterial placement of dilator or catheter, hemothorax, pneumothorax, cerebral ischemia, patient death (related to procedure), significant hematoma, or vascular injury (defined as complication requiring expert consultation or blood product transfusion). We did not require a lower limit on blood transfusion. We considered pneumothorax a complication regardless of whether chest tube intervention was performed, as pneumothorax subjects the patient to additional tests (eg, serial CXRs) and sometimes symptoms (shortness of breath, pain, anxiety) regardless of whether or not a chest tube was required. Complications were confirmed by a direct review of procedure notes, progress notes, discharge summaries, and imaging studies.
Trainee Survey
A survey was electronically disseminated to all internal medicine and medicine-pediatric residents to inquire about CVC experiences, including time spent in the medical ICU, number of CVCs performed, postprocedure behavior for both failed and successful CVCs, and supervision experience and attitudes. Please see supplemental materials for full survey contents.
Statistical Methods
Descriptive statistics (percentage) were used to summarize data. Continuous and categorical variables were compared using Student t tests and chi-square tests, respectively. All analyses were performed using SAS 9.3 (SAS Institute, Cary, NC).
Ethical and Regulatory Oversight
The study was deemed exempt by the University of Michigan Institutional Review Board (HUM00100549) as data collection was part of a quality improvement effort.
RESULTS
Demographics and Characteristics of Device Insertion
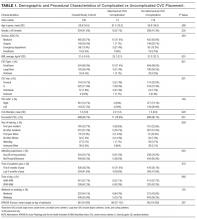
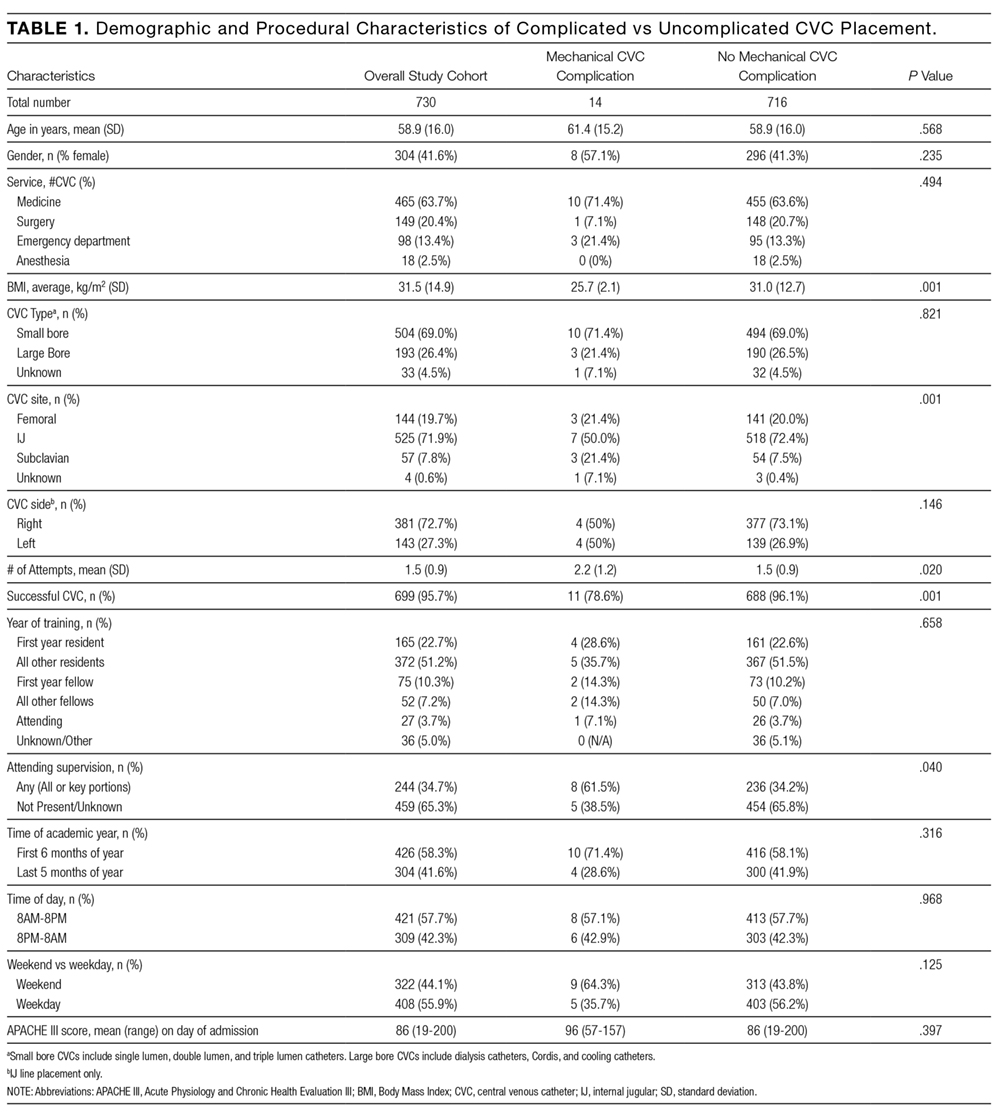
Between June 1, 2014, and May 1, 2015, 730 CVC procedure notes were reviewed (Table 1). The mean age of the study population was 58.9 years, and 41.6% (n = 304) were female. BMI data were available in 400 patients without complications and 5 patients with complications; the average BMI was 31.5 kg/m2. The APACHE III score was available for 442 patients without complications and 10 patients with complications; the average score was 86 (range 19-200). Most of the CVCs placed (n= 504, 69%) were small bore (<7 Fr). The majority of catheters were placed in the internal jugular (IJ) position (n = 525, 71.9%), followed by femoral (n = 144, 19.7%), subclavian (N = 57, 7.8%), and undocumented (n = 4, 0.6%). Ninety-six percent (n = 699) of CVCs were successfully placed. Seventy-six percent (n = 558) of procedure notes included documentation of the number of CVC attempts; of these, 85% documented 2 or fewer attempts. The majority of CVCs were placed by residents (n = 537, 73.9%), followed by fellows (N = 127, 17.5%) and attendings (n = 27, 3.7%). Attending supervision for all or key portions of CVC placement occurred 34.7% (n = 244) of the time overall and was lower for internal medicine trainees (n = 98/463, 21.2%) compared with surgical trainees (n = 73/127, 57.4%) or emergency medicine trainees (n = 62/96, 64.6%; P < 0.001). All successful IJ and subclavian CVCs except for 2 insertions (0.3%) had a postprocedure CXR. A minority of notes documented pressure transduction (4.5%) or blood gas analysis (0.2%) to confirm venous placement.
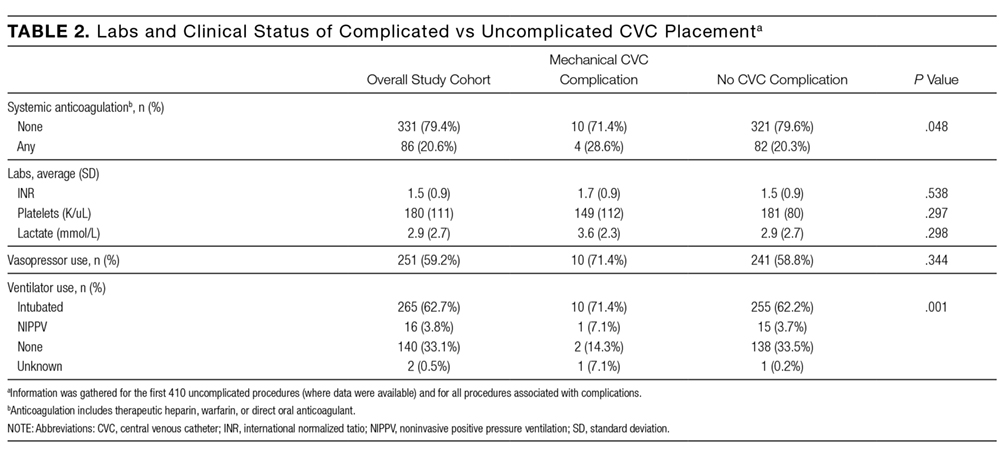
Mechanical Complications
The mechanical complications identified included pneumothorax (n = 5), bleeding requiring transfusion (n = 3), vascular injury requiring expert consultation or intervention (n = 3), stroke (n = 1), and death (n = 2). Vascular injuries included 1 neck hematoma with superinfection requiring antibiotics, 1 neck hematoma requiring otolaryngology and vascular surgery consultation, and 1 venous dissection of IJ vein requiring vascular surgery consultation. None of these cases required operative intervention. The stroke was caused by inadvertent CVC placement into the carotid artery. One patient experienced tension pneumothorax and died due to this complication; this death occurred after 3 failed left subclavian CVC attempts and an ultimately successful CVC placement into left IJ vein. Another death occurred immediately following unsuccessful Cordis placement. As no autopsy was performed, it is impossible to know if the cause of death was the line placement. However, it would be prudent to consider this as a CVC complication given the temporal relationship to line placement. Thus, the total number of patients who experienced severe mechanical complications was 14 out of 730 (1.92%).
Risk Factors for Mechanical Complications
Certain patient factors were more commonly associated with complications. For example, BMI was significantly lower in the group that experienced complications vs those that did not (25.7 vs 31.0 kg/m2, P = 0.001). No other associations between demographic factors, including age (61.4 years vs 58.9 years, P = 0.57) or sex (57.1% male vs 41.3% female, P = 0.24), or admission APACHE III score (96 vs 86, P = 0.397) were noted. The mean INR, platelets, and lactate did not differ between the 2 groups. There was no difference between the use of vasopressors. Ventilator use (including endotracheal tube or NIPPV) was found to be significantly higher in the group that experienced mechanical complications (78.5% vs 65.9%, P = 0.001). Anticoagulation use was also associated with mechanical complications (28.6% vs 20.6%, P = 0.05); 3 patients on anticoagulation experienced significant hematomas. Mechanical complications were more common with subclavian location (21.4% vs 7.8%, P = 0.001); in all 3 cases involving subclavian CVC placement, the complication experienced was pneumothorax. The number of attempts significantly differed between the 2 groups, with an average of 1.5 attempts in the group without complications and 2.2 attempts in the group that experienced complications (P = 0.02). Additionally, rates of successful placement were lower among patients who experienced complications (78.6% vs 95.7%, P = 0.001).
With respect to operator characteristics, no significant difference between the levels of training was noted among those who experienced complications vs those who did not. Attending supervision was more frequent for the group that experienced complications (61.5% vs 34.2%, P = 0.04). There was no significant difference in complication rate according to the first vs the second half of the academic year (0.4% vs 0.3% per month, P = 0.30) or CVC placement during the day vs night (1.9% vs 2.0%, P = 0.97). A trend toward more complications in CVCs placed over the weekend compared to a weekday was observed (2.80% vs 1.23%, P = 0.125).
Unsuccessful CVCs
There were 30 documented unsuccessful CVC procedures, representing 4.1% of all procedures. Of these, 3 procedures had complications; these included 2 pneumothoraxes (1 leading to death) and 1 unexplained death. Twenty-four of the unsuccessful CVC attempts were in either the subclavian or IJ location; of these, 5 (21%) did not have a postprocedure CXR obtained.
Survey Results
The survey was completed by 103 out of 166 internal medicine residents (62% response rate). Of these, 55% (n = 57) reported having performed 5 or more CVCs, and 14% (n = 14) had performed more than 15 CVCs.
All respondents who had performed at least 1 CVC (n = 80) were asked about their perceptions regarding attending supervision. Eighty-one percent (n = 65/80) responded that they have never been directly supervised by an attending during CVC placement, while 16% (n = 13/80) reported being supervised less than 25% of the time. Most (n = 53/75, 71%) did not feel that attending supervision affected their performance, while 21% (n = 16/75) felt it affected performance negatively, and only 8% (n = 6/75) stated it affected performance positively. Nineteen percent (n = 15/80) indicated that they prefer more supervision by attendings, while 35% (n = 28/80) did not wish for more attending supervision, and 46% (n = 37/80) were indifferent.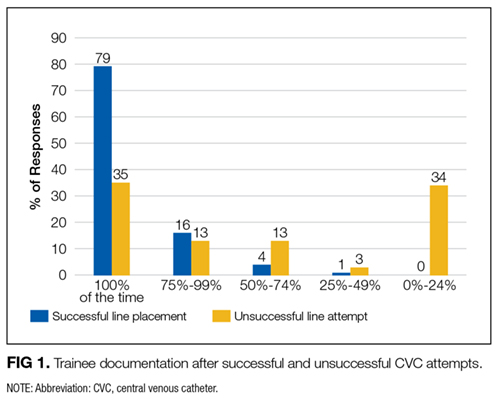

DISCUSSION
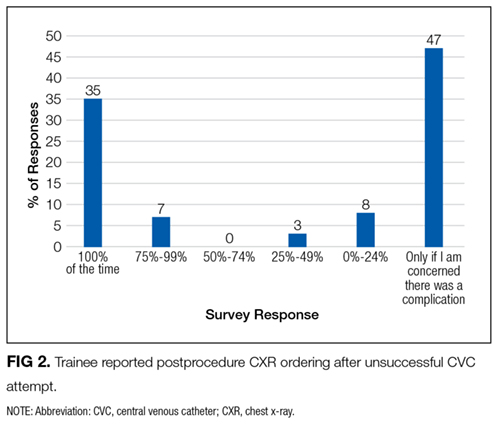
We performed a contemporary analysis of CVC placement at an academic tertiary care center and observed a rate of severe mechanical complications of 1.9%. This rate is within previously described acceptable thresholds.16 Our study adds to the literature by identifying several important risk factors for development of mechanical complications. We confirm many risk factors that have been noted historically, such as subclavian line location,2,3 attending supervision,3 low BMI,4 number of CVC attempts, and unsuccessful CVC placement.3,4,7,15 We identified several unique risk factors, including systemic anticoagulation as well as ventilator use. Lastly, we identified unexpected deficits in trainee knowledge surrounding management of failed CVCs and negative attitudes regarding attending supervision.
Most existing literature evaluated risk factors for CVC complication prior to routine ultrasound use;3-5,7,15 surprisingly, it appears that severe mechanical complications do not differ dramatically in the real-time ultrasound era. Eisen et al.3 prospectively studied CVC placement at an academic medical center and found a severe mechanical complication rate (as defined in our paper) of 1.9% due to pneumothorax (1.3%), hemothorax (0.3%), and death (0.3%).We would expect the number of complications to decrease in the postultrasound era, and indeed it appears that pneumothoraces have decreased likely due to ultrasound guidance and decrease in subclavian location. However, in contrast, rates of significant hematomas and bleeding are higher in our study. Although we are unable to state why this may be the case, increasing use of anticoagulation in the general population might explain this finding.17 For instance, of the 6 patients who experienced hematomas or vascular injuries in our study, 3 were on anticoagulation at the time of CVC placement.
Interestingly, time of academic year of CVC placement and level of training were not correlated with an increased risk of complications, nor was time of day of CVC placement. In contrast, Merrer et al.showed that CVC insertion during nighttime was significantly associated with increased mechanical complications (odds ratio 2.06, 95% confidence interval, 1.04-4.08;,P = 0.03).5 This difference may be attributable to the fact that most of our ICUs now have a night float system rather than a more traditional 24-hour call model; therefore, trainees are less likely to be sleep deprived during CVC placement at night.
Severity of illness did not appear to significantly affect mechanical complication rates based on similar APACHE scores between the 2 groups. In addition, other indicators of illness severity (vasopressor use or lactate level) did not suggest that sicker patients may be more likely to experience mechanical complications than others. One could conjecture that perhaps sicker patients were more likely to have lines placed by more experienced trainees, although the present study design does not allow us to answer this question. Interestingly, ventilator use was associated with higher rates of complications. We cannot say definitively why this was the case; however, 1 contributing factor may be the physical constraints of placing the CVC around ventilator tubing.
Several unexpected findings surrounding attending supervision were noted: first, attending supervision appears to be significantly associated with increased complication rate, and second, trainees have negative perceptions regarding attending supervision. Eisen et al.showed a similar association between attending supervision and complication rate.3 It is possible that the increased complication rate is because sicker patients are more likely to have procedural supervision by attendings, attending physicians may be called to supervise when a CVC placement is not going as planned, or attendings may supervise more inexperienced operators. Reasons behind negative trainee attitudes surrounding supervision are unclear and literature on this topic is limited. This is an area that warrants further exploration in future studies.
Another unexpected finding is trainee practices regarding unsuccessful CVC placement; most trainees do not document failed procedures or order follow-up CXRs after unsuccessful CVC attempts. Given the higher risk of complications after unsuccessful CVCs, it is paramount that all physicians are trained to order postprocedure CXR to rule out pneumothorax or hemothorax. Furthermore, documentation of failed procedures is important for medical accuracy, transparency, and also hospital billing. It is unknown if these practices surrounding unsuccessful CVCs are institution-specific or more widespread. As far as we know, this is the first time that trainee practices regarding failed CVC placement have been published. Interestingly, while many current guidelines call attention to prevention, recognition, and management of central line-associated mechanical complications, specific recommendations about postprocedure behavior after failed CVC placement are not published.9-11 We feel it is critical that institutions reflect on their own practices, especially given that unsuccessful CVCs are shown to be correlated with a significant increase in complication rate. At our own institution, we have initiated an educational component of central line training for medicine trainees specifically addressing failed central line attempts.
This study has several limitations, including a retrospective study design at a single institution. There was a low overall number of complications, which reduced our ability to detect risk factors for complications and did not allow us to perform multivariable adjustment. Other limitations are that only documented CVC attempts were recorded and only those that met our search criteria. Lastly, not all notes contain information such as the number of attempts or peer supervision. Furthermore, the definition of CVC “attempt” is left to the operator’s discretion.
In conclusion, we observed a modern CVC mechanical complication rate of 1.9%. While the complication rate is similar to previous studies, there appear to be lower rates of pneumothorax and higher rates of bleeding complications. We also identified a deficit in trainee education regarding unsuccessful CVC placement; this is a novel finding and requires further investigation at other centers.
Disclosure: The authors have no conflicts of interest to report.
1. McGee DC, Gould MK. Preventing complications of central venous catheterization. N Engl J Med. 2003;348(12):1123-1133. PubMed
2. Parienti JJ, Mongardon N, Mégarbane B, et al. Intravascular complications of central venous catheterization by insertion site. N Engl J Med. 2015;373(13):1220-1229. PubMed
3. Eisen LA, Narasimhan M, Berger JS, Mayo PH, Rosen MJ, Schneider RF. Mechanical complications of central venous catheters. J Intensive Care Med. 2006;21(1):40-46. PubMed
4. Mansfield PF, Hohn DC, Fornage BD, Gregurich MA, Ota DM. Complications and failures of subclavian-vein catheterization. N Engl J Med. 1994;331(26):1735-1738. PubMed
5. Merrer J, De Jonghe B, Golliot F, et al. Complications of femoral and subclavian venous catheterization in critically ill patients: A randomized controlled trial. JAMA. 2001;286(6):700-707. PubMed
6. Steele R, Irvin CB. Central line mechanical complication rate in emergency medicine patients. Acad Emerg Med. 2001;8(2):204-207. PubMed
7. Calvache JA, Rodriguez MV, Trochez A, Klimek M, Stolker RJ, Lesaffre E. Incidence of mechanical complications of central venous catheterization using landmark technique: Do not try more than 3 times. J Intensive Care Med. 2016;31(6):397-402. PubMed
8. Barsuk JH, McDaghie WC, Cohen ER, Balachandran JS, Wayne DB. Use of simulation-based mastery learning to improve the quality of central venous catheter placement in a medical intensive care unit. J Hosp Med. 2009;4(7):397-403. PubMed
9. American Society of Anesthesiologists Task Force on Central Venous Access, Rupp SM, Apfelbaum JL, et al. Practice guidelines for central venous access: A report by the American Society of Anesthesiologists Task Force on Central Venous Access. Anesthesiology. 2012;116(3):539-573. PubMed
10. Bodenham Chair A, Babu S, Bennett J, et al. Association of Anaesthetists of Great Britian and Irealand: Safe vascular access 2016. Anaesthesia. 2016;71:573-585. PubMed
11. Frykholm P, Pikwer A, Hammarskjöld F, et al. Clinical guidelines on central venous catheterisation. Swedish Society of Anaesthesiology and Intensic Care Medicine. Acta Anaesteshiol Scand. 2014;58(5):508-524. PubMed
12. Sekiguchi H, Tokita JE, Minami T, Eisen LA, Mayo PH, Narasimhan M. A prerotational, simulation-based workshop improves the safety of central venous catheter insertion: Results of a successful internal medicine house staff training program. Chest. 2011;140(3): 652-658. PubMed
13. Dong Y, Suri HS, Cook DA, et al. Simulation-based objective assessment discerns clinical proficiency in central line placement: A construct validation. Chest. 2010;137(5):1050-1056. PubMed
14. Evans LV, Dodge KL, Shah TD, et al. Simulation training in central venous catheter insertion: Improved performance in clinical practice. Acad Med. 2010;85(9):1462-1469. PubMed
15. Lefrant JY, Muller L, De La Coussaye JE et al. Risk factors of failure and immediate complication of subclavian vein catheterization in critically ill patients. Intensive Care Med. 2002;28(8):1036-1041. PubMed
16. Dariushnia SR, Wallace MJ, Siddigi NH, et al. Quality improvement guidelines for central venous access. J Vasc Interv Radiol. 2010;21(7):976-981. PubMed
17. Barnes GD, Lucas E, Alexander GC, Goldberger ZD. National trends in ambulatory oral anticoagulant use. Am J Med. 2015;128(12):1300-1305.e2. PubMed
Central venous catheter (CVC) placement is commonly performed in emergency and critical care settings for parenteral access, central monitoring, and hemodialysis. Although potentially lifesaving CVC insertion is associated with immediate risks including injury to nerves, vessels, and lungs.1-3 These “insertion-related complications” are of particular interest for several reasons. First, the frequency of such complications varies widely, with published rates between 1.4% and 33.2%.2-7 Reasons for such variation include differences in study definitions of complications (eg, pneumothorax and tip position),2,5 setting of CVC placement (eg, intensive care unit [ICU] vs emergency room), timing of placement (eg, elective vs emergent), differences in technique, and type of operator (eg, experienced vs learner). Thus, the precise incidence of such events in modern-day training settings with use of ultrasound guidance remains uncertain. Second, mechanical complications might be preventable with adequate training and supervision. Indeed, studies using simulation-based mastery techniques have demonstrated a reduction in rates of complications following intensive training.8 Finally, understanding risk factors associated with insertion complications might inform preventative strategies and improve patient safety.9-11
Few studies to date have examined trainees’ perceptions on CVC training, experience, supervision, and ability to recognize and prevent mechanical complications. While research investigating effects of simulation training has accumulated, most focus on successful completion of the procedure or individual procedural steps with little emphasis on operator perceptions.12-14 In addition, while multiple studies have shown that unsuccessful line attempts are a risk factor for CVC complications,3,4,7,15 there is very little known about trainee behavior and perceptions regarding unsuccessful line placement. CVC simulation trainings often assume successful completion of the procedure and do not address the crucial postprocedure steps that should be undertaken if a procedure is unsuccessful. For these reasons, we developed a survey to specifically examine trainee experience with CVC placement, supervision, postprocedural behavior, and attitudes regarding unsuccessful line placement.
Therefore, we designed a study with 2 specific goals: The first is to perform a contemporary analysis of CVC mechanical complication rate at an academic teaching institution and identify potential risk factors associated with these complications. Second, we sought to determine trainee perceptions regarding CVC complication experience, prevention, procedural supervision, and perceptions surrounding unsuccessful line placement.
METHODS
Design and Setting
We conducted a single-center retrospective review of nontunneled acute CVC procedures between June 1, 2014, and May 1, 2015, at the University of Michigan Health System (UMHS). UMHS is a tertiary care referral center with over 900 inpatient beds, including 99 ICU beds.
All residents in internal medicine, surgery, anesthesia, and emergency medicine receive mandatory education in CVC placement that includes an online training module and simulation-based training with competency assessment. Use of real-time ultrasound guidance is considered the standard of care for CVC placement.
Data Collection
Inpatient procedure notes were electronically searched for terms indicating CVC placement. This was performed by using our hospital’s Data Office for Clinical and Translational Research using the Electronic Medical Record Search Engine tool. Please see the supplemental materials for the full list of search terms. We electronically extracted data, including date of procedure, gender, and most recent body mass index (BMI), within 1 year prior to note. Acute Physiology and Chronic Health Evaluation III (APACHE III) data are tracked for all patients on admission to ICU; this was collected when available. Charts were then manually reviewed to collect additional data, including international normalized ratio (INR), platelet count, lactate level on the day of CVC placement, anticoagulant use (actively prescribed coumadin, therapeutic enoxaparin, therapeutic unfractionated heparin, or direct oral anticoagulant), ventilator or noninvasive positive pressure ventilation (NIPPV) at time of CVC placement, and vasopressor requirement within 24 hours of CVC placement. The procedure note was reviewed to gather information about site of CVC placement, size and type of catheter, number of attempts, procedural success, training level of the operator, and attending presence. Small bore CVCs were defined as 7 French (Fr) or lower. Large bore CVCs were defined as >7 Fr; this includes dialysis catheters, Cordis catheters (Cordis, Fremont, CA), and cooling catheters. The times of the procedure note and postprocedure chest x-ray (CXR) were recorded, including whether the CVC was placed on a weekend (Friday 7
Primary Outcome
The primary outcome was the rate of severe mechanical complications related to CVC placement. Similar to prior studies,2 we defined severe mechanical complications as arterial placement of dilator or catheter, hemothorax, pneumothorax, cerebral ischemia, patient death (related to procedure), significant hematoma, or vascular injury (defined as complication requiring expert consultation or blood product transfusion). We did not require a lower limit on blood transfusion. We considered pneumothorax a complication regardless of whether chest tube intervention was performed, as pneumothorax subjects the patient to additional tests (eg, serial CXRs) and sometimes symptoms (shortness of breath, pain, anxiety) regardless of whether or not a chest tube was required. Complications were confirmed by a direct review of procedure notes, progress notes, discharge summaries, and imaging studies.
Trainee Survey
A survey was electronically disseminated to all internal medicine and medicine-pediatric residents to inquire about CVC experiences, including time spent in the medical ICU, number of CVCs performed, postprocedure behavior for both failed and successful CVCs, and supervision experience and attitudes. Please see supplemental materials for full survey contents.
Statistical Methods
Descriptive statistics (percentage) were used to summarize data. Continuous and categorical variables were compared using Student t tests and chi-square tests, respectively. All analyses were performed using SAS 9.3 (SAS Institute, Cary, NC).
Ethical and Regulatory Oversight
The study was deemed exempt by the University of Michigan Institutional Review Board (HUM00100549) as data collection was part of a quality improvement effort.
RESULTS
Demographics and Characteristics of Device Insertion
Between June 1, 2014, and May 1, 2015, 730 CVC procedure notes were reviewed (Table 1). The mean age of the study population was 58.9 years, and 41.6% (n = 304) were female. BMI data were available in 400 patients without complications and 5 patients with complications; the average BMI was 31.5 kg/m2. The APACHE III score was available for 442 patients without complications and 10 patients with complications; the average score was 86 (range 19-200). Most of the CVCs placed (n= 504, 69%) were small bore (<7 Fr). The majority of catheters were placed in the internal jugular (IJ) position (n = 525, 71.9%), followed by femoral (n = 144, 19.7%), subclavian (N = 57, 7.8%), and undocumented (n = 4, 0.6%). Ninety-six percent (n = 699) of CVCs were successfully placed. Seventy-six percent (n = 558) of procedure notes included documentation of the number of CVC attempts; of these, 85% documented 2 or fewer attempts. The majority of CVCs were placed by residents (n = 537, 73.9%), followed by fellows (N = 127, 17.5%) and attendings (n = 27, 3.7%). Attending supervision for all or key portions of CVC placement occurred 34.7% (n = 244) of the time overall and was lower for internal medicine trainees (n = 98/463, 21.2%) compared with surgical trainees (n = 73/127, 57.4%) or emergency medicine trainees (n = 62/96, 64.6%; P < 0.001). All successful IJ and subclavian CVCs except for 2 insertions (0.3%) had a postprocedure CXR. A minority of notes documented pressure transduction (4.5%) or blood gas analysis (0.2%) to confirm venous placement.
Mechanical Complications
The mechanical complications identified included pneumothorax (n = 5), bleeding requiring transfusion (n = 3), vascular injury requiring expert consultation or intervention (n = 3), stroke (n = 1), and death (n = 2). Vascular injuries included 1 neck hematoma with superinfection requiring antibiotics, 1 neck hematoma requiring otolaryngology and vascular surgery consultation, and 1 venous dissection of IJ vein requiring vascular surgery consultation. None of these cases required operative intervention. The stroke was caused by inadvertent CVC placement into the carotid artery. One patient experienced tension pneumothorax and died due to this complication; this death occurred after 3 failed left subclavian CVC attempts and an ultimately successful CVC placement into left IJ vein. Another death occurred immediately following unsuccessful Cordis placement. As no autopsy was performed, it is impossible to know if the cause of death was the line placement. However, it would be prudent to consider this as a CVC complication given the temporal relationship to line placement. Thus, the total number of patients who experienced severe mechanical complications was 14 out of 730 (1.92%).
Risk Factors for Mechanical Complications
Certain patient factors were more commonly associated with complications. For example, BMI was significantly lower in the group that experienced complications vs those that did not (25.7 vs 31.0 kg/m2, P = 0.001). No other associations between demographic factors, including age (61.4 years vs 58.9 years, P = 0.57) or sex (57.1% male vs 41.3% female, P = 0.24), or admission APACHE III score (96 vs 86, P = 0.397) were noted. The mean INR, platelets, and lactate did not differ between the 2 groups. There was no difference between the use of vasopressors. Ventilator use (including endotracheal tube or NIPPV) was found to be significantly higher in the group that experienced mechanical complications (78.5% vs 65.9%, P = 0.001). Anticoagulation use was also associated with mechanical complications (28.6% vs 20.6%, P = 0.05); 3 patients on anticoagulation experienced significant hematomas. Mechanical complications were more common with subclavian location (21.4% vs 7.8%, P = 0.001); in all 3 cases involving subclavian CVC placement, the complication experienced was pneumothorax. The number of attempts significantly differed between the 2 groups, with an average of 1.5 attempts in the group without complications and 2.2 attempts in the group that experienced complications (P = 0.02). Additionally, rates of successful placement were lower among patients who experienced complications (78.6% vs 95.7%, P = 0.001).
With respect to operator characteristics, no significant difference between the levels of training was noted among those who experienced complications vs those who did not. Attending supervision was more frequent for the group that experienced complications (61.5% vs 34.2%, P = 0.04). There was no significant difference in complication rate according to the first vs the second half of the academic year (0.4% vs 0.3% per month, P = 0.30) or CVC placement during the day vs night (1.9% vs 2.0%, P = 0.97). A trend toward more complications in CVCs placed over the weekend compared to a weekday was observed (2.80% vs 1.23%, P = 0.125).
Unsuccessful CVCs
There were 30 documented unsuccessful CVC procedures, representing 4.1% of all procedures. Of these, 3 procedures had complications; these included 2 pneumothoraxes (1 leading to death) and 1 unexplained death. Twenty-four of the unsuccessful CVC attempts were in either the subclavian or IJ location; of these, 5 (21%) did not have a postprocedure CXR obtained.
Survey Results
The survey was completed by 103 out of 166 internal medicine residents (62% response rate). Of these, 55% (n = 57) reported having performed 5 or more CVCs, and 14% (n = 14) had performed more than 15 CVCs.
All respondents who had performed at least 1 CVC (n = 80) were asked about their perceptions regarding attending supervision. Eighty-one percent (n = 65/80) responded that they have never been directly supervised by an attending during CVC placement, while 16% (n = 13/80) reported being supervised less than 25% of the time. Most (n = 53/75, 71%) did not feel that attending supervision affected their performance, while 21% (n = 16/75) felt it affected performance negatively, and only 8% (n = 6/75) stated it affected performance positively. Nineteen percent (n = 15/80) indicated that they prefer more supervision by attendings, while 35% (n = 28/80) did not wish for more attending supervision, and 46% (n = 37/80) were indifferent.
DISCUSSION
We performed a contemporary analysis of CVC placement at an academic tertiary care center and observed a rate of severe mechanical complications of 1.9%. This rate is within previously described acceptable thresholds.16 Our study adds to the literature by identifying several important risk factors for development of mechanical complications. We confirm many risk factors that have been noted historically, such as subclavian line location,2,3 attending supervision,3 low BMI,4 number of CVC attempts, and unsuccessful CVC placement.3,4,7,15 We identified several unique risk factors, including systemic anticoagulation as well as ventilator use. Lastly, we identified unexpected deficits in trainee knowledge surrounding management of failed CVCs and negative attitudes regarding attending supervision.
Most existing literature evaluated risk factors for CVC complication prior to routine ultrasound use;3-5,7,15 surprisingly, it appears that severe mechanical complications do not differ dramatically in the real-time ultrasound era. Eisen et al.3 prospectively studied CVC placement at an academic medical center and found a severe mechanical complication rate (as defined in our paper) of 1.9% due to pneumothorax (1.3%), hemothorax (0.3%), and death (0.3%).We would expect the number of complications to decrease in the postultrasound era, and indeed it appears that pneumothoraces have decreased likely due to ultrasound guidance and decrease in subclavian location. However, in contrast, rates of significant hematomas and bleeding are higher in our study. Although we are unable to state why this may be the case, increasing use of anticoagulation in the general population might explain this finding.17 For instance, of the 6 patients who experienced hematomas or vascular injuries in our study, 3 were on anticoagulation at the time of CVC placement.
Interestingly, time of academic year of CVC placement and level of training were not correlated with an increased risk of complications, nor was time of day of CVC placement. In contrast, Merrer et al.showed that CVC insertion during nighttime was significantly associated with increased mechanical complications (odds ratio 2.06, 95% confidence interval, 1.04-4.08;,P = 0.03).5 This difference may be attributable to the fact that most of our ICUs now have a night float system rather than a more traditional 24-hour call model; therefore, trainees are less likely to be sleep deprived during CVC placement at night.
Severity of illness did not appear to significantly affect mechanical complication rates based on similar APACHE scores between the 2 groups. In addition, other indicators of illness severity (vasopressor use or lactate level) did not suggest that sicker patients may be more likely to experience mechanical complications than others. One could conjecture that perhaps sicker patients were more likely to have lines placed by more experienced trainees, although the present study design does not allow us to answer this question. Interestingly, ventilator use was associated with higher rates of complications. We cannot say definitively why this was the case; however, 1 contributing factor may be the physical constraints of placing the CVC around ventilator tubing.
Several unexpected findings surrounding attending supervision were noted: first, attending supervision appears to be significantly associated with increased complication rate, and second, trainees have negative perceptions regarding attending supervision. Eisen et al.showed a similar association between attending supervision and complication rate.3 It is possible that the increased complication rate is because sicker patients are more likely to have procedural supervision by attendings, attending physicians may be called to supervise when a CVC placement is not going as planned, or attendings may supervise more inexperienced operators. Reasons behind negative trainee attitudes surrounding supervision are unclear and literature on this topic is limited. This is an area that warrants further exploration in future studies.
Another unexpected finding is trainee practices regarding unsuccessful CVC placement; most trainees do not document failed procedures or order follow-up CXRs after unsuccessful CVC attempts. Given the higher risk of complications after unsuccessful CVCs, it is paramount that all physicians are trained to order postprocedure CXR to rule out pneumothorax or hemothorax. Furthermore, documentation of failed procedures is important for medical accuracy, transparency, and also hospital billing. It is unknown if these practices surrounding unsuccessful CVCs are institution-specific or more widespread. As far as we know, this is the first time that trainee practices regarding failed CVC placement have been published. Interestingly, while many current guidelines call attention to prevention, recognition, and management of central line-associated mechanical complications, specific recommendations about postprocedure behavior after failed CVC placement are not published.9-11 We feel it is critical that institutions reflect on their own practices, especially given that unsuccessful CVCs are shown to be correlated with a significant increase in complication rate. At our own institution, we have initiated an educational component of central line training for medicine trainees specifically addressing failed central line attempts.
This study has several limitations, including a retrospective study design at a single institution. There was a low overall number of complications, which reduced our ability to detect risk factors for complications and did not allow us to perform multivariable adjustment. Other limitations are that only documented CVC attempts were recorded and only those that met our search criteria. Lastly, not all notes contain information such as the number of attempts or peer supervision. Furthermore, the definition of CVC “attempt” is left to the operator’s discretion.
In conclusion, we observed a modern CVC mechanical complication rate of 1.9%. While the complication rate is similar to previous studies, there appear to be lower rates of pneumothorax and higher rates of bleeding complications. We also identified a deficit in trainee education regarding unsuccessful CVC placement; this is a novel finding and requires further investigation at other centers.
Disclosure: The authors have no conflicts of interest to report.
1. McGee DC, Gould MK. Preventing complications of central venous catheterization. N Engl J Med. 2003;348(12):1123-1133. PubMed
2. Parienti JJ, Mongardon N, Mégarbane B, et al. Intravascular complications of central venous catheterization by insertion site. N Engl J Med. 2015;373(13):1220-1229. PubMed
3. Eisen LA, Narasimhan M, Berger JS, Mayo PH, Rosen MJ, Schneider RF. Mechanical complications of central venous catheters. J Intensive Care Med. 2006;21(1):40-46. PubMed
4. Mansfield PF, Hohn DC, Fornage BD, Gregurich MA, Ota DM. Complications and failures of subclavian-vein catheterization. N Engl J Med. 1994;331(26):1735-1738. PubMed
5. Merrer J, De Jonghe B, Golliot F, et al. Complications of femoral and subclavian venous catheterization in critically ill patients: A randomized controlled trial. JAMA. 2001;286(6):700-707. PubMed
6. Steele R, Irvin CB. Central line mechanical complication rate in emergency medicine patients. Acad Emerg Med. 2001;8(2):204-207. PubMed
7. Calvache JA, Rodriguez MV, Trochez A, Klimek M, Stolker RJ, Lesaffre E. Incidence of mechanical complications of central venous catheterization using landmark technique: Do not try more than 3 times. J Intensive Care Med. 2016;31(6):397-402. PubMed
8. Barsuk JH, McDaghie WC, Cohen ER, Balachandran JS, Wayne DB. Use of simulation-based mastery learning to improve the quality of central venous catheter placement in a medical intensive care unit. J Hosp Med. 2009;4(7):397-403. PubMed
9. American Society of Anesthesiologists Task Force on Central Venous Access, Rupp SM, Apfelbaum JL, et al. Practice guidelines for central venous access: A report by the American Society of Anesthesiologists Task Force on Central Venous Access. Anesthesiology. 2012;116(3):539-573. PubMed
10. Bodenham Chair A, Babu S, Bennett J, et al. Association of Anaesthetists of Great Britian and Irealand: Safe vascular access 2016. Anaesthesia. 2016;71:573-585. PubMed
11. Frykholm P, Pikwer A, Hammarskjöld F, et al. Clinical guidelines on central venous catheterisation. Swedish Society of Anaesthesiology and Intensic Care Medicine. Acta Anaesteshiol Scand. 2014;58(5):508-524. PubMed
12. Sekiguchi H, Tokita JE, Minami T, Eisen LA, Mayo PH, Narasimhan M. A prerotational, simulation-based workshop improves the safety of central venous catheter insertion: Results of a successful internal medicine house staff training program. Chest. 2011;140(3): 652-658. PubMed
13. Dong Y, Suri HS, Cook DA, et al. Simulation-based objective assessment discerns clinical proficiency in central line placement: A construct validation. Chest. 2010;137(5):1050-1056. PubMed
14. Evans LV, Dodge KL, Shah TD, et al. Simulation training in central venous catheter insertion: Improved performance in clinical practice. Acad Med. 2010;85(9):1462-1469. PubMed
15. Lefrant JY, Muller L, De La Coussaye JE et al. Risk factors of failure and immediate complication of subclavian vein catheterization in critically ill patients. Intensive Care Med. 2002;28(8):1036-1041. PubMed
16. Dariushnia SR, Wallace MJ, Siddigi NH, et al. Quality improvement guidelines for central venous access. J Vasc Interv Radiol. 2010;21(7):976-981. PubMed
17. Barnes GD, Lucas E, Alexander GC, Goldberger ZD. National trends in ambulatory oral anticoagulant use. Am J Med. 2015;128(12):1300-1305.e2. PubMed
© 2017 Society of Hospital Medicine
Perspectives of Clinicians at Skilled Nursing Facilities on 30-Day Hospital Readmissions: A Qualitative Study
Skilled nursing facilities (SNFs) play a crucial role in the hospital readmission process.Approximately 1 in 4 Medicare beneficiaries discharged from an acute care hospital is admitted to a SNF instead of returning directly home. Of these patients, 1 in 4 will be readmitted within 30 days,1 a rate significantly higher than the readmission rate of the inpatient population as a whole.2 The 2014 Protecting Access to Medicare Act created a value-based purchasing program that will use quality measures to steer funds to, or away from, individual SNFs. When the program takes effect in 2018, the Centers for Medicare & Medicaid Services will use SNFs’ 30-day all-cause readmission rate to determine which SNFs receive payments and which receive penalties.3 The Affordable Care Act, passed in 2010, has also established penalties for hospitals with higher than expected readmission rates for Medicare patients.4
Despite this intensifying regulatory focus, relatively little is known about the factors that drive readmissions from SNFs. A prospective review of data from SNFs in 4 states has shown that SNFs staffed by nurse practitioners or physician assistants and those equipped to provide intravenous therapy were less likely to transfer patients to the hospital for ambulatory care-sensitive diagnoses.5 Qualitative studies have provided useful insight into the causes of SNF-to-hospital transfers but have not focused on 30-day readmissions.6,7 A single survey-based study has examined the causes of SNF-to-hospital readmissions.8 However, survey-based methodologies have limited ability to capture the complex perspectives of SNF clinicians, who play a critical role in determining which SNF patients require evaluation or treatment in an acute care setting.
To address this gap in knowledge about factors contributing to SNF readmissions, we conducted a qualitative study examining SNF clinicians’ perspectives on patients readmitted to the hospital within 30 days of discharge. We used a structured interview tool to explore the root causes of readmission with frontline SNF staff, with the goal of using this knowledge to inform future hospital quality improvement (QI) efforts.
METHODS
Case Identification
Hospital data-tracking software (Allscripts) was used to identify patients who experienced a 30-day, unplanned readmission from SNFs to an academic medical center. We restricted our search to patients whose index admission and readmission were to the medical center’s inpatient general medicine service. A study team member (BWC) monitored the dataset on a weekly basis and contacted SNF clinicians by e-mail and telephone to arrange interviews at times of mutual convenience. To mitigate against recall bias, interviews were conducted within 30 days of the readmission in question. A total of 32 cases were identified. No SNF clinicians refused a request for interview. For 8 of these cases, it was not possible to find a time of mutual convenience within the specified 30-day window. The remaining 24 cases involved patients from 15 SNFs across Connecticut. Interviews were conducted from August 2015 to November 2015.
The project was reviewed by our institution’s Human Investigation Committee and was exempted from Institutional Review Board review.
Study Participants
Interviews were conducted on-site at SNFs with groups of 1 to 4 SNF clinicians and administrators. SNF participants were informed of interviewer credentials and the study’s QI goals prior to participation. Participation was voluntary and did not affect the clinician’s relationship with the hospital or the SNF. Participants were not paid.
DATA COLLECTION
Interventions to Reduce Acute Care Transfers (INTERACT) is a QI program that includes training for clinicians, communication tools, and advance care planning tools.9 INTERACT is currently used in 138 Connecticut SNFs as part of a statewide QI effort funded by the Connecticut State Department of Public Health. In prospective QI studies,10,11 implementation of INTERACT has been associated with decreased transfers from SNFs to acute care hospitals. The INTERACT Quality Improvement Tool, one part of the INTERACT bundle of interventions, is a 26-item questionnaire used to identify root causes of transfers from SNFs to acute care hospitals. It includes both checklists and open-ended questions about patient factors, SNF procedures, and SNF clinical decision-making.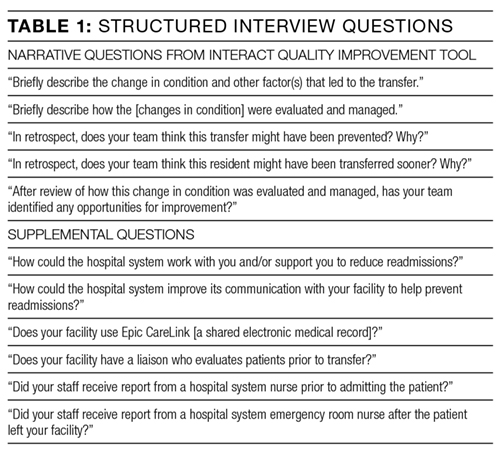
We used the INTERACT QI Tool12 to conduct structured interviews with nurses and administrators at SNFs. Interviewers used a hard copy of the tool to maintain field notes, and all parts of the questionnaire were completed in each interview. Although the questionnaire elicits baseline demographic and medical information, such as the patient’s age and vital signs prior to readmission, the majority of each interview was dedicated to discussion of the open-ended questions in Table 1. Upon completion of the INTERACT QI Tool, the interviewer asked 2 open-ended questions about reducing readmissions and 4 closed-ended questions regarding SNF admission procedures. (Table 1) The supplemental questions were added after preliminary interviews with SNF clinicians revealed concerns about the SNF referral process and about communication between the hospital, emergency department (ED) and SNFs—issues not included in the INTERACT questionnaire. Interviewers used phatic communication, probing questions, and follow-up questions to elicit detailed information from participants, and participant responses were not limited to topics in the questionnaire and the list of supplemental questions.
Interviews were conducted by a hospital clinical integration coordinator, social worker, and a physician (KB, MCB, BWC). All interviewers received formal training in qualitative research methods prior to the study.
All interviews were audio recorded, with permission from the participants, and were professionally transcribed. Field notes were maintained to ensure accuracy of INTERACT QI Tool data. Participant interviews covered no more than two cases per session and lasted from 18 to 71 minutes (mean duration, 38 minutes).
Analysis
Analysis of transcripts was inductive and informed by grounded theory methodology, in which data is reviewed for repeating ideas, which are then analyzed and grouped to develop a theoretical understanding of the phenomenon under investigation.13,14
A preliminary codebook was developed using transcripts of the first 11 interviews. All statements relevant to the readmission process were extracted from the raw interview transcript and collected into a single list. This list was then reviewed for statements sharing a particular idea or concern. Such statements were grouped together under the heading of a repeating idea, and each repeating idea was assigned a code. Using this codebook, each transcript was independently reviewed and coded by three study team members with formal training in inductive qualitative analysis (KB, KTM, BWC). Reviewers assigned codes to sections of relevant text. Discrepancies in code assignment were discussed among the 3 analysts until consensus was reached. Using the method of constant comparison described in grounded theory,the codebook was updated continuously as the process of coding transcripts proceeded.12 Changes to the codebook were discussed among the coding team until consensus was achieved. The process of data acquisition and coding continued until theoretical saturation was reached. Themes relating to underlying factors associated with readmissions were then identified based on shared properties among repeating ideas. ATLAS.ti (Scientific Software, Berlin, Germany, Version 7) was used to facilitate data organization and retrieval.
RESULTS
The SNFs in our study included 12 for-profit and 3 non-profit facilities. The number of licensed beds in each facility ranged from 73 to 360, with a mean of 148 beds. The SNFs had CMS Nursing Home Compare ratings ranging from 1 star, the lowest possible rating, to 5 stars, the highest possible,15 with a mean rating of 2.9 stars. Our analysis did not reveal differences in perceived contributions to readmissions from large vs. small or highly rated vs poorly rated SNFs.
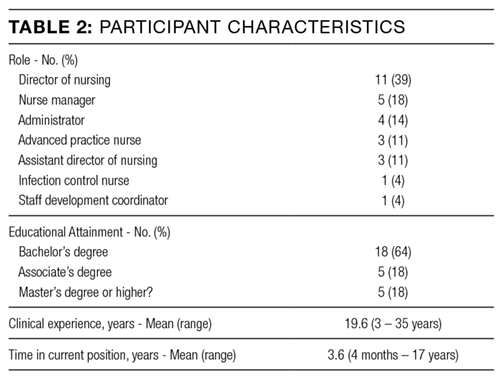
The patients in our analysis represented a highly comorbid and medically complex population (Table 3). Many had barriers to communication with clinical staff, including non–English-speaking status and underlying dementia.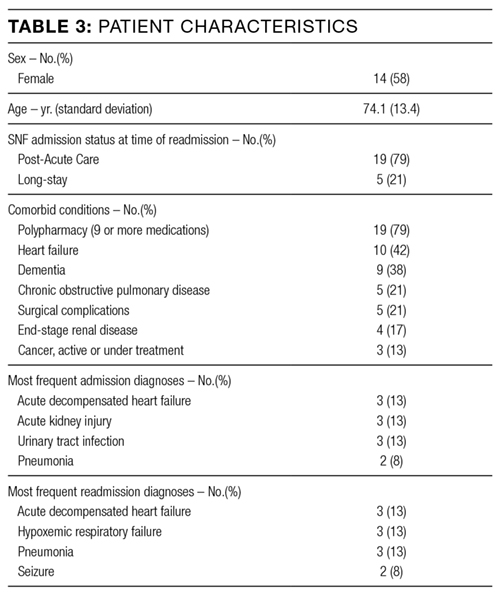
Five main themes emerged from our analysis: (1) lack of coordination between EDs and SNFs; (2) incompletely addressed goals of care; (3) mismatch between patient clinical needs and SNF capabilities; (4) important clinical information not effectively communicated by hospital; and (5) challenges in SNF processes and culture.
Emergent transitions: Lack of coordination between ED and SNF
SNF clinicians frequently encountered situations in which a relatively stable patient was readmitted to the hospital after being transferred to the ED, despite the fact that SNF clinicians believed the patient should have returned to the SNF once a specific test was performed or service rendered at the ED. Commonly cited clinical scenarios that resulted in such readmissions included placement of urinary catheters and evaluation for cystitis. An assistant director of nursing reported that “the ER doesn’t want to hear my side of the story,” making it difficult for her to provide information that would prevent such readmissions. Other SNF clinicians reported similar difficulties in communicating with ED clinicians.
Code status: Incompletely addressed goals of care
The SNF clinicians in our study described cases in which patients with end-stage lung disease and disseminated cancer were readmitted to the hospital, despite SNF efforts to prevent readmission and provide palliative care within the SNF. For example, a SNF advanced practice nurse described a case in which a patient with widely metastatic cancer requested readmission to the hospital for treatment of deep vein thrombosis, despite longstanding recommendations from SNF staff that the patient forego hospitalization and enroll in hospice care. After discussion of code status and goals of care with hospital clinicians, the patient chose to enroll in hospice care and not to continue anticoagulation. SNF clinicians often perceived that, in the words of one administrator, “the palliative talks in the hospital outweigh our talks by a lot.” Numerous SNF clinicians believed that in-depth clarification of goals of care prior to discharge could prevent some readmissions.
Wrong patient, wrong place: Mismatch between clinical needs and SNF capabilities
One director of nursing stated that “[when] you read a referral, there’s a huge difference sometimes between what you read and what you see.” SNF clinicians reported that this discrepancy between clinical report and clinical reality often leads to patients being placed in SNFs that are unequipped to care for them. Many patients were perceived as being too ill for discharge from the acute-care setting in the first place. A nurse manager described this as a pattern of “pushing patients out of the hospital.” However, mismatches in clinical disposition were also seen as contributing to readmissions for medically stable patients, such as those with dementia, for whom SNFs frequently lack adequate staffing and physical safeguards.
Missing links: Important clinical information not effectively communicated by hospital
SNF clinicians described numerous challenges in formulating plans of care based on hospital discharge documentation. Discrepancies between discharge summaries and patient instructions were perceived as common and potential causes of readmissions. For patients discharged from the academic medical center in this study, medication instructions are included in both the discharge summary sent to the SNF and in a patient instruction packet. Several SNF clinicians said that it was common for a course of antibiotics to be listed on the discharge summary but not the patient instruction packet, or vice versa. SNF clinicians, who usually lack access to the hospital’s electronic medical record, have limited means for determining the correct document. Other important clinical data points, such as intermittent intravenous (IV) furosemide dosing and suppressive antibiotic regimens, were omitted from discharge paperwork altogether. SNF clinicians had difficulty reaching hospital clinicians who could clarify these clinical questions. “Good luck finding the person that took care of [the patient] three days before,” said one director of nursing.
Change starts at home: Challenges in SNF processes and culture
Many clinicians in our study reported that their facilities had recently added clinical capabilities in an effort to care for patients with complex medical problems. For example, to prevent transfers of patients with decompensated heart failure, several facilities in our study had recently obtained certification to give IV diuretics. However, as one director of nursing stated, these efforts require “buy-in” from doctors to decrease readmissions. That buy-in has not always been forthcoming. SNF clinicians also reported difficulty convincing patients and families that their facilities are capable of providing care that, in the past, might only have been available in acute-care settings.
These themes, along with associated sub-themes and representative quotations, are shown above (Table 4).
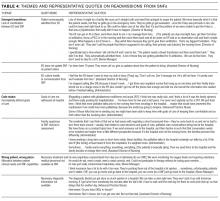

DISCUSSION

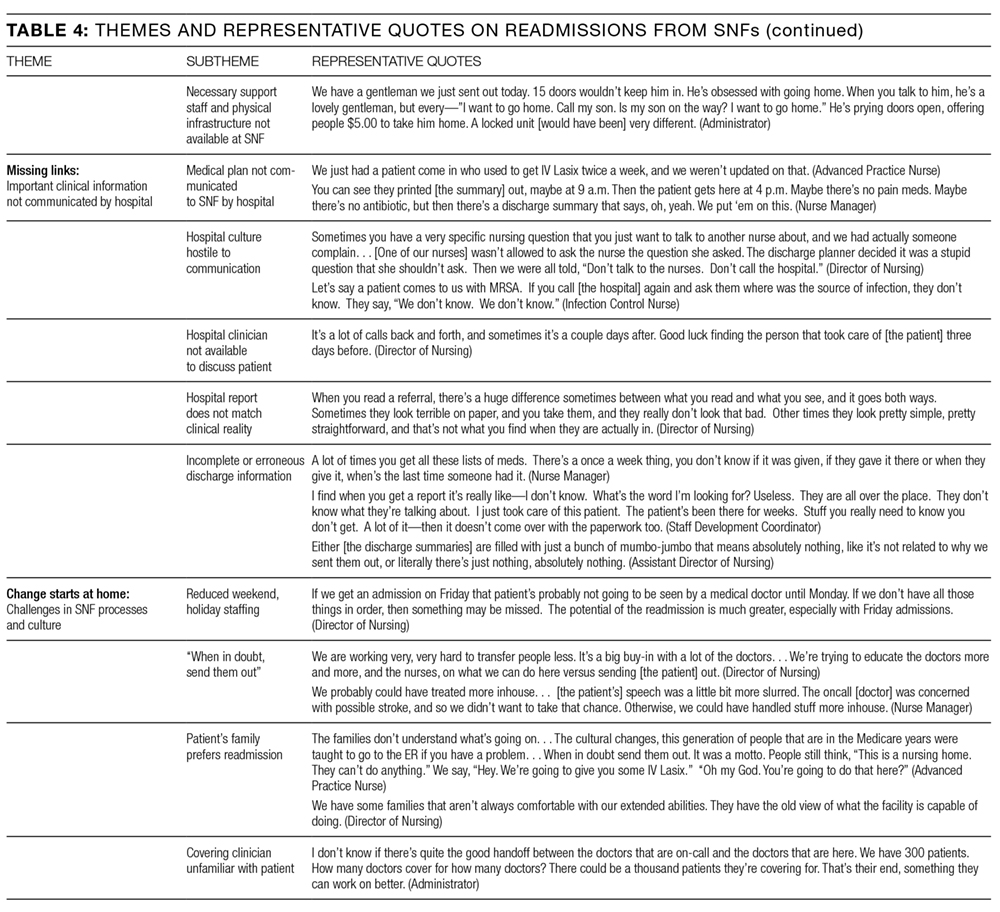
Our study suggests that the interaction between EDs and SNFs is an important and understudied domain in the spectrum of events leading to readmission. Prior studies have documented inadequacies in patient information provided by SNFs to EDs.16,17 Efforts to improve SNF-to-ED information sharing have focused on making sure that ED clinicians have important baseline information about patients transferred from a SNF.18,19 However, many of the clinicians in our study reported taking proactive steps to communicate with ED clinicians. These efforts encountered logistical and cultural barriers, with information that might have prevented readmission failing to reach ED providers. Many of the SNF clinicians in our study perceived this failure as a common cause of readmission, especially for relatively stable SNF patients.
Previous studies have pointed to a role for goals of care discussions in reducing hospital readmissions.20 Our data underscore an important qualification to these findings: Location matters. The SNF clinicians in our study reported frequent and detailed goals of care discussions with their patients. However, they also reported that goals of care discussions held in the subacute setting carried less weight with patients and families than discussions held in the hospital. SNF clinicians described a number of cases in which patients were willing to adjust code status or goals of care only after being readmitted to the hospital.
Our study also points to the implications of existing research showing that patients are discharged from acute care hospitals “quicker and sicker” than they had been prior to the 1983 adoption of Medicare’s prospective payment system.21 Specifically, the SNF clinicians we interviewed perceived a strong link between patient acuity at the time of transfer and SNFs’ persistently high readmission rates. As SNFs have worked to expand their clinical capabilities, they struggle to win buy-in from physicians and families, many of whom view SNFs as incapable of managing acute illness. Many SNF clinicians also pointed to deficiencies in their own referral and admission processes as a recurring cause of readmissions. For example, several patients in our analysis suffered from dementia. Although these patients were stable enough to leave the acute care setting, the SNF clinicians responsible for their readmissions felt that their SNFs were not well-equipped to care for patients with dementia and that the patients should instead have been transferred to facilities with more robust resources for dementia care.
Finally, our findings highlight a fundamental tension between hospitals and SNFs: Which facility ought to shoulder the responsibility and cost for services that may prevent a readmission—the hospital or the SNF? For example, does responsibility for coordinating subspecialist evaluation of a patient’s chronic condition fall to the hospital or to the SNF? If such an evaluation is undertaken during a hospitalization, it prolongs the patient’s hospital stay and happens at the hospital’s expense. If the patient is discharged to a SNF and sees the subspecialist in clinic, then the SNF must pay for transportation to and from the clinic appointment. SNF clinicians expressed near unanimity that fragmented models of care and high barriers to communication made it difficult to design solutions to these dilemmas.
Strengths and limitations
To our knowledge, this is the first interview-based study examining SNF clinicians’ perspectives on unplanned, 30-day hospital readmissions. We gathered information from clinicians with a range of clinical experience, all of whom had cared directly for the patient who had been readmitted. Our data came from clinicians at 15 SNFs of varying sizes and quality ratings, allowing us to identify a broad range of factors contributing to readmissions.
Because this study relied on qualitative methods, it should be viewed as hypothesis-generating rather than hypothesis-confirming. Further research is needed to determine whether variables related to the themes above are causally linked to SNF readmissions. We identified cases for review using convenience sampling of a cohort of readmitted patients at a single tertiary-care hospital, and all participating SNFs were located in Connecticut. These factors may limit the generalizability of our findings. Although the clinicians we interviewed occupied diverse roles within their respective SNFs, our sample did not include direct-care staff without managerial responsibility, such as certified nursing assistants or licensed practical nurses. This prevented our study from identifying themes into which managers would have limited insight, especially those involving cultural and management practices leading to poor communication between them and their staff. Because our study examines cases in which discharge and readmission were to a general medicine service, it may not describe factors relevant to patients discharged from subspecialist or surgical services.
Implications for future QI efforts and research
Several clinicians we interviewed suggested that readmissions might be reduced by dedicating the services of a hospital professional, such as a nurse or case manager, to monitoring the clinical course of medically complex patients after discharge. A dedicated “transition coach” could clarify deficiencies in discharge paperwork, facilitate necessary follow-up appointments, liaise with staff at both the hospital and the SNF, or coordinate acquisition of necessary equipment. Prospective trials have demonstrated that such interventions can decrease readmission rates among hospitalized patients,22,23 but formal studies have not been carried out among cohorts of SNF patients.
Prior efforts to improve SNF-ED information sharing have focused on making sure that ED clinicians have important baseline information about patients transferred from a SNF.24,25 The experiences of SNF clinicians in our study suggest that important information also fails to make its way from ED providers to SNFs and that this failure results in unnecessary readmissions of relatively stable SNF patients. Thus, hospitals may be able to prevent SNF readmissions by creating lines of communication between EDs and SNFs and by ensuring that ED physicians and mid-level providers are familiar with the clinical capabilities of local SNFs.
Future research and QI work should also investigate approaches to care coordination that ensure that complex patients are placed in SNFs with resources adequate to address their comorbidities. Potential interventions might include increased use of SNF “liaisons,” who would evaluate patients in-person prior to approving transfer to a given SNF. As has been previously suggested,26 hospitals might also reduce readmissions by narrowing the pool of facilities to which they transfer patients, thereby building more robust, interconnected relationships with a smaller number of SNFs.
CONCLUSION
SNF clinicians identified areas for improvement at almost every point in the chain of events spanning hospitalization, discharge, and transfer. Among the most frequently cited contributors to readmissions were clinical instability at the time of discharge and omission of clinically important information from discharge documentation. Improved communication between hospitals, ED clinicians, and SNFs, as well as more thoroughly defined goals of care at the time of discharge, were seen as promising ways of decreasing readmissions. Successful interventions for reducing readmissions from SNFs will likely require multifaceted approaches to these problems.
Disclosure: This research was supported by a grant (#P30HS023554-01) from the Agency for Healthcare Research and Quality (AHRQ) and received support from Yale New Haven Hospital and the Claude D. Pepper Older Americans Independence Center at Yale University School of Medicine (#P30AG021342 NIH/NIA).
1. Mor V, Intrator O, Feng Z, et al. The revolving door of rehospitalization from skilled nursing facilities. Health Aff. 2010;29(1):57-64. PubMed
2. Department of Health and Human Services. Medicare.gov Hospital Compare. https://medicare .gov/hospitalcompare/compare. Accessed October 21, 2015.
3. Centers for Medicare and Medicaid Services. Proposed fiscal year 2016 payment and policy changes for Medicare Skilled Nursing Facilities. https://cms.gov. Accessed October 21, 2015.
4. The Patient Protection and Affordable Care Act: Detailed Summary. Democratic Policy and Communications Committee website. http://www.dpc.senate.gov/healthreformbill/healthbill04.pdf. Accessed August 22, 2016.
5. Intrator O, Zinn J, Mor V. Nursing home characteristics and potentially preventable hospitalizations of long-stay residents. J Am Geriatr Soc. 2004;52:1730-1736. PubMed
6. Ouslander JG, Lamb G, Perloe M, et al. Potentially avoidable hospitalizations of nursing home residents: frequency, causes and costs. J Am Geriatr Soc. 2010;58:627-635. PubMed
7. Lamb G, Tappen R, Diaz S, et al. Avoidability of hospital transfers of nursing home residents: perspectives of frontline staff. J Am Geriatr Soc. 2011;59:1665-1672. PubMed
8. Ouslander JG, Naharci I, Engstrom G, et al. Hospital transfers of skilled nursing facility (SNF) patients within 48 hours and 30 days after SNF admission. J Am Med Dir Assoc. 2016; doi: 10.1016/j.jamda.2016.05.021. PubMed
9. Ouslander JG, Lamb G, Tappen R et al. Interventions to reduce hospitalizations from nursing homes: Evaluation of the INTERACT II collaborative quality improvement project. J Am Geriatr Soc. 2011; 59:745-753. PubMed
10. Ouslander JG, Perloe M, Givens JH et al. Reducing potentially avoidable hospitalization of nursing home residents: Results of a pilot quality improvement project. J Am Med Dir Assoc. 2009; 10:644-652. PubMed
11. Tena-Nelson R, Santos K, Weingast E et al. Reducing preventable hospital transfers: Results from a thirty nursing home collaborative. J Am Med Dir Assoc. 2012; 13:651-656. PubMed
12. Florida Atlantic University. Interventions to Reduce Acute Care Transfers. https://interact2.net/docs/INTERACT%20Version%204.0%20Tools/INTERACT%204.0%20NH%20Tools%206_17_15/148604%20QI_Tool%20for%20Review%20Acute%20Care%20Transf_AL.pdf
13. Oktay, Julianne. Grounded Theory. New York: Oxford University Press, 2012.
14. Auerbach, Carl and Silverstein, Louise B. Qualitative Data. New York: NYU Press, 2003.
15. Department of Health and Human Services. Medicare.gov Nursing Home Compare. https://medicare .gov/nursinghomecompare. Accessed April 4, 2016.
16. Jones JS, Dwyer PR, White LJ, et al. Patient transfer from nursing home to emergency department: outcomes and policy implications. Acad Emerg Med. 1997 Sep;4(9):908-15. PubMed
17. Lahn M, Friedman B, Bijur P, et al. Advance directives in skilled nursing facility residents transferred to emergency departments. Acad Emerg Med. 2001 Dec;8(12):1158-62. PubMed
18. Madden C, Garrett J, Busby-Whitehead J. The interface between nursing homes and emergency departments: a community effort to improve transfer of information. Acad Emerg Med. 1998 Nov;5(11):1123-6. PubMed
19. Hustey FM, Palmer RM. An internet-based communication network for information transfer during patient transitions from skilled nursing facility to the emergency department. J Am Geriatr Soc. 2010 Jun;58(6):1148-52. PubMed
20. O’Connor N, Moyer ME, Behta M, et al. The Impact of Inpatient Palliative Care Consultations on 30-Day Hospital Readmissions. J Pall Med. 2015 Nov 1; 18(11):956-961. PubMed
21. Qian X, Russell LB, Valiyeva E, et al. “Quicker and sicker” under Medicare’s prospective payment system for hospitals: new evidence on an old issue from a national longitudinal survey. Bull Econ Res. 2011;63(1):1-27. PubMed
22. Naylor MD, Brooten DA, Campbell RL, Maislin G, McCauley KM, Schwartz JS. Transitional care of older adults hospitalized with heart failure: a randomized, controlled trial. J Am Geriatr Soc. 2004 May;52(5):675-84. PubMed
23. Coleman EA, Parry C, Chalmers S, Min SJ. The care transitions intervention: results of a randomized controlled trial. Arch Intern Med. 2006 Sep 25;166(17):1822-1828. PubMed
24. Madden C, Garrett J, Busby-Whitehead J. The interface between nursing homes and emergency departments: a community effort to improve transfer of information. Acad Emerg Med. 1998 Nov;5(11):1123-6. PubMed
25. Hustey FM, Palmer RM. An internet-based communication network for information transfer during patient transitions from skilled nursing facility to the emergency department. J Am Geriatr Soc. 2010 Jun;58(6):1148-52. PubMed
26. Rahman M, Foster AD, Grabowski DC, Zinn JS, Mor V. Effect of hospital-SNF referral linkages on rehospitalization. Health Serv Res. 2013 Dec;48(6 Pt 1):1898-919. PubMed
Skilled nursing facilities (SNFs) play a crucial role in the hospital readmission process.Approximately 1 in 4 Medicare beneficiaries discharged from an acute care hospital is admitted to a SNF instead of returning directly home. Of these patients, 1 in 4 will be readmitted within 30 days,1 a rate significantly higher than the readmission rate of the inpatient population as a whole.2 The 2014 Protecting Access to Medicare Act created a value-based purchasing program that will use quality measures to steer funds to, or away from, individual SNFs. When the program takes effect in 2018, the Centers for Medicare & Medicaid Services will use SNFs’ 30-day all-cause readmission rate to determine which SNFs receive payments and which receive penalties.3 The Affordable Care Act, passed in 2010, has also established penalties for hospitals with higher than expected readmission rates for Medicare patients.4
Despite this intensifying regulatory focus, relatively little is known about the factors that drive readmissions from SNFs. A prospective review of data from SNFs in 4 states has shown that SNFs staffed by nurse practitioners or physician assistants and those equipped to provide intravenous therapy were less likely to transfer patients to the hospital for ambulatory care-sensitive diagnoses.5 Qualitative studies have provided useful insight into the causes of SNF-to-hospital transfers but have not focused on 30-day readmissions.6,7 A single survey-based study has examined the causes of SNF-to-hospital readmissions.8 However, survey-based methodologies have limited ability to capture the complex perspectives of SNF clinicians, who play a critical role in determining which SNF patients require evaluation or treatment in an acute care setting.
To address this gap in knowledge about factors contributing to SNF readmissions, we conducted a qualitative study examining SNF clinicians’ perspectives on patients readmitted to the hospital within 30 days of discharge. We used a structured interview tool to explore the root causes of readmission with frontline SNF staff, with the goal of using this knowledge to inform future hospital quality improvement (QI) efforts.
METHODS
Case Identification
Hospital data-tracking software (Allscripts) was used to identify patients who experienced a 30-day, unplanned readmission from SNFs to an academic medical center. We restricted our search to patients whose index admission and readmission were to the medical center’s inpatient general medicine service. A study team member (BWC) monitored the dataset on a weekly basis and contacted SNF clinicians by e-mail and telephone to arrange interviews at times of mutual convenience. To mitigate against recall bias, interviews were conducted within 30 days of the readmission in question. A total of 32 cases were identified. No SNF clinicians refused a request for interview. For 8 of these cases, it was not possible to find a time of mutual convenience within the specified 30-day window. The remaining 24 cases involved patients from 15 SNFs across Connecticut. Interviews were conducted from August 2015 to November 2015.
The project was reviewed by our institution’s Human Investigation Committee and was exempted from Institutional Review Board review.
Study Participants
Interviews were conducted on-site at SNFs with groups of 1 to 4 SNF clinicians and administrators. SNF participants were informed of interviewer credentials and the study’s QI goals prior to participation. Participation was voluntary and did not affect the clinician’s relationship with the hospital or the SNF. Participants were not paid.
DATA COLLECTION
Interventions to Reduce Acute Care Transfers (INTERACT) is a QI program that includes training for clinicians, communication tools, and advance care planning tools.9 INTERACT is currently used in 138 Connecticut SNFs as part of a statewide QI effort funded by the Connecticut State Department of Public Health. In prospective QI studies,10,11 implementation of INTERACT has been associated with decreased transfers from SNFs to acute care hospitals. The INTERACT Quality Improvement Tool, one part of the INTERACT bundle of interventions, is a 26-item questionnaire used to identify root causes of transfers from SNFs to acute care hospitals. It includes both checklists and open-ended questions about patient factors, SNF procedures, and SNF clinical decision-making.
We used the INTERACT QI Tool12 to conduct structured interviews with nurses and administrators at SNFs. Interviewers used a hard copy of the tool to maintain field notes, and all parts of the questionnaire were completed in each interview. Although the questionnaire elicits baseline demographic and medical information, such as the patient’s age and vital signs prior to readmission, the majority of each interview was dedicated to discussion of the open-ended questions in Table 1. Upon completion of the INTERACT QI Tool, the interviewer asked 2 open-ended questions about reducing readmissions and 4 closed-ended questions regarding SNF admission procedures. (Table 1) The supplemental questions were added after preliminary interviews with SNF clinicians revealed concerns about the SNF referral process and about communication between the hospital, emergency department (ED) and SNFs—issues not included in the INTERACT questionnaire. Interviewers used phatic communication, probing questions, and follow-up questions to elicit detailed information from participants, and participant responses were not limited to topics in the questionnaire and the list of supplemental questions.
Interviews were conducted by a hospital clinical integration coordinator, social worker, and a physician (KB, MCB, BWC). All interviewers received formal training in qualitative research methods prior to the study.
All interviews were audio recorded, with permission from the participants, and were professionally transcribed. Field notes were maintained to ensure accuracy of INTERACT QI Tool data. Participant interviews covered no more than two cases per session and lasted from 18 to 71 minutes (mean duration, 38 minutes).
Analysis
Analysis of transcripts was inductive and informed by grounded theory methodology, in which data is reviewed for repeating ideas, which are then analyzed and grouped to develop a theoretical understanding of the phenomenon under investigation.13,14
A preliminary codebook was developed using transcripts of the first 11 interviews. All statements relevant to the readmission process were extracted from the raw interview transcript and collected into a single list. This list was then reviewed for statements sharing a particular idea or concern. Such statements were grouped together under the heading of a repeating idea, and each repeating idea was assigned a code. Using this codebook, each transcript was independently reviewed and coded by three study team members with formal training in inductive qualitative analysis (KB, KTM, BWC). Reviewers assigned codes to sections of relevant text. Discrepancies in code assignment were discussed among the 3 analysts until consensus was reached. Using the method of constant comparison described in grounded theory,the codebook was updated continuously as the process of coding transcripts proceeded.12 Changes to the codebook were discussed among the coding team until consensus was achieved. The process of data acquisition and coding continued until theoretical saturation was reached. Themes relating to underlying factors associated with readmissions were then identified based on shared properties among repeating ideas. ATLAS.ti (Scientific Software, Berlin, Germany, Version 7) was used to facilitate data organization and retrieval.
RESULTS
The SNFs in our study included 12 for-profit and 3 non-profit facilities. The number of licensed beds in each facility ranged from 73 to 360, with a mean of 148 beds. The SNFs had CMS Nursing Home Compare ratings ranging from 1 star, the lowest possible rating, to 5 stars, the highest possible,15 with a mean rating of 2.9 stars. Our analysis did not reveal differences in perceived contributions to readmissions from large vs. small or highly rated vs poorly rated SNFs.
The patients in our analysis represented a highly comorbid and medically complex population (Table 3). Many had barriers to communication with clinical staff, including non–English-speaking status and underlying dementia.
Five main themes emerged from our analysis: (1) lack of coordination between EDs and SNFs; (2) incompletely addressed goals of care; (3) mismatch between patient clinical needs and SNF capabilities; (4) important clinical information not effectively communicated by hospital; and (5) challenges in SNF processes and culture.
Emergent transitions: Lack of coordination between ED and SNF
SNF clinicians frequently encountered situations in which a relatively stable patient was readmitted to the hospital after being transferred to the ED, despite the fact that SNF clinicians believed the patient should have returned to the SNF once a specific test was performed or service rendered at the ED. Commonly cited clinical scenarios that resulted in such readmissions included placement of urinary catheters and evaluation for cystitis. An assistant director of nursing reported that “the ER doesn’t want to hear my side of the story,” making it difficult for her to provide information that would prevent such readmissions. Other SNF clinicians reported similar difficulties in communicating with ED clinicians.
Code status: Incompletely addressed goals of care
The SNF clinicians in our study described cases in which patients with end-stage lung disease and disseminated cancer were readmitted to the hospital, despite SNF efforts to prevent readmission and provide palliative care within the SNF. For example, a SNF advanced practice nurse described a case in which a patient with widely metastatic cancer requested readmission to the hospital for treatment of deep vein thrombosis, despite longstanding recommendations from SNF staff that the patient forego hospitalization and enroll in hospice care. After discussion of code status and goals of care with hospital clinicians, the patient chose to enroll in hospice care and not to continue anticoagulation. SNF clinicians often perceived that, in the words of one administrator, “the palliative talks in the hospital outweigh our talks by a lot.” Numerous SNF clinicians believed that in-depth clarification of goals of care prior to discharge could prevent some readmissions.
Wrong patient, wrong place: Mismatch between clinical needs and SNF capabilities
One director of nursing stated that “[when] you read a referral, there’s a huge difference sometimes between what you read and what you see.” SNF clinicians reported that this discrepancy between clinical report and clinical reality often leads to patients being placed in SNFs that are unequipped to care for them. Many patients were perceived as being too ill for discharge from the acute-care setting in the first place. A nurse manager described this as a pattern of “pushing patients out of the hospital.” However, mismatches in clinical disposition were also seen as contributing to readmissions for medically stable patients, such as those with dementia, for whom SNFs frequently lack adequate staffing and physical safeguards.
Missing links: Important clinical information not effectively communicated by hospital
SNF clinicians described numerous challenges in formulating plans of care based on hospital discharge documentation. Discrepancies between discharge summaries and patient instructions were perceived as common and potential causes of readmissions. For patients discharged from the academic medical center in this study, medication instructions are included in both the discharge summary sent to the SNF and in a patient instruction packet. Several SNF clinicians said that it was common for a course of antibiotics to be listed on the discharge summary but not the patient instruction packet, or vice versa. SNF clinicians, who usually lack access to the hospital’s electronic medical record, have limited means for determining the correct document. Other important clinical data points, such as intermittent intravenous (IV) furosemide dosing and suppressive antibiotic regimens, were omitted from discharge paperwork altogether. SNF clinicians had difficulty reaching hospital clinicians who could clarify these clinical questions. “Good luck finding the person that took care of [the patient] three days before,” said one director of nursing.
Change starts at home: Challenges in SNF processes and culture
Many clinicians in our study reported that their facilities had recently added clinical capabilities in an effort to care for patients with complex medical problems. For example, to prevent transfers of patients with decompensated heart failure, several facilities in our study had recently obtained certification to give IV diuretics. However, as one director of nursing stated, these efforts require “buy-in” from doctors to decrease readmissions. That buy-in has not always been forthcoming. SNF clinicians also reported difficulty convincing patients and families that their facilities are capable of providing care that, in the past, might only have been available in acute-care settings.
These themes, along with associated sub-themes and representative quotations, are shown above (Table 4).
DISCUSSION
Our study suggests that the interaction between EDs and SNFs is an important and understudied domain in the spectrum of events leading to readmission. Prior studies have documented inadequacies in patient information provided by SNFs to EDs.16,17 Efforts to improve SNF-to-ED information sharing have focused on making sure that ED clinicians have important baseline information about patients transferred from a SNF.18,19 However, many of the clinicians in our study reported taking proactive steps to communicate with ED clinicians. These efforts encountered logistical and cultural barriers, with information that might have prevented readmission failing to reach ED providers. Many of the SNF clinicians in our study perceived this failure as a common cause of readmission, especially for relatively stable SNF patients.
Previous studies have pointed to a role for goals of care discussions in reducing hospital readmissions.20 Our data underscore an important qualification to these findings: Location matters. The SNF clinicians in our study reported frequent and detailed goals of care discussions with their patients. However, they also reported that goals of care discussions held in the subacute setting carried less weight with patients and families than discussions held in the hospital. SNF clinicians described a number of cases in which patients were willing to adjust code status or goals of care only after being readmitted to the hospital.
Our study also points to the implications of existing research showing that patients are discharged from acute care hospitals “quicker and sicker” than they had been prior to the 1983 adoption of Medicare’s prospective payment system.21 Specifically, the SNF clinicians we interviewed perceived a strong link between patient acuity at the time of transfer and SNFs’ persistently high readmission rates. As SNFs have worked to expand their clinical capabilities, they struggle to win buy-in from physicians and families, many of whom view SNFs as incapable of managing acute illness. Many SNF clinicians also pointed to deficiencies in their own referral and admission processes as a recurring cause of readmissions. For example, several patients in our analysis suffered from dementia. Although these patients were stable enough to leave the acute care setting, the SNF clinicians responsible for their readmissions felt that their SNFs were not well-equipped to care for patients with dementia and that the patients should instead have been transferred to facilities with more robust resources for dementia care.
Finally, our findings highlight a fundamental tension between hospitals and SNFs: Which facility ought to shoulder the responsibility and cost for services that may prevent a readmission—the hospital or the SNF? For example, does responsibility for coordinating subspecialist evaluation of a patient’s chronic condition fall to the hospital or to the SNF? If such an evaluation is undertaken during a hospitalization, it prolongs the patient’s hospital stay and happens at the hospital’s expense. If the patient is discharged to a SNF and sees the subspecialist in clinic, then the SNF must pay for transportation to and from the clinic appointment. SNF clinicians expressed near unanimity that fragmented models of care and high barriers to communication made it difficult to design solutions to these dilemmas.
Strengths and limitations
To our knowledge, this is the first interview-based study examining SNF clinicians’ perspectives on unplanned, 30-day hospital readmissions. We gathered information from clinicians with a range of clinical experience, all of whom had cared directly for the patient who had been readmitted. Our data came from clinicians at 15 SNFs of varying sizes and quality ratings, allowing us to identify a broad range of factors contributing to readmissions.
Because this study relied on qualitative methods, it should be viewed as hypothesis-generating rather than hypothesis-confirming. Further research is needed to determine whether variables related to the themes above are causally linked to SNF readmissions. We identified cases for review using convenience sampling of a cohort of readmitted patients at a single tertiary-care hospital, and all participating SNFs were located in Connecticut. These factors may limit the generalizability of our findings. Although the clinicians we interviewed occupied diverse roles within their respective SNFs, our sample did not include direct-care staff without managerial responsibility, such as certified nursing assistants or licensed practical nurses. This prevented our study from identifying themes into which managers would have limited insight, especially those involving cultural and management practices leading to poor communication between them and their staff. Because our study examines cases in which discharge and readmission were to a general medicine service, it may not describe factors relevant to patients discharged from subspecialist or surgical services.
Implications for future QI efforts and research
Several clinicians we interviewed suggested that readmissions might be reduced by dedicating the services of a hospital professional, such as a nurse or case manager, to monitoring the clinical course of medically complex patients after discharge. A dedicated “transition coach” could clarify deficiencies in discharge paperwork, facilitate necessary follow-up appointments, liaise with staff at both the hospital and the SNF, or coordinate acquisition of necessary equipment. Prospective trials have demonstrated that such interventions can decrease readmission rates among hospitalized patients,22,23 but formal studies have not been carried out among cohorts of SNF patients.
Prior efforts to improve SNF-ED information sharing have focused on making sure that ED clinicians have important baseline information about patients transferred from a SNF.24,25 The experiences of SNF clinicians in our study suggest that important information also fails to make its way from ED providers to SNFs and that this failure results in unnecessary readmissions of relatively stable SNF patients. Thus, hospitals may be able to prevent SNF readmissions by creating lines of communication between EDs and SNFs and by ensuring that ED physicians and mid-level providers are familiar with the clinical capabilities of local SNFs.
Future research and QI work should also investigate approaches to care coordination that ensure that complex patients are placed in SNFs with resources adequate to address their comorbidities. Potential interventions might include increased use of SNF “liaisons,” who would evaluate patients in-person prior to approving transfer to a given SNF. As has been previously suggested,26 hospitals might also reduce readmissions by narrowing the pool of facilities to which they transfer patients, thereby building more robust, interconnected relationships with a smaller number of SNFs.
CONCLUSION
SNF clinicians identified areas for improvement at almost every point in the chain of events spanning hospitalization, discharge, and transfer. Among the most frequently cited contributors to readmissions were clinical instability at the time of discharge and omission of clinically important information from discharge documentation. Improved communication between hospitals, ED clinicians, and SNFs, as well as more thoroughly defined goals of care at the time of discharge, were seen as promising ways of decreasing readmissions. Successful interventions for reducing readmissions from SNFs will likely require multifaceted approaches to these problems.
Disclosure: This research was supported by a grant (#P30HS023554-01) from the Agency for Healthcare Research and Quality (AHRQ) and received support from Yale New Haven Hospital and the Claude D. Pepper Older Americans Independence Center at Yale University School of Medicine (#P30AG021342 NIH/NIA).
1. Mor V, Intrator O, Feng Z, et al. The revolving door of rehospitalization from skilled nursing facilities. Health Aff. 2010;29(1):57-64. PubMed
2. Department of Health and Human Services. Medicare.gov Hospital Compare. https://medicare .gov/hospitalcompare/compare. Accessed October 21, 2015.
3. Centers for Medicare and Medicaid Services. Proposed fiscal year 2016 payment and policy changes for Medicare Skilled Nursing Facilities. https://cms.gov. Accessed October 21, 2015.
4. The Patient Protection and Affordable Care Act: Detailed Summary. Democratic Policy and Communications Committee website. http://www.dpc.senate.gov/healthreformbill/healthbill04.pdf. Accessed August 22, 2016.
5. Intrator O, Zinn J, Mor V. Nursing home characteristics and potentially preventable hospitalizations of long-stay residents. J Am Geriatr Soc. 2004;52:1730-1736. PubMed
6. Ouslander JG, Lamb G, Perloe M, et al. Potentially avoidable hospitalizations of nursing home residents: frequency, causes and costs. J Am Geriatr Soc. 2010;58:627-635. PubMed
7. Lamb G, Tappen R, Diaz S, et al. Avoidability of hospital transfers of nursing home residents: perspectives of frontline staff. J Am Geriatr Soc. 2011;59:1665-1672. PubMed
8. Ouslander JG, Naharci I, Engstrom G, et al. Hospital transfers of skilled nursing facility (SNF) patients within 48 hours and 30 days after SNF admission. J Am Med Dir Assoc. 2016; doi: 10.1016/j.jamda.2016.05.021. PubMed
9. Ouslander JG, Lamb G, Tappen R et al. Interventions to reduce hospitalizations from nursing homes: Evaluation of the INTERACT II collaborative quality improvement project. J Am Geriatr Soc. 2011; 59:745-753. PubMed
10. Ouslander JG, Perloe M, Givens JH et al. Reducing potentially avoidable hospitalization of nursing home residents: Results of a pilot quality improvement project. J Am Med Dir Assoc. 2009; 10:644-652. PubMed
11. Tena-Nelson R, Santos K, Weingast E et al. Reducing preventable hospital transfers: Results from a thirty nursing home collaborative. J Am Med Dir Assoc. 2012; 13:651-656. PubMed
12. Florida Atlantic University. Interventions to Reduce Acute Care Transfers. https://interact2.net/docs/INTERACT%20Version%204.0%20Tools/INTERACT%204.0%20NH%20Tools%206_17_15/148604%20QI_Tool%20for%20Review%20Acute%20Care%20Transf_AL.pdf
13. Oktay, Julianne. Grounded Theory. New York: Oxford University Press, 2012.
14. Auerbach, Carl and Silverstein, Louise B. Qualitative Data. New York: NYU Press, 2003.
15. Department of Health and Human Services. Medicare.gov Nursing Home Compare. https://medicare .gov/nursinghomecompare. Accessed April 4, 2016.
16. Jones JS, Dwyer PR, White LJ, et al. Patient transfer from nursing home to emergency department: outcomes and policy implications. Acad Emerg Med. 1997 Sep;4(9):908-15. PubMed
17. Lahn M, Friedman B, Bijur P, et al. Advance directives in skilled nursing facility residents transferred to emergency departments. Acad Emerg Med. 2001 Dec;8(12):1158-62. PubMed
18. Madden C, Garrett J, Busby-Whitehead J. The interface between nursing homes and emergency departments: a community effort to improve transfer of information. Acad Emerg Med. 1998 Nov;5(11):1123-6. PubMed
19. Hustey FM, Palmer RM. An internet-based communication network for information transfer during patient transitions from skilled nursing facility to the emergency department. J Am Geriatr Soc. 2010 Jun;58(6):1148-52. PubMed
20. O’Connor N, Moyer ME, Behta M, et al. The Impact of Inpatient Palliative Care Consultations on 30-Day Hospital Readmissions. J Pall Med. 2015 Nov 1; 18(11):956-961. PubMed
21. Qian X, Russell LB, Valiyeva E, et al. “Quicker and sicker” under Medicare’s prospective payment system for hospitals: new evidence on an old issue from a national longitudinal survey. Bull Econ Res. 2011;63(1):1-27. PubMed
22. Naylor MD, Brooten DA, Campbell RL, Maislin G, McCauley KM, Schwartz JS. Transitional care of older adults hospitalized with heart failure: a randomized, controlled trial. J Am Geriatr Soc. 2004 May;52(5):675-84. PubMed
23. Coleman EA, Parry C, Chalmers S, Min SJ. The care transitions intervention: results of a randomized controlled trial. Arch Intern Med. 2006 Sep 25;166(17):1822-1828. PubMed
24. Madden C, Garrett J, Busby-Whitehead J. The interface between nursing homes and emergency departments: a community effort to improve transfer of information. Acad Emerg Med. 1998 Nov;5(11):1123-6. PubMed
25. Hustey FM, Palmer RM. An internet-based communication network for information transfer during patient transitions from skilled nursing facility to the emergency department. J Am Geriatr Soc. 2010 Jun;58(6):1148-52. PubMed
26. Rahman M, Foster AD, Grabowski DC, Zinn JS, Mor V. Effect of hospital-SNF referral linkages on rehospitalization. Health Serv Res. 2013 Dec;48(6 Pt 1):1898-919. PubMed
© 2017 Society of Hospital Medicine
Use of Post-Acute Facility Care in Children Hospitalized With Acute Respiratory Illness
Respiratory illness (RI) is one of the most common reasons for pediatric hospitalization.1 Examples of RI include acute illness, such as bronchiolitis, bacterial pneumonia, and asthma, as well as chronic conditions, such as obstructive sleep apnea and chronic respiratory insufficiency. Hospital care for RI includes monitoring and treatment to optimize oxygenation, ventilation, hydration, and other body functions. Most previously healthy children hospitalized with RI stay in the hospital for a limited duration (eg, a few days) because the severity of their illness is short lived and they quickly return to their previous healthy status.2 However, hospital care is increasing for children with fragile and tenuous health due to complex medical conditions.3 RI is a common reason for hospitalization among these children as well and recovery of respiratory health and function can be slow and protracted for some of them.4 Weeks, months, or longer periods of time may be necessary for the children to return to their previous respiratory baseline health and function after hospital discharge; other children may not return to their baseline.5,6
Hospitalized older adults with high-severity RI are routinely streamlined for transfer to post-acute facility care (PAC) shortly (eg, a few days) after acute-care hospitalization. Nearly 70% of elderly Medicare beneficiaries use PAC following a brief length of stay (LOS) in the acute-care hospital.7 It is believed that PAC helps optimize the patients’ health and functional status and relieves the family caregiving burden that would have occurred at home.8-10 PAC use also helps to shorten acute-care hospitalization for RI while avoiding readmission.8-10 In contrast with adult patients, use of PAC for hospitalized children is not routine.11 While PAC use in children is infrequent, RI is one of the most common reasons for acute admission among children who use it.12
For some children with RI, PAC might be positioned to offer a safe, therapeutic, and high-value setting for pulmonary rehabilitation, as well as related medical, nutritional, functional, and family cares.6 PAC, by design, could possibly help some of the children transition back into their homes and communities. As studies continue to emerge that assess the value of PAC in children, it is important to learn more about the use of PAC in children hospitalized with RI. The objectives were to (1) assess which children admitted with RI are the most likely to use PAC services for recovery and (2) estimate how many hospitalized children not using PAC had the same characteristics as those who did.
METHODS
Study Design, Setting, and Population
We conducted a retrospective cohort analysis of 609,800 hospitalizations for RI occurring from January 1, 2010 to December 31, 2015, in 43 freestanding children’s hospitals in the Pediatric Health Information Systems (PHIS) dataset. All hospitals participating in PHIS are members of the Children’s Hospital Association.13 The Boston Children’s Hospital Institutional Review Board approved this study with a waiver for informed consent.
RI was identified using the Agency for Healthcare Research and Quality (AHRQ) Clinical Classification System (CCS).14 Using diagnosis CCS category 8 (“Diseases of the Respiratory System”) and the procedure CCS category 6 (“Operations on the Respiratory System”), we identified all hospitalizations from the participating hospitals with a principal diagnosis or procedure International Classification of Diseases, 9th Revision, Clinical Modification (ICD-9-CM) code for an RI.
Main Outcome Measure
Discharge disposition following the acute-care hospitalization for RI was the main outcome measure. We used PHIS uniform disposition coding to classify the discharge disposition as transfer to PAC (ie, rehabilitation facility, skilled nursing facility, etc.) vs all other dispositions (ie, routine to home, against medical advice, etc.).12 The PAC disposition category was derived from the Centers for Medicare & Medicaid Services Patient Discharge Status Codes and Hospital Transfer Policies as informed by the National Uniform Billing Committee Official UB-04 Data Specifications Manual, 2008. PAC transfer included disposition to external PAC facilities, as well as to internal, embedded PAC units residing in a few of the acute-care children’s hospitals included in the cohort.
Demographic and Clinical Characteristics
We assessed patient demographic and clinical characteristics that might correlate with PAC use following acute-care hospitalization for RI. Demographic characteristics included gender, age at admission in years, payer (public, private, and other), and race/ethnicity (Hispanic, non-Hispanic black, non-Hispanic white, other).
Clinical characteristics included chronic conditions (type and number) and assistance with medical technology. Chronic condition and medical technology characteristics were assessed with ICD-9-CM diagnosis codes. PHIS contain up to 41 ICD-9-CM diagnosis codes per hospital discharge record. To identify the presence and number of chronic conditions, we used the AHRQ Chronic Condition Indicator system, which categorizes over 14,000 ICD-9-CM diagnosis codes into chronic vs non-chronic conditions.14,15 Children hospitalized with a chronic condition were further classified as having a complex chronic condition (CCC) using Feudtner and colleagues’ ICD-9-CM diagnosis classification scheme.16 CCCs represent defined diagnosis groupings expected to last longer than 12 months and involving either a single organ system, severe enough to require specialty pediatric care and hospitalization, or multiple organ systems.17,18 Hospitalized children who were assisted with medical technology were identified with ICD-9-CM codes indicating the use of a medical device to manage and treat a chronic illness (eg, ventricular shunt to treat hydrocephalus) or to maintain basic body functions necessary for sustaining life (eg, a tracheostomy tube for breathing).19,20 We distinguished children undergoing tracheotomy during hospitalization using ICD-9-CM procedure codes 31.1 and 31.2.
Acute-Care Hospitalization Characteristics
We also assessed the relationship between acute-care hospitalization characteristics and use of PAC after discharge, including US census region, LOS, use of intensive care, number of medication classes administered, and use of enhanced respiratory support. Enhanced respiratory support was defined as use of continuous or bilevel positive airway pressure (CPAP or BiPAP) or mechanical ventilation during the acute-care hospitalization for RI. These respiratory supports were identified using billing data in PHIS.
Statistical Analysis
In bivariable analysis, we compared demographic, clinical, and hospitalization characteristics of hospitalized children with vs without discharge to PAC using Rao-Scott chi-square tests and Wilcoxon rank-sum tests as appropriate. In multivariable analysis, we derived a generalized linear mix effects model with fixed effects for demographic, clinical, and hospitalization characteristics that were associated with PAC at P < 0.1 in bivariable analysis (ie, age, gender, race/ethnicity, payer, medical technology, use of intensive care unit [ICU], use of positive pressure or mechanical ventilation, hospital region, LOS, new tracheostomy, existing tracheostomy, other technologies, number of medications, number of chronic conditions [of any complexity], and type of complex chronic conditions). We controlled for clustering of patients within hospitals by including a random intercept for each hospital. We also assessed combinations of patient characteristics on the likelihood of PAC use with classification and regression tree (CART) modeling. Using CART, we determined which characteristic combinations were associated with the highest and lowest use of PAC using binary split and post-pruning, goodness of fit rules.21 All statistical analyses were performed using SAS v.9.4 (SAS Institute, Cary, NC), and R v.3.2 (R Foundation for Statistical Computing, Vienna, Austria) using the “party” package. The threshold for statistical significance was set at P < 0.05.
RESULTS
Of the 609,800 hospitalizations for RI, PAC use after discharge occurred for 2660 (0.4%). RI discharges to PAC accounted for 2.1% (n = 67,405) of hospital days and 2.7% ($280 million) of hospital cost of all RI hospitalizations. For discharges to PAC, the most common RI were pneumonia (29.1% [n = 773]), respiratory failure or insufficiency (unspecified reason; 22.0% [n = 584]), and upper respiratory infection (12.2% [n = 323]).
Demographic Characteristics


Median age at acute-care admission was higher for PAC vs non-PAC discharges (6 years [interquartile range {IQR} 1-15] vs 2 years [0-7], P < 0.001; Table 1). Hispanic patients accounted for a smaller percentage of RI discharges to PAC vs non-PAC (14.1% vs 21.8%, P < 0.001) and a higher percentage to PAC were for patients with public insurance (75.9% vs 62.5, P < 0.001; Table 1).
Clinical Characteristics
A greater percentage of RI hospitalizations discharged to PAC vs not-PAC had ≥1 CCC (94.9% vs 33.5%), including a neuromuscular CCC (57.5% vs 8.9%) or respiratory CCC (62.5% vs 12.0%), P < 0.001 for all (Table 2). A greater percentage discharged to PAC was assisted with medical technology (83.2% vs 15.1%), including respiratory technology (eg, tracheostomy; 53.8% vs 5.4%) and gastrointestinal technology (eg, gastrostomy; 71.9% vs 11.8%), P < 0.001 for all. Of the children with respiratory technology, 14.8% (n = 394) underwent tracheotomy during the acute-care hospitalization. Children discharged to PAC had a higher percentage of multiple chronic conditions. For example, the percentages of children discharged to PAC vs not with ≥7 conditions were 54.5% vs 7.0% (P < 0.001; Table 2). The most common chronic conditions experienced by children discharged to PAC included epilepsy (41.2%), gastroesophageal reflux (36.6%), cerebral palsy (28.2%), and asthma (18.2%).
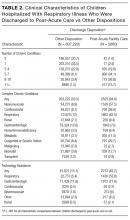
Hospitalization Characteristics

Acute-care RI hospitalization median LOS was longer for discharges to PAC vs non-PAC (10 days [IQR 4-27] vs 2 days [IQR 1-4], P < 0.001; Table 1). A greater percentage of discharges to PAC were administered medications from multiple classes during the acute-care RI admission (eg, 54.8% vs 13.4% used medications from ≥7 classes, P < 0.001). A greater percentage of discharges to PAC used intensive care services during the acute-care admission (65.6% vs 22.4%, P < 0.001). A greater percentage of discharges to PAC received CPAP (10.6 vs 5.0%), BiPAP (19.8% vs 11.4%), or mechanical ventilation (52.7% vs 9.1%) during the acute-care RI hospitalization (P < 0.001 for all; Table 1).
Multivariable Analysis of the Likelihood of Post-Acute Care Use Following Discharge
In multivariable analysis, the patient characteristics associated with the highest likelihood of discharge to PAC included ≥11 vs no chronic conditions (odds ratio [OR] 11.8 , 95% CI, 8.0-17.2), ≥9 classes vs no classes of medications administered during the acute-care hospitalization (OR 4.8 , 95% CI, 1.8-13.0), and existing tracheostomy (OR 3.0, [95% CI, 2.6-3.5; Figure 2 and eTable). Patient characteristics associated with a more modest likelihood of discharge to PAC included public vs private insurance (OR 1.8, 95% CI, 1.6-2.0), neuromuscular complex chronic condition (OR 1.6, 95% CI, 1.5-1.8), new tracheostomy (OR 1.9, 95% CI, 1.7-2.2), and use of any enhanced respiratory support (ie, CPAP/BiPAP/mechanical ventilation) during the acute-care hospitalization (OR 1.4, 95% CI, 1.3-1.6; Figure 2 and Supplementary Table).
Classification and Regression Tree Analysis
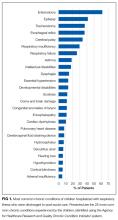

In the CART analysis, the highest percentage (6.3%) of children hospitalized with RI who were discharged to PAC had the following combination of characteristics: ≥6 chronic conditions, ≥7 classes of medications administered, and respiratory technology. Median (IQR) length of acute-care LOS for children with these attributes who were transferred to PAC was 19 (IQR 8-56; range 1-1005) days; LOS remained long (median 13 days [IQR 6-41, range 1-1413]) for children with the same attributes not transferred to PAC (n = 9448). Between these children transferred vs not to PAC, 79.3% vs 65.9% received ICU services; 74.4% vs 73.5% received CPAP, BiPAP, or mechanical ventilation; and 31.0% vs 22.7% underwent tracheotomy during the acute-care hospitalization. Of these children who were not transferred to PAC, 18.9% were discharged to home nursing services.
DISCUSSION
The findings from the present study suggest that patients with RI hospitalization in children’s hospitals who use PAC are medically complex, with high rates of multiple chronic conditions—including cerebral palsy, asthma, chronic respiratory insufficiency, dysphagia, epilepsy, and gastroesophageal reflux—and high rates of technology assistance including enterostomy and tracheostomy. The characteristics of patients most likely to use PAC include long LOS, a large number of chronic conditions, many types of medications administered during the acute-care hospitalization, respiratory technology use, and an underlying neuromuscular condition. Specifically, the highest percentage of children hospitalized with RI who were discharged to PAC had ≥6 chronic conditions, ≥7 classes of medications administered, and respiratory technology. Our analysis suggests that there may be a large population of children with these same characteristics who experienced a prolonged LOS but were not transferred to PAC.
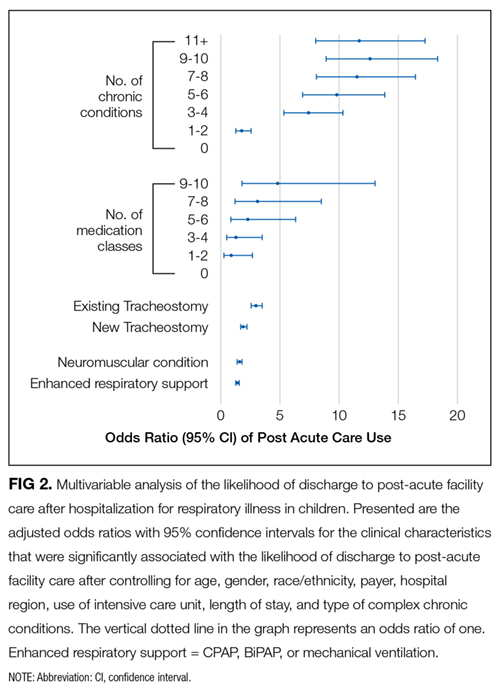
There are several reasons to explain why children hospitalized with RI who rely on medical technology, such as existing tracheostomy, are more likely to use PAC. Tracheostomy often indicates the presence of life-limiting impairment in oxygenation or ventilation, thereby representing a high degree of medical fragility. Tracheostomy, in some cases, offers enhanced ability to assist with RI treatment, including establishment of airway clearance of secretions (ie, suctioning and chest physiotherapy), administration of antimicrobials (eg, nebulized antibiotics), and optimization of ventilation (eg, non-invasive positive airway pressure). However, not all acute-care inpatient clinicians have experience and clinical proficiencies in the care of children with pediatric tracheostomy.23 As a result, a more cautious approach, with prolonged LOS and gradual arrival to hospital discharge, is often taken in the acute-care hospital setting for children with tracheostomy. Tracheostomy care delivered during recovery from RI by trained and experienced teams of providers in the PAC setting may be best positioned to help optimize respiratory health and ensure proper family education and readiness to continue care at home.6
Further investigation is needed of the long LOS in children not transferred to PAC who had similar characteristics to those who were transferred. In hospitalized adult patients with RI, PAC is routinely introduced early in the admission process, with anticipated transfer within a few days into the hospitalization. In the current study, LOS was nearly 2 weeks or longer in many children not transferred to PAC who had similar characteristics to those who were transferred. Perhaps some of the children not transferred experienced long LOS in the acute-care hospital because of a limited number of pediatric PAC beds in their local area. Some families of these children may have been offered but declined use of PAC. PAC may not have been offered to some because illness acuity was too high or there was lack of PAC awareness as a possible setting for recovery.
There are several limitations to this study. PHIS does not contain non-freestanding children’s hospitals; therefore, the study results may generalize best to children’s hospitals. PHIS does not contain information on the amount (eg, number of days used), cost, or treatments provided in PAC. Therefore, we were unable to determine the true reasons why children used PAC services following RI hospitalization (eg, for respiratory rehabilitation vs other reasons, such as epilepsy or nutrition/hydration management). Moreover, we could not assess which children truly used PAC for short-term recovery vs longer-term care because they were unable to reside at home (eg, they were too medically complex). We were unable to assess PAC availability (eg, number of beds) in the surrounding areas of the acute-care hospitals in the PHIS database. Although we assessed use of medical technology, PHIS does not contain data on functional status or activities of daily living, which correlate with the use of PAC in adults. We could not distinguish whether children receiving BiPAP, CPAP, or mechanical ventilation during hospitalization were using it chronically. Although higher PAC use was associated with public insurance, due to absent information on the children’s home, family, and social environment, we were unable to assess whether PAC use was influenced by limited caregiving support or resources.
Data on the type and number of chronic conditions are limited by the ICD-9-CM codes available to distinguish them. Although several patient demographic and clinical characteristics were significantly associated with the use of PAC, significance may have occurred because of the large sample size and consequent robust statistical power. This is why we elected to highlight and discuss the characteristics with the strongest and most clinically meaningful associations (eg, multiple chronic conditions). There may be additional characteristics, including social, familial, and community resources, that are not available to assess in PHIS that could have affected PAC use.
Despite these limitations, the current study suggests that the characteristics of children hospitalized with RI who use PAC for recovery are evident and that there is a large population of children with these characteristics who experienced a prolonged LOS that did not result in transfer to PAC. These findings could be used in subsequent studies to help create the base of a matched cohort of children with similar clinical, demographic, and hospitalization characteristics who used vs didn’t use PAC. Comparison of the functional status, health trajectory, and family and/or social attributes of these 2 groups of children, as well as their post-discharge outcomes and utilization (eg, length of PAC stay, emergency department revisits, and acute-care hospital readmissions), could occur with chart review, clinician and parent interview, and other methods. This body of work might ultimately lead to an assessment of value in PAC and potentially help us understand the need for PAC capacity in various communities. In the meantime, clinicians may find it useful to consider the results of the current study when contemplating PAC use in their hospitalized children with RI, including exploration of health system opportunities of clinical collaboration between acute-care children’s hospitals and PAC facilities. Ultimately, all of this work will generate meaningful knowledge regarding the most appropriate, safe, and cost-effective settings for hospitalized children with RI to regain their health.
Acknowledgments
Dr. Berry was supported by the Agency for Healthcare Research and Quality (R21 HS023092-01), the Lucile Packard Foundation for Children’s Health, and Franciscan Hospital for Children. The funders were not involved in the design and conduct of the study; collection, management, analysis, and interpretation of the data; and preparation, review, or approval of the manuscript; and decision to submit the manuscript for publication.
Disclosure: The authors have no financial relationships relevant to this article to disclose.
1. Friedman B, Berdahl T, Simpson LA, et al. Annual report on health care for children and youth in the United States: focus on trends in hospital use and quality. Acad Pediatr. 2011;11(4):263-279. PubMed
2. Srivastava R, Homer CJ. Length of stay for common pediatric conditions: teaching versus nonteaching hospitals. Pediatrics. 2003;112(2):278-281. PubMed
3. Berry JG, Hall M, Hall DE, et al. Inpatient growth and resource use in 28 children’s hospitals: a longitudinal, multi-institutional study. JAMA Pediatr. 2013;167(2):170-177. PubMed
4. Gold JM, Hall M, Shah SS, et al. Long length of hospital stay in children with medical complexity. J Hosp Med. 2016;11(11):750-756. PubMed
5. Faultner J. Integrating medical plans within family life. JAMA Pediatr. 2014;168(10):891-892. PubMed
6. O’Brien JE, Haley SM, Dumas HM, et al. Outcomes of post-acute hospital episodes for young children requiring airway support. Dev Neurorehabil. 2007;10(3):241-247. PubMed
7. Morley M, Bogasky S, Gage B, et al. Medicare post-acute care episodes and payment bundling. Medicare Medicaid Res Rev. 2014;4(1):mmrr.004.01.b02. PubMed
8. Mentro AM, Steward DK. Caring for medically fragile children in the home: an alternative theoretical approach. Res Theory Nurs Pract. 2002;16(3):161-177. PubMed
9. Thyen U, Kuhlthau K, Perrin JM. Employment, child care, and mental health of mothers caring for children assisted by technology. Pediatrics. 1999;103(6 Pt 1):1235-1242. PubMed
10. Thyen U, Terres NM, Yazdgerdi SR, Perrin JM. Impact of long-term care of children assisted by technology on maternal health. J Dev Behav Pediatr. 1998;19(4):273-282. PubMed
11. O’Brien JE, Berry J, Dumas H. Pediatric Post-acute hospital care: striving for identity and value. Hosp Pediatr. 2015;5(10):548-551. PubMed
12. Berry JG, Hall M, Dumas H, et al. Pediatric hospital discharges to home health and postacute facility care: a national study. JAMA Pediatr. 2016;170(4):326-333. PubMed
13. Children’s Hospital Association. Pediatric Health Information System. https://childrenshospitals.org/Programs-and-Services/Data-Analytics-and-Research/Pediatric-Analytic-Solutions/Pediatric-Health-Information-System. Accessed June 12, 2017.
14. Agency for Healthcare Research and Quality. Chronic Condition Indicator. http://www.hcup-us.ahrq.gov/toolssoftware/chronic/chronic.jsp. Accessed on June 19, 2017.
15. Berry JG, Ash AS, Cohen E, Hasan F, Feudtner C, Hall M. Contributions of children with multiple chronic conditions to pediatric hospitalizations in the United States: A Retrospective Cohort Analysis [published online ahead of print June 20, 2017]. Hosp Pediatr. 2017 Jun 20. doi: 10.1542/hpeds.2016-0179. PubMed
16. Feudtner C, Feinstein JA, Zhong W, Hall M, Dai D. Pediatric complex chronic conditions classification system version 2: updated for ICD-10 and complex medical technology dependence and transplantation. BMC Pediatr. 2014;14:199. PubMed
17. Cohen E, Kuo DZ, Agrawal R, et al. Children with medical complexity: an emerging population for clinical and research initiatives. Pediatrics. 2011;127(3):529-538. PubMed
18. Feudtner C, Christakis DA, Connell FA. Pediatric deaths attributable to complex chronic conditions: a population-based study of Washington State, 1980-1997. Pediatrics. 2000;106(1 Pt 2):205-209. PubMed
19. Palfrey JS, Walker DK, Haynie M, et al. Technology’s children: report of a statewide census of children dependent on medical supports. Pediatrics. 1991;87(5):611-618. PubMed
20. Feudtner C, Villareale NL, Morray B, Sharp V, Hays RM, Neff JM. Technology-dependency among patients discharged from a children’s hospital: a retrospective cohort study. BMC Pediatr. 2005;5(1):8. PubMed
21. Breiman L, Freidman J, Stone CJ, Olshen RA. Classification and Regression Trees. Belmont, CA: Wadsworth International; 1984.
22. Thomson J, Hall M, Ambroggio L, et al. Aspiration and Non-Aspiration Pneumonia in Hospitalized Children With Neurologic Impairment. Pediatrics. 2016;137(2):e20151612. PubMed
23. Berry JG, Goldmann DA, Mandl KD, et al. Health information management and perceptions of the quality of care for children with tracheotomy: a qualitative study. BMC Health Serv Res. 2011;11:117. PubMed
Respiratory illness (RI) is one of the most common reasons for pediatric hospitalization.1 Examples of RI include acute illness, such as bronchiolitis, bacterial pneumonia, and asthma, as well as chronic conditions, such as obstructive sleep apnea and chronic respiratory insufficiency. Hospital care for RI includes monitoring and treatment to optimize oxygenation, ventilation, hydration, and other body functions. Most previously healthy children hospitalized with RI stay in the hospital for a limited duration (eg, a few days) because the severity of their illness is short lived and they quickly return to their previous healthy status.2 However, hospital care is increasing for children with fragile and tenuous health due to complex medical conditions.3 RI is a common reason for hospitalization among these children as well and recovery of respiratory health and function can be slow and protracted for some of them.4 Weeks, months, or longer periods of time may be necessary for the children to return to their previous respiratory baseline health and function after hospital discharge; other children may not return to their baseline.5,6
Hospitalized older adults with high-severity RI are routinely streamlined for transfer to post-acute facility care (PAC) shortly (eg, a few days) after acute-care hospitalization. Nearly 70% of elderly Medicare beneficiaries use PAC following a brief length of stay (LOS) in the acute-care hospital.7 It is believed that PAC helps optimize the patients’ health and functional status and relieves the family caregiving burden that would have occurred at home.8-10 PAC use also helps to shorten acute-care hospitalization for RI while avoiding readmission.8-10 In contrast with adult patients, use of PAC for hospitalized children is not routine.11 While PAC use in children is infrequent, RI is one of the most common reasons for acute admission among children who use it.12
For some children with RI, PAC might be positioned to offer a safe, therapeutic, and high-value setting for pulmonary rehabilitation, as well as related medical, nutritional, functional, and family cares.6 PAC, by design, could possibly help some of the children transition back into their homes and communities. As studies continue to emerge that assess the value of PAC in children, it is important to learn more about the use of PAC in children hospitalized with RI. The objectives were to (1) assess which children admitted with RI are the most likely to use PAC services for recovery and (2) estimate how many hospitalized children not using PAC had the same characteristics as those who did.
METHODS
Study Design, Setting, and Population
We conducted a retrospective cohort analysis of 609,800 hospitalizations for RI occurring from January 1, 2010 to December 31, 2015, in 43 freestanding children’s hospitals in the Pediatric Health Information Systems (PHIS) dataset. All hospitals participating in PHIS are members of the Children’s Hospital Association.13 The Boston Children’s Hospital Institutional Review Board approved this study with a waiver for informed consent.
RI was identified using the Agency for Healthcare Research and Quality (AHRQ) Clinical Classification System (CCS).14 Using diagnosis CCS category 8 (“Diseases of the Respiratory System”) and the procedure CCS category 6 (“Operations on the Respiratory System”), we identified all hospitalizations from the participating hospitals with a principal diagnosis or procedure International Classification of Diseases, 9th Revision, Clinical Modification (ICD-9-CM) code for an RI.
Main Outcome Measure
Discharge disposition following the acute-care hospitalization for RI was the main outcome measure. We used PHIS uniform disposition coding to classify the discharge disposition as transfer to PAC (ie, rehabilitation facility, skilled nursing facility, etc.) vs all other dispositions (ie, routine to home, against medical advice, etc.).12 The PAC disposition category was derived from the Centers for Medicare & Medicaid Services Patient Discharge Status Codes and Hospital Transfer Policies as informed by the National Uniform Billing Committee Official UB-04 Data Specifications Manual, 2008. PAC transfer included disposition to external PAC facilities, as well as to internal, embedded PAC units residing in a few of the acute-care children’s hospitals included in the cohort.
Demographic and Clinical Characteristics
We assessed patient demographic and clinical characteristics that might correlate with PAC use following acute-care hospitalization for RI. Demographic characteristics included gender, age at admission in years, payer (public, private, and other), and race/ethnicity (Hispanic, non-Hispanic black, non-Hispanic white, other).
Clinical characteristics included chronic conditions (type and number) and assistance with medical technology. Chronic condition and medical technology characteristics were assessed with ICD-9-CM diagnosis codes. PHIS contain up to 41 ICD-9-CM diagnosis codes per hospital discharge record. To identify the presence and number of chronic conditions, we used the AHRQ Chronic Condition Indicator system, which categorizes over 14,000 ICD-9-CM diagnosis codes into chronic vs non-chronic conditions.14,15 Children hospitalized with a chronic condition were further classified as having a complex chronic condition (CCC) using Feudtner and colleagues’ ICD-9-CM diagnosis classification scheme.16 CCCs represent defined diagnosis groupings expected to last longer than 12 months and involving either a single organ system, severe enough to require specialty pediatric care and hospitalization, or multiple organ systems.17,18 Hospitalized children who were assisted with medical technology were identified with ICD-9-CM codes indicating the use of a medical device to manage and treat a chronic illness (eg, ventricular shunt to treat hydrocephalus) or to maintain basic body functions necessary for sustaining life (eg, a tracheostomy tube for breathing).19,20 We distinguished children undergoing tracheotomy during hospitalization using ICD-9-CM procedure codes 31.1 and 31.2.
Acute-Care Hospitalization Characteristics
We also assessed the relationship between acute-care hospitalization characteristics and use of PAC after discharge, including US census region, LOS, use of intensive care, number of medication classes administered, and use of enhanced respiratory support. Enhanced respiratory support was defined as use of continuous or bilevel positive airway pressure (CPAP or BiPAP) or mechanical ventilation during the acute-care hospitalization for RI. These respiratory supports were identified using billing data in PHIS.
Statistical Analysis
In bivariable analysis, we compared demographic, clinical, and hospitalization characteristics of hospitalized children with vs without discharge to PAC using Rao-Scott chi-square tests and Wilcoxon rank-sum tests as appropriate. In multivariable analysis, we derived a generalized linear mix effects model with fixed effects for demographic, clinical, and hospitalization characteristics that were associated with PAC at P < 0.1 in bivariable analysis (ie, age, gender, race/ethnicity, payer, medical technology, use of intensive care unit [ICU], use of positive pressure or mechanical ventilation, hospital region, LOS, new tracheostomy, existing tracheostomy, other technologies, number of medications, number of chronic conditions [of any complexity], and type of complex chronic conditions). We controlled for clustering of patients within hospitals by including a random intercept for each hospital. We also assessed combinations of patient characteristics on the likelihood of PAC use with classification and regression tree (CART) modeling. Using CART, we determined which characteristic combinations were associated with the highest and lowest use of PAC using binary split and post-pruning, goodness of fit rules.21 All statistical analyses were performed using SAS v.9.4 (SAS Institute, Cary, NC), and R v.3.2 (R Foundation for Statistical Computing, Vienna, Austria) using the “party” package. The threshold for statistical significance was set at P < 0.05.
RESULTS
Of the 609,800 hospitalizations for RI, PAC use after discharge occurred for 2660 (0.4%). RI discharges to PAC accounted for 2.1% (n = 67,405) of hospital days and 2.7% ($280 million) of hospital cost of all RI hospitalizations. For discharges to PAC, the most common RI were pneumonia (29.1% [n = 773]), respiratory failure or insufficiency (unspecified reason; 22.0% [n = 584]), and upper respiratory infection (12.2% [n = 323]).
Demographic Characteristics
Median age at acute-care admission was higher for PAC vs non-PAC discharges (6 years [interquartile range {IQR} 1-15] vs 2 years [0-7], P < 0.001; Table 1). Hispanic patients accounted for a smaller percentage of RI discharges to PAC vs non-PAC (14.1% vs 21.8%, P < 0.001) and a higher percentage to PAC were for patients with public insurance (75.9% vs 62.5, P < 0.001; Table 1).
Clinical Characteristics
A greater percentage of RI hospitalizations discharged to PAC vs not-PAC had ≥1 CCC (94.9% vs 33.5%), including a neuromuscular CCC (57.5% vs 8.9%) or respiratory CCC (62.5% vs 12.0%), P < 0.001 for all (Table 2). A greater percentage discharged to PAC was assisted with medical technology (83.2% vs 15.1%), including respiratory technology (eg, tracheostomy; 53.8% vs 5.4%) and gastrointestinal technology (eg, gastrostomy; 71.9% vs 11.8%), P < 0.001 for all. Of the children with respiratory technology, 14.8% (n = 394) underwent tracheotomy during the acute-care hospitalization. Children discharged to PAC had a higher percentage of multiple chronic conditions. For example, the percentages of children discharged to PAC vs not with ≥7 conditions were 54.5% vs 7.0% (P < 0.001; Table 2). The most common chronic conditions experienced by children discharged to PAC included epilepsy (41.2%), gastroesophageal reflux (36.6%), cerebral palsy (28.2%), and asthma (18.2%).
Hospitalization Characteristics
Acute-care RI hospitalization median LOS was longer for discharges to PAC vs non-PAC (10 days [IQR 4-27] vs 2 days [IQR 1-4], P < 0.001; Table 1). A greater percentage of discharges to PAC were administered medications from multiple classes during the acute-care RI admission (eg, 54.8% vs 13.4% used medications from ≥7 classes, P < 0.001). A greater percentage of discharges to PAC used intensive care services during the acute-care admission (65.6% vs 22.4%, P < 0.001). A greater percentage of discharges to PAC received CPAP (10.6 vs 5.0%), BiPAP (19.8% vs 11.4%), or mechanical ventilation (52.7% vs 9.1%) during the acute-care RI hospitalization (P < 0.001 for all; Table 1).
Multivariable Analysis of the Likelihood of Post-Acute Care Use Following Discharge
In multivariable analysis, the patient characteristics associated with the highest likelihood of discharge to PAC included ≥11 vs no chronic conditions (odds ratio [OR] 11.8 , 95% CI, 8.0-17.2), ≥9 classes vs no classes of medications administered during the acute-care hospitalization (OR 4.8 , 95% CI, 1.8-13.0), and existing tracheostomy (OR 3.0, [95% CI, 2.6-3.5; Figure 2 and eTable). Patient characteristics associated with a more modest likelihood of discharge to PAC included public vs private insurance (OR 1.8, 95% CI, 1.6-2.0), neuromuscular complex chronic condition (OR 1.6, 95% CI, 1.5-1.8), new tracheostomy (OR 1.9, 95% CI, 1.7-2.2), and use of any enhanced respiratory support (ie, CPAP/BiPAP/mechanical ventilation) during the acute-care hospitalization (OR 1.4, 95% CI, 1.3-1.6; Figure 2 and Supplementary Table).
Classification and Regression Tree Analysis
In the CART analysis, the highest percentage (6.3%) of children hospitalized with RI who were discharged to PAC had the following combination of characteristics: ≥6 chronic conditions, ≥7 classes of medications administered, and respiratory technology. Median (IQR) length of acute-care LOS for children with these attributes who were transferred to PAC was 19 (IQR 8-56; range 1-1005) days; LOS remained long (median 13 days [IQR 6-41, range 1-1413]) for children with the same attributes not transferred to PAC (n = 9448). Between these children transferred vs not to PAC, 79.3% vs 65.9% received ICU services; 74.4% vs 73.5% received CPAP, BiPAP, or mechanical ventilation; and 31.0% vs 22.7% underwent tracheotomy during the acute-care hospitalization. Of these children who were not transferred to PAC, 18.9% were discharged to home nursing services.
DISCUSSION
The findings from the present study suggest that patients with RI hospitalization in children’s hospitals who use PAC are medically complex, with high rates of multiple chronic conditions—including cerebral palsy, asthma, chronic respiratory insufficiency, dysphagia, epilepsy, and gastroesophageal reflux—and high rates of technology assistance including enterostomy and tracheostomy. The characteristics of patients most likely to use PAC include long LOS, a large number of chronic conditions, many types of medications administered during the acute-care hospitalization, respiratory technology use, and an underlying neuromuscular condition. Specifically, the highest percentage of children hospitalized with RI who were discharged to PAC had ≥6 chronic conditions, ≥7 classes of medications administered, and respiratory technology. Our analysis suggests that there may be a large population of children with these same characteristics who experienced a prolonged LOS but were not transferred to PAC.
There are several reasons to explain why children hospitalized with RI who rely on medical technology, such as existing tracheostomy, are more likely to use PAC. Tracheostomy often indicates the presence of life-limiting impairment in oxygenation or ventilation, thereby representing a high degree of medical fragility. Tracheostomy, in some cases, offers enhanced ability to assist with RI treatment, including establishment of airway clearance of secretions (ie, suctioning and chest physiotherapy), administration of antimicrobials (eg, nebulized antibiotics), and optimization of ventilation (eg, non-invasive positive airway pressure). However, not all acute-care inpatient clinicians have experience and clinical proficiencies in the care of children with pediatric tracheostomy.23 As a result, a more cautious approach, with prolonged LOS and gradual arrival to hospital discharge, is often taken in the acute-care hospital setting for children with tracheostomy. Tracheostomy care delivered during recovery from RI by trained and experienced teams of providers in the PAC setting may be best positioned to help optimize respiratory health and ensure proper family education and readiness to continue care at home.6
Further investigation is needed of the long LOS in children not transferred to PAC who had similar characteristics to those who were transferred. In hospitalized adult patients with RI, PAC is routinely introduced early in the admission process, with anticipated transfer within a few days into the hospitalization. In the current study, LOS was nearly 2 weeks or longer in many children not transferred to PAC who had similar characteristics to those who were transferred. Perhaps some of the children not transferred experienced long LOS in the acute-care hospital because of a limited number of pediatric PAC beds in their local area. Some families of these children may have been offered but declined use of PAC. PAC may not have been offered to some because illness acuity was too high or there was lack of PAC awareness as a possible setting for recovery.
There are several limitations to this study. PHIS does not contain non-freestanding children’s hospitals; therefore, the study results may generalize best to children’s hospitals. PHIS does not contain information on the amount (eg, number of days used), cost, or treatments provided in PAC. Therefore, we were unable to determine the true reasons why children used PAC services following RI hospitalization (eg, for respiratory rehabilitation vs other reasons, such as epilepsy or nutrition/hydration management). Moreover, we could not assess which children truly used PAC for short-term recovery vs longer-term care because they were unable to reside at home (eg, they were too medically complex). We were unable to assess PAC availability (eg, number of beds) in the surrounding areas of the acute-care hospitals in the PHIS database. Although we assessed use of medical technology, PHIS does not contain data on functional status or activities of daily living, which correlate with the use of PAC in adults. We could not distinguish whether children receiving BiPAP, CPAP, or mechanical ventilation during hospitalization were using it chronically. Although higher PAC use was associated with public insurance, due to absent information on the children’s home, family, and social environment, we were unable to assess whether PAC use was influenced by limited caregiving support or resources.
Data on the type and number of chronic conditions are limited by the ICD-9-CM codes available to distinguish them. Although several patient demographic and clinical characteristics were significantly associated with the use of PAC, significance may have occurred because of the large sample size and consequent robust statistical power. This is why we elected to highlight and discuss the characteristics with the strongest and most clinically meaningful associations (eg, multiple chronic conditions). There may be additional characteristics, including social, familial, and community resources, that are not available to assess in PHIS that could have affected PAC use.
Despite these limitations, the current study suggests that the characteristics of children hospitalized with RI who use PAC for recovery are evident and that there is a large population of children with these characteristics who experienced a prolonged LOS that did not result in transfer to PAC. These findings could be used in subsequent studies to help create the base of a matched cohort of children with similar clinical, demographic, and hospitalization characteristics who used vs didn’t use PAC. Comparison of the functional status, health trajectory, and family and/or social attributes of these 2 groups of children, as well as their post-discharge outcomes and utilization (eg, length of PAC stay, emergency department revisits, and acute-care hospital readmissions), could occur with chart review, clinician and parent interview, and other methods. This body of work might ultimately lead to an assessment of value in PAC and potentially help us understand the need for PAC capacity in various communities. In the meantime, clinicians may find it useful to consider the results of the current study when contemplating PAC use in their hospitalized children with RI, including exploration of health system opportunities of clinical collaboration between acute-care children’s hospitals and PAC facilities. Ultimately, all of this work will generate meaningful knowledge regarding the most appropriate, safe, and cost-effective settings for hospitalized children with RI to regain their health.
Acknowledgments
Dr. Berry was supported by the Agency for Healthcare Research and Quality (R21 HS023092-01), the Lucile Packard Foundation for Children’s Health, and Franciscan Hospital for Children. The funders were not involved in the design and conduct of the study; collection, management, analysis, and interpretation of the data; and preparation, review, or approval of the manuscript; and decision to submit the manuscript for publication.
Disclosure: The authors have no financial relationships relevant to this article to disclose.
1. Friedman B, Berdahl T, Simpson LA, et al. Annual report on health care for children and youth in the United States: focus on trends in hospital use and quality. Acad Pediatr. 2011;11(4):263-279. PubMed
2. Srivastava R, Homer CJ. Length of stay for common pediatric conditions: teaching versus nonteaching hospitals. Pediatrics. 2003;112(2):278-281. PubMed
3. Berry JG, Hall M, Hall DE, et al. Inpatient growth and resource use in 28 children’s hospitals: a longitudinal, multi-institutional study. JAMA Pediatr. 2013;167(2):170-177. PubMed
4. Gold JM, Hall M, Shah SS, et al. Long length of hospital stay in children with medical complexity. J Hosp Med. 2016;11(11):750-756. PubMed
5. Faultner J. Integrating medical plans within family life. JAMA Pediatr. 2014;168(10):891-892. PubMed
6. O’Brien JE, Haley SM, Dumas HM, et al. Outcomes of post-acute hospital episodes for young children requiring airway support. Dev Neurorehabil. 2007;10(3):241-247. PubMed
7. Morley M, Bogasky S, Gage B, et al. Medicare post-acute care episodes and payment bundling. Medicare Medicaid Res Rev. 2014;4(1):mmrr.004.01.b02. PubMed
8. Mentro AM, Steward DK. Caring for medically fragile children in the home: an alternative theoretical approach. Res Theory Nurs Pract. 2002;16(3):161-177. PubMed
9. Thyen U, Kuhlthau K, Perrin JM. Employment, child care, and mental health of mothers caring for children assisted by technology. Pediatrics. 1999;103(6 Pt 1):1235-1242. PubMed
10. Thyen U, Terres NM, Yazdgerdi SR, Perrin JM. Impact of long-term care of children assisted by technology on maternal health. J Dev Behav Pediatr. 1998;19(4):273-282. PubMed
11. O’Brien JE, Berry J, Dumas H. Pediatric Post-acute hospital care: striving for identity and value. Hosp Pediatr. 2015;5(10):548-551. PubMed
12. Berry JG, Hall M, Dumas H, et al. Pediatric hospital discharges to home health and postacute facility care: a national study. JAMA Pediatr. 2016;170(4):326-333. PubMed
13. Children’s Hospital Association. Pediatric Health Information System. https://childrenshospitals.org/Programs-and-Services/Data-Analytics-and-Research/Pediatric-Analytic-Solutions/Pediatric-Health-Information-System. Accessed June 12, 2017.
14. Agency for Healthcare Research and Quality. Chronic Condition Indicator. http://www.hcup-us.ahrq.gov/toolssoftware/chronic/chronic.jsp. Accessed on June 19, 2017.
15. Berry JG, Ash AS, Cohen E, Hasan F, Feudtner C, Hall M. Contributions of children with multiple chronic conditions to pediatric hospitalizations in the United States: A Retrospective Cohort Analysis [published online ahead of print June 20, 2017]. Hosp Pediatr. 2017 Jun 20. doi: 10.1542/hpeds.2016-0179. PubMed
16. Feudtner C, Feinstein JA, Zhong W, Hall M, Dai D. Pediatric complex chronic conditions classification system version 2: updated for ICD-10 and complex medical technology dependence and transplantation. BMC Pediatr. 2014;14:199. PubMed
17. Cohen E, Kuo DZ, Agrawal R, et al. Children with medical complexity: an emerging population for clinical and research initiatives. Pediatrics. 2011;127(3):529-538. PubMed
18. Feudtner C, Christakis DA, Connell FA. Pediatric deaths attributable to complex chronic conditions: a population-based study of Washington State, 1980-1997. Pediatrics. 2000;106(1 Pt 2):205-209. PubMed
19. Palfrey JS, Walker DK, Haynie M, et al. Technology’s children: report of a statewide census of children dependent on medical supports. Pediatrics. 1991;87(5):611-618. PubMed
20. Feudtner C, Villareale NL, Morray B, Sharp V, Hays RM, Neff JM. Technology-dependency among patients discharged from a children’s hospital: a retrospective cohort study. BMC Pediatr. 2005;5(1):8. PubMed
21. Breiman L, Freidman J, Stone CJ, Olshen RA. Classification and Regression Trees. Belmont, CA: Wadsworth International; 1984.
22. Thomson J, Hall M, Ambroggio L, et al. Aspiration and Non-Aspiration Pneumonia in Hospitalized Children With Neurologic Impairment. Pediatrics. 2016;137(2):e20151612. PubMed
23. Berry JG, Goldmann DA, Mandl KD, et al. Health information management and perceptions of the quality of care for children with tracheotomy: a qualitative study. BMC Health Serv Res. 2011;11:117. PubMed
© 2017 Society of Hospital Medicine
If You Book It, Will They Come? Attendance at Postdischarge Follow-Up Visits Scheduled by Inpatient Providers
Given growing incentives to reduce readmission rates, predischarge checklists and bundles have recommended that inpatient providers schedule postdischarge follow-up visits (PDFVs) for their hospitalized patients.1-4 PDFVs have been linked to lower readmission rates in patients with chronic conditions, including congestive heart failure, psychiatric illnesses, and chronic obstructive pulmonary disease.5-8 In contrast, the impact of PDFVs on readmissions in hospitalized general medicine populations has been mixed.9-12 Beyond the presence or absence of PDFVs, it may be a patient’s inability to keep scheduled PDFVs that contributes more strongly to preventable readmissions.11
This challenge, dealing with the 12% to 37% of patients who miss their visits (“no-shows”), is not new.13-17 In high-risk patient populations, such as those with substance abuse, diabetes, or human immunodeficiency virus, no-shows (NSs) have been linked to poorer short-term and long-term clinical outcomes.16,18-20 Additionally, NSs pose a challenge for outpatient clinics and the healthcare system at large. The financial cost of NSs ranges from approximately $200 per patient in 2 analyses to $7 million in cumulative lost revenue per year at 1 large academic health system.13,17,21 As such, increasing attendance at PDFVs is a potential target for improving both patient outcomes and clinic productivity.
Most prior PDFV research has focused on readmission risk rather than PDFV attendance as the primary outcome.5-12 However, given the patient-oriented benefits of attending PDFVs and the clinic-oriented benefits of avoiding vacant time slots, NS PDFVs represent an important missed opportunity for our healthcare delivery system. To our knowledge, risk factors for PDFV nonattendance have not yet been systematically studied. The aim of our study was to analyze PDFV nonattendance, particularly NSs and same-day cancellations (SDCs), for hospitalizations and clinics within our healthcare system.
METHODS
Study Design
We conducted an observational cohort study of adult patients from 10 medical units at the Hospital of the University of Pennsylvania (a 789-bed quaternary-care hospital within an urban, academic medical system) who were scheduled with at least 1 PDFV. Specifically, the patients included in our analysis were hospitalized on general internal medicine services or medical subspecialty services with discharge dates between April 1, 2014, and March 31, 2015. Hospitalizations included in our study had at least 1 PDFV scheduled with an outpatient provider affiliated with the University of Pennsylvania Health System (UPHS). PDFVs scheduled with unaffiliated providers were not examined.
Each PDFV was requested by a patient’s inpatient care team. Once the care team had determined that a PDFV was clinically warranted, a member of the team (generally a resident, advanced practice provider, medical student, or designee) either called the UPHS clinic to schedule an appointment time or e-mailed the outpatient UPHS provider directly to facilitate a more urgent PDFV appointment time. Once a PDFV time was confirmed, PDFV details (ie, date, time, location, and phone number) were electronically entered into the patient’s discharge instructions by the inpatient care team. At the time of discharge, nurses reviewed these instructions with their patients. All patients left the hospital with a physical copy of these instructions. As part of routine care at our institution, patients then received automated telephone reminders from their UPHS-affiliated outpatient clinic 48 hours prior to each PDFV.
Data Collection
Our study was determined to meet criteria for quality improvement by the University of Pennsylvania’s Institutional Review Board. We used our healthcare system’s integrated electronic medical record system to track the dates of initial PDFV requests, the dates of hospitalization, and actual PDFV dates. PDFVs were included if the appointment request was made while a patient was hospitalized, including the day of discharge. Our study methodology only allowed us to investigate PDFVs scheduled with UPHS outpatient providers. We did not review discharge instructions or survey non-UPHS clinics to quantify visits scheduled with other providers, for example, community health centers or external private practices.
Exclusion criteria included the following: (1) office visits with nonproviders, for example, scheduled diagnostic procedures or pharmacist appointments for warfarin dosing; (2) visits cancelled by inpatient providers prior to discharge; (3) visits for patients not otherwise eligible for UPHS outpatient care because of insurance reasons; and (4) visits scheduled for dates after a patient’s death. Our motivation for the third exclusion criterion was the infrequent and irregular process by which PDFVs were authorized for these patients. These patients and their characteristics are described in Supplementary Table 1 in more detail.
For each PDFV, we recorded age, gender, race, insurance status, driving distance, length of stay for index hospitalization, discharging service (general internal medicine vs subspecialty), postdischarge disposition (home, home with home care services such as nursing or physical therapy, or facility), the number of PDFVs scheduled per index hospitalization, PDFV specialty type (oncologic subspecialty, nononcologic medical subspecialty, nononcologic surgical subspecialty, primary care, or other specialty), PDFV season, and PDFV lead time (the number of days between the discharge date and PDFV). We consolidated oncologic specialties into 1 group given the integrated nature of our healthcare system’s comprehensive cancer center. “Other” PDFV specialty subtypes are described in Supplementary Table 2. Driving distances between patient postal codes and our hospital were calculated using Excel VBA Master (Salt Lake City, Utah) and were subsequently categorized into patient-level quartiles for further analysis. For cancelled PDFVs, we collected dates of cancellation relative to the date of the appointment itself.
Study Outcomes
The primary study outcome was PDFV attendance. Each PDFV’s status was categorized by outpatient clinic staff as attended, cancelled, or NS. For cancelled appointments, cancellation dates and reasons (if entered by clinic representatives) were collected. In keeping with prior studies investigating outpatient nonattendance,we calculated collective NS/SDC rates for the variables listed above.17,22-25 We additionally calculated NS/SDC and attendance-as-scheduled rates stratified by the number of PDFVs per patient to assess for a “high-utilizer” effect with regard to PDFV attendance.
Statistical Analysis
We used multivariable mixed-effects regression with a logit link to assess associations between age, gender, race, insurance, driving distance quartile, length of stay, discharging service, postdischarge disposition, the number of PDFVs per hospitalization, PDFV specialty type, PDFV season, PDFV lead time, and our NS/SDC outcome. The mixed-effects approach was used to account for correlation structures induced by patients who had multiple visits and for patients with multiple hospitalizations. Specifically, our model specified 2 levels of nesting (PDFVs nested within each hospitalization, which were nested within each patient) to obtain appropriate standard error estimates for our adjusted odds ratios (ORs). Correlation matrices and multivariable variance inflation factors were used to assess collinearity among the predictor variables. These assessments did not indicate strong collinearity; hence, all predictors were included in the model. Only driving distance had a small amount of missing data (0.18% of driving distances were unavailable), so multiple imputation was not undertaken. Analyses were performed using R version 3.3.1 (R Foundation for Statistical Computing, Vienna, Austria).
RESULTS
Baseline Characteristics
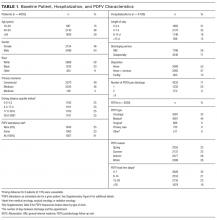

During the 1-year study period, there were 11,829 discrete hospitalizations in medical units at our hospital. Of these hospitalizations, 6136 (52%) had at least 1 UPHS-affiliated PDFV meeting our inclusion and exclusion criteria, as detailed in the Figure. Across these hospitalizations, 9258 PDFVs were scheduled on behalf of 4653 patients. Demographic characteristics for these patients, hospitalizations, and visits are detailed in Table 1. The median age of patients in our cohort was 61 years old (interquartile range [IQR] 49-70, range 18-101). The median driving distance was 17 miles (IQR 4.3-38.8, range 0-2891). For hospitalizations, the median length of stay was 5 days (IQR 3-10, range 0-97). The median PDFV lead time, which is defined as the number of days between discharge and PDFV, was 12 days (IQR 6-23, range 1-60). Overall, 41% of patients (n = 1927) attended all of their PDFVs as scheduled; Supplementary Figure 1 lists patient-level PDFV attendance-as-scheduled percentages in more detail.
Incidence of NSs and SDCs
Twenty-five percent of PDFVs (n = 2303) were ultimately NS/SDCs; this included 1658 NSs (18% of all appointments) and 645 SDCs (7% of all appointments). Fifty-two percent of PDFVs (n = 4847) were kept as scheduled, while 23% (n = 2108) were cancelled before the day of the visit. Of the 2558 cancellations with valid cancellation dates, 49% (n = 1252) were cancelled 2 or fewer days beforehand, as shown in Supplementary Figure 2.
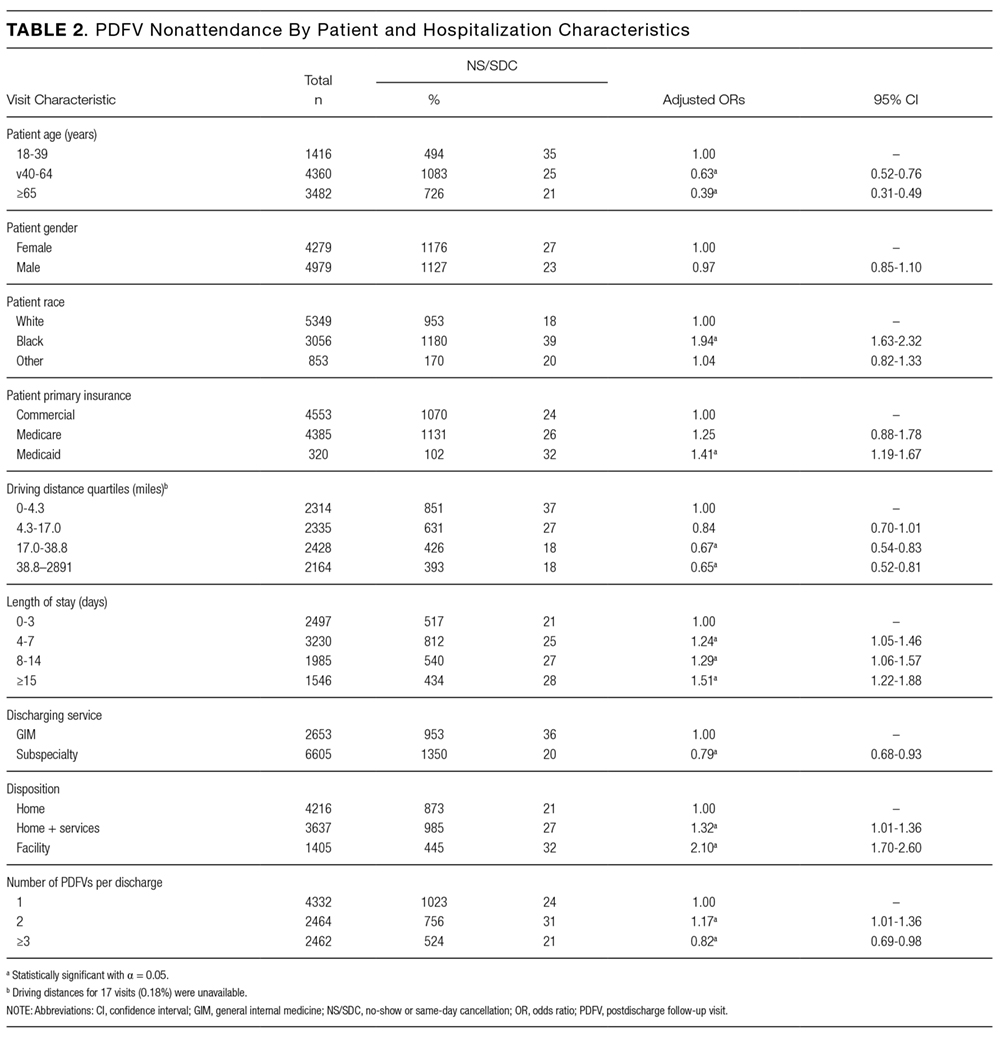
The presence of exactly 2 PDFVs per hospitalization was also associated with higher NS/SDC rates (OR 1.17, 95% CI, 1.01-1.36), compared to a single PDFV per hospitalization; however, the presence of more than 2 PDFVs per hospitalization was associated with lower NS/SDC rates (OR 0.82, 95% CI, 0.69-0.98). A separate analysis (data not shown) of potential high utilizers revealed a 15% NS/SDC rate for the top 0.5% of patients (median: 18 PDFVs each) and an 18% NS/SDC rate for the top 1% of patients (median: 14 PDFVs each) with regard to the numbers of PDFVs scheduled, compared to the 25% overall NS/SDC rate for all patients.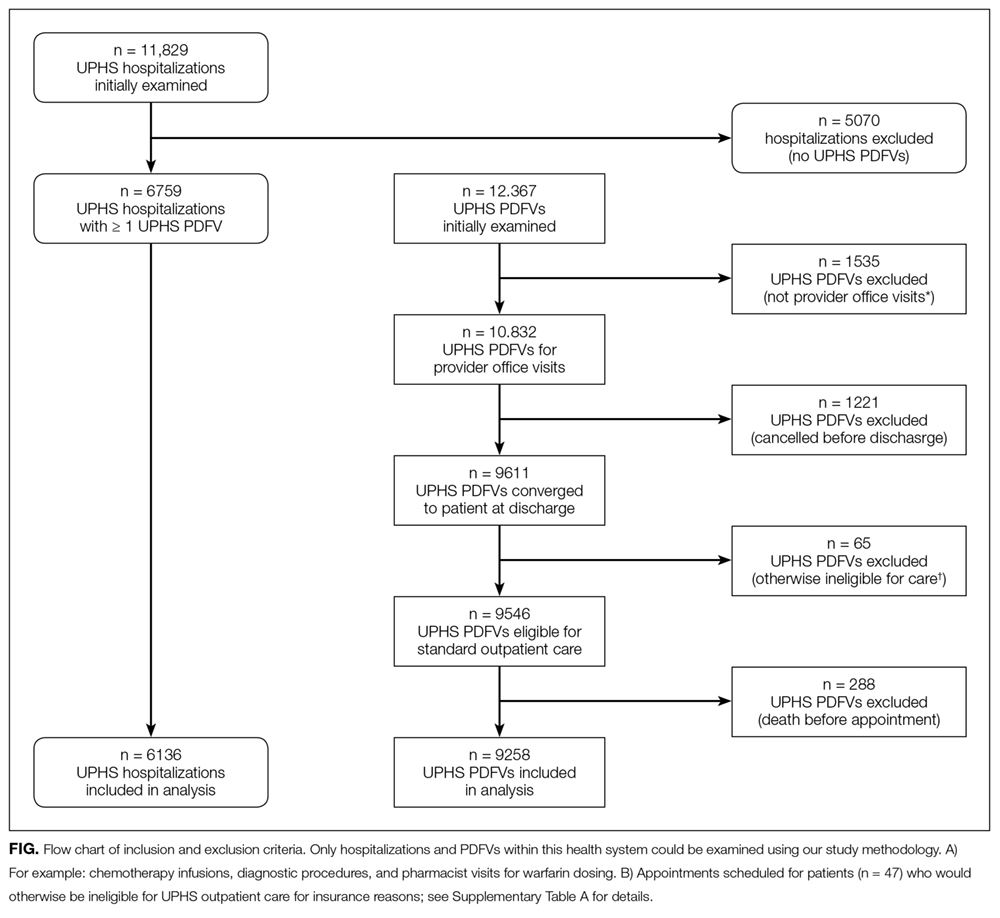
NS/SDC rates and adjusted ORs with regard to individual PDFV characteristics are displayed in Table 3. Nononcologic visits had higher NS/SDC rates than oncologic visits; for example, the NS/SDC rate for primary care visits was 39% (OR 2.62, 95% CI, 2.03-3.38), compared to 12% for oncologic visits. Appointments in the “other” specialty category also had high nonattendance rates, as further described in Supplementary Table B. Summertime appointments were more likely to be attended (OR 0.81, 95% CI, 0.68-0.97) compared to those in the spring. PDFV lead time (the time interval between the discharge date and appointment date) was not associated with changes in visit attendance.
DISCUSSION
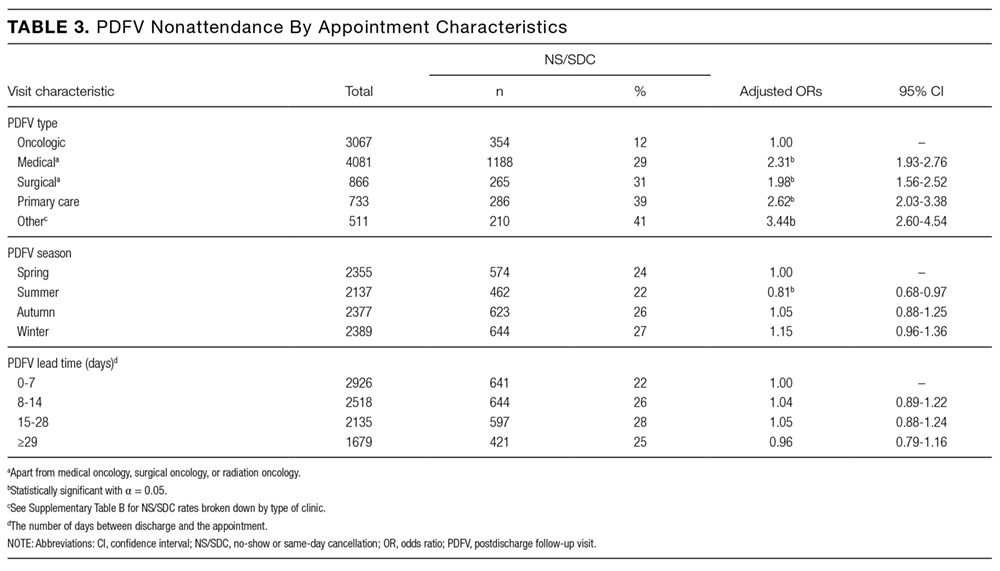
When comparing PDFV characteristics themselves, oncologic visits had the lowest NS/SDC incidence of any group analyzed in our study. This may be related to the inherent life-altering nature of a cancer diagnosis or our cancer center’s use of patient navigators.23,30 In contrast, primary care clinics suffered from NS/SDC rates approaching 40%, which is a concerning finding given the importance of primary care coordination in the posthospitalization period.9,31 Why are primary care appointments so commonly missed? Some studies suggest that forgetting about a primary care appointment is a leading reason.15,32,33 For PDFVs, this phenomenon may be augmented because the visits are not scheduled by patients themselves. Additionally, patients may paradoxically undervalue the benefit of an all-encompassing primary care visit, compared to a PDFV focused on a specific problem, (eg, a cardiology follow-up appointment for a patient with congestive heart failure). In particular, patients with limited health literacy may potentially undervalue the capabilities of their primary care clinics.34,35
The low absolute number of primary care PDFVs (only 8% of all visits) scheduled for patients at our hospital was an unexpected finding. This low percentage is likely a function of the patient population hospitalized at our large, urban quaternary-care facility. First, an unknown number of patients may have had PDFVs manually scheduled with primary care providers external to our health system; these PDFVs were not captured within our study. Second, 71% of the hospitalizations in our study occurred in subspecialty services, for which specific primary care follow-up may not be as urgent. Supporting this fact, further analysis of the 6136 hospitalizations in our study (data not shown) revealed that 28% of the hospitalizations in general internal medicine were scheduled with at least 1 primary care PDFV as opposed to only 5% of subspecialty-service hospitalizations.
In contrast to several previous studies of outpatient nonattendance,we did not find that visits scheduled for time points further in the future were more likely to be missed.14,24,25,36,37 Unlike other appointments, it may be that PDFV lead time does not affect attendance because of the unique manner in which PDFV times are scheduled and conveyed to patients. Unlike other appointments, patients do not schedule PDFVs themselves but instead learn about their PDFV dates as part of a large set of discharge instructions. This practice may result in poor recall of PDFV dates in recently hospitalized patients38, regardless of the lead time between discharge and the visit itself.
Supplementary Table 1 details a 51% NS/SDC rate for the small number of PDFVs (n = 65) that were excluded a priori from our analysis because of general ineligibility for UPHS outpatient care. We specifically chose to exclude this population because of the infrequent and irregular process by which these PDFVs were authorized on a case-by-case basis, typically via active engagement by our hospital’s social work department. We did not study this population further but postulate that the 51% NS/SDC rate may reflect other social determinants of health that contribute to appointment nonadherence in a predominantly uninsured population.
Beyond their effect on patient outcomes, improving PDFV-related processes has the potential to boost both inpatient and outpatient provider satisfaction. From the standpoint of frontline inpatient providers (often resident physicians), calling outpatient clinics to request PDFVs is viewed as 1 of the top 5 administrative tasks that interfere with house staff education.39 Future interventions that involve patients in the PDFV scheduling process may improve inpatient workflow while simultaneously engaging patients in their own care. For example, asking clinic representatives to directly schedule PDFVs with hospitalized patients, either by phone or in person, has been shown in pilot studies to improve PDFV attendance and decrease readmissions.40-42 Conversely, NS/SDC visits harm outpatient provider productivity and decrease provider availability for other patients.13,17,43 Strategies to mitigate the impact of unfilled appointment slots (eg, deliberately overbooking time slots in advance) carry their own risks, including provider burnout.44 As such, preventing NSs may be superior to curing their adverse impacts. Many such strategies exist in the ambulatory setting,13,43,45 for example, better communication with patients through texting or goal-directed, personalized phone reminders.46-48Our study methodology has several limitations. Most importantly, we were unable to measure PDFVs made with providers unaffiliated with UPHS. As previously noted, our low proportion of primary care PDFVs may specifically reflect patients with primary care providers outside of our health system. Similarly, our low percentage of Medicaid patients receiving PDFVs may be related to follow-up visits with nonaffiliated community health centers. We were unable to measure patient acuity and health literacy as potential predictors of NS/SDC rates. Driving distances were calculated from patient postal codes to our hospital, not to individual outpatient clinics. However, the majority of our hospital-affiliated clinics are located adjacent to our hospital; additionally, we grouped driving distances into quartiles for our analysis. We had initially attempted to differentiate between clinic-initiated and patient-initiated cancellations, but unfortunately, we found that the data were too unreliable to be used for further analysis (outlined in Supplementary Table 3). Lastly, because we studied patients in medical units at a single large, urban, academic center, our results are not generalizable to other settings (eg, community hospitals, hospitals with smaller networks of outpatient providers, or patients being discharged from surgical services or observation units).
CONCLUSION
Given national efforts to enhance postdischarge transitions of care, we aimed to analyze attendance at provider-scheduled PDFV appointments. Our finding that 25% of PDFVs resulted in NS/SDCs raises both questions and opportunities for inpatient and outpatient providers. Further research is needed to understand why so many patients miss their PDFVs, and we should work as a field to develop creative solutions to improve PDFV scheduling and attendance.
Acknowledgments
The authors acknowledge Marie Synnestvedt, PhD, and Manik Chhabra, MD, for their assistance with data gathering and statistical analysis. They also acknowledge Allison DeKosky, MD, Michael Serpa, BS, Michael McFall, and Scott Schlegel, MBA, for their assistance with researching this topic. They did not receive external compensation for their assistance outside of their usual salary support.
DISCLOSURE
Nothing to report.
1. Halasyamani L, Kripalani S, Coleman E, et al. Transition of care for hospitalized elderly patients - development of a discharge checklist for hospitalists. J Hosp Med. 2006;1(6):354-360. PubMed
2. Koehler BE, Richter KM, Youngblood L, et al. Reduction of 30-day postdischarge hospital readmission or emergency department (ED) visit rates in high-risk elderly medical patients through delivery of a targeted care bundle. J Hosp Med. 2009;4(4):211-218. PubMed
3. Soong C, Daub S, Lee JG, et al. Development of a checklist of safe discharge practices for hospital patients. J Hosp Med. 2013;8(8):444-449. PubMed
4. Rice YB, Barnes CA, Rastogi R, Hillstrom TJ, Steinkeler CN. Tackling 30-day, all-cause readmissions with a patient-centered transitional care bundle. Popul Health Manag. 2016;19(1):56-62. PubMed
5. Nelson EA, Maruish MM, Axler JL. Effects of discharge planning and compliance with outpatient appointments on readmission rates. Psych Serv. 2000;51(7):885-889. PubMed
6. Gavish R, Levy A, Dekel OK, Karp E, Maimon N. The association between hospital readmission and pulmonologist follow-up visits in patients with chronic obstructive pulmonary disease. Chest. 2015;148(2):375-381. PubMed
7. Jackson C, Shahsahebi M, Wedlake T, DuBard CA. Timeliness of outpatient follow-up: an evidence-based approach for planning after hospital discharge. Ann Fam Med. 2015;13(2):115-122. PubMed
8. Donaho EK, Hall AC, Gass JA, et al. Protocol-driven allied health post-discharge transition clinic to reduce hospital readmissions in heart failure. J Am Heart Assoc. 2015;4(12):e002296. PubMed
9. Misky GJ, Wald HL, Coleman EA. Post-hospitalization transitions: Examining the effects of timing of primary care provider follow-up. J Hosp Med. 2010;5(7):392-397. PubMed
10. Grafft CA, McDonald FS, Ruud KL, Liesinger JT, Johnson MG, Naessens JM. Effect of hospital follow-up appointment on clinical event outcomes and mortality. Arch Intern Med. 2010;171(11):955-960. PubMed
11. Auerbach AD, Kripalani S, Vasilevskis EE, et al. Preventability and causes of readmissions in a national cohort of general medicine patients. JAMA Intern Med. 2016;176(4):484-493. PubMed
12. Field TS, Ogarek J, Garber L, Reed G, Gurwitz JH. Association of early post-discharge follow-up by a primary care physician and 30-day rehospitalization among older adults. J Gen Intern Med. 2015;30(5):565-571. PubMed
13. Quinn K. It’s no-show time! Med Group Manage Assoc Connexion. 2007;7(6):44-49. PubMed
14. Whittle J, Schectman G, Lu N, Baar B, Mayo-Smith MF. Relationship of scheduling interval to missed and cancelled clinic appointments. J Ambulatory Care Manage. 2008;31(4):290-302. PubMed
15. Kaplan-Lewis E, Percac-Lima S. No-show to primary care appointments: Why patients do not come. J Prim Care Community Health. 2013;4(4):251-255. PubMed
16. Molfenter T. Reducing appointment no-shows: Going from theory to practice. Subst Use Misuse. 2013;48(9):743-749. PubMed
17. Kheirkhah P, Feng Q, Travis LM, Tavakoli-Tabasi S, Sharafkhaneh A. Prevalence, predictors and economic consequences of no-shows. BMC Health Serv Res. 2016;16(1):13. PubMed
18. Colubi MM, Perez-Elias MJ, Elias L, et al. Missing scheduled visits in the outpatient clinic as a marker of short-term admissions and death. HIV Clin Trials. 2012;13(5):289-295. PubMed
19. Obialo CI, Hunt WC, Bashir K, Zager PG. Relationship of missed and shortened hemodialysis treatments to hospitalization and mortality: Observations from a US dialysis network. Clin Kidney J. 2012;5(4):315-319. PubMed
20. Hwang AS, Atlas SJ, Cronin P, et al. Appointment “no-shows” are an independent predictor of subsequent quality of care and resource utilization outcomes. J Gen Intern Med. 2015;30(10):1426-1433. PubMed
21. Perez FD, Xie J, Sin A, et al. Characteristics and direct costs of academic pediatric subspecialty outpatient no-show events. J Healthc Qual. 2014;36(4):32-42. PubMed
22. Huang Y, Zuniga P. Effective cancellation policy to reduce the negative impact of patient no-show. Journal of the Operational Research Society. 2013;65(5):605-615.
23. Percac-Lima S, Cronin PR, Ryan DP, Chabner BA, Daly EA, Kimball AB. Patient navigation based on predictive modeling decreases no-show rates in cancer care. Cancer. 2015;121(10):1662-1670. PubMed
24. Torres O, Rothberg MB, Garb J, Ogunneye O, Onyema J, Higgins T. Risk factor model to predict a missed clinic appointment in an urban, academic, and underserved setting. Popul Health Manag. 2015;18(2):131-136. PubMed
25. Eid WE, Shehata SF, Cole DA, Doerman KL. Predictors of nonattendance at an endocrinology outpatient clinic. Endocr Pract. 2016;22(8):983-989. PubMed
26. Kashiwagi DT, Burton MC, Kirkland LL, Cha S, Varkey P. Do timely outpatient follow-up visits decrease hospital readmission rates? Am J Med Qual. 2012;27(1):11-15. PubMed
27. Miller AJ, Chae E, Peterson E, Ko AB. Predictors of repeated “no-showing” to clinic appointments. Am J Otolaryngol. 2015;36(3):411-414. PubMed
28. ASCO. Billing challenges for residents of Skilled Nursing Facilities. J Oncol Pract. 2008;4(5):245-248. PubMed
29. Centers for Medicare & Medicaid Services (2013). “SE0433: Skilled Nursing Facility consolidated billing as it relates to ambulance services.” Medicare Learning Network Matters. https://www.cms.gov/Outreach-and-Education/Medicare-Learning-Network-MLN/MLNMattersArticles/downloads/se0433.pdf. Accessed on February 14, 2017.
30. Luckett R, Pena N, Vitonis A, Bernstein MR, Feldman S. Effect of patient navigator program on no-show rates at an academic referral colposcopy clinic. J Womens Health (Larchmt). 2015;24(7):608-615. PubMed
31. Jones CD, Vu MB, O’Donnell CM, et al. A failure to communicate: A qualitative exploration of care coordination between hospitalists and primary care providers around patient hospitalizations. J Gen Intern Med. 2015;30(4):417-424. PubMed
32. George A, Rubin G. Non-attendance in general practice: a systematic review and its implications for access to primary health care. Fam Pract. 2003;20(2):178-184. 2016;31(12):1460-1466.J Gen Intern Med. PubMed
48. Shah SJ, Cronin P, Hong CS, et al. Targeted reminder phone calls to patients at high risk of no-show for primary care appointment: A randomized trial. 2010;123(6):542-548.Am J Med. PubMed
47. Parikh A, Gupta K, Wilson AC, Fields K, Cosgrove NM, Kostis JB. The effectiveness of outpatient appointment reminder systems in reducing no-show rates. 2009;20:142-144.Int J STD AIDS. PubMed
46. Price H, Waters AM, Mighty D, et al. Texting appointment reminders reduces ‘Did not attend’ rates, is popular with patients and is cost-effective. 2009;25(3):166-170.J Med Practice Management. PubMed
45. Hills LS. How to handle patients who miss appointments or show up late.
2009;39(3):271-287.Interfaces. PubMed
44. Kros J, Dellana S, West D. Overbooking Increases Patient Access at East Carolina University’s Student Health Services Clinic. 2012;344(3):211-219.Am J Med Sci.
43. Stubbs ND, Geraci SA, Stephenson PL, Jones DB, Sanders S. Methods to reduce outpatient non-attendance. PubMed
42. Haftka A, Cerasale MT, Paje D. Direct patient participation in discharge follow-up appointment scheduling. Paper presented at: Society of Hospital Medicine, Annual Meeting 2015; National Harbor, MD. 2012;5(1):27-32.Patient.
41. Chang R, Spahlinger D, Kim CS. Re-engineering the post-discharge appointment process for general medicine patients. PubMed
40. Coffey C, Kufta J. Patient-centered post-discharge appointment scheduling improves readmission rates. Paper presented at: Society of Hospital Medicine, Annual Meeting 2011; Grapevine, Texas. 2006;81(1):76-81.Acad Med.
39. Vidyarthi AR, Katz PP, Wall SD, Wachter RM, Auerbach AD. Impact of reduced duty hours on residents’ education satistfaction at the University of California, San Francisco.
2013;173(18):1715-1722.JAMA Intern Med. PubMed
38. Horwitz LI, Moriarty JP, Chen C, et al. Quality of discharge practices and patient understanding at an academic medical center. 2010;16(4):246-259.Health Informatics J. PubMed
37. Daggy J, Lawley M, Willis D, et al. Using no-show modeling to improve clinic performance. 2005;5:51.BMC Health Serv Res. PubMed
36. Lee VJ, Earnest A, Chen MI, Krishnan B. Predictors of failed attendances in a multi-specialty outpatient centre using electronic databases. 2013;3(9):e003212.BMJ Open. PubMed
35. Long T, Genao I, Horwitz LI. Reasons for readmission in an underserved high-risk population: A qualitative analysis of a series of inpatient interviews. 2013;32(7):1196-1203.Health Aff (Millwood). PubMed
34. Kangovi S, Barg FK, Carter T, Long JA, Shannon R, Grande D. Understanding why patients of low socioeconomic status prefer hospitals over ambulatory care. 2015;54(10):976-982.Clin Pediatr (Phila). PubMed
33. Samuels RC, Ward VL, Melvin P, et al. Missed Appointments: Factors Contributing to High No-Show Rates in an Urban Pediatrics Primary Care Clinic. PubMed
Given growing incentives to reduce readmission rates, predischarge checklists and bundles have recommended that inpatient providers schedule postdischarge follow-up visits (PDFVs) for their hospitalized patients.1-4 PDFVs have been linked to lower readmission rates in patients with chronic conditions, including congestive heart failure, psychiatric illnesses, and chronic obstructive pulmonary disease.5-8 In contrast, the impact of PDFVs on readmissions in hospitalized general medicine populations has been mixed.9-12 Beyond the presence or absence of PDFVs, it may be a patient’s inability to keep scheduled PDFVs that contributes more strongly to preventable readmissions.11
This challenge, dealing with the 12% to 37% of patients who miss their visits (“no-shows”), is not new.13-17 In high-risk patient populations, such as those with substance abuse, diabetes, or human immunodeficiency virus, no-shows (NSs) have been linked to poorer short-term and long-term clinical outcomes.16,18-20 Additionally, NSs pose a challenge for outpatient clinics and the healthcare system at large. The financial cost of NSs ranges from approximately $200 per patient in 2 analyses to $7 million in cumulative lost revenue per year at 1 large academic health system.13,17,21 As such, increasing attendance at PDFVs is a potential target for improving both patient outcomes and clinic productivity.
Most prior PDFV research has focused on readmission risk rather than PDFV attendance as the primary outcome.5-12 However, given the patient-oriented benefits of attending PDFVs and the clinic-oriented benefits of avoiding vacant time slots, NS PDFVs represent an important missed opportunity for our healthcare delivery system. To our knowledge, risk factors for PDFV nonattendance have not yet been systematically studied. The aim of our study was to analyze PDFV nonattendance, particularly NSs and same-day cancellations (SDCs), for hospitalizations and clinics within our healthcare system.
METHODS
Study Design
We conducted an observational cohort study of adult patients from 10 medical units at the Hospital of the University of Pennsylvania (a 789-bed quaternary-care hospital within an urban, academic medical system) who were scheduled with at least 1 PDFV. Specifically, the patients included in our analysis were hospitalized on general internal medicine services or medical subspecialty services with discharge dates between April 1, 2014, and March 31, 2015. Hospitalizations included in our study had at least 1 PDFV scheduled with an outpatient provider affiliated with the University of Pennsylvania Health System (UPHS). PDFVs scheduled with unaffiliated providers were not examined.
Each PDFV was requested by a patient’s inpatient care team. Once the care team had determined that a PDFV was clinically warranted, a member of the team (generally a resident, advanced practice provider, medical student, or designee) either called the UPHS clinic to schedule an appointment time or e-mailed the outpatient UPHS provider directly to facilitate a more urgent PDFV appointment time. Once a PDFV time was confirmed, PDFV details (ie, date, time, location, and phone number) were electronically entered into the patient’s discharge instructions by the inpatient care team. At the time of discharge, nurses reviewed these instructions with their patients. All patients left the hospital with a physical copy of these instructions. As part of routine care at our institution, patients then received automated telephone reminders from their UPHS-affiliated outpatient clinic 48 hours prior to each PDFV.
Data Collection
Our study was determined to meet criteria for quality improvement by the University of Pennsylvania’s Institutional Review Board. We used our healthcare system’s integrated electronic medical record system to track the dates of initial PDFV requests, the dates of hospitalization, and actual PDFV dates. PDFVs were included if the appointment request was made while a patient was hospitalized, including the day of discharge. Our study methodology only allowed us to investigate PDFVs scheduled with UPHS outpatient providers. We did not review discharge instructions or survey non-UPHS clinics to quantify visits scheduled with other providers, for example, community health centers or external private practices.
Exclusion criteria included the following: (1) office visits with nonproviders, for example, scheduled diagnostic procedures or pharmacist appointments for warfarin dosing; (2) visits cancelled by inpatient providers prior to discharge; (3) visits for patients not otherwise eligible for UPHS outpatient care because of insurance reasons; and (4) visits scheduled for dates after a patient’s death. Our motivation for the third exclusion criterion was the infrequent and irregular process by which PDFVs were authorized for these patients. These patients and their characteristics are described in Supplementary Table 1 in more detail.
For each PDFV, we recorded age, gender, race, insurance status, driving distance, length of stay for index hospitalization, discharging service (general internal medicine vs subspecialty), postdischarge disposition (home, home with home care services such as nursing or physical therapy, or facility), the number of PDFVs scheduled per index hospitalization, PDFV specialty type (oncologic subspecialty, nononcologic medical subspecialty, nononcologic surgical subspecialty, primary care, or other specialty), PDFV season, and PDFV lead time (the number of days between the discharge date and PDFV). We consolidated oncologic specialties into 1 group given the integrated nature of our healthcare system’s comprehensive cancer center. “Other” PDFV specialty subtypes are described in Supplementary Table 2. Driving distances between patient postal codes and our hospital were calculated using Excel VBA Master (Salt Lake City, Utah) and were subsequently categorized into patient-level quartiles for further analysis. For cancelled PDFVs, we collected dates of cancellation relative to the date of the appointment itself.
Study Outcomes
The primary study outcome was PDFV attendance. Each PDFV’s status was categorized by outpatient clinic staff as attended, cancelled, or NS. For cancelled appointments, cancellation dates and reasons (if entered by clinic representatives) were collected. In keeping with prior studies investigating outpatient nonattendance,we calculated collective NS/SDC rates for the variables listed above.17,22-25 We additionally calculated NS/SDC and attendance-as-scheduled rates stratified by the number of PDFVs per patient to assess for a “high-utilizer” effect with regard to PDFV attendance.
Statistical Analysis
We used multivariable mixed-effects regression with a logit link to assess associations between age, gender, race, insurance, driving distance quartile, length of stay, discharging service, postdischarge disposition, the number of PDFVs per hospitalization, PDFV specialty type, PDFV season, PDFV lead time, and our NS/SDC outcome. The mixed-effects approach was used to account for correlation structures induced by patients who had multiple visits and for patients with multiple hospitalizations. Specifically, our model specified 2 levels of nesting (PDFVs nested within each hospitalization, which were nested within each patient) to obtain appropriate standard error estimates for our adjusted odds ratios (ORs). Correlation matrices and multivariable variance inflation factors were used to assess collinearity among the predictor variables. These assessments did not indicate strong collinearity; hence, all predictors were included in the model. Only driving distance had a small amount of missing data (0.18% of driving distances were unavailable), so multiple imputation was not undertaken. Analyses were performed using R version 3.3.1 (R Foundation for Statistical Computing, Vienna, Austria).
RESULTS
Baseline Characteristics
During the 1-year study period, there were 11,829 discrete hospitalizations in medical units at our hospital. Of these hospitalizations, 6136 (52%) had at least 1 UPHS-affiliated PDFV meeting our inclusion and exclusion criteria, as detailed in the Figure. Across these hospitalizations, 9258 PDFVs were scheduled on behalf of 4653 patients. Demographic characteristics for these patients, hospitalizations, and visits are detailed in Table 1. The median age of patients in our cohort was 61 years old (interquartile range [IQR] 49-70, range 18-101). The median driving distance was 17 miles (IQR 4.3-38.8, range 0-2891). For hospitalizations, the median length of stay was 5 days (IQR 3-10, range 0-97). The median PDFV lead time, which is defined as the number of days between discharge and PDFV, was 12 days (IQR 6-23, range 1-60). Overall, 41% of patients (n = 1927) attended all of their PDFVs as scheduled; Supplementary Figure 1 lists patient-level PDFV attendance-as-scheduled percentages in more detail.
Incidence of NSs and SDCs
Twenty-five percent of PDFVs (n = 2303) were ultimately NS/SDCs; this included 1658 NSs (18% of all appointments) and 645 SDCs (7% of all appointments). Fifty-two percent of PDFVs (n = 4847) were kept as scheduled, while 23% (n = 2108) were cancelled before the day of the visit. Of the 2558 cancellations with valid cancellation dates, 49% (n = 1252) were cancelled 2 or fewer days beforehand, as shown in Supplementary Figure 2.
The presence of exactly 2 PDFVs per hospitalization was also associated with higher NS/SDC rates (OR 1.17, 95% CI, 1.01-1.36), compared to a single PDFV per hospitalization; however, the presence of more than 2 PDFVs per hospitalization was associated with lower NS/SDC rates (OR 0.82, 95% CI, 0.69-0.98). A separate analysis (data not shown) of potential high utilizers revealed a 15% NS/SDC rate for the top 0.5% of patients (median: 18 PDFVs each) and an 18% NS/SDC rate for the top 1% of patients (median: 14 PDFVs each) with regard to the numbers of PDFVs scheduled, compared to the 25% overall NS/SDC rate for all patients.
NS/SDC rates and adjusted ORs with regard to individual PDFV characteristics are displayed in Table 3. Nononcologic visits had higher NS/SDC rates than oncologic visits; for example, the NS/SDC rate for primary care visits was 39% (OR 2.62, 95% CI, 2.03-3.38), compared to 12% for oncologic visits. Appointments in the “other” specialty category also had high nonattendance rates, as further described in Supplementary Table B. Summertime appointments were more likely to be attended (OR 0.81, 95% CI, 0.68-0.97) compared to those in the spring. PDFV lead time (the time interval between the discharge date and appointment date) was not associated with changes in visit attendance.
DISCUSSION
When comparing PDFV characteristics themselves, oncologic visits had the lowest NS/SDC incidence of any group analyzed in our study. This may be related to the inherent life-altering nature of a cancer diagnosis or our cancer center’s use of patient navigators.23,30 In contrast, primary care clinics suffered from NS/SDC rates approaching 40%, which is a concerning finding given the importance of primary care coordination in the posthospitalization period.9,31 Why are primary care appointments so commonly missed? Some studies suggest that forgetting about a primary care appointment is a leading reason.15,32,33 For PDFVs, this phenomenon may be augmented because the visits are not scheduled by patients themselves. Additionally, patients may paradoxically undervalue the benefit of an all-encompassing primary care visit, compared to a PDFV focused on a specific problem, (eg, a cardiology follow-up appointment for a patient with congestive heart failure). In particular, patients with limited health literacy may potentially undervalue the capabilities of their primary care clinics.34,35
The low absolute number of primary care PDFVs (only 8% of all visits) scheduled for patients at our hospital was an unexpected finding. This low percentage is likely a function of the patient population hospitalized at our large, urban quaternary-care facility. First, an unknown number of patients may have had PDFVs manually scheduled with primary care providers external to our health system; these PDFVs were not captured within our study. Second, 71% of the hospitalizations in our study occurred in subspecialty services, for which specific primary care follow-up may not be as urgent. Supporting this fact, further analysis of the 6136 hospitalizations in our study (data not shown) revealed that 28% of the hospitalizations in general internal medicine were scheduled with at least 1 primary care PDFV as opposed to only 5% of subspecialty-service hospitalizations.
In contrast to several previous studies of outpatient nonattendance,we did not find that visits scheduled for time points further in the future were more likely to be missed.14,24,25,36,37 Unlike other appointments, it may be that PDFV lead time does not affect attendance because of the unique manner in which PDFV times are scheduled and conveyed to patients. Unlike other appointments, patients do not schedule PDFVs themselves but instead learn about their PDFV dates as part of a large set of discharge instructions. This practice may result in poor recall of PDFV dates in recently hospitalized patients38, regardless of the lead time between discharge and the visit itself.
Supplementary Table 1 details a 51% NS/SDC rate for the small number of PDFVs (n = 65) that were excluded a priori from our analysis because of general ineligibility for UPHS outpatient care. We specifically chose to exclude this population because of the infrequent and irregular process by which these PDFVs were authorized on a case-by-case basis, typically via active engagement by our hospital’s social work department. We did not study this population further but postulate that the 51% NS/SDC rate may reflect other social determinants of health that contribute to appointment nonadherence in a predominantly uninsured population.
Beyond their effect on patient outcomes, improving PDFV-related processes has the potential to boost both inpatient and outpatient provider satisfaction. From the standpoint of frontline inpatient providers (often resident physicians), calling outpatient clinics to request PDFVs is viewed as 1 of the top 5 administrative tasks that interfere with house staff education.39 Future interventions that involve patients in the PDFV scheduling process may improve inpatient workflow while simultaneously engaging patients in their own care. For example, asking clinic representatives to directly schedule PDFVs with hospitalized patients, either by phone or in person, has been shown in pilot studies to improve PDFV attendance and decrease readmissions.40-42 Conversely, NS/SDC visits harm outpatient provider productivity and decrease provider availability for other patients.13,17,43 Strategies to mitigate the impact of unfilled appointment slots (eg, deliberately overbooking time slots in advance) carry their own risks, including provider burnout.44 As such, preventing NSs may be superior to curing their adverse impacts. Many such strategies exist in the ambulatory setting,13,43,45 for example, better communication with patients through texting or goal-directed, personalized phone reminders.46-48Our study methodology has several limitations. Most importantly, we were unable to measure PDFVs made with providers unaffiliated with UPHS. As previously noted, our low proportion of primary care PDFVs may specifically reflect patients with primary care providers outside of our health system. Similarly, our low percentage of Medicaid patients receiving PDFVs may be related to follow-up visits with nonaffiliated community health centers. We were unable to measure patient acuity and health literacy as potential predictors of NS/SDC rates. Driving distances were calculated from patient postal codes to our hospital, not to individual outpatient clinics. However, the majority of our hospital-affiliated clinics are located adjacent to our hospital; additionally, we grouped driving distances into quartiles for our analysis. We had initially attempted to differentiate between clinic-initiated and patient-initiated cancellations, but unfortunately, we found that the data were too unreliable to be used for further analysis (outlined in Supplementary Table 3). Lastly, because we studied patients in medical units at a single large, urban, academic center, our results are not generalizable to other settings (eg, community hospitals, hospitals with smaller networks of outpatient providers, or patients being discharged from surgical services or observation units).
CONCLUSION
Given national efforts to enhance postdischarge transitions of care, we aimed to analyze attendance at provider-scheduled PDFV appointments. Our finding that 25% of PDFVs resulted in NS/SDCs raises both questions and opportunities for inpatient and outpatient providers. Further research is needed to understand why so many patients miss their PDFVs, and we should work as a field to develop creative solutions to improve PDFV scheduling and attendance.
Acknowledgments
The authors acknowledge Marie Synnestvedt, PhD, and Manik Chhabra, MD, for their assistance with data gathering and statistical analysis. They also acknowledge Allison DeKosky, MD, Michael Serpa, BS, Michael McFall, and Scott Schlegel, MBA, for their assistance with researching this topic. They did not receive external compensation for their assistance outside of their usual salary support.
DISCLOSURE
Nothing to report.
1. Halasyamani L, Kripalani S, Coleman E, et al. Transition of care for hospitalized elderly patients - development of a discharge checklist for hospitalists. J Hosp Med. 2006;1(6):354-360. PubMed
2. Koehler BE, Richter KM, Youngblood L, et al. Reduction of 30-day postdischarge hospital readmission or emergency department (ED) visit rates in high-risk elderly medical patients through delivery of a targeted care bundle. J Hosp Med. 2009;4(4):211-218. PubMed
3. Soong C, Daub S, Lee JG, et al. Development of a checklist of safe discharge practices for hospital patients. J Hosp Med. 2013;8(8):444-449. PubMed
4. Rice YB, Barnes CA, Rastogi R, Hillstrom TJ, Steinkeler CN. Tackling 30-day, all-cause readmissions with a patient-centered transitional care bundle. Popul Health Manag. 2016;19(1):56-62. PubMed
5. Nelson EA, Maruish MM, Axler JL. Effects of discharge planning and compliance with outpatient appointments on readmission rates. Psych Serv. 2000;51(7):885-889. PubMed
6. Gavish R, Levy A, Dekel OK, Karp E, Maimon N. The association between hospital readmission and pulmonologist follow-up visits in patients with chronic obstructive pulmonary disease. Chest. 2015;148(2):375-381. PubMed
7. Jackson C, Shahsahebi M, Wedlake T, DuBard CA. Timeliness of outpatient follow-up: an evidence-based approach for planning after hospital discharge. Ann Fam Med. 2015;13(2):115-122. PubMed
8. Donaho EK, Hall AC, Gass JA, et al. Protocol-driven allied health post-discharge transition clinic to reduce hospital readmissions in heart failure. J Am Heart Assoc. 2015;4(12):e002296. PubMed
9. Misky GJ, Wald HL, Coleman EA. Post-hospitalization transitions: Examining the effects of timing of primary care provider follow-up. J Hosp Med. 2010;5(7):392-397. PubMed
10. Grafft CA, McDonald FS, Ruud KL, Liesinger JT, Johnson MG, Naessens JM. Effect of hospital follow-up appointment on clinical event outcomes and mortality. Arch Intern Med. 2010;171(11):955-960. PubMed
11. Auerbach AD, Kripalani S, Vasilevskis EE, et al. Preventability and causes of readmissions in a national cohort of general medicine patients. JAMA Intern Med. 2016;176(4):484-493. PubMed
12. Field TS, Ogarek J, Garber L, Reed G, Gurwitz JH. Association of early post-discharge follow-up by a primary care physician and 30-day rehospitalization among older adults. J Gen Intern Med. 2015;30(5):565-571. PubMed
13. Quinn K. It’s no-show time! Med Group Manage Assoc Connexion. 2007;7(6):44-49. PubMed
14. Whittle J, Schectman G, Lu N, Baar B, Mayo-Smith MF. Relationship of scheduling interval to missed and cancelled clinic appointments. J Ambulatory Care Manage. 2008;31(4):290-302. PubMed
15. Kaplan-Lewis E, Percac-Lima S. No-show to primary care appointments: Why patients do not come. J Prim Care Community Health. 2013;4(4):251-255. PubMed
16. Molfenter T. Reducing appointment no-shows: Going from theory to practice. Subst Use Misuse. 2013;48(9):743-749. PubMed
17. Kheirkhah P, Feng Q, Travis LM, Tavakoli-Tabasi S, Sharafkhaneh A. Prevalence, predictors and economic consequences of no-shows. BMC Health Serv Res. 2016;16(1):13. PubMed
18. Colubi MM, Perez-Elias MJ, Elias L, et al. Missing scheduled visits in the outpatient clinic as a marker of short-term admissions and death. HIV Clin Trials. 2012;13(5):289-295. PubMed
19. Obialo CI, Hunt WC, Bashir K, Zager PG. Relationship of missed and shortened hemodialysis treatments to hospitalization and mortality: Observations from a US dialysis network. Clin Kidney J. 2012;5(4):315-319. PubMed
20. Hwang AS, Atlas SJ, Cronin P, et al. Appointment “no-shows” are an independent predictor of subsequent quality of care and resource utilization outcomes. J Gen Intern Med. 2015;30(10):1426-1433. PubMed
21. Perez FD, Xie J, Sin A, et al. Characteristics and direct costs of academic pediatric subspecialty outpatient no-show events. J Healthc Qual. 2014;36(4):32-42. PubMed
22. Huang Y, Zuniga P. Effective cancellation policy to reduce the negative impact of patient no-show. Journal of the Operational Research Society. 2013;65(5):605-615.
23. Percac-Lima S, Cronin PR, Ryan DP, Chabner BA, Daly EA, Kimball AB. Patient navigation based on predictive modeling decreases no-show rates in cancer care. Cancer. 2015;121(10):1662-1670. PubMed
24. Torres O, Rothberg MB, Garb J, Ogunneye O, Onyema J, Higgins T. Risk factor model to predict a missed clinic appointment in an urban, academic, and underserved setting. Popul Health Manag. 2015;18(2):131-136. PubMed
25. Eid WE, Shehata SF, Cole DA, Doerman KL. Predictors of nonattendance at an endocrinology outpatient clinic. Endocr Pract. 2016;22(8):983-989. PubMed
26. Kashiwagi DT, Burton MC, Kirkland LL, Cha S, Varkey P. Do timely outpatient follow-up visits decrease hospital readmission rates? Am J Med Qual. 2012;27(1):11-15. PubMed
27. Miller AJ, Chae E, Peterson E, Ko AB. Predictors of repeated “no-showing” to clinic appointments. Am J Otolaryngol. 2015;36(3):411-414. PubMed
28. ASCO. Billing challenges for residents of Skilled Nursing Facilities. J Oncol Pract. 2008;4(5):245-248. PubMed
29. Centers for Medicare & Medicaid Services (2013). “SE0433: Skilled Nursing Facility consolidated billing as it relates to ambulance services.” Medicare Learning Network Matters. https://www.cms.gov/Outreach-and-Education/Medicare-Learning-Network-MLN/MLNMattersArticles/downloads/se0433.pdf. Accessed on February 14, 2017.
30. Luckett R, Pena N, Vitonis A, Bernstein MR, Feldman S. Effect of patient navigator program on no-show rates at an academic referral colposcopy clinic. J Womens Health (Larchmt). 2015;24(7):608-615. PubMed
31. Jones CD, Vu MB, O’Donnell CM, et al. A failure to communicate: A qualitative exploration of care coordination between hospitalists and primary care providers around patient hospitalizations. J Gen Intern Med. 2015;30(4):417-424. PubMed
32. George A, Rubin G. Non-attendance in general practice: a systematic review and its implications for access to primary health care. Fam Pract. 2003;20(2):178-184. 2016;31(12):1460-1466.J Gen Intern Med. PubMed
48. Shah SJ, Cronin P, Hong CS, et al. Targeted reminder phone calls to patients at high risk of no-show for primary care appointment: A randomized trial. 2010;123(6):542-548.Am J Med. PubMed
47. Parikh A, Gupta K, Wilson AC, Fields K, Cosgrove NM, Kostis JB. The effectiveness of outpatient appointment reminder systems in reducing no-show rates. 2009;20:142-144.Int J STD AIDS. PubMed
46. Price H, Waters AM, Mighty D, et al. Texting appointment reminders reduces ‘Did not attend’ rates, is popular with patients and is cost-effective. 2009;25(3):166-170.J Med Practice Management. PubMed
45. Hills LS. How to handle patients who miss appointments or show up late.
2009;39(3):271-287.Interfaces. PubMed
44. Kros J, Dellana S, West D. Overbooking Increases Patient Access at East Carolina University’s Student Health Services Clinic. 2012;344(3):211-219.Am J Med Sci.
43. Stubbs ND, Geraci SA, Stephenson PL, Jones DB, Sanders S. Methods to reduce outpatient non-attendance. PubMed
42. Haftka A, Cerasale MT, Paje D. Direct patient participation in discharge follow-up appointment scheduling. Paper presented at: Society of Hospital Medicine, Annual Meeting 2015; National Harbor, MD. 2012;5(1):27-32.Patient.
41. Chang R, Spahlinger D, Kim CS. Re-engineering the post-discharge appointment process for general medicine patients. PubMed
40. Coffey C, Kufta J. Patient-centered post-discharge appointment scheduling improves readmission rates. Paper presented at: Society of Hospital Medicine, Annual Meeting 2011; Grapevine, Texas. 2006;81(1):76-81.Acad Med.
39. Vidyarthi AR, Katz PP, Wall SD, Wachter RM, Auerbach AD. Impact of reduced duty hours on residents’ education satistfaction at the University of California, San Francisco.
2013;173(18):1715-1722.JAMA Intern Med. PubMed
38. Horwitz LI, Moriarty JP, Chen C, et al. Quality of discharge practices and patient understanding at an academic medical center. 2010;16(4):246-259.Health Informatics J. PubMed
37. Daggy J, Lawley M, Willis D, et al. Using no-show modeling to improve clinic performance. 2005;5:51.BMC Health Serv Res. PubMed
36. Lee VJ, Earnest A, Chen MI, Krishnan B. Predictors of failed attendances in a multi-specialty outpatient centre using electronic databases. 2013;3(9):e003212.BMJ Open. PubMed
35. Long T, Genao I, Horwitz LI. Reasons for readmission in an underserved high-risk population: A qualitative analysis of a series of inpatient interviews. 2013;32(7):1196-1203.Health Aff (Millwood). PubMed
34. Kangovi S, Barg FK, Carter T, Long JA, Shannon R, Grande D. Understanding why patients of low socioeconomic status prefer hospitals over ambulatory care. 2015;54(10):976-982.Clin Pediatr (Phila). PubMed
33. Samuels RC, Ward VL, Melvin P, et al. Missed Appointments: Factors Contributing to High No-Show Rates in an Urban Pediatrics Primary Care Clinic. PubMed
662-7919; E-mail: [email protected]
Excess Readmission vs Excess Penalties: Maximum Readmission Penalties as a Function of Socioeconomics and Geography
INTRODUCTION
According to Centers for Medicare & Medicaid Services (CMS), approximately 1 in 5 patients discharged from a hospital will be readmitted within 30 days.1 The Hospital Readmission Reduction Program (HRRP) is designed to reduce readmission by withholding up to 3% of all Medicare reimbursement from hospitals with “excess” readmissions; however, absent from the HRRP is adjustment for socioeconomic status (SES), which CMS holds may undermine incentives to reduce health disparities and institutionalize lower standards for hospitals serving disadvantaged populations.2
Lack of SES adjustment has been criticized by those who point to evidence highlighting postdischarge environment and patient SES as drivers of readmission and suggest hospitals that serve low SES individuals will bear a disproportionate share of penalties.3-6 Single-center,3,7,8 regional,9,10 and nationwide6,11 studies highlight census tract level socioeconomic variables as predictive of readmission. Single-center studies, robust in controlling for confounders, including staffing, training, electronic medical record utilization, and transitional care processes, do not allow comparisons between hospitals, limiting utility in HRRP evaluation. Multicenter cohorts, on the other hand, allow for comparisons between high and low penalty hospitals, pioneered by Joynt et al12 after the first round of HRRP penalties; yet this technique may not account for confounding caused by extensive demographic, socioeconomic, and hospital characteristic heterogeneity inherent in a national cohort. Analysis of the 2015 HRRP penalty data by Sjoding et al.6 revealed higher chronic obstructive pulmonary disease (COPD) readmission rates in the Mid-Atlantic, Midwest, and South relative to other regions; however, the magnitude of small-area variation and its relationship to population SES have yet to be characterized.
Therefore, we conducted a matched case-control design, whereby each maximum penalty hospital was matched to a nonpenalty hospital using key hospital characteristics. We then used geographic matching to isolate SES factors predictive of readmission within specific geographies in an effort to control for regional population differences. We hypothesized that, among both matched and localized hospital pairs, the disparities in population SES are the most significant predictors of a maximum penalty. Now in the 3rd year of the HRRP with approximately 75% of eligible hospitals to receive penalties worth an estimated $428 million in the 2015 fiscal year,13 we offer a small-area analysis of bipolar extremes to inform debate surrounding the HRRP with evidence regarding the causes and implications of readmission penalties.
METHODS
Study Design and Sample
This study relies on a case-control design. The cases were defined as US hospitals to receive the maximum 3% HRRP penalty in fiscal year 2015. Controls were drawn from the cohort of hospitals potentially subject to HRRP penalties that received no readmission penalty in the 2015 fiscal year with at least 1 admission for any of the following conditions: heart failure (HF), acute myocardial infarction (AMI), pneumonia (PN), total knee arthroscopy or total hip arthroscopy (THA/TKA), or chronic obstructive pulmonary disease (COPD).
Data Sources
Penalty data were drawn from the 2015 master penalty file,14 which were accessed via CMS.gov. County-level demographic and socioeconomic data were gathered from the 2015 American Community Survey (ACS), a subsidiary of the US Census. Data on hospital characteristics, capacity, and regional healthcare utilization were drawn from 2012 Dartmouth Atlas,15 2012 Medicare Cost Report,16 2012 American Hospital Association Hospital Statistics Database, and 2014 Hospital Care Downloadable Database.
Hospital-level CMS data were linked to the master 2015 penalty file. Dartmouth Atlas data were subsequently linked to the file using the Dartmouth Atlas “Hospital to HSA/HRR Crosswalk” file (accessed via DartmouthAtlas.org.) Each hospital was assigned the profile of the hospital service area (HSA) and hospital referral region (HRR) in which it is located. An HSA is a geographic region defined by hospital admissions; the majority, but not entirety, of residents of a given HSA utilize the corresponding hospital. Similarly, an HRR is a geographic region defined by referrals for major cardiovascular and neurosurgery procedures. County-level socioeconomic data were linked to the dataset by county name; thus, hospital socioeconomic profiles are based on the county in which they are located.
Case-Control Matching
In the primary analysis, coarsened exact matching (CEM) matched controls to cases by potential confounding hospital characteristics, including the following: ownership, number of beds, case mix index (measure of acuity), ambulatory care visit rates within 14 days of discharge, and total number of penalty-eligible cases, including HF, AMI, COPD, PN, and THA/TKA.
In the secondary analysis, hospitals were geocoded by zip code. Geographic Information Systems mapping software (ESRI ArcGIS, Redlands, CA) relied upon Euclidean allocation distance spatial analysis17,18 to match each maximum-penalty hospital to the nearest nonpenalty hospital. Each case was matched to a distinct control; duplicate controls were replaced with the nearest unmatched no-penalty hospital.
Statistical Analysis
Univariate analyses utilized unpaired Student t tests (primary analysis) and paired Student t tests (secondary analysis). The CEM algorithm matches by strata rather than pairs, precluding paired Student t tests in the primary analysis. Statistical analyses were conducted using STATA (StataCorp. 2013. Stata Statistical Software: Release 13. College Station, TX).
RESULTS
Maximum Penalty and Nonpenalty Hospital Matching
Of 3383 hospitals eligible for the HRRP, 39 received the maximum penalty and 770 received no penalty. Thirty-eight control hospitals were identified using CEM algorithm; 1 maximum-penalty hospital could not be matched and was excluded from primary analy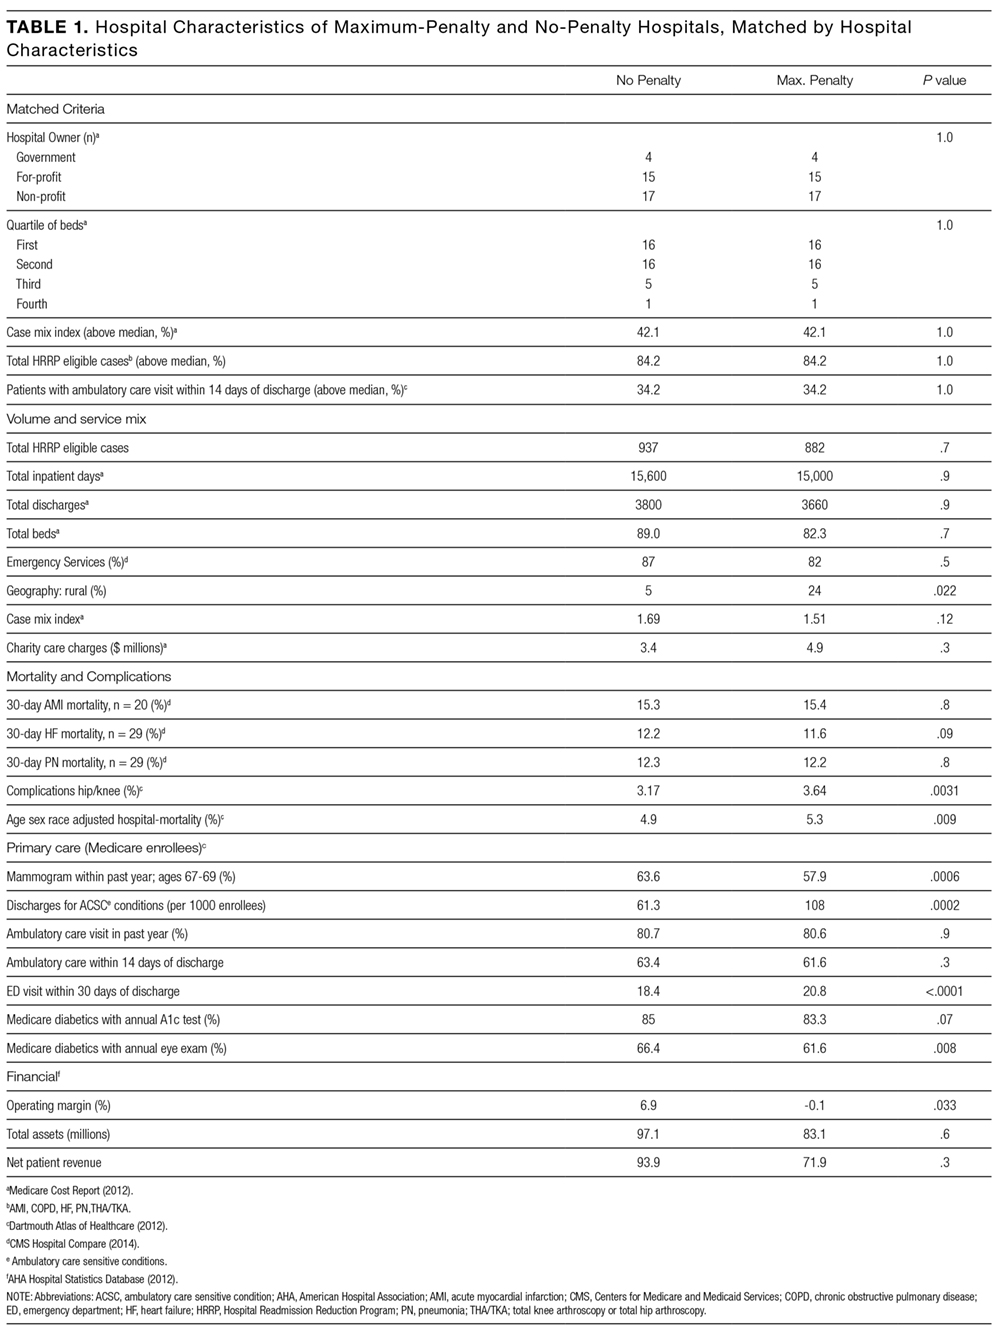
Hospital Characteristics
Case and control profiles are presented in Table 1. Cases and controls were matched by characteristics which may impact readmission rates (Table 1). CEM yielded cohorts similar across a spectrum of metrics, and identical in terms of matching criteria including ownership, beds (quartile), case mix index (above median), ambulatory care visit within 14 days of discharge (above median), and total number of penalty-eligible cases (above median). Relative to no-penalty hospitals, maximum-penalty hospitals were more likely rural (n = 9 vs n = 2, P = 0.022) and have a less profitable operating margin (0.1% vs 6.9%), and location within HSAs with higher age, sex, and race adjusted hospital-wide mortality rate (5.3% vs 4.9%, P = 0.009) and higher rates of discharge for ambulatory care sensitive conditions (108 vs 63 discharges per 1000 Medicare enrollees).
Demographic and Socioeconomic Characteristics
As presented in Table 2, cases a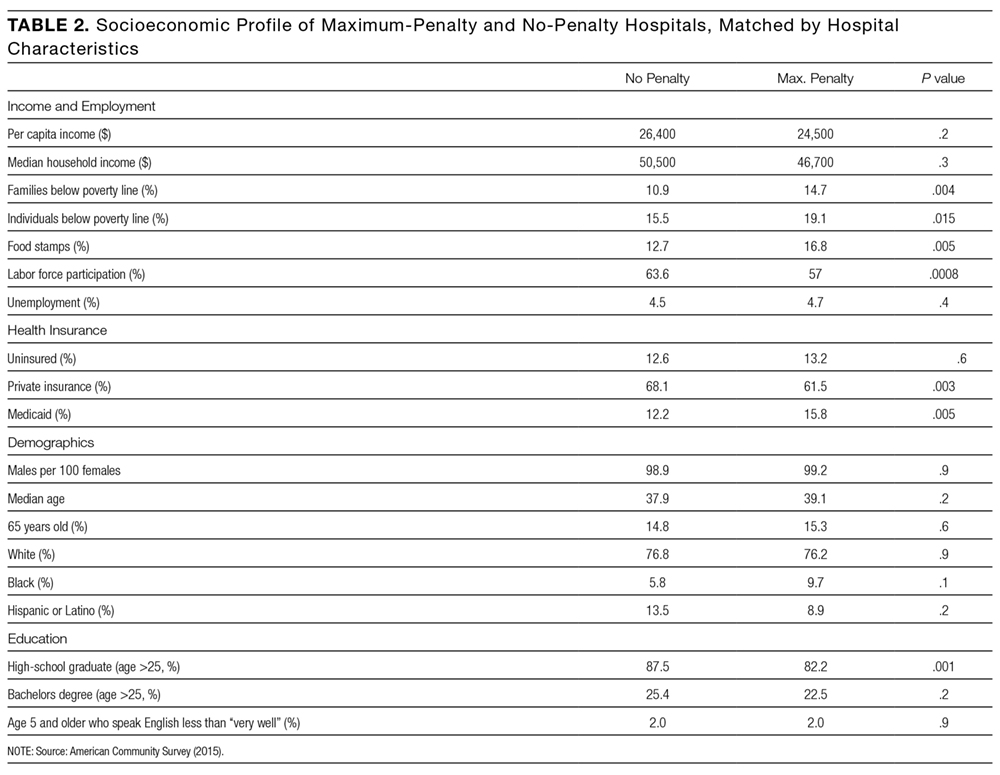
Secondary Analysis: Geographical Matching
Secondary analysis matched each maximum-penalty hospital to the nearest no-penalty hospital using a global information system vector analysis algorithm. As shown in the Figure, median distance between the case and the control was 42.5 miles (interquartile range: 25th percentile, 15.4 miles; 75th percentile, 98.4 miles). Seventeen pairs (44%) were in the same HRR, 6 of which were in the same HSA. Seven pairs (18%) were within the same county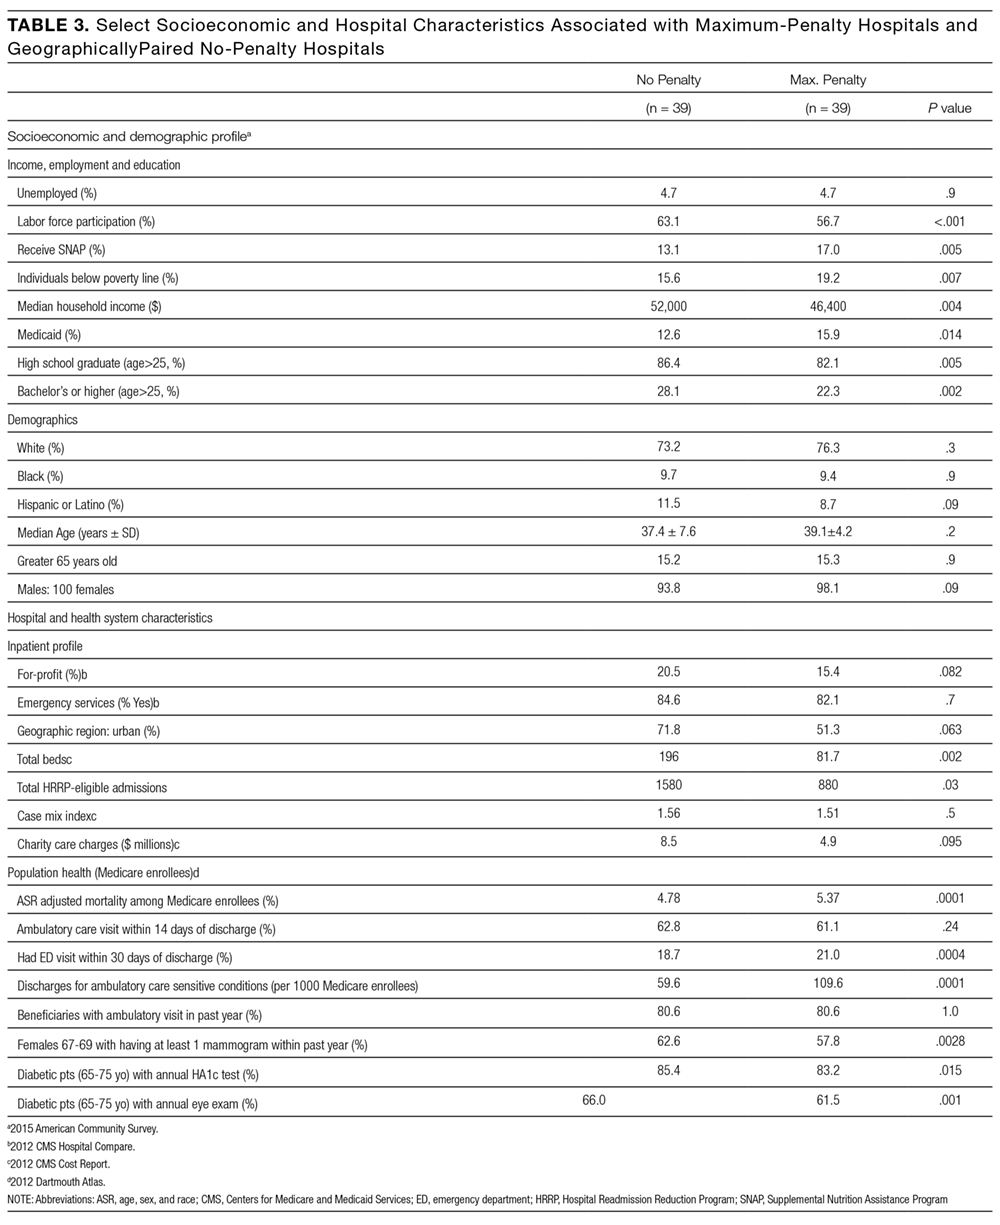
Secondary Analysis: Economic and Demographic Profiles of Geographically Matched Pairs
Demographic and socioeconomic profiles are presented in Table 3. The cases and controls are in counties with similar age, sex, and ethnicity distributions. Relative to no-penalty hospitals, maximum-penalty hospitals are in counties with lower socioeconomic profiles, including increased rates of poverty (15.6% vs 19.2%, P = 0.007) and lower rates of high school (86.4% vs 82.1%, P = 0.005) or college graduation (22.3% vs 28.1%, P = 0.002). Seven pairs were in the same county; a sensitivity analysis excluding these hospitals revealed similarly lower SES profile in cases relative to controls (Supplementary Table 1).
DISCUSSION
Our analysis reveals that county-level socioeconomic profiles are predictors of maximum HRRP penalties. Specifically, after matching cases and controls on 5 hospital characteristics that may influence readmission, maximum-penalty hospitals were more likely to be in rural counties with higher rates of poverty and lower rates of education relative to no-penalty hospitals. We observed no difference between cases and controls with respect to age, sex, or ethnicity.
Our study complement
Maximum Penalties as a Function of Population Health
The Dartmouth Atlas of Healthcare measures health outcomes, which are regionally aggregated among local hospitals by either HSA or HRR; see Methods. Such small-area aggregation does not precisely reflect outcomes from a specific hospital, but rather it describes the health status of localities. Disparities in health outcomes exist between maximum-penalty and no-penalty HSAs. Complication rates were slightly higher in maximum penalty HSAs, consistent with studies highlighting complications as drivers of surgical readmissions.22,23 Moreover, hospital-wide mortality rates were higher in maximum-penalty areas relative to nonpenalty HSAs (5.3 vs 4.9, P = 0.009).
Using national data, Krumholz et al. found no correlation between rates of readmission and mortality for HF, AMI, and PN24, which is a phenomenon acknowledged by the Medicare Payment Advisory Commission (MedPac) in a 2013 report titled, “Refining the hospital readmission reduction program.”25 In large national studies, others have shown low SES to be associated with elevated readmission but not mortality.10,11 In contrast, we restricted our analysis to matched cohorts and are, to our knowledge, the first to present evidence of an association between readmission and hospital-wide mortality adjusted for age, sex, and ethnicity.
Our results suggest maximum readmission penalties are a function of population health and public health capacity. The rates of ambulatory care sensitive condition (ACSC) discharges were substantially higher in HSAs of maximum penalty hospitals relative to nonpenalty hospitals (108 vs 63 per 1000 Medicare enrollees, P < 0.001). ACSC discharges have been used to measure primary care quality for 30 years, with the assumption being that admission for chronic conditions, such as HF, can be prevented with effective primary care.26,27 Moreover, patients discharged from maximum-penalty hospitals were more likely to have an emergency room visit within 30 days of discharge (20.8% vs 18.4%, P < 0.001). Higher rates of ACSCs and postdischarge emergency department visits suggest outpatient resources in maximum-penalty service areas struggle to manage the disease burden of high-risk populations. Geography may be a contributor; maximum-penalty hospitals were more likely to be rural than no-penalty hospitals (24% vs 5%, P = 0.022).
Our findings suggest hospitals providing care to vulnerable communities (defined by low income, low education, and high rates of ambulatory sensitive discharges) are disproportionately penalized. McHugh et al. revealed high nurse staffing levels to be protective against readmission penalties28, yet high penalties to low-margin hospitals may encourage reduced rather than increased staff. It may be better policy to direct resources rather than penalties to underserved communities; our findings echo others with concern about disproportionate penalties to hospitals serving low SES patients.2,5,6,29
Secondary Analysis: Geographic Matching
Geographic matching paired each maximum-penalty hospital to the nearest no-penalty hospital in an attempt to control for unmeasured regional factors that may confound an association between socioeconomic profile and health outcomes. For example, cost of living 30, 31 and obesity 32,33 vary regionally. Our study was unequipped to assess potential regional confounders; we attempted to control for them with geographical matching.
Median distance between maximum-penalty and no-penalty hospitals was 42.5 miles. Seven pairs were located within the same county, thus both case and control were assigned the same socioeconomic profile. Despite close proximity and identical SES profile in 7 of 39 pairs, maximum-penalty hospitals were in counties with lower income and lower rates of education, strengthening the association between SES and maximum readmission penalties.
Implications and Future Directions
In response to criticism surrounding the HRRP, the National Quality Forum endorsed the general concept of SES adjustment for hospital quality measures.34 Subsequently, in a briefing dated March 24, 2015, MedPAC, a government agency which provides Medicare policy analysis to Congress, proposed an SES adjustment methodology of “dividing hospitals into peer groups based on their overall share of low-income Medicare patients, and then setting a benchmark readmissions target for each peer group”;35 in other words, lower standards for hospitals that serve low-income populations. MedPAC’s proposal will reduce penalties to “safety net” institutions, which is progress but not a solution. Although the HRRP appears to be working, according to the US Department of Health and Human Services, readmissions fell by 150,000 between January 2012 and February 2013,36 we are concerned neither the HRRP nor the MedPac revision proposal considers geographic and environmental components of readmission. The HRRP promotes national improvement in exchange for regional regression.
Fair quality measures are key to value-based reimbursement models; yet, implicit in penalties for excess readmissions is the assumed ability to calculate hospital performance targets. Benchmarks for safety, timely care, and patient satisfaction can be uniform; rates of central line infections should not be influenced by patient mix. However, 9 of the 39 maximum-penalty hospitals under the HRRP are in rural Kentucky; one could hypothesize many reasons why rural Kentucky is a hotbed for excess readmission, including the regional production of tobacco and bourbon.
The fundamental question raised by our study is whether poor performance on quality measures is a function of underperforming hospitals or a manifestation of underserved communities. Moving forward, we encourage data systems and study designs that focus research on geospatial distribution of population health within the context of social and behavioral health determinants.37 Small-area studies of factors that drive health outcomes will inform rational alignment of healthcare policies and resources (including penalties and incentives) with underlying population needs.
Strengths and Weaknesses
Matching is a strength of the study. Primary analysis matched case and controls by hospital characteristics, generating cohorts similar across a spectrum of hospital metrics. Therefore, variation in readmission rates was less likely confounded by hospital characteristics. The secondary analysis was matched by geography in an effort to adjust for unmeasured, regional factors, including obesity and cost of living that may confound an association between SES and health outcomes. Geographic matching adds strength to our assertion that SES drives distinction between maximum-penalty hospitals and nonpenalty hospitals.
One weakness was the regional unit of analysis for socioeconomic and Dartmouth Atlas data, which is not a precise profile of the corresponding hospital. Each hospital was assigned a county-level socioeconomic profile. A more robust methodology would analyze patient-level SES data; this was impractical given a cohort of 78 hospitals. Regional health outcomes data limits analysis of readmission penalties as a function of hospital quality. Instead, regional data facilitated associations between readmission and population health, consistent with the aim of our study.
We analyzed 116 of 3668 hospitals eligible for the HRRP (3.2%), limiting the generalizability of our findings. Eighty-four percent of hospitals in the primary analysis have below the median number of beds, and none of them are teaching hospitals. Our analysis, restricted to maximum-penalty and no-penalty cohorts, does not address potential association between submaximal readmission penalties and socioeconomics.
Both matching techniques potentially controlled for similar SES factors and skewed our results towards null, especially in terms of race and ethnicity. Geographic matching generated 7 pairs (18%) within in the same county; both maximum-penalty and no-penalty hospitals were assigned the same socioeconomic profile, as well as 6 pairs (15%) within the same HSA, and both cases and controls had identical Dartmouth Atlas health outcomes profiles. We retained these pairs in our analysis to avoid artificially inflating SES and population health differences between cohorts.
Thirty-nine hospitals received a maximum penalty in the 3rd year of the HRRP. Relative to geographically matched no-penalty hospitals, maximum-penalty hospitals were more likely to be rural and located in counties with less educational attainment, more poverty and more poorly controlled chronic disease. In contrast to nationwide studies, a matched analysis plan revealed no difference between the cohorts in terms of race and ethnicity and provided evidence that maximum penalty hospitals had higher rates of age-, sex-, and race-adjusted hospital-wide mortality.
Our results highlight potential consequences of nationally derived benchmarks for phenomena underpinned by social, behavioral, and environmental factors and raise the question of whether maximum HRRP penalties are a consequence of underperforming hospitals or a manifestation of underserved communities. We are encouraged by MedPAC’s proposal to stratify HRRP by SES, yet recommend further small-area geographic analyses to better align quality measures, penalties, and incentives with resources and needs of distinct populations.
Acknowledgments
The authors thank William Hisey, who laid the foundation for the analysis and without whom the project would not have been possible.
DISCLOSURE
The authors certify that none of the material in this manuscript has been previously published and that none of this material is currently under consideration for publication elsewhere. This project received no funding. None of the authors on this manuscript have any commercial relationships to disclose in relation to this manuscript. All authors have reviewed and approved this manuscript and have contributed significantly to the design, conduct, and/or analysis of the research. No authors have any financial interests to disclose. No authors have any potential conflicts of interest to disclose. No authors have financial or personal relationships with any of the subject material presented in the manuscript.
1. Jencks SF, Williams MV, Coleman EA. Rehospitalizations among patients in the Medicare fee-for-service program. N Engl J Med. 2009;360(14):1418-1428. PubMed
30. Bethell C, Simpson L, Stumbo S, Carle AC, Gombojav N. National, state and local disparities in childhood obesity. Health Aff. 2010; 29(3): 347-356. PubMed
31. Singh GK, Kogan MD, van Dyck PC. Changes in state-specific childhood obesity and overweight prevalence in the United States from 2003 to 2007. Arch Pediatr Adolesc Med. 2010;164(7):598-607. PubMed
32. Aten BH, Figueroa EB, Martin TB. Regional Price Parities for States and Metropolitan Areas, 2006–2010. Survey of Current Business 2012;92:229-242.
33. Dubay L, Wheaton L, Zedlewski S. Geographic variation in the cost of living: implications for poverty guidelines and program eligibility. Urban Institute. 2013. https://aspe.hhs.gov/system/files/pdf/174186/UrbanGeographicVariation.pdf. Accessed on February 22, 2017. Last accessed July 10, 2017
34. National Quality Forum. Risk Adjustment for Socioeconomic Status or Other Sociodemographic Factors: a Technical Report. 2014. http://www.qualityforum. org/Publications/2014/08/Risk_Adjustment_for_Socioeconomic_Status_or_Other_Sociodemographic_Factors.aspx. Accessed July 10, 2017.
36. Services CfMaM. New HHS Data Shows Major Strides Made in Patient Safety, Leading to Improved Care and Savings. In: Services USDoHaH, ed. https://innovation.cms.gov/Files/reports/patient-safety-results.pdf. Accessed July 10, 2017.
37. Harrison KM, Dean HD. Use of data systems to address social determinants of health: a need to do more. Public Health Reports (Washington, DC:1974). 2011;126 Suppl 3:1-5. PubMed
INTRODUCTION
According to Centers for Medicare & Medicaid Services (CMS), approximately 1 in 5 patients discharged from a hospital will be readmitted within 30 days.1 The Hospital Readmission Reduction Program (HRRP) is designed to reduce readmission by withholding up to 3% of all Medicare reimbursement from hospitals with “excess” readmissions; however, absent from the HRRP is adjustment for socioeconomic status (SES), which CMS holds may undermine incentives to reduce health disparities and institutionalize lower standards for hospitals serving disadvantaged populations.2
Lack of SES adjustment has been criticized by those who point to evidence highlighting postdischarge environment and patient SES as drivers of readmission and suggest hospitals that serve low SES individuals will bear a disproportionate share of penalties.3-6 Single-center,3,7,8 regional,9,10 and nationwide6,11 studies highlight census tract level socioeconomic variables as predictive of readmission. Single-center studies, robust in controlling for confounders, including staffing, training, electronic medical record utilization, and transitional care processes, do not allow comparisons between hospitals, limiting utility in HRRP evaluation. Multicenter cohorts, on the other hand, allow for comparisons between high and low penalty hospitals, pioneered by Joynt et al12 after the first round of HRRP penalties; yet this technique may not account for confounding caused by extensive demographic, socioeconomic, and hospital characteristic heterogeneity inherent in a national cohort. Analysis of the 2015 HRRP penalty data by Sjoding et al.6 revealed higher chronic obstructive pulmonary disease (COPD) readmission rates in the Mid-Atlantic, Midwest, and South relative to other regions; however, the magnitude of small-area variation and its relationship to population SES have yet to be characterized.
Therefore, we conducted a matched case-control design, whereby each maximum penalty hospital was matched to a nonpenalty hospital using key hospital characteristics. We then used geographic matching to isolate SES factors predictive of readmission within specific geographies in an effort to control for regional population differences. We hypothesized that, among both matched and localized hospital pairs, the disparities in population SES are the most significant predictors of a maximum penalty. Now in the 3rd year of the HRRP with approximately 75% of eligible hospitals to receive penalties worth an estimated $428 million in the 2015 fiscal year,13 we offer a small-area analysis of bipolar extremes to inform debate surrounding the HRRP with evidence regarding the causes and implications of readmission penalties.
METHODS
Study Design and Sample
This study relies on a case-control design. The cases were defined as US hospitals to receive the maximum 3% HRRP penalty in fiscal year 2015. Controls were drawn from the cohort of hospitals potentially subject to HRRP penalties that received no readmission penalty in the 2015 fiscal year with at least 1 admission for any of the following conditions: heart failure (HF), acute myocardial infarction (AMI), pneumonia (PN), total knee arthroscopy or total hip arthroscopy (THA/TKA), or chronic obstructive pulmonary disease (COPD).
Data Sources
Penalty data were drawn from the 2015 master penalty file,14 which were accessed via CMS.gov. County-level demographic and socioeconomic data were gathered from the 2015 American Community Survey (ACS), a subsidiary of the US Census. Data on hospital characteristics, capacity, and regional healthcare utilization were drawn from 2012 Dartmouth Atlas,15 2012 Medicare Cost Report,16 2012 American Hospital Association Hospital Statistics Database, and 2014 Hospital Care Downloadable Database.
Hospital-level CMS data were linked to the master 2015 penalty file. Dartmouth Atlas data were subsequently linked to the file using the Dartmouth Atlas “Hospital to HSA/HRR Crosswalk” file (accessed via DartmouthAtlas.org.) Each hospital was assigned the profile of the hospital service area (HSA) and hospital referral region (HRR) in which it is located. An HSA is a geographic region defined by hospital admissions; the majority, but not entirety, of residents of a given HSA utilize the corresponding hospital. Similarly, an HRR is a geographic region defined by referrals for major cardiovascular and neurosurgery procedures. County-level socioeconomic data were linked to the dataset by county name; thus, hospital socioeconomic profiles are based on the county in which they are located.
Case-Control Matching
In the primary analysis, coarsened exact matching (CEM) matched controls to cases by potential confounding hospital characteristics, including the following: ownership, number of beds, case mix index (measure of acuity), ambulatory care visit rates within 14 days of discharge, and total number of penalty-eligible cases, including HF, AMI, COPD, PN, and THA/TKA.
In the secondary analysis, hospitals were geocoded by zip code. Geographic Information Systems mapping software (ESRI ArcGIS, Redlands, CA) relied upon Euclidean allocation distance spatial analysis17,18 to match each maximum-penalty hospital to the nearest nonpenalty hospital. Each case was matched to a distinct control; duplicate controls were replaced with the nearest unmatched no-penalty hospital.
Statistical Analysis
Univariate analyses utilized unpaired Student t tests (primary analysis) and paired Student t tests (secondary analysis). The CEM algorithm matches by strata rather than pairs, precluding paired Student t tests in the primary analysis. Statistical analyses were conducted using STATA (StataCorp. 2013. Stata Statistical Software: Release 13. College Station, TX).
RESULTS
Maximum Penalty and Nonpenalty Hospital Matching
Of 3383 hospitals eligible for the HRRP, 39 received the maximum penalty and 770 received no penalty. Thirty-eight control hospitals were identified using CEM algorithm; 1 maximum-penalty hospital could not be matched and was excluded from primary analy
Hospital Characteristics
Case and control profiles are presented in Table 1. Cases and controls were matched by characteristics which may impact readmission rates (Table 1). CEM yielded cohorts similar across a spectrum of metrics, and identical in terms of matching criteria including ownership, beds (quartile), case mix index (above median), ambulatory care visit within 14 days of discharge (above median), and total number of penalty-eligible cases (above median). Relative to no-penalty hospitals, maximum-penalty hospitals were more likely rural (n = 9 vs n = 2, P = 0.022) and have a less profitable operating margin (0.1% vs 6.9%), and location within HSAs with higher age, sex, and race adjusted hospital-wide mortality rate (5.3% vs 4.9%, P = 0.009) and higher rates of discharge for ambulatory care sensitive conditions (108 vs 63 discharges per 1000 Medicare enrollees).
Demographic and Socioeconomic Characteristics
As presented in Table 2, cases a
Secondary Analysis: Geographical Matching
Secondary analysis matched each maximum-penalty hospital to the nearest no-penalty hospital using a global information system vector analysis algorithm. As shown in the Figure, median distance between the case and the control was 42.5 miles (interquartile range: 25th percentile, 15.4 miles; 75th percentile, 98.4 miles). Seventeen pairs (44%) were in the same HRR, 6 of which were in the same HSA. Seven pairs (18%) were within the same county
Secondary Analysis: Economic and Demographic Profiles of Geographically Matched Pairs
Demographic and socioeconomic profiles are presented in Table 3. The cases and controls are in counties with similar age, sex, and ethnicity distributions. Relative to no-penalty hospitals, maximum-penalty hospitals are in counties with lower socioeconomic profiles, including increased rates of poverty (15.6% vs 19.2%, P = 0.007) and lower rates of high school (86.4% vs 82.1%, P = 0.005) or college graduation (22.3% vs 28.1%, P = 0.002). Seven pairs were in the same county; a sensitivity analysis excluding these hospitals revealed similarly lower SES profile in cases relative to controls (Supplementary Table 1).
DISCUSSION
Our analysis reveals that county-level socioeconomic profiles are predictors of maximum HRRP penalties. Specifically, after matching cases and controls on 5 hospital characteristics that may influence readmission, maximum-penalty hospitals were more likely to be in rural counties with higher rates of poverty and lower rates of education relative to no-penalty hospitals. We observed no difference between cases and controls with respect to age, sex, or ethnicity.
Our study complement
Maximum Penalties as a Function of Population Health
The Dartmouth Atlas of Healthcare measures health outcomes, which are regionally aggregated among local hospitals by either HSA or HRR; see Methods. Such small-area aggregation does not precisely reflect outcomes from a specific hospital, but rather it describes the health status of localities. Disparities in health outcomes exist between maximum-penalty and no-penalty HSAs. Complication rates were slightly higher in maximum penalty HSAs, consistent with studies highlighting complications as drivers of surgical readmissions.22,23 Moreover, hospital-wide mortality rates were higher in maximum-penalty areas relative to nonpenalty HSAs (5.3 vs 4.9, P = 0.009).
Using national data, Krumholz et al. found no correlation between rates of readmission and mortality for HF, AMI, and PN24, which is a phenomenon acknowledged by the Medicare Payment Advisory Commission (MedPac) in a 2013 report titled, “Refining the hospital readmission reduction program.”25 In large national studies, others have shown low SES to be associated with elevated readmission but not mortality.10,11 In contrast, we restricted our analysis to matched cohorts and are, to our knowledge, the first to present evidence of an association between readmission and hospital-wide mortality adjusted for age, sex, and ethnicity.
Our results suggest maximum readmission penalties are a function of population health and public health capacity. The rates of ambulatory care sensitive condition (ACSC) discharges were substantially higher in HSAs of maximum penalty hospitals relative to nonpenalty hospitals (108 vs 63 per 1000 Medicare enrollees, P < 0.001). ACSC discharges have been used to measure primary care quality for 30 years, with the assumption being that admission for chronic conditions, such as HF, can be prevented with effective primary care.26,27 Moreover, patients discharged from maximum-penalty hospitals were more likely to have an emergency room visit within 30 days of discharge (20.8% vs 18.4%, P < 0.001). Higher rates of ACSCs and postdischarge emergency department visits suggest outpatient resources in maximum-penalty service areas struggle to manage the disease burden of high-risk populations. Geography may be a contributor; maximum-penalty hospitals were more likely to be rural than no-penalty hospitals (24% vs 5%, P = 0.022).
Our findings suggest hospitals providing care to vulnerable communities (defined by low income, low education, and high rates of ambulatory sensitive discharges) are disproportionately penalized. McHugh et al. revealed high nurse staffing levels to be protective against readmission penalties28, yet high penalties to low-margin hospitals may encourage reduced rather than increased staff. It may be better policy to direct resources rather than penalties to underserved communities; our findings echo others with concern about disproportionate penalties to hospitals serving low SES patients.2,5,6,29
Secondary Analysis: Geographic Matching
Geographic matching paired each maximum-penalty hospital to the nearest no-penalty hospital in an attempt to control for unmeasured regional factors that may confound an association between socioeconomic profile and health outcomes. For example, cost of living 30, 31 and obesity 32,33 vary regionally. Our study was unequipped to assess potential regional confounders; we attempted to control for them with geographical matching.
Median distance between maximum-penalty and no-penalty hospitals was 42.5 miles. Seven pairs were located within the same county, thus both case and control were assigned the same socioeconomic profile. Despite close proximity and identical SES profile in 7 of 39 pairs, maximum-penalty hospitals were in counties with lower income and lower rates of education, strengthening the association between SES and maximum readmission penalties.
Implications and Future Directions
In response to criticism surrounding the HRRP, the National Quality Forum endorsed the general concept of SES adjustment for hospital quality measures.34 Subsequently, in a briefing dated March 24, 2015, MedPAC, a government agency which provides Medicare policy analysis to Congress, proposed an SES adjustment methodology of “dividing hospitals into peer groups based on their overall share of low-income Medicare patients, and then setting a benchmark readmissions target for each peer group”;35 in other words, lower standards for hospitals that serve low-income populations. MedPAC’s proposal will reduce penalties to “safety net” institutions, which is progress but not a solution. Although the HRRP appears to be working, according to the US Department of Health and Human Services, readmissions fell by 150,000 between January 2012 and February 2013,36 we are concerned neither the HRRP nor the MedPac revision proposal considers geographic and environmental components of readmission. The HRRP promotes national improvement in exchange for regional regression.
Fair quality measures are key to value-based reimbursement models; yet, implicit in penalties for excess readmissions is the assumed ability to calculate hospital performance targets. Benchmarks for safety, timely care, and patient satisfaction can be uniform; rates of central line infections should not be influenced by patient mix. However, 9 of the 39 maximum-penalty hospitals under the HRRP are in rural Kentucky; one could hypothesize many reasons why rural Kentucky is a hotbed for excess readmission, including the regional production of tobacco and bourbon.
The fundamental question raised by our study is whether poor performance on quality measures is a function of underperforming hospitals or a manifestation of underserved communities. Moving forward, we encourage data systems and study designs that focus research on geospatial distribution of population health within the context of social and behavioral health determinants.37 Small-area studies of factors that drive health outcomes will inform rational alignment of healthcare policies and resources (including penalties and incentives) with underlying population needs.
Strengths and Weaknesses
Matching is a strength of the study. Primary analysis matched case and controls by hospital characteristics, generating cohorts similar across a spectrum of hospital metrics. Therefore, variation in readmission rates was less likely confounded by hospital characteristics. The secondary analysis was matched by geography in an effort to adjust for unmeasured, regional factors, including obesity and cost of living that may confound an association between SES and health outcomes. Geographic matching adds strength to our assertion that SES drives distinction between maximum-penalty hospitals and nonpenalty hospitals.
One weakness was the regional unit of analysis for socioeconomic and Dartmouth Atlas data, which is not a precise profile of the corresponding hospital. Each hospital was assigned a county-level socioeconomic profile. A more robust methodology would analyze patient-level SES data; this was impractical given a cohort of 78 hospitals. Regional health outcomes data limits analysis of readmission penalties as a function of hospital quality. Instead, regional data facilitated associations between readmission and population health, consistent with the aim of our study.
We analyzed 116 of 3668 hospitals eligible for the HRRP (3.2%), limiting the generalizability of our findings. Eighty-four percent of hospitals in the primary analysis have below the median number of beds, and none of them are teaching hospitals. Our analysis, restricted to maximum-penalty and no-penalty cohorts, does not address potential association between submaximal readmission penalties and socioeconomics.
Both matching techniques potentially controlled for similar SES factors and skewed our results towards null, especially in terms of race and ethnicity. Geographic matching generated 7 pairs (18%) within in the same county; both maximum-penalty and no-penalty hospitals were assigned the same socioeconomic profile, as well as 6 pairs (15%) within the same HSA, and both cases and controls had identical Dartmouth Atlas health outcomes profiles. We retained these pairs in our analysis to avoid artificially inflating SES and population health differences between cohorts.
Thirty-nine hospitals received a maximum penalty in the 3rd year of the HRRP. Relative to geographically matched no-penalty hospitals, maximum-penalty hospitals were more likely to be rural and located in counties with less educational attainment, more poverty and more poorly controlled chronic disease. In contrast to nationwide studies, a matched analysis plan revealed no difference between the cohorts in terms of race and ethnicity and provided evidence that maximum penalty hospitals had higher rates of age-, sex-, and race-adjusted hospital-wide mortality.
Our results highlight potential consequences of nationally derived benchmarks for phenomena underpinned by social, behavioral, and environmental factors and raise the question of whether maximum HRRP penalties are a consequence of underperforming hospitals or a manifestation of underserved communities. We are encouraged by MedPAC’s proposal to stratify HRRP by SES, yet recommend further small-area geographic analyses to better align quality measures, penalties, and incentives with resources and needs of distinct populations.
Acknowledgments
The authors thank William Hisey, who laid the foundation for the analysis and without whom the project would not have been possible.
DISCLOSURE
The authors certify that none of the material in this manuscript has been previously published and that none of this material is currently under consideration for publication elsewhere. This project received no funding. None of the authors on this manuscript have any commercial relationships to disclose in relation to this manuscript. All authors have reviewed and approved this manuscript and have contributed significantly to the design, conduct, and/or analysis of the research. No authors have any financial interests to disclose. No authors have any potential conflicts of interest to disclose. No authors have financial or personal relationships with any of the subject material presented in the manuscript.
1. Jencks SF, Williams MV, Coleman EA. Rehospitalizations among patients in the Medicare fee-for-service program. N Engl J Med. 2009;360(14):1418-1428. PubMed
30. Bethell C, Simpson L, Stumbo S, Carle AC, Gombojav N. National, state and local disparities in childhood obesity. Health Aff. 2010; 29(3): 347-356. PubMed
31. Singh GK, Kogan MD, van Dyck PC. Changes in state-specific childhood obesity and overweight prevalence in the United States from 2003 to 2007. Arch Pediatr Adolesc Med. 2010;164(7):598-607. PubMed
32. Aten BH, Figueroa EB, Martin TB. Regional Price Parities for States and Metropolitan Areas, 2006–2010. Survey of Current Business 2012;92:229-242.
33. Dubay L, Wheaton L, Zedlewski S. Geographic variation in the cost of living: implications for poverty guidelines and program eligibility. Urban Institute. 2013. https://aspe.hhs.gov/system/files/pdf/174186/UrbanGeographicVariation.pdf. Accessed on February 22, 2017. Last accessed July 10, 2017
34. National Quality Forum. Risk Adjustment for Socioeconomic Status or Other Sociodemographic Factors: a Technical Report. 2014. http://www.qualityforum. org/Publications/2014/08/Risk_Adjustment_for_Socioeconomic_Status_or_Other_Sociodemographic_Factors.aspx. Accessed July 10, 2017.
36. Services CfMaM. New HHS Data Shows Major Strides Made in Patient Safety, Leading to Improved Care and Savings. In: Services USDoHaH, ed. https://innovation.cms.gov/Files/reports/patient-safety-results.pdf. Accessed July 10, 2017.
37. Harrison KM, Dean HD. Use of data systems to address social determinants of health: a need to do more. Public Health Reports (Washington, DC:1974). 2011;126 Suppl 3:1-5. PubMed
We Want to Know: Eliciting Hospitalized Patients’ Perspectives on Breakdowns in Care
There is growing recognition that patients and family members have critical insights into healthcare experiences. As consumers of healthcare, patient experience is the definitive gauge of whether healthcare is patient centered. In addition, patients may know things about their healthcare that the care team does not. Several studies have demonstrated that patients have knowledge of adverse events and medical errors that are not detected by other methods.1-5 For these reasons, systems designed to elicit patient perspectives of care and detect patient-perceived breakdowns in care could be used to improve healthcare safety and quality, including the patient experience.
Historically, hospitals have relied on patient-initiated reporting via complaints or legal action as the main source of information regarding patient-perceived breakdowns in care. However, many patients are hesitant to speak up about problems or uncertain about how to report concerns.6-8 As a result, healthcare systems often only learn of the most severe breakdowns in care from a subset of activated patients, thus underestimating how widespread patient-perceived breakdowns are.
To overcome these limitations of patient-initiated reporting, hospitals could conduct outreach to patients to actively identify and learn about patient-perceived breakdowns in care. Potential benefits of outreach to patients include more reliable detection of patient-perceived breakdowns in care, identification of a broader range of types of breakdowns commonly experienced by patients, and recognition of problems in real-time when there is more opportunity for redress. Indeed, some hospitals have adopted active outreach programs such as structured nurse manager rounding or postdischarge phone calls.9
It is possible that outreach will not overcome patients’ reluctance to speak up, or patients may not share serious or actionable breakdowns. The manner in which outreach is conducted is likely to influence the information patients are willing to share. Prior studies examining patient perspectives of healthcare have primarily taken a structured approach with close-ended questions or a focus on specific aspects of care.1,10,11 Limited data collected using an open-ended approach suggest patient-perceived breakdowns in care may be very common.2,12,13 However, the impact of such breakdowns on patients has not been well characterized.
In order to design systems that can optimally detect patient-perceived breakdowns in care, additional information is needed to understand whether patients will report breakdowns in response to outreach programs, what types of problems they will report, and how these problems impact them. Understanding such issues will allow healthcare systems to respond to calls by federal health agencies to develop mechanisms for patients to report concerns about breakdowns in care, thereby providing truly patient-centered care.14 Therefore, we undertook this study with the overall goal of describing what may be learned from an open-ended outreach approach that directly asks patients about problems they have encountered during hospitalization. Specifically, we aim to (1) describe the types of problems reported by patients in response to this outreach approach and (2) characterize patients’ perceptions of the impact of these events.
METHODS
Setting
We conducted this study in 2 hospitals between June 2014 and February 2015. One participating hospital is a large, urban, tertiary care medical center serving a predominantly white (78%) patient population in Baltimore, Maryland. The second hospital is a large, inner city, tertiary care medical center serving a predominantly African-American (71%) patient population in Washington, DC.
Three medical-surgical units (MSUs) at each hospital participated. We selected MSUs because MSU patients interact with a variety of clinicians, often have long stays, and are at risk for adverse events. Hospitalists were part of the clinical care team in each of the participating units, serving either as the attending of record or by comanaging patients.
Patient Eligibility
Patients were potentially eligible if they were at least 18 years old, able to speak English or Spanish, and admitted to the hospital for more than 24 hours. Ineligibility criteria included the following: imminent discharge, observation (noninpatient) status, on hospice, on infection precautions (for inpatient interviews only), psychiatric or violence concerns, prisoner status, significant confusion, or inability to provide informed consent.
Eligible patients in each unit were randomized. Interviewers consecutively approached patients according to their random assignment. If a patient was not available, the interviewer proceeded to the next room. Interviewers returned to rooms of missed patients when possible. Recruitment in the unit ended when the recruitment target for that unit was achieved.
Interviewers
Five interviewers conducted interviews. One author (KS) provided interviewer training that included didactic instruction, observation, feedback, and modeling. Interviewers participated in weekly debriefing sessions. One interviewer speaks Spanish fluently and was able to conduct interviews in Spanish. Translator services were available for the other interviewers.
Interview Process

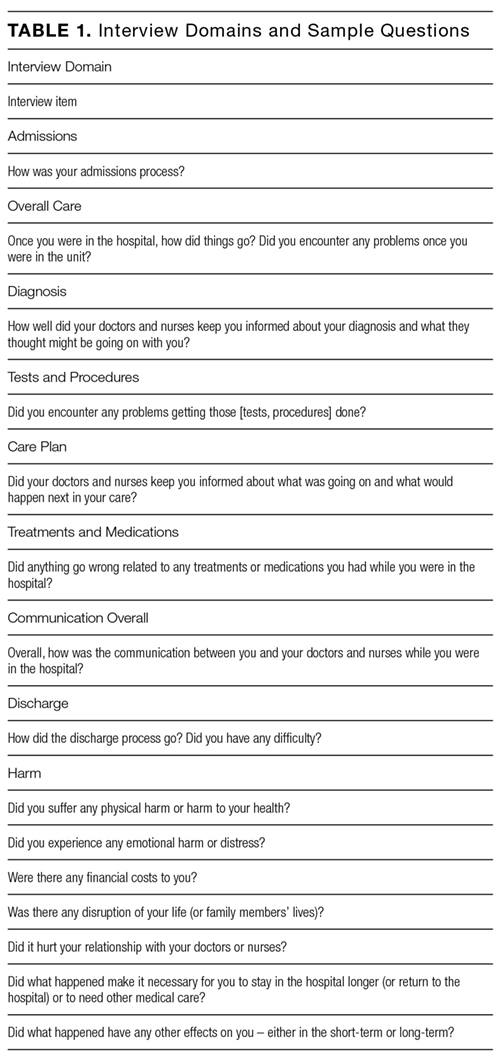
Interviews were conducted in person while the patients were hospitalized or via telephone 7 - 30 days postdischarge. A patient who had completed an interview while hospitalized was not eligible for a postdischarge telephone interview. Family members or friends present at the time of the interviews could also participate in addition to or in lieu of the patients with the patients’ assent. Interviewers obtained verbal, informed consent at the start of each interview.
The interview domains and sample questions were developed specifically for the current study and are listed in Table 1. The goal of the interview was to elicit the patient’s (or family member’s) perception of their care experiences and their perceptions of the consequences of any problems with their care. The interviewer sought to obtain sufficient detail to understand the patient’s concerns and to determine what, if any, action might be needed to remediate problems reported by patients. Interviewers captured patient responses by taking detailed notes on a case report form or by directly entering patient responses using a computer or iPad at the time of interview at the discretion of the interviewer.
We defined a patient-perceived breakdown as something that went wrong during the hospitalization according to the patient. If a patient-perceived breakdown in care was identified, the interviewer attempted to resolve the concern. Some breakdowns had occurred in the past, making further resolution impossible (eg, a long wait in the emergency department). Other breakdowns were active and addressable, such as the patient having clinical questions that had not been answered. In such cases, the interviewer attempted to address the patient’s concerns, typically by working with unit nursing staff. For patients interviewed postdischarge, the interviewer worked to resolve ongoing patient concerns with the assistance of the patient safety, quality, and compliance teams as needed. The interviewer provided a brief narrative summary of all interviews to unit nursing leadership within 24 hours. Positive comments were sent to leadership but not captured systematically for research purposes. Further details of the process of responding to patients’ concerns will be reported elsewhere. All data were entered into REDCap to facilitate data management and reporting.15
The MedStar Health Research Institute Institutional Review Board reviewed and approved this study.
Categorizing Patients’ Responses: The Patient Experience Coding Tool
Using directed content analysis,16 we deductively created the Patient Experience Coding Tool (PECT) in order to summarize the narrative information captured during the interviews and categorize patient-perceived breakdowns in care. First, we referred to our prior interviews of patients’ views on breakdowns in cancer care6 and surrogate decision-makers’ views on breakdowns in intensive care units13 to create the initial categories. We then applied the resultant framework to the interviews in the present study and refined the categories. This involved applying the categorization to an initial set of interviews to check the sufficiency of the coding categories. We clarified the scope of each category (ie, what types of events fit under each category) and created additional categories (eg, medication-related problems) to capture patient experiences that were not included in the initial framework.
We then coded each interview using the PECT. A minimum of 2 readers reviewed the narrative notes for each interview. The first reader provided an initial categorization; the second reader reviewed the narrative and confirmed or questioned the initial categorization to improve coding accuracy. If a reader was uncertain about the correct categorization, it was discussed by three readers until an agreement was achieved. Because facilities-related problems (eg, food or parking) fall outside the realm of provider-based hospital care, such comments were not the focus of the outreach efforts and were not consistently recorded. Therefore, they were not included in the PECT and are not reported here.
Analyses
We computed simple, descriptive statistics including the number and percentage of patients identifying at least one breakdown, as well as the number and percent reporting each type of breakdown. We also computed the number and percentage of patients reporting any harm and each type of harm. We computed the percentage of patients reporting at least 1 breakdown by hospital, type of interview (postdischarge vs inpatient), selected patient demographic characteristics (eg, gender, age, education, race), and interviewee (patient vs someone other than the patient interviewed or present during the interview) using the chi-square statistic to test the statistical significance of the resulting differences. All statistical analyses were performed using SPSS version 22.
RESULTS
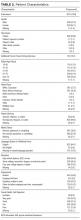
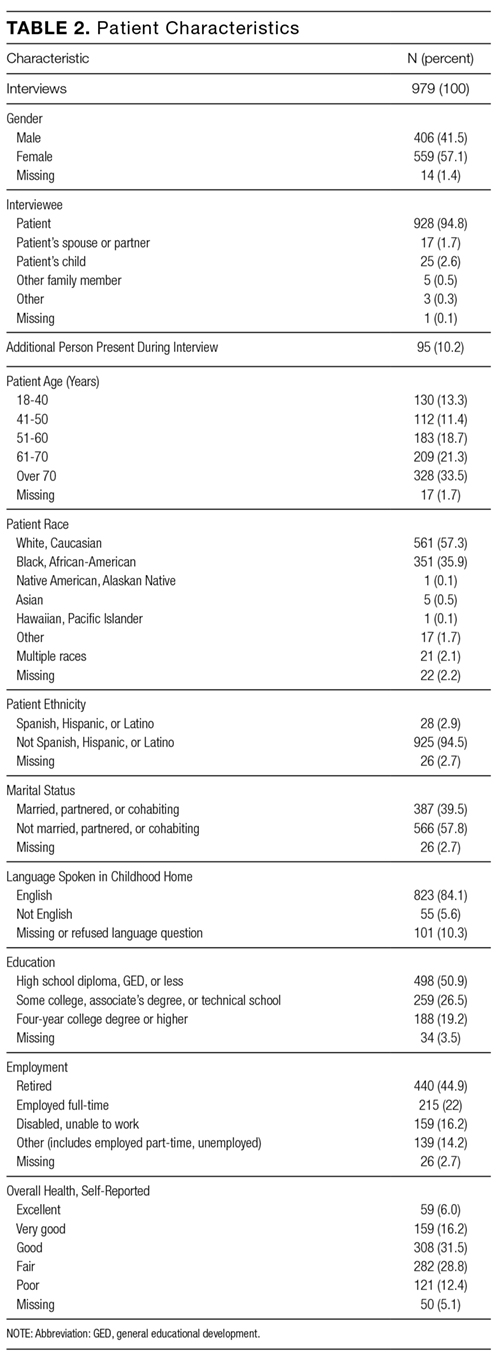
A total of 979 outreach interviews were conducted. Of these, 349 were conducted via telephone postdischarge, and 630 were conducted in person during hospitalization. The average interview duration was 8.5 minutes for telephone interviews and 12.2 minutes for in-person interviews. Of the patients approached to participate, 67% completed an interview (61% in person, 83% via telephone). Patient characteristics are summarized in Table 2.
Overall, 386 of 979 interviewees (39.4%) believed they had experienced at least one breakdown in care. The types of patient-perceived breakdowns reported were categorized using the PECT and are summarized in Table 3 and the Figure. The most common concern involved information exchange. Approximately 1 in 10 patients (n = 105, 10.7%) felt that they had not received the information they needed when they needed it. Medication-related concerns were reported by 12.3% (n = 120) of interviewees and predominantly included concerns about what medications were being administered (5.7%) and inadequately treated pain (5.6%). Many of the patients expressing concerns about what medications were administered questioned why they were not receiving their outpatient medications or did not understand why a different medication was being administered, suggesting that many of these instances were related to breakdowns in communication as well. Other relatively common concerns were delays in the admissions process (reported by 9.2% of interviewees), poor team communication (reported by 6.6% of interviewees), healthcare providers with a rude or uncaring manner (reported by 6.3% of interviewees), and problems related to discharge (reported by 5.7% of interviewees).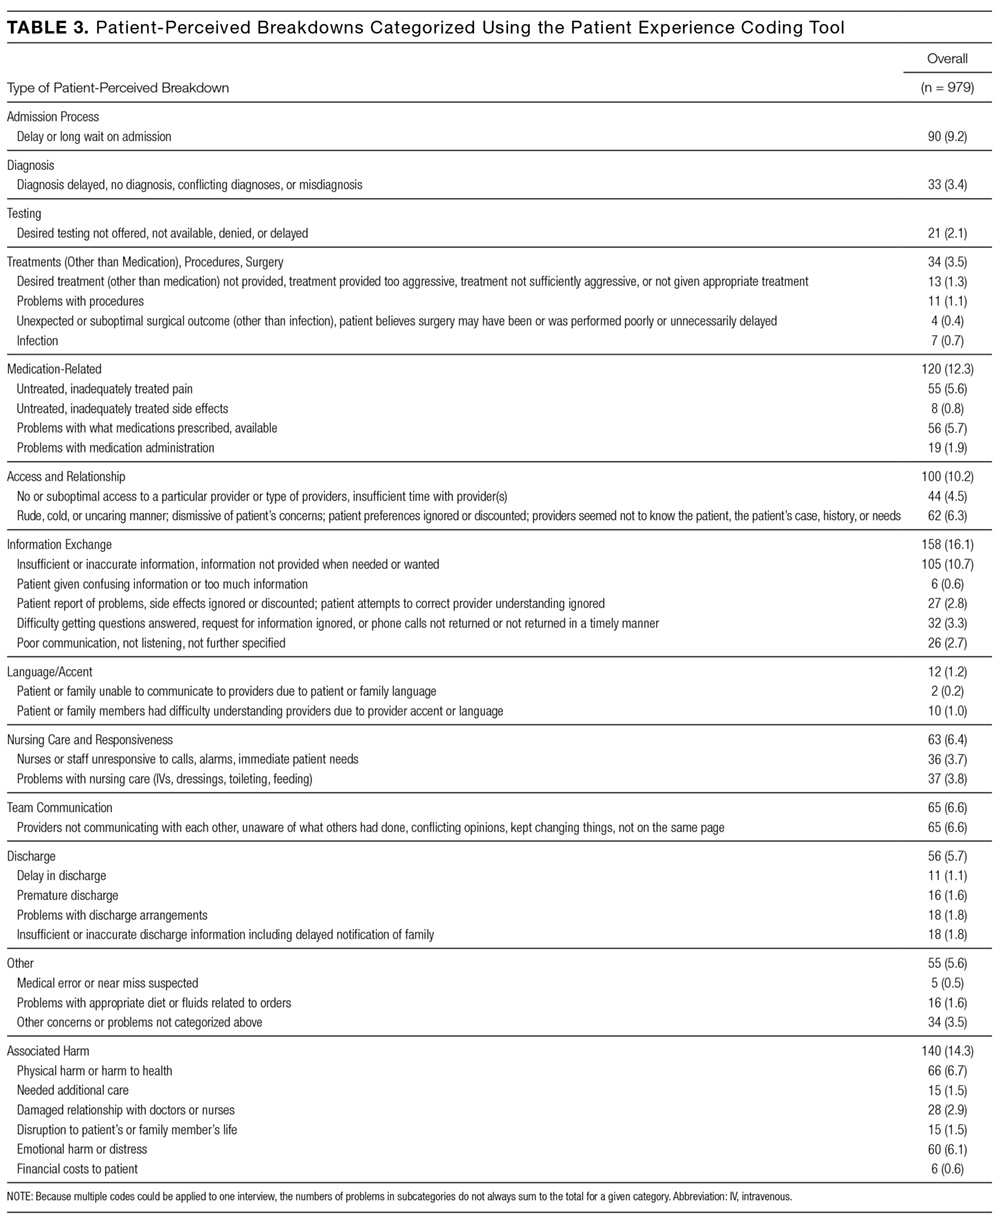
Of the 386 interviewees who perceived a breakdown in care, 140 (36.3%) perceived harm associated with the event (Table 3). The most common harms were physical (eg, pain; n = 66) and emotional (eg, distress, worry; n = 60). In addition, patients reported instances of damage to relationships with providers (n = 28) resulting in a loss of trust, with participants citing breakdowns as a reason for not coming back to a particular hospital or provider. In other cases, patients believed that breakdowns in care resulted in the need for additional care or a prolonged hospital stay.
We found no difference between the 2 hospitals where the study was conducted in the percentage of interviewees reporting at least 1 breakdown (39.1% vs 39.9%, P = 0.80). We also found no difference between interview method, (ie, in person vs telephone; 40.6% vs 37.2%, respectively, P = 0.30), patient gender (40.6% and 38.8% for men and women, respectively, P = 0.57), race (41.0% and 36.8% for white and black or African-American, respectively, P = 0.20) or between interviewers (P = 0.37). We did identify differences in rates of reporting at least 1 breakdown in care related to age (45.4% of patients aged 60 years or younger vs 34.5% of patients older than 60 years, P < 0.001) and education (32.7% of patients with a high school education or less vs 46.8% of those with at least some college education, P < 0.001). Patients interviewed alone reported fewer breakdowns than if another person was present during the interview or was interviewed in lieu of the patient (37.8% vs 53.4%, P = 0.002). The rate of reporting breakdowns for patients interviewed alone in the hospital is very similar to the rates of those interviewed via telephone (37.8% vs 37.2%). For most types of breakdowns, there were no differences in reporting for in-person vs postdischarge interviews. Discharge-related problems were more frequently reported among patients interviewed postdischarge (8.9% postdischarge vs 4.0% in person, P = 0.002). Patients interviewed in person were more likely to report problems with information exchange compared to patients interviewed postdischarge (17.6% vs 13.5%, respectively; P = 0.09), although this did not reach statistical significance.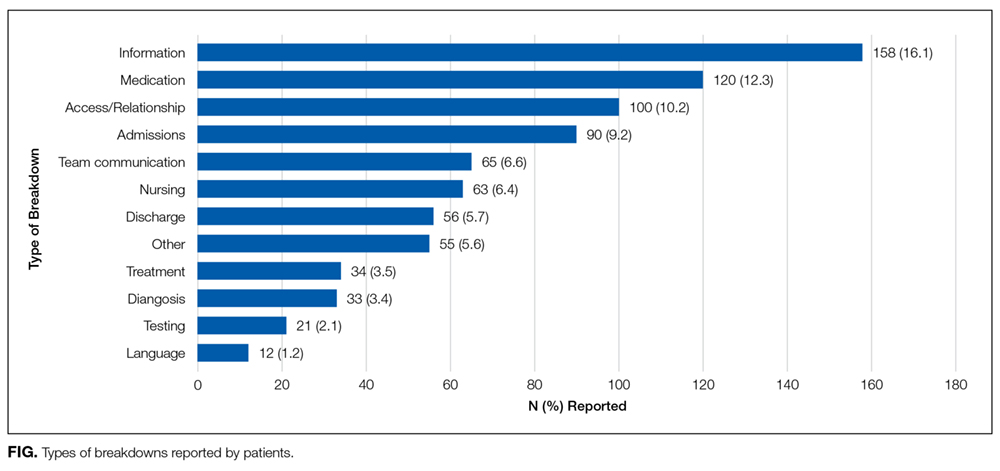
DISCUSSION
Through interviews with nearly 1000 patients, we have found that approximately 4 in 10 hospitalized patients believed they experienced a breakdown in care. Not only are patient-perceived breakdowns in care distressingly common, more than one-third of these events resulted in harm according to the patient. Patients reported a diverse range of breakdowns, including problems related to patient experience, as well as breakdowns in technical aspects of medical care. Collectively, these findings illustrate a striking need to identify and address these frequent and potentially harmful breakdowns.
Our findings are consistent with prior studies in which 20% to 50% of patients identified a problem during hospitalization. For example, Weingart et al. interviewed patients in a single general medical unit and found that 20% experienced an adverse event, near miss, or medical error, while nearly 40% experienced what was defined as a service quality incident.2,12 Of note, both our study and the study by Weingart et al. systematically elicited patients’ perspectives of breakdowns in care with explicit questions about problems or breakdowns in care.2,12 Because patients are often reluctant to speak up about problems in care,without such efforts to actively identify problems, providers and leaders are likely to be unaware of the majority of these concerns.6-8 These findings suggest that hospital-based providers should at least consider routinely asking patients about breakdowns in care to identify and respond to patients’ concerns.
Not only are patient-perceived breakdowns common, more than one-third of patients who experienced a breakdown considered it to be harmful. This suggests that our outreach approach identified predominantly nontrivial concerns. We adopted a broad definition of harm that includes emotional distress, damage to the relationship with providers, and life disruption. This differs from other studies examining patient reports of breakdowns in care, in which harm was restricted to physical injury.1,2 We consider this inclusive definition of harm to be a strength of the present study as it provides the most complete picture of the impact of such events on patients. This approach is supported by other studies demonstrating that patients place great emphasis on the psychological consequences of adverse events.17-19 Thus, it is clear from our work and other studies that nonphysical harm is important and warrants concerted efforts to address.
Patients in our study reported a variety of breakdowns, including breakdowns related to patient experience (eg, communication, relationship with providers) and technical aspects of healthcare delivery (eg, diagnosis, treatment). This is consistent with other studies examining patient perspectives of breakdowns in care. Weingart et al.found that hospitalized patients reported a broad range of problems, including adverse events, medical errors, communication breakdowns, and problems with food.2,12 This variety of events suggests a need for integration between the various hospital groups that handle patient-perceived breakdowns, including bedside providers, risk management, patient relations, patient advocates, and quality and safety groups, in order to provide a coordinated and effective response to the full spectrum of patient-perceived breakdowns in care.
Patients in our study were more likely to report breakdowns related to communication and relationships with providers than those related to technical aspects of care. Similarly, Kuzel et al.found that the most common problems cited by patients in the primary care setting were breakdowns in the clinician-patient relationship and access-related problems.17This is not surprising, as patients are likely to have more direct knowledge about communication and interpersonal relationships than about technical aspects of care.
We identified several factors associated with the likelihood of reporting a breakdown in care. Most strikingly, involving a friend or family member in the interview was strongly associated with reporting a breakdown. Other work has also suggested that patients’ friends and family members are an important source of information about safety concerns.20,21 In addition, several patient characteristics were associated with an increased likelihood of reporting a breakdown, including being younger and better educated. These findings highlight the importance of engaging patients’ friends and families in efforts to elicit patient concerns about healthcare, and they confirm recommendations for patients to bring a friend or family member to healthcare encounters.22 In addition, they illustrate the need to better understand how patient characteristics affect perceptions of breakdowns in care and their willingness to speak up, as this could inform efforts to target outreach to especially vulnerable patients.
A strength of this study is the number of interviews completed (almost 1000), which provides a diverse range of patient views and experiences, as evidenced by the demographic characteristics of participants. Interviews were conducted at two hospitals that differ substantially with regard to populations served, further enhancing the generalizability of our findings. Despite the large number of interviews and diverse patient characteristics, patients were drawn from only 3 units at 2 hospitals, which may limit generalizability.
We did not conduct medical record reviews to validate patients’ reports of problems, which may be viewed as a limitation. While such a comparison would be informative, the intent of the current study was to elicit patients’ perceptions of care, including aspects of care that are not typically captured in the medical record, such as communication. Other studies have demonstrated that patients’ reports of medical errors and adverse events tend to differ from providers’ reports of the same subjects.19,23 Therefore, we considered the patients’ perceptions of care to be a useful endpoint in and of itself. We did not determine the extent to which providers were already aware of patients’ concerns or whether they considered patients’ concerns valid. A related limitation is our inability to determine whether the differences we identified in the rates of breakdown reporting based on patient characteristics reflect differences in willingness to report or differences in experiences. Because we included patients in an MSU, it is possible that breakdowns were related to medical care, surgical care, or both. We did not follow patients longitudinally and therefore only captured harm perceived by a patient at the time of the interview. It is possible that patients may have experienced harm later in their hospitalization or following discharge that was not measured. Lastly, we did not measure interrater reliability of the interview coding and therefore do not present the PECT as a validated instrument. These important questions should be targeted for future study.
CONCLUSION
When directly asked about their experiences, almost 4 out of 10 hospitalized patients reported a breakdown in their care, many of which were perceived to be harmful. Not all hospitals will have the resources to implement the intensive approach used in this study to elicit patient-perceived breakdowns. Therefore, further work is needed to develop sustainable methods to overcome patients’ reluctance to report breakdowns in care. Engaging patients’ families and friends may be a particularly fruitful strategy. We offer the PECT as a tool that hospitals could use to summarize a variety of sources of patient feedback such as complaints, responses to surveys, and consumer reviews. Hospitals that effectively encourage patients and their family members to speak up about perceived breakdowns will identify many opportunities to address patient concerns, potentially leading to improved patient safety and experience.
1. Weissman JS, Schneider EC, Weingart SN, et al. Comparing patient-reported hospital adverse events with medical record review: Do patients know something that hospitals do not? Ann Intern Med. 2008;149(2):100-108. PubMed
2. Weingart SN, Pagovich O, Sands DZ, et al. What can hospitalized patients tell us about adverse events? learning from patient-reported incidents. J Gen Intern Med. 2005;20(9):830-836. PubMed
3. Wetzels R, Wolters R, van Weel C, Wensing M. Mix of methods is needed to identify adverse events in general practice: A prospective observational study. BMC Fam Pract. 2008;9:35. PubMed
4. Friedman SM, Provan D, Moore S, Hanneman K. Errors, near misses and adverse events in the emergency department: What can patients tell us? CJEM. 2008;10(5):421-427. PubMed
5. Iedema R, Allen S, Britton K, Gallagher TH. What do patients and relatives know about problems and failures in care? BMJ Qual Saf. 2012;21(3):198-205. PubMed
6. Mazor KM, Roblin DW, Greene SM, et al. Toward patient-centered cancer care: Patient perceptions of problematic events, impact, and response. J Clin Oncol. 2012;30(15):1784-1790. PubMed
7. Frosch DL, May SG, Rendle KA, Tietbohl C, Elwyn G. Authoritarian physicians and patients’ fear of being labeled ‘difficult’ among key obstacles to shared decision making. Health Aff (Millwood). 2012;31(5):1030-1038. PubMed
8. Entwistle VA, McCaughan D, Watt IS, et al. Speaking up about safety concerns: Multi-setting qualitative study of patients’ views and experiences. Qual Saf Health Care. 2010;19(6):e33. PubMed
9. Tan M, Lang D. Effectiveness of nurse leader rounding and post-discharge telephone calls in patient satisfaction: A systematic review. JBI database of systematic reviews and implementation reports. 2015;13(7):154-176. PubMed
10. Garbutt J, Bose D, McCawley BA, Burroughs T, Medoff G. Soliciting patient complaints to improve performance. Jt Comm J Qual Saf. 2003;29(3):103-112. PubMed
11. Agoritsas T, Bovier PA, Perneger TV. Patient reports of undesirable events during hospitalization. J Gen Intern Med. 2005;20(10):922-928. PubMed
12. Weingart SN, Pagovich O, Sands DZ, et al. Patient-reported service quality on a medicine unit. Int J Qual Health Care. 2006;18(2):95-101. PubMed
13. Fisher KA, Ahmad S, Jackson M, Mazor KM. Surrogate decision makers’ perspectives on preventable breakdowns in care among critically ill patients: A qualitative study. Patient Educ Couns. 2016;99(10):1685-1693. PubMed
14. Halpern MT, Roussel AE, Treiman K, Nerz PA, Hatlie MJ, Sheridan S. Designing consumer reporting systems for patient safety events. Final Report (Prepared by RTI International and Consumers Advancing Patient Safety under Contract No. 290-06-00001-5). AHRQ Publication No. 11-0060-EF. Rockville, MD: Agency for Healthcare Research and Quality; 2011.
15. Harris PA, Taylor R, Thielke R, Payne J, Gonzalez N, Conde JG. Research electronic data capture (REDCap)—A metadata-driven methodology and workflow process for providing translational research informatics support. J Biomed Inform. 2009;42(2):377-381. PubMed
16. Hsieh HF, Shannon SE. Three approaches to qualitative content analysis. Qual Health Res. 2005;15(9):1277-1288. PubMed
17. Kuzel AJ, Woolf SH, Gilchrist VJ, et al. Patient reports of preventable problems and harms in primary health care. Ann Fam Med. 2004;2(4):333-340. PubMed
18. Sokol-Hessner L, Folcarelli PH, Sands KE. Emotional harm from disrespect: The neglected preventable harm. BMJ Qual Saf. 2015;24(9):550-553. PubMed
19. Masso Guijarro P, Aranaz Andres JM, Mira JJ, Perdiguero E, Aibar C. Adverse events in hospitals: The patient’s point of view. Qual Saf Health Care. 2010;19(2):144-147. PubMed
20. Bardach NS, Lyndon A, Asteria-Penaloza R, Goldman LE, Lin GA, Dudley RA. From the closest observers of patient care: A thematic analysis of online narrative reviews of hospitals. BMJ Qual Saf. 2015. PubMed
21. Schneider EC, Ridgely MS, Quigley DD, et al. Developing and testing the health care safety hotline: A prototype consumer reporting system for patient safety events. Final Report (Prepared by RAND Corporation under contract HHSA2902010000171). Rockvelle, MD: Agency for Healthcare Research and Quality; May 2016.
22. Shekelle PG, Pronovost PJ, Wachter RM, et al. The top patient safety strategies that can be encouraged for adoption now. Ann Intern Med. 2013;158(5 Pt 2):365-368. PubMed
23. Lawton R, O’Hara JK, Sheard L, et al. Can staff and patient perspectives on hospital safety predict harm-free care? an analysis of staff and patient survey data and routinely collected outcomes. BMJ Qual Saf. 2015;24(6):369-376. PubMed
There is growing recognition that patients and family members have critical insights into healthcare experiences. As consumers of healthcare, patient experience is the definitive gauge of whether healthcare is patient centered. In addition, patients may know things about their healthcare that the care team does not. Several studies have demonstrated that patients have knowledge of adverse events and medical errors that are not detected by other methods.1-5 For these reasons, systems designed to elicit patient perspectives of care and detect patient-perceived breakdowns in care could be used to improve healthcare safety and quality, including the patient experience.
Historically, hospitals have relied on patient-initiated reporting via complaints or legal action as the main source of information regarding patient-perceived breakdowns in care. However, many patients are hesitant to speak up about problems or uncertain about how to report concerns.6-8 As a result, healthcare systems often only learn of the most severe breakdowns in care from a subset of activated patients, thus underestimating how widespread patient-perceived breakdowns are.
To overcome these limitations of patient-initiated reporting, hospitals could conduct outreach to patients to actively identify and learn about patient-perceived breakdowns in care. Potential benefits of outreach to patients include more reliable detection of patient-perceived breakdowns in care, identification of a broader range of types of breakdowns commonly experienced by patients, and recognition of problems in real-time when there is more opportunity for redress. Indeed, some hospitals have adopted active outreach programs such as structured nurse manager rounding or postdischarge phone calls.9
It is possible that outreach will not overcome patients’ reluctance to speak up, or patients may not share serious or actionable breakdowns. The manner in which outreach is conducted is likely to influence the information patients are willing to share. Prior studies examining patient perspectives of healthcare have primarily taken a structured approach with close-ended questions or a focus on specific aspects of care.1,10,11 Limited data collected using an open-ended approach suggest patient-perceived breakdowns in care may be very common.2,12,13 However, the impact of such breakdowns on patients has not been well characterized.
In order to design systems that can optimally detect patient-perceived breakdowns in care, additional information is needed to understand whether patients will report breakdowns in response to outreach programs, what types of problems they will report, and how these problems impact them. Understanding such issues will allow healthcare systems to respond to calls by federal health agencies to develop mechanisms for patients to report concerns about breakdowns in care, thereby providing truly patient-centered care.14 Therefore, we undertook this study with the overall goal of describing what may be learned from an open-ended outreach approach that directly asks patients about problems they have encountered during hospitalization. Specifically, we aim to (1) describe the types of problems reported by patients in response to this outreach approach and (2) characterize patients’ perceptions of the impact of these events.
METHODS
Setting
We conducted this study in 2 hospitals between June 2014 and February 2015. One participating hospital is a large, urban, tertiary care medical center serving a predominantly white (78%) patient population in Baltimore, Maryland. The second hospital is a large, inner city, tertiary care medical center serving a predominantly African-American (71%) patient population in Washington, DC.
Three medical-surgical units (MSUs) at each hospital participated. We selected MSUs because MSU patients interact with a variety of clinicians, often have long stays, and are at risk for adverse events. Hospitalists were part of the clinical care team in each of the participating units, serving either as the attending of record or by comanaging patients.
Patient Eligibility
Patients were potentially eligible if they were at least 18 years old, able to speak English or Spanish, and admitted to the hospital for more than 24 hours. Ineligibility criteria included the following: imminent discharge, observation (noninpatient) status, on hospice, on infection precautions (for inpatient interviews only), psychiatric or violence concerns, prisoner status, significant confusion, or inability to provide informed consent.
Eligible patients in each unit were randomized. Interviewers consecutively approached patients according to their random assignment. If a patient was not available, the interviewer proceeded to the next room. Interviewers returned to rooms of missed patients when possible. Recruitment in the unit ended when the recruitment target for that unit was achieved.
Interviewers
Five interviewers conducted interviews. One author (KS) provided interviewer training that included didactic instruction, observation, feedback, and modeling. Interviewers participated in weekly debriefing sessions. One interviewer speaks Spanish fluently and was able to conduct interviews in Spanish. Translator services were available for the other interviewers.
Interview Process
Interviews were conducted in person while the patients were hospitalized or via telephone 7 - 30 days postdischarge. A patient who had completed an interview while hospitalized was not eligible for a postdischarge telephone interview. Family members or friends present at the time of the interviews could also participate in addition to or in lieu of the patients with the patients’ assent. Interviewers obtained verbal, informed consent at the start of each interview.
The interview domains and sample questions were developed specifically for the current study and are listed in Table 1. The goal of the interview was to elicit the patient’s (or family member’s) perception of their care experiences and their perceptions of the consequences of any problems with their care. The interviewer sought to obtain sufficient detail to understand the patient’s concerns and to determine what, if any, action might be needed to remediate problems reported by patients. Interviewers captured patient responses by taking detailed notes on a case report form or by directly entering patient responses using a computer or iPad at the time of interview at the discretion of the interviewer.
We defined a patient-perceived breakdown as something that went wrong during the hospitalization according to the patient. If a patient-perceived breakdown in care was identified, the interviewer attempted to resolve the concern. Some breakdowns had occurred in the past, making further resolution impossible (eg, a long wait in the emergency department). Other breakdowns were active and addressable, such as the patient having clinical questions that had not been answered. In such cases, the interviewer attempted to address the patient’s concerns, typically by working with unit nursing staff. For patients interviewed postdischarge, the interviewer worked to resolve ongoing patient concerns with the assistance of the patient safety, quality, and compliance teams as needed. The interviewer provided a brief narrative summary of all interviews to unit nursing leadership within 24 hours. Positive comments were sent to leadership but not captured systematically for research purposes. Further details of the process of responding to patients’ concerns will be reported elsewhere. All data were entered into REDCap to facilitate data management and reporting.15
The MedStar Health Research Institute Institutional Review Board reviewed and approved this study.
Categorizing Patients’ Responses: The Patient Experience Coding Tool
Using directed content analysis,16 we deductively created the Patient Experience Coding Tool (PECT) in order to summarize the narrative information captured during the interviews and categorize patient-perceived breakdowns in care. First, we referred to our prior interviews of patients’ views on breakdowns in cancer care6 and surrogate decision-makers’ views on breakdowns in intensive care units13 to create the initial categories. We then applied the resultant framework to the interviews in the present study and refined the categories. This involved applying the categorization to an initial set of interviews to check the sufficiency of the coding categories. We clarified the scope of each category (ie, what types of events fit under each category) and created additional categories (eg, medication-related problems) to capture patient experiences that were not included in the initial framework.
We then coded each interview using the PECT. A minimum of 2 readers reviewed the narrative notes for each interview. The first reader provided an initial categorization; the second reader reviewed the narrative and confirmed or questioned the initial categorization to improve coding accuracy. If a reader was uncertain about the correct categorization, it was discussed by three readers until an agreement was achieved. Because facilities-related problems (eg, food or parking) fall outside the realm of provider-based hospital care, such comments were not the focus of the outreach efforts and were not consistently recorded. Therefore, they were not included in the PECT and are not reported here.
Analyses
We computed simple, descriptive statistics including the number and percentage of patients identifying at least one breakdown, as well as the number and percent reporting each type of breakdown. We also computed the number and percentage of patients reporting any harm and each type of harm. We computed the percentage of patients reporting at least 1 breakdown by hospital, type of interview (postdischarge vs inpatient), selected patient demographic characteristics (eg, gender, age, education, race), and interviewee (patient vs someone other than the patient interviewed or present during the interview) using the chi-square statistic to test the statistical significance of the resulting differences. All statistical analyses were performed using SPSS version 22.
RESULTS
A total of 979 outreach interviews were conducted. Of these, 349 were conducted via telephone postdischarge, and 630 were conducted in person during hospitalization. The average interview duration was 8.5 minutes for telephone interviews and 12.2 minutes for in-person interviews. Of the patients approached to participate, 67% completed an interview (61% in person, 83% via telephone). Patient characteristics are summarized in Table 2.
Overall, 386 of 979 interviewees (39.4%) believed they had experienced at least one breakdown in care. The types of patient-perceived breakdowns reported were categorized using the PECT and are summarized in Table 3 and the Figure. The most common concern involved information exchange. Approximately 1 in 10 patients (n = 105, 10.7%) felt that they had not received the information they needed when they needed it. Medication-related concerns were reported by 12.3% (n = 120) of interviewees and predominantly included concerns about what medications were being administered (5.7%) and inadequately treated pain (5.6%). Many of the patients expressing concerns about what medications were administered questioned why they were not receiving their outpatient medications or did not understand why a different medication was being administered, suggesting that many of these instances were related to breakdowns in communication as well. Other relatively common concerns were delays in the admissions process (reported by 9.2% of interviewees), poor team communication (reported by 6.6% of interviewees), healthcare providers with a rude or uncaring manner (reported by 6.3% of interviewees), and problems related to discharge (reported by 5.7% of interviewees).
Of the 386 interviewees who perceived a breakdown in care, 140 (36.3%) perceived harm associated with the event (Table 3). The most common harms were physical (eg, pain; n = 66) and emotional (eg, distress, worry; n = 60). In addition, patients reported instances of damage to relationships with providers (n = 28) resulting in a loss of trust, with participants citing breakdowns as a reason for not coming back to a particular hospital or provider. In other cases, patients believed that breakdowns in care resulted in the need for additional care or a prolonged hospital stay.
We found no difference between the 2 hospitals where the study was conducted in the percentage of interviewees reporting at least 1 breakdown (39.1% vs 39.9%, P = 0.80). We also found no difference between interview method, (ie, in person vs telephone; 40.6% vs 37.2%, respectively, P = 0.30), patient gender (40.6% and 38.8% for men and women, respectively, P = 0.57), race (41.0% and 36.8% for white and black or African-American, respectively, P = 0.20) or between interviewers (P = 0.37). We did identify differences in rates of reporting at least 1 breakdown in care related to age (45.4% of patients aged 60 years or younger vs 34.5% of patients older than 60 years, P < 0.001) and education (32.7% of patients with a high school education or less vs 46.8% of those with at least some college education, P < 0.001). Patients interviewed alone reported fewer breakdowns than if another person was present during the interview or was interviewed in lieu of the patient (37.8% vs 53.4%, P = 0.002). The rate of reporting breakdowns for patients interviewed alone in the hospital is very similar to the rates of those interviewed via telephone (37.8% vs 37.2%). For most types of breakdowns, there were no differences in reporting for in-person vs postdischarge interviews. Discharge-related problems were more frequently reported among patients interviewed postdischarge (8.9% postdischarge vs 4.0% in person, P = 0.002). Patients interviewed in person were more likely to report problems with information exchange compared to patients interviewed postdischarge (17.6% vs 13.5%, respectively; P = 0.09), although this did not reach statistical significance.
DISCUSSION
Through interviews with nearly 1000 patients, we have found that approximately 4 in 10 hospitalized patients believed they experienced a breakdown in care. Not only are patient-perceived breakdowns in care distressingly common, more than one-third of these events resulted in harm according to the patient. Patients reported a diverse range of breakdowns, including problems related to patient experience, as well as breakdowns in technical aspects of medical care. Collectively, these findings illustrate a striking need to identify and address these frequent and potentially harmful breakdowns.
Our findings are consistent with prior studies in which 20% to 50% of patients identified a problem during hospitalization. For example, Weingart et al. interviewed patients in a single general medical unit and found that 20% experienced an adverse event, near miss, or medical error, while nearly 40% experienced what was defined as a service quality incident.2,12 Of note, both our study and the study by Weingart et al. systematically elicited patients’ perspectives of breakdowns in care with explicit questions about problems or breakdowns in care.2,12 Because patients are often reluctant to speak up about problems in care,without such efforts to actively identify problems, providers and leaders are likely to be unaware of the majority of these concerns.6-8 These findings suggest that hospital-based providers should at least consider routinely asking patients about breakdowns in care to identify and respond to patients’ concerns.
Not only are patient-perceived breakdowns common, more than one-third of patients who experienced a breakdown considered it to be harmful. This suggests that our outreach approach identified predominantly nontrivial concerns. We adopted a broad definition of harm that includes emotional distress, damage to the relationship with providers, and life disruption. This differs from other studies examining patient reports of breakdowns in care, in which harm was restricted to physical injury.1,2 We consider this inclusive definition of harm to be a strength of the present study as it provides the most complete picture of the impact of such events on patients. This approach is supported by other studies demonstrating that patients place great emphasis on the psychological consequences of adverse events.17-19 Thus, it is clear from our work and other studies that nonphysical harm is important and warrants concerted efforts to address.
Patients in our study reported a variety of breakdowns, including breakdowns related to patient experience (eg, communication, relationship with providers) and technical aspects of healthcare delivery (eg, diagnosis, treatment). This is consistent with other studies examining patient perspectives of breakdowns in care. Weingart et al.found that hospitalized patients reported a broad range of problems, including adverse events, medical errors, communication breakdowns, and problems with food.2,12 This variety of events suggests a need for integration between the various hospital groups that handle patient-perceived breakdowns, including bedside providers, risk management, patient relations, patient advocates, and quality and safety groups, in order to provide a coordinated and effective response to the full spectrum of patient-perceived breakdowns in care.
Patients in our study were more likely to report breakdowns related to communication and relationships with providers than those related to technical aspects of care. Similarly, Kuzel et al.found that the most common problems cited by patients in the primary care setting were breakdowns in the clinician-patient relationship and access-related problems.17This is not surprising, as patients are likely to have more direct knowledge about communication and interpersonal relationships than about technical aspects of care.
We identified several factors associated with the likelihood of reporting a breakdown in care. Most strikingly, involving a friend or family member in the interview was strongly associated with reporting a breakdown. Other work has also suggested that patients’ friends and family members are an important source of information about safety concerns.20,21 In addition, several patient characteristics were associated with an increased likelihood of reporting a breakdown, including being younger and better educated. These findings highlight the importance of engaging patients’ friends and families in efforts to elicit patient concerns about healthcare, and they confirm recommendations for patients to bring a friend or family member to healthcare encounters.22 In addition, they illustrate the need to better understand how patient characteristics affect perceptions of breakdowns in care and their willingness to speak up, as this could inform efforts to target outreach to especially vulnerable patients.
A strength of this study is the number of interviews completed (almost 1000), which provides a diverse range of patient views and experiences, as evidenced by the demographic characteristics of participants. Interviews were conducted at two hospitals that differ substantially with regard to populations served, further enhancing the generalizability of our findings. Despite the large number of interviews and diverse patient characteristics, patients were drawn from only 3 units at 2 hospitals, which may limit generalizability.
We did not conduct medical record reviews to validate patients’ reports of problems, which may be viewed as a limitation. While such a comparison would be informative, the intent of the current study was to elicit patients’ perceptions of care, including aspects of care that are not typically captured in the medical record, such as communication. Other studies have demonstrated that patients’ reports of medical errors and adverse events tend to differ from providers’ reports of the same subjects.19,23 Therefore, we considered the patients’ perceptions of care to be a useful endpoint in and of itself. We did not determine the extent to which providers were already aware of patients’ concerns or whether they considered patients’ concerns valid. A related limitation is our inability to determine whether the differences we identified in the rates of breakdown reporting based on patient characteristics reflect differences in willingness to report or differences in experiences. Because we included patients in an MSU, it is possible that breakdowns were related to medical care, surgical care, or both. We did not follow patients longitudinally and therefore only captured harm perceived by a patient at the time of the interview. It is possible that patients may have experienced harm later in their hospitalization or following discharge that was not measured. Lastly, we did not measure interrater reliability of the interview coding and therefore do not present the PECT as a validated instrument. These important questions should be targeted for future study.
CONCLUSION
When directly asked about their experiences, almost 4 out of 10 hospitalized patients reported a breakdown in their care, many of which were perceived to be harmful. Not all hospitals will have the resources to implement the intensive approach used in this study to elicit patient-perceived breakdowns. Therefore, further work is needed to develop sustainable methods to overcome patients’ reluctance to report breakdowns in care. Engaging patients’ families and friends may be a particularly fruitful strategy. We offer the PECT as a tool that hospitals could use to summarize a variety of sources of patient feedback such as complaints, responses to surveys, and consumer reviews. Hospitals that effectively encourage patients and their family members to speak up about perceived breakdowns will identify many opportunities to address patient concerns, potentially leading to improved patient safety and experience.
1. Weissman JS, Schneider EC, Weingart SN, et al. Comparing patient-reported hospital adverse events with medical record review: Do patients know something that hospitals do not? Ann Intern Med. 2008;149(2):100-108. PubMed
2. Weingart SN, Pagovich O, Sands DZ, et al. What can hospitalized patients tell us about adverse events? learning from patient-reported incidents. J Gen Intern Med. 2005;20(9):830-836. PubMed
3. Wetzels R, Wolters R, van Weel C, Wensing M. Mix of methods is needed to identify adverse events in general practice: A prospective observational study. BMC Fam Pract. 2008;9:35. PubMed
4. Friedman SM, Provan D, Moore S, Hanneman K. Errors, near misses and adverse events in the emergency department: What can patients tell us? CJEM. 2008;10(5):421-427. PubMed
5. Iedema R, Allen S, Britton K, Gallagher TH. What do patients and relatives know about problems and failures in care? BMJ Qual Saf. 2012;21(3):198-205. PubMed
6. Mazor KM, Roblin DW, Greene SM, et al. Toward patient-centered cancer care: Patient perceptions of problematic events, impact, and response. J Clin Oncol. 2012;30(15):1784-1790. PubMed
7. Frosch DL, May SG, Rendle KA, Tietbohl C, Elwyn G. Authoritarian physicians and patients’ fear of being labeled ‘difficult’ among key obstacles to shared decision making. Health Aff (Millwood). 2012;31(5):1030-1038. PubMed
8. Entwistle VA, McCaughan D, Watt IS, et al. Speaking up about safety concerns: Multi-setting qualitative study of patients’ views and experiences. Qual Saf Health Care. 2010;19(6):e33. PubMed
9. Tan M, Lang D. Effectiveness of nurse leader rounding and post-discharge telephone calls in patient satisfaction: A systematic review. JBI database of systematic reviews and implementation reports. 2015;13(7):154-176. PubMed
10. Garbutt J, Bose D, McCawley BA, Burroughs T, Medoff G. Soliciting patient complaints to improve performance. Jt Comm J Qual Saf. 2003;29(3):103-112. PubMed
11. Agoritsas T, Bovier PA, Perneger TV. Patient reports of undesirable events during hospitalization. J Gen Intern Med. 2005;20(10):922-928. PubMed
12. Weingart SN, Pagovich O, Sands DZ, et al. Patient-reported service quality on a medicine unit. Int J Qual Health Care. 2006;18(2):95-101. PubMed
13. Fisher KA, Ahmad S, Jackson M, Mazor KM. Surrogate decision makers’ perspectives on preventable breakdowns in care among critically ill patients: A qualitative study. Patient Educ Couns. 2016;99(10):1685-1693. PubMed
14. Halpern MT, Roussel AE, Treiman K, Nerz PA, Hatlie MJ, Sheridan S. Designing consumer reporting systems for patient safety events. Final Report (Prepared by RTI International and Consumers Advancing Patient Safety under Contract No. 290-06-00001-5). AHRQ Publication No. 11-0060-EF. Rockville, MD: Agency for Healthcare Research and Quality; 2011.
15. Harris PA, Taylor R, Thielke R, Payne J, Gonzalez N, Conde JG. Research electronic data capture (REDCap)—A metadata-driven methodology and workflow process for providing translational research informatics support. J Biomed Inform. 2009;42(2):377-381. PubMed
16. Hsieh HF, Shannon SE. Three approaches to qualitative content analysis. Qual Health Res. 2005;15(9):1277-1288. PubMed
17. Kuzel AJ, Woolf SH, Gilchrist VJ, et al. Patient reports of preventable problems and harms in primary health care. Ann Fam Med. 2004;2(4):333-340. PubMed
18. Sokol-Hessner L, Folcarelli PH, Sands KE. Emotional harm from disrespect: The neglected preventable harm. BMJ Qual Saf. 2015;24(9):550-553. PubMed
19. Masso Guijarro P, Aranaz Andres JM, Mira JJ, Perdiguero E, Aibar C. Adverse events in hospitals: The patient’s point of view. Qual Saf Health Care. 2010;19(2):144-147. PubMed
20. Bardach NS, Lyndon A, Asteria-Penaloza R, Goldman LE, Lin GA, Dudley RA. From the closest observers of patient care: A thematic analysis of online narrative reviews of hospitals. BMJ Qual Saf. 2015. PubMed
21. Schneider EC, Ridgely MS, Quigley DD, et al. Developing and testing the health care safety hotline: A prototype consumer reporting system for patient safety events. Final Report (Prepared by RAND Corporation under contract HHSA2902010000171). Rockvelle, MD: Agency for Healthcare Research and Quality; May 2016.
22. Shekelle PG, Pronovost PJ, Wachter RM, et al. The top patient safety strategies that can be encouraged for adoption now. Ann Intern Med. 2013;158(5 Pt 2):365-368. PubMed
23. Lawton R, O’Hara JK, Sheard L, et al. Can staff and patient perspectives on hospital safety predict harm-free care? an analysis of staff and patient survey data and routinely collected outcomes. BMJ Qual Saf. 2015;24(6):369-376. PubMed
© 2017 Society of Hospital Medicine
Comparison of Methods to Define High Use of Inpatient Services Using Population-Based Data
As healthcare system use and costs continue to rise, increased importance has been placed on identifying the small subgroup of patients that drive this trend.1 It is estimated that 5% of healthcare users account for over 60% of healthcare spending.2-6 Furthermore, care for these “high users” is expensive due to an over-reliance on inpatient services. Approximately 40% of all health spending is for inpatient care, the largest single category of health spending, which is similarly skewed toward high users.1,3,5 Improving our understanding of this population may provide an opportunity to direct improvement efforts to a select group of patients with a potentially high benefit, as well as move care away from the costly inpatient setting.
However, the development of effective interventions to improve patient experience and outcomes while decreasing costs (referred to as the “Triple Aim” by the Institute for Health Improvement) for high users of inpatient services hinges on the methodology used to identify this high-risk population.7 There is substantial variability in definitions of high users; the most common definitions are based on the number of hospital encounters, days spent in the hospital, and hospital costs.8-15 Definitions have intrinsic differences in their implications around appropriateness, efficiency, and financial sustainability of inpatient resource use. Though the constructs underlying these definitions are highly variable, direct comparisons of differences in patient capture are limited.
A recent study from a single US center explored the clinical characteristics of hospital patients based on definitions of use vs cost and observed important differences in patients’ profiles and outcomes.12 While this suggests that the choice of definition may have major implications for whom to target (and the efficacy of any proposed interventions), this concept has not been explored at the population level. Therefore, we used population-based administrative data from a single-payer healthcare system to compare 3 common definitions of high inpatient service use and their influence on patient capture, health outcomes, and inpatient system burden.
METHODS
Data Sources and Study Population
We conducted a retrospective population-based study using administrative and clinical data for the province of Alberta, including the discharge abstracts database, physician claims, ambulatory care records, population health registry file, and aggregated data from the Canadian census.16 We identified all adults who had 1 or more hospitalizations with a discharge date between April 1, 2012, and March 31, 2013, though the admission date could be prior to April 1, 2012.
Definition of High-Inpatient Use
High-inpatient use was defined using 3 metrics: number of inpatient episodes, length of stay, and cost. As in prior studies, for each definition, individuals in the upper5th percentile of the relevant distribution were designated “high users,”2,15 while patients in the lower 95th percentile were considered “nonhigh users.” Patients could be defined as a high user in more than 1 definition.
Patients with 3 or more hospital episodes were defined as high users for the “number of inpatient episodes” definition. A hospital episode of care was defined as an event that resulted in discharge (or death) from an inpatient facility. If an individual was admitted to a hospital and transferred to another facility within 1 day of discharge, the hospitalizations were considered part of the same episode of care.
The “length of stay” definition refers to the cumulative number of days spent in an inpatient facility for all eligible episodes of care. Patients with 56 or more days in hospital during the study period were considered high users. Day of admission and discharge were considered full inpatient days, regardless of the time of admission and discharge.
The “cost” definition considered the cumulative estimated cost of every eligible episode of care. We estimated costs for each hospitalization using resource intensity weights (RIW). This is a relative weighted value for the average inpatient case after taking factors such as age, comorbidity, and procedures into account. The RIW for each episode was multiplied by the national average inpatient cost.17 Based on this definition, patients with a cumulative hospital cost of ≥ $63,597 were deemed high users. All costs were calculated in Canadian Dollars (CAD, $) and adjusted to 2013 dollars based on Statistics Canada’s Consumer Price Index.18
Demographic, Clinical, and Encounter Characteristics
Individual characteristics were measured using a combination of provincial administrative data sources. All measures were recorded as of the admission date of the first eligible hospitalization. Demographic characteristics included age, sex, First Nations status, urban/rural status (based on the individual’s residential postal code), and median neighborhood income quintile. Clinical characteristics included 28 comorbid conditions defined based on separate validated International Statistical Classification of Disease and Health Related Problems, Tenth Revision, Canada (ICD-10-CA) coding algorithms reported individually and cumulatively (categorized as 0, 1, 2–3, and 4+).19 Primary care attachment was defined as the percentage of all outpatient primary care visits made to a single practitioner in the 2-year period prior to their first hospitalization (among those with ≥3 visits). Attachment was categorized as 75%-100% (good attachment), 50%-74% (moderate attachment), or <50% (low attachment).20,21
We also identified hospital encounter-level characteristics. These included the most responsible diagnosis, admission category (elective or urgent/emergent), and discharge disposition for each hospital episode. Reported health outcomes included the proportion of patients with in-hospital mortality and those with at least one 30-day, all-cause readmission to hospital.
Analysis
Patient characteristics were described using proportions and means (standard deviation) as appropriate for high users and nonhigh users within and across each definition. Encounter characteristics were also described and stratified by age category (18-64 or 65+ years). Comparison of patient capture was then analyzed among patients who were high use by at least 1 definition. The overlap and agreement of the 3 definitions were compared using a Venn diagram and kappa statistic. The 10 most responsible diagnoses (based on frequency) were also compared across definitions and stratified by age.
Finally, the percentage of system burden accounted for by each measure was calculated as the amount used by high users divided by the total amount used by the entire study population (x 100). To assess the potential modifying effect of age, results were stratified by age category for each definition.
All analyses were conducted using Stata 11.2 (StataCorp LP, College Station, TX).22 The Conjoint Health Research Ethics Board of the University of Calgary approved this study and granted waiver of patient consent. This manuscript is written in accordance with reporting guidelines for studies conducted using observational routinely collected health data (RECORD statement).23
RESULTS
Comparison of Patient and Encounter-level Characterist
")
ics
")
A total of 219,106 adults had 283,204 inpatient episodes of care within the study timeframe. There were 12,707 (5.8%), 11,095 (5.1%), and 10,956 (5.0%) patients defined as high users based on number of inpatient episodes, length of stay, and cost, respectively (supplementary Figure 1). Regardless of definition, when compared to their non–high use counterparts, patients classified as high use were more likely to be male, older, in a lower median neighborhood income quintile, and have a higher level of comorbidity. Comparing across definitions of high use, those defined by number of inpatient episodes were more likely to be younger, live in rural areas, have better primary care attachment, and have fewer comorbidities, compared to the other definitions. High users by length of stay were more likely to be older and had a higher proportion of mental health–related comorbidities, including dementia and depression, as compared with the other definitions. Results were largely similar for those defined by cost (Table 1).
Encounter-level analyses
Comparison of Patient Capture and Inpatient Burden
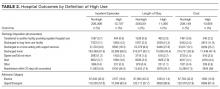
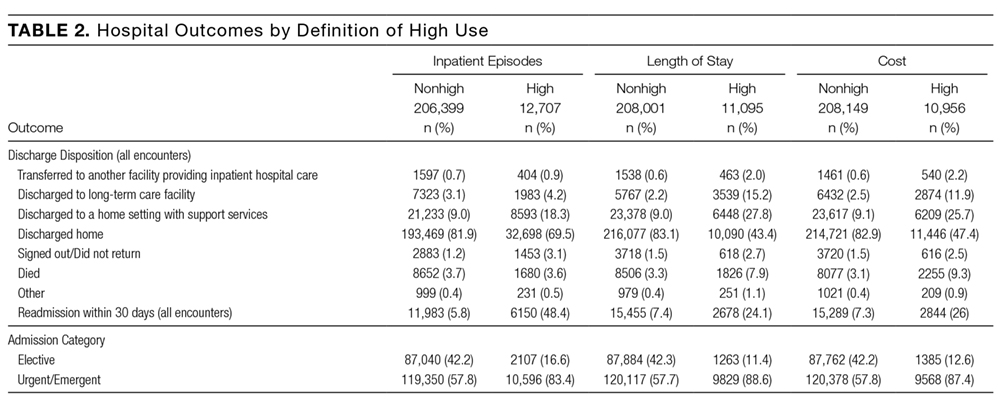
Of the 22,691 individuals who were defined as high use by at least 1 definition, 2,331 (10.3%) were consistently high use across all 3 definitions (kappa = 0.38; Figure 1). Of the 13,682 individuals classified as high use by at least 1 of length of stay or cost, 8369 (61.2%) were defined as high use by both definitions (kappa = 0.75). However, of the 12,707 defined as high use by the number of inpatient episodes, only 3698 (29.1%) were also defined as high use by another definition. Exploration of the most responsible diagnoses across definitions showed that congestive heart failure (2.8%-3.5%), chronic obstructive pulmonary disease (1.6%-3.2%), and dementia (0.6%-2.2%) were the most frequent. Acute medical conditions (eg, pneumonia [1.8%] or gastroenteritis [0.7%]) that may result in multiple shorter hospitalizations were observed at higher frequencies among high users defined by inpatient episodes, while conditions commonly requiring rehabilitation (eg, fracture [1.8%] and stroke [1.7%]) were more common among high users defined by length of stay and cost (supplementary Table 2). Stratification by age showed marked differences in the diagnoses across high-use definitions. Among hi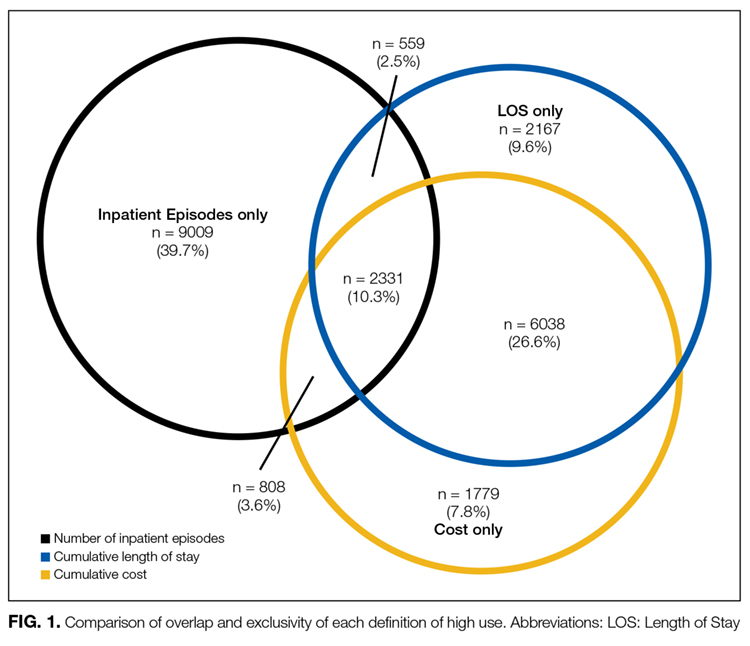
When assessing inpatient system burden, high users by number of inpatient episodes accounted for 47,044 (16.6%) of the 283,204 episodes. High users defined by length of stay accounted for 1,286,539 (46.4%) days of 2,773,561 total days, while high users defined by cost accumulated $1.4 billion (38.9%) of the estimated $3.7 billion in inpatient expenditures. High users defined by cost and length of stay each accounted for comparatively few episode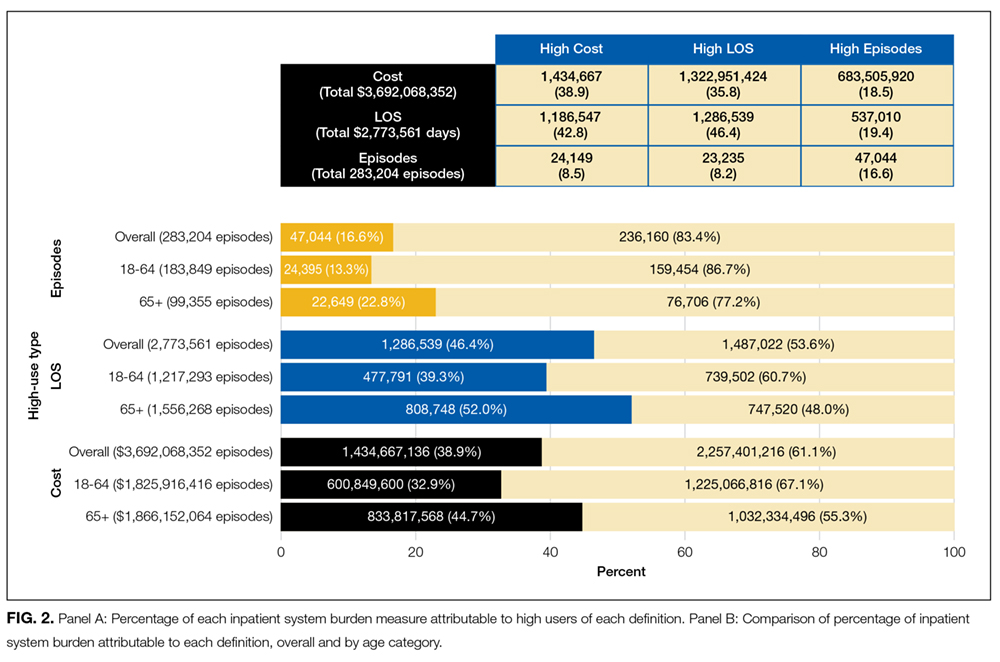
DISCUSSION
Using a large population-based cohort of all adults with at least 1 hospitalization in the province of Alberta, Canada, within a 12-month period, we compared 3 commonly used definitions of high inpatient use. The choice of definition had a substantial influence on the types of patients categorized as high use, as well as the proportion of total inpatient utilization that was associated with high users. The definition based on number of inpatient episodes captured a distinct population of high users, while the populations identified using cumulative length of stay or cost were similar.
Differences within and between definitions were especially apparent in age-stratified analyses: Greater length of stay or higher cost among patients aged 18-64 years identifies a large proportion of psychological conditions, while a greater number of inpatient episodes identifies acute conditions and childbirth or labor-related complications. Conversely, definitions based on length of stay and cost in the elderly (65+) identified groups with chronic conditions that result in progressive functional decline (often requiring increasing supportive services upon discharge) or conditions that require significant rehabilitation prior to discharge. Regarding inpatient system burden, high users defined by number of inpatient episodes accounted for a small proportion of total inpatient episodes, while high users defined by length of stay and cost accounted for nearly half of the accumulated hospital days and cost for each. These findings highlight the need for careful consideration of how high use is defined when studying high-user populations and implications for targeting subpopulations for intervention.
Our results add to those from previous studies. A US-based, single-center study of 2566 individuals compared definitions of high inpatient use based on cost and frequency of admission and found that patients defined by cost were predominantly hospitalized for surgical conditions, while those fulfilling the episode-based definition were often hospitalized for medical conditions.12 The most responsible diagnoses for patient hospitalizations in our study reflect this. We extended this comparison to consider the impact of age on outcomes and inpatient system burden and found that older age was also linked to poorer outcomes and increased burden. We also considered a third definition (cumulative length of stay), which provided another opportunity for comparison. The presence of chronic conditions requiring rehabilitation and possible alternate level of care days within our cohort highlights the utility of this length of stay-based approach when considering definitions. Although there were similarities between patients defined by length of stay and cost, partly due to cost being largely a function of length of stay, there were also important differences in their patient profiles. Those defined by cost tended to have conditions requiring surgical procedures not requiring extended in-hospital rehabilitation. Furthermore, the higher proportion of in-hospital mortality among those defined by cost may also reflect the fact that patients tend to accrue the majority of their healthcare expenditures during the final 120 days of life.24
Each definition of high use identified complex patients; however, the differences between the various types of high users identified by these definitions suggest that they are not interchangeable. Arguably, selection of the most appropriate definition should depend on the objective of measuring high users, particularly if an intervention is planned. Interventions for high users are complex, requiring both medical and nonmedical components. The current literature in this area has often focused on case management programs, collaboration with community-based social support programs, and improving coordination and transitions of care.25-27 While many of these approaches require considerable involvement outside of the inpatient setting, these interventions can be informed by defining who high users of inpatient services are. Our findings show several possible subgroups of high users, which could be targeted for intervention. For example, an inpatient episode-based definition, which identifies patients with frequent encounters for acute conditions (eg, pneumonia and urinary tract infections), would be informative if an intervention targeted reductions in inpatient use and readmission rates. Alternatively, an intervention designed to improve community-based mental health programs would best be informed by a definition based on length of stay in which high users with underlying mental health conditions were prevalent. Such interventions are rarely mutually exclusive and require multiple perspectives to inform their objectives. A well-designed intervention will not only address the medical characteristics of high users but also the social determinants of health that place patients at risk of high inpatient use.
Our study should be interpreted in light of its limitations. First, measures of disease severity were not available to further characterize similarities and differences across high-use groups. Furthermore, we were unable to account for other social determinants of health that may be relevant to inpatient system usage. Second, direct cost of hospitalizations was estimated based on RIW and is thus reflective of expected rather than actual costs. However, this will have minimal impact on capture, as patients defined by this metric require substantial costs to be included in the top fifth percentile, and thus deviations in individual hospitalization costs will have minimal influence on the cumulative cost. Finally, while inpatient spending makes up a large proportion of healthcare spending, there is likely a number of different high-use profiles found outside of the acute care setting. Despite these limitations, our study includes several key strengths. The use of population-level data allows for analysis that is robust and more generalizable than studies from single centers. Additionally, the comparison of 3 independent definitions allows for a greater comparison of the nuances of each definition. Our study also considers the important impact of age as an effect modifier of inpatient use in the general population and identifies distinct patient profiles that exist across each definition.
CONCLUSIONS
Definitions of high use of inpatient services based on number of inpatient episodes, days spent in hospital, and total hospital costs identify patient populations with different characteristics and differ substantially in their impact on health outcomes and inpatient burden. These results highlight the need for careful consideration of the context of the study or intervention and the implications of selecting a specific definition of high inpatient use at study conception. Ultimately, the performance of an intervention in high-use populations is likely to be conditional on the fit of the patient population generated by the chosen definition of high inpatient use to the objectives of a study.
Acknowledgments
This study is based in part on data provided by Alberta Health and Alberta Health Services. The interpretation and conclusions are those of the researchers and do not represent the views of the Government of Alberta. Neither the Government of Alberta nor Alberta Health express any opinion in relation to this study.
Disclosure
Dr. Hemmelgarn is supported by the Roy and Vi Baay Chair in Kidney Research. Dr. Manns is supported by the Svare Professorship in Health Economics and by a Health Scholar Award by Alberta Innovates Health Solutions (AIHS). Dr. Tonelli is supported by the David Freeze chair in Health Services Research. The Interdisciplinary Chronic Disease Collaboration is funded by AIHS—Collaborative Research and Innovation Opportunity (CRIO) Team Grants Program.
1. National Health Expenditure Trends, 1975 to 2015. Canadian Institute for Health Information. 2015. https://secure.cihi.ca/free_products/nhex_trends_narrative_report_2015_en.pdf. Accessed on June 23, 2016.
2. Berk ML, Monheit AC. The concentration of health care expenditures, revisited. Health Aff (Millwood). 2001;20:9-18. PubMed
3. Wodchis WP, Austin PC, Henry DA. A 3-year study of high-cost users of health care. CMAJ. 2016;188(3):182-188. PubMed
4. Forget EL, Roos LL, Deber RB, Wald R. Variations in Lifetime Healthcare Costs across a Population. Healthc Policy. 2008;4:e148-e167. PubMed
5. Joynt KE, Gawande AA, Orav EJ, Jha AK. Contribution of preventable acute care spending to total spending for high-cost Medicare patients. JAMA. 2013;309:2572-2578. PubMed
6. Riley GF. Long-term trends in the concentration of Medicare spending. Health Aff (Millwood). 2007;26:808-816. PubMed
7. IHI Triple Aim Initiative. Institute for Healthcare Improvement. 2015. http://www.ihi.org/engage/initiatives/TripleAim/Pages/default.aspx. Accessed on June 17, 2016.
8. Johansen H, Nair C, Bond J. Who goes to the hospital? An investigation of high users of hospital days. Health Reports. 1994;6(2):253-277. PubMed
9. Conwell LJ, Cohen JW. Characteristics of persons with high medical expenditures in the US civilian noninstitutionalized population. MEPS Statistical Brief# 73. 2002.
10. Lemstra M, Mackenbach J, Neudorf C, Nannapaneni U. High health care utilization and costs associated with lower socio-economic status: Results from a linked dataset. CJPH. 2009;100(3):180-183. PubMed
11. Macnee CL, McCabe S, Clarke PN, Fiske M, Campbell S. Typology of high users of health services among a rural medicaid population. Pub Health Nurs. 2009;26(5):396-404. PubMed
12. Nguyen OK, Tang N, Hillman JM, Gonzales R. What’s cost got to do with it? Association between hospital costs and frequency of admissions among “high users” of hospital care. J. Hosp Med. 2013;8(12):665-671. PubMed
13. Rosella LC, Fitzpatrick T, Wodchis WP, Calzavara A, Manson H, Goel V. High-cost health care users in Ontario, Canada: Demographic, socio-economic, and health status characteristics. BMC Health Serv Res. 2014;14(1):532. PubMed
14. Cohen SB. The Concentration of Health Care Expenditures and Related Expenses for Costly Medical Conditions, 2009. Agency for Healthcare Research and Quality Statistical Brief #359; 2012.
15. Ronksley PE, McKay JA, Kobewka DM, Mulpuru S, Forster AJ. Patterns of health care use in a high-cost inpatient population in Ottawa, Ontario: A retrospective observational study. CMAJ Open. 2015; 3:E111-E118. PubMed
16. Hemmelgarn BR, Clement F, Manns BJ, et al. Overview of the Alberta Kidney Disease Network. BMC Nephrol. 2009;10:30. PubMed
17. DAD Resource Intensity Weights and Expected Length of Stay. Canadian Institute for Health Information. 2016. https://www.cihi.ca/en/data-and-standards/standards/case-mix/resource-indicators-dad-resource-intensity-weights-and. Accessed on June 24, 2016.
18. Statistics Canada. The Canadian Consumer Price Index Reference Paper, Statistics Canada Catalogue no. 62-553-X.
19. Tonelli M, Wiebe N, Fortin M, et al. Methods for identifying 30 chronic conditions: Application to administrative data. BMC Med Inform Decis Mak. 2015;17:15(1):1. PubMed
20. Jaakkimainen RL, Klein-Geltink J, Guttmann A, Barnsley J, Jagorski B, Kopp A. Indicators of primary care based on administrative data. In Primary Care in Ontario: ICES Atlas. Toronto, Ontario: Institute for Clinical Evaluative Sciences; 2006.
21. Jee SH, Cabana MD. Indices for continuity of care: A systematic review of the literature. Med Care Res Rev. 2006;63:158-188. PubMed
22. Stata Statistical Software: Release 11. College Station, TX: StataCorp LP. 2009.
23. Benchimol EI, Smeeth L, Guttmann A, et al. The REporting of studies Conducted using Observational Routinely-collected health Data (RECORD) statement. PLoS Med. 2015;12(10):e1001885. PubMed
24. Tanuseputro P, Wodchis WP, Fowler R, et al. The health care cost of dying: A population-based retrospective cohort study of the last year of life in ontario, canada. PLoS One. 2015;10(3):e0121759. PubMed
25. Hong CS, Siegel AL, Ferris TG. Caring for high-need, high-cost patients: What makes for a successful care management program? Issue Brief (Commonw Fund). 2014;19:1-19. PubMed
26. Birnbaum M, Halper DE. Rethinking service delivery for high-cost Medicaid patients. Medicaid Institute. 2009. http://shnny.org/research/rethinking-service-delivery-for-high-cost-medicaid-patients/. Accessed on Jan 11, 2017.
27. Pan-Canadian forum on high users of health care. Canadian Institute for Health Information. 2014. https://secure.cihi.ca/free_products/highusers_summary_report_revised_EN_web.pdf. Accessed on Jan 11, 2017.
As healthcare system use and costs continue to rise, increased importance has been placed on identifying the small subgroup of patients that drive this trend.1 It is estimated that 5% of healthcare users account for over 60% of healthcare spending.2-6 Furthermore, care for these “high users” is expensive due to an over-reliance on inpatient services. Approximately 40% of all health spending is for inpatient care, the largest single category of health spending, which is similarly skewed toward high users.1,3,5 Improving our understanding of this population may provide an opportunity to direct improvement efforts to a select group of patients with a potentially high benefit, as well as move care away from the costly inpatient setting.
However, the development of effective interventions to improve patient experience and outcomes while decreasing costs (referred to as the “Triple Aim” by the Institute for Health Improvement) for high users of inpatient services hinges on the methodology used to identify this high-risk population.7 There is substantial variability in definitions of high users; the most common definitions are based on the number of hospital encounters, days spent in the hospital, and hospital costs.8-15 Definitions have intrinsic differences in their implications around appropriateness, efficiency, and financial sustainability of inpatient resource use. Though the constructs underlying these definitions are highly variable, direct comparisons of differences in patient capture are limited.
A recent study from a single US center explored the clinical characteristics of hospital patients based on definitions of use vs cost and observed important differences in patients’ profiles and outcomes.12 While this suggests that the choice of definition may have major implications for whom to target (and the efficacy of any proposed interventions), this concept has not been explored at the population level. Therefore, we used population-based administrative data from a single-payer healthcare system to compare 3 common definitions of high inpatient service use and their influence on patient capture, health outcomes, and inpatient system burden.
METHODS
Data Sources and Study Population
We conducted a retrospective population-based study using administrative and clinical data for the province of Alberta, including the discharge abstracts database, physician claims, ambulatory care records, population health registry file, and aggregated data from the Canadian census.16 We identified all adults who had 1 or more hospitalizations with a discharge date between April 1, 2012, and March 31, 2013, though the admission date could be prior to April 1, 2012.
Definition of High-Inpatient Use
High-inpatient use was defined using 3 metrics: number of inpatient episodes, length of stay, and cost. As in prior studies, for each definition, individuals in the upper5th percentile of the relevant distribution were designated “high users,”2,15 while patients in the lower 95th percentile were considered “nonhigh users.” Patients could be defined as a high user in more than 1 definition.
Patients with 3 or more hospital episodes were defined as high users for the “number of inpatient episodes” definition. A hospital episode of care was defined as an event that resulted in discharge (or death) from an inpatient facility. If an individual was admitted to a hospital and transferred to another facility within 1 day of discharge, the hospitalizations were considered part of the same episode of care.
The “length of stay” definition refers to the cumulative number of days spent in an inpatient facility for all eligible episodes of care. Patients with 56 or more days in hospital during the study period were considered high users. Day of admission and discharge were considered full inpatient days, regardless of the time of admission and discharge.
The “cost” definition considered the cumulative estimated cost of every eligible episode of care. We estimated costs for each hospitalization using resource intensity weights (RIW). This is a relative weighted value for the average inpatient case after taking factors such as age, comorbidity, and procedures into account. The RIW for each episode was multiplied by the national average inpatient cost.17 Based on this definition, patients with a cumulative hospital cost of ≥ $63,597 were deemed high users. All costs were calculated in Canadian Dollars (CAD, $) and adjusted to 2013 dollars based on Statistics Canada’s Consumer Price Index.18
Demographic, Clinical, and Encounter Characteristics
Individual characteristics were measured using a combination of provincial administrative data sources. All measures were recorded as of the admission date of the first eligible hospitalization. Demographic characteristics included age, sex, First Nations status, urban/rural status (based on the individual’s residential postal code), and median neighborhood income quintile. Clinical characteristics included 28 comorbid conditions defined based on separate validated International Statistical Classification of Disease and Health Related Problems, Tenth Revision, Canada (ICD-10-CA) coding algorithms reported individually and cumulatively (categorized as 0, 1, 2–3, and 4+).19 Primary care attachment was defined as the percentage of all outpatient primary care visits made to a single practitioner in the 2-year period prior to their first hospitalization (among those with ≥3 visits). Attachment was categorized as 75%-100% (good attachment), 50%-74% (moderate attachment), or <50% (low attachment).20,21
We also identified hospital encounter-level characteristics. These included the most responsible diagnosis, admission category (elective or urgent/emergent), and discharge disposition for each hospital episode. Reported health outcomes included the proportion of patients with in-hospital mortality and those with at least one 30-day, all-cause readmission to hospital.
Analysis
Patient characteristics were described using proportions and means (standard deviation) as appropriate for high users and nonhigh users within and across each definition. Encounter characteristics were also described and stratified by age category (18-64 or 65+ years). Comparison of patient capture was then analyzed among patients who were high use by at least 1 definition. The overlap and agreement of the 3 definitions were compared using a Venn diagram and kappa statistic. The 10 most responsible diagnoses (based on frequency) were also compared across definitions and stratified by age.
Finally, the percentage of system burden accounted for by each measure was calculated as the amount used by high users divided by the total amount used by the entire study population (x 100). To assess the potential modifying effect of age, results were stratified by age category for each definition.
All analyses were conducted using Stata 11.2 (StataCorp LP, College Station, TX).22 The Conjoint Health Research Ethics Board of the University of Calgary approved this study and granted waiver of patient consent. This manuscript is written in accordance with reporting guidelines for studies conducted using observational routinely collected health data (RECORD statement).23
RESULTS
Comparison of Patient and Encounter-level Characterist
ics
A total of 219,106 adults had 283,204 inpatient episodes of care within the study timeframe. There were 12,707 (5.8%), 11,095 (5.1%), and 10,956 (5.0%) patients defined as high users based on number of inpatient episodes, length of stay, and cost, respectively (supplementary Figure 1). Regardless of definition, when compared to their non–high use counterparts, patients classified as high use were more likely to be male, older, in a lower median neighborhood income quintile, and have a higher level of comorbidity. Comparing across definitions of high use, those defined by number of inpatient episodes were more likely to be younger, live in rural areas, have better primary care attachment, and have fewer comorbidities, compared to the other definitions. High users by length of stay were more likely to be older and had a higher proportion of mental health–related comorbidities, including dementia and depression, as compared with the other definitions. Results were largely similar for those defined by cost (Table 1).
Encounter-level analyses
Comparison of Patient Capture and Inpatient Burden
Of the 22,691 individuals who were defined as high use by at least 1 definition, 2,331 (10.3%) were consistently high use across all 3 definitions (kappa = 0.38; Figure 1). Of the 13,682 individuals classified as high use by at least 1 of length of stay or cost, 8369 (61.2%) were defined as high use by both definitions (kappa = 0.75). However, of the 12,707 defined as high use by the number of inpatient episodes, only 3698 (29.1%) were also defined as high use by another definition. Exploration of the most responsible diagnoses across definitions showed that congestive heart failure (2.8%-3.5%), chronic obstructive pulmonary disease (1.6%-3.2%), and dementia (0.6%-2.2%) were the most frequent. Acute medical conditions (eg, pneumonia [1.8%] or gastroenteritis [0.7%]) that may result in multiple shorter hospitalizations were observed at higher frequencies among high users defined by inpatient episodes, while conditions commonly requiring rehabilitation (eg, fracture [1.8%] and stroke [1.7%]) were more common among high users defined by length of stay and cost (supplementary Table 2). Stratification by age showed marked differences in the diagnoses across high-use definitions. Among hi
When assessing inpatient system burden, high users by number of inpatient episodes accounted for 47,044 (16.6%) of the 283,204 episodes. High users defined by length of stay accounted for 1,286,539 (46.4%) days of 2,773,561 total days, while high users defined by cost accumulated $1.4 billion (38.9%) of the estimated $3.7 billion in inpatient expenditures. High users defined by cost and length of stay each accounted for comparatively few episode
DISCUSSION
Using a large population-based cohort of all adults with at least 1 hospitalization in the province of Alberta, Canada, within a 12-month period, we compared 3 commonly used definitions of high inpatient use. The choice of definition had a substantial influence on the types of patients categorized as high use, as well as the proportion of total inpatient utilization that was associated with high users. The definition based on number of inpatient episodes captured a distinct population of high users, while the populations identified using cumulative length of stay or cost were similar.
Differences within and between definitions were especially apparent in age-stratified analyses: Greater length of stay or higher cost among patients aged 18-64 years identifies a large proportion of psychological conditions, while a greater number of inpatient episodes identifies acute conditions and childbirth or labor-related complications. Conversely, definitions based on length of stay and cost in the elderly (65+) identified groups with chronic conditions that result in progressive functional decline (often requiring increasing supportive services upon discharge) or conditions that require significant rehabilitation prior to discharge. Regarding inpatient system burden, high users defined by number of inpatient episodes accounted for a small proportion of total inpatient episodes, while high users defined by length of stay and cost accounted for nearly half of the accumulated hospital days and cost for each. These findings highlight the need for careful consideration of how high use is defined when studying high-user populations and implications for targeting subpopulations for intervention.
Our results add to those from previous studies. A US-based, single-center study of 2566 individuals compared definitions of high inpatient use based on cost and frequency of admission and found that patients defined by cost were predominantly hospitalized for surgical conditions, while those fulfilling the episode-based definition were often hospitalized for medical conditions.12 The most responsible diagnoses for patient hospitalizations in our study reflect this. We extended this comparison to consider the impact of age on outcomes and inpatient system burden and found that older age was also linked to poorer outcomes and increased burden. We also considered a third definition (cumulative length of stay), which provided another opportunity for comparison. The presence of chronic conditions requiring rehabilitation and possible alternate level of care days within our cohort highlights the utility of this length of stay-based approach when considering definitions. Although there were similarities between patients defined by length of stay and cost, partly due to cost being largely a function of length of stay, there were also important differences in their patient profiles. Those defined by cost tended to have conditions requiring surgical procedures not requiring extended in-hospital rehabilitation. Furthermore, the higher proportion of in-hospital mortality among those defined by cost may also reflect the fact that patients tend to accrue the majority of their healthcare expenditures during the final 120 days of life.24
Each definition of high use identified complex patients; however, the differences between the various types of high users identified by these definitions suggest that they are not interchangeable. Arguably, selection of the most appropriate definition should depend on the objective of measuring high users, particularly if an intervention is planned. Interventions for high users are complex, requiring both medical and nonmedical components. The current literature in this area has often focused on case management programs, collaboration with community-based social support programs, and improving coordination and transitions of care.25-27 While many of these approaches require considerable involvement outside of the inpatient setting, these interventions can be informed by defining who high users of inpatient services are. Our findings show several possible subgroups of high users, which could be targeted for intervention. For example, an inpatient episode-based definition, which identifies patients with frequent encounters for acute conditions (eg, pneumonia and urinary tract infections), would be informative if an intervention targeted reductions in inpatient use and readmission rates. Alternatively, an intervention designed to improve community-based mental health programs would best be informed by a definition based on length of stay in which high users with underlying mental health conditions were prevalent. Such interventions are rarely mutually exclusive and require multiple perspectives to inform their objectives. A well-designed intervention will not only address the medical characteristics of high users but also the social determinants of health that place patients at risk of high inpatient use.
Our study should be interpreted in light of its limitations. First, measures of disease severity were not available to further characterize similarities and differences across high-use groups. Furthermore, we were unable to account for other social determinants of health that may be relevant to inpatient system usage. Second, direct cost of hospitalizations was estimated based on RIW and is thus reflective of expected rather than actual costs. However, this will have minimal impact on capture, as patients defined by this metric require substantial costs to be included in the top fifth percentile, and thus deviations in individual hospitalization costs will have minimal influence on the cumulative cost. Finally, while inpatient spending makes up a large proportion of healthcare spending, there is likely a number of different high-use profiles found outside of the acute care setting. Despite these limitations, our study includes several key strengths. The use of population-level data allows for analysis that is robust and more generalizable than studies from single centers. Additionally, the comparison of 3 independent definitions allows for a greater comparison of the nuances of each definition. Our study also considers the important impact of age as an effect modifier of inpatient use in the general population and identifies distinct patient profiles that exist across each definition.
CONCLUSIONS
Definitions of high use of inpatient services based on number of inpatient episodes, days spent in hospital, and total hospital costs identify patient populations with different characteristics and differ substantially in their impact on health outcomes and inpatient burden. These results highlight the need for careful consideration of the context of the study or intervention and the implications of selecting a specific definition of high inpatient use at study conception. Ultimately, the performance of an intervention in high-use populations is likely to be conditional on the fit of the patient population generated by the chosen definition of high inpatient use to the objectives of a study.
Acknowledgments
This study is based in part on data provided by Alberta Health and Alberta Health Services. The interpretation and conclusions are those of the researchers and do not represent the views of the Government of Alberta. Neither the Government of Alberta nor Alberta Health express any opinion in relation to this study.
Disclosure
Dr. Hemmelgarn is supported by the Roy and Vi Baay Chair in Kidney Research. Dr. Manns is supported by the Svare Professorship in Health Economics and by a Health Scholar Award by Alberta Innovates Health Solutions (AIHS). Dr. Tonelli is supported by the David Freeze chair in Health Services Research. The Interdisciplinary Chronic Disease Collaboration is funded by AIHS—Collaborative Research and Innovation Opportunity (CRIO) Team Grants Program.
1. National Health Expenditure Trends, 1975 to 2015. Canadian Institute for Health Information. 2015. https://secure.cihi.ca/free_products/nhex_trends_narrative_report_2015_en.pdf. Accessed on June 23, 2016.
2. Berk ML, Monheit AC. The concentration of health care expenditures, revisited. Health Aff (Millwood). 2001;20:9-18. PubMed
3. Wodchis WP, Austin PC, Henry DA. A 3-year study of high-cost users of health care. CMAJ. 2016;188(3):182-188. PubMed
4. Forget EL, Roos LL, Deber RB, Wald R. Variations in Lifetime Healthcare Costs across a Population. Healthc Policy. 2008;4:e148-e167. PubMed
5. Joynt KE, Gawande AA, Orav EJ, Jha AK. Contribution of preventable acute care spending to total spending for high-cost Medicare patients. JAMA. 2013;309:2572-2578. PubMed
6. Riley GF. Long-term trends in the concentration of Medicare spending. Health Aff (Millwood). 2007;26:808-816. PubMed
7. IHI Triple Aim Initiative. Institute for Healthcare Improvement. 2015. http://www.ihi.org/engage/initiatives/TripleAim/Pages/default.aspx. Accessed on June 17, 2016.
8. Johansen H, Nair C, Bond J. Who goes to the hospital? An investigation of high users of hospital days. Health Reports. 1994;6(2):253-277. PubMed
9. Conwell LJ, Cohen JW. Characteristics of persons with high medical expenditures in the US civilian noninstitutionalized population. MEPS Statistical Brief# 73. 2002.
10. Lemstra M, Mackenbach J, Neudorf C, Nannapaneni U. High health care utilization and costs associated with lower socio-economic status: Results from a linked dataset. CJPH. 2009;100(3):180-183. PubMed
11. Macnee CL, McCabe S, Clarke PN, Fiske M, Campbell S. Typology of high users of health services among a rural medicaid population. Pub Health Nurs. 2009;26(5):396-404. PubMed
12. Nguyen OK, Tang N, Hillman JM, Gonzales R. What’s cost got to do with it? Association between hospital costs and frequency of admissions among “high users” of hospital care. J. Hosp Med. 2013;8(12):665-671. PubMed
13. Rosella LC, Fitzpatrick T, Wodchis WP, Calzavara A, Manson H, Goel V. High-cost health care users in Ontario, Canada: Demographic, socio-economic, and health status characteristics. BMC Health Serv Res. 2014;14(1):532. PubMed
14. Cohen SB. The Concentration of Health Care Expenditures and Related Expenses for Costly Medical Conditions, 2009. Agency for Healthcare Research and Quality Statistical Brief #359; 2012.
15. Ronksley PE, McKay JA, Kobewka DM, Mulpuru S, Forster AJ. Patterns of health care use in a high-cost inpatient population in Ottawa, Ontario: A retrospective observational study. CMAJ Open. 2015; 3:E111-E118. PubMed
16. Hemmelgarn BR, Clement F, Manns BJ, et al. Overview of the Alberta Kidney Disease Network. BMC Nephrol. 2009;10:30. PubMed
17. DAD Resource Intensity Weights and Expected Length of Stay. Canadian Institute for Health Information. 2016. https://www.cihi.ca/en/data-and-standards/standards/case-mix/resource-indicators-dad-resource-intensity-weights-and. Accessed on June 24, 2016.
18. Statistics Canada. The Canadian Consumer Price Index Reference Paper, Statistics Canada Catalogue no. 62-553-X.
19. Tonelli M, Wiebe N, Fortin M, et al. Methods for identifying 30 chronic conditions: Application to administrative data. BMC Med Inform Decis Mak. 2015;17:15(1):1. PubMed
20. Jaakkimainen RL, Klein-Geltink J, Guttmann A, Barnsley J, Jagorski B, Kopp A. Indicators of primary care based on administrative data. In Primary Care in Ontario: ICES Atlas. Toronto, Ontario: Institute for Clinical Evaluative Sciences; 2006.
21. Jee SH, Cabana MD. Indices for continuity of care: A systematic review of the literature. Med Care Res Rev. 2006;63:158-188. PubMed
22. Stata Statistical Software: Release 11. College Station, TX: StataCorp LP. 2009.
23. Benchimol EI, Smeeth L, Guttmann A, et al. The REporting of studies Conducted using Observational Routinely-collected health Data (RECORD) statement. PLoS Med. 2015;12(10):e1001885. PubMed
24. Tanuseputro P, Wodchis WP, Fowler R, et al. The health care cost of dying: A population-based retrospective cohort study of the last year of life in ontario, canada. PLoS One. 2015;10(3):e0121759. PubMed
25. Hong CS, Siegel AL, Ferris TG. Caring for high-need, high-cost patients: What makes for a successful care management program? Issue Brief (Commonw Fund). 2014;19:1-19. PubMed
26. Birnbaum M, Halper DE. Rethinking service delivery for high-cost Medicaid patients. Medicaid Institute. 2009. http://shnny.org/research/rethinking-service-delivery-for-high-cost-medicaid-patients/. Accessed on Jan 11, 2017.
27. Pan-Canadian forum on high users of health care. Canadian Institute for Health Information. 2014. https://secure.cihi.ca/free_products/highusers_summary_report_revised_EN_web.pdf. Accessed on Jan 11, 2017.
© 2017 Society of Hospital Medicine
Symptoms Mimicking Those of Hypokalemic Periodic Paralysis Induced by Soluble Barium Poisoning
Hypokalemic periodic paralysis (HPP) is a relatively common and potentially life-threating condition that can be either sporadic or recurring and has both inherited and acquired causes.1 Familial HPP, on the other hand, is a rare condition (1:100,000) caused by loss of function mutations leading to the disruption of membrane potential consequently making them inexcitable.2 Appearance of symptoms is typically in the first or second decade of life (60% of cases have onset aged < 16 years) with susceptible individuals experiencing sudden onset of perioral numbness; weakness; centrifugal paralysis, often with nausea; vomiting and diarrhea; and prostration, usually triggered by highcarbohydrate meals and rest following sustained muscle-group use.3
These symptoms are common to all forms of HPP, making the differential diagnosis wide and confusing. Rhabdomyolysis is occasionally associated with many severe hypokalemic episodes.4 Myopathy and permanent muscle weakness have been reported in HPP.5,6 Other reported inciting factors include a drop in serum potassium caused by β-adrenergic bronchodilator treatment.7 Clinical attacks also have been associated with diabetic ketoacidosis and combined hypokalemia and hypophosphatemia.8 Thyrotoxicosis also causes similar muscle action potential changes but only when hyperthyroidism is uncorrected. 9-12 Less commonly, hypothyroidism has been reported to be associated with hypokalemic paralysis.3
Pa Ping, a condition involving hypokalemic paralysis of uncertain etiology, is geographically centered in the Szechuan region of China.13 Cases of Bartter, Liddle, and Gitelman syndromes also have been associated with hypokalemic paralysis.3,14 There is an association with malignant hyperthermia following or during systemic anesthesia. Patients presenting as Guillain-Barré syndrome have been found to have periodic paralysis triggered by hypokalemia from any cause.15 Sjögren syndrome and renal tubular acidosis also are reported to have triggered symptoms of hypokalemic paralysis.16,17
True type 1 HPP is caused by channelopathies resulting from mutations in the calcium channel gene CACN1AS (HypoPP1), which accounts for 70% of the cases, whereas type 2 HPP is cause by sodium channel gene SCN4A (HypoPP2) mutations, which accounts for 10% to 20% of cases.18,19 An association with a voltage-gated potassium channel KCNE3 mutation has been made but is disputed.20,21 Females typically have less severe and less frequent attacks, and attacks lessen or disappear during pregnancy.22
In a small controlled trial, acetazolamide has been reported to have prophylactic benefit, although a more powerful carbonic anhydrase inhibitor, dichlorophenamide, was reported to be effective in a study after acetazolamide had become ineffective.23,24 These treatments would not be expected to be of clinical use in hypokalemia due to barium poisoning.
Barium poisoning has been reported as a result of accidental contamination of foodstuffs with soluble barium.25 Onset of symptoms is rapid, with nausea, vomiting, diarrhea, and malaise followed rapidly by weakness, which can include the muscles of respiration. This littleconsidered but rapidly lethal poisoning event can be accidental as a result of environmental exposure due to unintentional ingestion of the toxin or deliberate criminal poisoning as in this case. Because deliberate poisoning rarely crosses the mind of the clinician, awareness of the potential similarity of barium poisoning to other forms of HPP and even familial HPP is important.
Case Presentation
A male veteran aged 45 years when treated by the authors was well until moving into a new rural home when he began to experience acute episodes of variable perioral numbness, diarrhea, paresthesias, abdominal cramping, and weakness, which ranged from mild, self-terminating extremity weakness to 3 episodes of respiratory failure that required intubation and mechanical ventilation.
All episodes were accompanied by hypokalemia in the range of 2 to 3 mEq/L, but levels varied erratically during admissions from severe hypokalemia to normo- and hyperkalemia. Over 3 years, the patient was admitted to the hospital 19 times, underwent extensive workup, and was referred to endocrinology services at Duke University, Vanderbilt University, and the Cleveland Clinic. Diagnostic efforts centered on establishing whether he had a latepresenting variant of familial HPP.
Genetic evaluations could not identify known single-nucleotide polymorphisms associated with that condition. The consensus was that he had a potassium leak somewhere between his kidneys and bladder. Recommended management was a high baseline oral potassium supplementation and spironolactone. He had a brief period of improvement after moving to a different house, but the episodes returned once he moved back to his old house despite adherence to recommended treatment. In December 2012, he experienced his worst episode, with potassium 1.8 mEq/L on admission, resulting in admission to the intensive care unit (ICU).
Following a precipitous clinical decline, the patient was intubated and mechanically ventilated. Nephrology was consulted and given the recurrent life-threatening pattern, an intensive chart review was undertaken. It was noted that a urine arsenic level that had been normal several admissions previously at 18 μg/L was elevated during a subsequent admission at 59 μg/L, and several weeks later during a later admission the level had fallen to 15 μg/L. Urine lead was undetectable on 3 occasions, and urine mercury was within normal limits.
Arsenic toxicity did not match the patient’s clinical syndrome, but the pattern seemed to be consistent with the possibility of unexplained toxic exposure and subsequent clearance. Therefore, an intensive literature search for syndromes of environmental exposure or poisoning resembling HPP was undertaken. The search revealed several references in the literature to paralysis similar to HPP that involved ingestion of hair-removing soap and rat poison containing barium sulfide and carbonate. References also pointed to the similarity of the symptoms to Guillain-Barre syndrome.
As a result of that literature search, a blood barium level was collected in the ICU that revealed 14,550 ng/mL. A scalp hair sample showed 6.1 μg barium per gram of hair (reference, 0.53 μg/g to 2 μg/g). Neither the patient nor his wife reported being involved in painting, ceramic work, decorating glassware or fabric with dyes, working with stained glass, smelting, metal welding, or use of vermicides.
A U.S. Environmental Protection Agency team was sent to the house, and a detailed toxic survey of the house and the surrounding grounds was conducted with no excess barium found. Barium levels were checked by a private physician on the wife and 2 minor children. The wife’s barium levels came back undetectable in a blood sample and elevated in a hair sample. One child had a very low detected level in her blood and slightly elevated in her hair, and the other child had a low level in her blood and her hair. Because the circumstances of the wife’s and children’s exposure could not be explained environmentally nor could the veteran’s exposure source be identified, the VA Police Service contacted the Tennessee Bureau of Investigation, and they questioned the veteran and his wife.
Shortly after that the veteran received a paralyzing gunshot wound to the back, and the ensuing investigation resulted in incarceration of his wife for both attempted murder by firearm and serial poisoning after soluble barium-containing materials were found hidden in the house.
Discussion
Human barium poisoning is a rarely reported toxic exposure that results in rapid onset of nausea, vomiting, diarrhea, progressive weakness that may end in respiratory paralysis and death if intubation and mechanical ventilation are not promptly initiated. Although the barium found in radiographic contrast media is highly insoluble, ingested barium carbonate and sulfide are rapidly absorbed into the bloodstream, reaching high levels quickly and altering the conductance of potassium channels. The result is erratic variation in blood potassium and prolonged paralysis unless it is immediately suspected and hemodialysis is initiated. In this case, the suspicion level at the time of intubation was insufficient to justify initiating acute hemodialysis.
Soluble barium is available from a number of open sources. Depilatory powders and several rat poisons list barium sulfide or carbonate, both soluble forms of barium rapidly absorbed through the gastrointestinal mucosa, as a major ingredient. One celebrated 2012 case in a city near Chattanooga, Tennessee, involved allegations of barium carbonate poisoning involving rat poison mixed into coffee creamer, but no charges could be filed because the sample handling precluded definitive linkage. Another deliberate toxic poisoning in Texas was traced to soluble barium introduced into a father’s food by his daughter.
The patient reported here experienced 3 years and 19 admissions with 3 episodes of mechanical intubation before his suspected variant HPP was recognized as actually being due to soluble barium poisoning.
Barium does not appear in usual heavy metal urine and blood screens and as a result may not be asked for if not thought of in the differential diagnosis. Physicians dealing with instances of recurrent suspected HPP that do not fit usual age and clinical characteristics for HPP, lack the single-nucleotide polymorphisms associated with the disease, and are not associated with other conditions causing severe hypokalemia, such as renal tubular acidosis, Bartter, Liddle or Gitelman syndrome or severe diuretic or licorice-induced hypokalemia should have soluble barium poisoning included in the differential diagnosis. Appropriately drawn blood specimens in special metal-free sampling tubes and hair barium levels should be included in the diagnostic workup. If poisoning is suspected, a chain of evidence should be obtained to protect possible future criminal investigation against compromise.
Acknowledgments
The authors thanks Tennessee 2nd District Attorney General Barry P. Staubus, 2nd District Assistant Attorney General Teresa A. Nelson, the VA Police Service, and the Tennessee Bureau of Investigation for their help.
1. Ahlawat SK, Sachdev A. Hypokalaemic paralysis. Postgrad Med J. 1999;75(882):193-197.
2. Fontaine B. Periodic paralysis. Adv Genet.2008;63:3-23.
3. Kayal AK, Goswami M, Das M, Jain R. Clinical and biochemical spectrum of hypokalemic paralysis in North: East India. Ann Indian Acad Neurol.2013;16(2):211-217.
4. Johnson CH, VanTassell VJ. Acute barium poisoning with respiratory failure and rhabdomyolysis. Ann Emerg Med. 1991;20(10):1138-1142.
5. Gold R, Reichmann H. Muscle pathology correlates with permanent weakness in hypokalemic periodic paralysis: a case report. Acta Neuropathol. 1992;84(2):202-206.
6. Links TP, Zwarts MJ, Wilmink JT, Molenaar WM, Oosterhuis HJ. Permanent muscle weakness in familial hypokalaemic periodic paralysis. Clinical, radiological and pathological aspects. Brain. 1990;113(pt 6):1873-1889.
7. Tucker C, Villanueva L. Acute hypokalemic periodic paralysis possibly precipitated by albuterol. Am J Health Syst Pharm. 2013;70(18):1588-1591.
8. Liu PY, Jeng CY. Severe hypophosphatemia in a patient with diabetic ketoacidosis and acute respiratory failure. J Chin Med Assoc. 2004;67(7):355-359.
9. Sigue G, Gamble L, Pelitere M, et al. From profound hypokalemia to life-threatening hyperkalemia: a case of barium sulfide poisoning. Arch Intern Med. 2000;160(4):548-541.
10. Kuntzer T, Flocard F, Vial C, et al. Exercise test in muscle channelopathies and other muscle disorders. Muscle Nerve. 2000;23(7):1089-1094.
11. Tengan CH, Antunes AC, Gabbai AA, Manzano GM. The exercise test as a monitor of disease status in hypokalaemic periodic paralysis. J Neurol Neurosurg Psychiatry. 2004;75(3):497-499.
12. McManis PG, Lambert EH, Daube JR. The exercise test in periodic paralysis. Muscle Nerve. 1986;9(8):704-710.
13. Huang K-W. Pa ping (transient paralysis simulating family periodic paralysis). Chin Med J. 1943;61(4):305-312.
14. Ng HY, Lin SH, Hsu CY, Tsai YZ, Chen HC, Lee CT. Hypokalemic paralysis due to Gitelman syndrome:a family study. Neurology. 2006;67(6):1080-1082.
15. Mohta M, Kalra B, Shukla R, Sethi AK. An unusual presentation of hypokalemia. J Anesth Clin Res. 2014;5(3):389.
16. Fujimoto T, Shiiki H, Takahi Y, Dohi K. Primary Sjögren’s Syndrome presenting as hypokalaemic periodic paralysis and respiratory arrest. Clin Rheumatol. 2001;20(5):365-368.
17. Chang YC, Huang CC, Chiou YY, Yu CY. Renal tubular acidosis complicated with hypokalemic periodic paralysis. Pediatr Neurol. 1995;13(1):52-54.
18. Lehmann-Horn F, Jurkat-Rott K, Rüdel R. Periodic paralysis: understanding channelopathies. Curr Neurol Neurosci Rep. 2002;2(1):61-69.
19. Venance SL, Cannon SC, Fialho D, et al; CINCH investigators. The primary periodic paralyses: diagnosis, pathogenesis and treatment. Brain. 2006;129(pt 1):8-17.
20. Sharma C, Nath K, Parekh J. Reversible electrophysiological abnormalities in hypokalemic paralysis: case report of two cases. Ann Indian Acad Neurol. 2014;17(1):100-102.
21. Sternberg D, Tabti N, Fournier E, Hainque B, Fontaine B. Lack of association of the potassium channel-associated peptide MiRP2-R83H variant with periodic paralysis. Neurology. 2003;61(6):857-859.
22. Ke Q, Luo B, Qi M, Du Y, Wu W. Gender differences in penetrance and phenotype in hypokalemic periodic paralysis. Muscle Nerve. 2013;47(1):41-45.
23. Griggs RC, Engel WK, Resnick JS. Acetazolamide treatment of hypokalemic periodic paralysis. Prevention of attacks and improvement of persistent weakness. Ann Intern Med. 1970;73(1):39-48.
24. Dalakas MC, Engel WK. Treatment of “permanent” muscle weakness in familial hypokalemic periodic paralysis. Muscle Nerve. 1983;6(3):182-186.
25. Ghose A, Sayeed AA, Hossain A, Rahman R, Faiz A, Haque G. Mass barium carbonate poisoning with fatal outcome, lessons learned: a case series. Cases J. 2009;2:9327.
Hypokalemic periodic paralysis (HPP) is a relatively common and potentially life-threating condition that can be either sporadic or recurring and has both inherited and acquired causes.1 Familial HPP, on the other hand, is a rare condition (1:100,000) caused by loss of function mutations leading to the disruption of membrane potential consequently making them inexcitable.2 Appearance of symptoms is typically in the first or second decade of life (60% of cases have onset aged < 16 years) with susceptible individuals experiencing sudden onset of perioral numbness; weakness; centrifugal paralysis, often with nausea; vomiting and diarrhea; and prostration, usually triggered by highcarbohydrate meals and rest following sustained muscle-group use.3
These symptoms are common to all forms of HPP, making the differential diagnosis wide and confusing. Rhabdomyolysis is occasionally associated with many severe hypokalemic episodes.4 Myopathy and permanent muscle weakness have been reported in HPP.5,6 Other reported inciting factors include a drop in serum potassium caused by β-adrenergic bronchodilator treatment.7 Clinical attacks also have been associated with diabetic ketoacidosis and combined hypokalemia and hypophosphatemia.8 Thyrotoxicosis also causes similar muscle action potential changes but only when hyperthyroidism is uncorrected. 9-12 Less commonly, hypothyroidism has been reported to be associated with hypokalemic paralysis.3
Pa Ping, a condition involving hypokalemic paralysis of uncertain etiology, is geographically centered in the Szechuan region of China.13 Cases of Bartter, Liddle, and Gitelman syndromes also have been associated with hypokalemic paralysis.3,14 There is an association with malignant hyperthermia following or during systemic anesthesia. Patients presenting as Guillain-Barré syndrome have been found to have periodic paralysis triggered by hypokalemia from any cause.15 Sjögren syndrome and renal tubular acidosis also are reported to have triggered symptoms of hypokalemic paralysis.16,17
True type 1 HPP is caused by channelopathies resulting from mutations in the calcium channel gene CACN1AS (HypoPP1), which accounts for 70% of the cases, whereas type 2 HPP is cause by sodium channel gene SCN4A (HypoPP2) mutations, which accounts for 10% to 20% of cases.18,19 An association with a voltage-gated potassium channel KCNE3 mutation has been made but is disputed.20,21 Females typically have less severe and less frequent attacks, and attacks lessen or disappear during pregnancy.22
In a small controlled trial, acetazolamide has been reported to have prophylactic benefit, although a more powerful carbonic anhydrase inhibitor, dichlorophenamide, was reported to be effective in a study after acetazolamide had become ineffective.23,24 These treatments would not be expected to be of clinical use in hypokalemia due to barium poisoning.
Barium poisoning has been reported as a result of accidental contamination of foodstuffs with soluble barium.25 Onset of symptoms is rapid, with nausea, vomiting, diarrhea, and malaise followed rapidly by weakness, which can include the muscles of respiration. This littleconsidered but rapidly lethal poisoning event can be accidental as a result of environmental exposure due to unintentional ingestion of the toxin or deliberate criminal poisoning as in this case. Because deliberate poisoning rarely crosses the mind of the clinician, awareness of the potential similarity of barium poisoning to other forms of HPP and even familial HPP is important.
Case Presentation
A male veteran aged 45 years when treated by the authors was well until moving into a new rural home when he began to experience acute episodes of variable perioral numbness, diarrhea, paresthesias, abdominal cramping, and weakness, which ranged from mild, self-terminating extremity weakness to 3 episodes of respiratory failure that required intubation and mechanical ventilation.
All episodes were accompanied by hypokalemia in the range of 2 to 3 mEq/L, but levels varied erratically during admissions from severe hypokalemia to normo- and hyperkalemia. Over 3 years, the patient was admitted to the hospital 19 times, underwent extensive workup, and was referred to endocrinology services at Duke University, Vanderbilt University, and the Cleveland Clinic. Diagnostic efforts centered on establishing whether he had a latepresenting variant of familial HPP.
Genetic evaluations could not identify known single-nucleotide polymorphisms associated with that condition. The consensus was that he had a potassium leak somewhere between his kidneys and bladder. Recommended management was a high baseline oral potassium supplementation and spironolactone. He had a brief period of improvement after moving to a different house, but the episodes returned once he moved back to his old house despite adherence to recommended treatment. In December 2012, he experienced his worst episode, with potassium 1.8 mEq/L on admission, resulting in admission to the intensive care unit (ICU).
Following a precipitous clinical decline, the patient was intubated and mechanically ventilated. Nephrology was consulted and given the recurrent life-threatening pattern, an intensive chart review was undertaken. It was noted that a urine arsenic level that had been normal several admissions previously at 18 μg/L was elevated during a subsequent admission at 59 μg/L, and several weeks later during a later admission the level had fallen to 15 μg/L. Urine lead was undetectable on 3 occasions, and urine mercury was within normal limits.
Arsenic toxicity did not match the patient’s clinical syndrome, but the pattern seemed to be consistent with the possibility of unexplained toxic exposure and subsequent clearance. Therefore, an intensive literature search for syndromes of environmental exposure or poisoning resembling HPP was undertaken. The search revealed several references in the literature to paralysis similar to HPP that involved ingestion of hair-removing soap and rat poison containing barium sulfide and carbonate. References also pointed to the similarity of the symptoms to Guillain-Barre syndrome.
As a result of that literature search, a blood barium level was collected in the ICU that revealed 14,550 ng/mL. A scalp hair sample showed 6.1 μg barium per gram of hair (reference, 0.53 μg/g to 2 μg/g). Neither the patient nor his wife reported being involved in painting, ceramic work, decorating glassware or fabric with dyes, working with stained glass, smelting, metal welding, or use of vermicides.
A U.S. Environmental Protection Agency team was sent to the house, and a detailed toxic survey of the house and the surrounding grounds was conducted with no excess barium found. Barium levels were checked by a private physician on the wife and 2 minor children. The wife’s barium levels came back undetectable in a blood sample and elevated in a hair sample. One child had a very low detected level in her blood and slightly elevated in her hair, and the other child had a low level in her blood and her hair. Because the circumstances of the wife’s and children’s exposure could not be explained environmentally nor could the veteran’s exposure source be identified, the VA Police Service contacted the Tennessee Bureau of Investigation, and they questioned the veteran and his wife.
Shortly after that the veteran received a paralyzing gunshot wound to the back, and the ensuing investigation resulted in incarceration of his wife for both attempted murder by firearm and serial poisoning after soluble barium-containing materials were found hidden in the house.
Discussion
Human barium poisoning is a rarely reported toxic exposure that results in rapid onset of nausea, vomiting, diarrhea, progressive weakness that may end in respiratory paralysis and death if intubation and mechanical ventilation are not promptly initiated. Although the barium found in radiographic contrast media is highly insoluble, ingested barium carbonate and sulfide are rapidly absorbed into the bloodstream, reaching high levels quickly and altering the conductance of potassium channels. The result is erratic variation in blood potassium and prolonged paralysis unless it is immediately suspected and hemodialysis is initiated. In this case, the suspicion level at the time of intubation was insufficient to justify initiating acute hemodialysis.
Soluble barium is available from a number of open sources. Depilatory powders and several rat poisons list barium sulfide or carbonate, both soluble forms of barium rapidly absorbed through the gastrointestinal mucosa, as a major ingredient. One celebrated 2012 case in a city near Chattanooga, Tennessee, involved allegations of barium carbonate poisoning involving rat poison mixed into coffee creamer, but no charges could be filed because the sample handling precluded definitive linkage. Another deliberate toxic poisoning in Texas was traced to soluble barium introduced into a father’s food by his daughter.
The patient reported here experienced 3 years and 19 admissions with 3 episodes of mechanical intubation before his suspected variant HPP was recognized as actually being due to soluble barium poisoning.
Barium does not appear in usual heavy metal urine and blood screens and as a result may not be asked for if not thought of in the differential diagnosis. Physicians dealing with instances of recurrent suspected HPP that do not fit usual age and clinical characteristics for HPP, lack the single-nucleotide polymorphisms associated with the disease, and are not associated with other conditions causing severe hypokalemia, such as renal tubular acidosis, Bartter, Liddle or Gitelman syndrome or severe diuretic or licorice-induced hypokalemia should have soluble barium poisoning included in the differential diagnosis. Appropriately drawn blood specimens in special metal-free sampling tubes and hair barium levels should be included in the diagnostic workup. If poisoning is suspected, a chain of evidence should be obtained to protect possible future criminal investigation against compromise.
Acknowledgments
The authors thanks Tennessee 2nd District Attorney General Barry P. Staubus, 2nd District Assistant Attorney General Teresa A. Nelson, the VA Police Service, and the Tennessee Bureau of Investigation for their help.
1. Ahlawat SK, Sachdev A. Hypokalaemic paralysis. Postgrad Med J. 1999;75(882):193-197.
2. Fontaine B. Periodic paralysis. Adv Genet.2008;63:3-23.
3. Kayal AK, Goswami M, Das M, Jain R. Clinical and biochemical spectrum of hypokalemic paralysis in North: East India. Ann Indian Acad Neurol.2013;16(2):211-217.
4. Johnson CH, VanTassell VJ. Acute barium poisoning with respiratory failure and rhabdomyolysis. Ann Emerg Med. 1991;20(10):1138-1142.
5. Gold R, Reichmann H. Muscle pathology correlates with permanent weakness in hypokalemic periodic paralysis: a case report. Acta Neuropathol. 1992;84(2):202-206.
6. Links TP, Zwarts MJ, Wilmink JT, Molenaar WM, Oosterhuis HJ. Permanent muscle weakness in familial hypokalaemic periodic paralysis. Clinical, radiological and pathological aspects. Brain. 1990;113(pt 6):1873-1889.
7. Tucker C, Villanueva L. Acute hypokalemic periodic paralysis possibly precipitated by albuterol. Am J Health Syst Pharm. 2013;70(18):1588-1591.
8. Liu PY, Jeng CY. Severe hypophosphatemia in a patient with diabetic ketoacidosis and acute respiratory failure. J Chin Med Assoc. 2004;67(7):355-359.
9. Sigue G, Gamble L, Pelitere M, et al. From profound hypokalemia to life-threatening hyperkalemia: a case of barium sulfide poisoning. Arch Intern Med. 2000;160(4):548-541.
10. Kuntzer T, Flocard F, Vial C, et al. Exercise test in muscle channelopathies and other muscle disorders. Muscle Nerve. 2000;23(7):1089-1094.
11. Tengan CH, Antunes AC, Gabbai AA, Manzano GM. The exercise test as a monitor of disease status in hypokalaemic periodic paralysis. J Neurol Neurosurg Psychiatry. 2004;75(3):497-499.
12. McManis PG, Lambert EH, Daube JR. The exercise test in periodic paralysis. Muscle Nerve. 1986;9(8):704-710.
13. Huang K-W. Pa ping (transient paralysis simulating family periodic paralysis). Chin Med J. 1943;61(4):305-312.
14. Ng HY, Lin SH, Hsu CY, Tsai YZ, Chen HC, Lee CT. Hypokalemic paralysis due to Gitelman syndrome:a family study. Neurology. 2006;67(6):1080-1082.
15. Mohta M, Kalra B, Shukla R, Sethi AK. An unusual presentation of hypokalemia. J Anesth Clin Res. 2014;5(3):389.
16. Fujimoto T, Shiiki H, Takahi Y, Dohi K. Primary Sjögren’s Syndrome presenting as hypokalaemic periodic paralysis and respiratory arrest. Clin Rheumatol. 2001;20(5):365-368.
17. Chang YC, Huang CC, Chiou YY, Yu CY. Renal tubular acidosis complicated with hypokalemic periodic paralysis. Pediatr Neurol. 1995;13(1):52-54.
18. Lehmann-Horn F, Jurkat-Rott K, Rüdel R. Periodic paralysis: understanding channelopathies. Curr Neurol Neurosci Rep. 2002;2(1):61-69.
19. Venance SL, Cannon SC, Fialho D, et al; CINCH investigators. The primary periodic paralyses: diagnosis, pathogenesis and treatment. Brain. 2006;129(pt 1):8-17.
20. Sharma C, Nath K, Parekh J. Reversible electrophysiological abnormalities in hypokalemic paralysis: case report of two cases. Ann Indian Acad Neurol. 2014;17(1):100-102.
21. Sternberg D, Tabti N, Fournier E, Hainque B, Fontaine B. Lack of association of the potassium channel-associated peptide MiRP2-R83H variant with periodic paralysis. Neurology. 2003;61(6):857-859.
22. Ke Q, Luo B, Qi M, Du Y, Wu W. Gender differences in penetrance and phenotype in hypokalemic periodic paralysis. Muscle Nerve. 2013;47(1):41-45.
23. Griggs RC, Engel WK, Resnick JS. Acetazolamide treatment of hypokalemic periodic paralysis. Prevention of attacks and improvement of persistent weakness. Ann Intern Med. 1970;73(1):39-48.
24. Dalakas MC, Engel WK. Treatment of “permanent” muscle weakness in familial hypokalemic periodic paralysis. Muscle Nerve. 1983;6(3):182-186.
25. Ghose A, Sayeed AA, Hossain A, Rahman R, Faiz A, Haque G. Mass barium carbonate poisoning with fatal outcome, lessons learned: a case series. Cases J. 2009;2:9327.