User login
Inpatient Portals for Hospitalized Patients and Caregivers: A Systematic Review
Engaging patients and their caregivers in care improves health outcomes1-3 and is endorsed by leading healthcare organizations as essential to improving care quality and safety.4-6 Patient engagement emphasizes that patients, caregivers, and healthcare providers work together to “promote and support active patient and public involvement in health and healthcare and to strengthen their influence on healthcare decisions.”7 Patient portals, web-based personal health records linked to electronic health record (EHR) data, are intended to promote engagement by providing patients and their caregivers with timely electronic access to their healthcare information and supporting communication through secure messaging with their healthcare team.8 The use of patient portals has also been suggested as a way for patients and/or caregivers to identify and intercept medical errors, thus having the potential to also improve patient safety.8,9
As a requirement for meaningful use, access to health information through patient portals in the ambulatory setting has increased dramatically.10 Studies evaluating the use of these patient portals to promote patient-centered care are growing, but evidence supporting their impact on improved health outcomes is currently insufficient.11-15 Although research and policy focus on the use of patient portals in the ambulatory setting, recent literature suggests that patient portals may be used to share inpatient clinical information to engage patients and their caregivers during their hospitalization.16-18 Before the widespread use of patient portals in the inpatient setting is endorsed, systematic research is needed to understand optimal portal design requirements, if and how these portals are used, and whether their use provides value to the hospitalized patient and/or caregiver.8
Prior literature summarized early findings regarding the use of various technologies designed to engage hospitalized patients.17,19,20 In this systematic review, we describe the emerging literature examining the design, use, and impact of inpatient portals for hospitalized patients and/or caregivers over the last 10 years. Inpatient portals are defined here as electronic patient portals tethered to EHRs that are designed to provide hospitalized patients and/or caregivers secure access to personalized, inpatient clinical information with the intent of engaging them in their hospital care. After analyzing and summarizing these data, we then identify knowledge gaps and potential future research directions.
METHODS
Search Strategy, Study Selection, and Analysis
This systematic review included available, peer-reviewed, and grey literature published from January 1, 2006, to August 8, 2017, in PubMed, Web of Science (including the Institute of Electrical and Electronics Engineers Xplore), Cochrane, CINAHLPlus, and Scopus databases. Terms and phrases, including those found in the Medical Subject Heading (MeSH) index, were used to identify studies evaluating (1) patient portals (“health record, personal [MeSH],” “personal health record,” “patient portal,” “inpatient portal,” “ipad,” “tablet,” or “bedside information technology”), (2) engagement (“engagement,” “empowerment,” “participation,” “activation,” or “self-efficacy”), and (3) in the hospital (“inpatient [MeSH],” “hospital [MeSH],” “hospitalized patient [MeSH],” or “unit”). MeSH terms were used when applicable. Based on previous literature, free-text terms were also used when subject headings were not applied consistently, such as with terms related to engagement.17,21 Studies were excluded if they were not written in English, if they evaluated portals exclusively in the emergency department or ambulatory setting, and/or if they described future study protocols. Studies describing general inpatient technology or evaluating portals used in the hospital but not tethered to inpatient EHR clinical data were also excluded.
By using the Preferred Reporting Items for Systematic Reviews and Meta-Analyses guidelines,22 2 researchers (M.K. and P.H.) completed the literature search and potential article screening. Results were aggregated and studies were screened and excluded from full review based on title and abstract information. Additional studies were included after reference list review. During a full review of included studies, 2 researchers independently extracted data, including the study objective, design, setting, sample, data collection instruments, outcomes, and a description of results. Guided by our study objective, findings were reconciled by consensus and analyzed and described according to the following 3 themes: (1) inpatient portal design, (2) inpatient portal use and usability, and (3) the impact of inpatient portal use on patient or caregiver and healthcare team outcomes as defined by retrieved studies.
The quality of studies was evaluated by the same 2 researchers independently by using the Downs and Black checklist for assessing the methodological quality of randomized and nonrandomized healthcare interventions.23 Qualitative studies describing the development of portal prototypes and/or portal redesign efforts were excluded from these analyses. Discrepancies were resolved by consensus.Because of the wide variability in study designs, populations, and outcomes, a meta-analysis of pooled data was not performed.
RESULTS
Of the 731 studies identified through database searching and reference review, 36 were included for full-text review and 17 met inclusion criteria (Figure; Table 1). Studies excluded after full-text review described portal use outside of the inpatient setting, portals not linked to hospital EHR clinical data, portals not designed for inpatients, and/or inpatient technology in general. The inpatient portal platforms, hardware used, and functionalities varied within included studies (Table 2). The majority of studies used custom, web-based inpatient portal applications on tablet computers. Most provided information about the patients’ hospital medications, healthcare team, and education about their condition and/or a medical glossary. Many included the patient’s schedule, hospital problem list, discharge information, and a way to keep notes.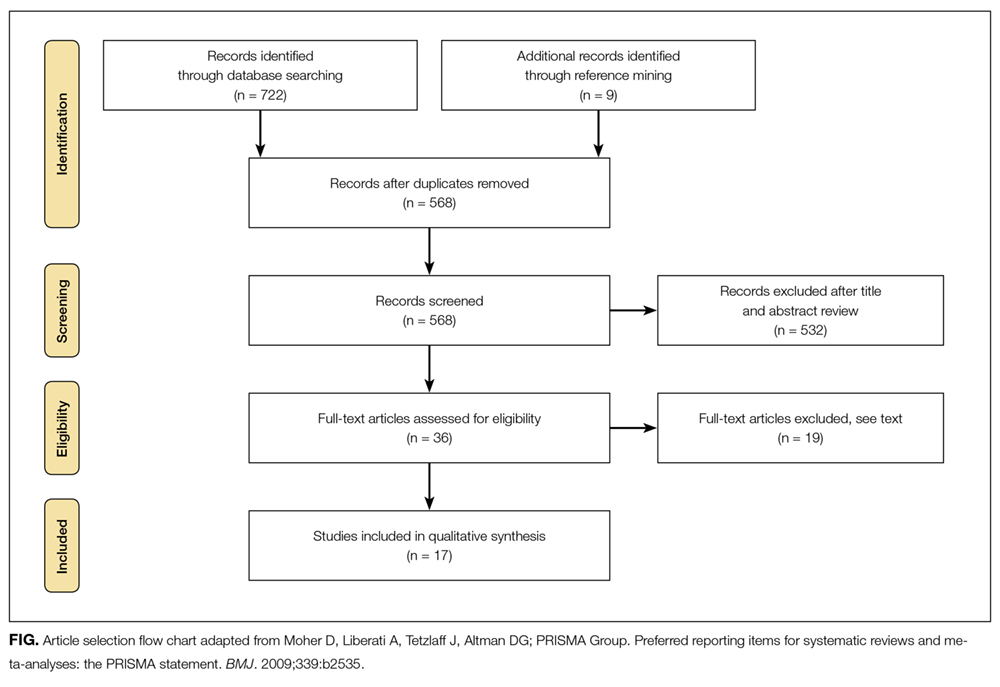
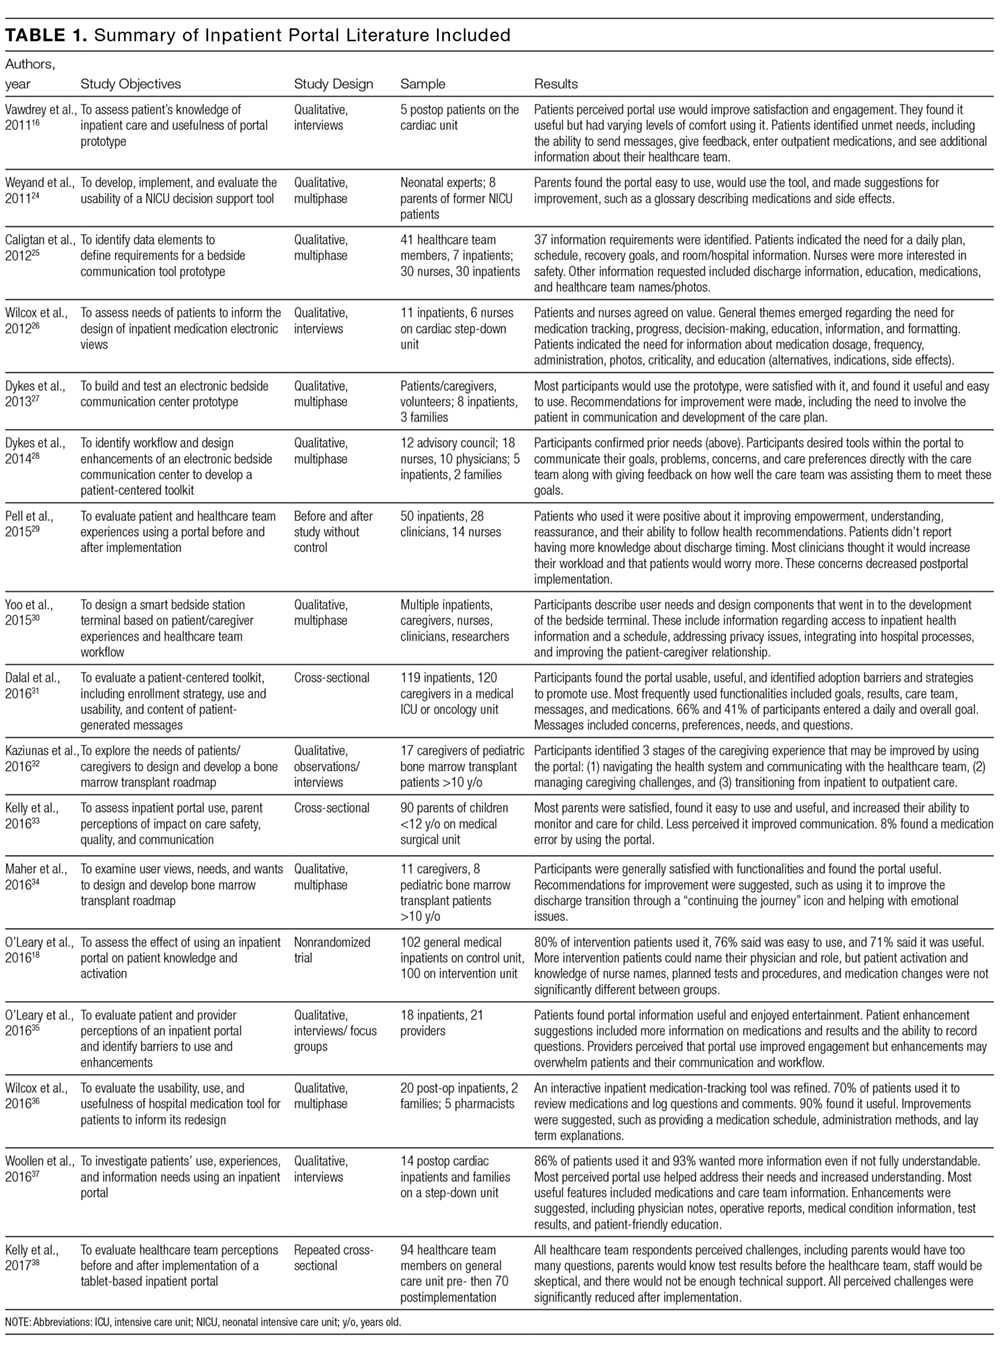
There has been a recent increase in inpatient portal study publication, with 9 studies published during or after 2016. Five were conducted in the pediatric setting and all but 130 with English-speaking participants. Twelve studies were qualitative, many of which were conducted in multiple phases by using semi-structured interviews and/or focus groups to develop or redesign inpatient portals. Of the remaining studies, 3 used a cross-sectional design, 1 used a before and after design without a control group, and 1 was a nonrandomized trial. Studies were rated as having medium-to-high risk of bias because of design flaws (Table 1 in supplementary Appendix). Because many studies were small pilot studies and all were single-centered studies, the generalizability of findings to different healthcare settings or patient populations is limited.
Inpatient Portal Design
Most included studies evaluated patient and/or caregiver information needs to design and/or enhance inpatient portals.16,24-37 In 1 study, patients described an overall lack of information provided in the hospital and insufficient time to understand and remember information, which, when shared, was often presented by using medical terminology.30 They wanted information to help them understand their daily hospital routine, confirm and compare medications and test results, learn about care, and prepare for discharge. Participants in multiple studies echoed these results, indicating the need for a schedule of upcoming clinical events (eg, medication administration, procedures, imaging), secure and timely clinical information (eg, list of diagnoses and medications, test results), personalized education, a medical glossary, discharge information, and a way to take notes and recognize and communicate with providers.
Patients also requested further information transparency,34,37 including physicians’ notes, radiology results, operative reports, and billing information, along with general hospital information,16 meal ordering,33 and video conferencing.27 ln designing and refining an inpatient medication-tracking tool, participants identified the need for information about medication dosage, frequency, timing, administration method, criticality, alternative medications or forms, and education.26,36 Patients and/or caregivers also indicated interest in communicating with inpatient providers by using the portal.16,27,28,30-37 In 1 study, patients highlighted the need to be involved in care plan development,27 which led to portal refinement to allow for patient-generated data entry, including care goals and a way to communicate real-time concerns and feedback.28
Studies also considered healthcare team perspectives to inform portal design.25,26,28,30,35,37 Although information needs usually overlapped, patient and healthcare team priorities differed in some areas. Although patients wanted to “know what was going to happen to them,” nurses in 1 study were more concerned about providing information to protect patients, such as safety and precaution materials.25 Similarly, when designing a medication-tracking tool, patients sought information that helped them understand what to expect, while pharmacists focused on medication safety and providing information that fit their workflow (eg, abstract medication schedules).36
Identified study data raised important portal interface design considerations. Results suggested clinical data should be presented by using simple displays,28 accommodating real-time information. Participants recommended links16,29 to personalized patient-friendly37 education accessed with minimal steps.26 Interfaces may be personalized for target users, such as patient or proxy and younger or older individuals. For example, older patients reported less familiarity with touch screens, internal keyboards, and handwriting recognition, favoring voice recognition for recording notes.27 This raised questions about how portals can be designed to best maintain patient privacy.25 Interface design, such as navigation, also relied heavily on hardware choice, such as tablet versus mobile phone.28
Inpatient Portal Use and Usability
Most patient and/or caregiver participants in included studies were interested in using an inpatient portal, used it when offered, found it easy to use, useful, and/or were satisfied with it.16,18,24-37 Most used and liked functionalities that provided healthcare team, test result, and medication information.22,33,37 In the 1 identified controlled trial,18 researchers evaluated an inpatient portal given to adult inpatients that included a problem list, schedule, medication list, and healthcare team information. Of the intervention unit patients, 80% used the portal, 76% indicated it was easy to use, and 71% thought it provided useful information. When a portal was given to 239 adult patients and caregivers in another study, 66% sent a total of 291 messages to the healthcare team.31 Of these, 153 provided feedback, 76 expressed preferences, and 16 communicated concerns. In a pediatric study, an inpatient portal was given to 296 parents who sent a total of 36 messages and 176 requests.33 Messages sent included information regarding caregiver needs, questions, updates, and/or positive endorsements of the healthcare team and/or care.
Impact of Inpatient Portal Use
Multiple studies evaluated the impact of inpatient portal use on patient and/or caregiver engagement, empowerment, activation, and/or knowledge, which had mixed results. Most adult patients interviewed in one study had positive experiences using a portal to answer their questions between physician visits and learn about, remember, and engage in care.37 A majority of adult inpatient portal users in another study agreed that portal use helped them feel in control and understand their condition; however, they did not report having improved discharge timing knowledge.29 In a pediatric study, most parent inpatient portal users agreed use improved their ability to monitor, understand, and make decisions about their child’s care.33 In the controlled trial,18 a higher percentage of portal intervention patients could identify their physician or role; however, patient activation was not statistically different between intervention and control patients.
Results from included studies also evaluated the impact of portal use on communication. Some suggest inpatient portal use may replace and/or facilitate verbal communication between patients, caregivers, and providers.35 In a pediatric study, 51% of parent portal users reported it gave them the information they needed, reducing the amount of questions they had for their healthcare team.33 Similarly 43% of 14 adult inpatient portal users in another study thought the portal could replace at least some face-to-face communication.37 Some providers indicated portal use enhanced rounding discussion quality.35 Another study suggested that patient-provider communication via electronic messaging may provide benefits for some patients and not others.37
Multiple studies evaluated patient, caregiver, and/or healthcare team perceptions of the impact of inpatient portal use on detection of errors and patient safety.29,31,33,35 In adult inpatients, 6% agreed portal use could help them find errors.29 In a pediatric study, 8% reported finding at least 1 medication error by using the portal, and 89% thought use reduced errors in their child’s care.33 One patient in a qualitative study of adult inpatients cited an example of a dosing error discovered by using the portal.37 Healthcare providers in another study also reported that use facilitated patient error identification.35
Included studies evaluated the potential impact of portal use on patient anxiety, confusion, and/or worry, and the work of healthcare teams. In 1 study, nurses voiced concerns about giving information subject to change or that couldn’t always be achieved because of competing hospital priorities, such as discharge timing.25 They also worried about giving medical information that would create cognitive overload for patients and/or require professional interpretation. Although providers in another study perceived little negative impact on their workflow after portal implementation, they worried about the potential of adding other information to the portal.35 For example, they were concerned that the future release of abnormal test results or sensitive data would lead to confusion and more time spent answering patient questions. Physicians also worried that secure messaging could be overused by patients, would be used to inappropriately express acute concerns, or might adversely affect verbal communication. Providers in 2 studies expressed concerns about potential negative implications of portal use on their work before implementation, which were subsequently reduced after portal implementation.29,38 Conversely, no parent portal users in another study thought portal information was confusing.33 One parent participant noted portal use may actually decrease anxiety: “Access to their medical information gives patients and their caregivers perspective and insight into their hospital care and empowers them with knowledge about [what is going on], which reduces anxiety.”37
DISCUSSION
We identified multiple studies evaluating the design, use, and impact of inpatient patient portals for hospitalized patients and caregivers. Based on the information needs identified by patients and healthcare team participants, multiple key content and design recommendations are suggested, including presenting (1) timely, personalized clinical and educational information in lay terms, (2) the care trajectory, including care plan and patient schedule, and (3) a way to recognize and communicate with the inpatient healthcare team. Design challenges still exist, such as translating medical terminology from EHRs into patient-friendly language, proxy access, and portal integration across transitions. Data from identified studies suggest hospitalized patients and caregivers are interested in and willing to use inpatient portals, but there is less information about the use of each functionality. Evidence supporting the role of inpatient portal use in improving patient and/or caregiver engagement, knowledge, communication, and the quality and safety of care is currently limited. Included studies indicate that healthcare team members had concerns about using portals to share clinical information and communicate electronically in the hospital. The extent to which these concerns translate to demonstrable problems remains to be seen.
Early studies focus on patient and caregiver information needs and portal interface design. Although the necessity for certain core functionalities and design requirements are becoming clear,20 best practices regarding the amount and timing of information released (eg, physician notes, lab results), optimal hardware decisions (eg, large-screen displays, hospital-owned tablets, bring-your-own-device model), and details around secure-messaging implementation in the acute hospital setting are still lacking. Future work is needed to understand optimal patient-provider communication architectures that support improved synchronous and asynchronous messaging and privacy-preserving approaches to the design of these systems to handle patient-generated data as it becomes more commonplace. Although patient participants in these studies were generally satisfied using inpatient portals, many indicated the need for even more transparency, such as the release of results in real time and inclusion of physician notes (even if they could not be fully comprehended).37 As the movement of sharing notes with patients in the ambulatory setting grows,39 it will inevitably extend to the inpatient setting.40 Further research is needed to understand the impact of increased transparency on health outcomes, patient anxiety, and inpatient healthcare team workload. Although the majority of studies described the design and/or use of custom portal platforms, EHR vendors are now developing inpatient portals that integrate into preexisting systems (eg, MyChart Bedside, Epic Systems). This will increase the likelihood of broad inpatient portal adoption and may facilitate multicenter trials evaluating the impact of their use.
The next steps will need to focus on the evaluation of specific inpatient portal functionalities and the impact of their use on objective process and outcome measures by using rigorous, experimental study designs. Akin to ambulatory portal research, measures of interest will include patient activation,41,42 patient and/or caregiver satisfaction,43 care processes (eg, length of stay, readmissions), and patient safety (eg, safety perceptions, adverse drug events, hospital-acquired conditions, and diagnostic errors). More than a mechanism for unidirectional sharing information from providers to the patient, inpatient portals will also provide a platform for the reciprocal exchange of information from the patient to the provider through patient-generated data, such as goal setting and feedback. Patients may play a larger role in reporting hospital satisfaction in real time, reconciling medications, contributing to the treatment plan, and identifying medical errors. As portals are integrated across the care continuum,20 our understanding of their impact may become more clear.
In this review, only 5 studies were conducted in the pediatric hospital setting.24,32-34,38 With hospitalized children experiencing 3 times more harm from medical errors than adults,44 engaging parents in inpatient care to improve safety has become a national priority.45 Giving patient portals, or “parent portals,” to parents of hospitalized children may provide a unique opportunity to share healthcare information and promote engagement, a direction for future study. There is also a research gap in evaluating adolescent inpatient portal use. Future portals may be designed to incentivize young children to learn about their hospitalization through games linked to health-related education.
Finally, as patients and caregivers begin using inpatient portals, there will almost certainly be consequences for healthcare teams. Understanding and anticipating human and work system factors influencing inpatient portal adoption and use from the perspectives of both patients and healthcare teams are needed.46,47 Engaging healthcare team members as valuable stakeholders during implementation and measuring the impact of portal use on their workload is necessary, especially as portal use spreads beyond pilot units. The success of inpatient portals is dependent upon both the positive benefits for patients and their acceptance by healthcare teams.48
Limitations exist in conducting a systematic literature review.49 The conceptual definition of a portal for hospitalized patients and patient/caregiver engagement is evolving; therefore, our definition may not have captured all relevant studies. We intentionally did not include all inpatient technology, as we were interested in a narrow definition of portals designed for inpatients that provided clinical information from the inpatient EHR. Because of rapid technology changes, we also limited our search to studies published within the last 10 years; prior literature has been described elsewhere.17 We excluded non-English language studies, limiting our ability to capture the full scope of inpatient portal research. These patients already experience healthcare delivery disparities, widened by the inaccessibility of innovative health information technologies.50 Future studies would be enhanced with the inclusion of these participants.
Inpatient portal research is in its infancy but growing rapidly. Studies to date are primarily focused on portal design and have small sample sizes. Early findings suggest that patients and caregivers are, in general, enthusiastic about using inpatient portals. Further research is needed, however, to determine the impact of inpatient portal use on patient engagement and hospital-care quality, safety, and cost.
Disclosure
This work was supported by a Department of Pediatrics Research and Development Grant at the University of Wisconsin School of Medicine and Public Health. This publication was also supported by the Clinical and Translational Science Award program through the National Center for Advancing Translational Sciences, grant UL1TR000427. Dr. Hoonakker’s involvement was also partially supported by the National Science Foundation, grant CMMI 1536987. Funding sources had no involvement in study design, analysis, or interpretation of data. The authors have no conflicts of interest to declare.
1. Stewart M, Brown JB, Donner A, et al. The impact of patient-centered care on outcomes. J Fam Pract. 2000;49(9):796-804. PubMed
2. Little P, Everitt H, Williamson I, et al. Observational study of effect of patient centredness and positive approach on outcomes of general practice consultations. BMJ. 2001;323(7318):908-911. PubMed
3. Maeng DD, Graf TR, Davis DE, Tomcavage J, Bloom FJ, Jr. Can a patient-centered medical home lead to better patient outcomes? The Quality Implications of Geisinger’s ProvenHealth Navigator. Am J Med Qual. 2012;27(3):210-216. PubMed
4. Joint Commision on Accreditation of Healthcare Organizations. Speak up: Prevent errors in your child’s care. http://www.jointcommission.org/Speak_Up_Prevent_Errors_in_Your_Childs_Care/. Accessed June 10, 2017.
5. Committee on Hospital Care and Institute for Patient and Family-centered Care. Patient- and family-centered care and the pediatrician’s role. Pediatrics. 2012;129(2):394-404. PubMed
6. Institute of Medicine Committee on Quality of Health Care in America. Crossing the Quality Chasm: A New Health System for the 21st Century. Washington, DC: National Academy Press; 2001. PubMed
7. Coulter A. Engaging Patients in Healthcare. New York: McGraw-Hill Education; 2011. PubMed
8. Tang PC, Ash JS, Bates DW, Overhage JM, Sands DZ. Personal health records: definitions, benefits, and strategies for overcoming barriers to adoption. J Am Med Inform Assoc. 2006;13(2):121-126. PubMed
9. Schnipper JL, Gandhi TK, Wald JS, et al. Design and implementation of a web-based patient portal linked to an electronic health record designed to improve medication safety: the Patient Gateway medications module. Inform Prim Care. 2008;16(2):147-155. PubMed
10. Blumenthal D, Tavenner M. The “meaningful use” regulation for electronic health records. N Engl J Med. 2010;363(6):501-504. PubMed
11. Ammenwerth E, Schnell-Inderst P, Hoerbst A. The impact of electronic patient portals on patient care: a systematic review of controlled trials. J Med Internet Res. 2012;14(6):e162. PubMed
12. Goldzweig CL, Orshansky G, Paige NM, et al. Electronic patient portals: evidence on health utcomes, satisfaction, efficiency, and attitudes: a systematic review. Ann Intern Med. 2013;159(10):677-687. PubMed
13. Davis Giardina T, Menon S, Parrish DE, Sittig DF, Singh H. Patient access to medical records and healthcare outcomes: a systematic review. J Am Med Inform Assoc. 2014;21(4):737-741. PubMed
14. Kalra D, Fernando B. A review of the empirical evidence of the healthcare benefits of personal health records. Yearb Med Inform. 2013;8(1):93-102. PubMed
15. Kruse CS, Bolton K, Freriks G. The effect of patient portals on quality outcomes and its implications to meaningful use: a systematic review. J Med Internet Res. 2015;17(2):e44. PubMed
16. Vawdrey DK, Wilcox LG, Collins SA, et al. A tablet computer application for patients to participate in their hospital care. AMIA Annu Symp Proc. 2011:1428-1435. PubMed
17. Prey JE, Woollen J, Wilcox L, et al. Patient engagement in the inpatient setting: a systematic review. J Am Med Inform Assoc. 2014;21(4):742-750. PubMed
18. O’Leary KJ, Lohman ME, Culver E, et al. The effect of tablet computers with a mobile patient portal application on hospitalized patients’ knowledge and activation. J Am Med Inform Assoc. 2016;23(1):159-165. PubMed
19. Skeels M, Tan DS. Identifying opportunities for inpatient-centric technology. Proceedings of the 1st ACM International Health Informatics Symposium. Arlington: ACM; 2010:580-589.
20. Collins SA, Rozenblum R, Leung WY, et al. Acute care patient portals: a qualitative study of stakeholder perspectives on current practices. J Am Med Inform Assoc. 2017;24(e1):e9-e17. PubMed
21. Morris D, Karlson A. Dynamic Accessibility Requirements for Hospital Patients. SIGCHI Conference on Human Factors in Computing Systems. Vancouver, BC, Canada: ACM; 2011.
22. Moher D, Liberati A, Tetzlaff J, Altman DG; PRISMA Group. Preferred reporting items for systematic reviews and meta-analyses: the PRISMA statement. BMJ. 2009;339:b2535. PubMed
23. Downs SH, Black N. The feasibility of creating a checklist for the assessment of the methodological quality both of randomised and non-randomised studies of health care interventions. J Epidemiol Community Health. 1998;52(6):377-384. PubMed
24. Weyand SA, Frize M, Bariciak E, Dunn S. Development and usability testing of a parent decision support tool for the neonatal intensive care unit. Conf Proc IEEE Eng Med Biol Soc. 2011:6430-6433. PubMed
25. Caligtan CA, Carroll DL, Hurley AC, Gersh-Zaremski R, Dykes PC. Bedside information technology to support patient-centered care. Int J Med Inform. 2012;81(7):442-451. PubMed
26. Wilcox L, Feiner S, Liu A, Restaino S, Collins S, Vawdrey D. Designing inpatient technology to meet the medication information needs of cardiology patients. Proceedings of the 2nd ACM SIGHIT International Health Informatics Symposium. Miami: ACM; 2012:831-836. PubMed
27. Dykes PC, Carroll DL, Hurley AC, et al. Building and testing a patient-centric electronic bedside communication center. J Gerontol Nurs. 2013;39(1):15-19. PubMed
28. Dykes PC, Stade D, Chang F, et al. Participatory design and development of a patient-centered toolkit to engage hospitalized patients and care partners in their plan of care. AMIA Annu Symp Proc. 2014:486-495. PubMed
29. Pell JM, Mancuso M, Limon S, Oman K, Lin CT. Patient access to electronic health records during hospitalization. JAMA Intern Med. 2015;175(5):856-858. PubMed
30. Yoo S, Lee KH, Baek H, et al. Development and user research of a smart bedside station system toward patient-centered healthcare system. J Med Syst. 2015;39(9):86. PubMed
31. Dalal AK, Dykes PC, Collins S, et al. A web-based, patient-centered toolkit to engage patients and caregivers in the acute care setting: a preliminary evaluation. J Am Med Inform Assoc. 2016;23(1):80-87. PubMed
32. Kaziunas E, Hanauer DA, Ackerman MS, Choi SW. Identifying unmet informational needs in the inpatient setting to increase patient and caregiver engagement in the context of pediatric hematopoietic stem cell transplantation. J Am Med Inform Assoc. 2016;23(1):94-104. PubMed
33. Kelly MM, Hoonakker PLT, Dean SM. Using an inpatient portal to engage families in pediatric hospital care. J Am Med Inform Assoc. 2016;24(1):153-161. PubMed
34. Maher M, Kaziunas E, Ackerman M, et al. User-centered design groups to engage patients and caregivers with a personalized health information technology tool. Biol Blood Marrow Transplant. 2016;22(2):349-358. PubMed
35. O’Leary KJ, Sharma RK, Killarney A, et al. Patients’ and healthcare providers’ perceptions of a mobile portal application for hospitalized patients. BMC Med Inform Decis Mak. 2016;16(1):123-130. PubMed
36. Wilcox L, Woollen J, Prey J, et al. Interactive tools for inpatient medication tracking: a multi-phase study with cardiothoracic surgery patients. J Am Med Inform Assoc. 2016;23(1):144-158. PubMed
37. Woollen J, Prey J, Wilcox L, et al. Patient experiences using an inpatient personal health record. Appl Clin Inform. 2016;7(2):446-460. PubMed
38. Kelly MM, Dean SM, Carayon P, Wetterneck TB, Hoonakker PLT. Healthcare team perceptions of a portal for parents of hospitalized children before and after implementation. Appl Clin Inform. 2017;8(1):265-278. PubMed
39. Wolff JL, Darer JD, Berger A, et al. Inviting patients and care partners to read doctors’ notes: OpenNotes and shared access to electronic medical records. J Am Med Inform Assoc. 2017;24(e1):e166-e172. PubMed
40. Feldman HJ, Walker J, Li J, Delbanco T. OpenNotes:hospitalists’ challenge and opportunity. J Hosp Med. 2013;8(7):414-417. PubMed
41. Hibbard JH, Stockard J, Mahoney ER, Tusler M. Development of the Patient Activation Measure (PAM): conceptualizing and measuring activation in patients and consumers. Health Serv Res. 2004;39(4 Pt 1):1005-1026. PubMed
42. Prey JE, Qian M, Restaino S, et al. Reliability and validity of the patient activation measure in hospitalized patients. Patient Educ Couns. 2016;99(12):2026-2033. PubMed
43. Toomey SL, Zaslavsky AM, Elliott MN, et al. The development of a pediatric inpatient experience of care measure: Child HCAHPS. Pediatrics. 2015;136(2):360-369. PubMed
44. Kaushal R, Bates DW, Landrigan C, et al. Medication errors and adverse drug events in pediatric inpatients. JAMA. 2001;285(16):2114-2120. PubMed
45. Agency for Healthcare Research and Quality. 20 Tips to help prevent medical errors in children. Secondary 20 Tips to help prevent medical errors in children. http://www.ahrq.gov/patients-consumers/care-planning/errors/20tips/index.html. Accessed on June 10, 2017.
46. Thompson MJ, Reilly JD, Valdez RS. Work system barriers to patient, provider, and caregiver use of personal health records: A systematic review. Appl Ergon. 2016;54:218-242. PubMed
47. Holden RJ, Carayon P, Gurses AP, et al. SEIPS 2.0: a human factors framework for studying and improving the work of healthcare professionals and patients. Ergonomics. 2013;56(11):1669-1686. PubMed
48. Gagnon MP, Ngangue P, Payne-Gagnon J, Desmartis M. m-Health adoption by healthcare professionals: a systematic review. J Am Med Inform Assoc. 2016;23(1):212-220. PubMed
49. Russell CL. An overview of the integrative research review. Prog Transplant. 2005;15(1):8-13. PubMed
50. Yamin CK, Emani S, Williams DH, et al. The digital divide in adoption and use of a personal health record. Arch Intern Med. 2011;171(6):568-574. PubMed
Engaging patients and their caregivers in care improves health outcomes1-3 and is endorsed by leading healthcare organizations as essential to improving care quality and safety.4-6 Patient engagement emphasizes that patients, caregivers, and healthcare providers work together to “promote and support active patient and public involvement in health and healthcare and to strengthen their influence on healthcare decisions.”7 Patient portals, web-based personal health records linked to electronic health record (EHR) data, are intended to promote engagement by providing patients and their caregivers with timely electronic access to their healthcare information and supporting communication through secure messaging with their healthcare team.8 The use of patient portals has also been suggested as a way for patients and/or caregivers to identify and intercept medical errors, thus having the potential to also improve patient safety.8,9
As a requirement for meaningful use, access to health information through patient portals in the ambulatory setting has increased dramatically.10 Studies evaluating the use of these patient portals to promote patient-centered care are growing, but evidence supporting their impact on improved health outcomes is currently insufficient.11-15 Although research and policy focus on the use of patient portals in the ambulatory setting, recent literature suggests that patient portals may be used to share inpatient clinical information to engage patients and their caregivers during their hospitalization.16-18 Before the widespread use of patient portals in the inpatient setting is endorsed, systematic research is needed to understand optimal portal design requirements, if and how these portals are used, and whether their use provides value to the hospitalized patient and/or caregiver.8
Prior literature summarized early findings regarding the use of various technologies designed to engage hospitalized patients.17,19,20 In this systematic review, we describe the emerging literature examining the design, use, and impact of inpatient portals for hospitalized patients and/or caregivers over the last 10 years. Inpatient portals are defined here as electronic patient portals tethered to EHRs that are designed to provide hospitalized patients and/or caregivers secure access to personalized, inpatient clinical information with the intent of engaging them in their hospital care. After analyzing and summarizing these data, we then identify knowledge gaps and potential future research directions.
METHODS
Search Strategy, Study Selection, and Analysis
This systematic review included available, peer-reviewed, and grey literature published from January 1, 2006, to August 8, 2017, in PubMed, Web of Science (including the Institute of Electrical and Electronics Engineers Xplore), Cochrane, CINAHLPlus, and Scopus databases. Terms and phrases, including those found in the Medical Subject Heading (MeSH) index, were used to identify studies evaluating (1) patient portals (“health record, personal [MeSH],” “personal health record,” “patient portal,” “inpatient portal,” “ipad,” “tablet,” or “bedside information technology”), (2) engagement (“engagement,” “empowerment,” “participation,” “activation,” or “self-efficacy”), and (3) in the hospital (“inpatient [MeSH],” “hospital [MeSH],” “hospitalized patient [MeSH],” or “unit”). MeSH terms were used when applicable. Based on previous literature, free-text terms were also used when subject headings were not applied consistently, such as with terms related to engagement.17,21 Studies were excluded if they were not written in English, if they evaluated portals exclusively in the emergency department or ambulatory setting, and/or if they described future study protocols. Studies describing general inpatient technology or evaluating portals used in the hospital but not tethered to inpatient EHR clinical data were also excluded.
By using the Preferred Reporting Items for Systematic Reviews and Meta-Analyses guidelines,22 2 researchers (M.K. and P.H.) completed the literature search and potential article screening. Results were aggregated and studies were screened and excluded from full review based on title and abstract information. Additional studies were included after reference list review. During a full review of included studies, 2 researchers independently extracted data, including the study objective, design, setting, sample, data collection instruments, outcomes, and a description of results. Guided by our study objective, findings were reconciled by consensus and analyzed and described according to the following 3 themes: (1) inpatient portal design, (2) inpatient portal use and usability, and (3) the impact of inpatient portal use on patient or caregiver and healthcare team outcomes as defined by retrieved studies.
The quality of studies was evaluated by the same 2 researchers independently by using the Downs and Black checklist for assessing the methodological quality of randomized and nonrandomized healthcare interventions.23 Qualitative studies describing the development of portal prototypes and/or portal redesign efforts were excluded from these analyses. Discrepancies were resolved by consensus.Because of the wide variability in study designs, populations, and outcomes, a meta-analysis of pooled data was not performed.
RESULTS
Of the 731 studies identified through database searching and reference review, 36 were included for full-text review and 17 met inclusion criteria (Figure; Table 1). Studies excluded after full-text review described portal use outside of the inpatient setting, portals not linked to hospital EHR clinical data, portals not designed for inpatients, and/or inpatient technology in general. The inpatient portal platforms, hardware used, and functionalities varied within included studies (Table 2). The majority of studies used custom, web-based inpatient portal applications on tablet computers. Most provided information about the patients’ hospital medications, healthcare team, and education about their condition and/or a medical glossary. Many included the patient’s schedule, hospital problem list, discharge information, and a way to keep notes.
There has been a recent increase in inpatient portal study publication, with 9 studies published during or after 2016. Five were conducted in the pediatric setting and all but 130 with English-speaking participants. Twelve studies were qualitative, many of which were conducted in multiple phases by using semi-structured interviews and/or focus groups to develop or redesign inpatient portals. Of the remaining studies, 3 used a cross-sectional design, 1 used a before and after design without a control group, and 1 was a nonrandomized trial. Studies were rated as having medium-to-high risk of bias because of design flaws (Table 1 in supplementary Appendix). Because many studies were small pilot studies and all were single-centered studies, the generalizability of findings to different healthcare settings or patient populations is limited.
Inpatient Portal Design
Most included studies evaluated patient and/or caregiver information needs to design and/or enhance inpatient portals.16,24-37 In 1 study, patients described an overall lack of information provided in the hospital and insufficient time to understand and remember information, which, when shared, was often presented by using medical terminology.30 They wanted information to help them understand their daily hospital routine, confirm and compare medications and test results, learn about care, and prepare for discharge. Participants in multiple studies echoed these results, indicating the need for a schedule of upcoming clinical events (eg, medication administration, procedures, imaging), secure and timely clinical information (eg, list of diagnoses and medications, test results), personalized education, a medical glossary, discharge information, and a way to take notes and recognize and communicate with providers.
Patients also requested further information transparency,34,37 including physicians’ notes, radiology results, operative reports, and billing information, along with general hospital information,16 meal ordering,33 and video conferencing.27 ln designing and refining an inpatient medication-tracking tool, participants identified the need for information about medication dosage, frequency, timing, administration method, criticality, alternative medications or forms, and education.26,36 Patients and/or caregivers also indicated interest in communicating with inpatient providers by using the portal.16,27,28,30-37 In 1 study, patients highlighted the need to be involved in care plan development,27 which led to portal refinement to allow for patient-generated data entry, including care goals and a way to communicate real-time concerns and feedback.28
Studies also considered healthcare team perspectives to inform portal design.25,26,28,30,35,37 Although information needs usually overlapped, patient and healthcare team priorities differed in some areas. Although patients wanted to “know what was going to happen to them,” nurses in 1 study were more concerned about providing information to protect patients, such as safety and precaution materials.25 Similarly, when designing a medication-tracking tool, patients sought information that helped them understand what to expect, while pharmacists focused on medication safety and providing information that fit their workflow (eg, abstract medication schedules).36
Identified study data raised important portal interface design considerations. Results suggested clinical data should be presented by using simple displays,28 accommodating real-time information. Participants recommended links16,29 to personalized patient-friendly37 education accessed with minimal steps.26 Interfaces may be personalized for target users, such as patient or proxy and younger or older individuals. For example, older patients reported less familiarity with touch screens, internal keyboards, and handwriting recognition, favoring voice recognition for recording notes.27 This raised questions about how portals can be designed to best maintain patient privacy.25 Interface design, such as navigation, also relied heavily on hardware choice, such as tablet versus mobile phone.28
Inpatient Portal Use and Usability
Most patient and/or caregiver participants in included studies were interested in using an inpatient portal, used it when offered, found it easy to use, useful, and/or were satisfied with it.16,18,24-37 Most used and liked functionalities that provided healthcare team, test result, and medication information.22,33,37 In the 1 identified controlled trial,18 researchers evaluated an inpatient portal given to adult inpatients that included a problem list, schedule, medication list, and healthcare team information. Of the intervention unit patients, 80% used the portal, 76% indicated it was easy to use, and 71% thought it provided useful information. When a portal was given to 239 adult patients and caregivers in another study, 66% sent a total of 291 messages to the healthcare team.31 Of these, 153 provided feedback, 76 expressed preferences, and 16 communicated concerns. In a pediatric study, an inpatient portal was given to 296 parents who sent a total of 36 messages and 176 requests.33 Messages sent included information regarding caregiver needs, questions, updates, and/or positive endorsements of the healthcare team and/or care.
Impact of Inpatient Portal Use
Multiple studies evaluated the impact of inpatient portal use on patient and/or caregiver engagement, empowerment, activation, and/or knowledge, which had mixed results. Most adult patients interviewed in one study had positive experiences using a portal to answer their questions between physician visits and learn about, remember, and engage in care.37 A majority of adult inpatient portal users in another study agreed that portal use helped them feel in control and understand their condition; however, they did not report having improved discharge timing knowledge.29 In a pediatric study, most parent inpatient portal users agreed use improved their ability to monitor, understand, and make decisions about their child’s care.33 In the controlled trial,18 a higher percentage of portal intervention patients could identify their physician or role; however, patient activation was not statistically different between intervention and control patients.
Results from included studies also evaluated the impact of portal use on communication. Some suggest inpatient portal use may replace and/or facilitate verbal communication between patients, caregivers, and providers.35 In a pediatric study, 51% of parent portal users reported it gave them the information they needed, reducing the amount of questions they had for their healthcare team.33 Similarly 43% of 14 adult inpatient portal users in another study thought the portal could replace at least some face-to-face communication.37 Some providers indicated portal use enhanced rounding discussion quality.35 Another study suggested that patient-provider communication via electronic messaging may provide benefits for some patients and not others.37
Multiple studies evaluated patient, caregiver, and/or healthcare team perceptions of the impact of inpatient portal use on detection of errors and patient safety.29,31,33,35 In adult inpatients, 6% agreed portal use could help them find errors.29 In a pediatric study, 8% reported finding at least 1 medication error by using the portal, and 89% thought use reduced errors in their child’s care.33 One patient in a qualitative study of adult inpatients cited an example of a dosing error discovered by using the portal.37 Healthcare providers in another study also reported that use facilitated patient error identification.35
Included studies evaluated the potential impact of portal use on patient anxiety, confusion, and/or worry, and the work of healthcare teams. In 1 study, nurses voiced concerns about giving information subject to change or that couldn’t always be achieved because of competing hospital priorities, such as discharge timing.25 They also worried about giving medical information that would create cognitive overload for patients and/or require professional interpretation. Although providers in another study perceived little negative impact on their workflow after portal implementation, they worried about the potential of adding other information to the portal.35 For example, they were concerned that the future release of abnormal test results or sensitive data would lead to confusion and more time spent answering patient questions. Physicians also worried that secure messaging could be overused by patients, would be used to inappropriately express acute concerns, or might adversely affect verbal communication. Providers in 2 studies expressed concerns about potential negative implications of portal use on their work before implementation, which were subsequently reduced after portal implementation.29,38 Conversely, no parent portal users in another study thought portal information was confusing.33 One parent participant noted portal use may actually decrease anxiety: “Access to their medical information gives patients and their caregivers perspective and insight into their hospital care and empowers them with knowledge about [what is going on], which reduces anxiety.”37
DISCUSSION
We identified multiple studies evaluating the design, use, and impact of inpatient patient portals for hospitalized patients and caregivers. Based on the information needs identified by patients and healthcare team participants, multiple key content and design recommendations are suggested, including presenting (1) timely, personalized clinical and educational information in lay terms, (2) the care trajectory, including care plan and patient schedule, and (3) a way to recognize and communicate with the inpatient healthcare team. Design challenges still exist, such as translating medical terminology from EHRs into patient-friendly language, proxy access, and portal integration across transitions. Data from identified studies suggest hospitalized patients and caregivers are interested in and willing to use inpatient portals, but there is less information about the use of each functionality. Evidence supporting the role of inpatient portal use in improving patient and/or caregiver engagement, knowledge, communication, and the quality and safety of care is currently limited. Included studies indicate that healthcare team members had concerns about using portals to share clinical information and communicate electronically in the hospital. The extent to which these concerns translate to demonstrable problems remains to be seen.
Early studies focus on patient and caregiver information needs and portal interface design. Although the necessity for certain core functionalities and design requirements are becoming clear,20 best practices regarding the amount and timing of information released (eg, physician notes, lab results), optimal hardware decisions (eg, large-screen displays, hospital-owned tablets, bring-your-own-device model), and details around secure-messaging implementation in the acute hospital setting are still lacking. Future work is needed to understand optimal patient-provider communication architectures that support improved synchronous and asynchronous messaging and privacy-preserving approaches to the design of these systems to handle patient-generated data as it becomes more commonplace. Although patient participants in these studies were generally satisfied using inpatient portals, many indicated the need for even more transparency, such as the release of results in real time and inclusion of physician notes (even if they could not be fully comprehended).37 As the movement of sharing notes with patients in the ambulatory setting grows,39 it will inevitably extend to the inpatient setting.40 Further research is needed to understand the impact of increased transparency on health outcomes, patient anxiety, and inpatient healthcare team workload. Although the majority of studies described the design and/or use of custom portal platforms, EHR vendors are now developing inpatient portals that integrate into preexisting systems (eg, MyChart Bedside, Epic Systems). This will increase the likelihood of broad inpatient portal adoption and may facilitate multicenter trials evaluating the impact of their use.
The next steps will need to focus on the evaluation of specific inpatient portal functionalities and the impact of their use on objective process and outcome measures by using rigorous, experimental study designs. Akin to ambulatory portal research, measures of interest will include patient activation,41,42 patient and/or caregiver satisfaction,43 care processes (eg, length of stay, readmissions), and patient safety (eg, safety perceptions, adverse drug events, hospital-acquired conditions, and diagnostic errors). More than a mechanism for unidirectional sharing information from providers to the patient, inpatient portals will also provide a platform for the reciprocal exchange of information from the patient to the provider through patient-generated data, such as goal setting and feedback. Patients may play a larger role in reporting hospital satisfaction in real time, reconciling medications, contributing to the treatment plan, and identifying medical errors. As portals are integrated across the care continuum,20 our understanding of their impact may become more clear.
In this review, only 5 studies were conducted in the pediatric hospital setting.24,32-34,38 With hospitalized children experiencing 3 times more harm from medical errors than adults,44 engaging parents in inpatient care to improve safety has become a national priority.45 Giving patient portals, or “parent portals,” to parents of hospitalized children may provide a unique opportunity to share healthcare information and promote engagement, a direction for future study. There is also a research gap in evaluating adolescent inpatient portal use. Future portals may be designed to incentivize young children to learn about their hospitalization through games linked to health-related education.
Finally, as patients and caregivers begin using inpatient portals, there will almost certainly be consequences for healthcare teams. Understanding and anticipating human and work system factors influencing inpatient portal adoption and use from the perspectives of both patients and healthcare teams are needed.46,47 Engaging healthcare team members as valuable stakeholders during implementation and measuring the impact of portal use on their workload is necessary, especially as portal use spreads beyond pilot units. The success of inpatient portals is dependent upon both the positive benefits for patients and their acceptance by healthcare teams.48
Limitations exist in conducting a systematic literature review.49 The conceptual definition of a portal for hospitalized patients and patient/caregiver engagement is evolving; therefore, our definition may not have captured all relevant studies. We intentionally did not include all inpatient technology, as we were interested in a narrow definition of portals designed for inpatients that provided clinical information from the inpatient EHR. Because of rapid technology changes, we also limited our search to studies published within the last 10 years; prior literature has been described elsewhere.17 We excluded non-English language studies, limiting our ability to capture the full scope of inpatient portal research. These patients already experience healthcare delivery disparities, widened by the inaccessibility of innovative health information technologies.50 Future studies would be enhanced with the inclusion of these participants.
Inpatient portal research is in its infancy but growing rapidly. Studies to date are primarily focused on portal design and have small sample sizes. Early findings suggest that patients and caregivers are, in general, enthusiastic about using inpatient portals. Further research is needed, however, to determine the impact of inpatient portal use on patient engagement and hospital-care quality, safety, and cost.
Disclosure
This work was supported by a Department of Pediatrics Research and Development Grant at the University of Wisconsin School of Medicine and Public Health. This publication was also supported by the Clinical and Translational Science Award program through the National Center for Advancing Translational Sciences, grant UL1TR000427. Dr. Hoonakker’s involvement was also partially supported by the National Science Foundation, grant CMMI 1536987. Funding sources had no involvement in study design, analysis, or interpretation of data. The authors have no conflicts of interest to declare.
1. Stewart M, Brown JB, Donner A, et al. The impact of patient-centered care on outcomes. J Fam Pract. 2000;49(9):796-804. PubMed
2. Little P, Everitt H, Williamson I, et al. Observational study of effect of patient centredness and positive approach on outcomes of general practice consultations. BMJ. 2001;323(7318):908-911. PubMed
3. Maeng DD, Graf TR, Davis DE, Tomcavage J, Bloom FJ, Jr. Can a patient-centered medical home lead to better patient outcomes? The Quality Implications of Geisinger’s ProvenHealth Navigator. Am J Med Qual. 2012;27(3):210-216. PubMed
4. Joint Commision on Accreditation of Healthcare Organizations. Speak up: Prevent errors in your child’s care. http://www.jointcommission.org/Speak_Up_Prevent_Errors_in_Your_Childs_Care/. Accessed June 10, 2017.
5. Committee on Hospital Care and Institute for Patient and Family-centered Care. Patient- and family-centered care and the pediatrician’s role. Pediatrics. 2012;129(2):394-404. PubMed
6. Institute of Medicine Committee on Quality of Health Care in America. Crossing the Quality Chasm: A New Health System for the 21st Century. Washington, DC: National Academy Press; 2001. PubMed
7. Coulter A. Engaging Patients in Healthcare. New York: McGraw-Hill Education; 2011. PubMed
8. Tang PC, Ash JS, Bates DW, Overhage JM, Sands DZ. Personal health records: definitions, benefits, and strategies for overcoming barriers to adoption. J Am Med Inform Assoc. 2006;13(2):121-126. PubMed
9. Schnipper JL, Gandhi TK, Wald JS, et al. Design and implementation of a web-based patient portal linked to an electronic health record designed to improve medication safety: the Patient Gateway medications module. Inform Prim Care. 2008;16(2):147-155. PubMed
10. Blumenthal D, Tavenner M. The “meaningful use” regulation for electronic health records. N Engl J Med. 2010;363(6):501-504. PubMed
11. Ammenwerth E, Schnell-Inderst P, Hoerbst A. The impact of electronic patient portals on patient care: a systematic review of controlled trials. J Med Internet Res. 2012;14(6):e162. PubMed
12. Goldzweig CL, Orshansky G, Paige NM, et al. Electronic patient portals: evidence on health utcomes, satisfaction, efficiency, and attitudes: a systematic review. Ann Intern Med. 2013;159(10):677-687. PubMed
13. Davis Giardina T, Menon S, Parrish DE, Sittig DF, Singh H. Patient access to medical records and healthcare outcomes: a systematic review. J Am Med Inform Assoc. 2014;21(4):737-741. PubMed
14. Kalra D, Fernando B. A review of the empirical evidence of the healthcare benefits of personal health records. Yearb Med Inform. 2013;8(1):93-102. PubMed
15. Kruse CS, Bolton K, Freriks G. The effect of patient portals on quality outcomes and its implications to meaningful use: a systematic review. J Med Internet Res. 2015;17(2):e44. PubMed
16. Vawdrey DK, Wilcox LG, Collins SA, et al. A tablet computer application for patients to participate in their hospital care. AMIA Annu Symp Proc. 2011:1428-1435. PubMed
17. Prey JE, Woollen J, Wilcox L, et al. Patient engagement in the inpatient setting: a systematic review. J Am Med Inform Assoc. 2014;21(4):742-750. PubMed
18. O’Leary KJ, Lohman ME, Culver E, et al. The effect of tablet computers with a mobile patient portal application on hospitalized patients’ knowledge and activation. J Am Med Inform Assoc. 2016;23(1):159-165. PubMed
19. Skeels M, Tan DS. Identifying opportunities for inpatient-centric technology. Proceedings of the 1st ACM International Health Informatics Symposium. Arlington: ACM; 2010:580-589.
20. Collins SA, Rozenblum R, Leung WY, et al. Acute care patient portals: a qualitative study of stakeholder perspectives on current practices. J Am Med Inform Assoc. 2017;24(e1):e9-e17. PubMed
21. Morris D, Karlson A. Dynamic Accessibility Requirements for Hospital Patients. SIGCHI Conference on Human Factors in Computing Systems. Vancouver, BC, Canada: ACM; 2011.
22. Moher D, Liberati A, Tetzlaff J, Altman DG; PRISMA Group. Preferred reporting items for systematic reviews and meta-analyses: the PRISMA statement. BMJ. 2009;339:b2535. PubMed
23. Downs SH, Black N. The feasibility of creating a checklist for the assessment of the methodological quality both of randomised and non-randomised studies of health care interventions. J Epidemiol Community Health. 1998;52(6):377-384. PubMed
24. Weyand SA, Frize M, Bariciak E, Dunn S. Development and usability testing of a parent decision support tool for the neonatal intensive care unit. Conf Proc IEEE Eng Med Biol Soc. 2011:6430-6433. PubMed
25. Caligtan CA, Carroll DL, Hurley AC, Gersh-Zaremski R, Dykes PC. Bedside information technology to support patient-centered care. Int J Med Inform. 2012;81(7):442-451. PubMed
26. Wilcox L, Feiner S, Liu A, Restaino S, Collins S, Vawdrey D. Designing inpatient technology to meet the medication information needs of cardiology patients. Proceedings of the 2nd ACM SIGHIT International Health Informatics Symposium. Miami: ACM; 2012:831-836. PubMed
27. Dykes PC, Carroll DL, Hurley AC, et al. Building and testing a patient-centric electronic bedside communication center. J Gerontol Nurs. 2013;39(1):15-19. PubMed
28. Dykes PC, Stade D, Chang F, et al. Participatory design and development of a patient-centered toolkit to engage hospitalized patients and care partners in their plan of care. AMIA Annu Symp Proc. 2014:486-495. PubMed
29. Pell JM, Mancuso M, Limon S, Oman K, Lin CT. Patient access to electronic health records during hospitalization. JAMA Intern Med. 2015;175(5):856-858. PubMed
30. Yoo S, Lee KH, Baek H, et al. Development and user research of a smart bedside station system toward patient-centered healthcare system. J Med Syst. 2015;39(9):86. PubMed
31. Dalal AK, Dykes PC, Collins S, et al. A web-based, patient-centered toolkit to engage patients and caregivers in the acute care setting: a preliminary evaluation. J Am Med Inform Assoc. 2016;23(1):80-87. PubMed
32. Kaziunas E, Hanauer DA, Ackerman MS, Choi SW. Identifying unmet informational needs in the inpatient setting to increase patient and caregiver engagement in the context of pediatric hematopoietic stem cell transplantation. J Am Med Inform Assoc. 2016;23(1):94-104. PubMed
33. Kelly MM, Hoonakker PLT, Dean SM. Using an inpatient portal to engage families in pediatric hospital care. J Am Med Inform Assoc. 2016;24(1):153-161. PubMed
34. Maher M, Kaziunas E, Ackerman M, et al. User-centered design groups to engage patients and caregivers with a personalized health information technology tool. Biol Blood Marrow Transplant. 2016;22(2):349-358. PubMed
35. O’Leary KJ, Sharma RK, Killarney A, et al. Patients’ and healthcare providers’ perceptions of a mobile portal application for hospitalized patients. BMC Med Inform Decis Mak. 2016;16(1):123-130. PubMed
36. Wilcox L, Woollen J, Prey J, et al. Interactive tools for inpatient medication tracking: a multi-phase study with cardiothoracic surgery patients. J Am Med Inform Assoc. 2016;23(1):144-158. PubMed
37. Woollen J, Prey J, Wilcox L, et al. Patient experiences using an inpatient personal health record. Appl Clin Inform. 2016;7(2):446-460. PubMed
38. Kelly MM, Dean SM, Carayon P, Wetterneck TB, Hoonakker PLT. Healthcare team perceptions of a portal for parents of hospitalized children before and after implementation. Appl Clin Inform. 2017;8(1):265-278. PubMed
39. Wolff JL, Darer JD, Berger A, et al. Inviting patients and care partners to read doctors’ notes: OpenNotes and shared access to electronic medical records. J Am Med Inform Assoc. 2017;24(e1):e166-e172. PubMed
40. Feldman HJ, Walker J, Li J, Delbanco T. OpenNotes:hospitalists’ challenge and opportunity. J Hosp Med. 2013;8(7):414-417. PubMed
41. Hibbard JH, Stockard J, Mahoney ER, Tusler M. Development of the Patient Activation Measure (PAM): conceptualizing and measuring activation in patients and consumers. Health Serv Res. 2004;39(4 Pt 1):1005-1026. PubMed
42. Prey JE, Qian M, Restaino S, et al. Reliability and validity of the patient activation measure in hospitalized patients. Patient Educ Couns. 2016;99(12):2026-2033. PubMed
43. Toomey SL, Zaslavsky AM, Elliott MN, et al. The development of a pediatric inpatient experience of care measure: Child HCAHPS. Pediatrics. 2015;136(2):360-369. PubMed
44. Kaushal R, Bates DW, Landrigan C, et al. Medication errors and adverse drug events in pediatric inpatients. JAMA. 2001;285(16):2114-2120. PubMed
45. Agency for Healthcare Research and Quality. 20 Tips to help prevent medical errors in children. Secondary 20 Tips to help prevent medical errors in children. http://www.ahrq.gov/patients-consumers/care-planning/errors/20tips/index.html. Accessed on June 10, 2017.
46. Thompson MJ, Reilly JD, Valdez RS. Work system barriers to patient, provider, and caregiver use of personal health records: A systematic review. Appl Ergon. 2016;54:218-242. PubMed
47. Holden RJ, Carayon P, Gurses AP, et al. SEIPS 2.0: a human factors framework for studying and improving the work of healthcare professionals and patients. Ergonomics. 2013;56(11):1669-1686. PubMed
48. Gagnon MP, Ngangue P, Payne-Gagnon J, Desmartis M. m-Health adoption by healthcare professionals: a systematic review. J Am Med Inform Assoc. 2016;23(1):212-220. PubMed
49. Russell CL. An overview of the integrative research review. Prog Transplant. 2005;15(1):8-13. PubMed
50. Yamin CK, Emani S, Williams DH, et al. The digital divide in adoption and use of a personal health record. Arch Intern Med. 2011;171(6):568-574. PubMed
© 2017 Society of Hospital Medicine
A Method for Attributing Patient-Level Metrics to Rotating Providers in an Inpatient Setting
Hospitalists’ performance is routinely evaluated by third-party payers, employers, and patients. As hospitalist programs mature, there is a need to develop processes to identify, internally measure, and report on individual and group performance. We know from Society of Hospital Medicine (SHM) data that a significant amount of hospitalists’ total compensation is at least partially based on performance. Often this is based at least in part on quality data. In 2006, SHM issued a white paper detailing the key elements of a successful performance monitoring and reporting process.1,2 Recommendations included the identification of meaningful operational and clinical performance metrics, and the ability to monitor and report both group and individual metrics was highlighted as an essential component. There is evidence that comparison of individual provider performance with that of their peers is a necessary element of successful provider dashboards.3 Additionally, regular feedback and a clear, visual presentation of the data are important components of successful provider feedback dashboards.3-6
Much of the literature regarding provider feedback dashboards has been based in the outpatient setting. The majority of these dashboards focus on the management of chronic illnesses (eg, diabetes and hypertension), rates of preventative care services (eg, colonoscopy or mammogram), or avoidance of unnecessary care (eg, antibiotics for sinusitis).4,5 Unlike in the outpatient setting, in which 1 provider often provides a majority of the care for a given episode of care, hospitalized patients are often cared for by multiple providers, challenging the appropriate attribution of patient-level metrics to specific providers. Under the standard approach, an entire hospitalization is attributed to 1 physician, generally the attending of record for the hospitalization, which may be the admitting provider or the discharging provider, depending on the approach used by the hospital. However, assigning responsibility for an entire hospitalization to a provider who may have only seen the patient for a small percentage of a hospitalization may jeopardize the validity of metrics. As provider metrics are increasingly being used for compensation, it is important to ensure that the method for attribution correctly identifies the providers caring for patients. To our knowledge there is no gold standard approach for attributing metrics to providers when patients are cared for by multiple providers, and the standard attending of record–based approach may lack face validity in many cases.
We aimed to develop and operationalize a system to more fairly attribute patient-level data to individual providers across a single hospitalization even when multiple providers cared for the patient. We then compared our methodology to the standard approach, in which the attending of record receives full attribution for each metric, to determine the difference on a provider level between the 2 models.
METHODS
Clinical Setting
The Johns Hopkins Hospital is a 1145-bed, tertiary-care hospital. Over the years of this project, the Johns Hopkins Hospitalist Program was an approximately 20-physician group providing care in a variety of settings, including a dedicated hospitalist floor, where this metrics program was initiated. Hospitalists in this setting work Monday through Friday, with 1 hospitalist and a moonlighter covering on the weekends. Admissions are performed by an admitter, and overnight care is provided by a nocturnist. Initially 17 beds, this unit expanded to 24 beds in June 2012. For the purposes of this article, we included all general medicine patients admitted to this floor between July 1, 2010, and June 30, 2014, who were cared for by hospitalists. During this period, all patients were inpatients; no patients were admitted under observation status. All of these patients were cared for by hospitalists without housestaff or advanced practitioners. Since 2014, the metrics program has been expanded to other hospitalist-run services in the hospital, but for simplicity, we have not presented these more recent data.
Individual Provider Metrics
Metrics were chosen to reflect institutional quality and efficiency priorities. Our choice of metrics was restricted to those that (1) plausibly reflect provider performance, at least in part, and (2) could be accessed in electronic form (without any manual chart review). Whenever possible, we chose metrics with objective data. Additionally, because funding for this effort was provided by the hospital, we sought to ensure that enough of the metrics were related to cost to justify ongoing hospital support of the project. SAS 9.2 (SAS Institute Inc, Cary, NC) was used to calculate metric weights. Specific metrics included American College of Chest Physicians (ACCP)–compliant venous thromboembolism (VTE) prophylaxis,7 observed-to-expected length of stay (LOS) ratio, percentage of discharges per day, discharges before 3 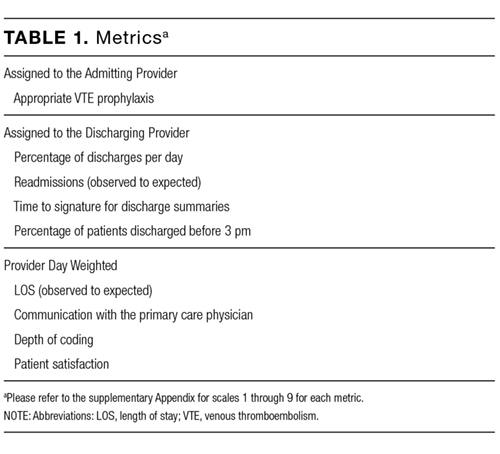
Appropriate prophylaxis for VTE was calculated by using an algorithm embedded within the computerized provider order entry system, which assessed the prescription of ACCP-compliant VTE prophylaxis within 24 hours following admission. This included a risk assessment, and credit was given for no prophylaxis and/or mechanical and/or pharmacologic prophylaxis per the ACCP guidelines.7
Observed-to-expected LOS was defined by using the University HealthSystem Consortium (UHC; now Vizient Inc) expected LOS for the given calendar year. This approach incorporates patient diagnoses, demographics, and other administrative variables to define an expected LOS for each patient.
The percent of patients discharged per day was defined from billing data as the percentage of a provider’s evaluation and management charges that were the final charge of a patient’s stay (regardless of whether a discharge day service was coded).
Discharge prior to 3
Depth of coding was defined as the number of coded diagnoses submitted to the Maryland Health Services Cost Review Commission for determining payment and was viewed as an indicator of the thoroughness of provider documentation.
Patient satisfaction was defined at the patient level (for those patients who turned in patient satisfaction surveys) as the pooled value of the 5 provider questions on the hospital’s patient satisfaction survey administered by Press Ganey: “time the physician spent with you,” “did the physician show concern for your questions/worries,” “did the physician keep you informed,” “friendliness/courtesy of the physician,” and “skill of the physician.”8
Readmission rates were defined as same-hospital readmissions divided by the total number of patients discharged by a given provider, with exclusions based on the Centers for Medicare and Medicaid Services hospital-wide, all-cause readmission measure.1 The expected same-hospital readmission rate was defined for each patient as the observed readmission rate in the entire UHC (Vizient) data set for all patients with the same All Patient Refined Diagnosis Related Group and severity of illness, as we have described previously.9
Communication with the primary care provider was the only self-reported metric used. It was based on a mandatory prompt on the discharge worksheet in the electronic medical record (EMR). Successful communication with the outpatient provider was defined as verbal or electronic communication by the hospitalist with the outpatient provider. Partial (50%) credit was given for providers who attempted but were unsuccessful in communicating with the outpatient provider, for patients for whom the provider had access to the Johns Hopkins EMR system, and for planned admissions without new or important information to convey. No credit was given for providers who indicated that communication was not indicated, who indicated that a patient and/or family would update the provider, or who indicated that the discharge summary would be sufficient.9 Because the discharge worksheet could be initiated at any time during the hospitalization, providers could document communication with the outpatient provider at any point during hospitalization.
Discharge summary turnaround was defined as the average number of days elapsed between the day of discharge and the signing of the discharge summary in the EMR.
Assigning Ownership of Patients to Individual Providers
Using billing data, we assigned ownership of patient care based on the type, timing, and number of charges that occurred during each hospitalization (Figure 1). Eligible charges included all history and physical (codes 99221, 99222, and 99223), subsequent care (codes 99231, 99232, and 99233), and discharge charges (codes 99238 and 99239).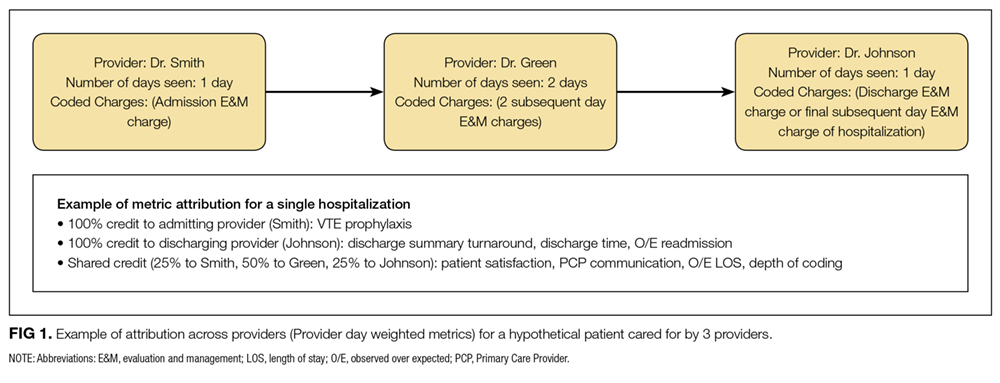
By using a unique identifier assigned for each hospitalization, professional fees submitted by providers were used to identify which provider saw the patient on the admission day, discharge day, as well as subsequent care days. Providers’ productivity, bonus supplements, and policy compliance were determined by using billing data, which encouraged the prompt submittal of charges.
The provider who billed the admission history and physical (codes 99221, 99222, and 99223) within 1 calendar date of the patient’s initial admission was defined as the admitting provider. Patients transferred to the hospitalist service from other services were not assigned an admitting hospitalist. The sole metric assigned to the admitting hospitalist was ACCP-compliant VTE prophylaxis.
The provider who billed the final subsequent care or discharge code (codes 99231, 99232, 99233, 99238, and 99239) within 1 calendar date of discharge was defined as the discharging provider. For hospitalizations characterized by a single provider charge (eg, for patients admitted and discharged on the same day), the provider billing this charge was assigned as both the admitting and discharging physician. Patients upgraded to the intensive care unit (ICU) were not counted as a discharge unless the patient was downgraded and discharged from the hospitalist service. The discharging provider was assigned responsibility for the time of discharge, the percent of patients discharged per day, the discharge summary turnaround time, and hospital readmissions.
Metrics that were assigned to multiple providers for a single hospitalization were termed “provider day–weighted” metrics. The formula for calculating the weight for each provider day–weighted metric was as follows: weight for provider A = [number of daily charges billed by provider A] divided by [LOS +1]. The initial hospital day was counted as day 0. LOS plus 1 was used to recognize that a typical hospitalization will have a charge on the day of admission (day 0) and a charge on the day of discharge such that an LOS of 2 days (eg, a patient admitted on Monday and discharged on Wednesday) will have 3 daily charges. Provider day–weighted metrics included patient satisfaction, communication with the outpatient provider, depth of coding, and observed-to-expected LOS.
Our billing software prevented providers from the same group from billing multiple daily charges, thus ensuring that there were no duplicated charges submitted for a given day.
Presenting Results
Providers were only shown data from the day-weighted approach. For ease of visual interpretation, scores for each metric were scaled ordinally from 1 (worst performance) to 9 (best performance; Table 1). Data were displayed in a dashboard format on a password-protected website for each provider to view his or her own data relative to that of the hospitalist peer group. The dashboard was implemented in this format on July 1, 2011. Data were updated quarterly (Figure 2).
Results were displayed in a polyhedral or spider-web graph (Figure 2). Provider and group metrics were scaled according to predefined benchmarks established for each metric and standardized to a scale ranging from 1 to 9. The scale for each metric was set based on examining historical data and group median performance on the metrics to ensure that there was a range of performance (ie, to avoid having most hospitalists scoring a 1 or 9). Scaling thresholds were periodically adjusted as appropriate to maintain good visual discrimination. Higher scores (creating a larger-volume polygon) are desirable even for metrics such as LOS, for which a low value is desirable. Both a spider-web graph and trends over time were available to the provider (Figure 2). These graphs display a comparison of the individual provider scores for each metric to the hospitalist group average for that metric.
Comparison with the Standard (Attending of Record) Method of Attribution
For the purposes of this report, we sought to determine whether there were meaningful differences between our day-weighted approach versus the standard method of attribution, in which the attending of record is assigned responsibility for each metric that would not have been attributed to the discharging attending under both methods. Our goal was to determine where and whether there was a meaningful difference between the 2 methodologies, recognizing that the degree of difference between these 2 methodologies might vary in other institutions and settings. In our hospital, the attending of record is generally the discharging attending. In order to compare the 2 methodologies, we arbitrarily picked 2015 to retrospectively evaluate the differences between these 2 methods of attribution. We did not display or provide data using the standard methodology to providers at any point; this approach was used only for the purposes of this report. Because these metrics are intended to evaluate relative provider performance, we assigned a percentile to each provider for his or her performance on the given metric using our attribution methodology and then, similarly, assigned a percentile to each provider using the standard methodology. This yielded 2 percentile scores for each provider and each metric. We then compared these percentile ranks for providers in 2 ways: (1) we determined how often providers who scored in the top half of the group for a given metric (above the 50th percentile) also scored in the top half of the group for that metric by using the other calculation method, and (2) we calculated the absolute value of the difference in percentiles between the 2 methods to characterize the impact on a provider’s ranking for that metric that might result from switching to the other method. For instance, if a provider scored at the 20th percentile for the group in patient satisfaction with 1 attribution method and scored at the 40th percentile for the group in patient satisfaction using the other method, the absolute change in percentile would be 20 percentile points. But, this provider would still be below the 50th percentile by both methods (concordant bottom half performance). We did not perform this comparison for metrics assigned to the discharging provider (such as discharge summary turnaround time or readmissions) because the attending of record designation is assigned to the discharging provider at our hospital.
RESULTS
The dashboard was successfully operationalized on July 1, 2011, with displays visible to providers as shown in Figure 2. Consistent with the principles of providing effective performance feedback to providers, the display simultaneously showed providers their individual performance as well as the performance of their peers. Providers were able to view their spider-web plot for prior quarters. Not shown are additional views that allowed providers to see quarterly trends in their data versus their peers across several fiscal years. Also available to providers was their ranking relative to their peers for each metric; specific peers were deidentified in the display.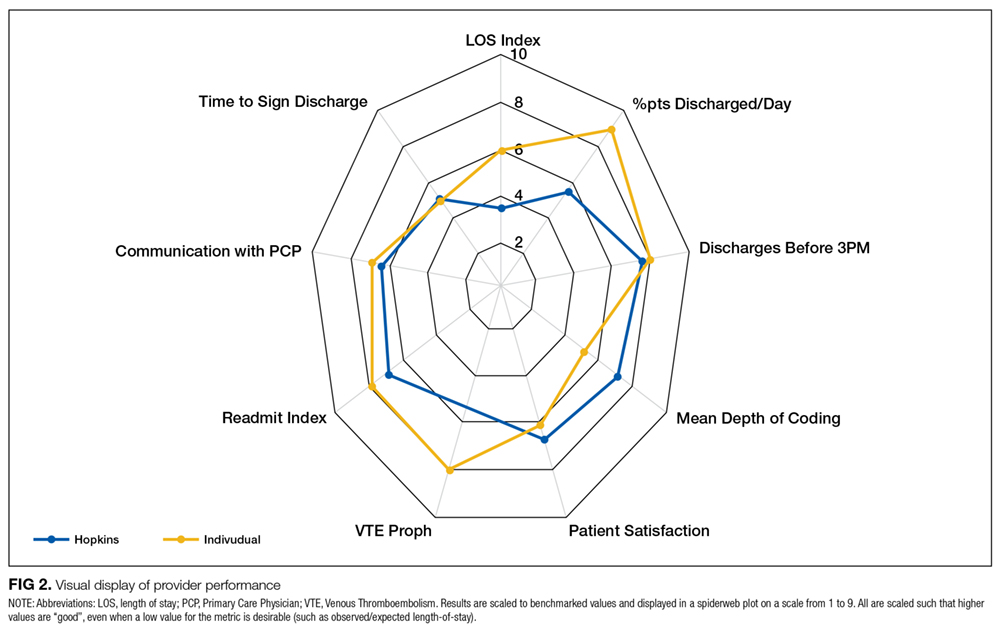
There was notable discordance between provider rankings between the 2 methodologies, as shown in Table 2. Provider performance above or below the median was concordant 56% to 75% of the time (depending on the particular metric), indicating substantial discordance because top-half or bottom-half concordance would be expected to occur by chance 50% of the time. Although the provider percentile differences between the 2 methods tended to be modest for most providers (the median difference between the methods was 13 to 22 percentile points for the various metrics), there were some providers for whom the method of calculation dramatically impacted their rankings. For 5 of the 6 metrics we examined, at least 1 provider had a 50-percentile or greater change in his or her ranking based on the method used. This indicates that at least some providers would have had markedly different scores relative to their peers had we used the alternative methodology (Table 2). In VTE prophylaxis, for example, at least 1 provider had a 94-percentile change in his or her ranking; similarly, a provider had an 88-perentile change in his or her LOS ranking between the 2 methodologies.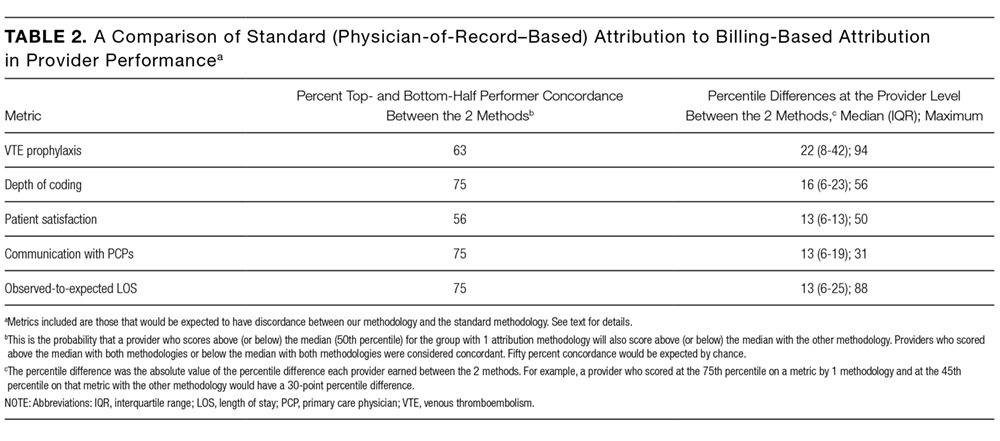
DISCUSSION
We found that it is possible to assign metrics across 1 hospital stay to multiple providers by using billing data. We also found a meaningful discrepancy in how well providers scored (relative to their peers) based on the method used for attribution. These results imply that hospitals should consider attributing performance metrics based on ascribed ownership from billing data and not just from attending of record status.
As hospitalist programs and providers in general are increasingly being asked to develop dashboards to monitor individual and group performance, correctly attributing care to providers is likely to become increasingly important. Experts agree that principles of effective provider performance dashboards include ranking individual provider performance relative to peers, clearly displaying data in an easily accessible format, and ensuring that data can be credibly attributed to the individual provider.3,4,6 However, there appears to be no gold standard method for attribution, especially in the inpatient setting. Our results imply that hospitals should consider attributing performance metrics based on ascribed ownership from billing data and not just from attending of record status.
Several limitations of our findings are important to consider. First, our program is a relatively small, academic group with handoffs that typically occur every 1 to 2 weeks and sometimes with additional handoffs on weekends. Different care patterns and settings might impact the utility of our attribution methodology relative to the standard methodology. Additionally, it is important to note that the relative merits of the different methodologies cannot be ascertained from our comparison. We can demonstrate discordance between the attribution methodologies, but we cannot say that 1 method is correct and the other is flawed. Although we believe that our day-weighted approach feels fairer to providers based on group input and feedback, we did not conduct a formal survey to examine providers’ preferences for the standard versus day-weighted approaches. The appropriateness of a particular attribution method needs to be assessed locally and may vary based on the clinical setting. For instance, on a service in which patients are admitted for procedures, it may make more sense to attribute the outcome of the case to the proceduralist even if that provider did not bill for the patient’s care on a daily basis. Finally, the computational requirements of our methodology are not trivial and require linking billing data with administrative patient-level data, which may be challenging to operationalize in some institutions.
These limitations aside, we believe that our attribution methodology has face validity. For example, a provider might be justifiably frustrated if, using the standard methodology, he or she is charged with the LOS of a patient who had been hospitalized for months, particularly if that patient is discharged shortly after the provider assumes care. Our method addresses this type of misattribution. Particularly when individual provider compensation is based on performance on metrics (as is the case at our institution), optimizing provider attribution to particular patients may be important, and face validity may be required for group buy-in.
In summary, we have demonstrated that it is possible to use billing data to assign ownership of patients to multiple providers over 1 hospital stay. This could be applied to other hospitalist programs as well as other healthcare settings in which multiple providers care for patients during 1 healthcare encounter (eg, ICUs).
Disclosure
The authors declare they have no relevant conflicts of interest.
1. Horwitz L, Partovian C, Lin Z, et al. Hospital-Wide (All-Condition) 30‐Day Risk-Standardized Readmission Measure. https://www.cms.gov/Medicare/Quality-Initiatives-Patient-Assessment-Instruments/MMS/downloads/MMSHospital-WideAll-ConditionReadmissionRate.pdf. Accessed March 6, 2015.
2. Medicine SoH. Measuring Hospitalist Performance: Metrics, Reports, and Dashboards. 2007; https://www.hospitalmedicine.org/Web/Practice_Management/Products_and_Programs/measure_hosp_perf_metrics_reports_dashboards.aspx. Accessed May 12, 2013.
3. Teleki SS, Shaw R, Damberg CL, McGlynn EA. Providing performance feedback to individual physicians: current practice and emerging lessons. Santa Monica, CA: RAND Corporation; 2006. 1-47. https://www.rand.org/content/dam/rand/pubs/working_papers/2006/RAND_WR381.pdf. Accessed August, 2017.
4. Brehaut JC, Colquhoun HL, Eva KW, et al. Practice Feedback Interventions: 15 Suggestions for Optimizing Effectiveness Practice Feedback Interventions. Ann Intern Med. 2016;164(6):435-441. PubMed
5. Dowding D, Randell R, Gardner P, et al. Dashboards for improving patient care: review of the literature. Int J Med Inform. 2015;84(2):87-100. PubMed
6. Landon BE, Normand S-LT, Blumenthal D, Daley J. Physician clinical performance assessment: prospects and barriers. JAMA. 2003;290(9):1183-1189. PubMed
7. Guyatt GH, Akl EA, Crowther M, Gutterman DD, Schuünemann HJ. Executive summary: Antit hrombotic therapy and prevention of thrombosis, 9th ed: American College of Chest Physicians evidence-based clinical practice guidelines. Ann Intern Med. 2012;141(2 suppl):7S-47S. PubMed
8. Siddiqui Z, Qayyum R, Bertram A, et al. Does Provider Self-reporting of Etiquette Behaviors Improve Patient Experience? A Randomized Controlled Trial. J Hosp Med. 2017;12(6):402-406. PubMed
9. Oduyebo I, Lehmann CU, Pollack CE, et al. Association of self-reported hospital discharge handoffs with 30-day readmissions. JAMA Intern Med. 2013;173(8):624-629. PubMed
Hospitalists’ performance is routinely evaluated by third-party payers, employers, and patients. As hospitalist programs mature, there is a need to develop processes to identify, internally measure, and report on individual and group performance. We know from Society of Hospital Medicine (SHM) data that a significant amount of hospitalists’ total compensation is at least partially based on performance. Often this is based at least in part on quality data. In 2006, SHM issued a white paper detailing the key elements of a successful performance monitoring and reporting process.1,2 Recommendations included the identification of meaningful operational and clinical performance metrics, and the ability to monitor and report both group and individual metrics was highlighted as an essential component. There is evidence that comparison of individual provider performance with that of their peers is a necessary element of successful provider dashboards.3 Additionally, regular feedback and a clear, visual presentation of the data are important components of successful provider feedback dashboards.3-6
Much of the literature regarding provider feedback dashboards has been based in the outpatient setting. The majority of these dashboards focus on the management of chronic illnesses (eg, diabetes and hypertension), rates of preventative care services (eg, colonoscopy or mammogram), or avoidance of unnecessary care (eg, antibiotics for sinusitis).4,5 Unlike in the outpatient setting, in which 1 provider often provides a majority of the care for a given episode of care, hospitalized patients are often cared for by multiple providers, challenging the appropriate attribution of patient-level metrics to specific providers. Under the standard approach, an entire hospitalization is attributed to 1 physician, generally the attending of record for the hospitalization, which may be the admitting provider or the discharging provider, depending on the approach used by the hospital. However, assigning responsibility for an entire hospitalization to a provider who may have only seen the patient for a small percentage of a hospitalization may jeopardize the validity of metrics. As provider metrics are increasingly being used for compensation, it is important to ensure that the method for attribution correctly identifies the providers caring for patients. To our knowledge there is no gold standard approach for attributing metrics to providers when patients are cared for by multiple providers, and the standard attending of record–based approach may lack face validity in many cases.
We aimed to develop and operationalize a system to more fairly attribute patient-level data to individual providers across a single hospitalization even when multiple providers cared for the patient. We then compared our methodology to the standard approach, in which the attending of record receives full attribution for each metric, to determine the difference on a provider level between the 2 models.
METHODS
Clinical Setting
The Johns Hopkins Hospital is a 1145-bed, tertiary-care hospital. Over the years of this project, the Johns Hopkins Hospitalist Program was an approximately 20-physician group providing care in a variety of settings, including a dedicated hospitalist floor, where this metrics program was initiated. Hospitalists in this setting work Monday through Friday, with 1 hospitalist and a moonlighter covering on the weekends. Admissions are performed by an admitter, and overnight care is provided by a nocturnist. Initially 17 beds, this unit expanded to 24 beds in June 2012. For the purposes of this article, we included all general medicine patients admitted to this floor between July 1, 2010, and June 30, 2014, who were cared for by hospitalists. During this period, all patients were inpatients; no patients were admitted under observation status. All of these patients were cared for by hospitalists without housestaff or advanced practitioners. Since 2014, the metrics program has been expanded to other hospitalist-run services in the hospital, but for simplicity, we have not presented these more recent data.
Individual Provider Metrics
Metrics were chosen to reflect institutional quality and efficiency priorities. Our choice of metrics was restricted to those that (1) plausibly reflect provider performance, at least in part, and (2) could be accessed in electronic form (without any manual chart review). Whenever possible, we chose metrics with objective data. Additionally, because funding for this effort was provided by the hospital, we sought to ensure that enough of the metrics were related to cost to justify ongoing hospital support of the project. SAS 9.2 (SAS Institute Inc, Cary, NC) was used to calculate metric weights. Specific metrics included American College of Chest Physicians (ACCP)–compliant venous thromboembolism (VTE) prophylaxis,7 observed-to-expected length of stay (LOS) ratio, percentage of discharges per day, discharges before 3
Appropriate prophylaxis for VTE was calculated by using an algorithm embedded within the computerized provider order entry system, which assessed the prescription of ACCP-compliant VTE prophylaxis within 24 hours following admission. This included a risk assessment, and credit was given for no prophylaxis and/or mechanical and/or pharmacologic prophylaxis per the ACCP guidelines.7
Observed-to-expected LOS was defined by using the University HealthSystem Consortium (UHC; now Vizient Inc) expected LOS for the given calendar year. This approach incorporates patient diagnoses, demographics, and other administrative variables to define an expected LOS for each patient.
The percent of patients discharged per day was defined from billing data as the percentage of a provider’s evaluation and management charges that were the final charge of a patient’s stay (regardless of whether a discharge day service was coded).
Discharge prior to 3
Depth of coding was defined as the number of coded diagnoses submitted to the Maryland Health Services Cost Review Commission for determining payment and was viewed as an indicator of the thoroughness of provider documentation.
Patient satisfaction was defined at the patient level (for those patients who turned in patient satisfaction surveys) as the pooled value of the 5 provider questions on the hospital’s patient satisfaction survey administered by Press Ganey: “time the physician spent with you,” “did the physician show concern for your questions/worries,” “did the physician keep you informed,” “friendliness/courtesy of the physician,” and “skill of the physician.”8
Readmission rates were defined as same-hospital readmissions divided by the total number of patients discharged by a given provider, with exclusions based on the Centers for Medicare and Medicaid Services hospital-wide, all-cause readmission measure.1 The expected same-hospital readmission rate was defined for each patient as the observed readmission rate in the entire UHC (Vizient) data set for all patients with the same All Patient Refined Diagnosis Related Group and severity of illness, as we have described previously.9
Communication with the primary care provider was the only self-reported metric used. It was based on a mandatory prompt on the discharge worksheet in the electronic medical record (EMR). Successful communication with the outpatient provider was defined as verbal or electronic communication by the hospitalist with the outpatient provider. Partial (50%) credit was given for providers who attempted but were unsuccessful in communicating with the outpatient provider, for patients for whom the provider had access to the Johns Hopkins EMR system, and for planned admissions without new or important information to convey. No credit was given for providers who indicated that communication was not indicated, who indicated that a patient and/or family would update the provider, or who indicated that the discharge summary would be sufficient.9 Because the discharge worksheet could be initiated at any time during the hospitalization, providers could document communication with the outpatient provider at any point during hospitalization.
Discharge summary turnaround was defined as the average number of days elapsed between the day of discharge and the signing of the discharge summary in the EMR.
Assigning Ownership of Patients to Individual Providers
Using billing data, we assigned ownership of patient care based on the type, timing, and number of charges that occurred during each hospitalization (Figure 1). Eligible charges included all history and physical (codes 99221, 99222, and 99223), subsequent care (codes 99231, 99232, and 99233), and discharge charges (codes 99238 and 99239).
By using a unique identifier assigned for each hospitalization, professional fees submitted by providers were used to identify which provider saw the patient on the admission day, discharge day, as well as subsequent care days. Providers’ productivity, bonus supplements, and policy compliance were determined by using billing data, which encouraged the prompt submittal of charges.
The provider who billed the admission history and physical (codes 99221, 99222, and 99223) within 1 calendar date of the patient’s initial admission was defined as the admitting provider. Patients transferred to the hospitalist service from other services were not assigned an admitting hospitalist. The sole metric assigned to the admitting hospitalist was ACCP-compliant VTE prophylaxis.
The provider who billed the final subsequent care or discharge code (codes 99231, 99232, 99233, 99238, and 99239) within 1 calendar date of discharge was defined as the discharging provider. For hospitalizations characterized by a single provider charge (eg, for patients admitted and discharged on the same day), the provider billing this charge was assigned as both the admitting and discharging physician. Patients upgraded to the intensive care unit (ICU) were not counted as a discharge unless the patient was downgraded and discharged from the hospitalist service. The discharging provider was assigned responsibility for the time of discharge, the percent of patients discharged per day, the discharge summary turnaround time, and hospital readmissions.
Metrics that were assigned to multiple providers for a single hospitalization were termed “provider day–weighted” metrics. The formula for calculating the weight for each provider day–weighted metric was as follows: weight for provider A = [number of daily charges billed by provider A] divided by [LOS +1]. The initial hospital day was counted as day 0. LOS plus 1 was used to recognize that a typical hospitalization will have a charge on the day of admission (day 0) and a charge on the day of discharge such that an LOS of 2 days (eg, a patient admitted on Monday and discharged on Wednesday) will have 3 daily charges. Provider day–weighted metrics included patient satisfaction, communication with the outpatient provider, depth of coding, and observed-to-expected LOS.
Our billing software prevented providers from the same group from billing multiple daily charges, thus ensuring that there were no duplicated charges submitted for a given day.
Presenting Results
Providers were only shown data from the day-weighted approach. For ease of visual interpretation, scores for each metric were scaled ordinally from 1 (worst performance) to 9 (best performance; Table 1). Data were displayed in a dashboard format on a password-protected website for each provider to view his or her own data relative to that of the hospitalist peer group. The dashboard was implemented in this format on July 1, 2011. Data were updated quarterly (Figure 2).
Results were displayed in a polyhedral or spider-web graph (Figure 2). Provider and group metrics were scaled according to predefined benchmarks established for each metric and standardized to a scale ranging from 1 to 9. The scale for each metric was set based on examining historical data and group median performance on the metrics to ensure that there was a range of performance (ie, to avoid having most hospitalists scoring a 1 or 9). Scaling thresholds were periodically adjusted as appropriate to maintain good visual discrimination. Higher scores (creating a larger-volume polygon) are desirable even for metrics such as LOS, for which a low value is desirable. Both a spider-web graph and trends over time were available to the provider (Figure 2). These graphs display a comparison of the individual provider scores for each metric to the hospitalist group average for that metric.
Comparison with the Standard (Attending of Record) Method of Attribution
For the purposes of this report, we sought to determine whether there were meaningful differences between our day-weighted approach versus the standard method of attribution, in which the attending of record is assigned responsibility for each metric that would not have been attributed to the discharging attending under both methods. Our goal was to determine where and whether there was a meaningful difference between the 2 methodologies, recognizing that the degree of difference between these 2 methodologies might vary in other institutions and settings. In our hospital, the attending of record is generally the discharging attending. In order to compare the 2 methodologies, we arbitrarily picked 2015 to retrospectively evaluate the differences between these 2 methods of attribution. We did not display or provide data using the standard methodology to providers at any point; this approach was used only for the purposes of this report. Because these metrics are intended to evaluate relative provider performance, we assigned a percentile to each provider for his or her performance on the given metric using our attribution methodology and then, similarly, assigned a percentile to each provider using the standard methodology. This yielded 2 percentile scores for each provider and each metric. We then compared these percentile ranks for providers in 2 ways: (1) we determined how often providers who scored in the top half of the group for a given metric (above the 50th percentile) also scored in the top half of the group for that metric by using the other calculation method, and (2) we calculated the absolute value of the difference in percentiles between the 2 methods to characterize the impact on a provider’s ranking for that metric that might result from switching to the other method. For instance, if a provider scored at the 20th percentile for the group in patient satisfaction with 1 attribution method and scored at the 40th percentile for the group in patient satisfaction using the other method, the absolute change in percentile would be 20 percentile points. But, this provider would still be below the 50th percentile by both methods (concordant bottom half performance). We did not perform this comparison for metrics assigned to the discharging provider (such as discharge summary turnaround time or readmissions) because the attending of record designation is assigned to the discharging provider at our hospital.
RESULTS
The dashboard was successfully operationalized on July 1, 2011, with displays visible to providers as shown in Figure 2. Consistent with the principles of providing effective performance feedback to providers, the display simultaneously showed providers their individual performance as well as the performance of their peers. Providers were able to view their spider-web plot for prior quarters. Not shown are additional views that allowed providers to see quarterly trends in their data versus their peers across several fiscal years. Also available to providers was their ranking relative to their peers for each metric; specific peers were deidentified in the display.
There was notable discordance between provider rankings between the 2 methodologies, as shown in Table 2. Provider performance above or below the median was concordant 56% to 75% of the time (depending on the particular metric), indicating substantial discordance because top-half or bottom-half concordance would be expected to occur by chance 50% of the time. Although the provider percentile differences between the 2 methods tended to be modest for most providers (the median difference between the methods was 13 to 22 percentile points for the various metrics), there were some providers for whom the method of calculation dramatically impacted their rankings. For 5 of the 6 metrics we examined, at least 1 provider had a 50-percentile or greater change in his or her ranking based on the method used. This indicates that at least some providers would have had markedly different scores relative to their peers had we used the alternative methodology (Table 2). In VTE prophylaxis, for example, at least 1 provider had a 94-percentile change in his or her ranking; similarly, a provider had an 88-perentile change in his or her LOS ranking between the 2 methodologies.
DISCUSSION
We found that it is possible to assign metrics across 1 hospital stay to multiple providers by using billing data. We also found a meaningful discrepancy in how well providers scored (relative to their peers) based on the method used for attribution. These results imply that hospitals should consider attributing performance metrics based on ascribed ownership from billing data and not just from attending of record status.
As hospitalist programs and providers in general are increasingly being asked to develop dashboards to monitor individual and group performance, correctly attributing care to providers is likely to become increasingly important. Experts agree that principles of effective provider performance dashboards include ranking individual provider performance relative to peers, clearly displaying data in an easily accessible format, and ensuring that data can be credibly attributed to the individual provider.3,4,6 However, there appears to be no gold standard method for attribution, especially in the inpatient setting. Our results imply that hospitals should consider attributing performance metrics based on ascribed ownership from billing data and not just from attending of record status.
Several limitations of our findings are important to consider. First, our program is a relatively small, academic group with handoffs that typically occur every 1 to 2 weeks and sometimes with additional handoffs on weekends. Different care patterns and settings might impact the utility of our attribution methodology relative to the standard methodology. Additionally, it is important to note that the relative merits of the different methodologies cannot be ascertained from our comparison. We can demonstrate discordance between the attribution methodologies, but we cannot say that 1 method is correct and the other is flawed. Although we believe that our day-weighted approach feels fairer to providers based on group input and feedback, we did not conduct a formal survey to examine providers’ preferences for the standard versus day-weighted approaches. The appropriateness of a particular attribution method needs to be assessed locally and may vary based on the clinical setting. For instance, on a service in which patients are admitted for procedures, it may make more sense to attribute the outcome of the case to the proceduralist even if that provider did not bill for the patient’s care on a daily basis. Finally, the computational requirements of our methodology are not trivial and require linking billing data with administrative patient-level data, which may be challenging to operationalize in some institutions.
These limitations aside, we believe that our attribution methodology has face validity. For example, a provider might be justifiably frustrated if, using the standard methodology, he or she is charged with the LOS of a patient who had been hospitalized for months, particularly if that patient is discharged shortly after the provider assumes care. Our method addresses this type of misattribution. Particularly when individual provider compensation is based on performance on metrics (as is the case at our institution), optimizing provider attribution to particular patients may be important, and face validity may be required for group buy-in.
In summary, we have demonstrated that it is possible to use billing data to assign ownership of patients to multiple providers over 1 hospital stay. This could be applied to other hospitalist programs as well as other healthcare settings in which multiple providers care for patients during 1 healthcare encounter (eg, ICUs).
Disclosure
The authors declare they have no relevant conflicts of interest.
1. Horwitz L, Partovian C, Lin Z, et al. Hospital-Wide (All-Condition) 30‐Day Risk-Standardized Readmission Measure. https://www.cms.gov/Medicare/Quality-Initiatives-Patient-Assessment-Instruments/MMS/downloads/MMSHospital-WideAll-ConditionReadmissionRate.pdf. Accessed March 6, 2015.
2. Medicine SoH. Measuring Hospitalist Performance: Metrics, Reports, and Dashboards. 2007; https://www.hospitalmedicine.org/Web/Practice_Management/Products_and_Programs/measure_hosp_perf_metrics_reports_dashboards.aspx. Accessed May 12, 2013.
3. Teleki SS, Shaw R, Damberg CL, McGlynn EA. Providing performance feedback to individual physicians: current practice and emerging lessons. Santa Monica, CA: RAND Corporation; 2006. 1-47. https://www.rand.org/content/dam/rand/pubs/working_papers/2006/RAND_WR381.pdf. Accessed August, 2017.
4. Brehaut JC, Colquhoun HL, Eva KW, et al. Practice Feedback Interventions: 15 Suggestions for Optimizing Effectiveness Practice Feedback Interventions. Ann Intern Med. 2016;164(6):435-441. PubMed
5. Dowding D, Randell R, Gardner P, et al. Dashboards for improving patient care: review of the literature. Int J Med Inform. 2015;84(2):87-100. PubMed
6. Landon BE, Normand S-LT, Blumenthal D, Daley J. Physician clinical performance assessment: prospects and barriers. JAMA. 2003;290(9):1183-1189. PubMed
7. Guyatt GH, Akl EA, Crowther M, Gutterman DD, Schuünemann HJ. Executive summary: Antit hrombotic therapy and prevention of thrombosis, 9th ed: American College of Chest Physicians evidence-based clinical practice guidelines. Ann Intern Med. 2012;141(2 suppl):7S-47S. PubMed
8. Siddiqui Z, Qayyum R, Bertram A, et al. Does Provider Self-reporting of Etiquette Behaviors Improve Patient Experience? A Randomized Controlled Trial. J Hosp Med. 2017;12(6):402-406. PubMed
9. Oduyebo I, Lehmann CU, Pollack CE, et al. Association of self-reported hospital discharge handoffs with 30-day readmissions. JAMA Intern Med. 2013;173(8):624-629. PubMed
© 2017 Society of Hospital Medicine
Near and Far
A previously healthy 30-year-old woman presented to the emergency department with 2 weeks of weakness.
True muscle weakness must be distinguished from the more common causes of asthenia. Many systemic disorders produce fatigue, with resulting functional limitation that is often interpreted by patients as weakness. Initial history should focus on conditions producing fatigue, such as cardiopulmonary disease, anemia, connective tissue disease, depression or cachexia related to malignancy, infection, or other inflammatory states. Careful questioning may reveal evidence of dyspnea, poor exercise tolerance, or joint pain as an alternative to actual loss of muscle power. If true weakness is still suspected, attention should be focused on the pattern, onset, anatomic site, and progression of weakness. Muscle weakness is often characterized by difficulty with specific tasks, such as climbing stairs, rising from a chair, raising a hand, or using cutlery. The physical examination is critical in determining whether weakness is due to true loss of motor power. The differential diagnosis of weakness is broad and includes neurologic, infectious, endocrine, inflammatory, genetic, metabolic, and drug-induced etiologies.
She initially experienced 3 days of mild cramps and soreness in her thighs. She then developed weakness that began in her thighs and progressed to involve her lower legs and upper and lower arms. She had difficulty combing her hair. She required the use of her arms to get up from a chair. She grasped onto objects to aid in ambulation around the house. In addition, she described 1 year of moderate fatigue but no fever, weight loss, dyspnea, dysphagia, visual changes, paresthesias, bowel or bladder incontinence, back pain, or preceding gastrointestinal or respiratory illness. She had experienced diffuse intermittent hives, most prominent in her chest and upper arms, for the past several weeks.
History certainly supports true weakness but will need to be confirmed on examination. The distribution began as proximal but now appears diffuse. The presence of myalgia and cramping raises the possibility of noninflammatory myopathies, which are usually more insidious in onset. A severe electrolyte disturbance would be possible, based on the diffuse nature of weakness that was preceded by cramping. The distribution of weakness and lack of bowel or bladder incontinence is reassuring and suggests against a spinal cord disorder; however, a high index of suspicion must be maintained for myelopathy because delayed treatment might result in irreversible paralysis.
The patient’s course also includes hives. Common causes of hives include infections and allergic reactions to medications, foods, and insect stings. Urticaria may also result from systemic disorders, such as vasculitis, lupus, lymphoma, mastocytosis, and paraproteinemias, which can be associated with weakness and fatigue. Although severe weakness in combination with hives makes an infectious and allergic reaction less likely, we still seek to ascertain if the evolving chief complaints of weakness and hives are the result of a single unifying and evolving multisystem disorder or are distinct and unrelated processes.
Her past medical history included fibromyalgia, kidney stones, and gastroesophageal reflux disease. One week prior to presentation, she was prescribed prednisone 60 mg daily for the treatment of hives; the dose had been tapered to 40 mg at presentation, with mild improvement of hives. She recently started doxepin for fibromyalgia and insomnia. She lived at home with her husband and 8-year-old child. She worked as a clerk in a pest control office and denied any pesticide exposure. She denied tobacco, alcohol, or illicit drug use. Her family history included systemic lupus erythematosus (SLE) in her mother and maternal aunt.
Glucocorticoids are associated with myopathy; however, the weakness preceded steroid therapy. Thus, unless there was unknown exposure to high-dose steroid medication to treat recurrent episodes of urticaria earlier in her course, glucocorticoid-related myopathy is unlikely. Fibromyalgia might cause the perception of weakness from pain. However, the history of difficulty combing her hair and rising from a chair suggests actual loss of motor power. The side effects of her medications, such as newly started doxepin, must be reviewed. A family history of SLE raises concern for rheumatologic conditions; however, one might expect improvement with steroid therapy.
On physical examination, her temperature was 36.9 °C, blood pressure 126/93 mmHg, pulse 81 beats per minute, respiratory rate 16 breaths per minute, and oxygen saturation 100% on ambient air. Her cardiopulmonary examination was normal. Her abdomen was nontender and without hepatosplenomegaly. Her strength was 2 out of 5 in proximal and distal legs, bilaterally, and 4 out of 5 in proximal and distal upper extremities. She had normal muscle tone without fasciculations or atrophy. Her joints were without edema, erythema, or impaired range of motion. She had normal sensation to light touch in arms and legs. Her reflexes were 2+ in the patellar, Achilles, and brachioradialis tendons. She had no lymphadenopathy, mucosal ulcerations, or alopecia. A skin examination revealed smooth, slightly elevated, and faded pink wheals that were diffuse but most prominent in upper arms and chest.
Physical examination confirms the presence of true muscle weakness. The differential diagnosis is narrowed by several findings, both positive and negative, elicited in the examination. The diffuse nature of the weakness eliminates focal central nervous system lesions, such as stroke, intracranial mass lesions, or demyelinating white matter foci. Combining this finding with normal reflexes and history of preceding myalgias makes electrolyte-induced and inflammatory (eg, polymyositis) myopathies more likely. The normal deep tendon reflexes and the absence of a delayed relaxation phase lower the likelihood of hypothyroidism.
Diseases originating from the neuromuscular junction, such as myasthenia gravis, may also present with weakness and normal reflexes, although this pattern of weakness would be atypical; myasthenia gravis classically presents with fatigable weakness and ocular findings of diplopia and/or ptosis. First-tier testing should include a complete blood count to evaluate for eosinophilia, comprehensive metabolic panel, and urinalysis for myoglobinuria, thyroid stimulating hormone, and muscle enzymes.
Results of a complete blood count demonstrated a leukocyte count of 16.1 k/uL with 82% neutrophils, 13% lymphocytes, 5% monocytes, and 0% eosinophils. Hemoglobin was 13.2 g/dL, and platelet count 226 k/uL. Sodium was 136 mmol/L, potassium 1.5 mmol/L, chloride 115 mmol/L, bicarbonate 12 mmol/L, blood urea nitrogen 26 mg/dL, creatinine 1.0 mg/dL (baseline creatinine: 0.6), and glucose 102 mg/dL. Calcium was 9.4 mg/dL, magnesium 2.6 mg/dL, phosphorus 1.8 mg/dL, CK 501 U/L (normal: 40-230), and TSH 5.48 uIU/mL (normal: 0.5-4). Aspartate aminotransferase was 64 U/L, alanine aminotransferase 23 U/L, alkaline phosphatase 66 U/L, bilirubin 0.9 mg/dL, albumin 3.8 g/dL, and total protein 8.7 g/dL (normal: 6.2-7.8). Human immunodeficiency virus antibody screen was negative. An electrocardiogram revealed normal sinus rhythm, flattened T waves, and prominent U waves.
Potassium losses are classically categorized into 1 of 3 groups: renal losses, gastrointestinal losses, or transcellular shifts. Without a clear history of diuretic use, renal losses may not be apparent on history and examination. In contrast, gastrointestinal losses are almost always evidenced by a history of vomiting and/or diarrhea, with rare exceptions, including unreported laxative abuse or surreptitious vomiting. Transcellular potassium shifts can be seen in states of increased insulin or beta-adrenergic activity and alkalosis and result from both primary and secondary causes of hypokalemic periodic paralysis.
The presence of a reduced serum bicarbonate and elevated chloride concentration suggests a normal anion gap metabolic acidosis. Many conditions associated with normal anion gap metabolic acidosis are evident by history, such as diarrhea. In enigmatic cases such as this, it will be important to take a stepwise approach that includes an evaluation for urinary potassium losses and assessment of acid-base status. An unexplained normal anion gap metabolic acidosis combined with hypokalemia raises suspicion for a distal renal tubular acidosis (RTA). Additional testing to evaluate for a possible RTA should include the assessment of urinary electrolytes and urinary pH. The hypokalemia explains her weakness, but the etiology of such profound hypokalemia is not evident, nor is it clear how it relates to her hives.
The severity of the hypokalemia, combined with electrocardiogram changes, necessitates rapid intravenous potassium repletion, telemetry monitoring, and frequent serum potassium measurement. Treatment of her metabolic acidosis is more nuanced and depends upon both the severity of disturbance and the suspicion of whether the etiology is transcellular shift, potassium depletion, or both.
Urine studies demonstrated a urine specific gravity of 1.006 (normal: 1.001-1.030), urine pH was 6.5 (normal: 5-6.5), trace leukocyte esterase, negative nitrite, 30 mg/dL of protein (normal: <15), sodium 64 mmol/L (normal: 40-220), potassium 17 mmol/L (normal: 25-125), and chloride 71 mmol/L (normal: 110-250). Urine microscopy demonstrated 3 red blood cells per high power field (normal: 0-1), 4 white blood cells per high power field (normal: 0-4), 4+ bacteria per high power field, and no red blood cell casts. Urine protein-to-creatinine ratio was 1.6. C3 and C4 complement levels were 53 mg/dL (normal: 80-165) and 12 mg/dL (normal: 15-49), respectively. C-reactive protein was <0.5 (normal: 0-0.9), and erythrocyte sedimentation rate was 16 mm/hour (normal: 0-20).
A calculation of the urine anion gap (UAG; [urine sodium + urine potassium] – urine chloride) yields a UAG of 10 mq/L. A positive UAG, together with a nongap metabolic acidosis, should prompt the consideration of RTA. The normal renal response to acidosis is to reduce the urine pH to less than 5.3 through an increase in hydrogen ion excretion in the form of ammonium. A urine pH of 6.5 is highly suggestive of type 1 (distal) RTA and its associated impairment of distal acidification. Treatment with sodium bicarbonate to correct the acidosis and associated complications is warranted.
A distal RTA would account for her past medical history of renal stones. Acidemia promotes both increased calcium phosphate release from bone (with subsequent hypercalciuria) and enhanced citrate reabsorption in the proximal renal tubules, leading to decreased urinary citrate. Citrate inhibits calcium stone formation. The increased calcium load to renal tubules in addition to decreased urinary citrate both lead to increased precipitation of calcium stones in the genitourinary tract.
A diagnosis of distal RTA should prompt evaluation for specific etiologies, such as
Her antinuclear antibody titer was >1:1280 (normal: <80). Anti-SSA and -SSB antibodies were both positive, with a titer >100 (normal: <20). Rheumatoid factor was positive at 22 IU/mL (normal: 0-14). Anti-smith, anti-double stranded DNA, and anti-ribonucleoprotein antibodies were negative.
Sjögren’s syndrome appears to be the ultimate etiology of this patient’s distal RTA. The diagnosis of Sjögren’s is more classically made in the presence of lacrimal and/or salivary dysfunction and confirmed with compatible autoantibodies. In the absence of dry eyes or dry mouth, attention should be focused on her skin findings. Cutaneous vasculitis does occur in a small percentage of Sjögren’s syndrome cases. Urticarial lesions have been reported in this subset, and skin biopsy would further support the diagnosis.
Treatment of Sjögren’s syndrome with immunosuppressive therapy may ameliorate renal parenchymal pathology and improve her profound metabolic disturbances.
On further questioning, she described several months of mild xerostomia, which resulted in increased consumption of fluids. She did not have keratoconjunctivitis sicca. Biopsy of her urticarial rash demonstrated a leukocytoclastic vasculitis with eosinophilic infiltration (Figure 1). Renal biopsy with hematoxylin and eosin staining, immunofluorescence, and electron microscopy demonstrated an immune complex-mediated glomerulonephritis and moderate tubulointerstitial nephritis (Figure 2). A diagnosis of Sjögren’s syndrome was made based on the patient’s xerostomia, high titers of antinuclear antibodies, SSA and SSB antibodies, positive rheumatoid factor, hypocomplementemia, and systemic manifestations associated with Sjögren’s syndrome, including distal RTA, nephrolithiasis, and hives, with histologic evidence of leukocytoclastic vasculitis.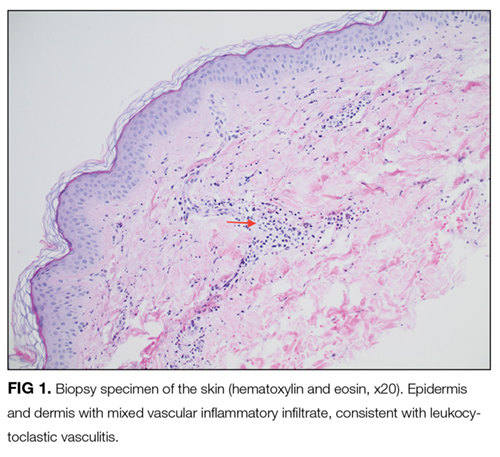
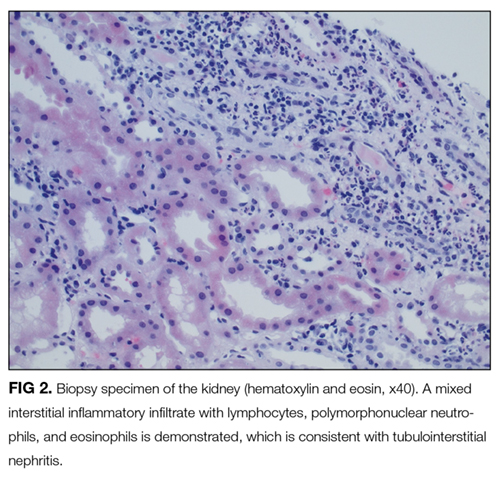
She received aggressive potassium and bicarbonate repletion and, several days later, had normalization of both. Her weakness and myalgia rapidly improved concomitantly with the correction of her hypokalemia. Five days later she was ambulating independently and discharged with potassium citrate and prednisone therapy. She had improved fatigue and rash at a 1-month follow-up with rheumatology. As an outpatient, she was started on azathioprine and slowly tapered off her steroids. Over the next several months, she had normal potassium, bicarbonate, and renal function, although she did require lithotripsy for an obstructive renal stone.
COMMENTARY
RTA should be considered in the differential diagnosis of an unexplained normal anion gap metabolic acidosis. There are 3 major types of RTAs, with different characteristics. In type 1 (distal) RTA, the primary defect is impaired distal acidification of the urine. Distal RTA commonly presents with hypokalemia, calciuria (often presenting as renal stones), and a positive UAG.1 In type 2 (proximal) RTA, the primary defect is impaired bicarbonate reabsorption, leading to bicarbonate wasting in the urine. Proximal RTAs can be secondary to an isolated defect in bicarbonate reabsorption or generalized proximal renal tubule dysfunction (Fanconi syndrome).1 A type 4 RTA is characterized by hypoaldosteronism, presenting usually with a mild nonanion gap metabolic acidosis and hyperkalemia. This patient’s history of renal stones, hypokalemia, and positive UAG supported a type 1 (distal) RTA. Distal RTA is often idiopathic, but initial evaluation should include a review of medications and investigation into an underlying systemic disorder (eg, plasma cell dyscrasia or autoimmune disease). This would include eliciting a possible history of xerostomia and xerophthalmia, together with testing of SSA (Ro) and SSB (La) antibodies, to assess for Sjögren’s syndrome. In addition, checking serum calcium to assess for hyperparathyroidism or familial idiopathic hypercalciuria and a review of medications, such as lithium and amphotericin,1 may uncover other secondary causes of distal RTA.
While Sjögren’s syndrome primarily affects salivary and lacrimal glands, leading to dry mouth and dry eyes, respectively, extraglandular manifestations are common, with fatigue and arthralgia occurring in half of patients. Extra-glandular involvement also often includes the skin and kidneys but can affect several other organ systems, including the central nervous system, heart, lungs, bone marrow, and lymph nodes.2
There are many cutaneous manifestations of Sjögren’s syndrome.3 Xerosis, or xeroderma, is the most common and is characterized by dry, scaly skin. Cutaneous vasculitis can occur in 10% of patients with Sjögren’s syndrome and often presents with palpable purpura or diffuse urticarial lesions, as in our patient.4 Erythematous maculopapules and cryoglobulinemic vasculitis may also occur.4 A less common skin manifestation is annular erythema, presenting as an indurated, ring-like lesion.5
Chronic tubulointerstitial nephritis is the most common renal manifestation of Sjögren’s syndrome.6 This often pre-sents with a mild elevated serum creatinine and a distal RTA, leading to hypokalemia, as in the case discussed. Distal RTA is well described, occurring in one-quarter of patients with Sjögren’s syndrome.7 The pathophysiology leading to distal RTA in Sjögren’s syndrome is thought to arise from autoimmune injury to the H(+)-ATPase pump in the renal collecting tubules, leading to decreased distal proton secretion.8,9 Younger adults with Sjögren’s syndrome, in the third and fourth decades of life, have a predilection to develop tubulointerstitial inflammation, distal RTA, and nephrolithiasis, as in the present case.6 Sjögren’s syndrome less commonly presents with membranoproliferative glomerulonephritis or membranous nephropathy.10,11 Cryoglobulinemia-associated hypocomplementemia and glomerulonephritis may also occur with Sjögren’s syndrome, yet glomerular lesions are less common than is tubulointerstitial inflammation. The patient discussed had proteinuria and evidence of immune complex-mediated glomerulonephritis.
Treatment of sicca symptoms is generally supportive. It includes artificial tears, encouragement of good hydration, salivary stimulants, and maintaining good oral hygiene. Pilocarpine, a cholinergic parasympathomimetic agent, is approved by the Food and Drug Administration to treat dry mouth associated with Sjögren’s syndrome. The treatment of extraglandular manifestations depends on the organ(s) involved. More severe presentations, such as vasculitis and glomerulonephritis, often require immunosuppressive therapy with systemic glucocorticoids, cyclophosphamide, azathioprine, or other immunosuppressive agents,12 including rituximab. RTA often necessitates treatment with oral bicarbonate and supplemental potassium repletion.
The base rate of disease (ie, prevalence of disease) influences a diagnostician’s pretest probability of a given diagnosis. The discussant briefly considered rare causes of hives (eg, vasculitis) but appropriately fine-tuned their differential for the patient’s hypokalemia and RTA. Once the diagnosis of Sjögren’s syndrome was made with certainty, the clinician was able to revisit the patient’s rash with a new lens. Urticarial vasculitis suddenly became a plausible consideration, despite its rarity (compared to allergic causes of hives) because of the direct link to the underlying autoimmune condition, which affected both the proximal muscles and distal nephrons.
TEACHING POINTS
- Evaluation of patients with weakness starts with determining true muscle weakness (ie, pathology involving the brain, spinal cord, peripheral nerve, neuromuscular junction, and/or muscle) from asthenia.
- Distal RTA should be considered in patients with a nonanion gap metabolic acidosis and hypokalemia.
- Sjögren’s syndrome has many extraglandular clinical manifestations, including vasculitis, urticaria, tubulointerstitial renal inflammation, glomerulonephritis, and lymphoma.
Acknowledgment
The authors thank Virgilius Cornea, MD, for his interpretation of the pathologic images.
Disclosure
Dr. Manesh is supported by the Jeremiah A. Barondess Fellowship in the Clinical Transaction of the New York Academy of Medicine, in collaboration with the Accreditation Council for Graduate Medical Education (ACGME). The authors declare no conflicts of interests.
1. Rodríguez Soriano J. Renal tubular acidosis: the clinical entity. J Am Soc Nephrol. 2002;13(8):2160-2170. PubMed
2. Asmussen K, Andersen V, Bendixen G, Schiødt M, Oxholm P. A new model for classification of disease manifestations in primary Sjögren’s syndrome: evaluation in a retrospective long-term study. J Intern Med. 1996;239(6):475-482. PubMed
3. Kittridge A, Routhouska SB, Korman NJ. Dermatologic manifestations of Sjögren syndrome. J Cutan Med Surg. 2011;15(1):8-14. PubMed
4. Ramos-Casals M, Anaya JM, García-Carrasco M, et al. Cutaneous vasculitis in primary Sjögren syndrome: classification and clinical significance of 52 patients. Medicine (Baltimore). 2004; 83(2):96-106. PubMed
5. Katayama I, Kotobuki Y, Kiyohara E, Murota H. Annular erythema associated with Sjögren’s syndrome: review of the literature on the management and clinical analysis of skin lesions. Mod Rheumatol. 2010;20(2):123-129. PubMed
6. Maripuri S, Grande JP, Osborn TG, et al. Renal involvement in primary Sjögren’s syndrome: a clinicopathologic study. Clin J Am Soc Nephrol. 2009;4(9):1423-1431. PubMed
7. Pun KK, Wong CK, Tsui EY, Tam SC, Kung AW, Wang CC. Hypokalemic periodic paralysis due to the Sjögren syndrome in Chinese patients. Ann Intern Med. 1989;110(5):405-406. PubMed
8. Cohen EP, Bastani B, Cohen MR, Kolner S, Hemken P, Gluck SL. Absence of H(+)-ATPase in cortical collecting tubules of a patient with Sjogren’s syndrome and distal renal tubular acidosis. J Am Soc Nephrol. 1992;3(2):264-271. PubMed
9. Bastani B, Haragsim L, Gluck S, Siamopoulos KC. Lack of H-ATPase in distal nephron causing hypokalaemic distal RTA in a patient with Sjögren’s syndrome. Nephrol Dial Transplant. 1995;10(6):908-909. PubMed
10. Cortez MS, Sturgill BC, Bolton WK. Membranoproliferative glomerulonephritis with primary Sjögren’s syndrome. Am J Kidney Dis. 1995;25(4):632-636. PubMed
11. Baba A, Hara S, Sato Y, Yamada K, Fujimoto S, Eto T. [Three patients with nephrotic syndrome due to membranous nephropathy complicated by Sjögren’s syndrome]. Nihon Jinzo Gakkai Shi. 2005;47(8):882-886. PubMed
12. Thanou-Stavraki A, James JA. Primary Sjogren’s syndrome: current and prospective therapies. Semin Arthritis Rheum. 2008;37(5):273-292. PubMed
A previously healthy 30-year-old woman presented to the emergency department with 2 weeks of weakness.
True muscle weakness must be distinguished from the more common causes of asthenia. Many systemic disorders produce fatigue, with resulting functional limitation that is often interpreted by patients as weakness. Initial history should focus on conditions producing fatigue, such as cardiopulmonary disease, anemia, connective tissue disease, depression or cachexia related to malignancy, infection, or other inflammatory states. Careful questioning may reveal evidence of dyspnea, poor exercise tolerance, or joint pain as an alternative to actual loss of muscle power. If true weakness is still suspected, attention should be focused on the pattern, onset, anatomic site, and progression of weakness. Muscle weakness is often characterized by difficulty with specific tasks, such as climbing stairs, rising from a chair, raising a hand, or using cutlery. The physical examination is critical in determining whether weakness is due to true loss of motor power. The differential diagnosis of weakness is broad and includes neurologic, infectious, endocrine, inflammatory, genetic, metabolic, and drug-induced etiologies.
She initially experienced 3 days of mild cramps and soreness in her thighs. She then developed weakness that began in her thighs and progressed to involve her lower legs and upper and lower arms. She had difficulty combing her hair. She required the use of her arms to get up from a chair. She grasped onto objects to aid in ambulation around the house. In addition, she described 1 year of moderate fatigue but no fever, weight loss, dyspnea, dysphagia, visual changes, paresthesias, bowel or bladder incontinence, back pain, or preceding gastrointestinal or respiratory illness. She had experienced diffuse intermittent hives, most prominent in her chest and upper arms, for the past several weeks.
History certainly supports true weakness but will need to be confirmed on examination. The distribution began as proximal but now appears diffuse. The presence of myalgia and cramping raises the possibility of noninflammatory myopathies, which are usually more insidious in onset. A severe electrolyte disturbance would be possible, based on the diffuse nature of weakness that was preceded by cramping. The distribution of weakness and lack of bowel or bladder incontinence is reassuring and suggests against a spinal cord disorder; however, a high index of suspicion must be maintained for myelopathy because delayed treatment might result in irreversible paralysis.
The patient’s course also includes hives. Common causes of hives include infections and allergic reactions to medications, foods, and insect stings. Urticaria may also result from systemic disorders, such as vasculitis, lupus, lymphoma, mastocytosis, and paraproteinemias, which can be associated with weakness and fatigue. Although severe weakness in combination with hives makes an infectious and allergic reaction less likely, we still seek to ascertain if the evolving chief complaints of weakness and hives are the result of a single unifying and evolving multisystem disorder or are distinct and unrelated processes.
Her past medical history included fibromyalgia, kidney stones, and gastroesophageal reflux disease. One week prior to presentation, she was prescribed prednisone 60 mg daily for the treatment of hives; the dose had been tapered to 40 mg at presentation, with mild improvement of hives. She recently started doxepin for fibromyalgia and insomnia. She lived at home with her husband and 8-year-old child. She worked as a clerk in a pest control office and denied any pesticide exposure. She denied tobacco, alcohol, or illicit drug use. Her family history included systemic lupus erythematosus (SLE) in her mother and maternal aunt.
Glucocorticoids are associated with myopathy; however, the weakness preceded steroid therapy. Thus, unless there was unknown exposure to high-dose steroid medication to treat recurrent episodes of urticaria earlier in her course, glucocorticoid-related myopathy is unlikely. Fibromyalgia might cause the perception of weakness from pain. However, the history of difficulty combing her hair and rising from a chair suggests actual loss of motor power. The side effects of her medications, such as newly started doxepin, must be reviewed. A family history of SLE raises concern for rheumatologic conditions; however, one might expect improvement with steroid therapy.
On physical examination, her temperature was 36.9 °C, blood pressure 126/93 mmHg, pulse 81 beats per minute, respiratory rate 16 breaths per minute, and oxygen saturation 100% on ambient air. Her cardiopulmonary examination was normal. Her abdomen was nontender and without hepatosplenomegaly. Her strength was 2 out of 5 in proximal and distal legs, bilaterally, and 4 out of 5 in proximal and distal upper extremities. She had normal muscle tone without fasciculations or atrophy. Her joints were without edema, erythema, or impaired range of motion. She had normal sensation to light touch in arms and legs. Her reflexes were 2+ in the patellar, Achilles, and brachioradialis tendons. She had no lymphadenopathy, mucosal ulcerations, or alopecia. A skin examination revealed smooth, slightly elevated, and faded pink wheals that were diffuse but most prominent in upper arms and chest.
Physical examination confirms the presence of true muscle weakness. The differential diagnosis is narrowed by several findings, both positive and negative, elicited in the examination. The diffuse nature of the weakness eliminates focal central nervous system lesions, such as stroke, intracranial mass lesions, or demyelinating white matter foci. Combining this finding with normal reflexes and history of preceding myalgias makes electrolyte-induced and inflammatory (eg, polymyositis) myopathies more likely. The normal deep tendon reflexes and the absence of a delayed relaxation phase lower the likelihood of hypothyroidism.
Diseases originating from the neuromuscular junction, such as myasthenia gravis, may also present with weakness and normal reflexes, although this pattern of weakness would be atypical; myasthenia gravis classically presents with fatigable weakness and ocular findings of diplopia and/or ptosis. First-tier testing should include a complete blood count to evaluate for eosinophilia, comprehensive metabolic panel, and urinalysis for myoglobinuria, thyroid stimulating hormone, and muscle enzymes.
Results of a complete blood count demonstrated a leukocyte count of 16.1 k/uL with 82% neutrophils, 13% lymphocytes, 5% monocytes, and 0% eosinophils. Hemoglobin was 13.2 g/dL, and platelet count 226 k/uL. Sodium was 136 mmol/L, potassium 1.5 mmol/L, chloride 115 mmol/L, bicarbonate 12 mmol/L, blood urea nitrogen 26 mg/dL, creatinine 1.0 mg/dL (baseline creatinine: 0.6), and glucose 102 mg/dL. Calcium was 9.4 mg/dL, magnesium 2.6 mg/dL, phosphorus 1.8 mg/dL, CK 501 U/L (normal: 40-230), and TSH 5.48 uIU/mL (normal: 0.5-4). Aspartate aminotransferase was 64 U/L, alanine aminotransferase 23 U/L, alkaline phosphatase 66 U/L, bilirubin 0.9 mg/dL, albumin 3.8 g/dL, and total protein 8.7 g/dL (normal: 6.2-7.8). Human immunodeficiency virus antibody screen was negative. An electrocardiogram revealed normal sinus rhythm, flattened T waves, and prominent U waves.
Potassium losses are classically categorized into 1 of 3 groups: renal losses, gastrointestinal losses, or transcellular shifts. Without a clear history of diuretic use, renal losses may not be apparent on history and examination. In contrast, gastrointestinal losses are almost always evidenced by a history of vomiting and/or diarrhea, with rare exceptions, including unreported laxative abuse or surreptitious vomiting. Transcellular potassium shifts can be seen in states of increased insulin or beta-adrenergic activity and alkalosis and result from both primary and secondary causes of hypokalemic periodic paralysis.
The presence of a reduced serum bicarbonate and elevated chloride concentration suggests a normal anion gap metabolic acidosis. Many conditions associated with normal anion gap metabolic acidosis are evident by history, such as diarrhea. In enigmatic cases such as this, it will be important to take a stepwise approach that includes an evaluation for urinary potassium losses and assessment of acid-base status. An unexplained normal anion gap metabolic acidosis combined with hypokalemia raises suspicion for a distal renal tubular acidosis (RTA). Additional testing to evaluate for a possible RTA should include the assessment of urinary electrolytes and urinary pH. The hypokalemia explains her weakness, but the etiology of such profound hypokalemia is not evident, nor is it clear how it relates to her hives.
The severity of the hypokalemia, combined with electrocardiogram changes, necessitates rapid intravenous potassium repletion, telemetry monitoring, and frequent serum potassium measurement. Treatment of her metabolic acidosis is more nuanced and depends upon both the severity of disturbance and the suspicion of whether the etiology is transcellular shift, potassium depletion, or both.
Urine studies demonstrated a urine specific gravity of 1.006 (normal: 1.001-1.030), urine pH was 6.5 (normal: 5-6.5), trace leukocyte esterase, negative nitrite, 30 mg/dL of protein (normal: <15), sodium 64 mmol/L (normal: 40-220), potassium 17 mmol/L (normal: 25-125), and chloride 71 mmol/L (normal: 110-250). Urine microscopy demonstrated 3 red blood cells per high power field (normal: 0-1), 4 white blood cells per high power field (normal: 0-4), 4+ bacteria per high power field, and no red blood cell casts. Urine protein-to-creatinine ratio was 1.6. C3 and C4 complement levels were 53 mg/dL (normal: 80-165) and 12 mg/dL (normal: 15-49), respectively. C-reactive protein was <0.5 (normal: 0-0.9), and erythrocyte sedimentation rate was 16 mm/hour (normal: 0-20).
A calculation of the urine anion gap (UAG; [urine sodium + urine potassium] – urine chloride) yields a UAG of 10 mq/L. A positive UAG, together with a nongap metabolic acidosis, should prompt the consideration of RTA. The normal renal response to acidosis is to reduce the urine pH to less than 5.3 through an increase in hydrogen ion excretion in the form of ammonium. A urine pH of 6.5 is highly suggestive of type 1 (distal) RTA and its associated impairment of distal acidification. Treatment with sodium bicarbonate to correct the acidosis and associated complications is warranted.
A distal RTA would account for her past medical history of renal stones. Acidemia promotes both increased calcium phosphate release from bone (with subsequent hypercalciuria) and enhanced citrate reabsorption in the proximal renal tubules, leading to decreased urinary citrate. Citrate inhibits calcium stone formation. The increased calcium load to renal tubules in addition to decreased urinary citrate both lead to increased precipitation of calcium stones in the genitourinary tract.
A diagnosis of distal RTA should prompt evaluation for specific etiologies, such as
Her antinuclear antibody titer was >1:1280 (normal: <80). Anti-SSA and -SSB antibodies were both positive, with a titer >100 (normal: <20). Rheumatoid factor was positive at 22 IU/mL (normal: 0-14). Anti-smith, anti-double stranded DNA, and anti-ribonucleoprotein antibodies were negative.
Sjögren’s syndrome appears to be the ultimate etiology of this patient’s distal RTA. The diagnosis of Sjögren’s is more classically made in the presence of lacrimal and/or salivary dysfunction and confirmed with compatible autoantibodies. In the absence of dry eyes or dry mouth, attention should be focused on her skin findings. Cutaneous vasculitis does occur in a small percentage of Sjögren’s syndrome cases. Urticarial lesions have been reported in this subset, and skin biopsy would further support the diagnosis.
Treatment of Sjögren’s syndrome with immunosuppressive therapy may ameliorate renal parenchymal pathology and improve her profound metabolic disturbances.
On further questioning, she described several months of mild xerostomia, which resulted in increased consumption of fluids. She did not have keratoconjunctivitis sicca. Biopsy of her urticarial rash demonstrated a leukocytoclastic vasculitis with eosinophilic infiltration (Figure 1). Renal biopsy with hematoxylin and eosin staining, immunofluorescence, and electron microscopy demonstrated an immune complex-mediated glomerulonephritis and moderate tubulointerstitial nephritis (Figure 2). A diagnosis of Sjögren’s syndrome was made based on the patient’s xerostomia, high titers of antinuclear antibodies, SSA and SSB antibodies, positive rheumatoid factor, hypocomplementemia, and systemic manifestations associated with Sjögren’s syndrome, including distal RTA, nephrolithiasis, and hives, with histologic evidence of leukocytoclastic vasculitis.
She received aggressive potassium and bicarbonate repletion and, several days later, had normalization of both. Her weakness and myalgia rapidly improved concomitantly with the correction of her hypokalemia. Five days later she was ambulating independently and discharged with potassium citrate and prednisone therapy. She had improved fatigue and rash at a 1-month follow-up with rheumatology. As an outpatient, she was started on azathioprine and slowly tapered off her steroids. Over the next several months, she had normal potassium, bicarbonate, and renal function, although she did require lithotripsy for an obstructive renal stone.
COMMENTARY
RTA should be considered in the differential diagnosis of an unexplained normal anion gap metabolic acidosis. There are 3 major types of RTAs, with different characteristics. In type 1 (distal) RTA, the primary defect is impaired distal acidification of the urine. Distal RTA commonly presents with hypokalemia, calciuria (often presenting as renal stones), and a positive UAG.1 In type 2 (proximal) RTA, the primary defect is impaired bicarbonate reabsorption, leading to bicarbonate wasting in the urine. Proximal RTAs can be secondary to an isolated defect in bicarbonate reabsorption or generalized proximal renal tubule dysfunction (Fanconi syndrome).1 A type 4 RTA is characterized by hypoaldosteronism, presenting usually with a mild nonanion gap metabolic acidosis and hyperkalemia. This patient’s history of renal stones, hypokalemia, and positive UAG supported a type 1 (distal) RTA. Distal RTA is often idiopathic, but initial evaluation should include a review of medications and investigation into an underlying systemic disorder (eg, plasma cell dyscrasia or autoimmune disease). This would include eliciting a possible history of xerostomia and xerophthalmia, together with testing of SSA (Ro) and SSB (La) antibodies, to assess for Sjögren’s syndrome. In addition, checking serum calcium to assess for hyperparathyroidism or familial idiopathic hypercalciuria and a review of medications, such as lithium and amphotericin,1 may uncover other secondary causes of distal RTA.
While Sjögren’s syndrome primarily affects salivary and lacrimal glands, leading to dry mouth and dry eyes, respectively, extraglandular manifestations are common, with fatigue and arthralgia occurring in half of patients. Extra-glandular involvement also often includes the skin and kidneys but can affect several other organ systems, including the central nervous system, heart, lungs, bone marrow, and lymph nodes.2
There are many cutaneous manifestations of Sjögren’s syndrome.3 Xerosis, or xeroderma, is the most common and is characterized by dry, scaly skin. Cutaneous vasculitis can occur in 10% of patients with Sjögren’s syndrome and often presents with palpable purpura or diffuse urticarial lesions, as in our patient.4 Erythematous maculopapules and cryoglobulinemic vasculitis may also occur.4 A less common skin manifestation is annular erythema, presenting as an indurated, ring-like lesion.5
Chronic tubulointerstitial nephritis is the most common renal manifestation of Sjögren’s syndrome.6 This often pre-sents with a mild elevated serum creatinine and a distal RTA, leading to hypokalemia, as in the case discussed. Distal RTA is well described, occurring in one-quarter of patients with Sjögren’s syndrome.7 The pathophysiology leading to distal RTA in Sjögren’s syndrome is thought to arise from autoimmune injury to the H(+)-ATPase pump in the renal collecting tubules, leading to decreased distal proton secretion.8,9 Younger adults with Sjögren’s syndrome, in the third and fourth decades of life, have a predilection to develop tubulointerstitial inflammation, distal RTA, and nephrolithiasis, as in the present case.6 Sjögren’s syndrome less commonly presents with membranoproliferative glomerulonephritis or membranous nephropathy.10,11 Cryoglobulinemia-associated hypocomplementemia and glomerulonephritis may also occur with Sjögren’s syndrome, yet glomerular lesions are less common than is tubulointerstitial inflammation. The patient discussed had proteinuria and evidence of immune complex-mediated glomerulonephritis.
Treatment of sicca symptoms is generally supportive. It includes artificial tears, encouragement of good hydration, salivary stimulants, and maintaining good oral hygiene. Pilocarpine, a cholinergic parasympathomimetic agent, is approved by the Food and Drug Administration to treat dry mouth associated with Sjögren’s syndrome. The treatment of extraglandular manifestations depends on the organ(s) involved. More severe presentations, such as vasculitis and glomerulonephritis, often require immunosuppressive therapy with systemic glucocorticoids, cyclophosphamide, azathioprine, or other immunosuppressive agents,12 including rituximab. RTA often necessitates treatment with oral bicarbonate and supplemental potassium repletion.
The base rate of disease (ie, prevalence of disease) influences a diagnostician’s pretest probability of a given diagnosis. The discussant briefly considered rare causes of hives (eg, vasculitis) but appropriately fine-tuned their differential for the patient’s hypokalemia and RTA. Once the diagnosis of Sjögren’s syndrome was made with certainty, the clinician was able to revisit the patient’s rash with a new lens. Urticarial vasculitis suddenly became a plausible consideration, despite its rarity (compared to allergic causes of hives) because of the direct link to the underlying autoimmune condition, which affected both the proximal muscles and distal nephrons.
TEACHING POINTS
- Evaluation of patients with weakness starts with determining true muscle weakness (ie, pathology involving the brain, spinal cord, peripheral nerve, neuromuscular junction, and/or muscle) from asthenia.
- Distal RTA should be considered in patients with a nonanion gap metabolic acidosis and hypokalemia.
- Sjögren’s syndrome has many extraglandular clinical manifestations, including vasculitis, urticaria, tubulointerstitial renal inflammation, glomerulonephritis, and lymphoma.
Acknowledgment
The authors thank Virgilius Cornea, MD, for his interpretation of the pathologic images.
Disclosure
Dr. Manesh is supported by the Jeremiah A. Barondess Fellowship in the Clinical Transaction of the New York Academy of Medicine, in collaboration with the Accreditation Council for Graduate Medical Education (ACGME). The authors declare no conflicts of interests.
1. Rodríguez Soriano J. Renal tubular acidosis: the clinical entity. J Am Soc Nephrol. 2002;13(8):2160-2170. PubMed
2. Asmussen K, Andersen V, Bendixen G, Schiødt M, Oxholm P. A new model for classification of disease manifestations in primary Sjögren’s syndrome: evaluation in a retrospective long-term study. J Intern Med. 1996;239(6):475-482. PubMed
3. Kittridge A, Routhouska SB, Korman NJ. Dermatologic manifestations of Sjögren syndrome. J Cutan Med Surg. 2011;15(1):8-14. PubMed
4. Ramos-Casals M, Anaya JM, García-Carrasco M, et al. Cutaneous vasculitis in primary Sjögren syndrome: classification and clinical significance of 52 patients. Medicine (Baltimore). 2004; 83(2):96-106. PubMed
5. Katayama I, Kotobuki Y, Kiyohara E, Murota H. Annular erythema associated with Sjögren’s syndrome: review of the literature on the management and clinical analysis of skin lesions. Mod Rheumatol. 2010;20(2):123-129. PubMed
6. Maripuri S, Grande JP, Osborn TG, et al. Renal involvement in primary Sjögren’s syndrome: a clinicopathologic study. Clin J Am Soc Nephrol. 2009;4(9):1423-1431. PubMed
7. Pun KK, Wong CK, Tsui EY, Tam SC, Kung AW, Wang CC. Hypokalemic periodic paralysis due to the Sjögren syndrome in Chinese patients. Ann Intern Med. 1989;110(5):405-406. PubMed
8. Cohen EP, Bastani B, Cohen MR, Kolner S, Hemken P, Gluck SL. Absence of H(+)-ATPase in cortical collecting tubules of a patient with Sjogren’s syndrome and distal renal tubular acidosis. J Am Soc Nephrol. 1992;3(2):264-271. PubMed
9. Bastani B, Haragsim L, Gluck S, Siamopoulos KC. Lack of H-ATPase in distal nephron causing hypokalaemic distal RTA in a patient with Sjögren’s syndrome. Nephrol Dial Transplant. 1995;10(6):908-909. PubMed
10. Cortez MS, Sturgill BC, Bolton WK. Membranoproliferative glomerulonephritis with primary Sjögren’s syndrome. Am J Kidney Dis. 1995;25(4):632-636. PubMed
11. Baba A, Hara S, Sato Y, Yamada K, Fujimoto S, Eto T. [Three patients with nephrotic syndrome due to membranous nephropathy complicated by Sjögren’s syndrome]. Nihon Jinzo Gakkai Shi. 2005;47(8):882-886. PubMed
12. Thanou-Stavraki A, James JA. Primary Sjogren’s syndrome: current and prospective therapies. Semin Arthritis Rheum. 2008;37(5):273-292. PubMed
© 2017 Society of Hospital Medicine
Improving Quality of Care for Seriously Ill Patients: Opportunities for Hospitalists
Palliative care is specialized medical care focused on providing relief from the symptoms, pain, and stress of a serious illness. The goal is to improve the quality of life for both the patient and the family. In all settings, palliative care has been found to improve patients’ quality of life,1,2 improve family satisfaction and well-being,3 reduce resource utilization and costs,4 and, in some studies, increase the length of life for seriously ill patients.5
Given the frequency with which seriously ill patients are hospitalized, hospitalists are well positioned to identify those who could benefit from palliative care interventions.6 Hospitalists routinely use primary palliative care skills, including pain and symptom management and skilled care planning conversations. For complex cases, such as patients with intractable symptoms or major family conflict, hospitalists may refer to specialist palliative care teams for consultation.
The Society of Hospital Medicine (SHM) defines the key primary palliative care responsibilities for hospitalists as (1) leading discussions on the goals of care and advance care planning with patients and families, (2) screening and treating common physical symptoms, and (3) referring patients to community services to provide support postdischarge.7 According to data in the National Palliative Care Registry,8 48% of all palliative care referrals in 2015 came from hospitalists, which is more than double the percentage of referrals from any other specialty.9
In a recent survey conducted by SHM about serious illness communication, 53% of hospitalists reported concerns about a patient or family’s understanding of their prognosis, and 50% indicated that they do not feel confident managing family conflict.10
IMPROVING VALUE
Context
Patients with multiple serious chronic conditions are often forced to rely on emergency services when crises, such as uncontrolled pain or dyspnea exacerbation, occur after hours, resulting in the revolving-door hospitalizations that typically characterize their care.11 As the prevalence of serious illness rises and the shift to value-based payment accelerates, hospitals are under increasing pressure to deliver efficient and high-quality services that meet the needs of seriously ill patients. The integration of standardized palliative care screening and assessment enables hospitalists and other providers to identify high-need individuals and match services and delivery models to needs, whether it be respite care for an exhausted and overwhelmed family caregiver or a home protocol for managing recurrent dyspnea crises for a patient with chronic obstructive pulmonary disease (COPD). This process improves the quality of care and quality of life, and in doing so, prevents the need for costly crisis care.
Reducing Readmissions
By identifying patients in need of extra symptom management support, or those at a turning point requiring discussion about achievable priorities for care, hospitalists can avert crises for patients earlier in the disease trajectory either by managing the patient’s palliative needs themselves or by connecting patients with specialty palliative care services as needed. This leads to a better quality of life (and survival in some studies) for both patients and their families1,3,5 and reduces unnecessary emergency department (ED) and hospital use.12 Hospitalists providing palliative care can also reduce readmissions by improving care coordination, including clinical communication and medication reconciliation after discharge.13
A 2015 Harvard Business Review study found that the quality of communication in the hospital is the strongest independent predictor of readmissions when combined with process-of-care improvements, such as standardized patient screening and assessment of family caregiver capacity.14 While medical education prepares physicians to deliver evidence-based medical care, it currently offers little to no training in communication skills, despite mounting evidence that this is a critical component of quality healthcare.
Cost Savings
Hospital palliative care teams are associated with significant hospital cost savings that result from aligning care with patient priorities, leading, in turn, to reduced nonbeneficial hospital imaging, medications, procedures, and length of stay.15 See the table16,17 for examples of cost and quality outcomes of specialist palliative care provision and evidence supporting each outcome.18-25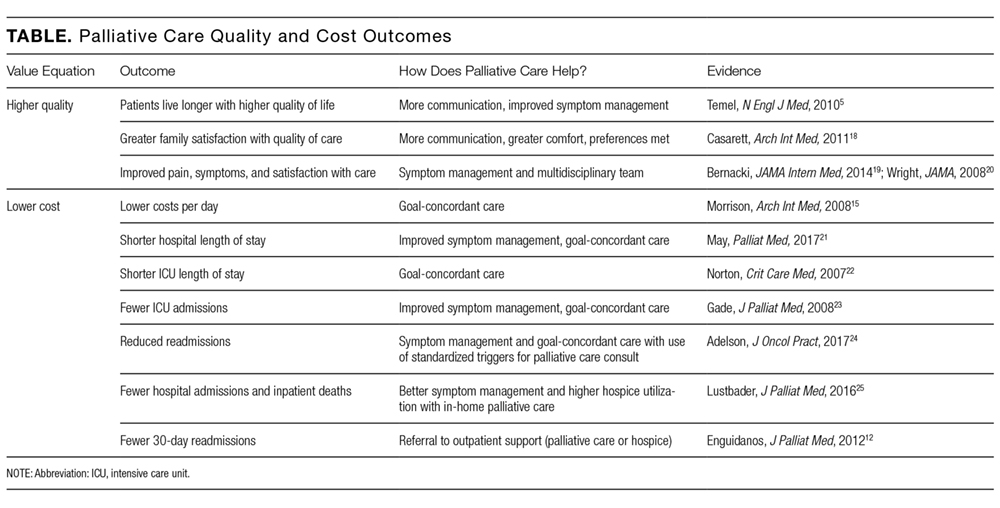
Multiple studies consistently demonstrate that inpatient palliative care teams reduce hospital costs.26 One randomized controlled trial investigating the impact of an inpatient palliative care service found that patients who received care from the palliative care team reported greater satisfaction with their care, had fewer intensive care unit admissions, had more advanced directives at hospital discharge, longer hospice length of stay, and lower total healthcare costs (a net difference of $6766 per patient).23
Research shows that the earlier palliative care is provided, the greater the impact on the subsequent course of care,27 suggesting that hospitalists who provide frontline palliative care interventions as early as possible in a seriously ill patient’s stay will be able to provide higher quality care with lower overall costs. Notably, the majority of research on cost savings associated with palliative care has focused on the impact of specialist palliative care teams, and further research is needed to understand the economic impact of primary palliative care provision.
Improving Satisfaction
Shifting to value-based payment means that the patient and family experience determine an increasingly large percentage of hospital and provider reimbursement. Palliative care approaches, such as family caregiver assessment and support, access to 24/7 assistance after discharge, and person-centered care by an interdisciplinary team, improve performance in all of these measures. Communication skills training improves patient satisfaction scores, and skilled discussions about achievable priorities for care are associated with better quality of life, reduced nonbeneficial and burdensome treatments, and an increase in goal-concordant care.19 Communication skills training has also been shown to reduce burnout and improve empathy among physicians.28,29
SKILLS TRAINING OPPORTUNITIES
Though more evidence is needed to understand the impact of primary palliative care provision by hospitalists, the strong evidence on the benefits of specialty palliative care suggests that the skilled provision of primary palliative care by hospitalists will result in higher quality, higher value care. A number of training options exist for midcareer hospital medicine clinicians, including both in-person and online training in communication and other palliative care skills.
- The Center to Advance Palliative Care (CAPC) is a membership organization that offers online continuing education unit and continuing medical education courses on communication skills, pain and symptom management, caregiver support, and care coordination. CAPC also offers courses on palliative interventions for patients with dementia, COPD, and heart failure.
- SHM is actively invested in engaging hospitalists in palliative care skills training. SHM provides free toolkits on a variety of topics within the palliative care domain, including pain management, postacute care transitions, and opioid safety. The recently released Serious Illness Communication toolkit offers background on the role of hospitalists in palliative care provision, a pathway for fitting goals-of-care conversations into hospitalist workflow and recommended metrics and training resources. SHM also uses a mentored implementation model in which expert physicians mentor hospital team members on best practices in palliative care. SHM’s Palliative Care Task Force seeks to identify educational activities for hospitalists and create opportunities to integrate palliative care in hospital medicine.30
- The Serious Illness Care Program at Ariadne Labs in Boston aims to facilitate conversations between clinicians and seriously ill patients through its Serious Illness Conversation Guide, combined with technical assistance on workflow redesign to help clinicians conduct and document serious illness conversations.
- VitalTalk specializes in clinical communication education. Through online and in-person train-the-trainer programs, VitalTalk equips clinicians to lead communication training programs at their home institutions.
- The Education in Palliative and End-of-Life Care Program and End-of-Life Nursing Education Consortium (ELNEC) uses a train-the-trainer approach to educate providers in palliative care clinical competencies and increase the reach of primary palliative care provision. ELNEC workshops are complemented by a curriculum of online clinical training modules.
CULTURE CHANGE
Though palliative care skills training is a necessary first step, hospitalists also cite lack of time, difficulty finding records of previous patient discussions, and frequent handoffs as among the barriers to integrating palliative care into their practice.10 Studies examining the process of palliative care and hospital culture change have found that barriers to palliative care integration include a culture of aggressive care in EDs, lack of standardized patient identification criteria, and limited knowledge about and staffing for palliative care.31 These data indicate the need for system changes that enable hospitalists to operationalize palliative care principles.
Health systems must implement systems and processes that routinize palliative care, making it part of the mainstream course of care for seriously ill patients and their caregivers. This includes developing systems for the identification of patients with palliative care needs, embedding palliative care assessment and referral into clinical workflows, and enabling standardized palliative care documentation in electronic medical records. While palliative care skills training is essential, investment in systems change is no less critical to embedding palliative care practices in clinical norms across specialties.
CONCLUSION
Hospitalists can use a palliative approach to improve care quality and quality of life for seriously ill patients while helping to avoid preventable and unnecessary 911 calls, ED visits, and hospitalizations. The shift towards value-based payment is a strong incentive for hospitals and hospitalists to direct resources toward practices that improve the quality of life and care for the highest-need patients and their families. When equipped with the tools they need to provide palliative care, either themselves or in collaboration with palliative care teams, hospitalists have the opportunity to profoundly redirect the experience of care for seriously ill patients and their families.
Disclosure
The authors declared no conflicts of interest.
1. Casarett D, Pickard A, Bailey FA, et al. Do Palliative Consultations Improve Patient Outcomes? J Am Geriatr Soc. 2008;56(4):595-599. PubMed
2. Delgado-Guay MO, Parsons HA, Zhijun LM, Palmer LJ, Bruera E. Symptom distress, interventions, and outcomes of intensive care unit cancer patients referred to a palliative care consult team. Cancer. 2009;115(2):437-445. PubMed
3. Gelfman LP, Meier DE, Morrison SR. Does Palliative Care Improve Quality? A Survey of Bereaved Family Members. J Pain Symptom Manage. 2008;36(1):22-28. PubMed
4. Morrison SR, Dietrich J, Ladwig S, et al. Palliative Care Consultation Teams Cut Hospital Costs for Medicaid Beneficiaries. Health Aff. 2011;30:454-463. PubMed
5. Temel JS, Greer JA, Muzikansky A, et al. Early palliative care for patients with metastatic non‐small‐cell lung cancer. N Engl J Med. 2010;363(8):733-742. PubMed
6. Lin RJ, Adelman RD, Diamond RR, Evans AT. The Sentinel Hospitalization and the Role of Palliative Care. J Hosp Med. 2014;9(5):320-323. PubMed
7. Palliative care. J Hosp Med. 2006;1:80-81. doi:10.1002/jhm.54.
8. Center to Advance Palliative Care. National palliative care registry. https://registry.capc.org/. Accessed May 26, 2017.
9. Rogers M, Dumanovsky T. How We Work: Trends and Insights in Hospital Palliative Care. New York: The Center to Advance Palliative Care and the National Palliative Care Research Center. https://registry.capc.org/wp-content/uploads/2017/02/How-We-Work-Trends-and-Insights-in-Hospital-Palliative-Care-2009-2015.pdf; 2017. Accessed May 26, 2017.
10. Rosenberg LB, Greenwald J, Caponi B, et al. Confidence with and Barriers to Serious Illness Communication: A National Survey of Hospitalists. J Palliat Med. 2017;20(9):1013-1019. PubMed
11. Aldridge MD, Kelley AS. The Myth Regarding the High Cost of End-of-Life Care. Am J Public Health. 2015;105(12):2411-2415. PubMed
12. Enguidanos S, Vesper E, Lorenz K. 30-Day Readmissions among Seriously Ill Older Adults. J Palliat Med. 2012;15(12):1356-1361. PubMed
13. Kripalani S, Theobald C, Anctil B, Vasilevskis E. Reducing Hospital Readmission Rates: Current Strategies and Future Directions. Annu Rev Med. 2014;65:471-485. PubMed
14. Senot C, Chandrasekaran A. What Has the Biggest Impact on Hospital Readmission Rates. Harvard Business Review. September 23, 2015. https://hbr.org/2015/09/what-has-the-biggest-impact-on-hospital-readmission-rates. Accessed March 29, 2017.
15. Morrison RS, Penrod JD, Cassel JB, et al. Cost Savings Associated with US Hospital Palliative Care Consultation Programs. Arch Intern Med. 2008;168(16):1783-1790. PubMed
16. Cassel JB. Palliative Care’s Impact on Utilization and Costs: Implications for Health Services Research and Policy. In: Kelley AS, Meier DE, editors. Meeting the Needs of Older Adults with Serious Illness: Challenges and Opportunities in the Age of Health Care Reform. New York: Springer Science+Business Media; 2014:109-126.
17. Meier D, Silvers A. Serious Illness Strategies for Health Plans and Accountable Care Organizations. https://media.capc.org/filer_public/2c/69/2c69a0f0-c90f-43ac-893e-e90cd0438482/serious_illness_strategies_web.pdf. 2017. Accessed August 10, 2017.
18. Casarett D, Johnson M, Smith D, Richardson D. The Optimal Delivery of Palliative Care: A National Comparison of the Outcomes of Consultation Teams vs Inpatient Units. Arch Intern Med. 2011;171(7):649-655. PubMed
19. Bernacki RE, Block SD. Communication About Serious Illness Care Goals: A Review and Synthesis of Best Practices. JAMA Intern Med. 2014;174(12):1994-2003. PubMed
20. Wright AA, Zhang B, Ray A, et al. Associations Between End-of-Life Discussions, Patient Mental Health, Medical Care Near Death, and Caregiver Bereavement Adjustment. JAMA. 2008;300(14):1665-1673. PubMed
21. May P, Garrido M, Cassel JB, et al. Cost Analysis of a Prospective Multi-Site Cohort Study of Palliative Care Consultation Teams for Adults with Advanced Cancer: Where Do Cost Savings Come From? Palliat Med. 2017;31(4):378-386. PubMed
22. Norton SA, Hogan LA, Holloway RG, et al. Proactive Palliative Care in the Medical Intensive Care Unit: Effects of Length of Stay for Selected High-Risk Patients. Crit Care Med. 2007;35(6):1530-1535. PubMed
23. Gade G, Venohr I, Conner D, et al. Impact of an Inpatient Palliative Care Team: A Randomized Controlled Trial. J Palliat Med. 2008;11(2):180-201. PubMed
24. Adelson K, Paris J, Horton J, et al. Standardized Criteria for Palliative Care Consultation on a Solid Tumor Oncology Service Reduces Downstream Health Care use. J Oncol Pract. 2017;13(5):e431-e440. PubMed
25. Lustbader D, Mitchell M, Carole R, et al. The Impact of a Home-Based Palliative Care Program in an Accountable Care Organization. J Palliat Med. 2017;20(1):23-28. PubMed
26. May P, Normand C, Morrison R. Economic Impact of Hospital Inpatient Palliative Care Consultation: Review of Current Evidence and Directions for Future Research. J Palliat Med. 2014;17(9):1054-1063. PubMed
27. May P, Garrido MM, Bassel JB, et al. Prospective Cohort Study of Hospital Palliative Care Teams for Inpatients with Advanced Cancer: Earlier Consultation Is Associated with Larger Cost-Saving Effect. J Clin Oncol. 2015;33(25):2745-2752. PubMed
28. Boissy A, Windover A, Bokar D, et al. Communication Skills Training for Physicians Improves Patient Satisfaction. J Gen Intern Med. 2016;31(7):755-761. PubMed
29. Kirkland KB. Finding Joy in Practice Cocreation in Palliative Care. JAMA. 2017;317(20):2065-2066. PubMed
30. Whelan C. SHM Establishes Palliative Care Task Force. The Hospitalist. 2005;11. http://www.the-hospitalist.org/hospitalist/article/123027/hospice-palliative-medicine/shm-establishes-palliative-care-task-force. Accessed July 31, 2017.
31. Grudzen CR, Richardson LD, Major-Monfried H, et al. Hospital Administrators’ Views on Barriers and Opportunities to Delivering Palliative Care in the Emergency Department. Ann Emerg Med. 2013;61(6):654-660. PubMed
Palliative care is specialized medical care focused on providing relief from the symptoms, pain, and stress of a serious illness. The goal is to improve the quality of life for both the patient and the family. In all settings, palliative care has been found to improve patients’ quality of life,1,2 improve family satisfaction and well-being,3 reduce resource utilization and costs,4 and, in some studies, increase the length of life for seriously ill patients.5
Given the frequency with which seriously ill patients are hospitalized, hospitalists are well positioned to identify those who could benefit from palliative care interventions.6 Hospitalists routinely use primary palliative care skills, including pain and symptom management and skilled care planning conversations. For complex cases, such as patients with intractable symptoms or major family conflict, hospitalists may refer to specialist palliative care teams for consultation.
The Society of Hospital Medicine (SHM) defines the key primary palliative care responsibilities for hospitalists as (1) leading discussions on the goals of care and advance care planning with patients and families, (2) screening and treating common physical symptoms, and (3) referring patients to community services to provide support postdischarge.7 According to data in the National Palliative Care Registry,8 48% of all palliative care referrals in 2015 came from hospitalists, which is more than double the percentage of referrals from any other specialty.9
In a recent survey conducted by SHM about serious illness communication, 53% of hospitalists reported concerns about a patient or family’s understanding of their prognosis, and 50% indicated that they do not feel confident managing family conflict.10
IMPROVING VALUE
Context
Patients with multiple serious chronic conditions are often forced to rely on emergency services when crises, such as uncontrolled pain or dyspnea exacerbation, occur after hours, resulting in the revolving-door hospitalizations that typically characterize their care.11 As the prevalence of serious illness rises and the shift to value-based payment accelerates, hospitals are under increasing pressure to deliver efficient and high-quality services that meet the needs of seriously ill patients. The integration of standardized palliative care screening and assessment enables hospitalists and other providers to identify high-need individuals and match services and delivery models to needs, whether it be respite care for an exhausted and overwhelmed family caregiver or a home protocol for managing recurrent dyspnea crises for a patient with chronic obstructive pulmonary disease (COPD). This process improves the quality of care and quality of life, and in doing so, prevents the need for costly crisis care.
Reducing Readmissions
By identifying patients in need of extra symptom management support, or those at a turning point requiring discussion about achievable priorities for care, hospitalists can avert crises for patients earlier in the disease trajectory either by managing the patient’s palliative needs themselves or by connecting patients with specialty palliative care services as needed. This leads to a better quality of life (and survival in some studies) for both patients and their families1,3,5 and reduces unnecessary emergency department (ED) and hospital use.12 Hospitalists providing palliative care can also reduce readmissions by improving care coordination, including clinical communication and medication reconciliation after discharge.13
A 2015 Harvard Business Review study found that the quality of communication in the hospital is the strongest independent predictor of readmissions when combined with process-of-care improvements, such as standardized patient screening and assessment of family caregiver capacity.14 While medical education prepares physicians to deliver evidence-based medical care, it currently offers little to no training in communication skills, despite mounting evidence that this is a critical component of quality healthcare.
Cost Savings
Hospital palliative care teams are associated with significant hospital cost savings that result from aligning care with patient priorities, leading, in turn, to reduced nonbeneficial hospital imaging, medications, procedures, and length of stay.15 See the table16,17 for examples of cost and quality outcomes of specialist palliative care provision and evidence supporting each outcome.18-25
Multiple studies consistently demonstrate that inpatient palliative care teams reduce hospital costs.26 One randomized controlled trial investigating the impact of an inpatient palliative care service found that patients who received care from the palliative care team reported greater satisfaction with their care, had fewer intensive care unit admissions, had more advanced directives at hospital discharge, longer hospice length of stay, and lower total healthcare costs (a net difference of $6766 per patient).23
Research shows that the earlier palliative care is provided, the greater the impact on the subsequent course of care,27 suggesting that hospitalists who provide frontline palliative care interventions as early as possible in a seriously ill patient’s stay will be able to provide higher quality care with lower overall costs. Notably, the majority of research on cost savings associated with palliative care has focused on the impact of specialist palliative care teams, and further research is needed to understand the economic impact of primary palliative care provision.
Improving Satisfaction
Shifting to value-based payment means that the patient and family experience determine an increasingly large percentage of hospital and provider reimbursement. Palliative care approaches, such as family caregiver assessment and support, access to 24/7 assistance after discharge, and person-centered care by an interdisciplinary team, improve performance in all of these measures. Communication skills training improves patient satisfaction scores, and skilled discussions about achievable priorities for care are associated with better quality of life, reduced nonbeneficial and burdensome treatments, and an increase in goal-concordant care.19 Communication skills training has also been shown to reduce burnout and improve empathy among physicians.28,29
SKILLS TRAINING OPPORTUNITIES
Though more evidence is needed to understand the impact of primary palliative care provision by hospitalists, the strong evidence on the benefits of specialty palliative care suggests that the skilled provision of primary palliative care by hospitalists will result in higher quality, higher value care. A number of training options exist for midcareer hospital medicine clinicians, including both in-person and online training in communication and other palliative care skills.
- The Center to Advance Palliative Care (CAPC) is a membership organization that offers online continuing education unit and continuing medical education courses on communication skills, pain and symptom management, caregiver support, and care coordination. CAPC also offers courses on palliative interventions for patients with dementia, COPD, and heart failure.
- SHM is actively invested in engaging hospitalists in palliative care skills training. SHM provides free toolkits on a variety of topics within the palliative care domain, including pain management, postacute care transitions, and opioid safety. The recently released Serious Illness Communication toolkit offers background on the role of hospitalists in palliative care provision, a pathway for fitting goals-of-care conversations into hospitalist workflow and recommended metrics and training resources. SHM also uses a mentored implementation model in which expert physicians mentor hospital team members on best practices in palliative care. SHM’s Palliative Care Task Force seeks to identify educational activities for hospitalists and create opportunities to integrate palliative care in hospital medicine.30
- The Serious Illness Care Program at Ariadne Labs in Boston aims to facilitate conversations between clinicians and seriously ill patients through its Serious Illness Conversation Guide, combined with technical assistance on workflow redesign to help clinicians conduct and document serious illness conversations.
- VitalTalk specializes in clinical communication education. Through online and in-person train-the-trainer programs, VitalTalk equips clinicians to lead communication training programs at their home institutions.
- The Education in Palliative and End-of-Life Care Program and End-of-Life Nursing Education Consortium (ELNEC) uses a train-the-trainer approach to educate providers in palliative care clinical competencies and increase the reach of primary palliative care provision. ELNEC workshops are complemented by a curriculum of online clinical training modules.
CULTURE CHANGE
Though palliative care skills training is a necessary first step, hospitalists also cite lack of time, difficulty finding records of previous patient discussions, and frequent handoffs as among the barriers to integrating palliative care into their practice.10 Studies examining the process of palliative care and hospital culture change have found that barriers to palliative care integration include a culture of aggressive care in EDs, lack of standardized patient identification criteria, and limited knowledge about and staffing for palliative care.31 These data indicate the need for system changes that enable hospitalists to operationalize palliative care principles.
Health systems must implement systems and processes that routinize palliative care, making it part of the mainstream course of care for seriously ill patients and their caregivers. This includes developing systems for the identification of patients with palliative care needs, embedding palliative care assessment and referral into clinical workflows, and enabling standardized palliative care documentation in electronic medical records. While palliative care skills training is essential, investment in systems change is no less critical to embedding palliative care practices in clinical norms across specialties.
CONCLUSION
Hospitalists can use a palliative approach to improve care quality and quality of life for seriously ill patients while helping to avoid preventable and unnecessary 911 calls, ED visits, and hospitalizations. The shift towards value-based payment is a strong incentive for hospitals and hospitalists to direct resources toward practices that improve the quality of life and care for the highest-need patients and their families. When equipped with the tools they need to provide palliative care, either themselves or in collaboration with palliative care teams, hospitalists have the opportunity to profoundly redirect the experience of care for seriously ill patients and their families.
Disclosure
The authors declared no conflicts of interest.
1. Casarett D, Pickard A, Bailey FA, et al. Do Palliative Consultations Improve Patient Outcomes? J Am Geriatr Soc. 2008;56(4):595-599. PubMed
2. Delgado-Guay MO, Parsons HA, Zhijun LM, Palmer LJ, Bruera E. Symptom distress, interventions, and outcomes of intensive care unit cancer patients referred to a palliative care consult team. Cancer. 2009;115(2):437-445. PubMed
3. Gelfman LP, Meier DE, Morrison SR. Does Palliative Care Improve Quality? A Survey of Bereaved Family Members. J Pain Symptom Manage. 2008;36(1):22-28. PubMed
4. Morrison SR, Dietrich J, Ladwig S, et al. Palliative Care Consultation Teams Cut Hospital Costs for Medicaid Beneficiaries. Health Aff. 2011;30:454-463. PubMed
5. Temel JS, Greer JA, Muzikansky A, et al. Early palliative care for patients with metastatic non‐small‐cell lung cancer. N Engl J Med. 2010;363(8):733-742. PubMed
6. Lin RJ, Adelman RD, Diamond RR, Evans AT. The Sentinel Hospitalization and the Role of Palliative Care. J Hosp Med. 2014;9(5):320-323. PubMed
7. Palliative care. J Hosp Med. 2006;1:80-81. doi:10.1002/jhm.54.
8. Center to Advance Palliative Care. National palliative care registry. https://registry.capc.org/. Accessed May 26, 2017.
9. Rogers M, Dumanovsky T. How We Work: Trends and Insights in Hospital Palliative Care. New York: The Center to Advance Palliative Care and the National Palliative Care Research Center. https://registry.capc.org/wp-content/uploads/2017/02/How-We-Work-Trends-and-Insights-in-Hospital-Palliative-Care-2009-2015.pdf; 2017. Accessed May 26, 2017.
10. Rosenberg LB, Greenwald J, Caponi B, et al. Confidence with and Barriers to Serious Illness Communication: A National Survey of Hospitalists. J Palliat Med. 2017;20(9):1013-1019. PubMed
11. Aldridge MD, Kelley AS. The Myth Regarding the High Cost of End-of-Life Care. Am J Public Health. 2015;105(12):2411-2415. PubMed
12. Enguidanos S, Vesper E, Lorenz K. 30-Day Readmissions among Seriously Ill Older Adults. J Palliat Med. 2012;15(12):1356-1361. PubMed
13. Kripalani S, Theobald C, Anctil B, Vasilevskis E. Reducing Hospital Readmission Rates: Current Strategies and Future Directions. Annu Rev Med. 2014;65:471-485. PubMed
14. Senot C, Chandrasekaran A. What Has the Biggest Impact on Hospital Readmission Rates. Harvard Business Review. September 23, 2015. https://hbr.org/2015/09/what-has-the-biggest-impact-on-hospital-readmission-rates. Accessed March 29, 2017.
15. Morrison RS, Penrod JD, Cassel JB, et al. Cost Savings Associated with US Hospital Palliative Care Consultation Programs. Arch Intern Med. 2008;168(16):1783-1790. PubMed
16. Cassel JB. Palliative Care’s Impact on Utilization and Costs: Implications for Health Services Research and Policy. In: Kelley AS, Meier DE, editors. Meeting the Needs of Older Adults with Serious Illness: Challenges and Opportunities in the Age of Health Care Reform. New York: Springer Science+Business Media; 2014:109-126.
17. Meier D, Silvers A. Serious Illness Strategies for Health Plans and Accountable Care Organizations. https://media.capc.org/filer_public/2c/69/2c69a0f0-c90f-43ac-893e-e90cd0438482/serious_illness_strategies_web.pdf. 2017. Accessed August 10, 2017.
18. Casarett D, Johnson M, Smith D, Richardson D. The Optimal Delivery of Palliative Care: A National Comparison of the Outcomes of Consultation Teams vs Inpatient Units. Arch Intern Med. 2011;171(7):649-655. PubMed
19. Bernacki RE, Block SD. Communication About Serious Illness Care Goals: A Review and Synthesis of Best Practices. JAMA Intern Med. 2014;174(12):1994-2003. PubMed
20. Wright AA, Zhang B, Ray A, et al. Associations Between End-of-Life Discussions, Patient Mental Health, Medical Care Near Death, and Caregiver Bereavement Adjustment. JAMA. 2008;300(14):1665-1673. PubMed
21. May P, Garrido M, Cassel JB, et al. Cost Analysis of a Prospective Multi-Site Cohort Study of Palliative Care Consultation Teams for Adults with Advanced Cancer: Where Do Cost Savings Come From? Palliat Med. 2017;31(4):378-386. PubMed
22. Norton SA, Hogan LA, Holloway RG, et al. Proactive Palliative Care in the Medical Intensive Care Unit: Effects of Length of Stay for Selected High-Risk Patients. Crit Care Med. 2007;35(6):1530-1535. PubMed
23. Gade G, Venohr I, Conner D, et al. Impact of an Inpatient Palliative Care Team: A Randomized Controlled Trial. J Palliat Med. 2008;11(2):180-201. PubMed
24. Adelson K, Paris J, Horton J, et al. Standardized Criteria for Palliative Care Consultation on a Solid Tumor Oncology Service Reduces Downstream Health Care use. J Oncol Pract. 2017;13(5):e431-e440. PubMed
25. Lustbader D, Mitchell M, Carole R, et al. The Impact of a Home-Based Palliative Care Program in an Accountable Care Organization. J Palliat Med. 2017;20(1):23-28. PubMed
26. May P, Normand C, Morrison R. Economic Impact of Hospital Inpatient Palliative Care Consultation: Review of Current Evidence and Directions for Future Research. J Palliat Med. 2014;17(9):1054-1063. PubMed
27. May P, Garrido MM, Bassel JB, et al. Prospective Cohort Study of Hospital Palliative Care Teams for Inpatients with Advanced Cancer: Earlier Consultation Is Associated with Larger Cost-Saving Effect. J Clin Oncol. 2015;33(25):2745-2752. PubMed
28. Boissy A, Windover A, Bokar D, et al. Communication Skills Training for Physicians Improves Patient Satisfaction. J Gen Intern Med. 2016;31(7):755-761. PubMed
29. Kirkland KB. Finding Joy in Practice Cocreation in Palliative Care. JAMA. 2017;317(20):2065-2066. PubMed
30. Whelan C. SHM Establishes Palliative Care Task Force. The Hospitalist. 2005;11. http://www.the-hospitalist.org/hospitalist/article/123027/hospice-palliative-medicine/shm-establishes-palliative-care-task-force. Accessed July 31, 2017.
31. Grudzen CR, Richardson LD, Major-Monfried H, et al. Hospital Administrators’ Views on Barriers and Opportunities to Delivering Palliative Care in the Emergency Department. Ann Emerg Med. 2013;61(6):654-660. PubMed
© 2018 Society of Hospital Medicine
Medication-Induced Pruritus From Direct Oral Anticoagulants
Pruritus is a subjective report of itching, which can be caused by dermatologic or systemic conditions. Pruritus accounts for about 5% of all skin adverse drug reactions (ADRs) after administration.1 Mechanisms by which medication-induced pruritus occurs are still unknown and have been understudied. Treatment modalities also have been understudied; however, the understood method for treatment is cessation of the causative agent.2
Anticoagulants commonly are used in several conditions, including prevention of ischemic cerebrovascular accident (CVA) in patients with atrial fibrillation (AF) as well as for the treatment and prevention of deep vein thrombosis (DVT) and pulmonary embolism (PE).3 Traditionally, warfarin was the gold standard anticoagulant. With the relatively recent approval of several direct oral anticoagulants (DOACs), such as rivaroxaban, apixaban, and dabigatran, the landscape of anticoagulation is changing. One benefit of using DOACs as opposed to warfarin is that they often require less frequent laboratory monitoring. However, rare ADRs not detected during clinical trials have appeared following drug approval.4
In a VA anticoagulation clinic that managed more than 60 patients taking DOACs, the authors identified 2 cases of pruritus, possibly associated with DOAC agents. These 2 cases point to a higher incidence rate than the rate reported in the rivaroxaban package insert (2%).5 Of note, pruritus is not mentioned in the apixaban package insert.6
Patient 1 Case Presentation
Patient 1 was a 69-year-old male with AF who was switched to rivaroxaban after 5 years of warfarin therapy. Past medical history included iron deficiency anemia, hypertension, type 2 diabetes mellitus, systolic heart failure, hyperlipidemia, hepatic steatosis, benign prostatic hyperplasia, and gastroesophageal reflux disease. The patient reported “itching all over” soon after initiation of rivaroxaban and that the itching was intolerable and always began 90 to 120 minutes after each dose of rivaroxaban with no associated rash.
After about 6 months of treatment with rivaroxaban, the patient was switched to apixaban; however, the pruritus persisted even after the switch. The onset of itching had similar timing with regard to the apixaban doses. When apixaban was initiated, the patient also was started on amiodarone and tamsulosin. A full pharmacotherapy review of the patient’s medication list for the incidence of pruritus was conducted. Regarding amiodarone and tamsulosin, incidence of pruritus was < 1%.7,8 Neither agent had yet been started during the rivaroxaban therapy; therefore, it was unlikely that either of these 2 medications were the causative agent of the pruritic ADR.
In response to the itching, the patient was given diphenhydramine 25 mg twice daily, taken with each dose of apixaban. Shortly thereafter, the patient reported that diphenhydramine lessened the severity of the pruritus. He was switched to loratadine 10 mg twice daily with each dose of apixaban, to avoid drowsiness as well as the increased anticholinergic ADRs of first-generation antihistamines. The patient reported that the itching was tolerable.
Patient 2 Case Presentation
Patient 2 was a 63-year-old male with AF and hypertension who was initially started on rivaroxaban and reported pruritus after about 1 month. Despite the uncomfortable itch, the patient elected to continue therapy and began diphenhydramine 25 mg daily with each dose of rivaroxaban. Diphenhydramine seemed to improve the pruritus but did not completely alleviate it. While on rivaroxaban, the patient experienced an acute drop in hemoglobin; however, no source of bleeding was found. Although the pruritus was largely resolved, he was switched to apixaban due to its favorable bleeding profile.9 The patient continued to have pruritus on apixaban; however, he reported that pruritus was less severe than it had been while taking rivaroxaban. The patient restarted on diphenhydramine twice daily with each dose of apixaban and reported cessation of pruritus.
Discussion
After observing both cases in relation to the timing between the administration of a DOAC and onset of pruritus, it seemed likely that the causative agent could be the DOAC. A Naranjo Nomogram was used to determine the likeliness of each drug to be the causative agent of the ADR.10 This nomogram is scaled from a low score of -4 to a high score of 13. Patients 1 and 2 had a score of 4, which is reflective of a possible ADR (score 1-4). Using the nomogram as well as the subjective information provided by the patients, it is reasonable to conclude that the pruritus was possibly associated with the use of the DOACs. Nonadherence to anticoagulants may lead to potentially fatal adverse outcomes, such as stroke. Medication-associated pruritus could lead to medication nonadherence if left unaddressed. It is notable that prescribing an antihistamine that is taken at the time of the anticoagulant dose allowed these patients with possible DOAC-associated pruritus to continue therapy with the selected anticoagulant. Further research on this topic is needed.
1. Reich A, Ständer S, Szepietowski C. Drug-induced pruritus: a review. Acta Derm Venereol. 2009;89(3):236-244.
2. Ebata T. Drug-induced itch management. Curr Probl Dermatol. 2016;50:155-163.
3. Burnett AE, Mahan CE, Vazquez SR, Oertel LB, Garcia DA, Ansell J. Guidance for the practical management of the direct oral anticoagulants (DOACs) in VTE treatment. J Thromb Thrombolysis. 2016;41(1):206-232.
4. U.S. Department of Health and Human Services, U.S. Food & Drug Administration. FDA Adverse Events Reporting System (FAERS) public dashboard. Apixaban. https://fis.fda.gov/sense/app/777e9f4d-0cf8-448e-8068-f564c31baa25/sheet/45beeb74-30ab-46be-8267-5756582633b4/state/analysis. Updated August 31, 2017. Accessed November 8, 2017.
5. Xarelto [package insert]. Titusville, NJ: Janssen Pharmaceuticals Inc; 2011.
6. Eliquis [package insert]. Princeton, NJ: Bristol-Myers Squibb Company; New York, NY: Pfizer Inc; 2016.
7. Pacerone [package insert]. Minneapolis, MN: Upsher-Smith Laboratories Inc; 2008. Minneapolis, MN.
8. Flomax [package insert]. Ridgefield, CT: Boehringer Ingelheim Pharmaceuticals Inc; 2016.
9. Granger CB, Alexander JH, McMurray JJ, et al; ARISTOTLE Committees and Investigators. Apixaban versus warfarin in patient with atrial fibrillation. N Engl J Med. 2011;365(11):981-992.
10. Michel DJ, Knodel LC. Comparison of three algorithms used to evaluate adverse drug reactions. Am J Hosp Pharm. 1986;43(7):1709-1714.
Pruritus is a subjective report of itching, which can be caused by dermatologic or systemic conditions. Pruritus accounts for about 5% of all skin adverse drug reactions (ADRs) after administration.1 Mechanisms by which medication-induced pruritus occurs are still unknown and have been understudied. Treatment modalities also have been understudied; however, the understood method for treatment is cessation of the causative agent.2
Anticoagulants commonly are used in several conditions, including prevention of ischemic cerebrovascular accident (CVA) in patients with atrial fibrillation (AF) as well as for the treatment and prevention of deep vein thrombosis (DVT) and pulmonary embolism (PE).3 Traditionally, warfarin was the gold standard anticoagulant. With the relatively recent approval of several direct oral anticoagulants (DOACs), such as rivaroxaban, apixaban, and dabigatran, the landscape of anticoagulation is changing. One benefit of using DOACs as opposed to warfarin is that they often require less frequent laboratory monitoring. However, rare ADRs not detected during clinical trials have appeared following drug approval.4
In a VA anticoagulation clinic that managed more than 60 patients taking DOACs, the authors identified 2 cases of pruritus, possibly associated with DOAC agents. These 2 cases point to a higher incidence rate than the rate reported in the rivaroxaban package insert (2%).5 Of note, pruritus is not mentioned in the apixaban package insert.6
Patient 1 Case Presentation
Patient 1 was a 69-year-old male with AF who was switched to rivaroxaban after 5 years of warfarin therapy. Past medical history included iron deficiency anemia, hypertension, type 2 diabetes mellitus, systolic heart failure, hyperlipidemia, hepatic steatosis, benign prostatic hyperplasia, and gastroesophageal reflux disease. The patient reported “itching all over” soon after initiation of rivaroxaban and that the itching was intolerable and always began 90 to 120 minutes after each dose of rivaroxaban with no associated rash.
After about 6 months of treatment with rivaroxaban, the patient was switched to apixaban; however, the pruritus persisted even after the switch. The onset of itching had similar timing with regard to the apixaban doses. When apixaban was initiated, the patient also was started on amiodarone and tamsulosin. A full pharmacotherapy review of the patient’s medication list for the incidence of pruritus was conducted. Regarding amiodarone and tamsulosin, incidence of pruritus was < 1%.7,8 Neither agent had yet been started during the rivaroxaban therapy; therefore, it was unlikely that either of these 2 medications were the causative agent of the pruritic ADR.
In response to the itching, the patient was given diphenhydramine 25 mg twice daily, taken with each dose of apixaban. Shortly thereafter, the patient reported that diphenhydramine lessened the severity of the pruritus. He was switched to loratadine 10 mg twice daily with each dose of apixaban, to avoid drowsiness as well as the increased anticholinergic ADRs of first-generation antihistamines. The patient reported that the itching was tolerable.
Patient 2 Case Presentation
Patient 2 was a 63-year-old male with AF and hypertension who was initially started on rivaroxaban and reported pruritus after about 1 month. Despite the uncomfortable itch, the patient elected to continue therapy and began diphenhydramine 25 mg daily with each dose of rivaroxaban. Diphenhydramine seemed to improve the pruritus but did not completely alleviate it. While on rivaroxaban, the patient experienced an acute drop in hemoglobin; however, no source of bleeding was found. Although the pruritus was largely resolved, he was switched to apixaban due to its favorable bleeding profile.9 The patient continued to have pruritus on apixaban; however, he reported that pruritus was less severe than it had been while taking rivaroxaban. The patient restarted on diphenhydramine twice daily with each dose of apixaban and reported cessation of pruritus.
Discussion
After observing both cases in relation to the timing between the administration of a DOAC and onset of pruritus, it seemed likely that the causative agent could be the DOAC. A Naranjo Nomogram was used to determine the likeliness of each drug to be the causative agent of the ADR.10 This nomogram is scaled from a low score of -4 to a high score of 13. Patients 1 and 2 had a score of 4, which is reflective of a possible ADR (score 1-4). Using the nomogram as well as the subjective information provided by the patients, it is reasonable to conclude that the pruritus was possibly associated with the use of the DOACs. Nonadherence to anticoagulants may lead to potentially fatal adverse outcomes, such as stroke. Medication-associated pruritus could lead to medication nonadherence if left unaddressed. It is notable that prescribing an antihistamine that is taken at the time of the anticoagulant dose allowed these patients with possible DOAC-associated pruritus to continue therapy with the selected anticoagulant. Further research on this topic is needed.
1. Reich A, Ständer S, Szepietowski C. Drug-induced pruritus: a review. Acta Derm Venereol. 2009;89(3):236-244.
2. Ebata T. Drug-induced itch management. Curr Probl Dermatol. 2016;50:155-163.
3. Burnett AE, Mahan CE, Vazquez SR, Oertel LB, Garcia DA, Ansell J. Guidance for the practical management of the direct oral anticoagulants (DOACs) in VTE treatment. J Thromb Thrombolysis. 2016;41(1):206-232.
4. U.S. Department of Health and Human Services, U.S. Food & Drug Administration. FDA Adverse Events Reporting System (FAERS) public dashboard. Apixaban. https://fis.fda.gov/sense/app/777e9f4d-0cf8-448e-8068-f564c31baa25/sheet/45beeb74-30ab-46be-8267-5756582633b4/state/analysis. Updated August 31, 2017. Accessed November 8, 2017.
5. Xarelto [package insert]. Titusville, NJ: Janssen Pharmaceuticals Inc; 2011.
6. Eliquis [package insert]. Princeton, NJ: Bristol-Myers Squibb Company; New York, NY: Pfizer Inc; 2016.
7. Pacerone [package insert]. Minneapolis, MN: Upsher-Smith Laboratories Inc; 2008. Minneapolis, MN.
8. Flomax [package insert]. Ridgefield, CT: Boehringer Ingelheim Pharmaceuticals Inc; 2016.
9. Granger CB, Alexander JH, McMurray JJ, et al; ARISTOTLE Committees and Investigators. Apixaban versus warfarin in patient with atrial fibrillation. N Engl J Med. 2011;365(11):981-992.
10. Michel DJ, Knodel LC. Comparison of three algorithms used to evaluate adverse drug reactions. Am J Hosp Pharm. 1986;43(7):1709-1714.
Lumbar Microlaminectomy vs Traditional Laminectomy
Lumbar spinal stenosis (LSS) is a common debilitating issue in older patients. Open laminectomies traditionally are the standard treatment for LSS; however, minimally invasive surgery (MIS) has recently become a popular option to facilitate recovery and improve efficiency of care regarding spine procedures.
Guiot and colleagues described the technique for an MIS decompressive lumbar laminectomy procedure.1 The surgery may represent an important strategy to improve the efficiency of care for patients with severe LSS. Several authors have reported clinical benefits with the MIS lumbar laminectomy, leading to a significant improvement in the Oswetry Disability Index (ODI) 25 in the degenerative stenosis group in cases of LSS.2-5 In a recent reviewof 13 studies Wong and colleagues concluded that the MIS laminectomy was efficacious in terms of symptomatic relief and patient satisfaction for patients with LSS.6 Further, Rosen and colleaguesfound a significant improvement in the ODI scores and in the Short Form-36 body pain and physical functions scores in patients aged ≥ 75 years.7
Perioperative measures, including blood loss and narcotic consumption, have been shown to significantly decrease with MIS surgery compared with open decompression.8,9 Decreased narcotic use is of particular interest for the geriatric population because it is expected to allow those patients to remain more physically active and mentally agile.10
Also, long-term success is important when assessing the efficacy of new MIS procedures. Oertel and colleagues found that 85% of patients reported long-term success after unilateral laminotomy of bilateral decompression (ULBD).11 These results indicate that a MIS laminectomy is effective in older patients with LSS and neurogenic claudication.
Although there are numerous MIS approaches to alleviating LSS, more research is needed to determine whether it is superior to the open laminectomy.9,12,13 Skovrliand and colleagues reviewed publications comparing ULBD and open laminectomies and determined that currently insufficient evidence exists to define which technique leads to more positive outcomes.14 Thus, the purpose of this study is 2-fold. First, this study adds to the current research by comparing estimated blood loss and length of stay (LOS) for microscopic MIS laminectomy vs traditional laminectomy. Second, this study aims to address the difference in health care costs between the 2 types of surgery in the VHA.
The U.S. health care system is facing several challenges and in particular pressure for cost reduction.15 VA hospitals are not exempt from those challenges, and their operating budgets are influenced by political and economic factors.16 Because of those challenges, cost-effectiveness is gaining importance.7 Future decisions for procedure coverage and reimbursement rates are likely to consider ratios like the cost to quality-adjusted life-years (QALY). Improving this ratio requires a reduction of cost and/or an improvement in outcome.
Minimally invasive spine surgery (MISS) may lower the cost of spine procedures. Wang and colleagues reported that minimally invasive posterior lumbar interbody fusion (PLIF) led to shorter stay and lower blood loss compared with traditional PLIF.17 These improvements led to about $8,000 in savings for a single-level PLIF.17
Lumbar degenerative disease is a frequently encountered condition, and lumbar laminectomy is one of the most frequently performed spine procedures at VA hospitals. Consequently, MISS may be an important strategy for the VA to face systematic challenges. At the Southern Arizona VA Health Care System (SAVAHCS) in Tucson, the authors converted lumbar laminectomies from traditional open surgery to a MIS procedure using a tubular retractor system and a paramedian approach. To the authors’ knowledge, no studies have evaluated outcomes and cost efficiency of MIS surgery at the VA. The results of such a study may be instrumental in choosing which surgery is appropriate in a patient-centered health care model.
Material and Methods
Fifty veterans with severe lumbar stenosis and neurogenic claudication underwent a 1- or 2-level laminectomy at SAVAHCS (Table). A traditional laminectomy was performed for all patients until conversion to the MIS procedure, then all subsequent patients underwent the microlaminectomy. There was 1 female patient in each group. The preoperative magnetic resonance imaging (MRI) of the patients showed severe spinal canal stenosis defined radiographically by the absence of cerebrospinal fluid signal at the affected level on MRI (Figures 1A and 2A) and clinically by the presence of neurogenic claudication. 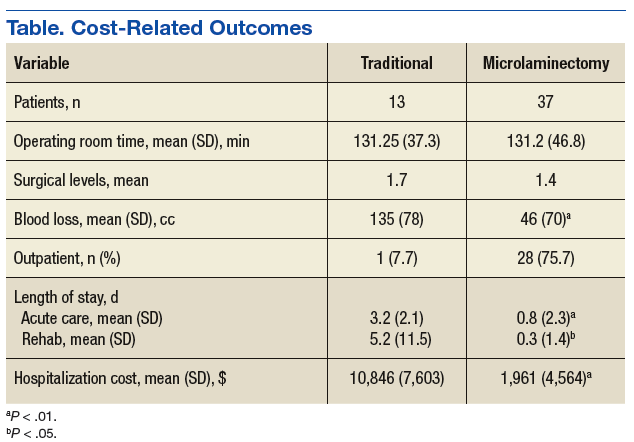
Procedure
The open laminectomies were performed in a traditional midline approach with removal of the spinous process along with the lamina bilaterally to provide spinal canal decompression (Figure 2). 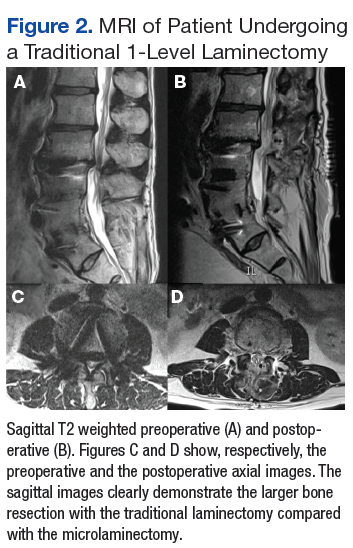
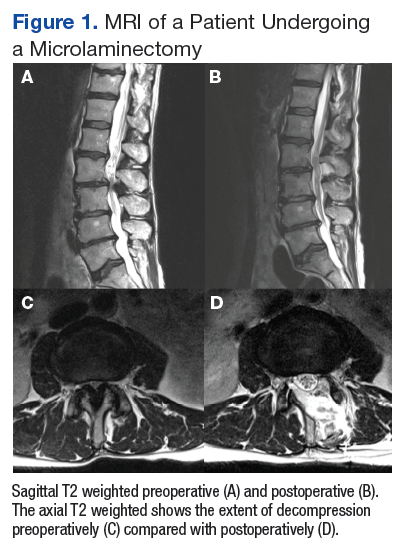
The patients were given the choice of going home or being admitted. Overall admission costs were determined by the VA hospital following described models.18 The LOS in rehabilitation were determined from the records of the SAVAHCS rehabilitation center.
Results
There was not a significant difference in age between the 2 groups; mean age was 69.7 ± 9.8 years for the traditional laminectomy group and 64.4 ± 8.3 years for the MIS group. Operating room time was just over 2 hours on average in both groups. Blood loss was estimated and reported by the surgeon and the anesthesiologist, based on values from the surgical suction system. Patients in the MIS group lost on average 46 cc ± 70 cc compared with 135 cc ± 78 cc in the traditional group. The average number of operated levels was higher in the traditional group (1.7 ± 0.5) compared with the MIS group (1.4 ± 0.5), but this difference did not reach significance (P > .05).
Length of Stay and Cost
The LOS was lower for the MIS group, and 76% chose to be discharged from the recovery room. After a traditional laminectomy, the average patient’s stay was 3 days in the hospital and 5 days in the rehabilitation center. The average MIS group patient stayed < 1 day in the hospital. There were no readmissions within 30 days and no severe morbidity (including no new neurologic deficits or death) in the MIS cohort.
Only 1 MIS patient needed transfer to the rehabilitation center. The estimated cost of care (hospital and rehabilitation) for the traditional group was $10,846 compared with $1,961 for the MIS group.
Discussion
In the authors’ experience, the use of MISS microlaminectomy for the treatment of LSS seems to have led to shorter hospital stays and faster recoveries. Some of the possible reasons for faster patient mobilization included a reduction in postoperative pain and the absence of a wound drain. Larger dissections with a traditional laminectomy often lead to the placement of a wound drain, which requires an inpatient stay until the wound output reaches a certain threshold. The absence of a drain and the reduction in pain with the MISS approach allowed the providers to focus on early ambulation and discharge planning. The microlaminectomy technique allowed for a proper surgical decompression with less tissue dissection than is required for a traditional laminectomy. Previous studies have shown that the microlaminectomy technique provides significant symptomatic relief.5-7,17
In most cases, the microlaminectomy can be performed on an outpatient basis. The improvement in bed availability is particularly important as surgical procedures may be delayed when hospitals operate at full capacity. Redesigning a procedure typically requiring hospital admission into an outpatient procedure improves availability, allowing for better patient access to health care.19
Other authors have studied opportunities to transform inpatient neurosurgical care into outpatient procedures. For instance, Purzner and colleagues presented a large series of successful outpatient neurosurgical cases, including craniotomies, cervical fusions, and lumbar microdiscectomies.20 The MISS techniques offer a critical option to facilitate postoperative recovery and improve efficiency of care in regards to spine procedures.5,17
Cost-Effectiveness Within the VHA
The VA has been described as one of the best health care systems in the U.S.9 The arguments in favor of the VA system include its integrated computerized system and its resistance to health care cost inflation over the years.21 The $186.5 billion 2018 fiscal year VA budget is surpassed only by the total DoD budget, and it is expected to rise substantially in the near future.22
Redesigning a procedure typically requiring hospital admission into an outpatient procedure improves bed availability and reduces cost.19 The authors have demonstrated that a minimally invasive unilateral paramedian approach for the treatment of lumbar stenosis leads to shorter hospital stay, improved bed availability, and lower cost while allowing for a proper surgical decompression. These clinical results are in accord with previous MIS surgery studies.5,17 The improvement in bed availability is particularly important within the VA system. Elective surgeries occasionally are delayed or cancelled because hospitals operate at full capacity. However, the authors’ outpatient microlaminectomy patients avoid delays or cancellations.
Given that both laminectomy procedures use similar operating room resources (time and material), the lower LOS associated with the microlaminectomy translates in cost saving. At SAVAHCS, acute care hospitalization is estimated at $3,000 per day when accounting for various costs, including nursing, pharmacy, ancillary services, and maintenance. The MIS procedure costs about $9,000 less than the open surgery. Over a 2-year period with 37 MIS patients, SAVAHCS saved about $300,000.
Patient Satisfaction
Patient satisfaction was assessed 1 day after the lumbar microdecompression outpatient surgery. Patients were asked to rate their overall surgical experience on a scale of 1 (worst) to 10 (best). All 24 patients who were contacted following outpatient lumbar microdecompression surgery rated the experience 10. These results indicate that patients do not expect or desire an admission following lumbar surgery, and they may recover comfortably at home. Studies are needed to compare outpatient and inpatient satisfaction ratings.
Conclusion
In this small sample, lumbar microlaminectomy significantly reduced LOS, successfully decompressed the spinal canal, and achieved symptomatic relief. Also, the procedure is associated with a lower blood loss than a traditional laminectomy and may reduce the rate of perioperative morbidity over time. In addition to faster recovery, the reduction in LOS can improve access to care by increasing the availability to inpatient admission.
1. Guiot BH, Khoo LT, Fessler RG. A minimally invasive technique for decompression of the lumbar spine. Spine (Phila PA 1976). 2002;27(4):432-438.
2. Rahman M, Summers LE, Richter B, Mimran RI, Jacob RP. Comparison of techniques for decompressive lumbar laminectomy: the minimally invasive versus the “classic” open approach. Minim Invasive Neurosurg. 2008;51(2)100-105.
3. Sasai K, Umeda M, Maruyama T, Wakabayashi E, Iida H. Microsurgical bilateral decompression via a unilateral approach for lumbar spinal canal stenosis including degenerative spondylolisthesis. J Neurosurg Spine. 2008;9(6):554-559.
4. Pao JL, Chen WC, Chen PQ. Clinical outcomes of microendoscopic decompressive laminotomy for degenerative lumbar spinal stenosis. Eur Spine J. 2009;18(5):672-678.
5. Yagi M, Okada, E, Ninomiya K, Kihara M. Postoperative outcome after modified unilateral-approach microendoscopic midline decompression for degenerative spinal stenosis. J Neurosurg Spine. 2009;10(4):293-299.
6. Wong AP, Smith ZA, Lall RR, Bresnahan LE, Fessler RG. The microendoscopic decompression of lumbar stenosis: a review of the current literature and clinical results. Minim Invasive Surg. 2012;2012:325095.
7. Rosen DS, O’Toole JE, Eichholz KM, et al. Minimally invasive lumbar spinal decompression in the elderly: outcomes of 50 patients aged 75 years and older. Neurosurgery. 2007;60(3):503-509.
8. Khoo LT, Fessler RG. Microendoscopic decompressive laminotomy for the treatment of lumbar stenosis. Neurosurgery. 2002;51(suppl 5):S146-S154.
9. Mobbs RJ, Li J, Sivabalan P, Raley D, Rao PJ. Outcomes after decompressive laminectomy for lumbar spinal stenosis: comparison between minimally invasive unilateral laminectomy for bilateral decompression and open laminectomy: clinical article. J Neurosurg Spine. 2014;21(2):179-186.
10. Avila MJ, Walter CM, Baaj AA. Outcomes and complications of minimally invasive surgery of the lumbar spine in the elderly. Cureus. 2016;8(3):e519.
11. Oertel MF, Ryang YM, Korinth MC, Gilsbach JM, Rohde V. Long-term results of microsurgical treatment of lumbar spinal stenosis by unilateral laminotomy for bilateral decompression. Neurosurgery. 2006;59(6):1264-1269.
12. Haddadi K, Ganjeh Qazvini HR. Outcome after surgery of lumbar spinal stenosis: a randomized comparison of bilateral laminotomy, trumpet laminectomy, and conventional laminectomy. Front Surg. 2016;3:199.
13. Watanabe K, Matsumoto M, Ikegami T, et al. Reduced postoperative wound pain after lumbar spinous process-splitting laminectomy for lumbar canal stenosis: a randomized controlled study. J Neurosurg Spine. 2011;14(1):51-58.
14. Skovrlj B, Belton P, Zarzour H, Qureshi SA. Perioperative outcomes in minimally invasive lumbar spine surgery: a systematic review. World J. Orthop. 2015;6(11):996-1005.
15. Hellander I. The deepening crisis in U.S. health care: a review of data. Int J Health Serv. 2011;41(3):575-586.
16. Chokshi DA. Improving health care for veterans—a watershed moment for the VA. N Engl J Med. 2014;371(4):297-299.
17. Wang MY, Cummock MD, Yu Y, Trivedi RA. An analysis of the differences in the acute hospitalization charges following minimally invasive versus open posterior lumbar interbody fusion. J Neurosurg Spine. 2010;12(6):694-699.
18. Barnett PG. Determination of VA health care costs. Med Care Res Rev. 2003;60(suppl 3):S124-S141.
19. Congressional Budget Office. The health care system for veterans: interim report. https://www.cbo.gov/sites/default/files/110th-congress-2007-2008/reports/12-21-va_healthcare.pdf. Published December 2007. Accessed October 13, 2017.
20. Purzner T, Purzner J, Massicotte EM, Bernstein M. Outpatient brain tumor surgery and spinal decompression: a prospective study of 1003 patients. Neurosurgery. 2011;69(1):119-126.
21. Waller D. How veterans’ hospitals became the best in health care. Time Magazine. http://content.time.com/time/magazine/article/0,9171,1376238,00.html. Published August 27, 2006. Accessed October 13, 2017.
22. U.S. Department of Veterans Affairs, Office of Budget. Annual budget submission—office of budget. https://www.va.gov/budget/products.asp. Updated July 12, 2017. Published October 13, 2017. Accessed October 27, 2017.
Lumbar spinal stenosis (LSS) is a common debilitating issue in older patients. Open laminectomies traditionally are the standard treatment for LSS; however, minimally invasive surgery (MIS) has recently become a popular option to facilitate recovery and improve efficiency of care regarding spine procedures.
Guiot and colleagues described the technique for an MIS decompressive lumbar laminectomy procedure.1 The surgery may represent an important strategy to improve the efficiency of care for patients with severe LSS. Several authors have reported clinical benefits with the MIS lumbar laminectomy, leading to a significant improvement in the Oswetry Disability Index (ODI) 25 in the degenerative stenosis group in cases of LSS.2-5 In a recent reviewof 13 studies Wong and colleagues concluded that the MIS laminectomy was efficacious in terms of symptomatic relief and patient satisfaction for patients with LSS.6 Further, Rosen and colleaguesfound a significant improvement in the ODI scores and in the Short Form-36 body pain and physical functions scores in patients aged ≥ 75 years.7
Perioperative measures, including blood loss and narcotic consumption, have been shown to significantly decrease with MIS surgery compared with open decompression.8,9 Decreased narcotic use is of particular interest for the geriatric population because it is expected to allow those patients to remain more physically active and mentally agile.10
Also, long-term success is important when assessing the efficacy of new MIS procedures. Oertel and colleagues found that 85% of patients reported long-term success after unilateral laminotomy of bilateral decompression (ULBD).11 These results indicate that a MIS laminectomy is effective in older patients with LSS and neurogenic claudication.
Although there are numerous MIS approaches to alleviating LSS, more research is needed to determine whether it is superior to the open laminectomy.9,12,13 Skovrliand and colleagues reviewed publications comparing ULBD and open laminectomies and determined that currently insufficient evidence exists to define which technique leads to more positive outcomes.14 Thus, the purpose of this study is 2-fold. First, this study adds to the current research by comparing estimated blood loss and length of stay (LOS) for microscopic MIS laminectomy vs traditional laminectomy. Second, this study aims to address the difference in health care costs between the 2 types of surgery in the VHA.
The U.S. health care system is facing several challenges and in particular pressure for cost reduction.15 VA hospitals are not exempt from those challenges, and their operating budgets are influenced by political and economic factors.16 Because of those challenges, cost-effectiveness is gaining importance.7 Future decisions for procedure coverage and reimbursement rates are likely to consider ratios like the cost to quality-adjusted life-years (QALY). Improving this ratio requires a reduction of cost and/or an improvement in outcome.
Minimally invasive spine surgery (MISS) may lower the cost of spine procedures. Wang and colleagues reported that minimally invasive posterior lumbar interbody fusion (PLIF) led to shorter stay and lower blood loss compared with traditional PLIF.17 These improvements led to about $8,000 in savings for a single-level PLIF.17
Lumbar degenerative disease is a frequently encountered condition, and lumbar laminectomy is one of the most frequently performed spine procedures at VA hospitals. Consequently, MISS may be an important strategy for the VA to face systematic challenges. At the Southern Arizona VA Health Care System (SAVAHCS) in Tucson, the authors converted lumbar laminectomies from traditional open surgery to a MIS procedure using a tubular retractor system and a paramedian approach. To the authors’ knowledge, no studies have evaluated outcomes and cost efficiency of MIS surgery at the VA. The results of such a study may be instrumental in choosing which surgery is appropriate in a patient-centered health care model.
Material and Methods
Fifty veterans with severe lumbar stenosis and neurogenic claudication underwent a 1- or 2-level laminectomy at SAVAHCS (Table). A traditional laminectomy was performed for all patients until conversion to the MIS procedure, then all subsequent patients underwent the microlaminectomy. There was 1 female patient in each group. The preoperative magnetic resonance imaging (MRI) of the patients showed severe spinal canal stenosis defined radiographically by the absence of cerebrospinal fluid signal at the affected level on MRI (Figures 1A and 2A) and clinically by the presence of neurogenic claudication.
Procedure
The open laminectomies were performed in a traditional midline approach with removal of the spinous process along with the lamina bilaterally to provide spinal canal decompression (Figure 2).
The patients were given the choice of going home or being admitted. Overall admission costs were determined by the VA hospital following described models.18 The LOS in rehabilitation were determined from the records of the SAVAHCS rehabilitation center.
Results
There was not a significant difference in age between the 2 groups; mean age was 69.7 ± 9.8 years for the traditional laminectomy group and 64.4 ± 8.3 years for the MIS group. Operating room time was just over 2 hours on average in both groups. Blood loss was estimated and reported by the surgeon and the anesthesiologist, based on values from the surgical suction system. Patients in the MIS group lost on average 46 cc ± 70 cc compared with 135 cc ± 78 cc in the traditional group. The average number of operated levels was higher in the traditional group (1.7 ± 0.5) compared with the MIS group (1.4 ± 0.5), but this difference did not reach significance (P > .05).
Length of Stay and Cost
The LOS was lower for the MIS group, and 76% chose to be discharged from the recovery room. After a traditional laminectomy, the average patient’s stay was 3 days in the hospital and 5 days in the rehabilitation center. The average MIS group patient stayed < 1 day in the hospital. There were no readmissions within 30 days and no severe morbidity (including no new neurologic deficits or death) in the MIS cohort.
Only 1 MIS patient needed transfer to the rehabilitation center. The estimated cost of care (hospital and rehabilitation) for the traditional group was $10,846 compared with $1,961 for the MIS group.
Discussion
In the authors’ experience, the use of MISS microlaminectomy for the treatment of LSS seems to have led to shorter hospital stays and faster recoveries. Some of the possible reasons for faster patient mobilization included a reduction in postoperative pain and the absence of a wound drain. Larger dissections with a traditional laminectomy often lead to the placement of a wound drain, which requires an inpatient stay until the wound output reaches a certain threshold. The absence of a drain and the reduction in pain with the MISS approach allowed the providers to focus on early ambulation and discharge planning. The microlaminectomy technique allowed for a proper surgical decompression with less tissue dissection than is required for a traditional laminectomy. Previous studies have shown that the microlaminectomy technique provides significant symptomatic relief.5-7,17
In most cases, the microlaminectomy can be performed on an outpatient basis. The improvement in bed availability is particularly important as surgical procedures may be delayed when hospitals operate at full capacity. Redesigning a procedure typically requiring hospital admission into an outpatient procedure improves availability, allowing for better patient access to health care.19
Other authors have studied opportunities to transform inpatient neurosurgical care into outpatient procedures. For instance, Purzner and colleagues presented a large series of successful outpatient neurosurgical cases, including craniotomies, cervical fusions, and lumbar microdiscectomies.20 The MISS techniques offer a critical option to facilitate postoperative recovery and improve efficiency of care in regards to spine procedures.5,17
Cost-Effectiveness Within the VHA
The VA has been described as one of the best health care systems in the U.S.9 The arguments in favor of the VA system include its integrated computerized system and its resistance to health care cost inflation over the years.21 The $186.5 billion 2018 fiscal year VA budget is surpassed only by the total DoD budget, and it is expected to rise substantially in the near future.22
Redesigning a procedure typically requiring hospital admission into an outpatient procedure improves bed availability and reduces cost.19 The authors have demonstrated that a minimally invasive unilateral paramedian approach for the treatment of lumbar stenosis leads to shorter hospital stay, improved bed availability, and lower cost while allowing for a proper surgical decompression. These clinical results are in accord with previous MIS surgery studies.5,17 The improvement in bed availability is particularly important within the VA system. Elective surgeries occasionally are delayed or cancelled because hospitals operate at full capacity. However, the authors’ outpatient microlaminectomy patients avoid delays or cancellations.
Given that both laminectomy procedures use similar operating room resources (time and material), the lower LOS associated with the microlaminectomy translates in cost saving. At SAVAHCS, acute care hospitalization is estimated at $3,000 per day when accounting for various costs, including nursing, pharmacy, ancillary services, and maintenance. The MIS procedure costs about $9,000 less than the open surgery. Over a 2-year period with 37 MIS patients, SAVAHCS saved about $300,000.
Patient Satisfaction
Patient satisfaction was assessed 1 day after the lumbar microdecompression outpatient surgery. Patients were asked to rate their overall surgical experience on a scale of 1 (worst) to 10 (best). All 24 patients who were contacted following outpatient lumbar microdecompression surgery rated the experience 10. These results indicate that patients do not expect or desire an admission following lumbar surgery, and they may recover comfortably at home. Studies are needed to compare outpatient and inpatient satisfaction ratings.
Conclusion
In this small sample, lumbar microlaminectomy significantly reduced LOS, successfully decompressed the spinal canal, and achieved symptomatic relief. Also, the procedure is associated with a lower blood loss than a traditional laminectomy and may reduce the rate of perioperative morbidity over time. In addition to faster recovery, the reduction in LOS can improve access to care by increasing the availability to inpatient admission.
1. Guiot BH, Khoo LT, Fessler RG. A minimally invasive technique for decompression of the lumbar spine. Spine (Phila PA 1976). 2002;27(4):432-438.
2. Rahman M, Summers LE, Richter B, Mimran RI, Jacob RP. Comparison of techniques for decompressive lumbar laminectomy: the minimally invasive versus the “classic” open approach. Minim Invasive Neurosurg. 2008;51(2)100-105.
3. Sasai K, Umeda M, Maruyama T, Wakabayashi E, Iida H. Microsurgical bilateral decompression via a unilateral approach for lumbar spinal canal stenosis including degenerative spondylolisthesis. J Neurosurg Spine. 2008;9(6):554-559.
4. Pao JL, Chen WC, Chen PQ. Clinical outcomes of microendoscopic decompressive laminotomy for degenerative lumbar spinal stenosis. Eur Spine J. 2009;18(5):672-678.
5. Yagi M, Okada, E, Ninomiya K, Kihara M. Postoperative outcome after modified unilateral-approach microendoscopic midline decompression for degenerative spinal stenosis. J Neurosurg Spine. 2009;10(4):293-299.
6. Wong AP, Smith ZA, Lall RR, Bresnahan LE, Fessler RG. The microendoscopic decompression of lumbar stenosis: a review of the current literature and clinical results. Minim Invasive Surg. 2012;2012:325095.
7. Rosen DS, O’Toole JE, Eichholz KM, et al. Minimally invasive lumbar spinal decompression in the elderly: outcomes of 50 patients aged 75 years and older. Neurosurgery. 2007;60(3):503-509.
8. Khoo LT, Fessler RG. Microendoscopic decompressive laminotomy for the treatment of lumbar stenosis. Neurosurgery. 2002;51(suppl 5):S146-S154.
9. Mobbs RJ, Li J, Sivabalan P, Raley D, Rao PJ. Outcomes after decompressive laminectomy for lumbar spinal stenosis: comparison between minimally invasive unilateral laminectomy for bilateral decompression and open laminectomy: clinical article. J Neurosurg Spine. 2014;21(2):179-186.
10. Avila MJ, Walter CM, Baaj AA. Outcomes and complications of minimally invasive surgery of the lumbar spine in the elderly. Cureus. 2016;8(3):e519.
11. Oertel MF, Ryang YM, Korinth MC, Gilsbach JM, Rohde V. Long-term results of microsurgical treatment of lumbar spinal stenosis by unilateral laminotomy for bilateral decompression. Neurosurgery. 2006;59(6):1264-1269.
12. Haddadi K, Ganjeh Qazvini HR. Outcome after surgery of lumbar spinal stenosis: a randomized comparison of bilateral laminotomy, trumpet laminectomy, and conventional laminectomy. Front Surg. 2016;3:199.
13. Watanabe K, Matsumoto M, Ikegami T, et al. Reduced postoperative wound pain after lumbar spinous process-splitting laminectomy for lumbar canal stenosis: a randomized controlled study. J Neurosurg Spine. 2011;14(1):51-58.
14. Skovrlj B, Belton P, Zarzour H, Qureshi SA. Perioperative outcomes in minimally invasive lumbar spine surgery: a systematic review. World J. Orthop. 2015;6(11):996-1005.
15. Hellander I. The deepening crisis in U.S. health care: a review of data. Int J Health Serv. 2011;41(3):575-586.
16. Chokshi DA. Improving health care for veterans—a watershed moment for the VA. N Engl J Med. 2014;371(4):297-299.
17. Wang MY, Cummock MD, Yu Y, Trivedi RA. An analysis of the differences in the acute hospitalization charges following minimally invasive versus open posterior lumbar interbody fusion. J Neurosurg Spine. 2010;12(6):694-699.
18. Barnett PG. Determination of VA health care costs. Med Care Res Rev. 2003;60(suppl 3):S124-S141.
19. Congressional Budget Office. The health care system for veterans: interim report. https://www.cbo.gov/sites/default/files/110th-congress-2007-2008/reports/12-21-va_healthcare.pdf. Published December 2007. Accessed October 13, 2017.
20. Purzner T, Purzner J, Massicotte EM, Bernstein M. Outpatient brain tumor surgery and spinal decompression: a prospective study of 1003 patients. Neurosurgery. 2011;69(1):119-126.
21. Waller D. How veterans’ hospitals became the best in health care. Time Magazine. http://content.time.com/time/magazine/article/0,9171,1376238,00.html. Published August 27, 2006. Accessed October 13, 2017.
22. U.S. Department of Veterans Affairs, Office of Budget. Annual budget submission—office of budget. https://www.va.gov/budget/products.asp. Updated July 12, 2017. Published October 13, 2017. Accessed October 27, 2017.
Off Target But Hitting the Mark
A 32-year-old woman presented to the emergency department (ED) with 3 months of abdominal pain and 1 week of vomiting.
The differential diagnosis of abdominal pain is broad. This presentation could be caused by disorders of the gastrointestinal (GI), gynecologic, urinary, or, less likely, the neuromuscular systems. The presence of vomiting supports a GI cause. Pregnancy should be excluded in any woman of childbearing age presenting with abdominal pain.
Characteristics of the pain, including location, temporal characteristics, severity, and aggravating and alleviating factors, can narrow the differential diagnosis. The past medical history, including prior surgeries, menstrual, and obstetric history, is also critical.
Approximately 3 months prior to presentation, she reported a tick bite that had evolved into a circumferential targetoid rash. Her primary care provider performed serologic testing for Lyme disease, which was negative, and prescribed doxycycline, which she stopped after a week because of nausea and diffuse, achy, and constant abdominal pain. After initial improvement, symptoms recurred a week prior to presentation. The nausea was now associated with intractable vomiting and anorexia. She denied hematemesis or coffee ground emesis. Her abdominal pain intensified and radiated to her back. She lost 10 pounds over the past week. She denied headache, constipation, diarrhea, blood per rectum, melena, dysuria, vaginal discharge, or rash. She reported chills and temperatures up to 37.8 ° C at home.
She had a history of migraine headaches for which she took ibuprofen occasionally but took no other prescription or over-the-counter medications. She had never smoked, consumed 2 alcoholic beverages a month, and denied illicit drug use. She lived with her boyfriend on a farm in Indiana where she raised chickens, rabbits, and ducks.
The patient dates the onset of nausea and abdominal pain to a course of doxycycline, presumably prescribed for early Lyme disease, which was stopped after only 1 week. GI side effects, including nausea, vomiting, and upper abdominal pain, are common with doxycycline and may account for the early symptoms. However, these symptoms typically resolve promptly with drug discontinuation. Doxycycline may rarely cause esophageal and gastric ulcers, which could explain her symptoms.
Fewer than half of patients with erythema migrans caused by Lyme disease are seropositive at presentation, as there has been insufficient time for antibodies to develop. Lyme disease typically affects the skin, joints, heart, and nervous system and only rarely affects the GI tract. Acute Lyme disease can cause intestinal pseudoobstruction, splenomegaly, and mild hepatitis. Although Lyme disease is unlikely to be the cause of the current symptoms, serologic testing should be repeated and should be positive if the patient now has early disseminated disease.
Patients with Lyme disease are occasionally coinfected with a second organism. Ixodes scapularis, the tick that transmits Lyme disease in the Northeast and Midwest, can be coinfected with Babesia microti, a red cell parasite. Babesiosis can persist for months and presents with fever, malaise, and many other nonspecific symptoms, including some that this patient has: anorexia, weight loss, abdominal pain, and vomiting.
The history of migraine and intractable vomiting suggests the possibility of cyclic vomiting syndrome. This syndrome is characterized by episodic bouts of vomiting lasting from hours to as long as a week. The vomiting is often accompanied by abdominal pain and occasionally headaches. Episodes are separated by asymptomatic periods that may last months. Cyclic vomiting syndrome can occur at any age but is more common in children, those with a personal or family history of migraines, and heavy users of cannabis. At least 3 stereotypical episodes are required to make the diagnosis, so a history of prior similar symptoms should be explored.
The differential diagnosis of abdominal pain and vomiting should stay broad until a comprehensive physical exam and initial laboratory tests are performed. Volume status should be assessed by estimating jugular venous pressure and by obtaining supine and standing blood pressure measurements. The abdomen should be examined carefully, and the presence or absence of hepatomegaly, splenomegaly, masses, and ascites should be specifically noted. The presence of bradycardia, oligoarticular arthritis, or neuropathy could provide supporting evidence for Lyme disease. Pregnancy is less likely given the diffuse and persistent nature of the pain but should still be excluded.
On physical examination, she was distressed, writhing on the bed, and appearing comfortable only on her side with her knees flexed. Her temperature was 36.5 ° C, heart rate 83 beats per minute, respiratory rate 18 breaths per minute, blood pressure 143/77 mmHg, and oxygen saturation 94% while breathing ambient air. Her abdomen was diffusely tender, most markedly in the epigastrium. Abdominal rigidity, rebound tenderness, and costovertebral tenderness were absent. There was no rash; the previously reported targetoid skin lesion was no longer present. The remainder of the exam was normal.
Laboratory evaluation showed a white count of 7900/mm3, hemoglobin 14.3 gm/dL with normocytic indices, and a platelet count of 175,000/mm3. Sodium was 130 mmol/L, potassium was 3.1 mmol/L, bicarbonate 26 mmol/L, blood urea nitrogen 15 mg/dL, creatinine 0.6 mg/dL, and glucose 92 mg/dL. Serum calcium, aspartate aminotransferase, alanine aminotransferase, bilirubin, and lipase were normal. A urine pregnancy test was negative. Urine analysis was negative for nitrites and leukocyte esterase. Abdominal and pelvic computed tomography (CT) scan with intravenous (IV) contrast performed 3 days prior at an outside ED revealed a 3.4 centimeter left ovarian cyst. A subsequent transvaginal ultrasound was negative for cyst torsion and confirmed appropriate placement of an intrauterine device.
The absence of abdominal rigidity and rebound tenderness does not exclude peritonitis. A normal white blood cell count also does not reliably exclude serious intraabdominal pathology. However, the CT scan argues strongly against many common causes of abdominal pain, including appendicitis, diverticulitis, perforated ulcer, intestinal obstruction, and malignancy, assuming the symptoms have not changed since it was performed.
The patient’s laboratory studies argue against biliary obstruction, pancreatitis, pregnancy, hypercalcemia, and ongoing urinary tract infection. Patients with functional gallbladder disorders may have normal laboratory and CT findings but typically have recurrent, biliary-colic-type pain. The low serum potassium, a high blood urea nitrogen to creatinine ratio, and a low serum sodium reflect her significant vomiting. The hyponatremia is consistent with the appropriate release of antidiuretic hormone (ADH) in the setting of volume depletion. She should receive isotonic fluids plus potassium in addition to symptomatic treatment of pain and nausea. Given the severity and duration of symptoms, an esophagogastroduodenoscopy (EGD) should be performed to exclude GI mucosal disease, including peptic ulcer disease and gastritis, which may not be evident on the CT scan.
Additional diagnoses should be considered at this point. This patient has exposure to chickens, ducks, rabbits, and ticks as well as reported chills and mild temperature elevation at home. Tularemia, which can be transmitted by tick bites or exposure to infected rabbits, can cause a prolonged illness. Some patients have abdominal pain, anorexia, nausea, and weight loss, although fever is usually more prominent. Tularemia is uncommon and most frequently seen in the south-central part of the United States but has been reported throughout the country. She should be queried regarding additional exposures, including well water to assess her risk for Campylobacter infection.
Opiate withdrawal can present with pain and vomiting, but she reports no opiate use and lacks other findings such pupillary dilation or piloerection. Given the prevalence of opiate abuse, however, a toxicology screen should be performed. Hypercalcemia and diabetic ketoacidosis as metabolic causes of abdominal pain have been ruled out by her laboratory values. If no other cause is identified, other metabolic etiologies like Addison disease, familial Mediterranean fever, or porphyria should be considered.
Cyclic vomiting syndrome should still be on the differential. It is a diagnosis of exclusion requiring a history of recurrent, stereotypical episodes, which should be explicitly explored.
The patient was admitted to a medical unit by the hospitalist service and received IV normal saline, parenteral potassium, and IV pantoprazole. She underwent an EGD that revealed minor erosions in the antrum of the stomach. Biopsies were obtained.
Seven hours after the endoscopy, the patient had a brief period of confusion followed by a generalized tonic-clonic seizure lasting 1 minute. A head CT without contrast was negative for any focal abnormality. Repeat laboratory evaluation revealed that serum sodium was 125 mmol/L, and serum glucose was 113 mg/dL. She was transferred to the progressive care unit and received IV levetiracetam.
The endoscopy excluded structural abnormalities of the stomach and duodenum. The patient now has an additional problem, seizure, which needs to be incorporated in the diagnostic reasoning.
Seizures can be caused by the rapid development of severe hyponatremia, with serum sodium levels usually less than 120 mmol/L. Seizures caused by hyponatremia are typically preceded by headache and lethargy, as the intracellular movement of excess water causes cerebral edema. Hyponatremia is unlikely to be the cause of her seizure but should nevertheless be evaluated with a urine sodium concentration and serum and urine osmolality. If she is euvolemic, the IV fluids should be stopped and her free water intake should be restricted to avoid worsening the hyponatremia, as it is potentially caused by the syndrome of inappropriate ADH (SIADH).
There are many other possible causes for new onset seizures in adults, including brain tumor, head trauma, alcohol withdrawal, medications, and central nervous system infection, including Lyme disease. Lyme serologies should be repeated.
In this patient, it is likely that the seizure is a manifestation of the same illness that is causing her vomiting and abdominal pain. Seizure is not a feature of cyclic vomiting syndrome in adults. It is also not a feature of tularemia, adrenal insufficiency, or opioid withdrawal.
Acute intermittent porphyria (AIP) can cause both abdominal and neurologic problems. Hyponatremia is common during acute attacks, caused by either the inappropriate release of ADH or the appropriate release of the hormone if there is fluid loss. AIP is a rare diagnosis but could explain the uncommon combination of abdominal pain, vomiting, seizure, and hyponatremia. A spot urine porphobilinogen test should be sent to assess for AIP.
Additional laboratory studies were sent. Serum osmolality was 269 mosm/kg with a corresponding urine osmolality of 699 mosm/kg. A random urine sodium was 145 mEq/L. Thyroid stimulating hormone and cosyntropin stimulating testing were normal. IgM and IgG antibodies to Borrelia burgdorferi were negative. Urine porphobilinogen was sent. An electroencephalogram did not reveal epileptiform discharges. Magnetic resonance imaging (MRI) of the brain was significant for T2/FLAIR hyperintensity in the cortex and subcortical white matter of the occipital lobes bilaterally. Hypertonic saline and fluid restriction were initiated.
The patient’s labs are consistent with SIADH. Excessive ADH release because of volume depletion and consequent hyponatremia should have improved rapidly with the administration of saline. The high urine sodium suggests that she is now volume replete, while the high urine osmolality is consistent with the presence of excessive ADH in the absence of appropriate stimuli. In the context of normal thyroid and adrenal function, the hyponatremia is likely due to the SIADH.
Negative serologic testing for Lyme disease, 3 months after the onset of rash, excludes this diagnosis.
The MRI findings are consistent with posterior reversible encephalopathy syndrome (PRES), a clinicoradiographic syndrome of headache, altered mental status, seizure, and/or vision loss with associated white matter abnormalities of the posterior cerebral hemispheres. PRES has been reported with AIP as well as other disorders, most commonly hypertensive encephalopathy, eclampsia, and immunosuppressive drug use.
The patient’s sodium improved with fluid restriction and the administration of hypertonic saline. There was no recurrence of seizure activity. Amlodipine was initiated for blood pressure readings as high as 156/106 mmHg. A hepatobiliary scan revealed a gallbladder ejection fraction of 13%. Biopsies from her endoscopy revealed nonspecific inflammation without the presence of Helicobacter pylori. The patient was discharged home 7 days after admission after stabilization of serum sodium, improvement in her abdominal pain, and tolerance of oral intake. A plan was made for outpatient cholecystectomy.
Many causes of abdominal pain have been excluded and the remaining diagnostic possibility, porphyria, is rare. The clinicians have revisited their differential and considered other causes of abdominal pain, including functional gallbladder disorders. However, chronic cholecystitis (or functional gallbladder disorder) is not this patient’s primary problem. The diffuse, severe, and constant abdominal pain prior to admission is not typical of biliary pain, and many medical conditions and drugs, including amlodipine, can lead to a positive hepatobiliary scan. Chronic cholecystitis would not explain her seizure.
AIP remains at the top of the differential for this young woman. A urine porphobilinogen has been sent and must be followed up prior to any further workup or surgery.
One week after discharge, the patient’s urine porphobilinogen resulted at 172.8 mCmol/ (upper limits of normal 8.8). Sequencing analysis for genes coding the enzymes involved in the synthetic pathway for heme were sent. Hydroxymethylbilane synthase, coproporphyrinogen oxidase, and protoporphyrinogen oxidase mutation assays were all normal. Despite the normal genetic assays, the diagnosis of AIP was made on the basis of the clinical presentation and elevated urine porphobilinogen. The patient was referred to a hematologist and initiated on oral glucose supplements and hematin infusions.
DISCUSSION
Although abdominal pain has a broad differential, the combination of abdominal pain and neurologic or psychiatric symptoms should suggest the possibility of porphyria, especially if symptoms are recurrent or unexplained. The porphyrias are a group of disorders caused by defects in the synthetic pathway of heme, leading to an overproduction and accumulation of precursors. Heme is a component of multiple proteins, including hemoglobin, myoglobin, and the cytochrome P450 enzymes. Although it is synthesized in all tissues, the bone marrow and liver are the organs most actively involved. The porphyrias can be classified according to the primary site of the overproduction and accumulation of heme precursors (liver vs bone marrow). Although there is overlap between the 2 groups, hepatic porphyrias often present with acute neurovisceral symptoms, while the erythropoietic porphyrias often cause cutaneous photosensitivity.1
AIP is the most common hepatic porphyria with a prevalence of 1 in 20,000 in Caucasians of Western European descent.1 AIP is caused by a defect in the gene that encodes porphobilinogen deaminase, leading to the accumulation of porphobilinogen.1 The cardinal manifestation is an acute porphyric attack. While the precise mechanisms underlying the symptoms are unknown, the accumulating metabolites may be directly neurotoxic.2 Attacks are precipitated by factors that induce heme synthesis, including caloric restriction, alcohol, and certain medications, particularly those that upregulate cyP450. The most commonly implicated drugs are anesthetics, antiepileptics, sulfonamides, rifampin, and estrogen and progesterone. Attacks can also be precipitated by changes in endogenous sex hormone levels, like the increase in progesterone seen in the luteal phase of the menstrual cycle, which may account for the higher incidence of symptomatic attacks in women.3
Acute attacks of AIP may have a wide variety of presentations; the disease was referred to as the “little imitator” in the early 20th century.4 The most common symptom is acute, severe abdominal pain, which may mimic an acute abdomen. Because the pain is neuropathic rather than inflammatory, abdominal tenderness, rebound, fever, and leukocytosis are usually absent, as they were in this patient. Abdominal pain is often accompanied by neuropsychiatric symptoms, including sensory and motor neuropathy, anxiety, hallucinations, delirium, and altered level of consciousness. Seizure occurs in 20% of cases. Involvement of the autonomic nervous system causes tachycardia and new onset hypertension in the majority of patients as well as restlessness and tremor. Hyponatremia, mediated by the syndrome of inappropriate ADH secretion, occurs in nearly a third of patients.5,6 MRI findings consistent with PRES have also been described in AIP.7
The diagnosis of AIP is often delayed; diagnosis later in the disease course is associated with a poorer prognosis.8 Reported intervals between presentation and diagnosis range from several months to as long as 20 years.9 Associating the use of medications, caloric restriction, or the menstrual cycle with the exacerbation of symptoms or darkening of urine can help prompt an earlier diagnosis.6
AIP can be diagnosed by detecting a greater than 5-fold elevation of urinary porphobilinogen excretion in conjunction with the typical symptoms of an acute attack.5 Renal dysfunction causes urinary excretion of PBG to fall and serum levels to rise.10 Serum PBG levels should therefore be sent when AIP is suspected in the setting of renal dysfunction. The primary role of genetic testing in a patient who has AIP confirmed clinically and biochemically is to assist in genetic counseling and to identify asymptomatic family members.11 Genetic testing is not required to confirm the diagnosis and does not help prognosticate. It is unusual that a mutation was not detected in this case, as the current sensitivity of genetic testing is 97% to 100%.11
There are 4 principles of management of an acute porphyric attack. First, any precipitating factors such as medications should be stopped. Second, abdominal pain should be treated appropriately with opioids, if necessary. Third, if autonomic dysfunction is present, beta-blockers or clonidine should be given to treat hypertension.5 Finally, glucose and/or hemin should be administered to downregulate aminolevulinic acid (ALA) synthase by negative feedback. Downregulation of ALA synthase decreases the accumulation of the neurotoxic porphyrin precursors ALA and PBG.5 For patients with mild symptoms, glucose alone (300-500 g/d) may be enough to abort the attack.12 This can be achieved via a high-carbohydrate diet in those able to tolerate oral intake or via continuous infusions of dextrose containing fluids.5 For more severe attacks with associated polyneuropathy, respiratory muscle weakness, or seizures, or for attacks that are not resolving, heme preparations dosed at 3 to 4 mg/kg/d for 3 to 4 days are indicated.5
The recent diagnosis of acute Lyme disease was a distractor in this presentation. In Lyme endemic areas, patients with erythema migrans are treated based on the clinical presentation rather than serologic testing.13 Although this patient took only 1 week of doxycycline, testing during this hospitalization showed that she had either been cured early or had not had Lyme disease in the first place. There is no known association between Lyme disease and the porphyrias, and doxycycline is not a common precipitant of AIP attacks.14 However, the GI side effects of doxycycline may have decreased caloric intake and ultimately provoked the patient’s first attack of AIP. The clinicians in this case appropriately avoided the “target” but hit the mark by correctly diagnosing AIP.
KEY POINTS
- Consider AIP in patients with unexplained abdominal pain, especially when accompanied by neuropsychiatric symptoms and autonomic lability.
- Diagnose AIP by sending a urine PBG during a suspected acute attack.
- Treat AIP acutely by removing precipitants, treating abdominal pain, and initiating dextrose-containing fluids and hemin infusions to downregulate ALA synthase.
Acknowledgments
The authors thank the patient who enthusiastically supported the writing of this report.
Disclosure
Warren Gavin, MD has disclosed participation in expert testimony. The authors have no financial or other conflicts of interest to disclose.
1. Desnick RJ, Balwani M. The Porphyrias. In: Kasper D, Fauci A, Hauser S, Longo D, Jameson J, Loscalzo J, eds. Harrison’s Principles of Internal Medicine, 19th Edition. New York: McGraw-Hill; 2015. http://accessmedicine.mhmedical.com.proxy.medlib.uits.iu.edu/content.aspx?bookid=1130&Sectionid=79754263. Accessed June 14, 2016.
2. Bissell DM, Lai JC, Meister RK, Blanc PD. Role of Delta-aminolevulinic Acid in the Symptoms of Acute Porphyria. Am J Med. 2015;128(3):313-317. PubMed
3. Bonkovsky HL, Guo JT, Hou W, Li T, Narang T, Thapar M. Porphyrin and Heme Metabolism and the Porphyrias. Compr Physiol. 2013;3(1):365-401. PubMed
4. Crimlisk HL. The little imitator--porphyria: a neuropsychiatric disorder. J Neurol Neurosurg Psychiatry. 1997;62(4):319-328. PubMed
5. Pischik E, Kauppinen R. An update of clinical management of acute intermittent porphyria. Appl Clin Genet. 2015;8:201-214. PubMed
6. Ventura P, Cappellini MD, Biolcati G, Guida CC, Rocchi E; Gruppo Italiano Porfiria (GrIP). A challenging diagnosis for potential fatal diseases: recommendations for diagnosing acute porphyrias. Eur J Intern Med. 2014;25(6):497-505. PubMed
7. Dagens A, Gilhooley MJ. Acute intermittent porphyria leading to posterior reversible encephalopathy syndrome (PRES): a rare cause of abdominal pain and seizures. BMJ Case Rep. 2016:bcr2016215350. PubMed
8. Pischik E, Bulyanitsa A, Kazakov V, Kauppinen R. Clinical features predictive of a poor prognosis in acute porphyria. J Neurol. 2004;251(12):1538-1541. PubMed
9. Sack GH. Acute intermittent porphyria. JAMA. 1990;264(10):1290-1293. PubMed
10. Sardh E, Andersson DEH, Henrichson A, Harper P. Porphyrin precursors and porphyrins in three patients with acute intermittent porphyria and end-stage renal disease under different therapy regimes. Cell Mol Biol (Noisy-le-grand). 2009;55(1):66-71. PubMed
11. Whatley SD, Badminton MN. Role of genetic testing in the management of patients with inherited porphyria and their families. Ann Clin Biochem. 2013;50(3):204-216. PubMed
12. Anderson KE, Bloomer JR, Bonkovsky HL, et al. Recommendations for the diagnosis and treatment of the acute porphyrias. Ann Intern Med. 2005;142(6):439-450. PubMed
13. Wormser GP, Dattwyler RJ, Shapiro ED, et al. The clinical assessment, treatment, and prevention of lyme disease, human granulocytic anaplasmosis, and babesiosis: clinical practice guidelines by the Infectious Diseases Society of America. Clin Infect Dis. 2006;43(9):1089-1134. PubMed
14. American Porphyria Foundation. Drug database. http://www.porphyriafoundation.com/drug-database. Accessed July 21, 2017.
A 32-year-old woman presented to the emergency department (ED) with 3 months of abdominal pain and 1 week of vomiting.
The differential diagnosis of abdominal pain is broad. This presentation could be caused by disorders of the gastrointestinal (GI), gynecologic, urinary, or, less likely, the neuromuscular systems. The presence of vomiting supports a GI cause. Pregnancy should be excluded in any woman of childbearing age presenting with abdominal pain.
Characteristics of the pain, including location, temporal characteristics, severity, and aggravating and alleviating factors, can narrow the differential diagnosis. The past medical history, including prior surgeries, menstrual, and obstetric history, is also critical.
Approximately 3 months prior to presentation, she reported a tick bite that had evolved into a circumferential targetoid rash. Her primary care provider performed serologic testing for Lyme disease, which was negative, and prescribed doxycycline, which she stopped after a week because of nausea and diffuse, achy, and constant abdominal pain. After initial improvement, symptoms recurred a week prior to presentation. The nausea was now associated with intractable vomiting and anorexia. She denied hematemesis or coffee ground emesis. Her abdominal pain intensified and radiated to her back. She lost 10 pounds over the past week. She denied headache, constipation, diarrhea, blood per rectum, melena, dysuria, vaginal discharge, or rash. She reported chills and temperatures up to 37.8 ° C at home.
She had a history of migraine headaches for which she took ibuprofen occasionally but took no other prescription or over-the-counter medications. She had never smoked, consumed 2 alcoholic beverages a month, and denied illicit drug use. She lived with her boyfriend on a farm in Indiana where she raised chickens, rabbits, and ducks.
The patient dates the onset of nausea and abdominal pain to a course of doxycycline, presumably prescribed for early Lyme disease, which was stopped after only 1 week. GI side effects, including nausea, vomiting, and upper abdominal pain, are common with doxycycline and may account for the early symptoms. However, these symptoms typically resolve promptly with drug discontinuation. Doxycycline may rarely cause esophageal and gastric ulcers, which could explain her symptoms.
Fewer than half of patients with erythema migrans caused by Lyme disease are seropositive at presentation, as there has been insufficient time for antibodies to develop. Lyme disease typically affects the skin, joints, heart, and nervous system and only rarely affects the GI tract. Acute Lyme disease can cause intestinal pseudoobstruction, splenomegaly, and mild hepatitis. Although Lyme disease is unlikely to be the cause of the current symptoms, serologic testing should be repeated and should be positive if the patient now has early disseminated disease.
Patients with Lyme disease are occasionally coinfected with a second organism. Ixodes scapularis, the tick that transmits Lyme disease in the Northeast and Midwest, can be coinfected with Babesia microti, a red cell parasite. Babesiosis can persist for months and presents with fever, malaise, and many other nonspecific symptoms, including some that this patient has: anorexia, weight loss, abdominal pain, and vomiting.
The history of migraine and intractable vomiting suggests the possibility of cyclic vomiting syndrome. This syndrome is characterized by episodic bouts of vomiting lasting from hours to as long as a week. The vomiting is often accompanied by abdominal pain and occasionally headaches. Episodes are separated by asymptomatic periods that may last months. Cyclic vomiting syndrome can occur at any age but is more common in children, those with a personal or family history of migraines, and heavy users of cannabis. At least 3 stereotypical episodes are required to make the diagnosis, so a history of prior similar symptoms should be explored.
The differential diagnosis of abdominal pain and vomiting should stay broad until a comprehensive physical exam and initial laboratory tests are performed. Volume status should be assessed by estimating jugular venous pressure and by obtaining supine and standing blood pressure measurements. The abdomen should be examined carefully, and the presence or absence of hepatomegaly, splenomegaly, masses, and ascites should be specifically noted. The presence of bradycardia, oligoarticular arthritis, or neuropathy could provide supporting evidence for Lyme disease. Pregnancy is less likely given the diffuse and persistent nature of the pain but should still be excluded.
On physical examination, she was distressed, writhing on the bed, and appearing comfortable only on her side with her knees flexed. Her temperature was 36.5 ° C, heart rate 83 beats per minute, respiratory rate 18 breaths per minute, blood pressure 143/77 mmHg, and oxygen saturation 94% while breathing ambient air. Her abdomen was diffusely tender, most markedly in the epigastrium. Abdominal rigidity, rebound tenderness, and costovertebral tenderness were absent. There was no rash; the previously reported targetoid skin lesion was no longer present. The remainder of the exam was normal.
Laboratory evaluation showed a white count of 7900/mm3, hemoglobin 14.3 gm/dL with normocytic indices, and a platelet count of 175,000/mm3. Sodium was 130 mmol/L, potassium was 3.1 mmol/L, bicarbonate 26 mmol/L, blood urea nitrogen 15 mg/dL, creatinine 0.6 mg/dL, and glucose 92 mg/dL. Serum calcium, aspartate aminotransferase, alanine aminotransferase, bilirubin, and lipase were normal. A urine pregnancy test was negative. Urine analysis was negative for nitrites and leukocyte esterase. Abdominal and pelvic computed tomography (CT) scan with intravenous (IV) contrast performed 3 days prior at an outside ED revealed a 3.4 centimeter left ovarian cyst. A subsequent transvaginal ultrasound was negative for cyst torsion and confirmed appropriate placement of an intrauterine device.
The absence of abdominal rigidity and rebound tenderness does not exclude peritonitis. A normal white blood cell count also does not reliably exclude serious intraabdominal pathology. However, the CT scan argues strongly against many common causes of abdominal pain, including appendicitis, diverticulitis, perforated ulcer, intestinal obstruction, and malignancy, assuming the symptoms have not changed since it was performed.
The patient’s laboratory studies argue against biliary obstruction, pancreatitis, pregnancy, hypercalcemia, and ongoing urinary tract infection. Patients with functional gallbladder disorders may have normal laboratory and CT findings but typically have recurrent, biliary-colic-type pain. The low serum potassium, a high blood urea nitrogen to creatinine ratio, and a low serum sodium reflect her significant vomiting. The hyponatremia is consistent with the appropriate release of antidiuretic hormone (ADH) in the setting of volume depletion. She should receive isotonic fluids plus potassium in addition to symptomatic treatment of pain and nausea. Given the severity and duration of symptoms, an esophagogastroduodenoscopy (EGD) should be performed to exclude GI mucosal disease, including peptic ulcer disease and gastritis, which may not be evident on the CT scan.
Additional diagnoses should be considered at this point. This patient has exposure to chickens, ducks, rabbits, and ticks as well as reported chills and mild temperature elevation at home. Tularemia, which can be transmitted by tick bites or exposure to infected rabbits, can cause a prolonged illness. Some patients have abdominal pain, anorexia, nausea, and weight loss, although fever is usually more prominent. Tularemia is uncommon and most frequently seen in the south-central part of the United States but has been reported throughout the country. She should be queried regarding additional exposures, including well water to assess her risk for Campylobacter infection.
Opiate withdrawal can present with pain and vomiting, but she reports no opiate use and lacks other findings such pupillary dilation or piloerection. Given the prevalence of opiate abuse, however, a toxicology screen should be performed. Hypercalcemia and diabetic ketoacidosis as metabolic causes of abdominal pain have been ruled out by her laboratory values. If no other cause is identified, other metabolic etiologies like Addison disease, familial Mediterranean fever, or porphyria should be considered.
Cyclic vomiting syndrome should still be on the differential. It is a diagnosis of exclusion requiring a history of recurrent, stereotypical episodes, which should be explicitly explored.
The patient was admitted to a medical unit by the hospitalist service and received IV normal saline, parenteral potassium, and IV pantoprazole. She underwent an EGD that revealed minor erosions in the antrum of the stomach. Biopsies were obtained.
Seven hours after the endoscopy, the patient had a brief period of confusion followed by a generalized tonic-clonic seizure lasting 1 minute. A head CT without contrast was negative for any focal abnormality. Repeat laboratory evaluation revealed that serum sodium was 125 mmol/L, and serum glucose was 113 mg/dL. She was transferred to the progressive care unit and received IV levetiracetam.
The endoscopy excluded structural abnormalities of the stomach and duodenum. The patient now has an additional problem, seizure, which needs to be incorporated in the diagnostic reasoning.
Seizures can be caused by the rapid development of severe hyponatremia, with serum sodium levels usually less than 120 mmol/L. Seizures caused by hyponatremia are typically preceded by headache and lethargy, as the intracellular movement of excess water causes cerebral edema. Hyponatremia is unlikely to be the cause of her seizure but should nevertheless be evaluated with a urine sodium concentration and serum and urine osmolality. If she is euvolemic, the IV fluids should be stopped and her free water intake should be restricted to avoid worsening the hyponatremia, as it is potentially caused by the syndrome of inappropriate ADH (SIADH).
There are many other possible causes for new onset seizures in adults, including brain tumor, head trauma, alcohol withdrawal, medications, and central nervous system infection, including Lyme disease. Lyme serologies should be repeated.
In this patient, it is likely that the seizure is a manifestation of the same illness that is causing her vomiting and abdominal pain. Seizure is not a feature of cyclic vomiting syndrome in adults. It is also not a feature of tularemia, adrenal insufficiency, or opioid withdrawal.
Acute intermittent porphyria (AIP) can cause both abdominal and neurologic problems. Hyponatremia is common during acute attacks, caused by either the inappropriate release of ADH or the appropriate release of the hormone if there is fluid loss. AIP is a rare diagnosis but could explain the uncommon combination of abdominal pain, vomiting, seizure, and hyponatremia. A spot urine porphobilinogen test should be sent to assess for AIP.
Additional laboratory studies were sent. Serum osmolality was 269 mosm/kg with a corresponding urine osmolality of 699 mosm/kg. A random urine sodium was 145 mEq/L. Thyroid stimulating hormone and cosyntropin stimulating testing were normal. IgM and IgG antibodies to Borrelia burgdorferi were negative. Urine porphobilinogen was sent. An electroencephalogram did not reveal epileptiform discharges. Magnetic resonance imaging (MRI) of the brain was significant for T2/FLAIR hyperintensity in the cortex and subcortical white matter of the occipital lobes bilaterally. Hypertonic saline and fluid restriction were initiated.
The patient’s labs are consistent with SIADH. Excessive ADH release because of volume depletion and consequent hyponatremia should have improved rapidly with the administration of saline. The high urine sodium suggests that she is now volume replete, while the high urine osmolality is consistent with the presence of excessive ADH in the absence of appropriate stimuli. In the context of normal thyroid and adrenal function, the hyponatremia is likely due to the SIADH.
Negative serologic testing for Lyme disease, 3 months after the onset of rash, excludes this diagnosis.
The MRI findings are consistent with posterior reversible encephalopathy syndrome (PRES), a clinicoradiographic syndrome of headache, altered mental status, seizure, and/or vision loss with associated white matter abnormalities of the posterior cerebral hemispheres. PRES has been reported with AIP as well as other disorders, most commonly hypertensive encephalopathy, eclampsia, and immunosuppressive drug use.
The patient’s sodium improved with fluid restriction and the administration of hypertonic saline. There was no recurrence of seizure activity. Amlodipine was initiated for blood pressure readings as high as 156/106 mmHg. A hepatobiliary scan revealed a gallbladder ejection fraction of 13%. Biopsies from her endoscopy revealed nonspecific inflammation without the presence of Helicobacter pylori. The patient was discharged home 7 days after admission after stabilization of serum sodium, improvement in her abdominal pain, and tolerance of oral intake. A plan was made for outpatient cholecystectomy.
Many causes of abdominal pain have been excluded and the remaining diagnostic possibility, porphyria, is rare. The clinicians have revisited their differential and considered other causes of abdominal pain, including functional gallbladder disorders. However, chronic cholecystitis (or functional gallbladder disorder) is not this patient’s primary problem. The diffuse, severe, and constant abdominal pain prior to admission is not typical of biliary pain, and many medical conditions and drugs, including amlodipine, can lead to a positive hepatobiliary scan. Chronic cholecystitis would not explain her seizure.
AIP remains at the top of the differential for this young woman. A urine porphobilinogen has been sent and must be followed up prior to any further workup or surgery.
One week after discharge, the patient’s urine porphobilinogen resulted at 172.8 mCmol/ (upper limits of normal 8.8). Sequencing analysis for genes coding the enzymes involved in the synthetic pathway for heme were sent. Hydroxymethylbilane synthase, coproporphyrinogen oxidase, and protoporphyrinogen oxidase mutation assays were all normal. Despite the normal genetic assays, the diagnosis of AIP was made on the basis of the clinical presentation and elevated urine porphobilinogen. The patient was referred to a hematologist and initiated on oral glucose supplements and hematin infusions.
DISCUSSION
Although abdominal pain has a broad differential, the combination of abdominal pain and neurologic or psychiatric symptoms should suggest the possibility of porphyria, especially if symptoms are recurrent or unexplained. The porphyrias are a group of disorders caused by defects in the synthetic pathway of heme, leading to an overproduction and accumulation of precursors. Heme is a component of multiple proteins, including hemoglobin, myoglobin, and the cytochrome P450 enzymes. Although it is synthesized in all tissues, the bone marrow and liver are the organs most actively involved. The porphyrias can be classified according to the primary site of the overproduction and accumulation of heme precursors (liver vs bone marrow). Although there is overlap between the 2 groups, hepatic porphyrias often present with acute neurovisceral symptoms, while the erythropoietic porphyrias often cause cutaneous photosensitivity.1
AIP is the most common hepatic porphyria with a prevalence of 1 in 20,000 in Caucasians of Western European descent.1 AIP is caused by a defect in the gene that encodes porphobilinogen deaminase, leading to the accumulation of porphobilinogen.1 The cardinal manifestation is an acute porphyric attack. While the precise mechanisms underlying the symptoms are unknown, the accumulating metabolites may be directly neurotoxic.2 Attacks are precipitated by factors that induce heme synthesis, including caloric restriction, alcohol, and certain medications, particularly those that upregulate cyP450. The most commonly implicated drugs are anesthetics, antiepileptics, sulfonamides, rifampin, and estrogen and progesterone. Attacks can also be precipitated by changes in endogenous sex hormone levels, like the increase in progesterone seen in the luteal phase of the menstrual cycle, which may account for the higher incidence of symptomatic attacks in women.3
Acute attacks of AIP may have a wide variety of presentations; the disease was referred to as the “little imitator” in the early 20th century.4 The most common symptom is acute, severe abdominal pain, which may mimic an acute abdomen. Because the pain is neuropathic rather than inflammatory, abdominal tenderness, rebound, fever, and leukocytosis are usually absent, as they were in this patient. Abdominal pain is often accompanied by neuropsychiatric symptoms, including sensory and motor neuropathy, anxiety, hallucinations, delirium, and altered level of consciousness. Seizure occurs in 20% of cases. Involvement of the autonomic nervous system causes tachycardia and new onset hypertension in the majority of patients as well as restlessness and tremor. Hyponatremia, mediated by the syndrome of inappropriate ADH secretion, occurs in nearly a third of patients.5,6 MRI findings consistent with PRES have also been described in AIP.7
The diagnosis of AIP is often delayed; diagnosis later in the disease course is associated with a poorer prognosis.8 Reported intervals between presentation and diagnosis range from several months to as long as 20 years.9 Associating the use of medications, caloric restriction, or the menstrual cycle with the exacerbation of symptoms or darkening of urine can help prompt an earlier diagnosis.6
AIP can be diagnosed by detecting a greater than 5-fold elevation of urinary porphobilinogen excretion in conjunction with the typical symptoms of an acute attack.5 Renal dysfunction causes urinary excretion of PBG to fall and serum levels to rise.10 Serum PBG levels should therefore be sent when AIP is suspected in the setting of renal dysfunction. The primary role of genetic testing in a patient who has AIP confirmed clinically and biochemically is to assist in genetic counseling and to identify asymptomatic family members.11 Genetic testing is not required to confirm the diagnosis and does not help prognosticate. It is unusual that a mutation was not detected in this case, as the current sensitivity of genetic testing is 97% to 100%.11
There are 4 principles of management of an acute porphyric attack. First, any precipitating factors such as medications should be stopped. Second, abdominal pain should be treated appropriately with opioids, if necessary. Third, if autonomic dysfunction is present, beta-blockers or clonidine should be given to treat hypertension.5 Finally, glucose and/or hemin should be administered to downregulate aminolevulinic acid (ALA) synthase by negative feedback. Downregulation of ALA synthase decreases the accumulation of the neurotoxic porphyrin precursors ALA and PBG.5 For patients with mild symptoms, glucose alone (300-500 g/d) may be enough to abort the attack.12 This can be achieved via a high-carbohydrate diet in those able to tolerate oral intake or via continuous infusions of dextrose containing fluids.5 For more severe attacks with associated polyneuropathy, respiratory muscle weakness, or seizures, or for attacks that are not resolving, heme preparations dosed at 3 to 4 mg/kg/d for 3 to 4 days are indicated.5
The recent diagnosis of acute Lyme disease was a distractor in this presentation. In Lyme endemic areas, patients with erythema migrans are treated based on the clinical presentation rather than serologic testing.13 Although this patient took only 1 week of doxycycline, testing during this hospitalization showed that she had either been cured early or had not had Lyme disease in the first place. There is no known association between Lyme disease and the porphyrias, and doxycycline is not a common precipitant of AIP attacks.14 However, the GI side effects of doxycycline may have decreased caloric intake and ultimately provoked the patient’s first attack of AIP. The clinicians in this case appropriately avoided the “target” but hit the mark by correctly diagnosing AIP.
KEY POINTS
- Consider AIP in patients with unexplained abdominal pain, especially when accompanied by neuropsychiatric symptoms and autonomic lability.
- Diagnose AIP by sending a urine PBG during a suspected acute attack.
- Treat AIP acutely by removing precipitants, treating abdominal pain, and initiating dextrose-containing fluids and hemin infusions to downregulate ALA synthase.
Acknowledgments
The authors thank the patient who enthusiastically supported the writing of this report.
Disclosure
Warren Gavin, MD has disclosed participation in expert testimony. The authors have no financial or other conflicts of interest to disclose.
1. Desnick RJ, Balwani M. The Porphyrias. In: Kasper D, Fauci A, Hauser S, Longo D, Jameson J, Loscalzo J, eds. Harrison’s Principles of Internal Medicine, 19th Edition. New York: McGraw-Hill; 2015. http://accessmedicine.mhmedical.com.proxy.medlib.uits.iu.edu/content.aspx?bookid=1130&Sectionid=79754263. Accessed June 14, 2016.
2. Bissell DM, Lai JC, Meister RK, Blanc PD. Role of Delta-aminolevulinic Acid in the Symptoms of Acute Porphyria. Am J Med. 2015;128(3):313-317. PubMed
3. Bonkovsky HL, Guo JT, Hou W, Li T, Narang T, Thapar M. Porphyrin and Heme Metabolism and the Porphyrias. Compr Physiol. 2013;3(1):365-401. PubMed
4. Crimlisk HL. The little imitator--porphyria: a neuropsychiatric disorder. J Neurol Neurosurg Psychiatry. 1997;62(4):319-328. PubMed
5. Pischik E, Kauppinen R. An update of clinical management of acute intermittent porphyria. Appl Clin Genet. 2015;8:201-214. PubMed
6. Ventura P, Cappellini MD, Biolcati G, Guida CC, Rocchi E; Gruppo Italiano Porfiria (GrIP). A challenging diagnosis for potential fatal diseases: recommendations for diagnosing acute porphyrias. Eur J Intern Med. 2014;25(6):497-505. PubMed
7. Dagens A, Gilhooley MJ. Acute intermittent porphyria leading to posterior reversible encephalopathy syndrome (PRES): a rare cause of abdominal pain and seizures. BMJ Case Rep. 2016:bcr2016215350. PubMed
8. Pischik E, Bulyanitsa A, Kazakov V, Kauppinen R. Clinical features predictive of a poor prognosis in acute porphyria. J Neurol. 2004;251(12):1538-1541. PubMed
9. Sack GH. Acute intermittent porphyria. JAMA. 1990;264(10):1290-1293. PubMed
10. Sardh E, Andersson DEH, Henrichson A, Harper P. Porphyrin precursors and porphyrins in three patients with acute intermittent porphyria and end-stage renal disease under different therapy regimes. Cell Mol Biol (Noisy-le-grand). 2009;55(1):66-71. PubMed
11. Whatley SD, Badminton MN. Role of genetic testing in the management of patients with inherited porphyria and their families. Ann Clin Biochem. 2013;50(3):204-216. PubMed
12. Anderson KE, Bloomer JR, Bonkovsky HL, et al. Recommendations for the diagnosis and treatment of the acute porphyrias. Ann Intern Med. 2005;142(6):439-450. PubMed
13. Wormser GP, Dattwyler RJ, Shapiro ED, et al. The clinical assessment, treatment, and prevention of lyme disease, human granulocytic anaplasmosis, and babesiosis: clinical practice guidelines by the Infectious Diseases Society of America. Clin Infect Dis. 2006;43(9):1089-1134. PubMed
14. American Porphyria Foundation. Drug database. http://www.porphyriafoundation.com/drug-database. Accessed July 21, 2017.
© 2018 Society of Hospital Medicine
Hospitalist and Internal Medicine Leaders’ Perspectives of Early Discharge Challenges at Academic Medical Centers
The discharge process is a critical bottleneck for efficient patient flow through the hospital. Delayed discharges translate into delays in admissions and other patient transitions, often leading to excess costs, patient dissatisfaction, and even patient harm.1-3 The emergency department is particularly impacted by these delays; bottlenecks there lead to overcrowding, increased overall hospital length of stay, and increased risks for bad outcomes during hospitalization.2
Academic medical centers in particular may struggle with delayed discharges. In a typical teaching hospital, a team composed of an attending physician and housestaff share responsibility for determining the discharge plan. Additionally, clinical teaching activities may affect the process and quality of discharge.4-6
The prevalence and causes of delayed discharges vary greatly.7-9 To improve efficiency around discharge, many hospitals have launched initiatives designed to discharge patients earlier in the day, including goal setting (“discharge by noon”), scheduling discharge appointments, and using quality-improvement methods, such as Lean Methodology (LEAN), to remove inefficiencies within discharge processes.10-12 However, there are few data on the prevalence and effectiveness of different strategies.
The aim of this study was to survey academic hospitalist and general internal medicine physician leaders to elicit their perspectives on the factors contributing to discharge timing and the relative importance and effectiveness of early-discharge initiatives.
METHODS
Study Design, Participants, and Oversight
We obtained a list of 115 university-affiliated hospitals associated with a residency program and, in most cases, a medical school from Vizient Inc. (formerly University HealthSystem Consortium), an alliance of academic medical centers and affiliated hospitals. Each member institution submits clinical data to allow for the benchmarking of outcomes to drive transparency and quality improvement.13 More than 95% of the nation’s academic medical centers and affiliated hospitals participate in this collaborative. Vizient works with members but does not set nor promote quality metrics, such as discharge timeliness. E-mail addresses for hospital medicine physician leaders (eg, division chief) of major academic medical centers were obtained from each institution via publicly available data (eg, the institution’s website). When an institution did not have a hospital medicine section, we identified the division chief of general internal medicine. The University of California, San Francisco Institutional Review Board approved this study.
Survey Development and Domains
We developed a 30-item survey to evaluate 5 main domains of interest: current discharge practices, degree of prioritization of early discharge on the inpatient service, barriers to timely discharge, prevalence and perceived effectiveness of implemented early-discharge initiatives, and barriers to implementation of early-discharge initiatives.
Respondents were first asked to identify their institutions’ goals for discharge time. They were then asked to compare the priority of early-discharge initiatives to other departmental quality-improvement initiatives, such as reducing 30-day readmissions, improving interpreter use, and improving patient satisfaction. Next, respondents were asked to estimate the degree to which clinical or patient factors contributed to delays in discharge. Respondents were then asked whether specific early-discharge initiatives, such as changes to rounding practices or communication interventions, were implemented at their institutions and, if so, the perceived effectiveness of these initiatives at meeting discharge targets. We piloted the questions locally with physicians and researchers prior to finalizing the survey.
Data Collection
We sent surveys via an online platform (Research Electronic Data Capture).14 Nonresponders were sent 2 e-mail reminders and then a follow-up telephone call asking them to complete the survey. Only 1 survey per academic medical center was collected. Any respondent who completed the survey within 2 weeks of receiving it was entered to win a Kindle Fire.
Data Analysis
We summarized survey responses using descriptive statistics. Analysis was completed in IBM SPSS version 22 (Armonk, NY).
RESULTS
Survey Respondent and Institutional Characteristics
Of the 115 institutions surveyed, we received 61 responses (response rate of 53%), with 39 (64%) respondents from divisions of hospital medicine and 22 (36%) from divisions of general internal medicine. A majority (n = 53; 87%) stated their medicine services have a combination of teaching (with residents) and nonteaching (without residents) teams. Thirty-nine (64%) reported having daily multidisciplinary rounds.
Early Discharge as a Priority
Forty-seven (77%) institutional representatives strongly agreed or agreed that early discharge was a priority, with discharge by noon being the most common target time (n = 23; 38%). Thirty (50%) respondents rated early discharge as more important than improving interpreter use for non-English-speaking patients and equally important as reducing 30-day readmissions (n = 29; 48%) and improving patient satisfaction (n = 27; 44%).
Factors Delaying Discharge
The most common factors perceived as delaying discharge were considered external to the hospital, such as postacute care bed availability or scheduled (eg, ambulance) transport delays (n = 48; 79%), followed by patient factors such as patient transport issues (n = 44; 72%). Less commonly reported were workflow issues, such as competing primary team priorities or case manager bandwidth (n = 38; 62%; Table 1).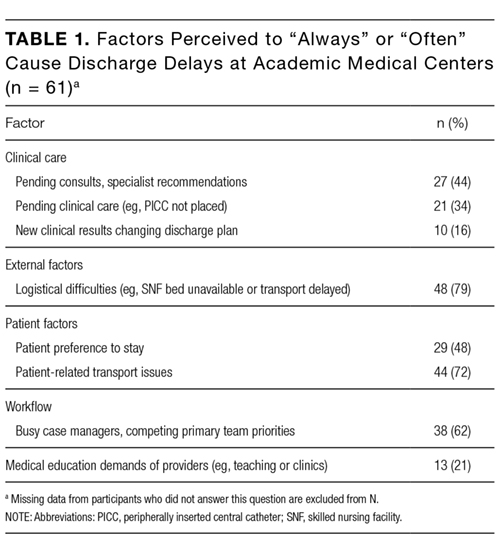
Initiatives to Improve Discharge
The most commonly implemented initiatives perceived as effective at improving discharge times were the preemptive identification of early discharges to plan discharge paperwork (n = 34; 56%), communication with patients about anticipated discharge time on the day prior to discharge (n = 29; 48%), and the implementation of additional rounds between physician teams and case managers specifically around discharge planning (n = 28; 46%). Initiatives not commonly implemented included regular audit of and feedback on discharge times to providers and teams (n = 21; 34%), the use of a discharge readiness checklist (n = 26; 43%), incentives such as bonuses or penalties (n = 37; 61%), the use of a whiteboard to indicate discharge times (n = 23; 38%), and dedicated quality-improvement approaches such as LEAN (n = 37; 61%; Table 2).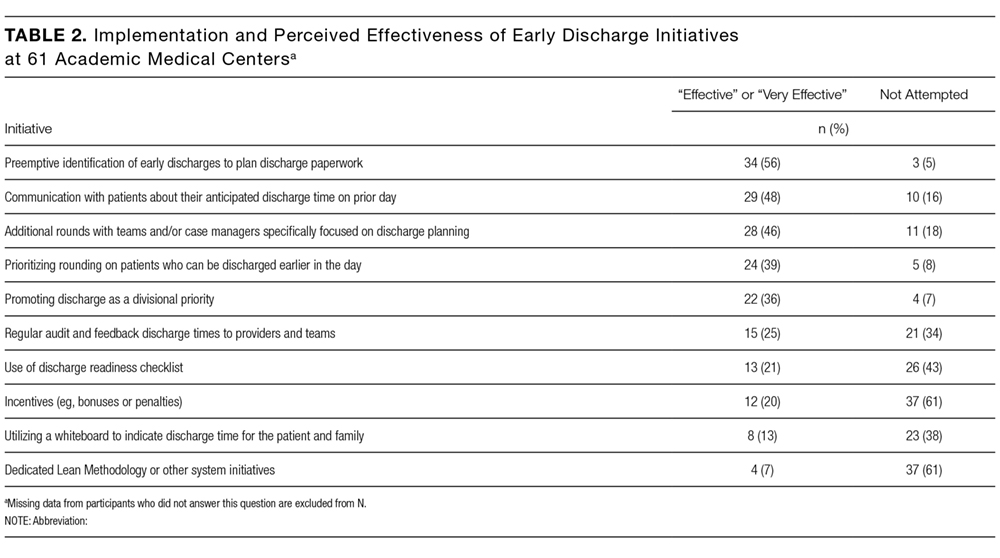
DISCUSSION
Our study suggests early discharge for medicine patients is a priority among academic institutions. Hospitalist and general internal medicine physician leaders in our study generally attributed delayed discharges to external factors, particularly unavailability of postacute care facilities and transportation delays. Having issues with finding postacute care placements is consistent with previous findings by Selker et al.15 and Carey et al.8 This is despite the 20-year difference between Selker et al.’s study and the current study, reflecting a continued opportunity for improvement, including stronger partnerships with local and regional postacute care facilities to expedite care transition and stronger discharge-planning efforts early in the admission process. Efforts in postacute care placement may be particularly important for Medicaid-insured and uninsured patients.
Our responders, hospitalist and internal medicine physician leaders, did not perceive the additional responsibilities of teaching and supervising trainees to be factors that significantly delayed patient discharge. This is in contrast to previous studies, which attributed delays in discharge to prolonged clinical decision-making related to teaching and supervision.4-6,8 This discrepancy may be due to the fact that we only surveyed single physician leaders at each institution and not residents. Our finding warrants further investigation to understand the degree to which resident skills may impact discharge planning and processes.
Institutions represented in our study have attempted a variety of initiatives promoting earlier discharge, with varying levels of perceived success. Initiatives perceived to be the most effective by hospital leaders centered on 2 main areas: (1) changing individual provider practice and (2) anticipatory discharge preparation. Interestingly, this is in discordance with the main factors labeled as causing delays in discharges, such as obtaining postacute care beds, busy case managers, and competing demands on primary teams. We hypothesize this may be because such changes require organization- or system-level changes and are perceived as more arduous than changes at the individual level. In addition, changes to individual provider behavior may be more cost- and time-effective than more systemic initiatives.
Our findings are consistent with the work published by Wertheimer and colleagues,11 who show that additional afternoon interdisciplinary rounds can help identify patients who may be discharged before noon the next day. In their study, identifying such patients in advance improved the overall early-discharge rate the following day.
Our findings should be interpreted in light of several limitations. Our survey only considers the perspectives of hospitalist and general internal medicine physician leaders at academic medical centers that are part of the Vizient Inc. collaborative. They do not represent all academic or community-based medical centers. Although the perceived effectiveness of some initiatives was high, we did not collect empirical data to support these claims or to determine which initiative had the greatest relative impact on discharge timeliness. Lastly, we did not obtain resident, nursing, or case manager perspectives on discharge practices. Given their roles as frontline providers, we may have missed these alternative perspectives.
Our study shows there is a strong interest in increasing early discharges in an effort to improve hospital throughput and patient flow.
Acknowledgments
The authors thank all participants who completed the survey and Danielle Carrier at Vizient Inc. (formally University HealthSystem Consortium) for her assistance in obtaining data.
Disclosures
Hemali Patel, Margaret Fang, Michelle Mourad, Adrienne Green, Ryan Murphy, and James Harrison report no conflicts of interest. At the time the research was conducted, Robert Wachter reported that he is a member of the Lucian Leape Institute at the National Patient Safety Foundation (no compensation except travel expenses); recently chaired an advisory board to England’s National Health Service (NHS) reviewing the NHS’s digital health strategy (no compensation except travel expenses); has a contract with UCSF from the Agency for Healthcare Research and Quality to edit a patient-safety website; receives compensation from John Wiley & Sons for writing a blog; receives royalties from Lippincott Williams & Wilkins and McGraw-Hill Education for writing and/or editing several books; receives stock options for serving on the board of Acuity Medical Management Systems; receives a yearly stipend for serving on the board of The Doctors Company; serves on the scientific advisory boards for amino.com, PatientSafe Solutions Inc., Twine, and EarlySense (for which he receives stock options); has a small royalty stake in CareWeb, a hospital communication tool developed at UCSF; and holds the Marc and Lynne Benioff Endowed Chair in Hospital Medicine and the Holly Smith Distinguished Professorship in Science and Medicine at UCSF.
1. Khanna S, Boyle J, Good N, Lind J. Impact of admission and discharge peak times on hospital overcrowding. Stud Health Technol Inform. 2011;168:82-88. PubMed
2. White BA, Biddinger PD, Chang Y, Grabowski B, Carignan S, Brown DFM. Boarding Inpatients in the Emergency Department Increases Discharged Patient Length of Stay. J Emerg Med. 2013;44(1):230-235. doi:10.1016/j.jemermed.2012.05.007. PubMed
3. Derlet RW, Richards JR. Overcrowding in the nation’s emergency departments: complex causes and disturbing effects. Ann Emerg Med. 2000;35(1):63-68. PubMed
4. da Silva SA, Valácio RA, Botelho FC, Amaral CFS. Reasons for discharge delays in teaching hospitals. Rev Saúde Pública. 2014;48(2):314-321. doi:10.1590/S0034-8910.2014048004971. PubMed
5. Greysen SR, Schiliro D, Horwitz LI, Curry L, Bradley EH. “Out of Sight, Out of Mind”: Housestaff Perceptions of Quality-Limiting Factors in Discharge Care at Teaching Hospitals. J Hosp Med Off Publ Soc Hosp Med. 2012;7(5):376-381. doi:10.1002/jhm.1928. PubMed
6. Goldman J, Reeves S, Wu R, Silver I, MacMillan K, Kitto S. Medical Residents and Interprofessional Interactions in Discharge: An Ethnographic Exploration of Factors That Affect Negotiation. J Gen Intern Med. 2015;30(10):1454-1460. doi:10.1007/s11606-015-3306-6. PubMed
7. Okoniewska B, Santana MJ, Groshaus H, et al. Barriers to discharge in an acute care medical teaching unit: a qualitative analysis of health providers’ perceptions. J Multidiscip Healthc. 2015;8:83-89. doi:10.2147/JMDH.S72633. PubMed
8. Carey MR, Sheth H, Scott Braithwaite R. A Prospective Study of Reasons for Prolonged Hospitalizations on a General Medicine Teaching Service. J Gen Intern Med. 2005;20(2):108-115. doi:10.1111/j.1525-1497.2005.40269.x. PubMed
9. Kim CS, Hart AL, Paretti RF, et al. Excess Hospitalization Days in an Academic Medical Center: Perceptions of Hospitalists and Discharge Planners. Am J Manag Care. 2011;17(2):e34-e42. http://www.ajmc.com/journals/issue/2011/2011-2-vol17-n2/AJMC_11feb_Kim_WebX_e34to42/. Accessed on October 26, 2016.
10. Gershengorn HB, Kocher R, Factor P. Management Strategies to Effect Change in Intensive Care Units: Lessons from the World of Business. Part II. Quality-Improvement Strategies. Ann Am Thorac Soc. 2014;11(3):444-453. doi:10.1513/AnnalsATS.201311-392AS. PubMed
11. Wertheimer B, Jacobs REA, Bailey M, et al. Discharge before noon: An achievable hospital goal. J Hosp Med. 2014;9(4):210-214. doi:10.1002/jhm.2154. PubMed
12. Manning DM, Tammel KJ, Blegen RN, et al. In-room display of day and time patient is anticipated to leave hospital: a “discharge appointment.” J Hosp Med. 2007;2(1):13-16. doi:10.1002/jhm.146. PubMed
13. Networks for academic medical centers. https://www.vizientinc.com/Our-networks/Networks-for-academic-medical-centers. Accessed on July 13, 2017.
14. Harris PA, Taylor R, Thielke R, Payne J, Gonzalez N, Conde JG. Research Electronic Data Capture (REDCap) - A metadata-driven methodology and workflow process for providing translational research informatics support. J Biomed Inform. 2009;42(2):377-381. doi:10.1016/j.jbi.2008.08.010. PubMed
15. Selker HP, Beshansky JR, Pauker SG, Kassirer JP. The epidemiology of delays in a teaching hospital. The development and use of a tool that detects unnecessary hospital days. Med Care. 1989;27(2):112-129. PubMed
The discharge process is a critical bottleneck for efficient patient flow through the hospital. Delayed discharges translate into delays in admissions and other patient transitions, often leading to excess costs, patient dissatisfaction, and even patient harm.1-3 The emergency department is particularly impacted by these delays; bottlenecks there lead to overcrowding, increased overall hospital length of stay, and increased risks for bad outcomes during hospitalization.2
Academic medical centers in particular may struggle with delayed discharges. In a typical teaching hospital, a team composed of an attending physician and housestaff share responsibility for determining the discharge plan. Additionally, clinical teaching activities may affect the process and quality of discharge.4-6
The prevalence and causes of delayed discharges vary greatly.7-9 To improve efficiency around discharge, many hospitals have launched initiatives designed to discharge patients earlier in the day, including goal setting (“discharge by noon”), scheduling discharge appointments, and using quality-improvement methods, such as Lean Methodology (LEAN), to remove inefficiencies within discharge processes.10-12 However, there are few data on the prevalence and effectiveness of different strategies.
The aim of this study was to survey academic hospitalist and general internal medicine physician leaders to elicit their perspectives on the factors contributing to discharge timing and the relative importance and effectiveness of early-discharge initiatives.
METHODS
Study Design, Participants, and Oversight
We obtained a list of 115 university-affiliated hospitals associated with a residency program and, in most cases, a medical school from Vizient Inc. (formerly University HealthSystem Consortium), an alliance of academic medical centers and affiliated hospitals. Each member institution submits clinical data to allow for the benchmarking of outcomes to drive transparency and quality improvement.13 More than 95% of the nation’s academic medical centers and affiliated hospitals participate in this collaborative. Vizient works with members but does not set nor promote quality metrics, such as discharge timeliness. E-mail addresses for hospital medicine physician leaders (eg, division chief) of major academic medical centers were obtained from each institution via publicly available data (eg, the institution’s website). When an institution did not have a hospital medicine section, we identified the division chief of general internal medicine. The University of California, San Francisco Institutional Review Board approved this study.
Survey Development and Domains
We developed a 30-item survey to evaluate 5 main domains of interest: current discharge practices, degree of prioritization of early discharge on the inpatient service, barriers to timely discharge, prevalence and perceived effectiveness of implemented early-discharge initiatives, and barriers to implementation of early-discharge initiatives.
Respondents were first asked to identify their institutions’ goals for discharge time. They were then asked to compare the priority of early-discharge initiatives to other departmental quality-improvement initiatives, such as reducing 30-day readmissions, improving interpreter use, and improving patient satisfaction. Next, respondents were asked to estimate the degree to which clinical or patient factors contributed to delays in discharge. Respondents were then asked whether specific early-discharge initiatives, such as changes to rounding practices or communication interventions, were implemented at their institutions and, if so, the perceived effectiveness of these initiatives at meeting discharge targets. We piloted the questions locally with physicians and researchers prior to finalizing the survey.
Data Collection
We sent surveys via an online platform (Research Electronic Data Capture).14 Nonresponders were sent 2 e-mail reminders and then a follow-up telephone call asking them to complete the survey. Only 1 survey per academic medical center was collected. Any respondent who completed the survey within 2 weeks of receiving it was entered to win a Kindle Fire.
Data Analysis
We summarized survey responses using descriptive statistics. Analysis was completed in IBM SPSS version 22 (Armonk, NY).
RESULTS
Survey Respondent and Institutional Characteristics
Of the 115 institutions surveyed, we received 61 responses (response rate of 53%), with 39 (64%) respondents from divisions of hospital medicine and 22 (36%) from divisions of general internal medicine. A majority (n = 53; 87%) stated their medicine services have a combination of teaching (with residents) and nonteaching (without residents) teams. Thirty-nine (64%) reported having daily multidisciplinary rounds.
Early Discharge as a Priority
Forty-seven (77%) institutional representatives strongly agreed or agreed that early discharge was a priority, with discharge by noon being the most common target time (n = 23; 38%). Thirty (50%) respondents rated early discharge as more important than improving interpreter use for non-English-speaking patients and equally important as reducing 30-day readmissions (n = 29; 48%) and improving patient satisfaction (n = 27; 44%).
Factors Delaying Discharge
The most common factors perceived as delaying discharge were considered external to the hospital, such as postacute care bed availability or scheduled (eg, ambulance) transport delays (n = 48; 79%), followed by patient factors such as patient transport issues (n = 44; 72%). Less commonly reported were workflow issues, such as competing primary team priorities or case manager bandwidth (n = 38; 62%; Table 1).
Initiatives to Improve Discharge
The most commonly implemented initiatives perceived as effective at improving discharge times were the preemptive identification of early discharges to plan discharge paperwork (n = 34; 56%), communication with patients about anticipated discharge time on the day prior to discharge (n = 29; 48%), and the implementation of additional rounds between physician teams and case managers specifically around discharge planning (n = 28; 46%). Initiatives not commonly implemented included regular audit of and feedback on discharge times to providers and teams (n = 21; 34%), the use of a discharge readiness checklist (n = 26; 43%), incentives such as bonuses or penalties (n = 37; 61%), the use of a whiteboard to indicate discharge times (n = 23; 38%), and dedicated quality-improvement approaches such as LEAN (n = 37; 61%; Table 2).
DISCUSSION
Our study suggests early discharge for medicine patients is a priority among academic institutions. Hospitalist and general internal medicine physician leaders in our study generally attributed delayed discharges to external factors, particularly unavailability of postacute care facilities and transportation delays. Having issues with finding postacute care placements is consistent with previous findings by Selker et al.15 and Carey et al.8 This is despite the 20-year difference between Selker et al.’s study and the current study, reflecting a continued opportunity for improvement, including stronger partnerships with local and regional postacute care facilities to expedite care transition and stronger discharge-planning efforts early in the admission process. Efforts in postacute care placement may be particularly important for Medicaid-insured and uninsured patients.
Our responders, hospitalist and internal medicine physician leaders, did not perceive the additional responsibilities of teaching and supervising trainees to be factors that significantly delayed patient discharge. This is in contrast to previous studies, which attributed delays in discharge to prolonged clinical decision-making related to teaching and supervision.4-6,8 This discrepancy may be due to the fact that we only surveyed single physician leaders at each institution and not residents. Our finding warrants further investigation to understand the degree to which resident skills may impact discharge planning and processes.
Institutions represented in our study have attempted a variety of initiatives promoting earlier discharge, with varying levels of perceived success. Initiatives perceived to be the most effective by hospital leaders centered on 2 main areas: (1) changing individual provider practice and (2) anticipatory discharge preparation. Interestingly, this is in discordance with the main factors labeled as causing delays in discharges, such as obtaining postacute care beds, busy case managers, and competing demands on primary teams. We hypothesize this may be because such changes require organization- or system-level changes and are perceived as more arduous than changes at the individual level. In addition, changes to individual provider behavior may be more cost- and time-effective than more systemic initiatives.
Our findings are consistent with the work published by Wertheimer and colleagues,11 who show that additional afternoon interdisciplinary rounds can help identify patients who may be discharged before noon the next day. In their study, identifying such patients in advance improved the overall early-discharge rate the following day.
Our findings should be interpreted in light of several limitations. Our survey only considers the perspectives of hospitalist and general internal medicine physician leaders at academic medical centers that are part of the Vizient Inc. collaborative. They do not represent all academic or community-based medical centers. Although the perceived effectiveness of some initiatives was high, we did not collect empirical data to support these claims or to determine which initiative had the greatest relative impact on discharge timeliness. Lastly, we did not obtain resident, nursing, or case manager perspectives on discharge practices. Given their roles as frontline providers, we may have missed these alternative perspectives.
Our study shows there is a strong interest in increasing early discharges in an effort to improve hospital throughput and patient flow.
Acknowledgments
The authors thank all participants who completed the survey and Danielle Carrier at Vizient Inc. (formally University HealthSystem Consortium) for her assistance in obtaining data.
Disclosures
Hemali Patel, Margaret Fang, Michelle Mourad, Adrienne Green, Ryan Murphy, and James Harrison report no conflicts of interest. At the time the research was conducted, Robert Wachter reported that he is a member of the Lucian Leape Institute at the National Patient Safety Foundation (no compensation except travel expenses); recently chaired an advisory board to England’s National Health Service (NHS) reviewing the NHS’s digital health strategy (no compensation except travel expenses); has a contract with UCSF from the Agency for Healthcare Research and Quality to edit a patient-safety website; receives compensation from John Wiley & Sons for writing a blog; receives royalties from Lippincott Williams & Wilkins and McGraw-Hill Education for writing and/or editing several books; receives stock options for serving on the board of Acuity Medical Management Systems; receives a yearly stipend for serving on the board of The Doctors Company; serves on the scientific advisory boards for amino.com, PatientSafe Solutions Inc., Twine, and EarlySense (for which he receives stock options); has a small royalty stake in CareWeb, a hospital communication tool developed at UCSF; and holds the Marc and Lynne Benioff Endowed Chair in Hospital Medicine and the Holly Smith Distinguished Professorship in Science and Medicine at UCSF.
1. Khanna S, Boyle J, Good N, Lind J. Impact of admission and discharge peak times on hospital overcrowding. Stud Health Technol Inform. 2011;168:82-88. PubMed
2. White BA, Biddinger PD, Chang Y, Grabowski B, Carignan S, Brown DFM. Boarding Inpatients in the Emergency Department Increases Discharged Patient Length of Stay. J Emerg Med. 2013;44(1):230-235. doi:10.1016/j.jemermed.2012.05.007. PubMed
3. Derlet RW, Richards JR. Overcrowding in the nation’s emergency departments: complex causes and disturbing effects. Ann Emerg Med. 2000;35(1):63-68. PubMed
4. da Silva SA, Valácio RA, Botelho FC, Amaral CFS. Reasons for discharge delays in teaching hospitals. Rev Saúde Pública. 2014;48(2):314-321. doi:10.1590/S0034-8910.2014048004971. PubMed
5. Greysen SR, Schiliro D, Horwitz LI, Curry L, Bradley EH. “Out of Sight, Out of Mind”: Housestaff Perceptions of Quality-Limiting Factors in Discharge Care at Teaching Hospitals. J Hosp Med Off Publ Soc Hosp Med. 2012;7(5):376-381. doi:10.1002/jhm.1928. PubMed
6. Goldman J, Reeves S, Wu R, Silver I, MacMillan K, Kitto S. Medical Residents and Interprofessional Interactions in Discharge: An Ethnographic Exploration of Factors That Affect Negotiation. J Gen Intern Med. 2015;30(10):1454-1460. doi:10.1007/s11606-015-3306-6. PubMed
7. Okoniewska B, Santana MJ, Groshaus H, et al. Barriers to discharge in an acute care medical teaching unit: a qualitative analysis of health providers’ perceptions. J Multidiscip Healthc. 2015;8:83-89. doi:10.2147/JMDH.S72633. PubMed
8. Carey MR, Sheth H, Scott Braithwaite R. A Prospective Study of Reasons for Prolonged Hospitalizations on a General Medicine Teaching Service. J Gen Intern Med. 2005;20(2):108-115. doi:10.1111/j.1525-1497.2005.40269.x. PubMed
9. Kim CS, Hart AL, Paretti RF, et al. Excess Hospitalization Days in an Academic Medical Center: Perceptions of Hospitalists and Discharge Planners. Am J Manag Care. 2011;17(2):e34-e42. http://www.ajmc.com/journals/issue/2011/2011-2-vol17-n2/AJMC_11feb_Kim_WebX_e34to42/. Accessed on October 26, 2016.
10. Gershengorn HB, Kocher R, Factor P. Management Strategies to Effect Change in Intensive Care Units: Lessons from the World of Business. Part II. Quality-Improvement Strategies. Ann Am Thorac Soc. 2014;11(3):444-453. doi:10.1513/AnnalsATS.201311-392AS. PubMed
11. Wertheimer B, Jacobs REA, Bailey M, et al. Discharge before noon: An achievable hospital goal. J Hosp Med. 2014;9(4):210-214. doi:10.1002/jhm.2154. PubMed
12. Manning DM, Tammel KJ, Blegen RN, et al. In-room display of day and time patient is anticipated to leave hospital: a “discharge appointment.” J Hosp Med. 2007;2(1):13-16. doi:10.1002/jhm.146. PubMed
13. Networks for academic medical centers. https://www.vizientinc.com/Our-networks/Networks-for-academic-medical-centers. Accessed on July 13, 2017.
14. Harris PA, Taylor R, Thielke R, Payne J, Gonzalez N, Conde JG. Research Electronic Data Capture (REDCap) - A metadata-driven methodology and workflow process for providing translational research informatics support. J Biomed Inform. 2009;42(2):377-381. doi:10.1016/j.jbi.2008.08.010. PubMed
15. Selker HP, Beshansky JR, Pauker SG, Kassirer JP. The epidemiology of delays in a teaching hospital. The development and use of a tool that detects unnecessary hospital days. Med Care. 1989;27(2):112-129. PubMed
© 2017 Society of Hospital Medicine
The Association of Frailty with Discharge Disposition for Hospitalized Community Dwelling Elderly Patients
Frailty is a common geriatric syndrome characterized by decreased physiological reserves leading to increased vulnerability to stressors.1 Frail individuals are at increased risk of adverse health outcomes including falls, disability, hospitalization, and mortality.1 Discharge to skilled nursing facilities (SNFs) is also associated with adverse outcomes,2,3 but limited data exist on the utility of frailty in predicting discharge location in medical elders. We aimed to evaluate the association of frailty assessed by the Reported Edmonton Frailty Scale (REFS) with discharge disposition in hospitalized medical patients who were previously living in the community.
METHODS
We conducted a prospective study of community dwelling elders (≥65 years) hospitalized to the medical service from January 2014 to April 2016. Trained research assistants interviewed patients and/or caregivers on hospital day 1; the REFS was used to screen for frailty and the Mini-Cog assessment for cognitive impairment (supplementary Appendixes 1 and 2). The primary outcome was discharge disposition categorized as discharge to home (with or without home health services) or discharge to a postacute care (PAC) facility (SNF or inpatient rehabilitation). Multivariable Poisson regression analysis was used to estimate the relative risk of discharge to a PAC facility. Frailty was grouped into the following 3 categories: (1) not frail, (2) apparently vulnerable/mildly frail, and (3) moderately/severely frail.
RESULTS
Among the 775 patients screened, 272 declined to participate, were non-English speakers, were transferred from another facility, were admitted under observation status, had advanced dementia, or died during hospitalization. Five hundred and three medical patients were included: median age was 80 years (interquartile range 75-86 years); 54.1% were female and 82.9% were white. The most common comorbidities were hypertension (51.7%), diabetes (26.0%), and renal failure (26.0%). Of the included patients, 11.1% had a known diagnosis of dementia and 52.1% screened positive for cognitive impairment (Table).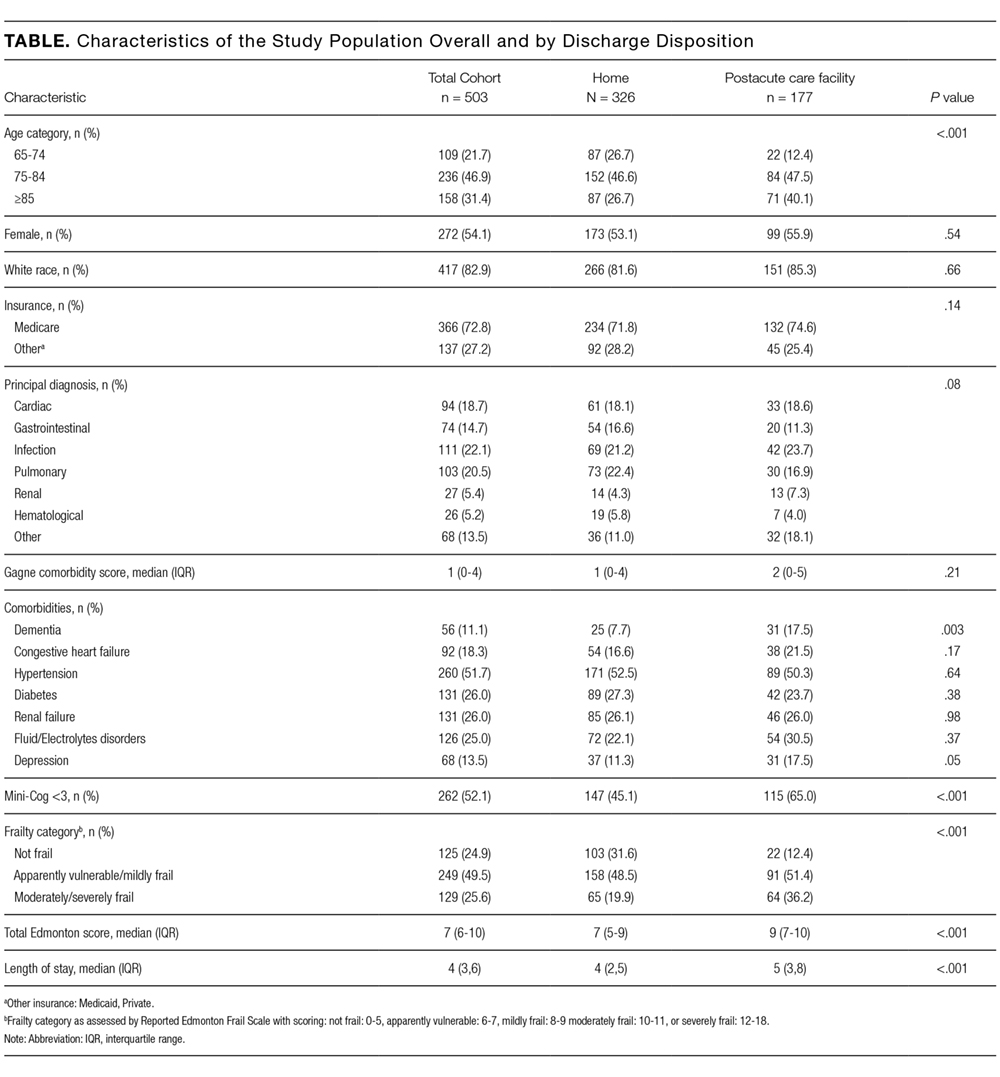
Overall, 24.9% were not frail, 49.5% were apparently vulnerable/mildly frail, and 25.6% were moderately/severely frail. About two-thirds (64.8%) returned home (40.0% with home healthcare) and 35% were discharged to a PAC facility (97.1% of them to SNF). Compared with patients who were discharged home, those discharged to a PAC facility were older (≥85 years; 26.7% vs 40.1%) and more likely to have dementia (7.7% vs 17.5%) and be frail (apparently vulnerable/mild frailty = 48.5% vs 51.4%%, moderate/severe frailty = 19.9% vs 36.2%; P < .001). Median length of hospital stay was shorter in those returning home (4 vs 5 days, P < .001).
In the multivariate analysis, which was adjusted for demographics, comorbidities, and principal diagnosis, frailty was strongly associated with discharge to PAC facility (apparently vulnerable/mild frailty vs no frailty, relative ratio [RR] = 2.00; 95% confidence interval [CI], 1.28-3.27, and moderate/severe frailty vs no frailty; RR = 2.66, 95% CI, 1.67-4.43). When the frailty score was included as a continuous variable, 1 unit increase in the score was associated with a 12% higher risk for discharge to a PAC facility (RR = 1.12; 95% CI, 1.07-1.17).
DISCUSSION
In this analysis of over 500 community-dwelling elderly medical patients hospitalized at one large tertiary center, we found that almost half of the patients were frail and over one-third had a new discharge to a PAC facility. Frailty, as assessed by REFS, was strongly associated with discharge to a PAC facility after adjusting for possible confounders.
Frailty is increasingly recognized as a useful tool to risk stratify the highly heterogeneous population of elderly people.4 Previous studies reported that frailty was predictive of discharge to PAC facilities in geriatric trauma and burn injury patients.5,6 We found similar results in a population of elderly medical patients. A recent study showed that the Hospital Admission Risk Profile
Our study has several limitations. First, it a single-center study and results may not be generalizable; however, we included a large sample of patients with a variety of medical diagnoses. Second, the REFS is self-reported posing the risks of recall, respondent bias, and interview bias. We chose the REFS to assess frailty due to its practicality and ease of administration but also its completeness of assessing multiple important geriatric domains. Lastly, we did not collect the reason for discharge to PAC and it may have been a potential confounder.
In conclusion, our study demonstrates that frailty assessed by a practical validated scale, the REFS, is a strong predictor of a new discharge to PAC facilities in older medical patients. Accurate identification of elders at risk for discharge to PAC facilities provides the potential to counsel patients and families and plan for complex post discharge needs. Future studies should identify potential interventions targeting frail patients in which PAC is not obligatory, aiming to increase their chance of being discharged home.
Disclosure
Drs. Stefan and Ramdass had full access to all the data in the study. They take responsibility for the integrity of the data and the accuracy of the analysis. Drs. Stefan, Starr, Brennan, and Ramdass conceived the study. Ms. Liu and Dr. Pekow analyzed the data. Dr. Ramdass prepared the manuscript. Drs. Stefan, Brennan, Lindenauer, and Starr critically reviewed the manuscript for important intellectual content. A subset of the patients included in this study was part of a Health Resources and Services Administration funded Geri-Pal Transformation through Learning and Collaboration project awarded to Baystate Medical Center, grant number U1QHP28702 (PI: Maura J. Brennan). The investigators retained full independence in the conduct of this research. The authors have no conflicts of interest.
1. Xue QL. The frailty syndrome: definition and natural history. Clin Geriatr Med. 2011;27(1):1-15. PubMed
2. Allen LA, Hernandez AF, Peterson ED, et al. Discharge to a skilled nursing facility and subsequent clinical outcomes among older patients hospitalized for heart failure. Circ Heart Fail. 2011;4(3):293-300. PubMed
3. Hakkarainen TW, Arbabi S, Willis M, et al. Outcomes of patients discharged to skilled nursing facilities after acute care hospitalizations. Ann Surg. 2016;263(2):280-285. PubMed
4. Rockwood K, Mitnitski A. Frailty in relation to the accumulation of deficits. J Gerontol A Biol Sci Med Sci. 2007;62(7):722-727. PubMed
5. Joseph B, Pandit V, Rhee Petal, et al. Predicting hospital discharge disposition in geriatric trauma patients: is frailty the answer? J Trauma Acute Care Surg. 2014;76(1):196-200. PubMed
6. Romanowski KS, Barsun, A, Pamlieri TL, Greenhalgh DG, Sen S. Frailty score on admission predicts outcomes in elderly burn injury. J Burn Care Res. 2015;36(1):1-6. PubMed
7. Liu SK, Montgomery J, Yan Y, et al. Association between hospital admission risk profile score and skilled nursing or acute rehabilitation facility discharges in hospitalized older adults. J Am Geriatr Soc. 2016;64(10):2095-2100. PubMed
Frailty is a common geriatric syndrome characterized by decreased physiological reserves leading to increased vulnerability to stressors.1 Frail individuals are at increased risk of adverse health outcomes including falls, disability, hospitalization, and mortality.1 Discharge to skilled nursing facilities (SNFs) is also associated with adverse outcomes,2,3 but limited data exist on the utility of frailty in predicting discharge location in medical elders. We aimed to evaluate the association of frailty assessed by the Reported Edmonton Frailty Scale (REFS) with discharge disposition in hospitalized medical patients who were previously living in the community.
METHODS
We conducted a prospective study of community dwelling elders (≥65 years) hospitalized to the medical service from January 2014 to April 2016. Trained research assistants interviewed patients and/or caregivers on hospital day 1; the REFS was used to screen for frailty and the Mini-Cog assessment for cognitive impairment (supplementary Appendixes 1 and 2). The primary outcome was discharge disposition categorized as discharge to home (with or without home health services) or discharge to a postacute care (PAC) facility (SNF or inpatient rehabilitation). Multivariable Poisson regression analysis was used to estimate the relative risk of discharge to a PAC facility. Frailty was grouped into the following 3 categories: (1) not frail, (2) apparently vulnerable/mildly frail, and (3) moderately/severely frail.
RESULTS
Among the 775 patients screened, 272 declined to participate, were non-English speakers, were transferred from another facility, were admitted under observation status, had advanced dementia, or died during hospitalization. Five hundred and three medical patients were included: median age was 80 years (interquartile range 75-86 years); 54.1% were female and 82.9% were white. The most common comorbidities were hypertension (51.7%), diabetes (26.0%), and renal failure (26.0%). Of the included patients, 11.1% had a known diagnosis of dementia and 52.1% screened positive for cognitive impairment (Table).
Overall, 24.9% were not frail, 49.5% were apparently vulnerable/mildly frail, and 25.6% were moderately/severely frail. About two-thirds (64.8%) returned home (40.0% with home healthcare) and 35% were discharged to a PAC facility (97.1% of them to SNF). Compared with patients who were discharged home, those discharged to a PAC facility were older (≥85 years; 26.7% vs 40.1%) and more likely to have dementia (7.7% vs 17.5%) and be frail (apparently vulnerable/mild frailty = 48.5% vs 51.4%%, moderate/severe frailty = 19.9% vs 36.2%; P < .001). Median length of hospital stay was shorter in those returning home (4 vs 5 days, P < .001).
In the multivariate analysis, which was adjusted for demographics, comorbidities, and principal diagnosis, frailty was strongly associated with discharge to PAC facility (apparently vulnerable/mild frailty vs no frailty, relative ratio [RR] = 2.00; 95% confidence interval [CI], 1.28-3.27, and moderate/severe frailty vs no frailty; RR = 2.66, 95% CI, 1.67-4.43). When the frailty score was included as a continuous variable, 1 unit increase in the score was associated with a 12% higher risk for discharge to a PAC facility (RR = 1.12; 95% CI, 1.07-1.17).
DISCUSSION
In this analysis of over 500 community-dwelling elderly medical patients hospitalized at one large tertiary center, we found that almost half of the patients were frail and over one-third had a new discharge to a PAC facility. Frailty, as assessed by REFS, was strongly associated with discharge to a PAC facility after adjusting for possible confounders.
Frailty is increasingly recognized as a useful tool to risk stratify the highly heterogeneous population of elderly people.4 Previous studies reported that frailty was predictive of discharge to PAC facilities in geriatric trauma and burn injury patients.5,6 We found similar results in a population of elderly medical patients. A recent study showed that the Hospital Admission Risk Profile
Our study has several limitations. First, it a single-center study and results may not be generalizable; however, we included a large sample of patients with a variety of medical diagnoses. Second, the REFS is self-reported posing the risks of recall, respondent bias, and interview bias. We chose the REFS to assess frailty due to its practicality and ease of administration but also its completeness of assessing multiple important geriatric domains. Lastly, we did not collect the reason for discharge to PAC and it may have been a potential confounder.
In conclusion, our study demonstrates that frailty assessed by a practical validated scale, the REFS, is a strong predictor of a new discharge to PAC facilities in older medical patients. Accurate identification of elders at risk for discharge to PAC facilities provides the potential to counsel patients and families and plan for complex post discharge needs. Future studies should identify potential interventions targeting frail patients in which PAC is not obligatory, aiming to increase their chance of being discharged home.
Disclosure
Drs. Stefan and Ramdass had full access to all the data in the study. They take responsibility for the integrity of the data and the accuracy of the analysis. Drs. Stefan, Starr, Brennan, and Ramdass conceived the study. Ms. Liu and Dr. Pekow analyzed the data. Dr. Ramdass prepared the manuscript. Drs. Stefan, Brennan, Lindenauer, and Starr critically reviewed the manuscript for important intellectual content. A subset of the patients included in this study was part of a Health Resources and Services Administration funded Geri-Pal Transformation through Learning and Collaboration project awarded to Baystate Medical Center, grant number U1QHP28702 (PI: Maura J. Brennan). The investigators retained full independence in the conduct of this research. The authors have no conflicts of interest.
1. Xue QL. The frailty syndrome: definition and natural history. Clin Geriatr Med. 2011;27(1):1-15. PubMed
2. Allen LA, Hernandez AF, Peterson ED, et al. Discharge to a skilled nursing facility and subsequent clinical outcomes among older patients hospitalized for heart failure. Circ Heart Fail. 2011;4(3):293-300. PubMed
3. Hakkarainen TW, Arbabi S, Willis M, et al. Outcomes of patients discharged to skilled nursing facilities after acute care hospitalizations. Ann Surg. 2016;263(2):280-285. PubMed
4. Rockwood K, Mitnitski A. Frailty in relation to the accumulation of deficits. J Gerontol A Biol Sci Med Sci. 2007;62(7):722-727. PubMed
5. Joseph B, Pandit V, Rhee Petal, et al. Predicting hospital discharge disposition in geriatric trauma patients: is frailty the answer? J Trauma Acute Care Surg. 2014;76(1):196-200. PubMed
6. Romanowski KS, Barsun, A, Pamlieri TL, Greenhalgh DG, Sen S. Frailty score on admission predicts outcomes in elderly burn injury. J Burn Care Res. 2015;36(1):1-6. PubMed
7. Liu SK, Montgomery J, Yan Y, et al. Association between hospital admission risk profile score and skilled nursing or acute rehabilitation facility discharges in hospitalized older adults. J Am Geriatr Soc. 2016;64(10):2095-2100. PubMed
© 2018 Society of Hospital Medicine
The Use of Clinical Decision Support in Reducing Diagnosis of and Treatment of Asymptomatic Bacteriuria
Reducing the treatment of asymptomatic bacteriuria (ASB), or isolation of bacteria from a urine specimen in a patient without urinary tract infection (UTI) symptoms, is a key goal of antibiotic stewardship programs.1 Treatment of ASB has been associated with the emergence of resistant organisms and subsequent UTI risk among women with recurrent UTI.2,3 The Infectious Diseases Society of America and the American Board of Internal Medicine Foundation’s Choosing Wisely campaign recommend against treating ASB, with the exception of pregnant patients and urogenital surgical patients.1,4
Obtaining urinalyses and urine cultures (UC) in asymptomatic patients may contribute to the unnecessary treatment of ASB. In a study of hospitalized patients, 62% received urinalysis testing, even though 82% of these patients did not have UTI symptoms.5 Of the patients found to have ASB, 30% were given antibiotics.5 Therefore, interventions aimed at reducing urine testing may reduce ASB treatment.
Electronic passive clinical decision support (CDS) alerts and electronic education may be effective interventions to reduce urine testing.6 While CDS tools are recommended in antibiotic stewardship guidelines,7 they have led to only modest improvements in appropriate antibiotic prescribing and are typically bundled with time-intensive educational interventions.8 Furthermore, most in-hospital interventions to decrease ASB treatment have focused on intensive care units (ICUs).9 We hypothesized that CDS and electronic education would decrease (1) urinalysis and UC ordering and (2) antibiotic orders for urinalyses and UCs in hospitalized adult patients.
METHODS
Population
We conducted a prospective time series analysis (preintervention: September 2014 to June 2015; postintervention: September 2015 to June 2016) at a large tertiary medical center. All hospitalized patients ≥18 years old were eligible except those admitted to services requiring specialized ASB management (eg, leukemia and lymphoma, solid organ transplant, and obstetrics).1 The study was declared quality improvement by the Johns Hopkins Institutional Review Board.
Intervention
In August 2015, we implemented a multifaceted intervention that included provider education and passive electronic CDS (supplementary Appendix 1 and supplementary Appendix 2). Materials were disseminated through hospital-wide computer workstation screensavers and a 1-page e-mailed newsletter to department of medicine clinicians. The CDS tool included simple informational messages recommending against urine testing without symptoms and against treating ASB; these messages accompanied electronic health record (EHR; Allscripts Sunrise Clinical Manager, Chicago, IL) orders for urinalysis, UC, and antibiotics commonly used within our institution to treat UTI (cefazolin, cephalexin, ceftriaxone, trimethoprim-sulfamethoxazole, nitrofurantoin, and ciprofloxacin). The information was displayed automatically when orders for these tests and antibiotics were selected; provider acknowledgment was not required to proceed.
Data Collection
The services within our hospital are geographically located. We collected orders for urinalysis, UC, and the associated antibiotics for all units except those housing patients excluded from our study. As the CDS tool appeared only in the inpatient EHR, only postadmission orders were included, excluding emergency department orders. For admissions with multiple urinalyses, urinalysis orders placed ≥72 hours apart were eligible. Only antibiotics ordered for ≥24 hours were included, excluding on-call and 1-time antibiotic orders.
Our approach to data collection attempted to model a clinician’s decision-making pathway from (1) ordering a urinalysis, to (2) ordering a UC in response to a urinalysis result, to (3) ordering antibiotics in response to a urinalysis or UC result. We focused on order placement rather than results to prioritize avoiding testing in asymptomatic patients, as our institution does not require positive urinalyses for UC testing (reflex testing). Urinalyses resulted within 1 to 2 hours, allowing for clinicians to quickly order UCs after urinalysis result review. Urinalysis and UC orders per monthly admissions were defined as (1) urinalyses, (2) UCs, (3) simultaneous urinalysis and UC (within 1 hour of each other), and (4) UCs ordered 1 to 24 hours after urinalysis. We also analyzed the following antibiotic orders per monthly admissions: (1) simultaneous urinalysis and antibiotic orders, (2) antibiotics ordered 1 to 24 hours after urinalysis order, and (3) antibiotics ordered within 24 hours of the UC result.
Outcome Measures
All outcome measures were calculated as the change over time per total monthly admissions in the preintervention and postintervention periods. In addition to symptoms, urinalysis is a critical, measurable early step in determining the presence of ASB. Therefore, the primary outcome measure was the postintervention change in monthly urinalysis orders, and the secondary outcome measure was the postintervention change in monthly UC orders. Additional outcome measures included monthly postintervention changes in (1) UC ordered 1 to 24 hours after urinalyses, (2) urinalyses and antibiotics ordered simultaneously, (3) antibiotic orders within 1 to 24 hours of urinalyses, and (4) antibiotics ordered within 24 hours of UC result.
Statistical Analysis
Statistical analyses were performed by using Stata (version 14.2; StataCorp LLC, College Station, TX). An interrupted time series analysis was performed to compare the change in orders per 100 monthly admissions in preintervention and postintervention periods. To do this, we created 2 separate segmented linear regression models for each dependent variable, pre- and postintervention. Normality was assumed because of large numbers. Rate differences per 100 monthly admissions are also calculated as the total number of orders divided by the total number of admissions in postintervention and preintervention periods with Mantel-Haenszel estimators. Differences were considered statistically significant at P ≤ .05.
RESULTS
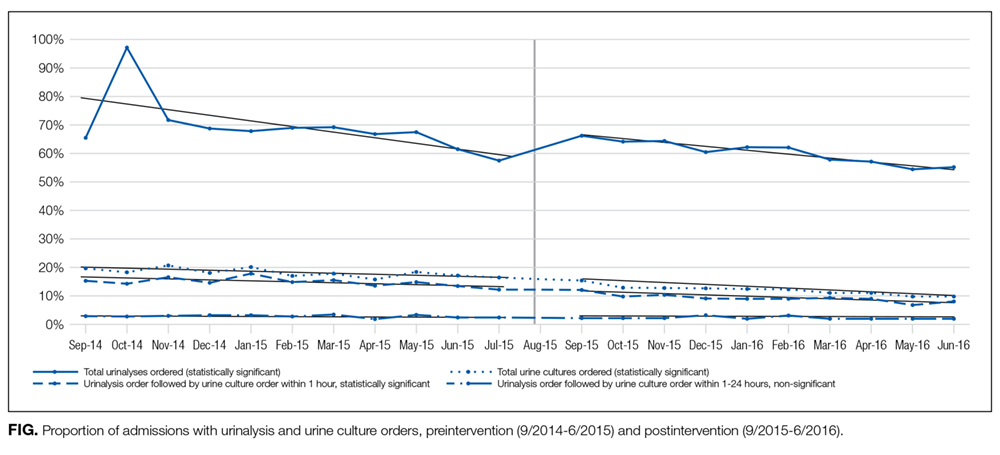
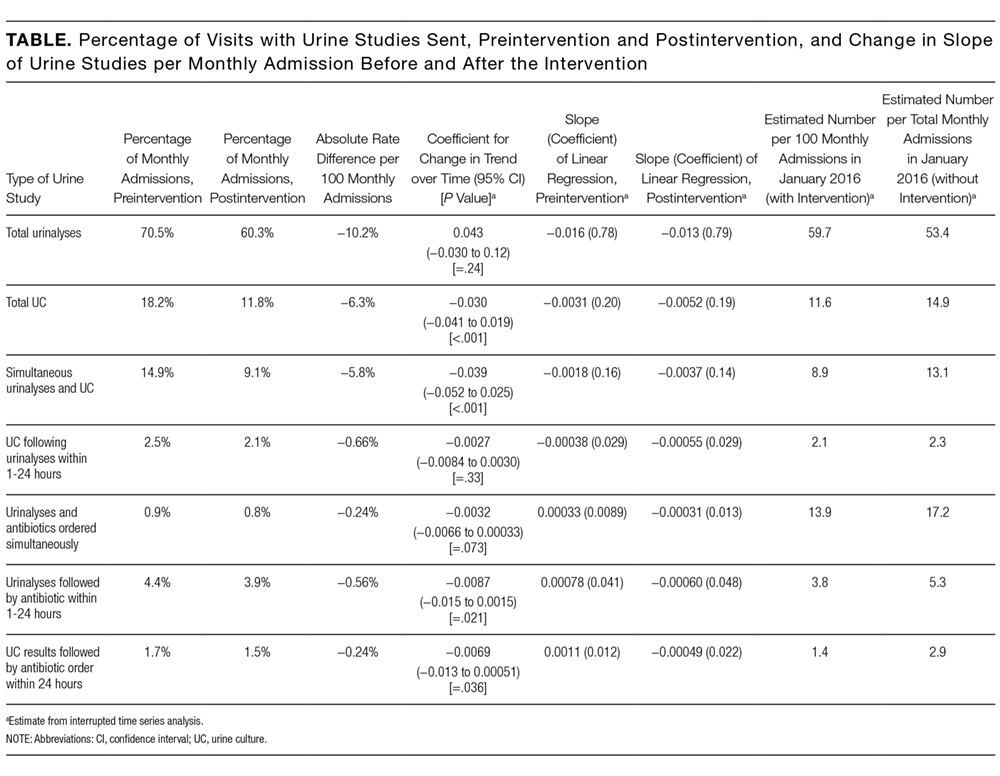
DISCUSSION
A multifaceted but simple bundle of CDS and provider education reduced UC testing but not urinalyses in a large tertiary care hospital. The bundle also reduced antibiotic ordering in response to urinalyses as well as antibiotic ordering in response to UC results.
Other in-hospital CDS tools to decrease ASB treatment have focused only on ICUs.9,10 Our intervention was evaluated hospital-wide and included urinalyses and UCs. Our intervention was clinician directed and not laboratory directed, such as a positive urinalysis reflexing to a UC. Simultaneous urinalysis and UC testing may lead to ASB treatment, as clinicians treat the positive UC and ignore the negative urinalysis.11,12 Therefore, we focused on UCs being sent in response to urinalyses.
We chose to focus on laboratory testing data instead of administrative diagnoses for UTI. The sensitivity of administrative data to determine similar conditions such as catheter-associated UTIs is low (0%).13
Our single-center study may not be generalizable to other settings. We did not include emergency department patients, as this location used a different EHR. In addition, given the 600,000 yearly hospital admissions, it was impractical to assess the appropriateness of each antibiotic-based documentation of symptoms. Instead of focusing on symptoms of ASB or UTI diagnoses, we focused on ordering urinalysis, UC, and antibiotics. In investigating the antibiotics most frequently used to treat UTI in our hospital, we may have both missed some patients who were treated with other antibiotics for ASB (eg, 4th generation cephalosporins, penicillins, carbapenems, etc) and captured patients receiving antibiotics for indications other than UTI (eg, pneumonia). In our focus on overall ordering practices across a hospital, we did not capture data on bladder catheterization status or the predominant organism seen in UC. At the time of the intervention, the laboratory did not have the resources for urinalysis testing reflexing to UC. However, our intervention did not prevent ordering simultaneous urinalysis and UC in symptomatic patients in general or urosepsis in particular. With only 12 total time points, the interrupted time series analysis may have been underpowered.14 We also do not know if the intervention’s effect would decay over time.
Although the intervention took very little staff time and resources, alert fatigue was a risk.15 We attempted to mitigate this alert fatigue by making the CDS passive (in the form of a brief informational message) with no provider action required. In conversations with providers in our institution, there has been dissatisfaction with alerts requiring action, as these are thought to be overly intrusive. We are also not clear on which element of the intervention bundle (ie, the CDS or the educational intervention) may have had more of an impact, as the elements of the intervention bundle were rolled out simultaneously. It is possible and even probable that both elements are needed to raise awareness of the problem. Also, as our EHR required all interventions to be rolled out hospital-wide simultaneously, we were unable to randomize certain floors or providers to the CDS portion of the intervention bundle. Other analyses including the type of hospital unit were beyond the scope of this brief report.
Our intervention bundle was associated with reduced UC orders and reduced antibiotics ordered after urinalyses. If a provider does not know there is bacteriuria, then the provider will not be tempted to order antibiotics. This easily implementable bundle may play an important role as an antimicrobial stewardship strategy for ASB.
Acknowledgments
The authors acknowledge the support of Erin Fanning, BS, and Angel Florentin, BS, in providing data for analysis. SCK received funding from the Johns Hopkins Institute for Clinical and Translational Research (ICTR), which is funded in part by grant number KL2TR001077 from the National Center for Advancing Translational Sciences (NCATS), a component of the National Institutes of Health (NIH), and the NIH Roadmap for Medical Research. These contents are solely the responsibility of the authors and do not necessarily represent the official view of the Johns Hopkins ICTR, NCATS, or NIH. We also acknowledge support from the Centers for Disease Control and Prevention’s Prevention Epicenter Program Q8377 (collaborative agreement U54 CK000447 to SEC). SEC has received support for consulting from Novartis and Theravance, and her institution has received a grant from Pfizer Grants for Learning and Change/The Joint Commission. This work was supported by the NIH T32 HL116275 to NC. The content is solely the responsibility of the authors and does not necessarily represent the official views of the NIH.
Disclosure
No conflicts of interest have been reported by any author.
1. Nicolle LE, Bradley S, Colgan R, et al. Infectious Diseases Society of America guidelines for the diagnosis and treatment of asymptomatic bacteriuria in adults. Clin Infect Dis. 2005;40(5):643-654. PubMed
2. Cai T, Mazzoli S, Mondaini N, et al. The role of asymptomatic bacteriuria in young women with recurrent urinary tract infections: to treat or not to treat? Clin Infect Dis. 2012;55(6):771-777. PubMed
3. Cai T, Nesi G, Mazzoli S, et al. Asymptomatic bacteriuria treatment is associated with a higher prevalence of antibiotic resistant strains in women with urinary tract infections. Clin Infect Dis. 2015;61(11):1655-1661. PubMed
4. Infectious Diseases Society of America. Choosing Wisely: Five Things Physicians and Patients Should Question. 2015. http://www.choosingwisely.org/societies/infectious-diseases-society-of-america/. Accessed on September 11, 2016.
5. Yin P, Kiss A, Leis JA. Urinalysis Orders Among Patients Admitted to the General Medicine Service. JAMA Intern Med. 2015;175(10):1711-1713. PubMed
6. McGregor JC, Weekes E, Forrest GN, et al. Impact of a computerized clinical decision support system on reducing inappropriate antimicrobial use: a randomized controlled trial. J Am Med Inform Assoc. 2006;13(4):378-384. PubMed
7. Barlam TF, Cosgrove SE, Abbo LM, et al. Implementing an Antibiotic Stewardship Program: Guidelines by the Infectious Diseases Society of America and the Society for Healthcare Epidemiology of America. Clin Infect Dis. 2016;62(10):e51-e77. PubMed
8. Gonzales R, Anderer T, McCulloch CE, et al. A cluster randomized trial of decision support strategies for reducing antibiotic use in acute bronchitis. JAMA Intern Med. 2013;173(4):267-273. PubMed
9. Sarg M, Waldrop GE, Beier MA, et al. Impact of Changes in Urine Culture Ordering Practice on Antimicrobial Utilization in Intensive Care Units at an Academic Medical Center. Infect Control Hosp Epidemiol. 2016;37(4):448-454. PubMed
10. Mehrotra A, Linder JA. Tipping the Balance Toward Fewer Antibiotics. JAMA Intern Med. 2016;176(11):1649-1650. PubMed
11. Leis JA, Gold WL, Daneman N, Shojania K, McGeer A. Downstream impact of urine cultures ordered without indication at two acute care teaching hospitals. Infect Control Hosp Epidemiol. 2013;34(10):1113-1114. PubMed
12. Stagg A, Lutz H, Kirpalaney S, et al. Impact of two-step urine culture ordering in the emergency department: a time series analysis. BMJ Qual Saf. 2017. doi:10.1136/bmjqs-2016-006250. PubMed
13. Cass AL, Kelly JW, Probst JC, Addy CL, McKeown RE. Identification of device-associated infections utilizing administrative data. Am J Infect Control. 2013;41(12):1195-1199. PubMed
14. Zhang F, Wagner AK, Ross-Degnan D. Simulation-based power calculation for designing interrupted time series analyses of health policy interventions. J Clin Epidemiol. 2011;64(11):1252-1261. PubMed
15. Embi PJ, Leonard AC. Evaluating alert fatigue over time to EHR-based clinical trial alerts: findings from a randomized controlled study. J Am Med Inform Assoc. 2012;19(e1):e145-e148. PubMed
Reducing the treatment of asymptomatic bacteriuria (ASB), or isolation of bacteria from a urine specimen in a patient without urinary tract infection (UTI) symptoms, is a key goal of antibiotic stewardship programs.1 Treatment of ASB has been associated with the emergence of resistant organisms and subsequent UTI risk among women with recurrent UTI.2,3 The Infectious Diseases Society of America and the American Board of Internal Medicine Foundation’s Choosing Wisely campaign recommend against treating ASB, with the exception of pregnant patients and urogenital surgical patients.1,4
Obtaining urinalyses and urine cultures (UC) in asymptomatic patients may contribute to the unnecessary treatment of ASB. In a study of hospitalized patients, 62% received urinalysis testing, even though 82% of these patients did not have UTI symptoms.5 Of the patients found to have ASB, 30% were given antibiotics.5 Therefore, interventions aimed at reducing urine testing may reduce ASB treatment.
Electronic passive clinical decision support (CDS) alerts and electronic education may be effective interventions to reduce urine testing.6 While CDS tools are recommended in antibiotic stewardship guidelines,7 they have led to only modest improvements in appropriate antibiotic prescribing and are typically bundled with time-intensive educational interventions.8 Furthermore, most in-hospital interventions to decrease ASB treatment have focused on intensive care units (ICUs).9 We hypothesized that CDS and electronic education would decrease (1) urinalysis and UC ordering and (2) antibiotic orders for urinalyses and UCs in hospitalized adult patients.
METHODS
Population
We conducted a prospective time series analysis (preintervention: September 2014 to June 2015; postintervention: September 2015 to June 2016) at a large tertiary medical center. All hospitalized patients ≥18 years old were eligible except those admitted to services requiring specialized ASB management (eg, leukemia and lymphoma, solid organ transplant, and obstetrics).1 The study was declared quality improvement by the Johns Hopkins Institutional Review Board.
Intervention
In August 2015, we implemented a multifaceted intervention that included provider education and passive electronic CDS (supplementary Appendix 1 and supplementary Appendix 2). Materials were disseminated through hospital-wide computer workstation screensavers and a 1-page e-mailed newsletter to department of medicine clinicians. The CDS tool included simple informational messages recommending against urine testing without symptoms and against treating ASB; these messages accompanied electronic health record (EHR; Allscripts Sunrise Clinical Manager, Chicago, IL) orders for urinalysis, UC, and antibiotics commonly used within our institution to treat UTI (cefazolin, cephalexin, ceftriaxone, trimethoprim-sulfamethoxazole, nitrofurantoin, and ciprofloxacin). The information was displayed automatically when orders for these tests and antibiotics were selected; provider acknowledgment was not required to proceed.
Data Collection
The services within our hospital are geographically located. We collected orders for urinalysis, UC, and the associated antibiotics for all units except those housing patients excluded from our study. As the CDS tool appeared only in the inpatient EHR, only postadmission orders were included, excluding emergency department orders. For admissions with multiple urinalyses, urinalysis orders placed ≥72 hours apart were eligible. Only antibiotics ordered for ≥24 hours were included, excluding on-call and 1-time antibiotic orders.
Our approach to data collection attempted to model a clinician’s decision-making pathway from (1) ordering a urinalysis, to (2) ordering a UC in response to a urinalysis result, to (3) ordering antibiotics in response to a urinalysis or UC result. We focused on order placement rather than results to prioritize avoiding testing in asymptomatic patients, as our institution does not require positive urinalyses for UC testing (reflex testing). Urinalyses resulted within 1 to 2 hours, allowing for clinicians to quickly order UCs after urinalysis result review. Urinalysis and UC orders per monthly admissions were defined as (1) urinalyses, (2) UCs, (3) simultaneous urinalysis and UC (within 1 hour of each other), and (4) UCs ordered 1 to 24 hours after urinalysis. We also analyzed the following antibiotic orders per monthly admissions: (1) simultaneous urinalysis and antibiotic orders, (2) antibiotics ordered 1 to 24 hours after urinalysis order, and (3) antibiotics ordered within 24 hours of the UC result.
Outcome Measures
All outcome measures were calculated as the change over time per total monthly admissions in the preintervention and postintervention periods. In addition to symptoms, urinalysis is a critical, measurable early step in determining the presence of ASB. Therefore, the primary outcome measure was the postintervention change in monthly urinalysis orders, and the secondary outcome measure was the postintervention change in monthly UC orders. Additional outcome measures included monthly postintervention changes in (1) UC ordered 1 to 24 hours after urinalyses, (2) urinalyses and antibiotics ordered simultaneously, (3) antibiotic orders within 1 to 24 hours of urinalyses, and (4) antibiotics ordered within 24 hours of UC result.
Statistical Analysis
Statistical analyses were performed by using Stata (version 14.2; StataCorp LLC, College Station, TX). An interrupted time series analysis was performed to compare the change in orders per 100 monthly admissions in preintervention and postintervention periods. To do this, we created 2 separate segmented linear regression models for each dependent variable, pre- and postintervention. Normality was assumed because of large numbers. Rate differences per 100 monthly admissions are also calculated as the total number of orders divided by the total number of admissions in postintervention and preintervention periods with Mantel-Haenszel estimators. Differences were considered statistically significant at P ≤ .05.
RESULTS
DISCUSSION
A multifaceted but simple bundle of CDS and provider education reduced UC testing but not urinalyses in a large tertiary care hospital. The bundle also reduced antibiotic ordering in response to urinalyses as well as antibiotic ordering in response to UC results.
Other in-hospital CDS tools to decrease ASB treatment have focused only on ICUs.9,10 Our intervention was evaluated hospital-wide and included urinalyses and UCs. Our intervention was clinician directed and not laboratory directed, such as a positive urinalysis reflexing to a UC. Simultaneous urinalysis and UC testing may lead to ASB treatment, as clinicians treat the positive UC and ignore the negative urinalysis.11,12 Therefore, we focused on UCs being sent in response to urinalyses.
We chose to focus on laboratory testing data instead of administrative diagnoses for UTI. The sensitivity of administrative data to determine similar conditions such as catheter-associated UTIs is low (0%).13
Our single-center study may not be generalizable to other settings. We did not include emergency department patients, as this location used a different EHR. In addition, given the 600,000 yearly hospital admissions, it was impractical to assess the appropriateness of each antibiotic-based documentation of symptoms. Instead of focusing on symptoms of ASB or UTI diagnoses, we focused on ordering urinalysis, UC, and antibiotics. In investigating the antibiotics most frequently used to treat UTI in our hospital, we may have both missed some patients who were treated with other antibiotics for ASB (eg, 4th generation cephalosporins, penicillins, carbapenems, etc) and captured patients receiving antibiotics for indications other than UTI (eg, pneumonia). In our focus on overall ordering practices across a hospital, we did not capture data on bladder catheterization status or the predominant organism seen in UC. At the time of the intervention, the laboratory did not have the resources for urinalysis testing reflexing to UC. However, our intervention did not prevent ordering simultaneous urinalysis and UC in symptomatic patients in general or urosepsis in particular. With only 12 total time points, the interrupted time series analysis may have been underpowered.14 We also do not know if the intervention’s effect would decay over time.
Although the intervention took very little staff time and resources, alert fatigue was a risk.15 We attempted to mitigate this alert fatigue by making the CDS passive (in the form of a brief informational message) with no provider action required. In conversations with providers in our institution, there has been dissatisfaction with alerts requiring action, as these are thought to be overly intrusive. We are also not clear on which element of the intervention bundle (ie, the CDS or the educational intervention) may have had more of an impact, as the elements of the intervention bundle were rolled out simultaneously. It is possible and even probable that both elements are needed to raise awareness of the problem. Also, as our EHR required all interventions to be rolled out hospital-wide simultaneously, we were unable to randomize certain floors or providers to the CDS portion of the intervention bundle. Other analyses including the type of hospital unit were beyond the scope of this brief report.
Our intervention bundle was associated with reduced UC orders and reduced antibiotics ordered after urinalyses. If a provider does not know there is bacteriuria, then the provider will not be tempted to order antibiotics. This easily implementable bundle may play an important role as an antimicrobial stewardship strategy for ASB.
Acknowledgments
The authors acknowledge the support of Erin Fanning, BS, and Angel Florentin, BS, in providing data for analysis. SCK received funding from the Johns Hopkins Institute for Clinical and Translational Research (ICTR), which is funded in part by grant number KL2TR001077 from the National Center for Advancing Translational Sciences (NCATS), a component of the National Institutes of Health (NIH), and the NIH Roadmap for Medical Research. These contents are solely the responsibility of the authors and do not necessarily represent the official view of the Johns Hopkins ICTR, NCATS, or NIH. We also acknowledge support from the Centers for Disease Control and Prevention’s Prevention Epicenter Program Q8377 (collaborative agreement U54 CK000447 to SEC). SEC has received support for consulting from Novartis and Theravance, and her institution has received a grant from Pfizer Grants for Learning and Change/The Joint Commission. This work was supported by the NIH T32 HL116275 to NC. The content is solely the responsibility of the authors and does not necessarily represent the official views of the NIH.
Disclosure
No conflicts of interest have been reported by any author.
1. Nicolle LE, Bradley S, Colgan R, et al. Infectious Diseases Society of America guidelines for the diagnosis and treatment of asymptomatic bacteriuria in adults. Clin Infect Dis. 2005;40(5):643-654. PubMed
2. Cai T, Mazzoli S, Mondaini N, et al. The role of asymptomatic bacteriuria in young women with recurrent urinary tract infections: to treat or not to treat? Clin Infect Dis. 2012;55(6):771-777. PubMed
3. Cai T, Nesi G, Mazzoli S, et al. Asymptomatic bacteriuria treatment is associated with a higher prevalence of antibiotic resistant strains in women with urinary tract infections. Clin Infect Dis. 2015;61(11):1655-1661. PubMed
4. Infectious Diseases Society of America. Choosing Wisely: Five Things Physicians and Patients Should Question. 2015. http://www.choosingwisely.org/societies/infectious-diseases-society-of-america/. Accessed on September 11, 2016.
5. Yin P, Kiss A, Leis JA. Urinalysis Orders Among Patients Admitted to the General Medicine Service. JAMA Intern Med. 2015;175(10):1711-1713. PubMed
6. McGregor JC, Weekes E, Forrest GN, et al. Impact of a computerized clinical decision support system on reducing inappropriate antimicrobial use: a randomized controlled trial. J Am Med Inform Assoc. 2006;13(4):378-384. PubMed
7. Barlam TF, Cosgrove SE, Abbo LM, et al. Implementing an Antibiotic Stewardship Program: Guidelines by the Infectious Diseases Society of America and the Society for Healthcare Epidemiology of America. Clin Infect Dis. 2016;62(10):e51-e77. PubMed
8. Gonzales R, Anderer T, McCulloch CE, et al. A cluster randomized trial of decision support strategies for reducing antibiotic use in acute bronchitis. JAMA Intern Med. 2013;173(4):267-273. PubMed
9. Sarg M, Waldrop GE, Beier MA, et al. Impact of Changes in Urine Culture Ordering Practice on Antimicrobial Utilization in Intensive Care Units at an Academic Medical Center. Infect Control Hosp Epidemiol. 2016;37(4):448-454. PubMed
10. Mehrotra A, Linder JA. Tipping the Balance Toward Fewer Antibiotics. JAMA Intern Med. 2016;176(11):1649-1650. PubMed
11. Leis JA, Gold WL, Daneman N, Shojania K, McGeer A. Downstream impact of urine cultures ordered without indication at two acute care teaching hospitals. Infect Control Hosp Epidemiol. 2013;34(10):1113-1114. PubMed
12. Stagg A, Lutz H, Kirpalaney S, et al. Impact of two-step urine culture ordering in the emergency department: a time series analysis. BMJ Qual Saf. 2017. doi:10.1136/bmjqs-2016-006250. PubMed
13. Cass AL, Kelly JW, Probst JC, Addy CL, McKeown RE. Identification of device-associated infections utilizing administrative data. Am J Infect Control. 2013;41(12):1195-1199. PubMed
14. Zhang F, Wagner AK, Ross-Degnan D. Simulation-based power calculation for designing interrupted time series analyses of health policy interventions. J Clin Epidemiol. 2011;64(11):1252-1261. PubMed
15. Embi PJ, Leonard AC. Evaluating alert fatigue over time to EHR-based clinical trial alerts: findings from a randomized controlled study. J Am Med Inform Assoc. 2012;19(e1):e145-e148. PubMed
© 2017 Society of Hospital Medicine