User login
Cardiac Biomarkers—Are We Testing Wisely?
Cardiac biomarker testing, along with a thorough patient history, physical exam, and an electrocardiogram, is required for the diagnosis of patients with suspected acute coronary syndrome (ACS). For nearly 3 decades, 2 cardiac biomarkers, troponin (I or T) and creatine kinase-MB fraction (CK-MB), have been ordered together to evaluate ACS patients out of concern that utilizing a single biomarker might be less diagnostically accurate than using 2 biomarkers. However, subsequent studies have shown that troponin is far more sensitive and specific for myocardial injury than CK-MB.1,2 Troponin testing offers important prognostic information irrespective of whether the CK-MB is normal or abnormal.3,4 In 2015, the American Society of Clinical Pathology released a Choosing Wisely® recommendation against ordering CK-MB (or myoglobin) for the diagnosis of acute myocardial infarction (AMI).5 This reflects an emerging consensus that CK-MB testing represents low-value care while troponin testing alone is the appropriate diagnostic strategy for ACS patients.
Remarkably, we know very little about patterns of cardiac biomarker utilization in clinical practice. In this issue of the Journal of Hospital Medicine, Prochaska et al.6 provide a valuable snapshot of troponin and CK-MB utilization at 91 U.S. academic medical centers (AMCs) for 18 months prior to and following the release of the 2015 Choosing Wisely® recommendation. From a retrospective review of 106,954 inpatient discharges with a principal diagnosis of AMI, they report a 29.2% rate of troponin-only testing in 2013 with a gradual increase over 3 years to 53.5% in 2016. Interestingly, the study’s baseline troponin-only utilization rate is consistent with a 2013 College of American Pathologists survey, which estimated that 23% of U.S. clinical laboratories no longer process CK-MB (and therefore run troponins alone).7
Did the 2015 Choosing Wisely® recommendation have an impact on providers choosing cardiac biomarkers wisely? The authors answer this question in a novel way by stratifying hospitals into performance tertiles for each study quarter and then further classifying them into groups that were consistently high, middle, and low performers throughout the study period. Using an interrupted time series design, they identify 26 hospitals who improved their troponin-only testing performance tertile during the study period and examine their average quarterly rate of change. As illustrated in Figure 3, they report a sharp increase in the rate of change of troponin-only testing shortly after the release of the 2015 Choosing Wisely® recommendation. The authors reasonably conclude that the Choosing Wisely® campaign “appeared to facilitate accelerated adoption of troponin-only testing” among these hospitals.
However, we should interpret these results with caution. The authors highlight several limitations, including the absence of causality common in observational studies and insufficient time to follow-up to capture the full (or transient) impact of the intervention. There are factors external to the Choosing Wisely® campaign that may have influenced cardiac biomarker testing patterns observed. Examples include variation in hospital leadership, financial drivers, and local culture that promote high-value care. We also note that (1) there are several published interventions to improve troponin-only ordering that predate the Choosing Wisely® campaign8,9; (2) a prominent cardiology guideline endorsed the use of troponin as a preferred cardiac biomarker in 201210; and (3) a widely cited opinion by prominent researchers called for the elimination of CK-MB from clinical practice in 2008.11 These publications suggest there was already an awareness of and efforts underway to improve cardiac enzyme testing contributing to the results described by Prochaska et al.
Limitations notwithstanding, we commend Prochaska et al. for conducting the first-known description of patient-level trend rates of troponin and CK-MB testing. Finally, it is worth noting that where there is accomplishment, there is also opportunity. At the end of the study period, nearly 50% of institutions had yet to adopt a troponin-only strategy. While there has been an overall trend towards improvement, this number remains high. We may conjecture as to possible explanations: Providers may be unconvinced that a single troponin is sufficient in the diagnosis of ACS (ie, lack of knowledge or debate over the interpretation of available science), stakeholders may be slow to de-adopt practices using appropriate systems levers (eg, laboratories delisting CK-MB processing), and incentives may be lacking to motivate AMCs. The results of this study should be used as a burning platform to those who wish to “test wisely” in cardiac biomarker use.
Disclosure
The authors report no conflicts of interest or financial disclosures.
1. Katus HA, Remppis A, Neumann FJ, et al. Diagnostic efficiency of troponin T measurements in acute myocardial infarction. Circulation. 1991;83:902-912. PubMed
2. Adams JE III, Bodor GS, Dávila-Román VG, et al. Cardiac troponin I. A marker with high specificity for cardiac injury. Circulation. 1993;88:101-106. PubMed
3. Newby LK, Roe MT, Chen AY, et al. Frequency and clinical implications of discordant creatine kinase-MB and troponin measurements in acute coronary syndromes. J Am Coll Cardiol. 2006;47:312-318. PubMed
4. Goodman SG, Steg PG, Eagle KA, et al. The diagnostic and prognostic impact of the redefinition of acute myocardial infarction: lessons from the Global Registry of Acute Coronary Events (GRACE). Am Heart J. 2006;151:654-660. PubMed
5. American Society of Clinical Pathology - Choosing Wisely recommendations; http://www.choosingwisely.org/clinicianlists/#parentSociety=American_Society_for_Clinical_Pathology. Released February 2015. Accessed June 12, 2017.
6. Prochaska MT, Hohmann SF, Modes M, Arora VM. Trends in Troponin-Only Testing for AMI in Academic Teaching Hospitals and the Impact of Choosing Wisely®. J Hosp
7. Singh G, Baweja PS. CK-MB: Journey to Obsolescence. Am J Clin Pathol. 2014;141(3):415-419. PubMed
8. Larochelle MR, Knight AM, Pantle H, Riedel S, Trost JC. Reducing excess biomarker use at an academic medical center. J Gen Intern Med. 2014;29(11):1468-1474. PubMed
9. Baron JM, Lewandrowski KB, Kamis IK, Singh B, Belkziz SM, Dighe AS. A novel strategy for evaluating the effects of an electronic test ordering alert message: optimizing cardiac marker use. J Pathol Inform. 2012;3:3. PubMed
10. Thygesen K, Alpert JS, Jaffe AS, et al. Third Universal Definition of Myocardial Infarction. Circulation. 2012;126:2020-2035. PubMed
11. Saenger AK, Jaffe AS. Requiem for a Heavyweight: The Demise of CK-MB. Circulation. 2008;118(21):2200-2206. PubMed
Cardiac biomarker testing, along with a thorough patient history, physical exam, and an electrocardiogram, is required for the diagnosis of patients with suspected acute coronary syndrome (ACS). For nearly 3 decades, 2 cardiac biomarkers, troponin (I or T) and creatine kinase-MB fraction (CK-MB), have been ordered together to evaluate ACS patients out of concern that utilizing a single biomarker might be less diagnostically accurate than using 2 biomarkers. However, subsequent studies have shown that troponin is far more sensitive and specific for myocardial injury than CK-MB.1,2 Troponin testing offers important prognostic information irrespective of whether the CK-MB is normal or abnormal.3,4 In 2015, the American Society of Clinical Pathology released a Choosing Wisely® recommendation against ordering CK-MB (or myoglobin) for the diagnosis of acute myocardial infarction (AMI).5 This reflects an emerging consensus that CK-MB testing represents low-value care while troponin testing alone is the appropriate diagnostic strategy for ACS patients.
Remarkably, we know very little about patterns of cardiac biomarker utilization in clinical practice. In this issue of the Journal of Hospital Medicine, Prochaska et al.6 provide a valuable snapshot of troponin and CK-MB utilization at 91 U.S. academic medical centers (AMCs) for 18 months prior to and following the release of the 2015 Choosing Wisely® recommendation. From a retrospective review of 106,954 inpatient discharges with a principal diagnosis of AMI, they report a 29.2% rate of troponin-only testing in 2013 with a gradual increase over 3 years to 53.5% in 2016. Interestingly, the study’s baseline troponin-only utilization rate is consistent with a 2013 College of American Pathologists survey, which estimated that 23% of U.S. clinical laboratories no longer process CK-MB (and therefore run troponins alone).7
Did the 2015 Choosing Wisely® recommendation have an impact on providers choosing cardiac biomarkers wisely? The authors answer this question in a novel way by stratifying hospitals into performance tertiles for each study quarter and then further classifying them into groups that were consistently high, middle, and low performers throughout the study period. Using an interrupted time series design, they identify 26 hospitals who improved their troponin-only testing performance tertile during the study period and examine their average quarterly rate of change. As illustrated in Figure 3, they report a sharp increase in the rate of change of troponin-only testing shortly after the release of the 2015 Choosing Wisely® recommendation. The authors reasonably conclude that the Choosing Wisely® campaign “appeared to facilitate accelerated adoption of troponin-only testing” among these hospitals.
However, we should interpret these results with caution. The authors highlight several limitations, including the absence of causality common in observational studies and insufficient time to follow-up to capture the full (or transient) impact of the intervention. There are factors external to the Choosing Wisely® campaign that may have influenced cardiac biomarker testing patterns observed. Examples include variation in hospital leadership, financial drivers, and local culture that promote high-value care. We also note that (1) there are several published interventions to improve troponin-only ordering that predate the Choosing Wisely® campaign8,9; (2) a prominent cardiology guideline endorsed the use of troponin as a preferred cardiac biomarker in 201210; and (3) a widely cited opinion by prominent researchers called for the elimination of CK-MB from clinical practice in 2008.11 These publications suggest there was already an awareness of and efforts underway to improve cardiac enzyme testing contributing to the results described by Prochaska et al.
Limitations notwithstanding, we commend Prochaska et al. for conducting the first-known description of patient-level trend rates of troponin and CK-MB testing. Finally, it is worth noting that where there is accomplishment, there is also opportunity. At the end of the study period, nearly 50% of institutions had yet to adopt a troponin-only strategy. While there has been an overall trend towards improvement, this number remains high. We may conjecture as to possible explanations: Providers may be unconvinced that a single troponin is sufficient in the diagnosis of ACS (ie, lack of knowledge or debate over the interpretation of available science), stakeholders may be slow to de-adopt practices using appropriate systems levers (eg, laboratories delisting CK-MB processing), and incentives may be lacking to motivate AMCs. The results of this study should be used as a burning platform to those who wish to “test wisely” in cardiac biomarker use.
Disclosure
The authors report no conflicts of interest or financial disclosures.
1. Katus HA, Remppis A, Neumann FJ, et al. Diagnostic efficiency of troponin T measurements in acute myocardial infarction. Circulation. 1991;83:902-912. PubMed
2. Adams JE III, Bodor GS, Dávila-Román VG, et al. Cardiac troponin I. A marker with high specificity for cardiac injury. Circulation. 1993;88:101-106. PubMed
3. Newby LK, Roe MT, Chen AY, et al. Frequency and clinical implications of discordant creatine kinase-MB and troponin measurements in acute coronary syndromes. J Am Coll Cardiol. 2006;47:312-318. PubMed
4. Goodman SG, Steg PG, Eagle KA, et al. The diagnostic and prognostic impact of the redefinition of acute myocardial infarction: lessons from the Global Registry of Acute Coronary Events (GRACE). Am Heart J. 2006;151:654-660. PubMed
5. American Society of Clinical Pathology - Choosing Wisely recommendations; http://www.choosingwisely.org/clinicianlists/#parentSociety=American_Society_for_Clinical_Pathology. Released February 2015. Accessed June 12, 2017.
6. Prochaska MT, Hohmann SF, Modes M, Arora VM. Trends in Troponin-Only Testing for AMI in Academic Teaching Hospitals and the Impact of Choosing Wisely®. J Hosp
7. Singh G, Baweja PS. CK-MB: Journey to Obsolescence. Am J Clin Pathol. 2014;141(3):415-419. PubMed
8. Larochelle MR, Knight AM, Pantle H, Riedel S, Trost JC. Reducing excess biomarker use at an academic medical center. J Gen Intern Med. 2014;29(11):1468-1474. PubMed
9. Baron JM, Lewandrowski KB, Kamis IK, Singh B, Belkziz SM, Dighe AS. A novel strategy for evaluating the effects of an electronic test ordering alert message: optimizing cardiac marker use. J Pathol Inform. 2012;3:3. PubMed
10. Thygesen K, Alpert JS, Jaffe AS, et al. Third Universal Definition of Myocardial Infarction. Circulation. 2012;126:2020-2035. PubMed
11. Saenger AK, Jaffe AS. Requiem for a Heavyweight: The Demise of CK-MB. Circulation. 2008;118(21):2200-2206. PubMed
© 2017 Society of Hospital Medicine
Opportunities and Challenges for Improving the Patient Experience in the Acute and Post–Acute Care Setting Using Patient Portals: The Patient’s Perspective
To realize the vision of patient-centered care, efforts are focusing on engaging patients and “care partners,” often a family caregiver, by using patient-facing technologies.1-4 Web-based patient portals linked to the electronic health record (EHR) provide patients and care partners with the ability to access personal health information online and to communicate with clinicians. In recent years, institutions have been increasing patient portal offerings to improve the patient experience, promote safety, and optimize healthcare delivery.5-7
DRIVERS OF ADOPTION
The adoption of patient portals has been driven by federal incentive programs (Meaningful Use), efforts by the Center for Medicare and Medicaid Services, and the Office of the National Coordinator for Health Information Technology to improve patient outcomes and the transition toward value-based reimbursement.2,8,9 The vast majority of use has been in ambulatory settings; use for acute care is nascent at best.10 Among hospitalized patients, few bring an internet-enabled computer or mobile device to access personal health records online.11 However, evidence suggests that care partners will use portals on behalf of acutely ill patients.4 As the Caregiver Advise, Record, Enable Act is implemented, hospitals will be required to identify patients’ care partners during hospitalization, inform them when the patient is ready for discharge, and provide self-management instructions during the transition home.12 In this context, understanding how best to leverage acute care patient portals will be important to institutions, clinicians, and vendors.
CURRENT KNOWLEDGE
The literature regarding acute care patient portals is rapidly growing.4,10 Hospitalized patients have unmet information and communication needs, and hospital-based clinicians struggle to meet these needs in a timely manner.13-15 In general, patients feel that using a mobile device to access personal health records has the potential to improve their experience.11 Early studies suggest that acute care patient portals can promote patient-centered communication and collaboration during hospitalization, including in intensive care settings.4,16,17 Furthermore, the use of acute care patient portals can improve perception of safety and quality, decrease anxiety, and increase understanding of health conditions.3,14 Although early evidence is promising, considerable knowledge gaps exist regarding patient outcomes over the acute episode of care.10,18
OUTSTANDING QUESTIONS
A clear area of interest is accessing acute care patient portals via mobile technology to engage patients during recovery from hospitalization.4,11 Although we do not yet know whether use during care transitions will favorably impact outcomes, given the high rate of harm after discharge, this seems likely.19 The few studies evaluating the effect on validated measures of engagement (Patient Activation Measure) and hospital readmissions have not shown demonstrable improvement to date.20,21 Clearly, optimizing acute care patient portals with regard to patient-clinician communication, as well as the type, timing, and format of information delivered, will be necessary to maximize value.4,22
From the patient’s perspective, there is much we can learn.23 Is the information that is presented pertinent, timely, and easy to understand? Will the use of portals detract from face-to-face interactions? Does greater transparency foster more accountability? Achieving an appropriate balance of digital health-information sharing for hospitalized patients is challenging given the sensitivity of patient data when diagnoses are uncertain and treatments are in flux.4,24 These questions must be answered as hospitals implement acute care patient portals.
ACUTE CARE PATIENT PORTAL TASK FORCE
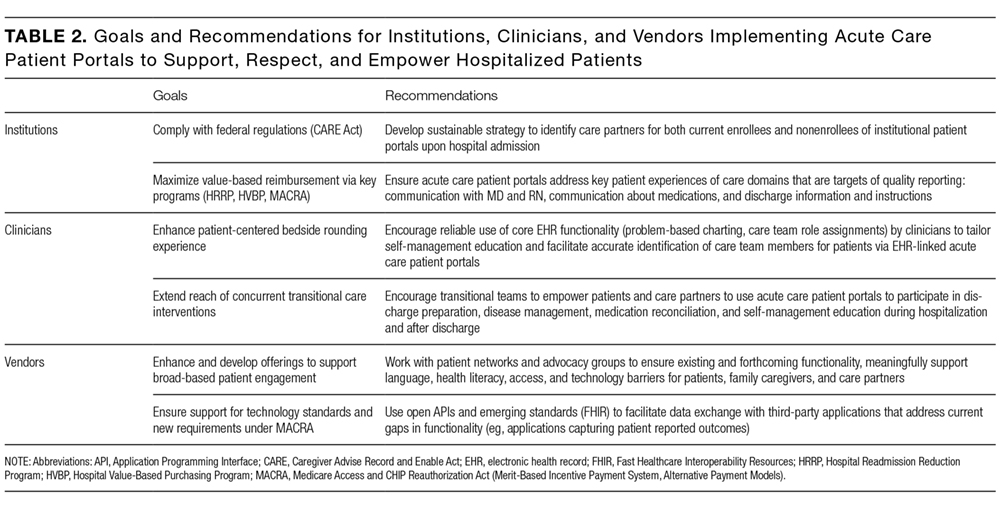
To start addressing knowledge gaps, we established a task force of 21 leading researchers, informatics and policy experts, and clinical leaders. The Acute Care Patient Portal Task Force was a subgroup of the Libretto Consortium, a collaboration of 4 academic medical centers established by the Gordon and Betty Moore Foundation to design, develop, and implement technologies to engage patients, care partners, and providers in preventing harm in hospital settings. Initially, we were challenged with assessing stakeholders’ perspectives from early adopter institutions. We learned that acute care patient portals must offer an integrated experience across care settings, humanize the patient-clinician relationship, enable equitable access, and align with institutional strategy to promote sustainability.19

Cognitive Support
The opportunities identified include acclimatizing and assimilating to the hospital environment (reviewing policies and patient rights) and facilitating self-education and preparation by linking to personal health information and providing structured guidance at transitions.4 For example, a care partner of an incapacitated patient may watch a video to orient to the intensive care unit, navigate educational content linked to the patient’s admission diagnosis (pneumonia) entered in the EHR, view the timing of an upcoming imaging study (chest computed tomography scan), and complete a standardized checklist prior to discharge.
The main challenges we identified include ensuring accuracy of hospital-, unit-, and patient-level information, addressing information overload, configuring notification and display settings to optimize the user experience, presenting information at an appropriate health literacy level,4,21 and addressing security and privacy concerns when expanding access to family members.24
Respect and Boundaries
Opportunities identified include supporting individual learning styles by using interactive features of mobile devices to improve comprehension for visual, auditory, and tactile learners and reinforcing learning through the use of various types of digital media.25-27 For example, a visual learner may view a video tutorial for a newly prescribed medication. A tactile learner may prefer to use interactive graphical displays that exploit multidimensional touch capabilities of mobile devices to learn about active conditions or an upcoming procedure. An auditory learner may choose to use intelligent personal assistants to navigate their plan of care (“Hey Siri, what is my schedule for today?”). By addressing the learning preferences of patients and time constraints of clinicians, institutions can use acute care patient portals to promote more respectful interactions and collaborative decision-making during important care processes, such as obtaining surgical consent.28,29
We also identified opportunities to facilitate personalization by tailoring educational content and by enabling the use of patient-generated health data collected from wearable devices. For example, patients may prefer to interact with a virtual advocate to review discharge instructions (“Louis” in Project Re-Engineered Discharge) when personalized to their demographics and health literacy level.30-32 Patients may choose to upload step counts from wearable devices so that clinicians can monitor activity goals in preparation for discharge and while recovering afterwards. When supported in these ways, acute care patient portals allow patients to have more meaningful interactions with clinicians about diagnoses, treatments, prognosis, and goals for recovery.
The main challenges we identified include balancing interactions with technology and clinicians, ensuring clinicians understand how patients from different socioeconomic backgrounds use existing and newer technology to enhance self-management, assessing health and technology literacy, and understanding individual preferences for sharing patient-generated health data. Importantly, we must remain vigilant that patients will express concern about overdependence on technology, especially if it detracts from in-person interaction; our panelists emphasized that technology should never replace “human touch.”
Patient and Family Empowerment
The opportunities identified include promoting patient-centered communication by supporting a real-time and asynchronous dialogue among patients, care partners, and care team members (including ambulatory clinicians) while minimizing conversational silos4,33; displaying names, roles, and pictures of all care team members4,34; fostering transparency by sharing clinician documentation in progress notes and sign-outs35; ensuring accountability for a single plan of care spanning shift changes and handoffs, and providing a mechanism to enable real-time feedback.
Hospitalization can be a vulnerable and isolating experience, perpetuated by a lack of timely and coordinated communication with the care team. We identified opportunities to mitigate anxiety by promoting shared understanding when questions require input from multiple clinicians, when team members change, or when patients wish to communicate with their longitudinal ambulatory providers.4,34 For example, inviting patients to review clinicians’ progress notes should stimulate more open and meaningful communication.35 Furthermore, requesting that patients state their wishes, preferences, and goals could improve overall concordance with care team members.36,37 Empowering patients and care partners to voice their concerns, particularly those related to miscommunication, may mitigate harm propagated by handoffs, shift work, and weekend coverage.38,39 While reporting safety concerns represents a novel mechanism to augment medical-error reporting by clinicians alone,23,40 this strategy will be most effective when aligned with standardized communication initiatives (I-PASS) that have been proven to reduce medical errors and preventable adverse events and are being implemented nationally.41 Finally, by leveraging tools that facilitate instantaneous feedback, patients can be empowered to react to their plan (ranking skilled nursing facility options) as it is developed.
The main challenges we identified include managing expectations regarding the use of communication tools, accurately and reliably identifying care team members in the EHR,34 acknowledging patients as equal partners, ensuring patients receive a consistent message about diagnoses and therapies during handoffs and when multiple consultants have conflicting opinions about the plan,37 and addressing patient concerns fairly and respectfully.
RECOMMENDATIONS AND CONCLUSIONS
In summary, the patient-centered themes we identified serve as guiding principles for institutions, clinicians, and vendors who wish to use patient portals to improve the acute and postacute care patient experience. One central message resonates: Patients do not simply want access to their health information and the ability to communicate with the clinicians who furnish this information; they want to feel supported, respected, and empowered when doing so. It is only through partnership with patients and their advocates that we can fully realize the impact of digital technologies when patients are in their most vulnerable state.
Acknowledgments
The authors thank their colleagues and the patient and family advocates who contributed to this body of work as part of the Acute Care Patient Portal Task Force and conference: Brittany Couture; Ronen Rozenblum, PhD, MPH; Jennifer Prey, MPhil, MS, PhD; Kristin O’Reilly, RN, BSN, MPH; Patricia Q. Bourie, RN, MS, Cindy Dwyer, RN, BSN,S; Ryan Greysen, MD, MHS, MA; Jeffery Smith, MPP; Michael Gropper, MD, PhD; Patricia Dykes, RN, PhD; Martha B. Carnie; Jeffrey W. Mello; and Jane Webster.
Disclosure
Anuj K. Dalal, MD, David W. Bates, MD, MSc, and Sarah Collins, RN, PhD, are responsible for the conception or design of the work; acquisition, analysis, or interpretation of data; drafting the work or revising it critically for important intellectual content; and final approval of the version to be published. The authors agree to be accountable for all aspects of the work and to ensure that questions related to the accuracy or integrity of the work are appropriately investigated and resolved. This work was supported by a grant from the Gordon and Betty Moore Foundation ([GBMF] #4993). GBMF had no role in the design or conduct of the study; the collection, analysis, or interpretation of data; or preparation or review of the manuscript. The findings and conclusions in this report are those of the authors and do not necessarily represent the official position of GBMF. The authors report no conflicts of interest.
1. Sarkar U, Bates DW. Care partners and online patient portals. JAMA. 2014;311(4):357-358. PubMed
2. Grando MA, Rozenblum R, Bates DW, eds. Information Technology for Patient Empowerment in Healthcare, 1st Edition. Berlin: Walter de Gruyter Inc.; 2015.
3. Kelly MM, Hoonakker PLT, Dean SM. Using an inpatient portal to engage families in pediatric hospital care. J Am Med Inform Assoc. 2016;24(1):153-161. PubMed
4. Dalal AK, Dykes PC, Collins S, et al. A web-based, patient-centered toolkit to engage patients and caregivers in the acute care setting: A preliminary evaluation. J Am Med Inform Assoc. 2016;23(1):80-87. PubMed
5. Prey JE, Restaino S, Vawdrey DK. Providing hospital patients with access to their medical records. AMIA Annu Symp Proc. 2014;2014:1884-1893. PubMed
6. Herrin J, Harris KG, Kenward K, Hines S, Joshi MS, Frosch DL. Patient and family engagement: A survey of US hospital practices. BMJ Qual Saf. 2016;25(3):182-189. PubMed
7. Tom JO, Mangione-Smith R, Solomon C, Grossman DC. Integrated personal health record use: Association with parent-reported care experiences. Pediatrics. 2012;130(1):e183-e190. PubMed
8. Centers for Medicare & Medicaid Services (CMS), HHS. Medicare and Medicaid Programs; Electronic Health Record Incentive Program-Stage 2. Federal Register Final Rule. Sect. 170; 2012. https://www.federalregister.gov/documents/2012/03/07/2012-4443/medicare-and-medicaid-programs-electronic-health-record-incentive-program-stage-2. Accessed March 1, 2017.
9. Centers for Medicare & Medicaid Services (CMS), HHS. Medicare program; merit-based incentive payment system (MIPS) and alternative payment model (APM) incentive under the physician fee schedule, and criteria for physician-focused payment models. Final rule with comment period. Fed Regist. 2016;81(214):77008-77831. PubMed
10. Prey JE, Woollen J, Wilcox L, et al. Patient engagement in the inpatient setting: A systematic review. J Am Med Informat Assoc. 2014;21(4):742-750. PubMed
11. Ludwin S, Greysen SR. Use of smartphones and mobile devices in hospitalized patients: Untapped opportunities for inpatient engagement. J Hosp Med. 2015;10(7):459-461. PubMed
12. Coleman EA. Family caregivers as partners in care transitions: The caregiver advise record and enable act. J Hosp Med. 2016;11(12):883-885. PubMed
13. Kaziunas E, Hanauer DA, Ackerman MS, Choi SW. Identifying unmet informational needs in the inpatient setting to increase patient and caregiver engagement in the context of pediatric hematopoietic stem cell transplantation. J Am Med Inform Assoc. 2016;23(1):94-104. PubMed
14. Woollen J, Prey J, Wilcox L, et al. Patient experiences using an inpatient personal health record. Appl Clin Inform. 2016;7(2):446-460. PubMed
15. Irizarry T, DeVito Dabbs A, Curran CR. Patient portals and patient engagement: A state of the science review. J Med Internet Res. 2015;17(6):e148. doi:10.2196/jmir.4255. PubMed
16. Vawdrey DK, Wilcox LG, Collins SA, et al. A tablet computer application for patients to participate in their hospital care. AMIA Annu Symp Proc. 2011;2011:1428-1435. PubMed
17. Collins SA, Rozenblum R, Leung WY, et al. Acute care patient portals: A qualitative study of stakeholder perspectives on current practices. J Am Med Inform Assoc. 2016;24(e1):e9-e17. PubMed
18. Berger Z, Flickinger TE, Pfoh E, Martinez KA, Dy SM. Promoting engagement by patients and families to reduce adverse events in acute care settings: A systematic review. BMJ Qual Saf. 2014;23(7):548-555. PubMed
19. Forster AJ, Murff HJ, Peterson JF, Gandhi TK, Bates DW. The incidence and severity of adverse events affecting patients after discharge from the hospital. Ann Intern Med. 2003;138(3):161-167. PubMed
20. Griffin A, Skinner A, Thornhill J, Weinberger M. Patient Portals: Who uses them? What features do they use? And do they reduce hospital readmissions? Appl Clin Inform. 2016;7(2):489-501. PubMed
21. O’Leary KJ, Lohman ME, Culver E, Killarney A, Randy Smith G Jr, Liebovitz DM. The effect of tablet computers with a mobile patient portal application on hospitalized patients’ knowledge and activation. J Am Med Inform Assoc. 2016;23(1):159-165. PubMed
22. O’Leary KJ, Sharma RK, Killarney A, et al. Patients’ and Healthcare Providers’ Perceptions of a Mobile Portal Application for Hospitalized Patients. BMC Med Inform Decis Mak. 2016;16(1):123. PubMed
23. Pell JM, Mancuso M, Limon S, Oman K, Lin CT. Patient access to electronic health records during hospitalization. JAMA Intern Med. 2015;175(5):856-858. PubMed
24. Brown SM, Aboumatar HJ, Francis L, et al. Balancing digital information-sharing and patient privacy when engaging families in the intensive care unit. J Am Med Inform Assoc. 2016;23(5):995-1000. PubMed
25. Krishna S, Francisco BD, Balas EA, et al. Internet-enabled interactive multimedia asthma education program: A randomized trial. Pediatrics. 2003;111(3):503-510. PubMed
26. Fox MP. A systematic review of the literature reporting on studies that examined the impact of interactive, computer-based patient education programs. Patient Educ Couns. 2009;77(1):6-13. PubMed
27. Morgan ER, Laing K, McCarthy J, McCrate F, Seal MD. Using tablet-based technology in patient education about systemic therapy options for early-stage breast cancer: A pilot study. Curr Oncol. 2015;22(5):e364-e369. PubMed
28. Nehme J, El-Khani U, Chow A, Hakky S, Ahmed AR, Purkayastha S. The use of multimedia consent programs for surgical procedures: A systematic review. Surg Innov. 2013;20(1):13-23. PubMed
29. Waller A, Forshaw K, Carey M, et al. Optimizing patient preparation and surgical experience using eHealth technology. JMIR Med Inform. 2015;3(3):e29. PubMed
30. Abbott MB, Shaw P. Virtual nursing avatars: Nurse roles and evolving concepts of care. Online J Issues Nurs. 2016;21(3):7. PubMed
31. Cawthon C, Walia S, Osborn CY, Niesner KJ, Schnipper JL, Kripalani S. Improving care transitions: The patient perspective. J Health Commun. 2012;17 Suppl 3:312-324. PubMed
32. Bickmore TW, Pfeifer LM, Byron D, et al. Usability of conversational agents by patients with inadequate health literacy: Evidence from two clinical trials. J Health Commun. 2010;15 Suppl 2:197-210. PubMed
33. 2017;376(20):1905-1907. N Engl J Med.42. Mandl KD, Kohane IS. A 21st-century health IT system—creating a real-world information economy. PubMed
34. 2014;371(19):1803-1812.N Engl J Med41. Starmer AJ, Spector ND, Srivastava R, et al. Changes in medical errors after implementation of a handoff program. PubMed
35. 2016;24(1):153-161.J Am Med Inform Assoc.40. Kelly MM, Hoonakker PLT, Dean SM. Using an inpatient portal to engage families in pediatric hospital care. PubMed
36. 2017;171(4):372-381.JAMA Pediatr.39. Khan A, Coffey M, Litterer KP, et al. Families as partners in hospital error and adverse event surveillance. PubMed
37. 2017;17(4):389-402.Acad Pediatr.38. Khan A, Baird J, Rogers JE, et al. Parent and provider experience and shared understanding after a family-centered nighttime communication intervention. PubMed
38. 2016;6(6):319-329.Hosp Pediatr. 37. Khan A, Rogers JE, Forster CS, Furtak SL, Schuster MA, Landrigan CP. Communication and shared understanding between parents and resident-physicians at night. PubMed
39. 2016;11(9):615-619.J Hosp Med36. Figueroa JF, Schnipper JL, McNally K, Stade D, Lipsitz SR, Dalal AK. How often are hospitalized patients and providers on the same page with regard to the patient’s primary recovery goal for hospitalization? PubMed
40. 2013;8(7):414-417.J Hosp Med.35. Feldman HJ, Walker J, Li J, Delbanco T. OpenNotes: Hospitalists’ challenge and opportunity. PubMed
41. 2016;11(5):381-385.J Hosp Med.34. Dalal AK, Schnipper JL. Care team identification in the electronic health record: A critical first step for patient-centered communication.PubMed
42. 2016;24(e1):e178-e184.J Am Med Inform Assoc.33. Dalal AK, Schnipper J, Massaro A, et al. A web-based and mobile patient-centered “microblog” messaging platform to improve care team communication in acute care. PubMed
To realize the vision of patient-centered care, efforts are focusing on engaging patients and “care partners,” often a family caregiver, by using patient-facing technologies.1-4 Web-based patient portals linked to the electronic health record (EHR) provide patients and care partners with the ability to access personal health information online and to communicate with clinicians. In recent years, institutions have been increasing patient portal offerings to improve the patient experience, promote safety, and optimize healthcare delivery.5-7
DRIVERS OF ADOPTION
The adoption of patient portals has been driven by federal incentive programs (Meaningful Use), efforts by the Center for Medicare and Medicaid Services, and the Office of the National Coordinator for Health Information Technology to improve patient outcomes and the transition toward value-based reimbursement.2,8,9 The vast majority of use has been in ambulatory settings; use for acute care is nascent at best.10 Among hospitalized patients, few bring an internet-enabled computer or mobile device to access personal health records online.11 However, evidence suggests that care partners will use portals on behalf of acutely ill patients.4 As the Caregiver Advise, Record, Enable Act is implemented, hospitals will be required to identify patients’ care partners during hospitalization, inform them when the patient is ready for discharge, and provide self-management instructions during the transition home.12 In this context, understanding how best to leverage acute care patient portals will be important to institutions, clinicians, and vendors.
CURRENT KNOWLEDGE
The literature regarding acute care patient portals is rapidly growing.4,10 Hospitalized patients have unmet information and communication needs, and hospital-based clinicians struggle to meet these needs in a timely manner.13-15 In general, patients feel that using a mobile device to access personal health records has the potential to improve their experience.11 Early studies suggest that acute care patient portals can promote patient-centered communication and collaboration during hospitalization, including in intensive care settings.4,16,17 Furthermore, the use of acute care patient portals can improve perception of safety and quality, decrease anxiety, and increase understanding of health conditions.3,14 Although early evidence is promising, considerable knowledge gaps exist regarding patient outcomes over the acute episode of care.10,18
OUTSTANDING QUESTIONS
A clear area of interest is accessing acute care patient portals via mobile technology to engage patients during recovery from hospitalization.4,11 Although we do not yet know whether use during care transitions will favorably impact outcomes, given the high rate of harm after discharge, this seems likely.19 The few studies evaluating the effect on validated measures of engagement (Patient Activation Measure) and hospital readmissions have not shown demonstrable improvement to date.20,21 Clearly, optimizing acute care patient portals with regard to patient-clinician communication, as well as the type, timing, and format of information delivered, will be necessary to maximize value.4,22
From the patient’s perspective, there is much we can learn.23 Is the information that is presented pertinent, timely, and easy to understand? Will the use of portals detract from face-to-face interactions? Does greater transparency foster more accountability? Achieving an appropriate balance of digital health-information sharing for hospitalized patients is challenging given the sensitivity of patient data when diagnoses are uncertain and treatments are in flux.4,24 These questions must be answered as hospitals implement acute care patient portals.
ACUTE CARE PATIENT PORTAL TASK FORCE
To start addressing knowledge gaps, we established a task force of 21 leading researchers, informatics and policy experts, and clinical leaders. The Acute Care Patient Portal Task Force was a subgroup of the Libretto Consortium, a collaboration of 4 academic medical centers established by the Gordon and Betty Moore Foundation to design, develop, and implement technologies to engage patients, care partners, and providers in preventing harm in hospital settings. Initially, we were challenged with assessing stakeholders’ perspectives from early adopter institutions. We learned that acute care patient portals must offer an integrated experience across care settings, humanize the patient-clinician relationship, enable equitable access, and align with institutional strategy to promote sustainability.19
Cognitive Support
The opportunities identified include acclimatizing and assimilating to the hospital environment (reviewing policies and patient rights) and facilitating self-education and preparation by linking to personal health information and providing structured guidance at transitions.4 For example, a care partner of an incapacitated patient may watch a video to orient to the intensive care unit, navigate educational content linked to the patient’s admission diagnosis (pneumonia) entered in the EHR, view the timing of an upcoming imaging study (chest computed tomography scan), and complete a standardized checklist prior to discharge.
The main challenges we identified include ensuring accuracy of hospital-, unit-, and patient-level information, addressing information overload, configuring notification and display settings to optimize the user experience, presenting information at an appropriate health literacy level,4,21 and addressing security and privacy concerns when expanding access to family members.24
Respect and Boundaries
Opportunities identified include supporting individual learning styles by using interactive features of mobile devices to improve comprehension for visual, auditory, and tactile learners and reinforcing learning through the use of various types of digital media.25-27 For example, a visual learner may view a video tutorial for a newly prescribed medication. A tactile learner may prefer to use interactive graphical displays that exploit multidimensional touch capabilities of mobile devices to learn about active conditions or an upcoming procedure. An auditory learner may choose to use intelligent personal assistants to navigate their plan of care (“Hey Siri, what is my schedule for today?”). By addressing the learning preferences of patients and time constraints of clinicians, institutions can use acute care patient portals to promote more respectful interactions and collaborative decision-making during important care processes, such as obtaining surgical consent.28,29
We also identified opportunities to facilitate personalization by tailoring educational content and by enabling the use of patient-generated health data collected from wearable devices. For example, patients may prefer to interact with a virtual advocate to review discharge instructions (“Louis” in Project Re-Engineered Discharge) when personalized to their demographics and health literacy level.30-32 Patients may choose to upload step counts from wearable devices so that clinicians can monitor activity goals in preparation for discharge and while recovering afterwards. When supported in these ways, acute care patient portals allow patients to have more meaningful interactions with clinicians about diagnoses, treatments, prognosis, and goals for recovery.
The main challenges we identified include balancing interactions with technology and clinicians, ensuring clinicians understand how patients from different socioeconomic backgrounds use existing and newer technology to enhance self-management, assessing health and technology literacy, and understanding individual preferences for sharing patient-generated health data. Importantly, we must remain vigilant that patients will express concern about overdependence on technology, especially if it detracts from in-person interaction; our panelists emphasized that technology should never replace “human touch.”
Patient and Family Empowerment
The opportunities identified include promoting patient-centered communication by supporting a real-time and asynchronous dialogue among patients, care partners, and care team members (including ambulatory clinicians) while minimizing conversational silos4,33; displaying names, roles, and pictures of all care team members4,34; fostering transparency by sharing clinician documentation in progress notes and sign-outs35; ensuring accountability for a single plan of care spanning shift changes and handoffs, and providing a mechanism to enable real-time feedback.
Hospitalization can be a vulnerable and isolating experience, perpetuated by a lack of timely and coordinated communication with the care team. We identified opportunities to mitigate anxiety by promoting shared understanding when questions require input from multiple clinicians, when team members change, or when patients wish to communicate with their longitudinal ambulatory providers.4,34 For example, inviting patients to review clinicians’ progress notes should stimulate more open and meaningful communication.35 Furthermore, requesting that patients state their wishes, preferences, and goals could improve overall concordance with care team members.36,37 Empowering patients and care partners to voice their concerns, particularly those related to miscommunication, may mitigate harm propagated by handoffs, shift work, and weekend coverage.38,39 While reporting safety concerns represents a novel mechanism to augment medical-error reporting by clinicians alone,23,40 this strategy will be most effective when aligned with standardized communication initiatives (I-PASS) that have been proven to reduce medical errors and preventable adverse events and are being implemented nationally.41 Finally, by leveraging tools that facilitate instantaneous feedback, patients can be empowered to react to their plan (ranking skilled nursing facility options) as it is developed.
The main challenges we identified include managing expectations regarding the use of communication tools, accurately and reliably identifying care team members in the EHR,34 acknowledging patients as equal partners, ensuring patients receive a consistent message about diagnoses and therapies during handoffs and when multiple consultants have conflicting opinions about the plan,37 and addressing patient concerns fairly and respectfully.
RECOMMENDATIONS AND CONCLUSIONS
In summary, the patient-centered themes we identified serve as guiding principles for institutions, clinicians, and vendors who wish to use patient portals to improve the acute and postacute care patient experience. One central message resonates: Patients do not simply want access to their health information and the ability to communicate with the clinicians who furnish this information; they want to feel supported, respected, and empowered when doing so. It is only through partnership with patients and their advocates that we can fully realize the impact of digital technologies when patients are in their most vulnerable state.
Acknowledgments
The authors thank their colleagues and the patient and family advocates who contributed to this body of work as part of the Acute Care Patient Portal Task Force and conference: Brittany Couture; Ronen Rozenblum, PhD, MPH; Jennifer Prey, MPhil, MS, PhD; Kristin O’Reilly, RN, BSN, MPH; Patricia Q. Bourie, RN, MS, Cindy Dwyer, RN, BSN,S; Ryan Greysen, MD, MHS, MA; Jeffery Smith, MPP; Michael Gropper, MD, PhD; Patricia Dykes, RN, PhD; Martha B. Carnie; Jeffrey W. Mello; and Jane Webster.
Disclosure
Anuj K. Dalal, MD, David W. Bates, MD, MSc, and Sarah Collins, RN, PhD, are responsible for the conception or design of the work; acquisition, analysis, or interpretation of data; drafting the work or revising it critically for important intellectual content; and final approval of the version to be published. The authors agree to be accountable for all aspects of the work and to ensure that questions related to the accuracy or integrity of the work are appropriately investigated and resolved. This work was supported by a grant from the Gordon and Betty Moore Foundation ([GBMF] #4993). GBMF had no role in the design or conduct of the study; the collection, analysis, or interpretation of data; or preparation or review of the manuscript. The findings and conclusions in this report are those of the authors and do not necessarily represent the official position of GBMF. The authors report no conflicts of interest.
1. Sarkar U, Bates DW. Care partners and online patient portals. JAMA. 2014;311(4):357-358. PubMed
2. Grando MA, Rozenblum R, Bates DW, eds. Information Technology for Patient Empowerment in Healthcare, 1st Edition. Berlin: Walter de Gruyter Inc.; 2015.
3. Kelly MM, Hoonakker PLT, Dean SM. Using an inpatient portal to engage families in pediatric hospital care. J Am Med Inform Assoc. 2016;24(1):153-161. PubMed
4. Dalal AK, Dykes PC, Collins S, et al. A web-based, patient-centered toolkit to engage patients and caregivers in the acute care setting: A preliminary evaluation. J Am Med Inform Assoc. 2016;23(1):80-87. PubMed
5. Prey JE, Restaino S, Vawdrey DK. Providing hospital patients with access to their medical records. AMIA Annu Symp Proc. 2014;2014:1884-1893. PubMed
6. Herrin J, Harris KG, Kenward K, Hines S, Joshi MS, Frosch DL. Patient and family engagement: A survey of US hospital practices. BMJ Qual Saf. 2016;25(3):182-189. PubMed
7. Tom JO, Mangione-Smith R, Solomon C, Grossman DC. Integrated personal health record use: Association with parent-reported care experiences. Pediatrics. 2012;130(1):e183-e190. PubMed
8. Centers for Medicare & Medicaid Services (CMS), HHS. Medicare and Medicaid Programs; Electronic Health Record Incentive Program-Stage 2. Federal Register Final Rule. Sect. 170; 2012. https://www.federalregister.gov/documents/2012/03/07/2012-4443/medicare-and-medicaid-programs-electronic-health-record-incentive-program-stage-2. Accessed March 1, 2017.
9. Centers for Medicare & Medicaid Services (CMS), HHS. Medicare program; merit-based incentive payment system (MIPS) and alternative payment model (APM) incentive under the physician fee schedule, and criteria for physician-focused payment models. Final rule with comment period. Fed Regist. 2016;81(214):77008-77831. PubMed
10. Prey JE, Woollen J, Wilcox L, et al. Patient engagement in the inpatient setting: A systematic review. J Am Med Informat Assoc. 2014;21(4):742-750. PubMed
11. Ludwin S, Greysen SR. Use of smartphones and mobile devices in hospitalized patients: Untapped opportunities for inpatient engagement. J Hosp Med. 2015;10(7):459-461. PubMed
12. Coleman EA. Family caregivers as partners in care transitions: The caregiver advise record and enable act. J Hosp Med. 2016;11(12):883-885. PubMed
13. Kaziunas E, Hanauer DA, Ackerman MS, Choi SW. Identifying unmet informational needs in the inpatient setting to increase patient and caregiver engagement in the context of pediatric hematopoietic stem cell transplantation. J Am Med Inform Assoc. 2016;23(1):94-104. PubMed
14. Woollen J, Prey J, Wilcox L, et al. Patient experiences using an inpatient personal health record. Appl Clin Inform. 2016;7(2):446-460. PubMed
15. Irizarry T, DeVito Dabbs A, Curran CR. Patient portals and patient engagement: A state of the science review. J Med Internet Res. 2015;17(6):e148. doi:10.2196/jmir.4255. PubMed
16. Vawdrey DK, Wilcox LG, Collins SA, et al. A tablet computer application for patients to participate in their hospital care. AMIA Annu Symp Proc. 2011;2011:1428-1435. PubMed
17. Collins SA, Rozenblum R, Leung WY, et al. Acute care patient portals: A qualitative study of stakeholder perspectives on current practices. J Am Med Inform Assoc. 2016;24(e1):e9-e17. PubMed
18. Berger Z, Flickinger TE, Pfoh E, Martinez KA, Dy SM. Promoting engagement by patients and families to reduce adverse events in acute care settings: A systematic review. BMJ Qual Saf. 2014;23(7):548-555. PubMed
19. Forster AJ, Murff HJ, Peterson JF, Gandhi TK, Bates DW. The incidence and severity of adverse events affecting patients after discharge from the hospital. Ann Intern Med. 2003;138(3):161-167. PubMed
20. Griffin A, Skinner A, Thornhill J, Weinberger M. Patient Portals: Who uses them? What features do they use? And do they reduce hospital readmissions? Appl Clin Inform. 2016;7(2):489-501. PubMed
21. O’Leary KJ, Lohman ME, Culver E, Killarney A, Randy Smith G Jr, Liebovitz DM. The effect of tablet computers with a mobile patient portal application on hospitalized patients’ knowledge and activation. J Am Med Inform Assoc. 2016;23(1):159-165. PubMed
22. O’Leary KJ, Sharma RK, Killarney A, et al. Patients’ and Healthcare Providers’ Perceptions of a Mobile Portal Application for Hospitalized Patients. BMC Med Inform Decis Mak. 2016;16(1):123. PubMed
23. Pell JM, Mancuso M, Limon S, Oman K, Lin CT. Patient access to electronic health records during hospitalization. JAMA Intern Med. 2015;175(5):856-858. PubMed
24. Brown SM, Aboumatar HJ, Francis L, et al. Balancing digital information-sharing and patient privacy when engaging families in the intensive care unit. J Am Med Inform Assoc. 2016;23(5):995-1000. PubMed
25. Krishna S, Francisco BD, Balas EA, et al. Internet-enabled interactive multimedia asthma education program: A randomized trial. Pediatrics. 2003;111(3):503-510. PubMed
26. Fox MP. A systematic review of the literature reporting on studies that examined the impact of interactive, computer-based patient education programs. Patient Educ Couns. 2009;77(1):6-13. PubMed
27. Morgan ER, Laing K, McCarthy J, McCrate F, Seal MD. Using tablet-based technology in patient education about systemic therapy options for early-stage breast cancer: A pilot study. Curr Oncol. 2015;22(5):e364-e369. PubMed
28. Nehme J, El-Khani U, Chow A, Hakky S, Ahmed AR, Purkayastha S. The use of multimedia consent programs for surgical procedures: A systematic review. Surg Innov. 2013;20(1):13-23. PubMed
29. Waller A, Forshaw K, Carey M, et al. Optimizing patient preparation and surgical experience using eHealth technology. JMIR Med Inform. 2015;3(3):e29. PubMed
30. Abbott MB, Shaw P. Virtual nursing avatars: Nurse roles and evolving concepts of care. Online J Issues Nurs. 2016;21(3):7. PubMed
31. Cawthon C, Walia S, Osborn CY, Niesner KJ, Schnipper JL, Kripalani S. Improving care transitions: The patient perspective. J Health Commun. 2012;17 Suppl 3:312-324. PubMed
32. Bickmore TW, Pfeifer LM, Byron D, et al. Usability of conversational agents by patients with inadequate health literacy: Evidence from two clinical trials. J Health Commun. 2010;15 Suppl 2:197-210. PubMed
33. 2017;376(20):1905-1907. N Engl J Med.42. Mandl KD, Kohane IS. A 21st-century health IT system—creating a real-world information economy. PubMed
34. 2014;371(19):1803-1812.N Engl J Med41. Starmer AJ, Spector ND, Srivastava R, et al. Changes in medical errors after implementation of a handoff program. PubMed
35. 2016;24(1):153-161.J Am Med Inform Assoc.40. Kelly MM, Hoonakker PLT, Dean SM. Using an inpatient portal to engage families in pediatric hospital care. PubMed
36. 2017;171(4):372-381.JAMA Pediatr.39. Khan A, Coffey M, Litterer KP, et al. Families as partners in hospital error and adverse event surveillance. PubMed
37. 2017;17(4):389-402.Acad Pediatr.38. Khan A, Baird J, Rogers JE, et al. Parent and provider experience and shared understanding after a family-centered nighttime communication intervention. PubMed
38. 2016;6(6):319-329.Hosp Pediatr. 37. Khan A, Rogers JE, Forster CS, Furtak SL, Schuster MA, Landrigan CP. Communication and shared understanding between parents and resident-physicians at night. PubMed
39. 2016;11(9):615-619.J Hosp Med36. Figueroa JF, Schnipper JL, McNally K, Stade D, Lipsitz SR, Dalal AK. How often are hospitalized patients and providers on the same page with regard to the patient’s primary recovery goal for hospitalization? PubMed
40. 2013;8(7):414-417.J Hosp Med.35. Feldman HJ, Walker J, Li J, Delbanco T. OpenNotes: Hospitalists’ challenge and opportunity. PubMed
41. 2016;11(5):381-385.J Hosp Med.34. Dalal AK, Schnipper JL. Care team identification in the electronic health record: A critical first step for patient-centered communication.PubMed
42. 2016;24(e1):e178-e184.J Am Med Inform Assoc.33. Dalal AK, Schnipper J, Massaro A, et al. A web-based and mobile patient-centered “microblog” messaging platform to improve care team communication in acute care. PubMed
© 2017 Society of Hospital Medicine
Reconsidering Hospital Readmission Measures
Hospital readmission rates are a consequential and contentious measure of hospital quality. Readmissions within 30 days of hospital discharge are part of the Centers for Medicare & Medicaid Services (CMS) Value-Based Purchasing Program and are publicly reported. Hospital-wide readmissions and condition-specific readmissions are heavily weighted by US News & World Report in its hospital rankings and in the new CMS Five-Star Quality Rating System.1 However, clinicians and researchers question the construct validity of current readmission measures.2,3
The focus on readmissions began in 2009 when Jencks et al.4 reported that 20% of Medicare patients were readmitted within 30 days after hospital discharge. Policy makers embraced readmission reduction, assuming that a hospital readmission so soon after discharge reflected poor quality of hospital care and that, with focused efforts, hospitals could reduce readmissions and save CMS money. In 2010, the Affordable Care Act introduced an initiative to reduce readmissions and, in 2012, the Hospital Readmission Reduction Program was implemented, financially penalizing hospitals with higher-than-expected readmission rates for patients hospitalized with principal diagnoses of heart failure, myocardial infarction, and pneumonia.5 Readmission measures have since proliferated and now include pay-for-performance metrics for hospitalizations for chronic obstructive pulmonary disease (COPD), coronary artery bypass grafting, and total hip or knee arthroplasty. Measures are also reported for stroke patients and for “hospital-wide readmissions,” a catch-all measure intended to capture readmission rates across most diagnoses, with various exclusions intended to prevent counting planned readmissions (eg, hospitalization for cholecystectomy following a hospitalization for cholecystitis). These measures use claims data to construct hierarchical regression models at the patient and hospital levels, assuming that variation among readmission rates are due to hospital quality effects. The goal of this approach is to level the playing field to avoid penalizing hospitals for caring for sicker patients who are at higher risk for readmission for reasons unrelated to hospital care. Yet hospital readmissions are influenced by a complex set of variables that go well beyond hospital care, some of which may be better captured by existing models than others. Below we review several potential biases in the hospital readmission measures and offer policy recommendations to improve the accuracy of these measures.
Variation in a quality measure is influenced by the quality of the underlying data, the mix of patients served, bias in the performance measure, and the degree of systemic or random error.6 Hospital readmission rates are subject to multiple sources of variation, and true differences in the quality of care are often a much smaller source of this variation. A recent analysis of patient readmissions following general surgery found that the majority were unrelated to suboptimal medical care.7 Consider 3 scenarios in which a patient with COPD is readmitted 22 days after discharge. In hospital 1, the patient was discharged without a prescription for a steroid inhaler. In hospital 2, the patient was discharged on a steroid inhaler, filled the prescription, and elected not to use it. In hospital 3, the patient was discharged on a steroid inhaler and was provided medical assistance to fill the prescription but still could not afford the $15 copay. In all 3 scenarios, the hospital would be equally culpable under the current readmission measures, suffering financial and reputational penalties.
Yet the hospitals in these scenarios are not equally culpable. Variation in the mix of patients and bias in the measure impacted performance. Hospital 1 should clearly be held accountable for the readmission. In the cases of hospitals 2 and 3, the situations are more nuanced. More education about COPD, financial investment by the hospital to cover a copay, or a different transitional care approach may have increased the likelihood of patient compliance, but, ultimately, hospitals 2 and 3 were impacted by personal health behaviors and access to public health services and financial assistance, and the readmissions were less within their control.8
To be valid, hospital readmission measures would need to ensure that all hospitals are similar in patient characteristics and in the need for an availability of public health services. Yet these factors vary among hospitals and cannot be accounted for by models that rely exclusively on patient-level variables, such as the nature and severity of illness. As a result, the existing readmission measures are biased against certain types of hospitals. Hospitals that treat a greater proportion of patients who are socioeconomically disadvantaged; who lack access to primary care, medical assistance, or public health programs; and who have substance abuse and mental health issues will have higher readmission rates. Hospitals that care for patients who fail initial treatments and require referral for complex care will also have higher readmission rates. These types of patients are not randomly distributed throughout our healthcare system. They are clustered at rural hospitals in underserved areas, certain urban health systems, safety net hospitals, and academic health centers. It is not surprising that readmission penalties have most severely impacted large academic hospitals that care for disadvantaged populations.2 These penalties may have unintended consequences, reducing a hospital’s willingness to care for disadvantaged populations.
While these biases may unfairly harm hospitals caring for disadvantaged patients, the readmission measures may also indirectly harm patients. Low hospital readmission rates are not associated with reduced mortality and, in some instances, track with higher mortality.9-11 This may result from measurement factors (patients who die cannot be readmitted), from neighborhood socioeconomic status (SES) factors that may impact readmissions more,12 or from actual patient harm (some patients need acute care following discharge and may have worse outcomes if that care is delayed).11 Doctors have long recognized this potential risk; empiric evidence now supports them. While mortality measures may also be impacted by sociodemographic variables,13 whether to adjust for SES should be defined by the purpose of the measure. If the measure is meant to evaluate hospital quality (or utilization in the case of readmissions), adjusting for SES is appropriate because it is unrealistic to expect a health system to reduce income inequality and provide safe housing. Failure to adjust for SES, which has a large impact on outcomes, may mask a quality of care issue. Conversely, if the purpose of a measure is for a community to improve population health, then it should not be adjusted for SES because the community could adjust for income inequality.
Despite the complex ethical challenges created by the efforts to reduce readmissions, there has been virtually no public dialogue with patients, physicians, and policy makers regarding how to balance the trade-offs between reducing readmission and maintaining safety. Patients would likely value increased survival more than reduced readmissions, yet the current CMS Five-Star Rating System for hospital quality weighs readmissions equally with mortality in its hospital rankings, potentially misinforming patients. For example, many well-known academic medical centers score well (4 or 5 stars) on mortality and poorly (1 or 2 stars) on readmissions, resulting in a low or average overall score, calling into question face validity and confounding consumers struggling to make decisions about where to seek care. The Medicare Payment Advisory Commission’s Report to the Congress14 highlights the multiple significant systematic and random errors with the hospital readmission data.
Revisiting the Hospital Readmission Measures
Given significant bias in the hospital readmission measures and the ethical challenges imposed by reducing readmissions, potentially at the expense of survival, we believe CMS needs to take action to remedy the problem. First, CMS should drop hospital readmissions as a quality measure from its hospital rankings. Other hospital-rating groups and insurers should do the same. When included in payment schemes, readmissions should not be construed as a quality measure but as a utilization measure, like length of stay.
Second, the Department of Health & Human Services (HHS) should invest in maturing the hospital readmission measures to ensure construct, content, and criterion validity and reliability. No doubt the risk adjustment is complex and may be inherently limited using Medicare claims data. In the case of SES adjustment, for example, limited numbers of SES measures can be constructed from current data sources.8,13 There are other approaches to address this recommendation. For example, HHS could define a preventable readmission as one linked to some process or outcome of hospital care, such as whether the patient was discharged on an inhaler. The National Quality Forum used this approach to define a preventable venous thromboembolic event as one occurring when a patient did not receive appropriate prophylaxis. In this way, only hospital 1 in the 3 scenarios for the patient with COPD would be penalized. However, we recognize that it is not always simple to define specific process measures (eg, prescribing an inhaler) that link to readmission outcomes and that there may be other important yet hard-to-measure interventions (eg, patient and family education) that are important components of patient-centered care and readmission prevention. This is why readmissions are so challenging as a quality measure. If experts cannot define clinician behaviors that have a strong theory of change or are causally related to reduced readmissions, it is hard to call readmissions a modifiable quality measure. Another potential strategy to level the playing field would be to compare readmission rates across peer institutions only. For instance, tertiary-care safety net hospitals would be compared to one another and rural community hospitals would be compared to one another.14 Lastly, new data sources could be added to account for the social, community-level, public health, and personal health factors that heavily influence a patient’s risk for readmission, in addition to hospital-level factors. Appropriate methods will be needed to develop statistical models for risk adjustment; however, this is a complex topic and beyond the scope of the current paper.
Third, HHS could continue to use the current readmission measures as population health measures while supporting multistakeholder teams to better understand how people and their communities, public health agencies, insurers, and healthcare providers can collaborate to help patients thrive and avoid readmissions by addressing true defects in care and care coordination.
While it is understandable why policy makers chose to focus on hospital readmissions, and while we recognize that concerns about the measures were unknown when they were created, emerging evidence demonstrates that the current readmission measures (particularly when used as a quality metric) lack construct validity, contain significant bias and systematic errors, and create ethical tension by rewarding hospitals both financially and reputationally for turning away sick and socially disadvantaged patients who may, consequently, have adverse outcomes. Current readmission measures need to be reconsidered.
Acknowledgments
The authors thank Christine G. Holzmueller, BLA, with the Armstrong Institute for Patient Safety and Quality, Johns Hopkins Medicine, for her assistance in editing the manuscript and preparing it for journal submission.
Disclosure
Dr. Pronovost errs on the side of full disclosure and reports receiving grant or contract support from the Agency for Healthcare Research and Quality, the Gordon and Betty Moore Foundation (research related to patient safety and quality of care), the National Institutes of Health (acute lung injury research), and the American Medical Association Inc. (improve blood pressure control); honoraria from various healthcare organizations for speaking on patient safety and quality (the Leigh Bureau manages engagements); book royalties from the Penguin Group for his book Safe Patients, Smart Hospitals; and was receiving stock and fees to serve as a director for Cantel Medical up until 24 months ago. Dr. Pronovost is a founder of Patient Doctor Technologies, a startup company that seeks to enhance the partnership between patients and clinicians with an application called Doctella. Dr. Brotman, Dr. Hoyer, and Ms. Deutschendorf report no relevant conflicts of interest.
1. Centers for Medicare & Medicaid Services. Five-star quality rating system. https://www.cms.gov/medicare/provider-enrollment-and-certification/certificationandcomplianc/fsqrs.html. Accessed October 11, 2016.
2. Joynt KE, Jha AK. Characteristics of hospitals receiving penalties under the Hospital Readmissions Reduction Program. JAMA. 2013;309(4):342-343. PubMed
3. Boozary AS, Manchin J, 3rd, Wicker RF. The Medicare Hospital Readmissions Reduction Program: time for reform. JAMA. 2015;314(4):347-348. PubMed
4. Jencks SF, Williams MV, Coleman EA. Rehospitalizations among patients in the Medicare fee-for-service program. N Engl J Med. 2009;360(14):1418-1428. PubMed
5. Centers for Medicare & Medicaid Services. Readmissions Reduction Program (HRRP). https://www.cms.gov/medicare/medicare-fee-for-service-payment/acuteinpatientpps/readmissions-reduction-program.html. Accessed April 12, 2017.
6. Parker C, Schwamm LH, Fonarow GC, Smith EE, Reeves MJ. Stroke quality metrics: systematic reviews of the relationships to patient-centered outcomes and impact of public reporting. Stroke. 2012;43(1):155-162. PubMed
7. McIntyre LK, Arbabi S, Robinson EF, Maier RV. Analysis of risk factors for patient readmission 30 days following discharge from general surgery. JAMA Surg. 2016;151(9):855-861. PubMed
8. Sheingold SH, Zuckerman R, Shartzer A. Understanding Medicare hospital readmission rates and differing penalties between safety-net and other hospitals. Health Aff (Millwood). 2016;35(1):124-131. PubMed
9. Brotman DJ, Hoyer EH, Leung C, Lepley D, Deutschendorf A. Associations between hospital-wide readmission rates and mortality measures at the hospital level: are hospital-wide readmissions a measure of quality? J Hosp Med. 2016;11(9):650-651. PubMed
10. Krumholz HM, Lin Z, Keenan PS, et al. Relationship between hospital readmission and mortality rates for patients hospitalized with acute myocardial infarction, heart failure, or pneumonia. JAMA. 2013;309(6):587-593. PubMed
11. Fan VS, Gaziano JM, Lew R, et al. A comprehensive care management program to prevent chronic obstructive pulmonary disease hospitalizations: a randomized, controlled trial. Ann Intern Med. 2012;156(10):673-683. PubMed
12. Bikdeli B, Wayda B, Bao H, et al. Place of residence and outcomes of patients with heart failure: analysis from the Telemonitoring to Improve Heart Failure Outcomes Trial. Circ Cardiovasc Qual Outcomes. 2014;7(5):749-756. PubMed
13. Bernheim SM, Parzynski CS, Horwitz L, et al. Accounting for patients’ socioeconomic status does not change hospital readmission rates. Health Aff (Millwood). 2016;35(8):1461-1470. PubMed
14. Medicare Payment Advisory Commission. Refining the Hospital Readmissions Reduction Program. In: Report to the Congress: Medicare and the Health Care Delivery System, Chapter 4. June 2013. PubMed
Hospital readmission rates are a consequential and contentious measure of hospital quality. Readmissions within 30 days of hospital discharge are part of the Centers for Medicare & Medicaid Services (CMS) Value-Based Purchasing Program and are publicly reported. Hospital-wide readmissions and condition-specific readmissions are heavily weighted by US News & World Report in its hospital rankings and in the new CMS Five-Star Quality Rating System.1 However, clinicians and researchers question the construct validity of current readmission measures.2,3
The focus on readmissions began in 2009 when Jencks et al.4 reported that 20% of Medicare patients were readmitted within 30 days after hospital discharge. Policy makers embraced readmission reduction, assuming that a hospital readmission so soon after discharge reflected poor quality of hospital care and that, with focused efforts, hospitals could reduce readmissions and save CMS money. In 2010, the Affordable Care Act introduced an initiative to reduce readmissions and, in 2012, the Hospital Readmission Reduction Program was implemented, financially penalizing hospitals with higher-than-expected readmission rates for patients hospitalized with principal diagnoses of heart failure, myocardial infarction, and pneumonia.5 Readmission measures have since proliferated and now include pay-for-performance metrics for hospitalizations for chronic obstructive pulmonary disease (COPD), coronary artery bypass grafting, and total hip or knee arthroplasty. Measures are also reported for stroke patients and for “hospital-wide readmissions,” a catch-all measure intended to capture readmission rates across most diagnoses, with various exclusions intended to prevent counting planned readmissions (eg, hospitalization for cholecystectomy following a hospitalization for cholecystitis). These measures use claims data to construct hierarchical regression models at the patient and hospital levels, assuming that variation among readmission rates are due to hospital quality effects. The goal of this approach is to level the playing field to avoid penalizing hospitals for caring for sicker patients who are at higher risk for readmission for reasons unrelated to hospital care. Yet hospital readmissions are influenced by a complex set of variables that go well beyond hospital care, some of which may be better captured by existing models than others. Below we review several potential biases in the hospital readmission measures and offer policy recommendations to improve the accuracy of these measures.
Variation in a quality measure is influenced by the quality of the underlying data, the mix of patients served, bias in the performance measure, and the degree of systemic or random error.6 Hospital readmission rates are subject to multiple sources of variation, and true differences in the quality of care are often a much smaller source of this variation. A recent analysis of patient readmissions following general surgery found that the majority were unrelated to suboptimal medical care.7 Consider 3 scenarios in which a patient with COPD is readmitted 22 days after discharge. In hospital 1, the patient was discharged without a prescription for a steroid inhaler. In hospital 2, the patient was discharged on a steroid inhaler, filled the prescription, and elected not to use it. In hospital 3, the patient was discharged on a steroid inhaler and was provided medical assistance to fill the prescription but still could not afford the $15 copay. In all 3 scenarios, the hospital would be equally culpable under the current readmission measures, suffering financial and reputational penalties.
Yet the hospitals in these scenarios are not equally culpable. Variation in the mix of patients and bias in the measure impacted performance. Hospital 1 should clearly be held accountable for the readmission. In the cases of hospitals 2 and 3, the situations are more nuanced. More education about COPD, financial investment by the hospital to cover a copay, or a different transitional care approach may have increased the likelihood of patient compliance, but, ultimately, hospitals 2 and 3 were impacted by personal health behaviors and access to public health services and financial assistance, and the readmissions were less within their control.8
To be valid, hospital readmission measures would need to ensure that all hospitals are similar in patient characteristics and in the need for an availability of public health services. Yet these factors vary among hospitals and cannot be accounted for by models that rely exclusively on patient-level variables, such as the nature and severity of illness. As a result, the existing readmission measures are biased against certain types of hospitals. Hospitals that treat a greater proportion of patients who are socioeconomically disadvantaged; who lack access to primary care, medical assistance, or public health programs; and who have substance abuse and mental health issues will have higher readmission rates. Hospitals that care for patients who fail initial treatments and require referral for complex care will also have higher readmission rates. These types of patients are not randomly distributed throughout our healthcare system. They are clustered at rural hospitals in underserved areas, certain urban health systems, safety net hospitals, and academic health centers. It is not surprising that readmission penalties have most severely impacted large academic hospitals that care for disadvantaged populations.2 These penalties may have unintended consequences, reducing a hospital’s willingness to care for disadvantaged populations.
While these biases may unfairly harm hospitals caring for disadvantaged patients, the readmission measures may also indirectly harm patients. Low hospital readmission rates are not associated with reduced mortality and, in some instances, track with higher mortality.9-11 This may result from measurement factors (patients who die cannot be readmitted), from neighborhood socioeconomic status (SES) factors that may impact readmissions more,12 or from actual patient harm (some patients need acute care following discharge and may have worse outcomes if that care is delayed).11 Doctors have long recognized this potential risk; empiric evidence now supports them. While mortality measures may also be impacted by sociodemographic variables,13 whether to adjust for SES should be defined by the purpose of the measure. If the measure is meant to evaluate hospital quality (or utilization in the case of readmissions), adjusting for SES is appropriate because it is unrealistic to expect a health system to reduce income inequality and provide safe housing. Failure to adjust for SES, which has a large impact on outcomes, may mask a quality of care issue. Conversely, if the purpose of a measure is for a community to improve population health, then it should not be adjusted for SES because the community could adjust for income inequality.
Despite the complex ethical challenges created by the efforts to reduce readmissions, there has been virtually no public dialogue with patients, physicians, and policy makers regarding how to balance the trade-offs between reducing readmission and maintaining safety. Patients would likely value increased survival more than reduced readmissions, yet the current CMS Five-Star Rating System for hospital quality weighs readmissions equally with mortality in its hospital rankings, potentially misinforming patients. For example, many well-known academic medical centers score well (4 or 5 stars) on mortality and poorly (1 or 2 stars) on readmissions, resulting in a low or average overall score, calling into question face validity and confounding consumers struggling to make decisions about where to seek care. The Medicare Payment Advisory Commission’s Report to the Congress14 highlights the multiple significant systematic and random errors with the hospital readmission data.
Revisiting the Hospital Readmission Measures
Given significant bias in the hospital readmission measures and the ethical challenges imposed by reducing readmissions, potentially at the expense of survival, we believe CMS needs to take action to remedy the problem. First, CMS should drop hospital readmissions as a quality measure from its hospital rankings. Other hospital-rating groups and insurers should do the same. When included in payment schemes, readmissions should not be construed as a quality measure but as a utilization measure, like length of stay.
Second, the Department of Health & Human Services (HHS) should invest in maturing the hospital readmission measures to ensure construct, content, and criterion validity and reliability. No doubt the risk adjustment is complex and may be inherently limited using Medicare claims data. In the case of SES adjustment, for example, limited numbers of SES measures can be constructed from current data sources.8,13 There are other approaches to address this recommendation. For example, HHS could define a preventable readmission as one linked to some process or outcome of hospital care, such as whether the patient was discharged on an inhaler. The National Quality Forum used this approach to define a preventable venous thromboembolic event as one occurring when a patient did not receive appropriate prophylaxis. In this way, only hospital 1 in the 3 scenarios for the patient with COPD would be penalized. However, we recognize that it is not always simple to define specific process measures (eg, prescribing an inhaler) that link to readmission outcomes and that there may be other important yet hard-to-measure interventions (eg, patient and family education) that are important components of patient-centered care and readmission prevention. This is why readmissions are so challenging as a quality measure. If experts cannot define clinician behaviors that have a strong theory of change or are causally related to reduced readmissions, it is hard to call readmissions a modifiable quality measure. Another potential strategy to level the playing field would be to compare readmission rates across peer institutions only. For instance, tertiary-care safety net hospitals would be compared to one another and rural community hospitals would be compared to one another.14 Lastly, new data sources could be added to account for the social, community-level, public health, and personal health factors that heavily influence a patient’s risk for readmission, in addition to hospital-level factors. Appropriate methods will be needed to develop statistical models for risk adjustment; however, this is a complex topic and beyond the scope of the current paper.
Third, HHS could continue to use the current readmission measures as population health measures while supporting multistakeholder teams to better understand how people and their communities, public health agencies, insurers, and healthcare providers can collaborate to help patients thrive and avoid readmissions by addressing true defects in care and care coordination.
While it is understandable why policy makers chose to focus on hospital readmissions, and while we recognize that concerns about the measures were unknown when they were created, emerging evidence demonstrates that the current readmission measures (particularly when used as a quality metric) lack construct validity, contain significant bias and systematic errors, and create ethical tension by rewarding hospitals both financially and reputationally for turning away sick and socially disadvantaged patients who may, consequently, have adverse outcomes. Current readmission measures need to be reconsidered.
Acknowledgments
The authors thank Christine G. Holzmueller, BLA, with the Armstrong Institute for Patient Safety and Quality, Johns Hopkins Medicine, for her assistance in editing the manuscript and preparing it for journal submission.
Disclosure
Dr. Pronovost errs on the side of full disclosure and reports receiving grant or contract support from the Agency for Healthcare Research and Quality, the Gordon and Betty Moore Foundation (research related to patient safety and quality of care), the National Institutes of Health (acute lung injury research), and the American Medical Association Inc. (improve blood pressure control); honoraria from various healthcare organizations for speaking on patient safety and quality (the Leigh Bureau manages engagements); book royalties from the Penguin Group for his book Safe Patients, Smart Hospitals; and was receiving stock and fees to serve as a director for Cantel Medical up until 24 months ago. Dr. Pronovost is a founder of Patient Doctor Technologies, a startup company that seeks to enhance the partnership between patients and clinicians with an application called Doctella. Dr. Brotman, Dr. Hoyer, and Ms. Deutschendorf report no relevant conflicts of interest.
1. Centers for Medicare & Medicaid Services. Five-star quality rating system. https://www.cms.gov/medicare/provider-enrollment-and-certification/certificationandcomplianc/fsqrs.html. Accessed October 11, 2016.
2. Joynt KE, Jha AK. Characteristics of hospitals receiving penalties under the Hospital Readmissions Reduction Program. JAMA. 2013;309(4):342-343. PubMed
3. Boozary AS, Manchin J, 3rd, Wicker RF. The Medicare Hospital Readmissions Reduction Program: time for reform. JAMA. 2015;314(4):347-348. PubMed
4. Jencks SF, Williams MV, Coleman EA. Rehospitalizations among patients in the Medicare fee-for-service program. N Engl J Med. 2009;360(14):1418-1428. PubMed
5. Centers for Medicare & Medicaid Services. Readmissions Reduction Program (HRRP). https://www.cms.gov/medicare/medicare-fee-for-service-payment/acuteinpatientpps/readmissions-reduction-program.html. Accessed April 12, 2017.
6. Parker C, Schwamm LH, Fonarow GC, Smith EE, Reeves MJ. Stroke quality metrics: systematic reviews of the relationships to patient-centered outcomes and impact of public reporting. Stroke. 2012;43(1):155-162. PubMed
7. McIntyre LK, Arbabi S, Robinson EF, Maier RV. Analysis of risk factors for patient readmission 30 days following discharge from general surgery. JAMA Surg. 2016;151(9):855-861. PubMed
8. Sheingold SH, Zuckerman R, Shartzer A. Understanding Medicare hospital readmission rates and differing penalties between safety-net and other hospitals. Health Aff (Millwood). 2016;35(1):124-131. PubMed
9. Brotman DJ, Hoyer EH, Leung C, Lepley D, Deutschendorf A. Associations between hospital-wide readmission rates and mortality measures at the hospital level: are hospital-wide readmissions a measure of quality? J Hosp Med. 2016;11(9):650-651. PubMed
10. Krumholz HM, Lin Z, Keenan PS, et al. Relationship between hospital readmission and mortality rates for patients hospitalized with acute myocardial infarction, heart failure, or pneumonia. JAMA. 2013;309(6):587-593. PubMed
11. Fan VS, Gaziano JM, Lew R, et al. A comprehensive care management program to prevent chronic obstructive pulmonary disease hospitalizations: a randomized, controlled trial. Ann Intern Med. 2012;156(10):673-683. PubMed
12. Bikdeli B, Wayda B, Bao H, et al. Place of residence and outcomes of patients with heart failure: analysis from the Telemonitoring to Improve Heart Failure Outcomes Trial. Circ Cardiovasc Qual Outcomes. 2014;7(5):749-756. PubMed
13. Bernheim SM, Parzynski CS, Horwitz L, et al. Accounting for patients’ socioeconomic status does not change hospital readmission rates. Health Aff (Millwood). 2016;35(8):1461-1470. PubMed
14. Medicare Payment Advisory Commission. Refining the Hospital Readmissions Reduction Program. In: Report to the Congress: Medicare and the Health Care Delivery System, Chapter 4. June 2013. PubMed
© 2017 Society of Hospital Medicine
The SDM 3 Circle Model: A Literature Synthesis and Adaptation for Shared Decision Making in the Hospital
Evolving models of medical care emphasize the importance of shared decision-making (SDM) on practical and ethical grounds.1-3 SDM is a cognitive, emotional, and relational process in which provider and patient collaborate in a decision after discussing the options, evidence, and potential benefits and harms, while considering the patient’s values, preferences, and circumstances.4 Categories of decisions include information gathering, pharmacotherapy, therapeutic procedures, consultations and referrals, counseling and precautions (eg, behavior modification, goals of care, end-of-life care), and care transitions (eg, transfer or discharge to home).5 Decisions span the continuum of urgency and may be anticipatory or reactive.6 The patient’s environment7,8 and the provider-patient relationship9 have been explicitly incorporated into the ideal SDM process.
SDM has been conceptually and empirically linked with evidence-based practice,1 although the relationship between SDM and clinical outcomes is less clear.10,11 SDM is desired by patients12 and may bolster patient satisfaction, trust, and adherence.13,14 Limited evidence suggests SDM could reduce inappropriate treatments and testing,15 decrease adverse events,16 and promote greater patient safety,17-19 but more well-designed studies are needed.
Provider, patient, and contextual factors influence the extent to which SDM occurs. Providers commonly cite time constraints and perceived lack of applicability to certain clinical scenarios or settings.19 Providers may also lack training and competency in SDM skills.2 Patients may be reluctant to disagree with their provider or fear being mislabeled as “difficult.”20 When faced with high stakes or emotionally charged decisions, patients’ surrogates may prefer to have the provider serve as the sole decision-maker.21 Contextually, there may be limited evidence, high clinical stake, or a number of equally beneficial (or harmful) options.22,23
Current SDM models guide clinicians in determining when and how to engage in SDM, yet models vary widely. For example, Elwyn’s model emphasizes the ethical imperative for SDM and outlines 3 SDM steps: introduce choice, describe options, and help patients explore preferences and make decisions.3 Using a multimodal review and clinician-driven feedback, Legaré’s “IP-SDM” (Interprofessional Shared Decision Making) model illustrates the roles of the interprofessional team and emphasizes the influence of environmental factors on decision-making.24 Recent systematic reviews of SDM models have attempted to identify common elements, language, and processes.2,25,26
This study reviews leading SDM models to construct a more environmentally and contextually sensitive model that is appropriate for the hospital setting. Although developed with hospital medicine in mind, a synthesized model that attends to environmental and systems context, provider/team factors, patient factors, and disease/medical variables is highly relevant in any setting where SDM occurs.
METHODS
We constructed a model that is appropriate for SDM across the care continuum through the following 3-part, iterative group process: (1) a comprehensive literature review of existing SDM models, (2) synthesis and inductive development of a new draft model, and (3) modification of the new model using feedback from SDM experts.
Narrative Literature Review
We performed a structured, comprehensive literature review 29 to compare and contrast existing SDM models and frameworks. Leading models and key concepts were first identified using 2 systematic reviews 25,26 and a comprehensive review.2 In order to extend the search to 2016 and include any overlooked articles, a PubMed search was performed using the terms “shared decision-making” or “medical decision-making” AND “model” or “theory” or “framework” for English-language articles from inception to 2016. The search was repeated using Google Scholar to verify results and obtain the number of citations per article as a proxy for impact and saturation. In order to minimize possible search error or selection bias, reference lists in high-impact publications were hand searched to identify additional articles. All abstracts were manually reviewed by 2 independent authors for relevance and later inclusion in our group iterative process. A priori inclusion criteria were limited to provider-patient SDM (ie, not clinical reasoning or making decisions in general) and complete descriptions of a conceptual model or framework. Additional publications suggested by experts (eg, perspective pieces or terminology summaries) were also reviewed.
Model Development and Expert Review
The draft model and a standardized set of questions (supplementary Appendix A) were then emailed to all first and last authors of the reviewed studies (Table 2). Expert responses were compiled, coded, and analyzed independently by 3 coauthors. Inductive coding techniques and a constant comparative approach were used to code the qualitative data.32 Preliminary findings were shared among the 3 reviewers and discussed until consensus was reached on emerging themes and implications for the new SDM model and multistep SDM pathway. A master list of suggested revisions was shared with the larger authorship team and the model was refined accordingly.
RESULTS
Two previously published systematic reviews25,26 identified 494 articles, 161 conceptual definitions of SDM, and over 30 separate key concepts. The additional PubMed search garnered 1957 publications (with many overlapping from the systematic reviews). A manual search of the systematic reviews and PubMed abstracts identified 16 unique and complete decision-making models for further review. Hand searches of their citations yielded an additional 6 models for a total of 22 models.3,4,13,23,33-51 The majority of excluded articles described specific decision aids and small clinical studies, focused on only one step of the decision-making process, or were not otherwise relevant. The first (SR) and senior authors (JS) reviewed the 22 models for SDM relevance, generalizability, and content saturation, yielding a final sample of 9 SDM models. A subsequent Google Scholar search did not identify any new SDM models but 2 SDM theory papers1,52 and 2 commentaries53,54 were selected based on influence (ie, number of citations), expert recommendation, or coverage of a novel aspect of SDM. A total of 15 studies (9 SDM models + 6 reviews; Table 2) were used by our development team to create a synthesized SDM model. A 10th SDM model55 and 3 additional descriptive and normative studies8,56,57 were later added based on expert feedback and incorporated into our final SDM 3 Circle Model.
Expert Feedback
Twenty-one of 27 (78%) SDM expert authors responded to our e-mail request for feedback. The majority (62%) agreed with the basic elements of the model, including the environmental frame and the 3 domains. Some respondents viewed SDM as strictly a process between patient and provider independent of the disease, leading to refinement of the medical context category. Several experts emphasized the importance of SDM “set-up,” which includes the elicitation of patient preferences in how decisions are made and the extent of patient and/or surrogate involvement.
Several respondents identified time constraints (N = 2), acuity of disease (N = 3), and presence of multiple teams (N = 6) to be the significant factors distinguishing inpatient from outpatient SDM. For some experts, “team” referred to the interprofessional care team, whereas others referred to it as the collaboration among attending physicians and trainees. Experts noted that although the intensity and frequency of inpatient interactions could promote SDM, higher patient acuity and the urgency of decisions could negatively influence SDM and/or the patient’s ability to participate. Similarly, the presence of other team members may either impede or promote SDM by either contributing to miscommunication or bringing well-trained SDM experts to the bedside. Financial impact on patients and resource constraints were also noted as relevant. All of these elements have been incorporated into the final SDM 3 Circle Model and multistep SDM Pathway (Supplemental Appendix A and B).
The SDM 3 Circle Model
The SDM 3 Circle Model comprises 3 categories of SDM barriers and facilitators that intersect within the environmental frame of an inpatient ward or other setting: (1) provider/team, (2) patient/family, and (3) medical context. A Venn diagram visually represents the conceptual overlaps and distinctions among these categories that are all affected by the environment in which they occur (Supplemental Appendix A).
The patient/family circle mirrors prior SDM models that address the role of patient preferences in making decisions,3,4,12 with the explicit addition of the roles of families and surrogates as either decision-makers or influencers. This circle includes personal characteristics, such as cognitions (eg, beliefs, attitudes), emotions (eg, anxiety, hope), behaviors (eg, adherence, assertiveness), illness history (ie, subjective experience and understanding of one’s own medical history), and related social features (eg, culture, education, literacy, social supports).
Patient factors are not static over time or context. They occur within an environmental setting and are likely to be influenced by concurrent provider and medical variables (the second and third circles). Disease exacerbation leading to hospitalization or transfer to a subacute facility could dramatically shift the calculus a patient uses to determine preferences or activate dormant family dynamics. Strong provider-patient rapport (the overlap of patient and provider factors) may influence the development of trust and subsequent decisions.9 The type of disease or symptom presentation (circle 3–medical context) may further influence patient factors due to stigma, perceived vulnerability, or assumed prognosis.
The provider/team circle includes both individual and team-based factors falling into similar categories as the patient/family domain, such as cognitions, behavior, and social features; however, these factors include both personal (eg, the provider’s personal history, values, and beliefs) and professional (eg, past medical training, decision-making style, past experiences treating a disease) characteristics. Decisions may involve an interprofessional team representing a broad range of personalities and professional values. Decisions and decision-making processes may change over time as team composition changes, as level of provider expertise varies, or as environmental, patient, or disease/illness factors influence providers and teams.
Medical context includes factors related to the disease and the potential ways to evaluate or manage it. Examples of disease factors include acuity, symptoms, course, and prognosis. Most obviously, disease factors will influence the content of risk-benefit discussions but may also affect the SDM process through disease stigma or cultural assumptions about etiology. Disease evaluation factors include the psychometrics of a diagnostic screen, invasive and noninvasive testing, or a range of different preventive or therapeutic interventions. Treatment variables include the available options, costs, and risk of complications. Medical context variables evolve as evidence-based medicine and biomedical knowledge increase and new treatment options emerge.
Each of the 3 circles operates within the same environmental frame, such as an inpatient medicine ward, which itself operates within a hospital and the broader healthcare system. This frame exerts overt and subtle influences on providers, patients, and even the medical context. Features of the environmental frame include culture (eg, values, preferences, social norms), university versus community setting, incentives, formularies, quality improvement campaigns, regulations, and technology use.
The dynamic interactivity of the environmental frame and the 3 circles inform the process of SDM and highlight key differences that may occur between care settings. Certain features may predominate in different situations, but all will influence and be influenced by features of other circles during the course of SDM.
Application of the SDM 3 Circle Model
Although the SDM process is similar across clinical settings, its operationalization varies in important ways for hospital decision-making. In some situations, patients may defer all decisions to their providers or decisions may be considered with multiple providers concurrently. In the hospital, SDM may not be possible, such as in emergency surgery for an obtunded patient or when the patient and surrogate are not available or able to participate in the decision. Therefore, providers may bypass the steps of information sharing and discussion of the decision (big arrow in the Figure and supplemental
DISCUSSION
The SDM 3 Circle Model provides a concise, ecologically valid, contextually sensitive representation of SDM that synthesizes and extends beyond recent SDM models.3,7,40 Each circle represents the forces that influence SDM across settings. Although the multistep SDM pathway occurs similarly in outpatient and inpatient settings, how each step is operationalized and how each “circle” exerts its influence may differ and warrants further consideration throughout the SDM process. For example, hospitalized patients may have greater stress and anxiety, have more family involvement, be more motivated to adhere to treatment, and may be under greater financial and social pressures. Unlike outpatient primary care, patients are less likely to have an existing relationship with their inpatient providers, potentially compromising patient confidence in the provider, and necessitating expeditious trust building.
The SDM 3 Circle Model captures “setting” in both the broader environmental frame and within the provider/team category of variables. The frame also captures health system and broader community variables that may influence the practicality of some medical decisions. Within this essential frame, all 3 categories of patient, provider, and medical context are included as part of the SDM process. A better understanding of their interplay may be of great value for clinicians, researchers, administrators, and policy makers who wish to further study and promote SDM. Both the SDM 3 Circle Model and its accompanying pathway (Figures 1 and 2) highlight opportunities for intervention and research, and may drive quality improvement initiatives to improve clinical outcomes.
Limitations
We did not perform a new systematic review, potentially omitting lesser-known publications. We mitigated this risk by using recent systematic reviews, searching multiple databases, hand searching citation lists, and making inquiries to SDM experts. Our selection of models used as a foundation for the synthesized model was based on consensus, which included an element of subjective, clinical judgment. Our SDM expert sample was small and limited to authors of the papers we reviewed, potentially restricting the range of viewpoints received. Lastly, the SDM 3 Circle Model highlights key concept areas rather than all possible factors that influence SDM.
CONCLUSIONS
We present a peer-reviewed, literature-based SDM model capable of accounting for the unique circumstances and challenges of SDM in the hospital. The SDM 3 Circle Model identifies the primary categories of variables thought to influence SDM, places them in a shared environmental frame, and visually represents their interactive nature. A multistep representation of the SDM process further illustrates how the unique features and challenges of hospitalization might exert influence at various points as patients and providers reach a shared decision. As the interrelationships of patient and provider/team, medical context, and the environmental frame in which they occur are better understood, more effective and targeted interventions to promote SDM can be developed and evaluated.
Acknowledgments
The authors would like to thank Evans Whitaker for his assistance with the literature review and the Patient Engagement Project volunteers for their support and assistance with data collection.
Disclosure
Financial support for this study was provided entirely by a grant from NIH/NCCIH (grant #R25 AT006573, awarded to Dr. Jason Satterfield). The funding agreement ensured the authors’ independence in designing the study, interpreting the data, writing, and publishing the report. The following authors are employed by the sponsor: Stephanie Rennke, MD, Patrick Yuan, BA, Brad Monash, MD, Rebecca Blankenburg, MD, MPH, Ian Chua, MD, Stephanie Harman, MD, Debbie S. Sakai, MD, Joan F. Hilton, DSc, MPH., and Jason Satterfield, PhD.
1. Hoffmann TC, Montori VM, Del Mar C. The connection between evidence-based medicine and shared decision making. JAMA. 2014;312(13):1295-1296. doi:10.1001/jama.2014.10186. PubMed
2. Stiggelbout AM, Pieterse AH, De Haes JC. Shared decision making: Concepts, evidence, and practice. Patient Educ Couns. 2015;98(10):1172-1179. doi:10.1016/j.pec.2015.06.022. PubMed
3. Elwyn G, Frosch D, Thomson R, et al. Shared decision making: a model for clinical practice. J Gen Intern Med. 2012;27(10):1361-1367. doi:10.1007/s11606-012-2077-6. PubMed
4. Charles C, Gafni A, Whelan T. Decision-making in the physician-patient encounter: revisiting the shared treatment decision-making model. Soc Sci Med. 1999;49(5):651-661. PubMed
5. Ofstad EH, Frich JC, Schei E, Frankel RM, Gulbrandsen P. What is a medical decision? A units. Am J Respir Crit Care Med. 2011;183(7):915-921. doi:10.1164/rccm.201008-1214OC. PubMed
22. Müller-Engelmann M, Keller H, Donner-Banzhoff N, Krones T. Shared decision making in medicine: The influence of situational treatment factors. Patient Educ Couns. 2011;82(2):240-246. doi:10.1016/j.pec.2010.04.028. PubMed
23. Whitney SN. A New Model of Medical Decisions: Exploring the Limits of Shared Decision Making. Med Decis Making. 2003;23(4):275-280. doi:10.1177/0272989X03256006. PubMed
24. Légaré F, Bekker H, Desroches S, et al. How can continuing professional development better promote shared decision-making? Perspectives from an international collaboration. Implement Sci. 2011;6:68. doi:10.1186/1748-5908-6-68. PubMed
25. Makoul G, Clayman ML. An integrative model of shared decision making in medical encounters. Patient Educ Couns. 2006;60(3):301-312. doi:10.1016/j.pec.2005.06.010. PubMed
26. Moumjid N, Gafni A, Brémond A, Carrère MO. Shared decision making in the medical taxonomy based on physician statements in hospital encounters: a qualitative study. BMJ Open. 2016;6(2):e010098. doi:10.1136/bmjopen-2015-010098. PubMed
6. Fowler FJ, Levin CA, Sepucha KR. Informing and involving patients to improve the quality of medical decisions. Health Aff (Millwood). 2011;30(4):699-706. doi:10.1377/hlthaff.2011.0003. PubMed
7. Weiner SJ, Kelly B, Ashley N, et al. Content coding for contextualization of care: evaluating physician performance at patient-centered decision making. Med Decis Making. 2014;34(1):97-106. doi:10.1177/0272989X13493146. PubMed
8. Weiner SJ, Schwartz A, Sharma G, et al. Patient-centered decision making and health care outcomes: an observational study. Ann Intern Med. 2013;158(8):573-579. doi:10.7326/0003-4819-158-8-201304160-00001. PubMed
9. Matthias MS, Salyers MP, Frankel RM. Re-thinking shared decision-making: context matters. Patient Educ Couns. 2013;91(2):176-179. doi:10.1016/j.pec.2013.01.006 PubMed
10. Clayman ML, Bylund CL, Chewning B, Makoul G. The Impact of Patient Participation in Health Decisions Within Medical Encounters: A Systematic Review. Med Decis Making. 2016;36(4):427-452. doi:10.1177/0272989X15613530. PubMed
11. Shay LA, Lafata JE. Understanding patient perceptions of shared decision making. Patient Educ Couns. 2014;96(3):295-301. doi:10.1016/j.pec.2014.07.017. PubMed
12. Chewning B, Bylund CL, Shah B, Arora NK, Gueguen JA, Makoul G. Patient preferences for shared decisions: a systematic review. Patient Educ Couns. 2012;86(1):9-18. doi:10.1016/j.pec.2011.02.004. PubMed
13. Butterworth JE, Campbell JL. Older patients and their GPs: shared decision making in enhancing trust. Br J Gen Pract. 2014;64(628):e709-e718. doi:10.3399/bjgp14X682297. PubMed
14. Joosten EA, DeFuentes-Merillas L, de Weert GH, Sensky T, van der Staak CP, de Jong CA. Systematic review of the effects of shared decision-making on patient satisfaction, treatment adherence and health status. Psychother Psychosom. 2008;77(4):219-226. doi:10.1159/000126073. PubMed
15. Stacey D, Légaré F, Col NF, et al. Decision aids for people facing health treatment or screening decisions. Cochrane Database Syst Rev. 2014;1:CD001431. doi:10.1002/14651858.CD001431.pub4. PubMed
16. Weingart SN, Zhu J, Chiappetta L, et al. Hospitalized patients’ participation and its impact on quality of care and patient safety. Int J Qual Health Care. 2011;23(3):269-277. doi:10.1093/intqhc/mzr002. PubMed
17. Mohammed K, Nolan MB, Rajjo T, et al. Creating a Patient-Centered Health Care Delivery System: A Systematic Review of Health Care Quality From the Patient Perspective. Am J Med Qual. 2014;31(1):12-21. doi:10.1177/1062860614545124. PubMed
18. Berger Z, Flickinger TE, Pfoh E, Martinez KA, Dy SM. Promoting engagement by patients and families to reduce adverse events in acute care settings: a systematic review. BMJ Qual Saf. 2014;23(7):548-555. doi:10.1136/bmjqs-2012-001769. PubMed
19. Légaré F, Ratté S, Gravel K, Graham ID. Barriers and facilitators to implementing shared decision-making in clinical practice: update of a systematic review of health professionals’ perceptions. Patient Educ Couns. 2008;73(3):526-535. doi:10.1016/j.pec.2008.07.018. PubMed
20. Frosch DL, May SG, Rendle KAS, Tietbohl C, Elwyn G. Authoritarian physicians and patients’ fear of being labeled “difficult” among key obstacles to shared decision making. Health Aff (Millwood). 2012;31(5):1030-1038. doi:10.1377/hlthaff.2011.0576. PubMed
21. Johnson SK, Bautista CA, Hong SY, Weissfeld L, White DB. An empirical study of surrogates’ preferred level of control over value-laden life support decisions in intensive care encounter: are we all talking about the same thing? Med Decis Making. 2007;27(5):539-546. doi:10.1177/0272989X07306779. PubMed
27. Hallström I, Elander G. Decision-making during hospitalization: parents’ and children’s involvement. J Clin Nurs. 2004;13(3):367-375. PubMed
28. Ofstad EH, Frich JC, Schei E, Frankel RM, Gulbrandsen P. Temporal characteristics of decisions in hospital encounters: a threshold for shared decision making? A qualitative study. Patient Educ Couns. 2014;97(2):216-222. doi:10.1016/j.pec.2014.08.005. PubMed
29. Baumeister RF, Leary MR. Writing narrative literature reviews. Rev Gen Psychol. 1997;1(3):311.
30. Moody DL. Theoretical and practical issues in evaluating the quality of conceptual models: current state and future directions. Data Knowl Eng. 2005;55(3):243-276. doi:10.1016/j.datak.2004.12.005.
31. McLeroy KR, Bibeau D, Steckler A, Glanz K. An ecological perspective on health promotion programs. Health Educ Q. 1988;15(4):351-377. PubMed
32. Basics of Qualitative Research | SAGE Publications Inc. https://us.sagepub.com/en-us/nam/basics-of-qualitative-research/book235578. Accessed on September 13, 2016. PubMed
33. 2013;2(4):421-433. doi:10.2217/cer.13.46.J Comp Eff Res33. Halley MC, Rendle KA, Frosch DL. A conceptual model of the multiple stages of communication necessary to support patient-centered care. PubMed
34. 2012;87(1):54-61. doi:10.1016/j.pec.2011.07.027.Patient Educ Couns34. Torke AM, Petronio S, Sachs GA, Helft PR, Purnell C. A conceptual model of the role of communication in surrogate decision making for hospitalized adults. PubMed
35. 2009;15(6):1142-1151. doi:10.1111/j.1365-2753.2009.01315.x.J Eval Clin Pract35. Falzer PR, Garman MD. A conditional model of evidence-based decision making: Model of evidence-based decision making. PubMed
36. 2012;8(4):161-164. doi:10.1097/PTS.0b013e318267c56e.J Patient Saf36. Holzmueller CG, Wu AW, Pronovost PJ. A framework for encouraging patient engagement in medical decision making. PubMed
37. 2014;97(2):158-164. doi:10.1016/j.pec.2014.07.027.Patient Educ Couns37. Elwyn G, Lloyd A, May C, et al. Collaborative deliberation: a model for patient care. PubMed
38. 2002;35(5-6):313-321. doi:10.1016/S1532-0464(03)00037-6.J Biomed Inform38. Ruland CM, Bakken S. Developing, implementing, and evaluating decision support systems for shared decision making in patient care: a conceptual model and case illustration. PubMed
39. 1999;319(7212):764.BMJ39. Shepperd S, Charnock D, Gann B. Helping patients access high quality health information. PubMed
40. 2011;25(1):18-25. doi:10.3109/13561820.2010.490502.J Interprof Care40. Légaré F, Stacey D, Pouliot S, et al. Interprofessionalism and shared decision-making in primary care: a stepwise approach towards a new model. PubMed
41. 2015;25(1):141-152. doi:10.1007/s10926-014-9532-7.J Occup Rehabil41. Coutu MF, Légaré F, Durand MJ, et al. Operationalizing a Shared Decision Making Model for Work Rehabilitation Programs: A Consensus Process. PubMed
42. 2013;13:231.BMC Health Serv Res42. Hölzel LP, Kriston L, Härter M. Patient preference for involvement, experienced involvement, decisional conflict, and satisfaction with physician: a structural equation model test. PubMed
43. 2008;134(4):835-843. doi:10.1378/chest.08-0235.Chest43. Curtis JR, White DB. Practical guidance for evidence-based ICU family conferences. PubMed
44. 2013;8:29-36. doi:10.4137/IMI.S12783.Integr Med Insights44. Brooks AT, Silverman L, Wallen G. Shared Decision Making: A Fundamental Tenet in a Conceptual Framework of Integrative Healthcare Delivery. PubMed
45. 2013;33(1):37-47. doi:10.1177/0272989X12458159.Med Decis Making45. Müller-Engelmann M, Donner-Banzhoff N, Keller H, et al. When decisions should be shared: a study of social norms in medical decision making using a factorial survey approach. PubMed
46. 2007;101(4):205-211.Z Arztl Fortbild Qualitatssich46. Mccaffery KJ, Shepherd HL, Trevena L, et al. Shared decision-making in Australia. PubMed
47. 2014;20(2):311-318. doi:10.1007/s12028-013-9922-2.Neurocrit Care
47. Rubin MA. The Collaborative Autonomy Model of Medical Decision-Making. 48. 2013;70(1 Suppl):141S-158S. doi:10.1177/1077558712461952.Med Care Res Rev PubMed
48. McCullough LB. The professional medical ethics model of decision making under conditions of clinical uncertainty. PubMed
49. 2009;87(2):368–390.Milbank Q49. Satterfield JM, Spring B, Brownson RC, et al. Toward a Transdisciplinary Model of Evidence-Based Practice. PubMed
50. 2015;25(3):276-282. doi:10.1016/j.whi.2015.02.002.Womens Health Issues50. Moore JE, Titler MG, Kane Low L, Dalton VK, Sampselle CM. Transforming Patient-Centered Care: Development of the Evidence Informed Decision Making through Engagement Model. PubMed
51. 1997;44(5):681-692.Soc Sci Med51. Charles C, Gafni A, Whelan T. Shared decision-making in the medical encounter: what does it mean? (or it takes at least two to tango). PubMed
52. 2010;80(2):164-172. doi:10.1016/j.pec.2009.10.015.Patient Educ Couns52. Stacey D, Légaré F, Pouliot S, Kryworuchko J, Dunn S. Shared decision making models to inform an interprofessional perspective on decision making: a theory analysis. PubMed
53. 2013;70(1 Suppl):94S-112S. doi:10.1177/1077558712459216.Med Care Res Rev53. Epstein RM, Gramling RE. What is shared in shared decision making? Complex decisions when the evidence is unclear. PubMed
54. 2010;304(8):903-904. doi:10.1001/jama.2010.1208.JAMA54. Kon AA. The shared decision-making continuum. PubMed
55. 2008;30(3):429-444. doi:10.1111/j.1467-9566.2007.01064.x.Sociol Health Illn55. Rapley T. Distributed decision making: the anatomy of decisions-in-action. PubMed
56. 1997;12(6):339-345.J Gen Intern Med56. Braddock CH 3rd, Fihn SD, Levinson W, Jonsen AR, Pearlman RA. How doctors and patients discuss routine clinical decisions. Informed decision making in the outpatient setting. PubMed
57. 1999;282(24):2313-2320.JAMA57. Braddock CH 3rd, Edwards KA, Hasenberg NM, Laidley TL, Levinson W. Informed decision making in outpatient practice: time to get back to basics. PubMed
58. 2009;69(12):1805-1812. doi:10.1016/j.socscimed.2009.09.056.Soc Sci Med58. Smith SK, Dixon A, Trevena L, Nutbeam D, McCaffery KJ. Exploring patient involvement in healthcare decision making across different education and functional health literacy groups.
2006;9(4):321-332. doi:10.1111/j.1369-7625.2006.00404.x.Health Expect. PubMed
59. Towle A, Godolphin W, Grams G, Lamarre A. Putting informed and shared decision making into practice. PubMed
60. 2011;17(4):554-564. doi: 10.1111/j.1365-2753.2010.01515.x.J Eval Clin Pract60. Légaré F, Stacey D, Gagnon S, et al. Validating a conceptual model for an interprofessional approach to shared decision making: a mixed methods study. PubMed
Evolving models of medical care emphasize the importance of shared decision-making (SDM) on practical and ethical grounds.1-3 SDM is a cognitive, emotional, and relational process in which provider and patient collaborate in a decision after discussing the options, evidence, and potential benefits and harms, while considering the patient’s values, preferences, and circumstances.4 Categories of decisions include information gathering, pharmacotherapy, therapeutic procedures, consultations and referrals, counseling and precautions (eg, behavior modification, goals of care, end-of-life care), and care transitions (eg, transfer or discharge to home).5 Decisions span the continuum of urgency and may be anticipatory or reactive.6 The patient’s environment7,8 and the provider-patient relationship9 have been explicitly incorporated into the ideal SDM process.
SDM has been conceptually and empirically linked with evidence-based practice,1 although the relationship between SDM and clinical outcomes is less clear.10,11 SDM is desired by patients12 and may bolster patient satisfaction, trust, and adherence.13,14 Limited evidence suggests SDM could reduce inappropriate treatments and testing,15 decrease adverse events,16 and promote greater patient safety,17-19 but more well-designed studies are needed.
Provider, patient, and contextual factors influence the extent to which SDM occurs. Providers commonly cite time constraints and perceived lack of applicability to certain clinical scenarios or settings.19 Providers may also lack training and competency in SDM skills.2 Patients may be reluctant to disagree with their provider or fear being mislabeled as “difficult.”20 When faced with high stakes or emotionally charged decisions, patients’ surrogates may prefer to have the provider serve as the sole decision-maker.21 Contextually, there may be limited evidence, high clinical stake, or a number of equally beneficial (or harmful) options.22,23
Current SDM models guide clinicians in determining when and how to engage in SDM, yet models vary widely. For example, Elwyn’s model emphasizes the ethical imperative for SDM and outlines 3 SDM steps: introduce choice, describe options, and help patients explore preferences and make decisions.3 Using a multimodal review and clinician-driven feedback, Legaré’s “IP-SDM” (Interprofessional Shared Decision Making) model illustrates the roles of the interprofessional team and emphasizes the influence of environmental factors on decision-making.24 Recent systematic reviews of SDM models have attempted to identify common elements, language, and processes.2,25,26
This study reviews leading SDM models to construct a more environmentally and contextually sensitive model that is appropriate for the hospital setting. Although developed with hospital medicine in mind, a synthesized model that attends to environmental and systems context, provider/team factors, patient factors, and disease/medical variables is highly relevant in any setting where SDM occurs.
METHODS
We constructed a model that is appropriate for SDM across the care continuum through the following 3-part, iterative group process: (1) a comprehensive literature review of existing SDM models, (2) synthesis and inductive development of a new draft model, and (3) modification of the new model using feedback from SDM experts.
Narrative Literature Review
We performed a structured, comprehensive literature review 29 to compare and contrast existing SDM models and frameworks. Leading models and key concepts were first identified using 2 systematic reviews 25,26 and a comprehensive review.2 In order to extend the search to 2016 and include any overlooked articles, a PubMed search was performed using the terms “shared decision-making” or “medical decision-making” AND “model” or “theory” or “framework” for English-language articles from inception to 2016. The search was repeated using Google Scholar to verify results and obtain the number of citations per article as a proxy for impact and saturation. In order to minimize possible search error or selection bias, reference lists in high-impact publications were hand searched to identify additional articles. All abstracts were manually reviewed by 2 independent authors for relevance and later inclusion in our group iterative process. A priori inclusion criteria were limited to provider-patient SDM (ie, not clinical reasoning or making decisions in general) and complete descriptions of a conceptual model or framework. Additional publications suggested by experts (eg, perspective pieces or terminology summaries) were also reviewed.
Model Development and Expert Review
The draft model and a standardized set of questions (supplementary Appendix A) were then emailed to all first and last authors of the reviewed studies (Table 2). Expert responses were compiled, coded, and analyzed independently by 3 coauthors. Inductive coding techniques and a constant comparative approach were used to code the qualitative data.32 Preliminary findings were shared among the 3 reviewers and discussed until consensus was reached on emerging themes and implications for the new SDM model and multistep SDM pathway. A master list of suggested revisions was shared with the larger authorship team and the model was refined accordingly.
RESULTS
Two previously published systematic reviews25,26 identified 494 articles, 161 conceptual definitions of SDM, and over 30 separate key concepts. The additional PubMed search garnered 1957 publications (with many overlapping from the systematic reviews). A manual search of the systematic reviews and PubMed abstracts identified 16 unique and complete decision-making models for further review. Hand searches of their citations yielded an additional 6 models for a total of 22 models.3,4,13,23,33-51 The majority of excluded articles described specific decision aids and small clinical studies, focused on only one step of the decision-making process, or were not otherwise relevant. The first (SR) and senior authors (JS) reviewed the 22 models for SDM relevance, generalizability, and content saturation, yielding a final sample of 9 SDM models. A subsequent Google Scholar search did not identify any new SDM models but 2 SDM theory papers1,52 and 2 commentaries53,54 were selected based on influence (ie, number of citations), expert recommendation, or coverage of a novel aspect of SDM. A total of 15 studies (9 SDM models + 6 reviews; Table 2) were used by our development team to create a synthesized SDM model. A 10th SDM model55 and 3 additional descriptive and normative studies8,56,57 were later added based on expert feedback and incorporated into our final SDM 3 Circle Model.
Expert Feedback
Twenty-one of 27 (78%) SDM expert authors responded to our e-mail request for feedback. The majority (62%) agreed with the basic elements of the model, including the environmental frame and the 3 domains. Some respondents viewed SDM as strictly a process between patient and provider independent of the disease, leading to refinement of the medical context category. Several experts emphasized the importance of SDM “set-up,” which includes the elicitation of patient preferences in how decisions are made and the extent of patient and/or surrogate involvement.
Several respondents identified time constraints (N = 2), acuity of disease (N = 3), and presence of multiple teams (N = 6) to be the significant factors distinguishing inpatient from outpatient SDM. For some experts, “team” referred to the interprofessional care team, whereas others referred to it as the collaboration among attending physicians and trainees. Experts noted that although the intensity and frequency of inpatient interactions could promote SDM, higher patient acuity and the urgency of decisions could negatively influence SDM and/or the patient’s ability to participate. Similarly, the presence of other team members may either impede or promote SDM by either contributing to miscommunication or bringing well-trained SDM experts to the bedside. Financial impact on patients and resource constraints were also noted as relevant. All of these elements have been incorporated into the final SDM 3 Circle Model and multistep SDM Pathway (Supplemental Appendix A and B).
The SDM 3 Circle Model
The SDM 3 Circle Model comprises 3 categories of SDM barriers and facilitators that intersect within the environmental frame of an inpatient ward or other setting: (1) provider/team, (2) patient/family, and (3) medical context. A Venn diagram visually represents the conceptual overlaps and distinctions among these categories that are all affected by the environment in which they occur (Supplemental Appendix A).
The patient/family circle mirrors prior SDM models that address the role of patient preferences in making decisions,3,4,12 with the explicit addition of the roles of families and surrogates as either decision-makers or influencers. This circle includes personal characteristics, such as cognitions (eg, beliefs, attitudes), emotions (eg, anxiety, hope), behaviors (eg, adherence, assertiveness), illness history (ie, subjective experience and understanding of one’s own medical history), and related social features (eg, culture, education, literacy, social supports).
Patient factors are not static over time or context. They occur within an environmental setting and are likely to be influenced by concurrent provider and medical variables (the second and third circles). Disease exacerbation leading to hospitalization or transfer to a subacute facility could dramatically shift the calculus a patient uses to determine preferences or activate dormant family dynamics. Strong provider-patient rapport (the overlap of patient and provider factors) may influence the development of trust and subsequent decisions.9 The type of disease or symptom presentation (circle 3–medical context) may further influence patient factors due to stigma, perceived vulnerability, or assumed prognosis.
The provider/team circle includes both individual and team-based factors falling into similar categories as the patient/family domain, such as cognitions, behavior, and social features; however, these factors include both personal (eg, the provider’s personal history, values, and beliefs) and professional (eg, past medical training, decision-making style, past experiences treating a disease) characteristics. Decisions may involve an interprofessional team representing a broad range of personalities and professional values. Decisions and decision-making processes may change over time as team composition changes, as level of provider expertise varies, or as environmental, patient, or disease/illness factors influence providers and teams.
Medical context includes factors related to the disease and the potential ways to evaluate or manage it. Examples of disease factors include acuity, symptoms, course, and prognosis. Most obviously, disease factors will influence the content of risk-benefit discussions but may also affect the SDM process through disease stigma or cultural assumptions about etiology. Disease evaluation factors include the psychometrics of a diagnostic screen, invasive and noninvasive testing, or a range of different preventive or therapeutic interventions. Treatment variables include the available options, costs, and risk of complications. Medical context variables evolve as evidence-based medicine and biomedical knowledge increase and new treatment options emerge.
Each of the 3 circles operates within the same environmental frame, such as an inpatient medicine ward, which itself operates within a hospital and the broader healthcare system. This frame exerts overt and subtle influences on providers, patients, and even the medical context. Features of the environmental frame include culture (eg, values, preferences, social norms), university versus community setting, incentives, formularies, quality improvement campaigns, regulations, and technology use.
The dynamic interactivity of the environmental frame and the 3 circles inform the process of SDM and highlight key differences that may occur between care settings. Certain features may predominate in different situations, but all will influence and be influenced by features of other circles during the course of SDM.
Application of the SDM 3 Circle Model
Although the SDM process is similar across clinical settings, its operationalization varies in important ways for hospital decision-making. In some situations, patients may defer all decisions to their providers or decisions may be considered with multiple providers concurrently. In the hospital, SDM may not be possible, such as in emergency surgery for an obtunded patient or when the patient and surrogate are not available or able to participate in the decision. Therefore, providers may bypass the steps of information sharing and discussion of the decision (big arrow in the Figure and supplemental
DISCUSSION
The SDM 3 Circle Model provides a concise, ecologically valid, contextually sensitive representation of SDM that synthesizes and extends beyond recent SDM models.3,7,40 Each circle represents the forces that influence SDM across settings. Although the multistep SDM pathway occurs similarly in outpatient and inpatient settings, how each step is operationalized and how each “circle” exerts its influence may differ and warrants further consideration throughout the SDM process. For example, hospitalized patients may have greater stress and anxiety, have more family involvement, be more motivated to adhere to treatment, and may be under greater financial and social pressures. Unlike outpatient primary care, patients are less likely to have an existing relationship with their inpatient providers, potentially compromising patient confidence in the provider, and necessitating expeditious trust building.
The SDM 3 Circle Model captures “setting” in both the broader environmental frame and within the provider/team category of variables. The frame also captures health system and broader community variables that may influence the practicality of some medical decisions. Within this essential frame, all 3 categories of patient, provider, and medical context are included as part of the SDM process. A better understanding of their interplay may be of great value for clinicians, researchers, administrators, and policy makers who wish to further study and promote SDM. Both the SDM 3 Circle Model and its accompanying pathway (Figures 1 and 2) highlight opportunities for intervention and research, and may drive quality improvement initiatives to improve clinical outcomes.
Limitations
We did not perform a new systematic review, potentially omitting lesser-known publications. We mitigated this risk by using recent systematic reviews, searching multiple databases, hand searching citation lists, and making inquiries to SDM experts. Our selection of models used as a foundation for the synthesized model was based on consensus, which included an element of subjective, clinical judgment. Our SDM expert sample was small and limited to authors of the papers we reviewed, potentially restricting the range of viewpoints received. Lastly, the SDM 3 Circle Model highlights key concept areas rather than all possible factors that influence SDM.
CONCLUSIONS
We present a peer-reviewed, literature-based SDM model capable of accounting for the unique circumstances and challenges of SDM in the hospital. The SDM 3 Circle Model identifies the primary categories of variables thought to influence SDM, places them in a shared environmental frame, and visually represents their interactive nature. A multistep representation of the SDM process further illustrates how the unique features and challenges of hospitalization might exert influence at various points as patients and providers reach a shared decision. As the interrelationships of patient and provider/team, medical context, and the environmental frame in which they occur are better understood, more effective and targeted interventions to promote SDM can be developed and evaluated.
Acknowledgments
The authors would like to thank Evans Whitaker for his assistance with the literature review and the Patient Engagement Project volunteers for their support and assistance with data collection.
Disclosure
Financial support for this study was provided entirely by a grant from NIH/NCCIH (grant #R25 AT006573, awarded to Dr. Jason Satterfield). The funding agreement ensured the authors’ independence in designing the study, interpreting the data, writing, and publishing the report. The following authors are employed by the sponsor: Stephanie Rennke, MD, Patrick Yuan, BA, Brad Monash, MD, Rebecca Blankenburg, MD, MPH, Ian Chua, MD, Stephanie Harman, MD, Debbie S. Sakai, MD, Joan F. Hilton, DSc, MPH., and Jason Satterfield, PhD.
1. Hoffmann TC, Montori VM, Del Mar C. The connection between evidence-based medicine and shared decision making. JAMA. 2014;312(13):1295-1296. doi:10.1001/jama.2014.10186. PubMed
2. Stiggelbout AM, Pieterse AH, De Haes JC. Shared decision making: Concepts, evidence, and practice. Patient Educ Couns. 2015;98(10):1172-1179. doi:10.1016/j.pec.2015.06.022. PubMed
3. Elwyn G, Frosch D, Thomson R, et al. Shared decision making: a model for clinical practice. J Gen Intern Med. 2012;27(10):1361-1367. doi:10.1007/s11606-012-2077-6. PubMed
4. Charles C, Gafni A, Whelan T. Decision-making in the physician-patient encounter: revisiting the shared treatment decision-making model. Soc Sci Med. 1999;49(5):651-661. PubMed
5. Ofstad EH, Frich JC, Schei E, Frankel RM, Gulbrandsen P. What is a medical decision? A units. Am J Respir Crit Care Med. 2011;183(7):915-921. doi:10.1164/rccm.201008-1214OC. PubMed
22. Müller-Engelmann M, Keller H, Donner-Banzhoff N, Krones T. Shared decision making in medicine: The influence of situational treatment factors. Patient Educ Couns. 2011;82(2):240-246. doi:10.1016/j.pec.2010.04.028. PubMed
23. Whitney SN. A New Model of Medical Decisions: Exploring the Limits of Shared Decision Making. Med Decis Making. 2003;23(4):275-280. doi:10.1177/0272989X03256006. PubMed
24. Légaré F, Bekker H, Desroches S, et al. How can continuing professional development better promote shared decision-making? Perspectives from an international collaboration. Implement Sci. 2011;6:68. doi:10.1186/1748-5908-6-68. PubMed
25. Makoul G, Clayman ML. An integrative model of shared decision making in medical encounters. Patient Educ Couns. 2006;60(3):301-312. doi:10.1016/j.pec.2005.06.010. PubMed
26. Moumjid N, Gafni A, Brémond A, Carrère MO. Shared decision making in the medical taxonomy based on physician statements in hospital encounters: a qualitative study. BMJ Open. 2016;6(2):e010098. doi:10.1136/bmjopen-2015-010098. PubMed
6. Fowler FJ, Levin CA, Sepucha KR. Informing and involving patients to improve the quality of medical decisions. Health Aff (Millwood). 2011;30(4):699-706. doi:10.1377/hlthaff.2011.0003. PubMed
7. Weiner SJ, Kelly B, Ashley N, et al. Content coding for contextualization of care: evaluating physician performance at patient-centered decision making. Med Decis Making. 2014;34(1):97-106. doi:10.1177/0272989X13493146. PubMed
8. Weiner SJ, Schwartz A, Sharma G, et al. Patient-centered decision making and health care outcomes: an observational study. Ann Intern Med. 2013;158(8):573-579. doi:10.7326/0003-4819-158-8-201304160-00001. PubMed
9. Matthias MS, Salyers MP, Frankel RM. Re-thinking shared decision-making: context matters. Patient Educ Couns. 2013;91(2):176-179. doi:10.1016/j.pec.2013.01.006 PubMed
10. Clayman ML, Bylund CL, Chewning B, Makoul G. The Impact of Patient Participation in Health Decisions Within Medical Encounters: A Systematic Review. Med Decis Making. 2016;36(4):427-452. doi:10.1177/0272989X15613530. PubMed
11. Shay LA, Lafata JE. Understanding patient perceptions of shared decision making. Patient Educ Couns. 2014;96(3):295-301. doi:10.1016/j.pec.2014.07.017. PubMed
12. Chewning B, Bylund CL, Shah B, Arora NK, Gueguen JA, Makoul G. Patient preferences for shared decisions: a systematic review. Patient Educ Couns. 2012;86(1):9-18. doi:10.1016/j.pec.2011.02.004. PubMed
13. Butterworth JE, Campbell JL. Older patients and their GPs: shared decision making in enhancing trust. Br J Gen Pract. 2014;64(628):e709-e718. doi:10.3399/bjgp14X682297. PubMed
14. Joosten EA, DeFuentes-Merillas L, de Weert GH, Sensky T, van der Staak CP, de Jong CA. Systematic review of the effects of shared decision-making on patient satisfaction, treatment adherence and health status. Psychother Psychosom. 2008;77(4):219-226. doi:10.1159/000126073. PubMed
15. Stacey D, Légaré F, Col NF, et al. Decision aids for people facing health treatment or screening decisions. Cochrane Database Syst Rev. 2014;1:CD001431. doi:10.1002/14651858.CD001431.pub4. PubMed
16. Weingart SN, Zhu J, Chiappetta L, et al. Hospitalized patients’ participation and its impact on quality of care and patient safety. Int J Qual Health Care. 2011;23(3):269-277. doi:10.1093/intqhc/mzr002. PubMed
17. Mohammed K, Nolan MB, Rajjo T, et al. Creating a Patient-Centered Health Care Delivery System: A Systematic Review of Health Care Quality From the Patient Perspective. Am J Med Qual. 2014;31(1):12-21. doi:10.1177/1062860614545124. PubMed
18. Berger Z, Flickinger TE, Pfoh E, Martinez KA, Dy SM. Promoting engagement by patients and families to reduce adverse events in acute care settings: a systematic review. BMJ Qual Saf. 2014;23(7):548-555. doi:10.1136/bmjqs-2012-001769. PubMed
19. Légaré F, Ratté S, Gravel K, Graham ID. Barriers and facilitators to implementing shared decision-making in clinical practice: update of a systematic review of health professionals’ perceptions. Patient Educ Couns. 2008;73(3):526-535. doi:10.1016/j.pec.2008.07.018. PubMed
20. Frosch DL, May SG, Rendle KAS, Tietbohl C, Elwyn G. Authoritarian physicians and patients’ fear of being labeled “difficult” among key obstacles to shared decision making. Health Aff (Millwood). 2012;31(5):1030-1038. doi:10.1377/hlthaff.2011.0576. PubMed
21. Johnson SK, Bautista CA, Hong SY, Weissfeld L, White DB. An empirical study of surrogates’ preferred level of control over value-laden life support decisions in intensive care encounter: are we all talking about the same thing? Med Decis Making. 2007;27(5):539-546. doi:10.1177/0272989X07306779. PubMed
27. Hallström I, Elander G. Decision-making during hospitalization: parents’ and children’s involvement. J Clin Nurs. 2004;13(3):367-375. PubMed
28. Ofstad EH, Frich JC, Schei E, Frankel RM, Gulbrandsen P. Temporal characteristics of decisions in hospital encounters: a threshold for shared decision making? A qualitative study. Patient Educ Couns. 2014;97(2):216-222. doi:10.1016/j.pec.2014.08.005. PubMed
29. Baumeister RF, Leary MR. Writing narrative literature reviews. Rev Gen Psychol. 1997;1(3):311.
30. Moody DL. Theoretical and practical issues in evaluating the quality of conceptual models: current state and future directions. Data Knowl Eng. 2005;55(3):243-276. doi:10.1016/j.datak.2004.12.005.
31. McLeroy KR, Bibeau D, Steckler A, Glanz K. An ecological perspective on health promotion programs. Health Educ Q. 1988;15(4):351-377. PubMed
32. Basics of Qualitative Research | SAGE Publications Inc. https://us.sagepub.com/en-us/nam/basics-of-qualitative-research/book235578. Accessed on September 13, 2016. PubMed
33. 2013;2(4):421-433. doi:10.2217/cer.13.46.J Comp Eff Res33. Halley MC, Rendle KA, Frosch DL. A conceptual model of the multiple stages of communication necessary to support patient-centered care. PubMed
34. 2012;87(1):54-61. doi:10.1016/j.pec.2011.07.027.Patient Educ Couns34. Torke AM, Petronio S, Sachs GA, Helft PR, Purnell C. A conceptual model of the role of communication in surrogate decision making for hospitalized adults. PubMed
35. 2009;15(6):1142-1151. doi:10.1111/j.1365-2753.2009.01315.x.J Eval Clin Pract35. Falzer PR, Garman MD. A conditional model of evidence-based decision making: Model of evidence-based decision making. PubMed
36. 2012;8(4):161-164. doi:10.1097/PTS.0b013e318267c56e.J Patient Saf36. Holzmueller CG, Wu AW, Pronovost PJ. A framework for encouraging patient engagement in medical decision making. PubMed
37. 2014;97(2):158-164. doi:10.1016/j.pec.2014.07.027.Patient Educ Couns37. Elwyn G, Lloyd A, May C, et al. Collaborative deliberation: a model for patient care. PubMed
38. 2002;35(5-6):313-321. doi:10.1016/S1532-0464(03)00037-6.J Biomed Inform38. Ruland CM, Bakken S. Developing, implementing, and evaluating decision support systems for shared decision making in patient care: a conceptual model and case illustration. PubMed
39. 1999;319(7212):764.BMJ39. Shepperd S, Charnock D, Gann B. Helping patients access high quality health information. PubMed
40. 2011;25(1):18-25. doi:10.3109/13561820.2010.490502.J Interprof Care40. Légaré F, Stacey D, Pouliot S, et al. Interprofessionalism and shared decision-making in primary care: a stepwise approach towards a new model. PubMed
41. 2015;25(1):141-152. doi:10.1007/s10926-014-9532-7.J Occup Rehabil41. Coutu MF, Légaré F, Durand MJ, et al. Operationalizing a Shared Decision Making Model for Work Rehabilitation Programs: A Consensus Process. PubMed
42. 2013;13:231.BMC Health Serv Res42. Hölzel LP, Kriston L, Härter M. Patient preference for involvement, experienced involvement, decisional conflict, and satisfaction with physician: a structural equation model test. PubMed
43. 2008;134(4):835-843. doi:10.1378/chest.08-0235.Chest43. Curtis JR, White DB. Practical guidance for evidence-based ICU family conferences. PubMed
44. 2013;8:29-36. doi:10.4137/IMI.S12783.Integr Med Insights44. Brooks AT, Silverman L, Wallen G. Shared Decision Making: A Fundamental Tenet in a Conceptual Framework of Integrative Healthcare Delivery. PubMed
45. 2013;33(1):37-47. doi:10.1177/0272989X12458159.Med Decis Making45. Müller-Engelmann M, Donner-Banzhoff N, Keller H, et al. When decisions should be shared: a study of social norms in medical decision making using a factorial survey approach. PubMed
46. 2007;101(4):205-211.Z Arztl Fortbild Qualitatssich46. Mccaffery KJ, Shepherd HL, Trevena L, et al. Shared decision-making in Australia. PubMed
47. 2014;20(2):311-318. doi:10.1007/s12028-013-9922-2.Neurocrit Care
47. Rubin MA. The Collaborative Autonomy Model of Medical Decision-Making. 48. 2013;70(1 Suppl):141S-158S. doi:10.1177/1077558712461952.Med Care Res Rev PubMed
48. McCullough LB. The professional medical ethics model of decision making under conditions of clinical uncertainty. PubMed
49. 2009;87(2):368–390.Milbank Q49. Satterfield JM, Spring B, Brownson RC, et al. Toward a Transdisciplinary Model of Evidence-Based Practice. PubMed
50. 2015;25(3):276-282. doi:10.1016/j.whi.2015.02.002.Womens Health Issues50. Moore JE, Titler MG, Kane Low L, Dalton VK, Sampselle CM. Transforming Patient-Centered Care: Development of the Evidence Informed Decision Making through Engagement Model. PubMed
51. 1997;44(5):681-692.Soc Sci Med51. Charles C, Gafni A, Whelan T. Shared decision-making in the medical encounter: what does it mean? (or it takes at least two to tango). PubMed
52. 2010;80(2):164-172. doi:10.1016/j.pec.2009.10.015.Patient Educ Couns52. Stacey D, Légaré F, Pouliot S, Kryworuchko J, Dunn S. Shared decision making models to inform an interprofessional perspective on decision making: a theory analysis. PubMed
53. 2013;70(1 Suppl):94S-112S. doi:10.1177/1077558712459216.Med Care Res Rev53. Epstein RM, Gramling RE. What is shared in shared decision making? Complex decisions when the evidence is unclear. PubMed
54. 2010;304(8):903-904. doi:10.1001/jama.2010.1208.JAMA54. Kon AA. The shared decision-making continuum. PubMed
55. 2008;30(3):429-444. doi:10.1111/j.1467-9566.2007.01064.x.Sociol Health Illn55. Rapley T. Distributed decision making: the anatomy of decisions-in-action. PubMed
56. 1997;12(6):339-345.J Gen Intern Med56. Braddock CH 3rd, Fihn SD, Levinson W, Jonsen AR, Pearlman RA. How doctors and patients discuss routine clinical decisions. Informed decision making in the outpatient setting. PubMed
57. 1999;282(24):2313-2320.JAMA57. Braddock CH 3rd, Edwards KA, Hasenberg NM, Laidley TL, Levinson W. Informed decision making in outpatient practice: time to get back to basics. PubMed
58. 2009;69(12):1805-1812. doi:10.1016/j.socscimed.2009.09.056.Soc Sci Med58. Smith SK, Dixon A, Trevena L, Nutbeam D, McCaffery KJ. Exploring patient involvement in healthcare decision making across different education and functional health literacy groups.
2006;9(4):321-332. doi:10.1111/j.1369-7625.2006.00404.x.Health Expect. PubMed
59. Towle A, Godolphin W, Grams G, Lamarre A. Putting informed and shared decision making into practice. PubMed
60. 2011;17(4):554-564. doi: 10.1111/j.1365-2753.2010.01515.x.J Eval Clin Pract60. Légaré F, Stacey D, Gagnon S, et al. Validating a conceptual model for an interprofessional approach to shared decision making: a mixed methods study. PubMed
© 2017 Society of Hospital Medicine
Inpatient Management of Diabetic Foot Infections: A Review of the Guidelines for Hospitalists
Diabetic foot infection (DFI) is a common result of diabetes and represents the most frequent complication requiring hospitalization and lower extremity amputation.1,2 Hospital discharges related to diabetic lower extremity ulcers increased from 72,000 in 1988 to 113,000 in 2007,3 and admissions related to infection rose 30% between 2005 and 2010.2 Ulceration and amputation are associated with a 40% to 50% 5-year mortality rate.4,5
Aggressive risk-factor management and interprofessional care can significantly reduce major amputations and mortality.6-13 Consistent and high-quality care for patients admitted with DFI is essential for optimizing outcomes; however, management varies widely, and critical assessment and prevention measures are often not employed by providers.14 This review synthesizes recommendations from existing guidelines to provide an overview of the best practices for the diagnosis, management, and discharge of DFI in the hospital setting (Supplementary Table 1, Supplementary Figure).
DETECTION AND STAGING OF INFECTION
The first step in the management of a DFI is a careful assessment of the presence and depth of infection.15 The Infectious Diseases Society of America (IDSA) guidelines recommend using at least 2 signs of classic inflammation (erythema, warmth, swelling, tenderness, or pain) or purulent drainage to diagnose soft tissue infection.1,15,16 Patients with ischemia may present atypically, with nonpurulent secretions, friable or discolored granulation tissue, undermining of wound edges, and foul odor. 1,15,16 Additional risk factors for DFI include ulceration for more than 30 days, recurrent foot ulcers, a traumatic foot wound, severe peripheral arterial disease (PAD) in the affected limb (ankle brachial index [ABI] <0.4), prior lower extremity amputation, loss of protective sensation, end-stage renal disease, and a history of walking barefoot.15,17,18
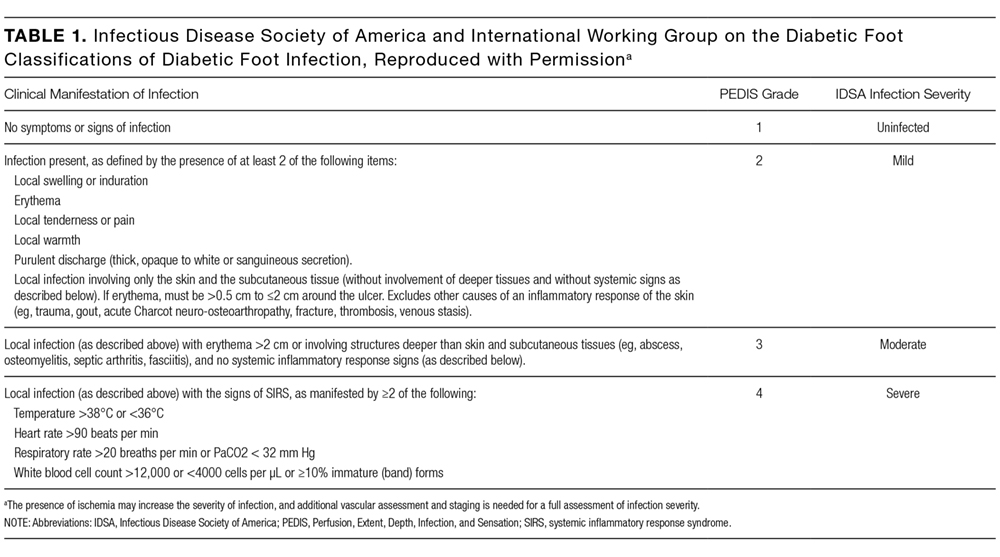
CRITERIA FOR HOSPITALIZATION
In practice, the decision to admit is based on clinical and systems-based drivers (Supplementary Table 2). The IDSA and IWGDF guidelines recommend hospitalization for patients with severe (PEDIS grade 4) infection, moderate (PEDIS grade 3) infection with certain complications (eg, severe PAD or lack of home support), an inability to comply with required outpatient treatment, lack of improvement with outpatient therapy, or presence of metabolic or hemodynamic instability.1,15 Clinicians must also consider the need for surgical debridement or complex antibiotic choices due to allergies and comorbidities. Hospitalists may also consider admission in cases in which outpatient follow-up cannot be easily arranged (eg, uninsured patients).
Outpatient management may be appropriate for patients with mild infections who are willing to be reassessed within 72 hours, or sooner if the infection worsens.23 For patients with moderate infections (eg, osteomyelitis without systemic signs of infection), access to an outpatient interprofessional DFI care team can potentially decrease the need for admission.
DIAGNOSIS OF OSTEOMYELITIS
Clinical features that raise suspicion for osteomyelitis include ulceration for at least 6 weeks with appropriate wound care and offloading, wound extension to the bone or joint, exposed bone, ulcers larger than 2 cm2, previous history of a wound, multiple wounds, and appearance of a sausage digit.15
The gold standard for diagnosis of osteomyelitis is a bone biopsy with histology. In the absence of histology, physicians rely on physical examination, inflammatory markers, and imaging to make the diagnosis. The presence of visible, chronically exposed bone within a forefoot ulcer is diagnostic. The accuracy of a probe to bone test depends on the pretest probability of osteomyelitis. Sensitivity and specificity range from 60% to 87% and from 85% to 91%, respectively.24 For patients with a single forefoot ulcer and PEDIS grade 2 or 3 infection, considering both ulcer depth and serum inflammatory markers (ulcer depth greater than 3 mm, or C-reactive protein greater than 3.2 mg/dL; ulcer depth greater than 3 mm, or erythrocyte sedimentation rate greater than 60 mm/h) increases sensitivity to 100%, although the specificity is relatively low (55% and 60%, respectively).25 When the diagnosis remains uncertain by physical examination, imaging is necessary for further evaluation.
ROLE OF IMAGING
All patients with DFI should have plain radiographs to look for foot deformities, soft tissue gas, foreign bodies, and osteomyelitis. If plain radiographs show classic evidence of osteomyelitis, (ie, cortical erosion, periosteal reaction, mixed lucency, and sclerosis in the absence of neuro-osteoarthropathy), advanced imaging is not necessary. However, these changes may not appear on plain films for up to 1 month after infection onset.15,26
The purpose of advanced imaging in the inpatient management of DFI is to detect conditions not obvious by physical examination or by plain radiographs that would alter surgical management (ie, deep abscess or necrotic bone) or antibiotic duration (ie, osteomyelitis or tenosynovitis).15 Magnetic resonance imaging (MRI) is the diagnostic modality of choice when the wound does not probe to bone and the diagnosis remains uncertain27 due to its accuracy and availability.1,15 However, MRI cannot always distinguish between infection and neuro-osteoarthropathy, especially in patients who have infection superimposed on a Charcot foot, have had recent surgical intervention, or have osteosynthesis material at the infection site.24 If MRI is contraindicated, guidelines vary on the next recommended test. The IDSA and the Society for Vascular Surgery recommend a labeled white blood cell scan combined with a bone scan, whereas the IWGDF recommends a labeled leukocyte scan, a single photon emission computed tomography (SPECT/CT), or a fluorodeoxyglucose positron emission tomography (FDG PET) scan.1,15,19 A recent comparison of a labeled white blood cell SPECT/CT versus MRI (using histology as the gold standard) reported that SPECT/CT had a similar sensitivity (89% versus 87%, respectively) and specificity (35% versus 37%, respectively) to MRI.28 In practice, physicians should consider which studies are readily available and confidently interpreted by radiologists at their institution.
ASSESSMENT OF ULCER ETIOLOGY
After infection is diagnosed and staged, clinicians should determine the underlying derangement in order to prevent recurrence after discharge. Common derangements leading to ulceration in diabetics include PAD, neuropathy, muscular tension, altered foot mechanics, trauma, or a combination of the above.1,15,29-31 All patients with DFI should undergo pedal perfusion assessment by an ABI, ankle and pedal Doppler arterial waveforms, and either toe brachial index (TBI) or transcutaneous oxygen pressure.1,15,19 In cases of suspected calcification, TBI is a more reliable measure of ischemia compared with the ABI.16,19 For patients with signs and symptoms of ischemia and an abnormal ABI or TBI measurement (ABI <0.9 and TBI <0.7), a nonurgent consultation with a vascular surgeon is recommended, while patients with severe ischemia (ABI <0.4) usually require urgent revascularization.15,32
A sensory examination with a Semmes-Weinstein monofilament should be conducted to identify patients with loss of protective sensation who may benefit from offloading devices and custom orthotics.15 Foot anatomy and mechanics as well as potential Achilles tendon contractures should be evaluated by a foot specialist such as a podiatrist, orthotist, orthopedist, or vascular surgeon, especially if debridement or amputation is being contemplated.
OBTAINING CULTURES
After diagnosing the infection clinically, appropriately obtained cultures are essential to guide therapy in all except mild cases with no prior antibiotic exposure or MRSA risk.1,15 Guidelines strongly recommend that specimens be obtained by biopsy or curettage from deep tissue at the base of the ulcer after the wound has been cleansed and debrided and prior to initiating antibiotics.1,15,33 Aspiration of purulent secretions using a sterile needle and syringe is another acceptable culturing method.15 While convenient, swab cultures are prone to both false-positive and false-negative results.34 Repeat cultures are only needed for patients who are not responding to treatment or for surveillance of resistant organisms.1
In cases of osteomyelitis, bone specimens should be sent for culture and histology either during surgical debridement or a bone biopsy. At the time of debridement, cultures and pathology should be sent from the proximal (clean) bone margin in order to document whether there is residual osteomyelitis postdebridement.35 For patients not planned for debridement, a bone biopsy is recommended if the diagnosis of osteomyelitis is unclear, response to empiric therapy is poor, broad-spectrum antibiotics are being considered, or the infection is in the midfoot or hindfoot.1,15,19 Results from soft tissue or sinus tract specimens should not be used to guide antibiotic selection in osteomyelitis, as several studies suggest that they do not correlate with bone culture results; one retrospective review found a mere 22.5% correlation between wound swabs and bone biopsy.1,36 A 2-week antibiotic-free period prior to biopsy is recommended in order to minimize the risk of false-negative results but must be balanced with the risk of worsening infection.1,15 If possible, the biopsy should be performed through uninfected tissue under fluoroscopy or CT guidance, with 2 to 3 cores obtained for culture and histology.1,15
INTERPROFESSIONAL INPATIENT CARE
A growing number of health systems have created inpatient and/or outpatient interprofessional diabetic foot care teams, and several studies demonstrated an association between these teams and a reduction in major amputations.7-11,13 The goal of the inpatient team is to rapidly triage patients with moderate to severe infections, expedite surgical interventions and culture collection, establish an effective treatment plan, and ensure adherence postdischarge to optimize outcomes. The common core of most teams includes podiatry, endocrinology, wound care, and vascular surgery, but team composition may vary based on the availability of local specialists with interest and expertise in DFI.9,10,33
The division of consultation between podiatry and orthopedic surgery is highly dependent upon individual practice patterns and hospital structure. In general, forefoot ulcers may be managed by podiatry or orthopedic surgery, while severe Charcot deformities are most often treated by orthopedic surgeons. Wound care nurses are often integral to successful wound healing, collaborating across specialties and serving as a weekly or biweekly point of contact for patients.
Early involvement of Infectious Disease (ID) specialists can be useful for guiding antibiotic choices and facilitating follow-up. ID should be involved with patients who require long-term antibiotic therapy (ie, cases of deep-tissue infection that are not completely amputated or debrided), have failed outpatient or empiric therapy, have antibiotic allergies or drug-resistant pathogens, or are being considered for outpatient parenteral antibiotic therapy.
ANTIBIOTIC THERAPY

The duration of antibiotic treatment for DFI is based on the severity of infection and response to treatment (Supplementary Table 3). Treatment should continue until the signs and symptoms of infection resolve, but there is no strong evidence to support treatment through complete healing. Healing will usually occur in 1 to 2 weeks for mild infections and in 2 to 3 weeks for moderate or severe infections.
Traditional management of diabetic foot osteomyelitis has relied almost exclusively on resection of all infected bone. However, data have emerged over the last 10 years to support initial medical management of select patients. Further research regarding the optimal treatment regimen and duration is ongoing, with 1 recent, randomized control trial comparing 6 versus 12 weeks of antibiotics for patients treated medically for osteomyelitis finding no difference in remission rates.1,41 Patients managed surgically for osteomyelitis are often treated parenterally for at least 4 weeks, but this practice is not based on strong evidence, and guidelines suggest most patients could be switched to highly bioavailable oral agents after a shorter course of intravenous therapy.1,15 Guidelines recommend 2 to 5 days of antibiotics after complete resection of infected bone and soft tissue (Supplementary Table 3). If the infected soft tissue remains, 1 to 3 weeks of therapy is usually sufficient, while 4 to 6 weeks is often needed if there is residually infected but viable bone.15
SURGICAL MANAGEMENT
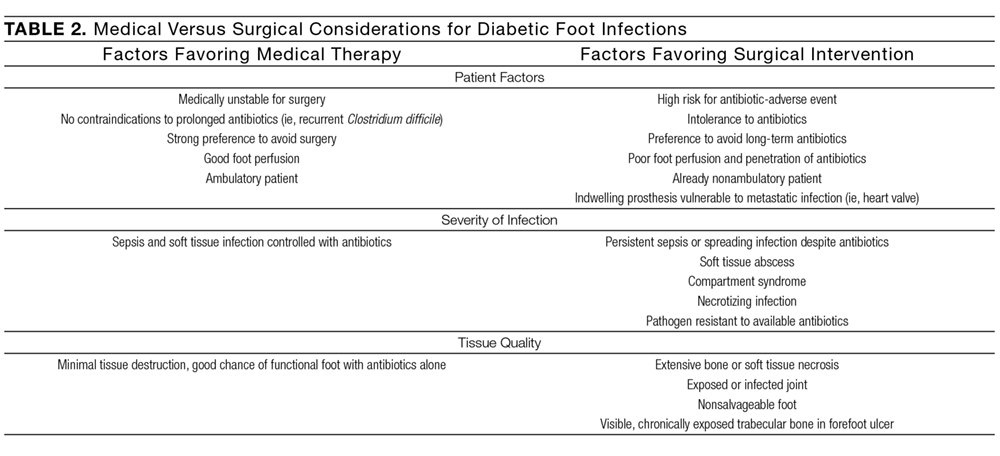
In patients with osteomyelitis, the decision between medical and surgical management is complex. Absolute indications for surgical resection include systemic toxicity with associated tissue infection, an open or infected joint space, and patients with prosthetic heart valves.27 However, the need for surgery is unclear beyond these absolute indications, and approximately two-thirds of osteomyelitis cases may be arrested or cured with antibiotic therapy alone.1 A prospective randomized comparative trial of patients with diabetic foot osteomyelitis found that patients treated with 90 days of antibiotics had similar healing rates, times to healing, and short-term complications as compared with those who underwent conservative bone resection.44 While further research is needed to determine which types of patients with osteomyelitis may be successfully treated without surgery, the IWGDF, the IDSA, and osteomyelitis experts have offered guidance on this decision (Table 2).1,15,27 If resection is necessary, hospitalists should request at least 4 specimens to help guide postoperative antibiotic therapy (1 sample for histology and 1 for microbiology, at both the grossly abnormal bone and the bone margin), as negative margin cultures predict a lower relapse risk for infection.1,35
CRITERIA FOR DISCHARGE
Guidelines suggest that patients be clinically stable before discharge, complete any urgent surgery, achieve acceptable glycemic control, and be presented with a comprehensive outpatient plan, including antibiotic therapy, offloading, wound care instructions, and outpatient follow-up (Supplementary Table 4). Physicians must consider patient and family preferences, expected adherence to therapy, availability of home support, and payer and cost issues when creating the discharge plan.15
INTERPROFESSIONAL OUTPATIENT CARE
An effective outpatient care team is critical to ensure wound healing and infection resolution. Efforts should be made to discharge patients to a comprehensive outpatient interprofessional foot care team, with a plan that includes professional foot care, patient education, and adequate footwear.48 Team composition varies but often includes representatives from vascular surgery, podiatry, orthotics, wound care, endocrinology, orthopedics, physical therapy and rehabilitation, infectious disease, and dermatology.11-13
CONCLUSION
DFIs are a common cause of morbidity in patients with diabetes and result in significant costs to the US healthcare system. Hospitalized patients with a DFI require appropriate classification of wound severity and assessment of vascular status, protective sensation, and potential osteomyelitis. Inpatient management of these patients includes obtaining necessary cultures, choosing an antibiotic regimen based on infection severity and the likely causative agent, and evaluating the need for surgical intervention. Prior to discharge, providers should determine a comprehensive follow-up plan and ensure patient engagement. Finally, interprofessional management has been shown to improve outcomes in DFI and should be adopted in both the inpatient and outpatient settings.
Disclosure
The authors report no conflicts of interest.
1. Lipsky BA, Aragón-Sánchez J, Diggle M, et al. IWGDF guidance on the diagnosis and management of foot infections in persons with diabetes. Diabetes Metab Res Rev. 2016;32 Suppl 1:45-74. PubMed
2. Hicks CW, Selvarajah S, Mathioudakis N, et al. Burden of infected diabetic foot ulcers on hospital admissions and costs. Ann Vasc Surg. 2016;33:149-158. PubMed
3. Number (in thousands) of hospital discharges with peripheral arterial disease (PAD), ulcer/inflammation/infection (ULCER), or neuropathy as first-listed diagnosis and diabetes as any-listed diagnosis United States, 1988-2007. Centers for Disease Control and Prevention website. http://www.cdc.gov/diabetes/statistics/hosplea/diabetes_complications/fig1_number.htm. Updated 2014. Accessed September 23, 2016.
4. Wilbek TE, Jansen RB, Jørgensen B, Svendsen OL. The diabetic foot in a multidisciplinary team setting. Number of amputations below ankle level and mortality. Exp Clin Endocrinol Diabetes. 2016;124(9):535-540. PubMed
5. Jupiter DC, Thorud JC, Buckley CJ, Shibuya N. The impact of foot ulceration and amputation on mortality in diabetic patients. I: From ulceration to death, a systematic review. Int Wound J. 2016;13(5):892-903. PubMed
6. Young MJ, McCardle JE, Randall LE, Barclay JI. Improved survival of diabetic foot ulcer patients 1995-2008: Possible impact of aggressive cardiovascular risk management. Diabetes Care. 2008;31(11):2143-2147. PubMed
7. Troisi N, Baggiore C, Landini G, Michelagnoli S. How daily practice changed in an urban area after establishing a multidisciplinary diabetic foot program. J Diabetes. 2016;8(4):594-595. PubMed
8. Wang C, Mai L, Yang C, et al. Reducing major lower extremity amputations after the introduction of a multidisciplinary team in patient with diabetes foot ulcer. BMC Endocr Disord. 2016;16(1):38. PubMed
9. Rubio JA, Aragón-Sánchez J, Jiménez S, et al. Reducing major lower extremity amputations after the introduction of a multidisciplinary team for the diabetic foot. Int J Low Extrem Wounds. 2014;13(1):22-26. PubMed
10. Yesil S, Akinci B, Bayraktar F, et al. Reduction of major amputations after starting a multidisciplinary diabetic foot care team: Single centre experience from Turkey. Exp Clin Endocrinol Diabetes. 2009;117(7):345-349. PubMed
11. Dargis V, Pantelejeva O, Jonushaite A, Vileikyte L, Boulton AJ. Benefits of a multidisciplinary approach in the management of recurrent diabetic foot ulceration in Lithuania: A prospective study. Diabetes Care. 1999;22(9):1428-1431. PubMed
12. Driver VR, Goodman RA, Fabbi M, French MA, Andersen CA. The impact of a podiatric lead limb preservation team on disease outcomes and risk prediction in the diabetic lower extremity: a retrospective cohort study. J Am Podiatr Med Assoc. 2010;100(4):235-241. PubMed
13. Hamonet J, Verdié-Kessler C, Daviet JC, et al. Evaluation of a multidisciplinary consultation of diabetic foot. Ann Phys Rehabil Med. 2010;53(5):306-318. PubMed
14. Prompers L, Huijberts M, Apelqvist J, et al. Delivery of care to diabetic patients with foot ulcers in daily practice: Results of the Eurodiale study, a prospective cohort study. Diabet Med. 2008;25(6):700-707. PubMed
15. Lipsky BA, Berendt AR, Cornia PB, et al. 2012 Infectious Diseases Society of America clinical practice guideline for the diagnosis and treatment of diabetic foot infections. Clin Infect Dis. 2012;54(12):e132-e173. PubMed
16. Noor S, Khan RU, Ahmad J. Understanding diabetic foot infection and its management. Diabetes Metab Syndr. 2016;11(2):149-156. PubMed
17. Hill MN, Feldman HI, Hilton SC, Holechek MJ, Ylitalo M, Benedict GW. Risk of foot complications in long-term diabetic patients with and without ESRD: A preliminary study. ANNA J. 1996;23(4):381-386; discussion 387-388. PubMed
18. Mohler ER, III. Peripheral arterial disease: Identification and implications. Arch Intern Med. 2003;163(19):2306-2314. PubMed
19. Hingorani A, LaMuraglia GM, Henke P, et al. The management of diabetic foot: A clinical practice guideline by the Society for Vascular Surgery in collaboration with the American Podiatric Medical Association and the Society for Vascular Medicine. J Vasc Surg. 2016;63(2 Suppl):3S-21S. PubMed
20. Noor S, Zubair M, Ahmad J. Diabetic foot ulcer--A review on pathophysiology, classification and microbial etiology. Diabetes Metab Syndr. 2015;9(3):192-199. PubMed
21. Wukich DK, Hobizal KB, Brooks MM. Severity of diabetic foot infection and rate of limb salvage. Foot Ankle Int. 2013;34(3):351-358. PubMed
22. Wukich DK, Hobizal KB, Raspovic KM, Rosario BL. SIRS is valid in discriminating between severe and moderate diabetic foot infections. Diabetes Care. 2013;36(11):3706-3711. PubMed
23. Grigoropoulou P, Eleftheriadou I, Jude EB, Tentolouris N. Diabetic foot infections: An update in diagnosis and management. Curr Diab Rep. 2017;17(1):3. PubMed
24. Glaudemans AW, Uçkay I, Lipsky BA. Challenges in diagnosing infection in the diabetic foot. Diabet Med. 2015;32(6):748-759. PubMed
25. Fleischer AE, Didyk AA, Woods JB, Burns SE, Wrobel JS, Armstrong DG. Combined clinical and laboratory testing improves diagnostic accuracy for osteomyelitis in the diabetic foot. J Foot Ankle Surg. 2009;48(1):39-46. PubMed
26. Jeffcoate WJ, Lipsky BA. Controversies in diagnosing and managing osteomyelitis of the foot in diabetes. Clin Infect Dis. 2004;39 Suppl 2:S115-S122. PubMed
27. Allahabadi S, Haroun KB, Musher DM, Lipsky BA, Barshes NR. Consensus on surgical aspects of managing osteomyelitis in the diabetic foot. Diabet Foot Ankle. 2016;7:30079. PubMed
28. La Fontaine J, Bhavan K, Lam K, et al. Comparison between Tc-99m WBC SPECT/CT and MRI for the diagnosis of biopsy-proven diabetic foot osteomyelitis. Wounds. 2016;28(8):271-278. PubMed
29. Bembi V, Singh S, Singh P, Aneja GK, Arya TV, Arora R. Prevalence of peripheral arterial disease in a cohort of diabetic patients. South Med J. 2006;99(6):564-569. PubMed
30. Marso SP, Hiatt WR. Peripheral arterial disease in patients with diabetes. J Am Coll Cardiol. 2006;47(5):921-929. PubMed
31. Hinchliffe RJ, Andros G, Apelqvist J, et al. A systematic review of the effectiveness of revascularization of the ulcerated foot in patients with diabetes and peripheral arterial disease. Diabetes Metab Res Rev. 2012;28 Suppl 1:179-217. PubMed
32. Brownrigg JR, Apelqvist J, Bakker K, Schaper NC, Hinchliffe RJ. Evidence-based management of PAD & the diabetic foot. Eur J Vasc Endovasc Surg. 2013;45(6):673-681. PubMed
33. 2015;13(2):115-122.Ann Fam Med49. Jackson C, Shahsahebi M, Wedlake T, DuBard CA. Timeliness of outpatient follow-up: an evidence-based approach for planning after hospital discharge. PubMed
34. 2016;32 Suppl 1:16-24.Diabetes Metab Res Rev48. Bus SA, van Netten JJ, Lavery LA, et al. IWGDF guidance on the prevention of foot ulcers in at-risk patients with diabetes. PubMed
35. 2003;85-A(8):1436-1445.J Bone Joint Surg Am47. Mueller MJ, Sinacore DR, Hastings MK, Strube MJ, Johnson JE. Effect of Achilles tendon lengthening on neuropathic plantar ulcers. A randomized clinical trial. PubMed
36. 2015;21(2):77-85.Foot Ankle Surg46. Cychosz CC, Phisitkul P, Belatti DA, Glazebrook MA, DiGiovanni CW. Gastrocnemius recession for foot and ankle conditions in adults: Evidence-based recommendations. PubMed
37. 2016;32 Suppl 1:25-36.Diabetes Metab Res Rev45. Bus SA, Armstrong DG, van Deursen RW, et al. IWGDF guidance on footwear and offloading interventions to prevent and heal foot ulcers in patients with diabetes. PubMed
38. 2014;37(3):789-795.Diabetes Care44. Lázaro-Martínez JL, Aragón-Sánchez J, García-Morales E. Antibiotics versus conservative surgery for treating diabetic foot osteomyelitis: A randomized comparative trial. PubMed
39. 1996;183(1):61-64.J Am Coll Surg43. Steed DL, Donohoe D, Webster MW, Lindsley L. Effect of extensive debridement and treatment on the healing of diabetic foot ulcers. Diabetic Ulcer Study Group. PubMed
40. 2002;10(6):354-359.Wound Repair Regen42. Saap LJ, Falanga V. Debridement performance index and its correlation with complete closure of diabetic foot ulcers. PubMed
41. 2015;38(2):302-307.Diabetes Care41. Tone A, Nguyen S, Devemy F, et al. Six-week versus twelve-week antibiotic therapy for nonsurgically treated diabetic foot osteomyelitis: A multicenter open-label controlled randomized study. PubMed
42. 2014;35(10):1229-1235.Infect Control Hosp Epidemiol40. Schultz L, Lowe TJ, Srinivasan A, Neilson D, Pugliese G. Economic impact of redundant antimicrobial therapy in US hospitals. PubMed
43. 2015;31(4):395-401.Diabetes Metab Res Rev39. Lipsky BA, Cannon CM, Ramani A, et al. Ceftaroline fosamil for treatment of diabetic foot infections: the CAPTURE study experience. PubMed
2011;55(9):4154-4160.Antimicrob Agents Chemother.38. Richter SS, Heilmann KP, Dohrn CL, et al. Activity of ceftaroline and epidemiologic trends in Staphylococcus aureus isolates collected from 43 medical centers in the United States in 2009. PubMed
44. 2011;52(3):e18-e55.Clin Infect Dis37. Liu C, Bayer A, Cosgrove SE, et al. Clinical practice guidelines by the Infectious Diseases Society of America for the treatment of methicillin-resistant Staphylococcus aureus infections in adults and children. PubMed
45. 2006;42(1):57-62.Clin Infect Dis36. Senneville E, Melliez H, Beltrand E, et al. Culture of percutaneous bone biopsy specimens for diagnosis of diabetic foot osteomyelitis: Concordance with ulcer swab cultures. PubMed
46. 2012;51(6):749-752.J Foot Ankle Surg35. Atway S, Nerone VS, Springer KD, Woodruff DM. Rate of residual osteomyelitis after partial foot amputation in diabetic patients: A standardized method for evaluating bone margins with intraoperative culture. PubMed
47. 2010;5(7):415-420.J Hosp Med34. Chakraborti C, Le C, Yanofsky A. Sensitivity of superficial cultures in lower extremity wounds. PubMed
48. 2013;36(9):2862-2871.Diabetes Care33. Wukich DK, Armstrong DG, Attinger CE, et al. Inpatient management of diabetic foot disorders: A clinical guide. PubMed
Diabetic foot infection (DFI) is a common result of diabetes and represents the most frequent complication requiring hospitalization and lower extremity amputation.1,2 Hospital discharges related to diabetic lower extremity ulcers increased from 72,000 in 1988 to 113,000 in 2007,3 and admissions related to infection rose 30% between 2005 and 2010.2 Ulceration and amputation are associated with a 40% to 50% 5-year mortality rate.4,5
Aggressive risk-factor management and interprofessional care can significantly reduce major amputations and mortality.6-13 Consistent and high-quality care for patients admitted with DFI is essential for optimizing outcomes; however, management varies widely, and critical assessment and prevention measures are often not employed by providers.14 This review synthesizes recommendations from existing guidelines to provide an overview of the best practices for the diagnosis, management, and discharge of DFI in the hospital setting (Supplementary Table 1, Supplementary Figure).
DETECTION AND STAGING OF INFECTION
The first step in the management of a DFI is a careful assessment of the presence and depth of infection.15 The Infectious Diseases Society of America (IDSA) guidelines recommend using at least 2 signs of classic inflammation (erythema, warmth, swelling, tenderness, or pain) or purulent drainage to diagnose soft tissue infection.1,15,16 Patients with ischemia may present atypically, with nonpurulent secretions, friable or discolored granulation tissue, undermining of wound edges, and foul odor. 1,15,16 Additional risk factors for DFI include ulceration for more than 30 days, recurrent foot ulcers, a traumatic foot wound, severe peripheral arterial disease (PAD) in the affected limb (ankle brachial index [ABI] <0.4), prior lower extremity amputation, loss of protective sensation, end-stage renal disease, and a history of walking barefoot.15,17,18
CRITERIA FOR HOSPITALIZATION
In practice, the decision to admit is based on clinical and systems-based drivers (Supplementary Table 2). The IDSA and IWGDF guidelines recommend hospitalization for patients with severe (PEDIS grade 4) infection, moderate (PEDIS grade 3) infection with certain complications (eg, severe PAD or lack of home support), an inability to comply with required outpatient treatment, lack of improvement with outpatient therapy, or presence of metabolic or hemodynamic instability.1,15 Clinicians must also consider the need for surgical debridement or complex antibiotic choices due to allergies and comorbidities. Hospitalists may also consider admission in cases in which outpatient follow-up cannot be easily arranged (eg, uninsured patients).
Outpatient management may be appropriate for patients with mild infections who are willing to be reassessed within 72 hours, or sooner if the infection worsens.23 For patients with moderate infections (eg, osteomyelitis without systemic signs of infection), access to an outpatient interprofessional DFI care team can potentially decrease the need for admission.
DIAGNOSIS OF OSTEOMYELITIS
Clinical features that raise suspicion for osteomyelitis include ulceration for at least 6 weeks with appropriate wound care and offloading, wound extension to the bone or joint, exposed bone, ulcers larger than 2 cm2, previous history of a wound, multiple wounds, and appearance of a sausage digit.15
The gold standard for diagnosis of osteomyelitis is a bone biopsy with histology. In the absence of histology, physicians rely on physical examination, inflammatory markers, and imaging to make the diagnosis. The presence of visible, chronically exposed bone within a forefoot ulcer is diagnostic. The accuracy of a probe to bone test depends on the pretest probability of osteomyelitis. Sensitivity and specificity range from 60% to 87% and from 85% to 91%, respectively.24 For patients with a single forefoot ulcer and PEDIS grade 2 or 3 infection, considering both ulcer depth and serum inflammatory markers (ulcer depth greater than 3 mm, or C-reactive protein greater than 3.2 mg/dL; ulcer depth greater than 3 mm, or erythrocyte sedimentation rate greater than 60 mm/h) increases sensitivity to 100%, although the specificity is relatively low (55% and 60%, respectively).25 When the diagnosis remains uncertain by physical examination, imaging is necessary for further evaluation.
ROLE OF IMAGING
All patients with DFI should have plain radiographs to look for foot deformities, soft tissue gas, foreign bodies, and osteomyelitis. If plain radiographs show classic evidence of osteomyelitis, (ie, cortical erosion, periosteal reaction, mixed lucency, and sclerosis in the absence of neuro-osteoarthropathy), advanced imaging is not necessary. However, these changes may not appear on plain films for up to 1 month after infection onset.15,26
The purpose of advanced imaging in the inpatient management of DFI is to detect conditions not obvious by physical examination or by plain radiographs that would alter surgical management (ie, deep abscess or necrotic bone) or antibiotic duration (ie, osteomyelitis or tenosynovitis).15 Magnetic resonance imaging (MRI) is the diagnostic modality of choice when the wound does not probe to bone and the diagnosis remains uncertain27 due to its accuracy and availability.1,15 However, MRI cannot always distinguish between infection and neuro-osteoarthropathy, especially in patients who have infection superimposed on a Charcot foot, have had recent surgical intervention, or have osteosynthesis material at the infection site.24 If MRI is contraindicated, guidelines vary on the next recommended test. The IDSA and the Society for Vascular Surgery recommend a labeled white blood cell scan combined with a bone scan, whereas the IWGDF recommends a labeled leukocyte scan, a single photon emission computed tomography (SPECT/CT), or a fluorodeoxyglucose positron emission tomography (FDG PET) scan.1,15,19 A recent comparison of a labeled white blood cell SPECT/CT versus MRI (using histology as the gold standard) reported that SPECT/CT had a similar sensitivity (89% versus 87%, respectively) and specificity (35% versus 37%, respectively) to MRI.28 In practice, physicians should consider which studies are readily available and confidently interpreted by radiologists at their institution.
ASSESSMENT OF ULCER ETIOLOGY
After infection is diagnosed and staged, clinicians should determine the underlying derangement in order to prevent recurrence after discharge. Common derangements leading to ulceration in diabetics include PAD, neuropathy, muscular tension, altered foot mechanics, trauma, or a combination of the above.1,15,29-31 All patients with DFI should undergo pedal perfusion assessment by an ABI, ankle and pedal Doppler arterial waveforms, and either toe brachial index (TBI) or transcutaneous oxygen pressure.1,15,19 In cases of suspected calcification, TBI is a more reliable measure of ischemia compared with the ABI.16,19 For patients with signs and symptoms of ischemia and an abnormal ABI or TBI measurement (ABI <0.9 and TBI <0.7), a nonurgent consultation with a vascular surgeon is recommended, while patients with severe ischemia (ABI <0.4) usually require urgent revascularization.15,32
A sensory examination with a Semmes-Weinstein monofilament should be conducted to identify patients with loss of protective sensation who may benefit from offloading devices and custom orthotics.15 Foot anatomy and mechanics as well as potential Achilles tendon contractures should be evaluated by a foot specialist such as a podiatrist, orthotist, orthopedist, or vascular surgeon, especially if debridement or amputation is being contemplated.
OBTAINING CULTURES
After diagnosing the infection clinically, appropriately obtained cultures are essential to guide therapy in all except mild cases with no prior antibiotic exposure or MRSA risk.1,15 Guidelines strongly recommend that specimens be obtained by biopsy or curettage from deep tissue at the base of the ulcer after the wound has been cleansed and debrided and prior to initiating antibiotics.1,15,33 Aspiration of purulent secretions using a sterile needle and syringe is another acceptable culturing method.15 While convenient, swab cultures are prone to both false-positive and false-negative results.34 Repeat cultures are only needed for patients who are not responding to treatment or for surveillance of resistant organisms.1
In cases of osteomyelitis, bone specimens should be sent for culture and histology either during surgical debridement or a bone biopsy. At the time of debridement, cultures and pathology should be sent from the proximal (clean) bone margin in order to document whether there is residual osteomyelitis postdebridement.35 For patients not planned for debridement, a bone biopsy is recommended if the diagnosis of osteomyelitis is unclear, response to empiric therapy is poor, broad-spectrum antibiotics are being considered, or the infection is in the midfoot or hindfoot.1,15,19 Results from soft tissue or sinus tract specimens should not be used to guide antibiotic selection in osteomyelitis, as several studies suggest that they do not correlate with bone culture results; one retrospective review found a mere 22.5% correlation between wound swabs and bone biopsy.1,36 A 2-week antibiotic-free period prior to biopsy is recommended in order to minimize the risk of false-negative results but must be balanced with the risk of worsening infection.1,15 If possible, the biopsy should be performed through uninfected tissue under fluoroscopy or CT guidance, with 2 to 3 cores obtained for culture and histology.1,15
INTERPROFESSIONAL INPATIENT CARE
A growing number of health systems have created inpatient and/or outpatient interprofessional diabetic foot care teams, and several studies demonstrated an association between these teams and a reduction in major amputations.7-11,13 The goal of the inpatient team is to rapidly triage patients with moderate to severe infections, expedite surgical interventions and culture collection, establish an effective treatment plan, and ensure adherence postdischarge to optimize outcomes. The common core of most teams includes podiatry, endocrinology, wound care, and vascular surgery, but team composition may vary based on the availability of local specialists with interest and expertise in DFI.9,10,33
The division of consultation between podiatry and orthopedic surgery is highly dependent upon individual practice patterns and hospital structure. In general, forefoot ulcers may be managed by podiatry or orthopedic surgery, while severe Charcot deformities are most often treated by orthopedic surgeons. Wound care nurses are often integral to successful wound healing, collaborating across specialties and serving as a weekly or biweekly point of contact for patients.
Early involvement of Infectious Disease (ID) specialists can be useful for guiding antibiotic choices and facilitating follow-up. ID should be involved with patients who require long-term antibiotic therapy (ie, cases of deep-tissue infection that are not completely amputated or debrided), have failed outpatient or empiric therapy, have antibiotic allergies or drug-resistant pathogens, or are being considered for outpatient parenteral antibiotic therapy.
ANTIBIOTIC THERAPY
The duration of antibiotic treatment for DFI is based on the severity of infection and response to treatment (Supplementary Table 3). Treatment should continue until the signs and symptoms of infection resolve, but there is no strong evidence to support treatment through complete healing. Healing will usually occur in 1 to 2 weeks for mild infections and in 2 to 3 weeks for moderate or severe infections.
Traditional management of diabetic foot osteomyelitis has relied almost exclusively on resection of all infected bone. However, data have emerged over the last 10 years to support initial medical management of select patients. Further research regarding the optimal treatment regimen and duration is ongoing, with 1 recent, randomized control trial comparing 6 versus 12 weeks of antibiotics for patients treated medically for osteomyelitis finding no difference in remission rates.1,41 Patients managed surgically for osteomyelitis are often treated parenterally for at least 4 weeks, but this practice is not based on strong evidence, and guidelines suggest most patients could be switched to highly bioavailable oral agents after a shorter course of intravenous therapy.1,15 Guidelines recommend 2 to 5 days of antibiotics after complete resection of infected bone and soft tissue (Supplementary Table 3). If the infected soft tissue remains, 1 to 3 weeks of therapy is usually sufficient, while 4 to 6 weeks is often needed if there is residually infected but viable bone.15
SURGICAL MANAGEMENT
In patients with osteomyelitis, the decision between medical and surgical management is complex. Absolute indications for surgical resection include systemic toxicity with associated tissue infection, an open or infected joint space, and patients with prosthetic heart valves.27 However, the need for surgery is unclear beyond these absolute indications, and approximately two-thirds of osteomyelitis cases may be arrested or cured with antibiotic therapy alone.1 A prospective randomized comparative trial of patients with diabetic foot osteomyelitis found that patients treated with 90 days of antibiotics had similar healing rates, times to healing, and short-term complications as compared with those who underwent conservative bone resection.44 While further research is needed to determine which types of patients with osteomyelitis may be successfully treated without surgery, the IWGDF, the IDSA, and osteomyelitis experts have offered guidance on this decision (Table 2).1,15,27 If resection is necessary, hospitalists should request at least 4 specimens to help guide postoperative antibiotic therapy (1 sample for histology and 1 for microbiology, at both the grossly abnormal bone and the bone margin), as negative margin cultures predict a lower relapse risk for infection.1,35
CRITERIA FOR DISCHARGE
Guidelines suggest that patients be clinically stable before discharge, complete any urgent surgery, achieve acceptable glycemic control, and be presented with a comprehensive outpatient plan, including antibiotic therapy, offloading, wound care instructions, and outpatient follow-up (Supplementary Table 4). Physicians must consider patient and family preferences, expected adherence to therapy, availability of home support, and payer and cost issues when creating the discharge plan.15
INTERPROFESSIONAL OUTPATIENT CARE
An effective outpatient care team is critical to ensure wound healing and infection resolution. Efforts should be made to discharge patients to a comprehensive outpatient interprofessional foot care team, with a plan that includes professional foot care, patient education, and adequate footwear.48 Team composition varies but often includes representatives from vascular surgery, podiatry, orthotics, wound care, endocrinology, orthopedics, physical therapy and rehabilitation, infectious disease, and dermatology.11-13
CONCLUSION
DFIs are a common cause of morbidity in patients with diabetes and result in significant costs to the US healthcare system. Hospitalized patients with a DFI require appropriate classification of wound severity and assessment of vascular status, protective sensation, and potential osteomyelitis. Inpatient management of these patients includes obtaining necessary cultures, choosing an antibiotic regimen based on infection severity and the likely causative agent, and evaluating the need for surgical intervention. Prior to discharge, providers should determine a comprehensive follow-up plan and ensure patient engagement. Finally, interprofessional management has been shown to improve outcomes in DFI and should be adopted in both the inpatient and outpatient settings.
Disclosure
The authors report no conflicts of interest.
1. Lipsky BA, Aragón-Sánchez J, Diggle M, et al. IWGDF guidance on the diagnosis and management of foot infections in persons with diabetes. Diabetes Metab Res Rev. 2016;32 Suppl 1:45-74. PubMed
2. Hicks CW, Selvarajah S, Mathioudakis N, et al. Burden of infected diabetic foot ulcers on hospital admissions and costs. Ann Vasc Surg. 2016;33:149-158. PubMed
3. Number (in thousands) of hospital discharges with peripheral arterial disease (PAD), ulcer/inflammation/infection (ULCER), or neuropathy as first-listed diagnosis and diabetes as any-listed diagnosis United States, 1988-2007. Centers for Disease Control and Prevention website. http://www.cdc.gov/diabetes/statistics/hosplea/diabetes_complications/fig1_number.htm. Updated 2014. Accessed September 23, 2016.
4. Wilbek TE, Jansen RB, Jørgensen B, Svendsen OL. The diabetic foot in a multidisciplinary team setting. Number of amputations below ankle level and mortality. Exp Clin Endocrinol Diabetes. 2016;124(9):535-540. PubMed
5. Jupiter DC, Thorud JC, Buckley CJ, Shibuya N. The impact of foot ulceration and amputation on mortality in diabetic patients. I: From ulceration to death, a systematic review. Int Wound J. 2016;13(5):892-903. PubMed
6. Young MJ, McCardle JE, Randall LE, Barclay JI. Improved survival of diabetic foot ulcer patients 1995-2008: Possible impact of aggressive cardiovascular risk management. Diabetes Care. 2008;31(11):2143-2147. PubMed
7. Troisi N, Baggiore C, Landini G, Michelagnoli S. How daily practice changed in an urban area after establishing a multidisciplinary diabetic foot program. J Diabetes. 2016;8(4):594-595. PubMed
8. Wang C, Mai L, Yang C, et al. Reducing major lower extremity amputations after the introduction of a multidisciplinary team in patient with diabetes foot ulcer. BMC Endocr Disord. 2016;16(1):38. PubMed
9. Rubio JA, Aragón-Sánchez J, Jiménez S, et al. Reducing major lower extremity amputations after the introduction of a multidisciplinary team for the diabetic foot. Int J Low Extrem Wounds. 2014;13(1):22-26. PubMed
10. Yesil S, Akinci B, Bayraktar F, et al. Reduction of major amputations after starting a multidisciplinary diabetic foot care team: Single centre experience from Turkey. Exp Clin Endocrinol Diabetes. 2009;117(7):345-349. PubMed
11. Dargis V, Pantelejeva O, Jonushaite A, Vileikyte L, Boulton AJ. Benefits of a multidisciplinary approach in the management of recurrent diabetic foot ulceration in Lithuania: A prospective study. Diabetes Care. 1999;22(9):1428-1431. PubMed
12. Driver VR, Goodman RA, Fabbi M, French MA, Andersen CA. The impact of a podiatric lead limb preservation team on disease outcomes and risk prediction in the diabetic lower extremity: a retrospective cohort study. J Am Podiatr Med Assoc. 2010;100(4):235-241. PubMed
13. Hamonet J, Verdié-Kessler C, Daviet JC, et al. Evaluation of a multidisciplinary consultation of diabetic foot. Ann Phys Rehabil Med. 2010;53(5):306-318. PubMed
14. Prompers L, Huijberts M, Apelqvist J, et al. Delivery of care to diabetic patients with foot ulcers in daily practice: Results of the Eurodiale study, a prospective cohort study. Diabet Med. 2008;25(6):700-707. PubMed
15. Lipsky BA, Berendt AR, Cornia PB, et al. 2012 Infectious Diseases Society of America clinical practice guideline for the diagnosis and treatment of diabetic foot infections. Clin Infect Dis. 2012;54(12):e132-e173. PubMed
16. Noor S, Khan RU, Ahmad J. Understanding diabetic foot infection and its management. Diabetes Metab Syndr. 2016;11(2):149-156. PubMed
17. Hill MN, Feldman HI, Hilton SC, Holechek MJ, Ylitalo M, Benedict GW. Risk of foot complications in long-term diabetic patients with and without ESRD: A preliminary study. ANNA J. 1996;23(4):381-386; discussion 387-388. PubMed
18. Mohler ER, III. Peripheral arterial disease: Identification and implications. Arch Intern Med. 2003;163(19):2306-2314. PubMed
19. Hingorani A, LaMuraglia GM, Henke P, et al. The management of diabetic foot: A clinical practice guideline by the Society for Vascular Surgery in collaboration with the American Podiatric Medical Association and the Society for Vascular Medicine. J Vasc Surg. 2016;63(2 Suppl):3S-21S. PubMed
20. Noor S, Zubair M, Ahmad J. Diabetic foot ulcer--A review on pathophysiology, classification and microbial etiology. Diabetes Metab Syndr. 2015;9(3):192-199. PubMed
21. Wukich DK, Hobizal KB, Brooks MM. Severity of diabetic foot infection and rate of limb salvage. Foot Ankle Int. 2013;34(3):351-358. PubMed
22. Wukich DK, Hobizal KB, Raspovic KM, Rosario BL. SIRS is valid in discriminating between severe and moderate diabetic foot infections. Diabetes Care. 2013;36(11):3706-3711. PubMed
23. Grigoropoulou P, Eleftheriadou I, Jude EB, Tentolouris N. Diabetic foot infections: An update in diagnosis and management. Curr Diab Rep. 2017;17(1):3. PubMed
24. Glaudemans AW, Uçkay I, Lipsky BA. Challenges in diagnosing infection in the diabetic foot. Diabet Med. 2015;32(6):748-759. PubMed
25. Fleischer AE, Didyk AA, Woods JB, Burns SE, Wrobel JS, Armstrong DG. Combined clinical and laboratory testing improves diagnostic accuracy for osteomyelitis in the diabetic foot. J Foot Ankle Surg. 2009;48(1):39-46. PubMed
26. Jeffcoate WJ, Lipsky BA. Controversies in diagnosing and managing osteomyelitis of the foot in diabetes. Clin Infect Dis. 2004;39 Suppl 2:S115-S122. PubMed
27. Allahabadi S, Haroun KB, Musher DM, Lipsky BA, Barshes NR. Consensus on surgical aspects of managing osteomyelitis in the diabetic foot. Diabet Foot Ankle. 2016;7:30079. PubMed
28. La Fontaine J, Bhavan K, Lam K, et al. Comparison between Tc-99m WBC SPECT/CT and MRI for the diagnosis of biopsy-proven diabetic foot osteomyelitis. Wounds. 2016;28(8):271-278. PubMed
29. Bembi V, Singh S, Singh P, Aneja GK, Arya TV, Arora R. Prevalence of peripheral arterial disease in a cohort of diabetic patients. South Med J. 2006;99(6):564-569. PubMed
30. Marso SP, Hiatt WR. Peripheral arterial disease in patients with diabetes. J Am Coll Cardiol. 2006;47(5):921-929. PubMed
31. Hinchliffe RJ, Andros G, Apelqvist J, et al. A systematic review of the effectiveness of revascularization of the ulcerated foot in patients with diabetes and peripheral arterial disease. Diabetes Metab Res Rev. 2012;28 Suppl 1:179-217. PubMed
32. Brownrigg JR, Apelqvist J, Bakker K, Schaper NC, Hinchliffe RJ. Evidence-based management of PAD & the diabetic foot. Eur J Vasc Endovasc Surg. 2013;45(6):673-681. PubMed
33. 2015;13(2):115-122.Ann Fam Med49. Jackson C, Shahsahebi M, Wedlake T, DuBard CA. Timeliness of outpatient follow-up: an evidence-based approach for planning after hospital discharge. PubMed
34. 2016;32 Suppl 1:16-24.Diabetes Metab Res Rev48. Bus SA, van Netten JJ, Lavery LA, et al. IWGDF guidance on the prevention of foot ulcers in at-risk patients with diabetes. PubMed
35. 2003;85-A(8):1436-1445.J Bone Joint Surg Am47. Mueller MJ, Sinacore DR, Hastings MK, Strube MJ, Johnson JE. Effect of Achilles tendon lengthening on neuropathic plantar ulcers. A randomized clinical trial. PubMed
36. 2015;21(2):77-85.Foot Ankle Surg46. Cychosz CC, Phisitkul P, Belatti DA, Glazebrook MA, DiGiovanni CW. Gastrocnemius recession for foot and ankle conditions in adults: Evidence-based recommendations. PubMed
37. 2016;32 Suppl 1:25-36.Diabetes Metab Res Rev45. Bus SA, Armstrong DG, van Deursen RW, et al. IWGDF guidance on footwear and offloading interventions to prevent and heal foot ulcers in patients with diabetes. PubMed
38. 2014;37(3):789-795.Diabetes Care44. Lázaro-Martínez JL, Aragón-Sánchez J, García-Morales E. Antibiotics versus conservative surgery for treating diabetic foot osteomyelitis: A randomized comparative trial. PubMed
39. 1996;183(1):61-64.J Am Coll Surg43. Steed DL, Donohoe D, Webster MW, Lindsley L. Effect of extensive debridement and treatment on the healing of diabetic foot ulcers. Diabetic Ulcer Study Group. PubMed
40. 2002;10(6):354-359.Wound Repair Regen42. Saap LJ, Falanga V. Debridement performance index and its correlation with complete closure of diabetic foot ulcers. PubMed
41. 2015;38(2):302-307.Diabetes Care41. Tone A, Nguyen S, Devemy F, et al. Six-week versus twelve-week antibiotic therapy for nonsurgically treated diabetic foot osteomyelitis: A multicenter open-label controlled randomized study. PubMed
42. 2014;35(10):1229-1235.Infect Control Hosp Epidemiol40. Schultz L, Lowe TJ, Srinivasan A, Neilson D, Pugliese G. Economic impact of redundant antimicrobial therapy in US hospitals. PubMed
43. 2015;31(4):395-401.Diabetes Metab Res Rev39. Lipsky BA, Cannon CM, Ramani A, et al. Ceftaroline fosamil for treatment of diabetic foot infections: the CAPTURE study experience. PubMed
2011;55(9):4154-4160.Antimicrob Agents Chemother.38. Richter SS, Heilmann KP, Dohrn CL, et al. Activity of ceftaroline and epidemiologic trends in Staphylococcus aureus isolates collected from 43 medical centers in the United States in 2009. PubMed
44. 2011;52(3):e18-e55.Clin Infect Dis37. Liu C, Bayer A, Cosgrove SE, et al. Clinical practice guidelines by the Infectious Diseases Society of America for the treatment of methicillin-resistant Staphylococcus aureus infections in adults and children. PubMed
45. 2006;42(1):57-62.Clin Infect Dis36. Senneville E, Melliez H, Beltrand E, et al. Culture of percutaneous bone biopsy specimens for diagnosis of diabetic foot osteomyelitis: Concordance with ulcer swab cultures. PubMed
46. 2012;51(6):749-752.J Foot Ankle Surg35. Atway S, Nerone VS, Springer KD, Woodruff DM. Rate of residual osteomyelitis after partial foot amputation in diabetic patients: A standardized method for evaluating bone margins with intraoperative culture. PubMed
47. 2010;5(7):415-420.J Hosp Med34. Chakraborti C, Le C, Yanofsky A. Sensitivity of superficial cultures in lower extremity wounds. PubMed
48. 2013;36(9):2862-2871.Diabetes Care33. Wukich DK, Armstrong DG, Attinger CE, et al. Inpatient management of diabetic foot disorders: A clinical guide. PubMed
© 2017 Society of Hospital Medicine
A Strong Diagnosis of Weakness
A 52-year-old man presented with bilateral weakness in all extremities. He noted the gradual onset of progressive muscle weakness 6 months prior to presentation. He reported generalized fatigue and difficulty with climbing stairs and carrying heavy objects.
Initial considerations of chronic weakness and fatigue are myopathy, polyneuropathy, medications, malignancy, endocrinopathies, human immunodeficiency virus (HIV), neuromuscular junction dysfunction, and central nervous system (CNS) disorders, such as amyotrophic lateral sclerosis (ALS) or multiple sclerosis (MS). Symmetrical muscle involvement and proximal weakness make myopathy most likely. Polyneuropathy, such as chronic inflammatory demyelinating polyneuropathy (CIDP), is less likely but still possible given the slowly progressive course. The use of medications that can cause myopathy should be explored, including colchicine, steroids, and statins. Gathering further history should focus on risk factors for HIV, as well as alcohol and illicit drug use. Malignancy can cause paraneoplastic myopathy. The review of systems should include symptoms of endocrinopathies, such as thyrotoxicosis and hypothyroidism. Fluctuations in weakness and dysphagia or ocular symptoms would suggest myasthenia gravis (MG). The time course and symmetrical weakness make a central disorder, such as ALS or MS, unlikely.
His past medical history was notable for pulmonary tuberculosis diagnosed at the age of 6 years, which was treated with hospitalization and an unknown medication regimen. He was not taking medications prior to this admission. His family history was significant for diabetes mellitus in both parents. He denied sick contacts. He was sexually active with his wife. He denied the use of tobacco and illicit drugs but endorsed alcohol consumption on a daily basis over the last 32 years. He reported no fluctuation in his symptoms, muscle or joint pains, rash, fevers, chills, diaphoresis, chest pain, dyspnea, abdominal pain, diarrhea, paresthesias, weight loss, or night sweats. He had never had a colonoscopy.
Painless progressive weakness of the limbs without sensory deficit is typical of a myopathy. Though CIDP can present with only motor weakness, the majority of patients have sensory symptoms, making this less likely. Although chronic alcohol abuse can cause myopathy, it seems less likely because other neurologic complications, such as sensory polyneuropathy or ataxia, would be expected. A review of systems does not suggest a thyroid disorder or malignancy, although this does not preclude an evaluation for both. The absence of fluctuations in weakness argues against MG. Though ALS, MG, MS, and CIDP are less likely, a neurologic exam is crucial in excluding them. The hallmark of ALS is upper motor neuron (UMN) and lower motor neuron signs in the absence of sensory symptoms and signs, while global hyporeflexia would be expected in CIDP, and fatigability on repeated power testing would be expected in MG. Neurologic findings disseminated in space (neuro-anatomically) would be expected in MS.
On physical examination, the patient had a temperature of 36.9°C, heart rate of 70 beats per minute, and regular respiratory rate of 10 breaths per minute, blood pressure 130/80 mmHg, and oxygen saturation 98% while breathing ambient air. Auscultation of the heart and lungs revealed normal findings. The abdomen was soft, nontender, and without masses or organomegaly. Neurologic examination disclosed bilateral symmetric upper and lower extremity weakness with positive Gower sign. Muscle strength scores of the bilateral biceps brachii, iliopsoas, and digitis extensor were between 4 and 5 without fatigability. Grasping power was impaired. Deep tendon reflexes were preserved, and there were no UMN signs. There was no tenderness to palpation in any muscle groups. Sensory testing was normal. Skin and lymph examinations were without abnormality. The rest of the physical examination was unremarkable.
Gower sign, characteristic of but not specific to muscular dystrophy, indicates proximal muscle weakness of lower extremities, wherein hands and arms are used to walk up the body into an upright position. The exam also reveals distal weakness as shown by reduced hand grasp. Symmetrical proximal weakness of all extremities without sensory deficits suggests a myopathic process, albeit one with some distal involvement. The absence of UMN signs argues against ALS, lack of fatigability argues against MG, and the absence of CNS or sensory deficits argues against MS.
Because myopathy is most likely, the next step would be to determine if this is an idiopathic inflammatory myopathy, such as polymyositis (PM) or dermatomyositis (DM), secondary inflammatory myopathy, or noninflammatory myopathy due to endocrinopathies. The time course is consistent with an inflammatory myopathy, such as PM or DM. Inclusion body myositis (IBM), another inflammatory myopathy, presents much more insidiously over years and tends to be asymmetric compared to PM. The absence of myalgia, arthralgia, rash, and gastrointestinal symptoms makes myopathy as a component of a connective tissue disease, such as systemic lupus erythematosus, or a mixed connective tissue disease unlikely. The next steps would be laboratory testing of muscle enzymes, complete blood count, biochemical profile, and antinuclear antibody (ANA).
Laboratory studies revealed a white blood cell count of 4460/mm3 with normal differential, hemoglobin 12.5 g/dL, and platelet count 345,000/mm3. Creatinine was 0.87 mg/dL, aspartate aminotransferase 61 IU/mL, alanine aminotransferase 45 IU/mL, and creatine kinase (CK) 529 U/L (normal range, 38-174 U/L). Other liver function enzymes were normal. Biochemistry studies disclosed normal sodium, potassium, glucose, calcium, and magnesium levels. Dipstick urinalysis revealed blood and protein, and the microscopic examination of urinary sediment was unremarkable without the presence of erythrocytes. Twenty-four-hour creatinine clearance was 106 mL/min (normal range, 97-137 mL/min). Chest radiography was unrevealing.
The modest increase in CK, evidence of myoglobinuria, and proteinuria can all occur with an inflammatory or metabolic myopathy. The combination of proximal and distal weakness, coupled with only a modestly elevated CK, makes IBM more likely than PM, as PM usually presents with proximal weakness and much higher CK values. Normal skin examination makes DM less likely, as skin manifestations are generally found at time of presentation. The onset of symptoms after age 50 and the patient being male also favor IBM, though a longer time course would be expected. Definitively distinguishing IBM from PM is important because treatment and prognosis differ.
Thyroid function and HIV testing should be obtained. ANA, more common in PM than in IBM, should be checked because these myopathies can be associated with other autoimmune diseases. Imaging is generally not essential, although magnetic resonance imaging (MRI) of the thighs may help to differentiate IBM from PM. Electromyography (EMG) should be done to determine the pattern of myopathy and select muscle biopsy sites.
Additional testing revealed a normal thyroid stimulating hormone level. HIV and ANA were negative. Serum aldolase level was 19 IU/L (normal range, 2.7-5.9 IU/L), myoglobin 277 ng/mL (normal range, 28-72 ng/mL), lactate dehydrogenase 416 IU/mL (normal range, 119-229 IU/mL), and C-reactive protein 0.32 mg/dL. An EMG revealed mild myogenic changes in all extremities. An MRI of the left brachial muscle revealed multiple scattered high-signal lesions.
The EMG and MRI findings are consistent with an inflammatory myopathy. The modest elevation in muscle enzymes and negative ANA are more consistent with IBM since most patients with PM or DM are ANA positive. Muscle biopsy can be very helpful in establishing the etiology of myopathy.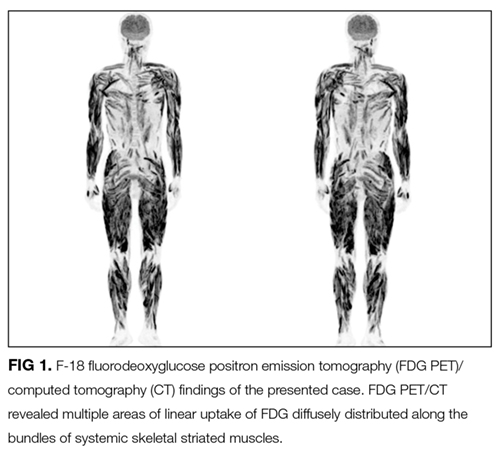
Malignancy is associated with DM and PM in about 9% and 4% of patients, respectively. The common cancers associated with these conditions are adenocarcinomas of the ovary, cervix, lung, pancreas, and stomach. Most cancers are diagnosed around the time of myositis diagnosis, although they can precede or follow by years. Idiopathic IBM is not associated with cancer.
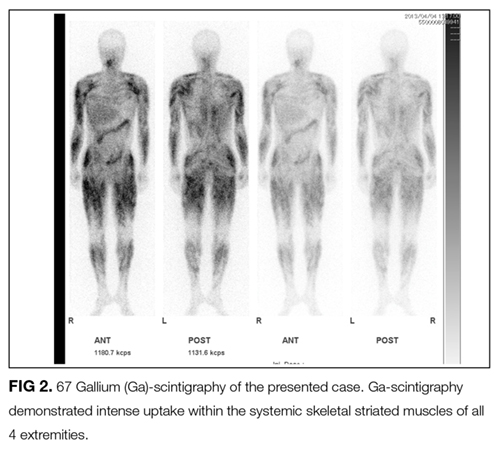
Open surgical muscle biopsy of the left biceps brachii was performed. Light microscopic examination disclosed interstitial edema and noncaseating granulomas. Immunostaining revealed an increase in the number of cluster of differentiation (CD) 4+ T cells. Caseating granulomas and Langhans giant cells were not present (Figure 3).

Tuberculin reaction and interferon-γ-release assay were negative. Staining for AFB and fungi was negative. ANCA, rheumatoid factor (RF), anti-Ro/SSA, anti-La/SSB, anti-Sm, anti-RNP, and anti-Jo-1 were all negative or unremarkable. Serum angiotensin converting enzyme (ACE) level was 155.6 U/L (normal range, 7-25 U/L). Twenty-four-hour urine analysis revealed calcium excretion of 517.7 mg/day (normal range, 58-450 mg/day), β2-microglobulin 69,627 ug/day (normal range, <254 ug/day), and N-acetyl-D-glucosamine 95.3 U/day (normal range, <5.1 U/day) with a normal creatinine clearance. Serum intact parathyroid hormone level (PTH) was 5 pg/mL (normal range, 10-65 pg/mL), and 25-hydroxyvitamin D level was 51.1 ng/mL (normal range, 30-80 ng/mL). A CT of the thorax revealed a small ground-glass density lesion in the left lower lobe but no hilar or mediastinal lymphadenopathy.
Negative ANCA, RF, and autoantibodies exclude systemic vasculitis and connective tissue disease as causes of GM. Hypercalciuria is suggestive of granulomatous production of calcitriol, which, in turn, suppresses PTH. Hypercalcemia is not common in patients with sarcoidosis, but hypercalciuria occurs frequently. Serum ACE is a marker associated with sarcoidosis, but its diagnostic and prognostic utility is unclear.
Though there is a concern for sarcoidosis, this diagnosis can only be confidently made by finding noncaseating granulomas on a background of compatible clinical and radiologic findings after alternate possible etiologies are excluded. The chest CT reveals a small ground-glass density lesion without hilar adenopathy. These findings, though not incompatible, are not typical for pulmonary sarcoidosis. Therefore, finding noncaeseating granulomas in a second organ system would point toward systemic sarcoidosis as a unifying diagnosis. Bronchoscopy with bronchoalveolar lavage (BAL) and transbronchial biopsy has a reasonable yield even in the absence of hilar adenopathy or typical parenchymal findings. A CD4/CD8 T-cell ratio of 2 or more on BAL provides supportive evidence for sarcoidosis.
It is reasonable to start empiric glucocorticoids for GM given that the AFB and fungal stains on histopathology are negative and that there is no evidence of lymphoma.
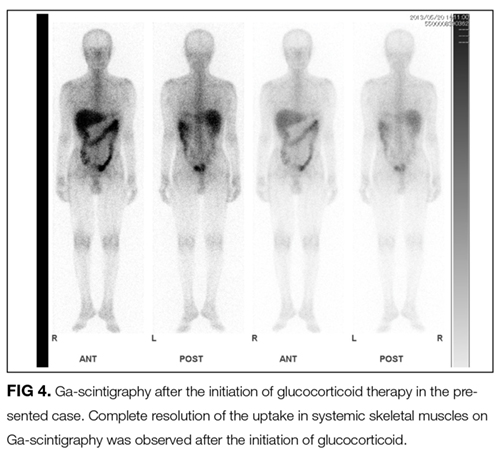
The CD4/CD8 T-cell ratio greater than 2, combined with the absence of neutrophils and eosinophils on BAL, is helpful in distinguishing sarcoidosis from other pulmonary diseases. This patient’s inflammatory myopathy was revealed to be a rare initial manifestation of systemic sarcoidosis.
DISCUSSION
Weakness is a common symptom of muscle disorders such as myopathies and muscular dystrophy. Idiopathic inflammatory myopathies include PM, DM, and others.1,2 These usually present with proximal-dominant muscle weakness, decreased endurance, and muscle inflammation. A diagnosis is made according to symptoms in combination with diagnostic examinations, including elevated serum CK levels, abnormal EMG findings, and histopathology of skeletal muscle biopsy specimens.
Sarcoidosis, a multisystem disorder of unknown etiology, is characterized histopathologically by noncaseating granulomas in affected organs.3 It typically affects young adults, with incidence peaking at 20 to 39 years of age. Although any organ may be involved, the disorder usually presents with 1 or more common abnormalities, including bilateral hilar lymphadenopathy, lung lesions, and skin and eye involvement. Musculoskeletal involvement is less common. It is estimated that skeletal muscle is involved in 50% to 80% of patients with sarcoidosis but is rarely symptomatic (0.5% to 2.5%).4-6
In this patient, weakness was distributed in both proximal and distal muscles, yet proximal weakness is the most characteristic feature in PM and DM. Therefore, sarcoidosis should be considered in the differential diagnosis of idiopathic inflammatory myopathies, especially when weakness accompanies abnormalities in other organs typically affected by sarcoidosis.
Myoglobinuria often is observed in rhabdomyolysis and inflammatory myopathies, conditions that produce high levels of serum CK and myoglobin. Myoglobinuria, often accompanied by the elevation of urinary β2-microglobulin and N-acetyl-D-glucosamine levels, can induce tubulointerstitial damage, which leads to acute kidney injury. In this case, however, these abnormal kidney findings were observed without high levels of serum CK or myoglobin. This suggests the potential for other causes of tubulointerstitial damage, such as granulomatous interstitial nephritis in renal sarcoidosis.3
Another characteristic abnormality was the elevation of urinary calcium excretion, which indicated an underlying granulomatous disorder, such as mycobacterial infection, granulomatosis with polyangiitis, or sarcoidosis. In sarcoidosis, hypercalciuria occurs in 40% of patients, hypercalcemia in 11%, and renal calculi in 10%.3,7 Hypercalciuria, for this patient, was important in arriving at the correct diagnosis after the gallium scan was obtained given the dearth of other typical features of sarcoidosis.
Although muscle biopsy is essential, imaging studies for idiopathic inflammatory myopathy are considered useful tools to narrow the differential diagnosis. The use of MRI of the skeletal muscle is helpful to both identify an adequate muscle for biopsy and demonstrate the pattern of affected muscles beyond clinical appearance, which aids in excluding, for example, muscular dystrophies.8,9
FDG PET/CT is a very sensitive imaging modality used to detect neoplastic lesions and has been widely used to screen for occult neoplasms and detect metastases.10-12 It is also useful for detecting inflammation in patients with osteomyelitis, metastatic infectious diseases, rheumatoid arthritis, vasculitis, inflammatory bowel diseases, fever of unknown origin, and sarcoidosis.11,12 In PM and DM, however, the sensitivity of FDG PET/CT for detection of myositis is reportedly lower than that of EMG and MRI.13 Similarly, gallium scintigraphy is usually performed to examine the disease activity of interstitial pneumonia or to detect malignancy. Previous literature and this case show that the striking images of gallium scintigraphy and FDG PET/CT have utility, not only for detection of sarcoid myopathy but also for the evaluation of treatment efficacy.14-17 Characteristic imaging findings on FDG PET/CT have been described as a “tiger man” appearance.17
For the treatment of sarcoid myopathy, systemic glucocorticoids are used for patients with symptomatic acute or chronic forms. The standard doses of prednisolone used for other forms of idiopathic inflammatory myopathies are usually administered.3-6 In general, the response of acute sarcoid myopathy to glucocorticoid therapy is favorable, and the clinical course is usually benign. However, the course in chronic sarcoid myopathy can be unpredictable with exacerbations. Given the lack of randomized trials of this therapy and because glucocorticoids themselves can cause steroid-induced myopathy, they are not used for asymptomatic patients.
In the end, astute clinical thinking, deductive reasoning, and pattern recognition were all instrumental in making this strong diagnosis of weakness.
KEY TEACHING POINTS
- Proximal muscle–dominant weakness is the characteristic feature in inflammatory myopathies like PM and DM. Myopathy causing proximal and distal weakness is more characteristic of sarcoidosis, IBM, alcohol, and statins.
- Elevations of urinary Times New Romanβ2-microglobulin and N-acetyl-D-glucosamine are often observed in inflammatory muscle diseases because of myoglobin-induced tubulointerstitial damage. These findings may also be caused by other conditions that affect the tubules, such as lupus nephritis, Sjogren’s syndrome, or renal sarcoidosis.
- Hypercalciuria in a patient with myopathy could suggest an underlying granulomatous disorder, such as mycobacterial infection, granulomatosis with polyangiitis, or sarcoidosis.
- The striking uptake within systemic skeletal striated muscles on gallium scintigraphy and “tiger man” appearance on FDG PET/CT are characteristic features of acute sarcoid myopathy; these are not common in other inflammatory myopathies.
Disclosure
Drs. Sudo, Wada, Narita, Mba, and Houchens have no conflicts of interest to disclose.
1. Vincze M, Danko K. Idiopathic inflammatory myopathies. Best Pract Res Clin Rheumatol. 2012;26:25-45. PubMed
2. Carstens PO, Schmidt J. Diagnosis, pathogenesis, and treatment of myositis: recent advances. Clin Exp Immunol. 2014;175:425-438. PubMed
3. Lannuzzi MC, Rhbicki BA, Teirstein AS. Sarcoidosis. N Eng J Med. 2007;357:2153-2165. PubMed
4. Baydur A, Pandya K, Sharma OP, et al. Control of ventilation, respiratory muscle strength, and granulomatous involvement of skeletal muscle in patients with sarcoidosis. Chest. 1993;103:396-402. PubMed
5. Zisman DA, Biermann JS, Martinez FJ, et al. Sarcoidosis presenting as a tumorlike muscular lesion. Case report and review of the literature. Medicine (Baltimore). 1999;78:112-122. PubMed
6. Fayad F, Liote F, Berenbaum F, et al. Muscle involvement in sarcoidosis: a retrospective and followup studies. J Rheumatol. 2006;33:98-103. PubMed
7. Berliner AR, Haas M, Choi MJ. Sarcoidosis: the nephrologist’s perspective. Am J Kidney Dis. 2006;48:856-870. PubMed
8. Otake S, Ishigaki T. Musular sarcoidosis. Semin Musculoskelet Radiol. 2001;5:167-170. PubMed
9. Otake S, Imagumbai N, Suzuki M, et al. MR imaging of muscular sarcoidosis after steroid therapy. Eur Radiol. 1998;8:1651-1653. PubMed
10. Hoffman JM, Gambhir SS. Molecular imaging: The vision and opportunity for radiology in the future. Radiology. 2007;244:39-47. PubMed
11. Basu S, Zhuang H, Torigian DA, et al. Functional imaging of inflammatory diseases using nuclear medicine techniques. Semin Nucl Med. 2009;39:124-145. PubMed
12. Gotthardt M, Cleeker-Rovers CP, Boerman OC, et al. Imaging of inflammation by PET, conventional scintigraphy, and other imaging techniques. J Nucl Med. 2010;51:1937-1949. PubMed
13. Owada T, Maezawa R, Kurasawa K, et al. Detection of inflammatory lesions by F-18 fluorodeoxyglucose positron emission tomography in patients with polymyositis and dermatomyositis. J Rheumatol. 2012;39:1659-1665. PubMed
14. Liem IH, Drent M, Antevska E, et al. Intense muscle uptake of gallium-67 in a patient with sarcoidosis. J Nucl Med. 1998;39:1605-1607. PubMed
15. Suehiro S, Shiokawa S, Taniguchi S, et al. Gallium-67 scintigraphy in the diagnosis and management of chronic sarcoid myopathy. Clin Rheumatol. 2003;22:146-148. PubMed
16. Marie I, Josse S, Lahaxe L, et al. Clinical images: muscle sarcoidosis demonstrated on positron emission tomography. Arthritis Rheum. 2009;60:2847. PubMed
17. Wieers G, Lhommel R, Lecouvet F, et al. A tiger man. Lancet. 2012;380:1859. PubMed
A 52-year-old man presented with bilateral weakness in all extremities. He noted the gradual onset of progressive muscle weakness 6 months prior to presentation. He reported generalized fatigue and difficulty with climbing stairs and carrying heavy objects.
Initial considerations of chronic weakness and fatigue are myopathy, polyneuropathy, medications, malignancy, endocrinopathies, human immunodeficiency virus (HIV), neuromuscular junction dysfunction, and central nervous system (CNS) disorders, such as amyotrophic lateral sclerosis (ALS) or multiple sclerosis (MS). Symmetrical muscle involvement and proximal weakness make myopathy most likely. Polyneuropathy, such as chronic inflammatory demyelinating polyneuropathy (CIDP), is less likely but still possible given the slowly progressive course. The use of medications that can cause myopathy should be explored, including colchicine, steroids, and statins. Gathering further history should focus on risk factors for HIV, as well as alcohol and illicit drug use. Malignancy can cause paraneoplastic myopathy. The review of systems should include symptoms of endocrinopathies, such as thyrotoxicosis and hypothyroidism. Fluctuations in weakness and dysphagia or ocular symptoms would suggest myasthenia gravis (MG). The time course and symmetrical weakness make a central disorder, such as ALS or MS, unlikely.
His past medical history was notable for pulmonary tuberculosis diagnosed at the age of 6 years, which was treated with hospitalization and an unknown medication regimen. He was not taking medications prior to this admission. His family history was significant for diabetes mellitus in both parents. He denied sick contacts. He was sexually active with his wife. He denied the use of tobacco and illicit drugs but endorsed alcohol consumption on a daily basis over the last 32 years. He reported no fluctuation in his symptoms, muscle or joint pains, rash, fevers, chills, diaphoresis, chest pain, dyspnea, abdominal pain, diarrhea, paresthesias, weight loss, or night sweats. He had never had a colonoscopy.
Painless progressive weakness of the limbs without sensory deficit is typical of a myopathy. Though CIDP can present with only motor weakness, the majority of patients have sensory symptoms, making this less likely. Although chronic alcohol abuse can cause myopathy, it seems less likely because other neurologic complications, such as sensory polyneuropathy or ataxia, would be expected. A review of systems does not suggest a thyroid disorder or malignancy, although this does not preclude an evaluation for both. The absence of fluctuations in weakness argues against MG. Though ALS, MG, MS, and CIDP are less likely, a neurologic exam is crucial in excluding them. The hallmark of ALS is upper motor neuron (UMN) and lower motor neuron signs in the absence of sensory symptoms and signs, while global hyporeflexia would be expected in CIDP, and fatigability on repeated power testing would be expected in MG. Neurologic findings disseminated in space (neuro-anatomically) would be expected in MS.
On physical examination, the patient had a temperature of 36.9°C, heart rate of 70 beats per minute, and regular respiratory rate of 10 breaths per minute, blood pressure 130/80 mmHg, and oxygen saturation 98% while breathing ambient air. Auscultation of the heart and lungs revealed normal findings. The abdomen was soft, nontender, and without masses or organomegaly. Neurologic examination disclosed bilateral symmetric upper and lower extremity weakness with positive Gower sign. Muscle strength scores of the bilateral biceps brachii, iliopsoas, and digitis extensor were between 4 and 5 without fatigability. Grasping power was impaired. Deep tendon reflexes were preserved, and there were no UMN signs. There was no tenderness to palpation in any muscle groups. Sensory testing was normal. Skin and lymph examinations were without abnormality. The rest of the physical examination was unremarkable.
Gower sign, characteristic of but not specific to muscular dystrophy, indicates proximal muscle weakness of lower extremities, wherein hands and arms are used to walk up the body into an upright position. The exam also reveals distal weakness as shown by reduced hand grasp. Symmetrical proximal weakness of all extremities without sensory deficits suggests a myopathic process, albeit one with some distal involvement. The absence of UMN signs argues against ALS, lack of fatigability argues against MG, and the absence of CNS or sensory deficits argues against MS.
Because myopathy is most likely, the next step would be to determine if this is an idiopathic inflammatory myopathy, such as polymyositis (PM) or dermatomyositis (DM), secondary inflammatory myopathy, or noninflammatory myopathy due to endocrinopathies. The time course is consistent with an inflammatory myopathy, such as PM or DM. Inclusion body myositis (IBM), another inflammatory myopathy, presents much more insidiously over years and tends to be asymmetric compared to PM. The absence of myalgia, arthralgia, rash, and gastrointestinal symptoms makes myopathy as a component of a connective tissue disease, such as systemic lupus erythematosus, or a mixed connective tissue disease unlikely. The next steps would be laboratory testing of muscle enzymes, complete blood count, biochemical profile, and antinuclear antibody (ANA).
Laboratory studies revealed a white blood cell count of 4460/mm3 with normal differential, hemoglobin 12.5 g/dL, and platelet count 345,000/mm3. Creatinine was 0.87 mg/dL, aspartate aminotransferase 61 IU/mL, alanine aminotransferase 45 IU/mL, and creatine kinase (CK) 529 U/L (normal range, 38-174 U/L). Other liver function enzymes were normal. Biochemistry studies disclosed normal sodium, potassium, glucose, calcium, and magnesium levels. Dipstick urinalysis revealed blood and protein, and the microscopic examination of urinary sediment was unremarkable without the presence of erythrocytes. Twenty-four-hour creatinine clearance was 106 mL/min (normal range, 97-137 mL/min). Chest radiography was unrevealing.
The modest increase in CK, evidence of myoglobinuria, and proteinuria can all occur with an inflammatory or metabolic myopathy. The combination of proximal and distal weakness, coupled with only a modestly elevated CK, makes IBM more likely than PM, as PM usually presents with proximal weakness and much higher CK values. Normal skin examination makes DM less likely, as skin manifestations are generally found at time of presentation. The onset of symptoms after age 50 and the patient being male also favor IBM, though a longer time course would be expected. Definitively distinguishing IBM from PM is important because treatment and prognosis differ.
Thyroid function and HIV testing should be obtained. ANA, more common in PM than in IBM, should be checked because these myopathies can be associated with other autoimmune diseases. Imaging is generally not essential, although magnetic resonance imaging (MRI) of the thighs may help to differentiate IBM from PM. Electromyography (EMG) should be done to determine the pattern of myopathy and select muscle biopsy sites.
Additional testing revealed a normal thyroid stimulating hormone level. HIV and ANA were negative. Serum aldolase level was 19 IU/L (normal range, 2.7-5.9 IU/L), myoglobin 277 ng/mL (normal range, 28-72 ng/mL), lactate dehydrogenase 416 IU/mL (normal range, 119-229 IU/mL), and C-reactive protein 0.32 mg/dL. An EMG revealed mild myogenic changes in all extremities. An MRI of the left brachial muscle revealed multiple scattered high-signal lesions.
The EMG and MRI findings are consistent with an inflammatory myopathy. The modest elevation in muscle enzymes and negative ANA are more consistent with IBM since most patients with PM or DM are ANA positive. Muscle biopsy can be very helpful in establishing the etiology of myopathy.
Malignancy is associated with DM and PM in about 9% and 4% of patients, respectively. The common cancers associated with these conditions are adenocarcinomas of the ovary, cervix, lung, pancreas, and stomach. Most cancers are diagnosed around the time of myositis diagnosis, although they can precede or follow by years. Idiopathic IBM is not associated with cancer.
Open surgical muscle biopsy of the left biceps brachii was performed. Light microscopic examination disclosed interstitial edema and noncaseating granulomas. Immunostaining revealed an increase in the number of cluster of differentiation (CD) 4+ T cells. Caseating granulomas and Langhans giant cells were not present (Figure 3).
Tuberculin reaction and interferon-γ-release assay were negative. Staining for AFB and fungi was negative. ANCA, rheumatoid factor (RF), anti-Ro/SSA, anti-La/SSB, anti-Sm, anti-RNP, and anti-Jo-1 were all negative or unremarkable. Serum angiotensin converting enzyme (ACE) level was 155.6 U/L (normal range, 7-25 U/L). Twenty-four-hour urine analysis revealed calcium excretion of 517.7 mg/day (normal range, 58-450 mg/day), β2-microglobulin 69,627 ug/day (normal range, <254 ug/day), and N-acetyl-D-glucosamine 95.3 U/day (normal range, <5.1 U/day) with a normal creatinine clearance. Serum intact parathyroid hormone level (PTH) was 5 pg/mL (normal range, 10-65 pg/mL), and 25-hydroxyvitamin D level was 51.1 ng/mL (normal range, 30-80 ng/mL). A CT of the thorax revealed a small ground-glass density lesion in the left lower lobe but no hilar or mediastinal lymphadenopathy.
Negative ANCA, RF, and autoantibodies exclude systemic vasculitis and connective tissue disease as causes of GM. Hypercalciuria is suggestive of granulomatous production of calcitriol, which, in turn, suppresses PTH. Hypercalcemia is not common in patients with sarcoidosis, but hypercalciuria occurs frequently. Serum ACE is a marker associated with sarcoidosis, but its diagnostic and prognostic utility is unclear.
Though there is a concern for sarcoidosis, this diagnosis can only be confidently made by finding noncaseating granulomas on a background of compatible clinical and radiologic findings after alternate possible etiologies are excluded. The chest CT reveals a small ground-glass density lesion without hilar adenopathy. These findings, though not incompatible, are not typical for pulmonary sarcoidosis. Therefore, finding noncaeseating granulomas in a second organ system would point toward systemic sarcoidosis as a unifying diagnosis. Bronchoscopy with bronchoalveolar lavage (BAL) and transbronchial biopsy has a reasonable yield even in the absence of hilar adenopathy or typical parenchymal findings. A CD4/CD8 T-cell ratio of 2 or more on BAL provides supportive evidence for sarcoidosis.
It is reasonable to start empiric glucocorticoids for GM given that the AFB and fungal stains on histopathology are negative and that there is no evidence of lymphoma.
The CD4/CD8 T-cell ratio greater than 2, combined with the absence of neutrophils and eosinophils on BAL, is helpful in distinguishing sarcoidosis from other pulmonary diseases. This patient’s inflammatory myopathy was revealed to be a rare initial manifestation of systemic sarcoidosis.
DISCUSSION
Weakness is a common symptom of muscle disorders such as myopathies and muscular dystrophy. Idiopathic inflammatory myopathies include PM, DM, and others.1,2 These usually present with proximal-dominant muscle weakness, decreased endurance, and muscle inflammation. A diagnosis is made according to symptoms in combination with diagnostic examinations, including elevated serum CK levels, abnormal EMG findings, and histopathology of skeletal muscle biopsy specimens.
Sarcoidosis, a multisystem disorder of unknown etiology, is characterized histopathologically by noncaseating granulomas in affected organs.3 It typically affects young adults, with incidence peaking at 20 to 39 years of age. Although any organ may be involved, the disorder usually presents with 1 or more common abnormalities, including bilateral hilar lymphadenopathy, lung lesions, and skin and eye involvement. Musculoskeletal involvement is less common. It is estimated that skeletal muscle is involved in 50% to 80% of patients with sarcoidosis but is rarely symptomatic (0.5% to 2.5%).4-6
In this patient, weakness was distributed in both proximal and distal muscles, yet proximal weakness is the most characteristic feature in PM and DM. Therefore, sarcoidosis should be considered in the differential diagnosis of idiopathic inflammatory myopathies, especially when weakness accompanies abnormalities in other organs typically affected by sarcoidosis.
Myoglobinuria often is observed in rhabdomyolysis and inflammatory myopathies, conditions that produce high levels of serum CK and myoglobin. Myoglobinuria, often accompanied by the elevation of urinary β2-microglobulin and N-acetyl-D-glucosamine levels, can induce tubulointerstitial damage, which leads to acute kidney injury. In this case, however, these abnormal kidney findings were observed without high levels of serum CK or myoglobin. This suggests the potential for other causes of tubulointerstitial damage, such as granulomatous interstitial nephritis in renal sarcoidosis.3
Another characteristic abnormality was the elevation of urinary calcium excretion, which indicated an underlying granulomatous disorder, such as mycobacterial infection, granulomatosis with polyangiitis, or sarcoidosis. In sarcoidosis, hypercalciuria occurs in 40% of patients, hypercalcemia in 11%, and renal calculi in 10%.3,7 Hypercalciuria, for this patient, was important in arriving at the correct diagnosis after the gallium scan was obtained given the dearth of other typical features of sarcoidosis.
Although muscle biopsy is essential, imaging studies for idiopathic inflammatory myopathy are considered useful tools to narrow the differential diagnosis. The use of MRI of the skeletal muscle is helpful to both identify an adequate muscle for biopsy and demonstrate the pattern of affected muscles beyond clinical appearance, which aids in excluding, for example, muscular dystrophies.8,9
FDG PET/CT is a very sensitive imaging modality used to detect neoplastic lesions and has been widely used to screen for occult neoplasms and detect metastases.10-12 It is also useful for detecting inflammation in patients with osteomyelitis, metastatic infectious diseases, rheumatoid arthritis, vasculitis, inflammatory bowel diseases, fever of unknown origin, and sarcoidosis.11,12 In PM and DM, however, the sensitivity of FDG PET/CT for detection of myositis is reportedly lower than that of EMG and MRI.13 Similarly, gallium scintigraphy is usually performed to examine the disease activity of interstitial pneumonia or to detect malignancy. Previous literature and this case show that the striking images of gallium scintigraphy and FDG PET/CT have utility, not only for detection of sarcoid myopathy but also for the evaluation of treatment efficacy.14-17 Characteristic imaging findings on FDG PET/CT have been described as a “tiger man” appearance.17
For the treatment of sarcoid myopathy, systemic glucocorticoids are used for patients with symptomatic acute or chronic forms. The standard doses of prednisolone used for other forms of idiopathic inflammatory myopathies are usually administered.3-6 In general, the response of acute sarcoid myopathy to glucocorticoid therapy is favorable, and the clinical course is usually benign. However, the course in chronic sarcoid myopathy can be unpredictable with exacerbations. Given the lack of randomized trials of this therapy and because glucocorticoids themselves can cause steroid-induced myopathy, they are not used for asymptomatic patients.
In the end, astute clinical thinking, deductive reasoning, and pattern recognition were all instrumental in making this strong diagnosis of weakness.
KEY TEACHING POINTS
- Proximal muscle–dominant weakness is the characteristic feature in inflammatory myopathies like PM and DM. Myopathy causing proximal and distal weakness is more characteristic of sarcoidosis, IBM, alcohol, and statins.
- Elevations of urinary Times New Romanβ2-microglobulin and N-acetyl-D-glucosamine are often observed in inflammatory muscle diseases because of myoglobin-induced tubulointerstitial damage. These findings may also be caused by other conditions that affect the tubules, such as lupus nephritis, Sjogren’s syndrome, or renal sarcoidosis.
- Hypercalciuria in a patient with myopathy could suggest an underlying granulomatous disorder, such as mycobacterial infection, granulomatosis with polyangiitis, or sarcoidosis.
- The striking uptake within systemic skeletal striated muscles on gallium scintigraphy and “tiger man” appearance on FDG PET/CT are characteristic features of acute sarcoid myopathy; these are not common in other inflammatory myopathies.
Disclosure
Drs. Sudo, Wada, Narita, Mba, and Houchens have no conflicts of interest to disclose.
1. Vincze M, Danko K. Idiopathic inflammatory myopathies. Best Pract Res Clin Rheumatol. 2012;26:25-45. PubMed
2. Carstens PO, Schmidt J. Diagnosis, pathogenesis, and treatment of myositis: recent advances. Clin Exp Immunol. 2014;175:425-438. PubMed
3. Lannuzzi MC, Rhbicki BA, Teirstein AS. Sarcoidosis. N Eng J Med. 2007;357:2153-2165. PubMed
4. Baydur A, Pandya K, Sharma OP, et al. Control of ventilation, respiratory muscle strength, and granulomatous involvement of skeletal muscle in patients with sarcoidosis. Chest. 1993;103:396-402. PubMed
5. Zisman DA, Biermann JS, Martinez FJ, et al. Sarcoidosis presenting as a tumorlike muscular lesion. Case report and review of the literature. Medicine (Baltimore). 1999;78:112-122. PubMed
6. Fayad F, Liote F, Berenbaum F, et al. Muscle involvement in sarcoidosis: a retrospective and followup studies. J Rheumatol. 2006;33:98-103. PubMed
7. Berliner AR, Haas M, Choi MJ. Sarcoidosis: the nephrologist’s perspective. Am J Kidney Dis. 2006;48:856-870. PubMed
8. Otake S, Ishigaki T. Musular sarcoidosis. Semin Musculoskelet Radiol. 2001;5:167-170. PubMed
9. Otake S, Imagumbai N, Suzuki M, et al. MR imaging of muscular sarcoidosis after steroid therapy. Eur Radiol. 1998;8:1651-1653. PubMed
10. Hoffman JM, Gambhir SS. Molecular imaging: The vision and opportunity for radiology in the future. Radiology. 2007;244:39-47. PubMed
11. Basu S, Zhuang H, Torigian DA, et al. Functional imaging of inflammatory diseases using nuclear medicine techniques. Semin Nucl Med. 2009;39:124-145. PubMed
12. Gotthardt M, Cleeker-Rovers CP, Boerman OC, et al. Imaging of inflammation by PET, conventional scintigraphy, and other imaging techniques. J Nucl Med. 2010;51:1937-1949. PubMed
13. Owada T, Maezawa R, Kurasawa K, et al. Detection of inflammatory lesions by F-18 fluorodeoxyglucose positron emission tomography in patients with polymyositis and dermatomyositis. J Rheumatol. 2012;39:1659-1665. PubMed
14. Liem IH, Drent M, Antevska E, et al. Intense muscle uptake of gallium-67 in a patient with sarcoidosis. J Nucl Med. 1998;39:1605-1607. PubMed
15. Suehiro S, Shiokawa S, Taniguchi S, et al. Gallium-67 scintigraphy in the diagnosis and management of chronic sarcoid myopathy. Clin Rheumatol. 2003;22:146-148. PubMed
16. Marie I, Josse S, Lahaxe L, et al. Clinical images: muscle sarcoidosis demonstrated on positron emission tomography. Arthritis Rheum. 2009;60:2847. PubMed
17. Wieers G, Lhommel R, Lecouvet F, et al. A tiger man. Lancet. 2012;380:1859. PubMed
© 2017 Society of Hospital Medicine
How Exemplary Teaching Physicians Interact with Hospitalized Patients
Approximately a century ago, Francis Peabody taught that “the secret of the care of the patient is in caring for the patient.”1 His advice remains true today. Despite the advent of novel diagnostic tests, technologically sophisticated interventional procedures, and life-saving medications, perhaps the most important skill a bedside clinician can use is the ability to connect with patients.
The literature on patient-physician interaction is vast2-11 and generally indicates that exemplary bedside clinicians are able to interact well with patients by being competent, trustworthy, personable, empathetic, and effective communicators. “Etiquette-based medicine,” first proposed by Kahn,12 emphasizes the importance of certain behaviors from physicians, such as introducing yourself and
Yet, improving patient-physician interactions remains necessary. A recent systematic review reported that almost half of the reviewed studies on the patient-physician relationship published between 2000 and 2014 conveyed the idea that the patient-physician relationship is deteriorating.13
As part of a broader study to understand the behaviors and approaches of exemplary inpatient attending physicians,14-16 we examined how 12 carefully selected physicians interacted with their patients during inpatient teaching rounds.
METHODS
Overview
We conducted a multisite study using an exploratory, qualitative approach to inquiry, which has been described previously.14-16 Our primary purpose was to study the attributes and behaviors of outstanding general medicine attendings in the setting of inpatient rounds. The focus of this article is on the attendings’ interactions with patients.
We used a modified snowball sampling approach17 to identify 12 exemplary physicians. First, we contacted individuals throughout the United States who were known to the principal investigator (S.S.) and asked for suggestions of excellent clinician educators (also referred to as attendings) for potential inclusion in the study. In addition to these personal contacts, other individuals unknown to the investigative team were contacted and asked to provide suggestions for attendings to include in the study. Specifically, the US News & World Report 2015 Top Medical Schools: Research Rankings,18 which are widely used to represent the best U.S. hospitals, were reviewed in an effort to identify attendings from a broad range of medical schools. Using this list, we identified other medical schools that were in the top 25 and were not already represented. We contacted the division chiefs of general internal (or hospital) medicine, chairs and chiefs of departments of internal medicine, and internal medicine residency program directors from these medical schools and asked for recommendations of attendings from both within and outside their institutions whom they considered to be great inpatient teachers.
This sampling method resulted in 59 potential participants. An internet search was conducted on each potential participant to obtain further information about the individuals and their institutions. Both personal characteristics (medical education, training, and educational awards) and organizational characteristics (geographic location, hospital size and affiliation, and patient population) were considered so that a variety of organizations and backgrounds were represented. Through this process, the list was narrowed to 16 attendings who were contacted to participate in the study, of which 12 agreed. The number of attendings examined was appropriate because saturation of metathemes can occur in as little as 6 interviews, and data saturation occurs at 12 interviews.19 The participants were asked to provide a list of their current learners (ie, residents and medical students) and 6 to 10 former learners to contact for interviews and focus groups.
Data Collection
Observations
Two researchers conducted the one-day site visits. One was a physician (S.S.) and the other a medical anthropologist (M.H.), and both have extensive experience in qualitative methods. The only exception was the site visit at the principal investigator’s own institution, which was conducted by the medical anthropologist and a nonpracticing physician who was unknown to the participants. The team structure varied slightly among different institutions but in general was composed of 1 attending, 1 senior medical resident, 1 to 2 interns, and approximately 2 medical students. Each site visit began with observing the attendings (n = 12) and current learners (n = 57) on morning rounds, which included their interactions with patients. These observations lasted approximately 2 to 3 hours. The observers took handwritten field notes, paying particular attention to group interactions, teaching approaches, and patient interactions. The observers stood outside the medical team circle and remained silent during rounds so as to be unobtrusive to the teams’ discussions. The observers discussed and compared their notes after each site visit.
Interviews and Focus Groups
The research team also conducted individual, semistructured interviews with the attendings (n = 12), focus groups with their current teams (n = 46), and interviews or focus groups with their former learners (n = 26). Current learners were asked open-ended questions about their roles on the teams, their opinions of the attendings, and the care the attendings provide to their patients. Because they were observed during rounds, the researchers asked for clarification about specific interactions observed during the teaching rounds. Depending on availability and location, former learners either participated in in-person focus groups or interviews on the day of the site visit, or in a later telephone interview. All interviews and focus groups were audio recorded and transcribed.
This study was deemed to be exempt from regulation by the University of Michigan Institutional Review Board. All participants were informed that their participation was completely voluntary and that they could refuse to answer any question.
Data Analysis
Data were analyzed using a thematic analysis approach,20 which involves reading through the data to identify patterns (and create codes) that relate to behaviors, experiences, meanings, and activities. The patterns are then grouped into themes to help further explain the findings.21 The research team members (S.S. and M.H.) met after the first site visit and developed initial ideas about meanings and possible patterns. One team member (M.H.) read all the transcripts from the site visit and, based on the data, developed a codebook to be used for this study. This process was repeated after every site visit, and the coding definitions were refined as necessary. All transcripts were reviewed to apply any new codes when they developed. NVivo® 10 software (QSR International, Melbourne, Australia) was used to assist with the qualitative data analysis.
To ensure consistency and identify relationships between codes, code reports listing all the data linked to a specific code were generated after all the field notes and transcripts were coded. Once verified, codes were grouped based on similarities and relationships into prominent themes related to physician-patient interactions by 2 team members (S.S. and M.H.), though all members reviewed them and concurred.
RESULTS
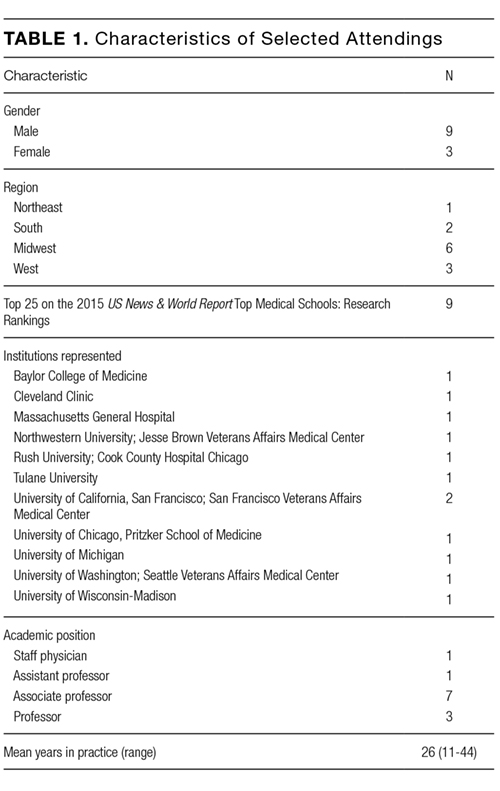
C are for the Patient’s Well-Being
The attendings we observed appeared to openly care for their patients’ well-being and were focused on the patients’ wants and needs. We noted that attendings were generally very attentive to the patients’ comfort. For example, we observed one attending sending the senior resident to find the patient’s nurse in order to obtain additional pain medications. The attending said to the patient several times, “I’m sorry you’re in so much pain.” When the team was leaving, she asked the intern to stay with the patient until the medications had been administered.
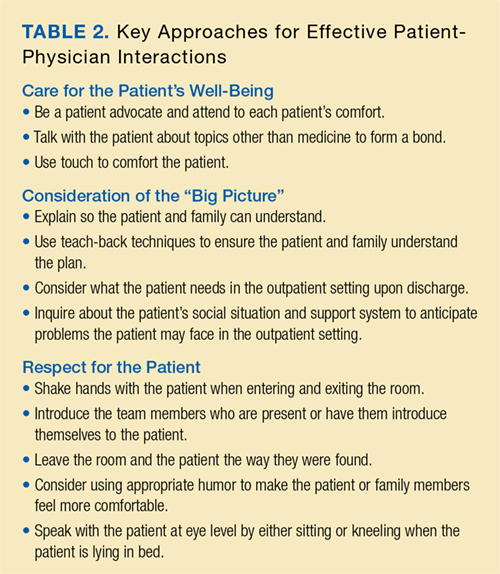
The attendings we observed could also be considered patient advocates, ensuring that patients received superb care. As one learner said about an attending who was attempting to have his patient listed for a liver transplant, “He is the biggest advocate for the patient that I have ever seen.” Regarding the balance between learning biomedical concepts and advocacy, another learner noted the following: “… there is always a teaching aspect, but he always makes sure that everything is taken care of for the patient…”
Building rapport creates and sustains bonds between people. Even though most of the attendings we observed primarily cared for hospitalized patients and had little long-term continuity with them, the attendings tended to take special care to talk with their patients about topics other than medicine to form a bond. This bonding between attending and patient was appreciated by learners. “Probably the most important thing I learned about patient care would be taking the time and really developing that relationship with patients,” said one of the former learners we interviewed. “There’s a question that he asks to a lot of our patients,” one learner told us, “especially our elderly patients, that [is], ‘What’s the most memorable moment in your life?’ So, he asks that question, and patient[s] open up and will share.”
The attendings often used touch to further solidify their relationships with their patients. We observed one attending who would touch her patients’ arms or knees when she was talking with them. Another attending would always shake the patient’s hand when leaving. Another attending would often lay his hand on the patient’s shoulder and help the patient sit up during the physical examination. Such humanistic behavior was noticed by learners. “She does a lot of comforting touch, particularly at the end of an exam,” said a current learner.
C onsideration of the “Big Picture”
Our exemplary attendings kept the “big picture” (that is, the patient’s overall medical and social needs) in clear focus. They behaved in a way to ensure that the patients understood the key points of their care and explained so the patients and families could understand. A current learner said, “[The attending] really makes sure that the patient understands what’s going on. And she always asks them, ‘What do you understand, what do you know, how can we fill in any blanks?’ And that makes the patient really involved in their own care, which I think is important.” This reflection was supported by direct observations. Attendings posed the following questions at the conclusion of patient interactions: “Tell me what you know.” “Tell me what our plan is.” “What did the lung doctors tell you yesterday?” These questions, which have been termed “teach-back” and are crucial for health literacy, were not meant to quiz the patient but rather to ensure the patient and family understood the plan.
We noticed that the attendings effectively explained clinical details and the plan of care to the patient while avoiding medical jargon. The following is an example of one interaction with a patient: “You threw up and created a tear in the food tube. Air got from that into the middle of the chest, not into the lungs. Air isn’t normally there. If it is just air, the body will reabsorb [it]... But we worry about bacteria getting in with the air. We need to figure out if it is an infection. We’re still trying to figure it out. Hang in there with us.” One learner commented, “… since we do bedside presentations, he has a great way of translating our gibberish, basically, to real language the patient understands.”
Finally, the attendings anticipated what patients would need in the outpatient setting. We observed that attendings stressed what the next steps would be during transitions of care. As one learner put it, “But he also thinks ahead; what do they need as an outpatient?” Another current learner commented on how another attending always asked about the social situations of his patients stating, “And then there is the social part of it. So, he is very much interested [in] where do they live? What is their support system? So, I think it has been a very holistic approach to patient care.”
R espect for the Patient
The attendings we observed were steadfastly respectful toward patients. As one attending told us, “The patient’s room is sacred space, and it’s a privilege for us to be there. And if we don’t earn that privilege, then we don’t get to go there.” We observed that the attendings generally referred to the patient as Mr. or Ms. (last name) rather than the patient’s first name unless the patient insisted. We also noticed that many of the attendings would introduce the team members to the patients or ask each member to introduce himself or herself. They also tended to leave the room and patient the way they were found, for example, by pushing the patient’s bedside table so that it was back within his or her reach or placing socks back onto the patient’s feet.
We noted that many of our attendings used appropriate humor with patients and families. As one learner explained, “I think Dr. [attending] makes most of our patients laugh during rounds. I don’t know if you noticed, but he really puts a smile on their face[s] whenever he walks in. … Maybe it would catch them off guard the first day, but after that, they are so happy to see him.”
Finally, we noticed that several of our attendings made sure to meet the patient at eye level during discussions by either kneeling or sitting on a chair. One of the attendings put it this way: “That’s a horrible power dynamic when you’re an inpatient and you’re sick and someone’s standing over you telling you things, and I like to be able to make eye contact with people, and often times that requires me to kneel down or to sit on a stool or to sit on the bed. … I feel like you’re able to connect with the people in a much better way…” Learners viewed this behavior favorably. As one told us, “[The attending] gets down to their level and makes sure that all of their questions are answered. So that is one thing that other attendings don’t necessarily do.”
DISCUSSION
In our national, qualitative study of 12 exemplary attending physicians, we found that these clinicians generally exhibited the following behaviors with patients. First, they were personable and caring and made significant attempts to connect with their patients. This occasionally took the form of using touch to comfort patients. Second, they tended to seek the “big picture” and tried to understand what patients would need upon hospital discharge. They communicated plans clearly to patients and families and inquired if those plans were understood. Finally, they showed respect toward their patients without fail. Such respect took many forms but included leaving the patient and room exactly as they were found and speaking with patients at eye level.
Our findings are largely consistent with other key studies in this field. Not surprisingly, the attendings we observed adhered to the major suggestions that Branch and colleagues2 put forth more than 15 years ago to improve the teaching of the humanistic dimension of the patient-physician relationship. Examples include greeting the patient, introducing team members and explaining each person’s role, asking open-ended questions, providing patient education, placing oneself at the same level as the patient, using appropriate touch, and being respectful. Weissmann et al.22 also found similar themes in their study of teaching physicians at 4 universities from 2003 to 2004. In that study, role-modeling was the primary method used by physician educators to teach the humanistic aspects of medical care, including nonverbal communication (eg, touch and eye contact), demonstration of respect, and building a personal connection with the patients.22In a focus group-based study performed at a teaching hospital in Boston, Ramani and Orlander23 concluded that both participating teachers and learners considered the patient’s bedside as a valuable venue to learn humanistic skills. Unfortunately, they also noted that there has been a decline in bedside teaching related to various factors, including documentation requirements and electronic medical records.23 Our attendings all demonstrated the value of teaching at a patient’s bedside. Not only could physical examination skills be demonstrated but role-modeling of interpersonal skills could be observed by learners.
Block and colleagues24 observed 29 interns in 732 patient encounters in 2 Baltimore training programs using Kahn’s “etiquette-based medicine” behaviors as a guide.12 They found that interns introduced themselves 40% of the time, explained their role 37% of the time, touched patients on 65% of visits (including as part of the physical examination), asked open-ended questions 75% of the time, and sat down with patients during only 9% of visits.24 Tackett et al.7 observed 24 hospitalists who collectively cared for 226 unique patients in 3 Baltimore-area hospitals. They found that each of the following behaviors was performed less than 30% of the time: explains role in care, shakes hand, and sits down.7 However, our attendings appeared to adhere to these behaviors to a much higher extent, though we did not quantify the interactions. This lends support to the notion that effective patient-physician interactions are the foundation of great teaching.
The attendings we observed (most of whom are inpatient based) tended to the contextual issues of the patients, such as their home environments and social support. Our exemplary physicians did what they could to ensure that patients received the appropriate follow-up care upon discharge.
Our study has important limitations. First, it was conducted in a limited number of US hospitals. The institutions represented were generally large, research-intensive, academic medical centers. Therefore, our findings may not apply to settings that are different from the hospitals studied. Second, our study included only 12 attendings and their learners, which may also limit the study’s generalizability. Third, we focused exclusively on teaching within general medicine rounds. Thus, our findings may not be generalizable to other subspecialties. Fourth, attendings were selected through a nonexhaustive method, increasing the potential for selection bias. However, the multisite design, the modified snowball sampling, and the inclusion of several types of institutions in the final participant pool introduced diversity to the final list. Former-learner responses were subject to recall bias. Finally, the study design is susceptible to observer bias. Attempts to reduce this included the diversity of the observers (ie, both a clinician and a nonclinician, the latter of whom was unfamiliar with medical education) and review of the data and coding by multiple research team members to ensure validity. Although we cannot discount the potential role of a Hawthorne effect on our data collection, the research team attempted to mitigate this by standing apart from the care teams and remaining unobtrusive during observations.
Limitations notwithstanding, we believe that our multisite study is important given the longstanding imperative to improve patient-physician interactions. We found empirical support for behaviors proposed by Branch and colleagues2 and Kahn12 in order to enhance these relationships. While others have studied attendings and their current learners,22 we add to the literature by also examining former learners’ perspectives on how the attendings’ teaching and role-modeling have created and sustained a lasting impact. The key findings of our national, qualitative study (care for the patient’s well-being, consideration of the “big picture,” and respect for the patient) can be readily adopted and honed by physicians to improve their interactions with hospitalized patients.
A cknowledgments
The findings and conclusions in this report are those of the authors and do not necessarily represent the official position of the US Department of Veterans Affairs.
F unding
Dr. Saint provided funding for this study using a University of Michigan endowment.
Disclosure
The authors declare no conflicts of interest.
1. Peabody FW. The care of the patient. JAMA. 1927;88(12):877-882. PubMed
2. Branch WT, Jr., Kern D, Haidet P, et al. The patient-physician relationship. Teaching the human dimensions of care in clinical settings. JAMA. 2001;286(9):1067-1074. PubMed
3. Frankel RM. Relationship-centered care and the patient-physician relationship. J Gen Intern Med. 2004;19(11):1163-1165. PubMed
4. Stewart MA. Effective physician-patient communication and health outcomes: a review. CMAJ. 1995;152(9):1423-1433. PubMed
5. Osmun WE, Brown JB, Stewart M, Graham S. Patients’ attitudes to comforting touch in family practice. Can Fam Physician. 2000;46:2411-2416. PubMed
6. Strasser F, Palmer JL, Willey J, et al. Impact of physician sitting versus standing during inpatient oncology consultations: patients’ preference and perception of compassion and duration. A randomized controlled trial. J Pain Symptom Manage. 2005;29(5):489-497. PubMed
7. Tackett S, Tad-y D, Rios R, Kisuule F, Wright S. Appraising the practice of etiquette-based medicine in the inpatient setting. J Gen Intern Med. 2013;28(7):908-913. PubMed
8. Gallagher TH, Levinson W. A prescription for protecting the doctor-patient relationship. Am J Manag Care. 2004;10(2, pt 1):61-68. PubMed
9. Braddock CH, 3rd, Snyder L. The doctor will see you shortly. The ethical significance of time for the patient-physician relationship. J Gen Intern Med. 2005;20(11):1057-1062. PubMed
10. Ong LM, de Haes JC, Hoos AM, Lammes FB. Doctor-patient communication: a review of the literature. Soc Sci Med. 1995;40(7):903-918. PubMed
11. Lee SJ, Back AL, Block SD, Stewart SK. Enhancing physician-patient communication. Hematology Am Soc Hematol Educ Program. 2002:464-483. PubMed
12. Kahn MW. Etiquette-based medicine. N Engl J Med. 2008;358(19):1988-1989. PubMed
13. Hoff T, Collinson GE. How Do We Talk About the Physician-Patient Relationship? What the Nonempirical Literature Tells Us. Med Care Res Rev. 2016. PubMed
14. Houchens N, Harrod M, Moody S, Fowler KE, Saint S. Techniques and behaviors associated with exemplary inpatient general medicine teaching: an exploratory qualitative study. J Hosp Med. 2017;12(7):503-509. PubMed
15. Houchens N, Harrod M, Fowler KE, Moody S., Saint S. Teaching “how” to think instead of “what” to think: how great inpatient physicians foster clinical reasoning. Am J Med. In Press.
16. Harrod M, Saint S, Stock RW. Teaching Inpatient Medicine: What Every Physician Needs to Know. New York, NY: Oxford University Press; 2017.
17. Richards L, Morse J. README FIRST for a User’s Guide to Qualitative Methods. 3rd ed. Los Angeles, CA: SAGE Publications Inc; 2013.
18. US News and World Report. Best Medical Schools: Research. 2014; http://grad-schools.usnews.rankingsandreviews.com/best-graduate-schools/top-medical-schools/research-rankings. Accessed on September 16, 2016.
19. Guest G, Bunce A, Johnson L. How many interviews are enough? An experiment with data saturation and variability. Field Methods. 2006;18(1):59-82.
20. Braun V, Clarke V. Using thematic analysis in psychology. Qual Res Psychol. 2006;3(2):77-101. PubMed
21. Aronson J. A pragmatic view of thematic analysis. Qual Rep. 1995;2(1):1-3.
22. Weissmann PF, Branch WT, Gracey CF, Haidet P, Frankel RM. Role modeling humanistic behavior: learning bedside manner from the experts. Acad Med. 2006;81(7):661-667. PubMed
23. Ramani S, Orlander JD. Human dimensions in bedside teaching: focus group discussions of teachers and learners. Teach Learn Med. 2013;25(4):312-318. PubMed
24. Block L, Hutzler L, Habicht R, et al. Do internal medicine interns practice etiquette-based communication? A critical look at the inpatient encounter. J Hosp Med. 2013;8(11):631-634. PubMed
Approximately a century ago, Francis Peabody taught that “the secret of the care of the patient is in caring for the patient.”1 His advice remains true today. Despite the advent of novel diagnostic tests, technologically sophisticated interventional procedures, and life-saving medications, perhaps the most important skill a bedside clinician can use is the ability to connect with patients.
The literature on patient-physician interaction is vast2-11 and generally indicates that exemplary bedside clinicians are able to interact well with patients by being competent, trustworthy, personable, empathetic, and effective communicators. “Etiquette-based medicine,” first proposed by Kahn,12 emphasizes the importance of certain behaviors from physicians, such as introducing yourself and
Yet, improving patient-physician interactions remains necessary. A recent systematic review reported that almost half of the reviewed studies on the patient-physician relationship published between 2000 and 2014 conveyed the idea that the patient-physician relationship is deteriorating.13
As part of a broader study to understand the behaviors and approaches of exemplary inpatient attending physicians,14-16 we examined how 12 carefully selected physicians interacted with their patients during inpatient teaching rounds.
METHODS
Overview
We conducted a multisite study using an exploratory, qualitative approach to inquiry, which has been described previously.14-16 Our primary purpose was to study the attributes and behaviors of outstanding general medicine attendings in the setting of inpatient rounds. The focus of this article is on the attendings’ interactions with patients.
We used a modified snowball sampling approach17 to identify 12 exemplary physicians. First, we contacted individuals throughout the United States who were known to the principal investigator (S.S.) and asked for suggestions of excellent clinician educators (also referred to as attendings) for potential inclusion in the study. In addition to these personal contacts, other individuals unknown to the investigative team were contacted and asked to provide suggestions for attendings to include in the study. Specifically, the US News & World Report 2015 Top Medical Schools: Research Rankings,18 which are widely used to represent the best U.S. hospitals, were reviewed in an effort to identify attendings from a broad range of medical schools. Using this list, we identified other medical schools that were in the top 25 and were not already represented. We contacted the division chiefs of general internal (or hospital) medicine, chairs and chiefs of departments of internal medicine, and internal medicine residency program directors from these medical schools and asked for recommendations of attendings from both within and outside their institutions whom they considered to be great inpatient teachers.
This sampling method resulted in 59 potential participants. An internet search was conducted on each potential participant to obtain further information about the individuals and their institutions. Both personal characteristics (medical education, training, and educational awards) and organizational characteristics (geographic location, hospital size and affiliation, and patient population) were considered so that a variety of organizations and backgrounds were represented. Through this process, the list was narrowed to 16 attendings who were contacted to participate in the study, of which 12 agreed. The number of attendings examined was appropriate because saturation of metathemes can occur in as little as 6 interviews, and data saturation occurs at 12 interviews.19 The participants were asked to provide a list of their current learners (ie, residents and medical students) and 6 to 10 former learners to contact for interviews and focus groups.
Data Collection
Observations
Two researchers conducted the one-day site visits. One was a physician (S.S.) and the other a medical anthropologist (M.H.), and both have extensive experience in qualitative methods. The only exception was the site visit at the principal investigator’s own institution, which was conducted by the medical anthropologist and a nonpracticing physician who was unknown to the participants. The team structure varied slightly among different institutions but in general was composed of 1 attending, 1 senior medical resident, 1 to 2 interns, and approximately 2 medical students. Each site visit began with observing the attendings (n = 12) and current learners (n = 57) on morning rounds, which included their interactions with patients. These observations lasted approximately 2 to 3 hours. The observers took handwritten field notes, paying particular attention to group interactions, teaching approaches, and patient interactions. The observers stood outside the medical team circle and remained silent during rounds so as to be unobtrusive to the teams’ discussions. The observers discussed and compared their notes after each site visit.
Interviews and Focus Groups
The research team also conducted individual, semistructured interviews with the attendings (n = 12), focus groups with their current teams (n = 46), and interviews or focus groups with their former learners (n = 26). Current learners were asked open-ended questions about their roles on the teams, their opinions of the attendings, and the care the attendings provide to their patients. Because they were observed during rounds, the researchers asked for clarification about specific interactions observed during the teaching rounds. Depending on availability and location, former learners either participated in in-person focus groups or interviews on the day of the site visit, or in a later telephone interview. All interviews and focus groups were audio recorded and transcribed.
This study was deemed to be exempt from regulation by the University of Michigan Institutional Review Board. All participants were informed that their participation was completely voluntary and that they could refuse to answer any question.
Data Analysis
Data were analyzed using a thematic analysis approach,20 which involves reading through the data to identify patterns (and create codes) that relate to behaviors, experiences, meanings, and activities. The patterns are then grouped into themes to help further explain the findings.21 The research team members (S.S. and M.H.) met after the first site visit and developed initial ideas about meanings and possible patterns. One team member (M.H.) read all the transcripts from the site visit and, based on the data, developed a codebook to be used for this study. This process was repeated after every site visit, and the coding definitions were refined as necessary. All transcripts were reviewed to apply any new codes when they developed. NVivo® 10 software (QSR International, Melbourne, Australia) was used to assist with the qualitative data analysis.
To ensure consistency and identify relationships between codes, code reports listing all the data linked to a specific code were generated after all the field notes and transcripts were coded. Once verified, codes were grouped based on similarities and relationships into prominent themes related to physician-patient interactions by 2 team members (S.S. and M.H.), though all members reviewed them and concurred.
RESULTS
C are for the Patient’s Well-Being
The attendings we observed appeared to openly care for their patients’ well-being and were focused on the patients’ wants and needs. We noted that attendings were generally very attentive to the patients’ comfort. For example, we observed one attending sending the senior resident to find the patient’s nurse in order to obtain additional pain medications. The attending said to the patient several times, “I’m sorry you’re in so much pain.” When the team was leaving, she asked the intern to stay with the patient until the medications had been administered.
The attendings we observed could also be considered patient advocates, ensuring that patients received superb care. As one learner said about an attending who was attempting to have his patient listed for a liver transplant, “He is the biggest advocate for the patient that I have ever seen.” Regarding the balance between learning biomedical concepts and advocacy, another learner noted the following: “… there is always a teaching aspect, but he always makes sure that everything is taken care of for the patient…”
Building rapport creates and sustains bonds between people. Even though most of the attendings we observed primarily cared for hospitalized patients and had little long-term continuity with them, the attendings tended to take special care to talk with their patients about topics other than medicine to form a bond. This bonding between attending and patient was appreciated by learners. “Probably the most important thing I learned about patient care would be taking the time and really developing that relationship with patients,” said one of the former learners we interviewed. “There’s a question that he asks to a lot of our patients,” one learner told us, “especially our elderly patients, that [is], ‘What’s the most memorable moment in your life?’ So, he asks that question, and patient[s] open up and will share.”
The attendings often used touch to further solidify their relationships with their patients. We observed one attending who would touch her patients’ arms or knees when she was talking with them. Another attending would always shake the patient’s hand when leaving. Another attending would often lay his hand on the patient’s shoulder and help the patient sit up during the physical examination. Such humanistic behavior was noticed by learners. “She does a lot of comforting touch, particularly at the end of an exam,” said a current learner.
C onsideration of the “Big Picture”
Our exemplary attendings kept the “big picture” (that is, the patient’s overall medical and social needs) in clear focus. They behaved in a way to ensure that the patients understood the key points of their care and explained so the patients and families could understand. A current learner said, “[The attending] really makes sure that the patient understands what’s going on. And she always asks them, ‘What do you understand, what do you know, how can we fill in any blanks?’ And that makes the patient really involved in their own care, which I think is important.” This reflection was supported by direct observations. Attendings posed the following questions at the conclusion of patient interactions: “Tell me what you know.” “Tell me what our plan is.” “What did the lung doctors tell you yesterday?” These questions, which have been termed “teach-back” and are crucial for health literacy, were not meant to quiz the patient but rather to ensure the patient and family understood the plan.
We noticed that the attendings effectively explained clinical details and the plan of care to the patient while avoiding medical jargon. The following is an example of one interaction with a patient: “You threw up and created a tear in the food tube. Air got from that into the middle of the chest, not into the lungs. Air isn’t normally there. If it is just air, the body will reabsorb [it]... But we worry about bacteria getting in with the air. We need to figure out if it is an infection. We’re still trying to figure it out. Hang in there with us.” One learner commented, “… since we do bedside presentations, he has a great way of translating our gibberish, basically, to real language the patient understands.”
Finally, the attendings anticipated what patients would need in the outpatient setting. We observed that attendings stressed what the next steps would be during transitions of care. As one learner put it, “But he also thinks ahead; what do they need as an outpatient?” Another current learner commented on how another attending always asked about the social situations of his patients stating, “And then there is the social part of it. So, he is very much interested [in] where do they live? What is their support system? So, I think it has been a very holistic approach to patient care.”
R espect for the Patient
The attendings we observed were steadfastly respectful toward patients. As one attending told us, “The patient’s room is sacred space, and it’s a privilege for us to be there. And if we don’t earn that privilege, then we don’t get to go there.” We observed that the attendings generally referred to the patient as Mr. or Ms. (last name) rather than the patient’s first name unless the patient insisted. We also noticed that many of the attendings would introduce the team members to the patients or ask each member to introduce himself or herself. They also tended to leave the room and patient the way they were found, for example, by pushing the patient’s bedside table so that it was back within his or her reach or placing socks back onto the patient’s feet.
We noted that many of our attendings used appropriate humor with patients and families. As one learner explained, “I think Dr. [attending] makes most of our patients laugh during rounds. I don’t know if you noticed, but he really puts a smile on their face[s] whenever he walks in. … Maybe it would catch them off guard the first day, but after that, they are so happy to see him.”
Finally, we noticed that several of our attendings made sure to meet the patient at eye level during discussions by either kneeling or sitting on a chair. One of the attendings put it this way: “That’s a horrible power dynamic when you’re an inpatient and you’re sick and someone’s standing over you telling you things, and I like to be able to make eye contact with people, and often times that requires me to kneel down or to sit on a stool or to sit on the bed. … I feel like you’re able to connect with the people in a much better way…” Learners viewed this behavior favorably. As one told us, “[The attending] gets down to their level and makes sure that all of their questions are answered. So that is one thing that other attendings don’t necessarily do.”
DISCUSSION
In our national, qualitative study of 12 exemplary attending physicians, we found that these clinicians generally exhibited the following behaviors with patients. First, they were personable and caring and made significant attempts to connect with their patients. This occasionally took the form of using touch to comfort patients. Second, they tended to seek the “big picture” and tried to understand what patients would need upon hospital discharge. They communicated plans clearly to patients and families and inquired if those plans were understood. Finally, they showed respect toward their patients without fail. Such respect took many forms but included leaving the patient and room exactly as they were found and speaking with patients at eye level.
Our findings are largely consistent with other key studies in this field. Not surprisingly, the attendings we observed adhered to the major suggestions that Branch and colleagues2 put forth more than 15 years ago to improve the teaching of the humanistic dimension of the patient-physician relationship. Examples include greeting the patient, introducing team members and explaining each person’s role, asking open-ended questions, providing patient education, placing oneself at the same level as the patient, using appropriate touch, and being respectful. Weissmann et al.22 also found similar themes in their study of teaching physicians at 4 universities from 2003 to 2004. In that study, role-modeling was the primary method used by physician educators to teach the humanistic aspects of medical care, including nonverbal communication (eg, touch and eye contact), demonstration of respect, and building a personal connection with the patients.22In a focus group-based study performed at a teaching hospital in Boston, Ramani and Orlander23 concluded that both participating teachers and learners considered the patient’s bedside as a valuable venue to learn humanistic skills. Unfortunately, they also noted that there has been a decline in bedside teaching related to various factors, including documentation requirements and electronic medical records.23 Our attendings all demonstrated the value of teaching at a patient’s bedside. Not only could physical examination skills be demonstrated but role-modeling of interpersonal skills could be observed by learners.
Block and colleagues24 observed 29 interns in 732 patient encounters in 2 Baltimore training programs using Kahn’s “etiquette-based medicine” behaviors as a guide.12 They found that interns introduced themselves 40% of the time, explained their role 37% of the time, touched patients on 65% of visits (including as part of the physical examination), asked open-ended questions 75% of the time, and sat down with patients during only 9% of visits.24 Tackett et al.7 observed 24 hospitalists who collectively cared for 226 unique patients in 3 Baltimore-area hospitals. They found that each of the following behaviors was performed less than 30% of the time: explains role in care, shakes hand, and sits down.7 However, our attendings appeared to adhere to these behaviors to a much higher extent, though we did not quantify the interactions. This lends support to the notion that effective patient-physician interactions are the foundation of great teaching.
The attendings we observed (most of whom are inpatient based) tended to the contextual issues of the patients, such as their home environments and social support. Our exemplary physicians did what they could to ensure that patients received the appropriate follow-up care upon discharge.
Our study has important limitations. First, it was conducted in a limited number of US hospitals. The institutions represented were generally large, research-intensive, academic medical centers. Therefore, our findings may not apply to settings that are different from the hospitals studied. Second, our study included only 12 attendings and their learners, which may also limit the study’s generalizability. Third, we focused exclusively on teaching within general medicine rounds. Thus, our findings may not be generalizable to other subspecialties. Fourth, attendings were selected through a nonexhaustive method, increasing the potential for selection bias. However, the multisite design, the modified snowball sampling, and the inclusion of several types of institutions in the final participant pool introduced diversity to the final list. Former-learner responses were subject to recall bias. Finally, the study design is susceptible to observer bias. Attempts to reduce this included the diversity of the observers (ie, both a clinician and a nonclinician, the latter of whom was unfamiliar with medical education) and review of the data and coding by multiple research team members to ensure validity. Although we cannot discount the potential role of a Hawthorne effect on our data collection, the research team attempted to mitigate this by standing apart from the care teams and remaining unobtrusive during observations.
Limitations notwithstanding, we believe that our multisite study is important given the longstanding imperative to improve patient-physician interactions. We found empirical support for behaviors proposed by Branch and colleagues2 and Kahn12 in order to enhance these relationships. While others have studied attendings and their current learners,22 we add to the literature by also examining former learners’ perspectives on how the attendings’ teaching and role-modeling have created and sustained a lasting impact. The key findings of our national, qualitative study (care for the patient’s well-being, consideration of the “big picture,” and respect for the patient) can be readily adopted and honed by physicians to improve their interactions with hospitalized patients.
A cknowledgments
The findings and conclusions in this report are those of the authors and do not necessarily represent the official position of the US Department of Veterans Affairs.
F unding
Dr. Saint provided funding for this study using a University of Michigan endowment.
Disclosure
The authors declare no conflicts of interest.
1. Peabody FW. The care of the patient. JAMA. 1927;88(12):877-882. PubMed
2. Branch WT, Jr., Kern D, Haidet P, et al. The patient-physician relationship. Teaching the human dimensions of care in clinical settings. JAMA. 2001;286(9):1067-1074. PubMed
3. Frankel RM. Relationship-centered care and the patient-physician relationship. J Gen Intern Med. 2004;19(11):1163-1165. PubMed
4. Stewart MA. Effective physician-patient communication and health outcomes: a review. CMAJ. 1995;152(9):1423-1433. PubMed
5. Osmun WE, Brown JB, Stewart M, Graham S. Patients’ attitudes to comforting touch in family practice. Can Fam Physician. 2000;46:2411-2416. PubMed
6. Strasser F, Palmer JL, Willey J, et al. Impact of physician sitting versus standing during inpatient oncology consultations: patients’ preference and perception of compassion and duration. A randomized controlled trial. J Pain Symptom Manage. 2005;29(5):489-497. PubMed
7. Tackett S, Tad-y D, Rios R, Kisuule F, Wright S. Appraising the practice of etiquette-based medicine in the inpatient setting. J Gen Intern Med. 2013;28(7):908-913. PubMed
8. Gallagher TH, Levinson W. A prescription for protecting the doctor-patient relationship. Am J Manag Care. 2004;10(2, pt 1):61-68. PubMed
9. Braddock CH, 3rd, Snyder L. The doctor will see you shortly. The ethical significance of time for the patient-physician relationship. J Gen Intern Med. 2005;20(11):1057-1062. PubMed
10. Ong LM, de Haes JC, Hoos AM, Lammes FB. Doctor-patient communication: a review of the literature. Soc Sci Med. 1995;40(7):903-918. PubMed
11. Lee SJ, Back AL, Block SD, Stewart SK. Enhancing physician-patient communication. Hematology Am Soc Hematol Educ Program. 2002:464-483. PubMed
12. Kahn MW. Etiquette-based medicine. N Engl J Med. 2008;358(19):1988-1989. PubMed
13. Hoff T, Collinson GE. How Do We Talk About the Physician-Patient Relationship? What the Nonempirical Literature Tells Us. Med Care Res Rev. 2016. PubMed
14. Houchens N, Harrod M, Moody S, Fowler KE, Saint S. Techniques and behaviors associated with exemplary inpatient general medicine teaching: an exploratory qualitative study. J Hosp Med. 2017;12(7):503-509. PubMed
15. Houchens N, Harrod M, Fowler KE, Moody S., Saint S. Teaching “how” to think instead of “what” to think: how great inpatient physicians foster clinical reasoning. Am J Med. In Press.
16. Harrod M, Saint S, Stock RW. Teaching Inpatient Medicine: What Every Physician Needs to Know. New York, NY: Oxford University Press; 2017.
17. Richards L, Morse J. README FIRST for a User’s Guide to Qualitative Methods. 3rd ed. Los Angeles, CA: SAGE Publications Inc; 2013.
18. US News and World Report. Best Medical Schools: Research. 2014; http://grad-schools.usnews.rankingsandreviews.com/best-graduate-schools/top-medical-schools/research-rankings. Accessed on September 16, 2016.
19. Guest G, Bunce A, Johnson L. How many interviews are enough? An experiment with data saturation and variability. Field Methods. 2006;18(1):59-82.
20. Braun V, Clarke V. Using thematic analysis in psychology. Qual Res Psychol. 2006;3(2):77-101. PubMed
21. Aronson J. A pragmatic view of thematic analysis. Qual Rep. 1995;2(1):1-3.
22. Weissmann PF, Branch WT, Gracey CF, Haidet P, Frankel RM. Role modeling humanistic behavior: learning bedside manner from the experts. Acad Med. 2006;81(7):661-667. PubMed
23. Ramani S, Orlander JD. Human dimensions in bedside teaching: focus group discussions of teachers and learners. Teach Learn Med. 2013;25(4):312-318. PubMed
24. Block L, Hutzler L, Habicht R, et al. Do internal medicine interns practice etiquette-based communication? A critical look at the inpatient encounter. J Hosp Med. 2013;8(11):631-634. PubMed
© 2017 Society of Hospital Medicine
Things We Do For No Reason: Echocardiogram in Unselected Patients with Syncope
The “Things We Do for No Reason” (TWDFNR) series reviews practices that have become common parts of hospital care but which may provide little value to our patients. Practices reviewed in the TWDFNR series do not represent “black and white” conclusions or clinical practice standards, but are meant as a starting place for research and active discussions among hospitalists and patients. We invite you to be part of that discussion. https://www.choosingwisely.org/
Syncope is a common cause of emergency department (ED) visits and hospitalizations. Echocardiogram is frequently used as a diagnostic tool in the evaluation of syncope, performed in 39%-91% of patients.
CLINICAL SCENARIO
A 57-year-old woman presented to the ED after a syncopal episode. She had just eaten dinner when she slumped over and became unresponsive. Her husband estimated that she regained consciousness 30 seconds later and quickly returned to baseline mental status. She denied chest pain, shortness of breath, or palpitations. Her medical history included hypertension and hypothyroidism. Her medication regimen was unchanged.
Vital signs, including orthostatic blood pressures, were within normal ranges. A physical examination revealed regular heart sounds without murmur, rub, or gallop. ECG showed normal sinus rhythm, normal axis, and normal intervals. Chest radiograph, complete blood count, chemistry, pro-brain natriuretic peptide (pro-BNP), and troponin were within normal ranges.
BACKGROUND
Syncope, defined as “abrupt, transient, complete loss of consciousness, associated with inability to maintain postural tone, with rapid and spontaneous recovery,”1 is a common clinical problem, accounting for 1% of ED visits in the United States.2 As syncope has been shown to be associated with increased mortality,3 the primary goal of syncope evaluation is to identify modifiable underlying causes, particularly cardiac causes. Current guidelines recommend a complete history and physical, orthostatic blood pressure measurement, and ECG as the initial evaluation for syncope.1 Echocardiogram is a frequent additional test, performed in 39%-91% of patients.4-8
WHY YOU MAY THINK ECHOCARDIOGRAM IS HELPFUL
Echocardiogram may identify depressed ejection fraction, a risk factor for ventricular arrhythmias, along with structural causes of syncope, including aortic stenosis, pulmonary hypertension, and hypertrophic cardiomyopathy.9 Structural heart disease is the underlying etiology in about 3% of patients with syncope.10
Prior guidelines stated that “an echocardiogram is a helpful screening test if the history, physical examination, and ECG do not provide a diagnosis or if underlying heart disease is suspected.”11 A separate guideline for the appropriate use of echocardiogram assigned a score of appropriateness on a 1-9 scale based on increasing indication.12 Echocardiogram for syncope was scored a 7 in patients with “no other symptoms or signs of cardiovascular disease.”12 Only 25%-40% of patients with syncope will have a cause identified after the history, physical examination, and ECG,13,14 creating diagnostic uncertainty that often leads to further testing.
WHY ECHOCARDIOGRAM IS NOT NECESSARY IN ALL PATIENTS
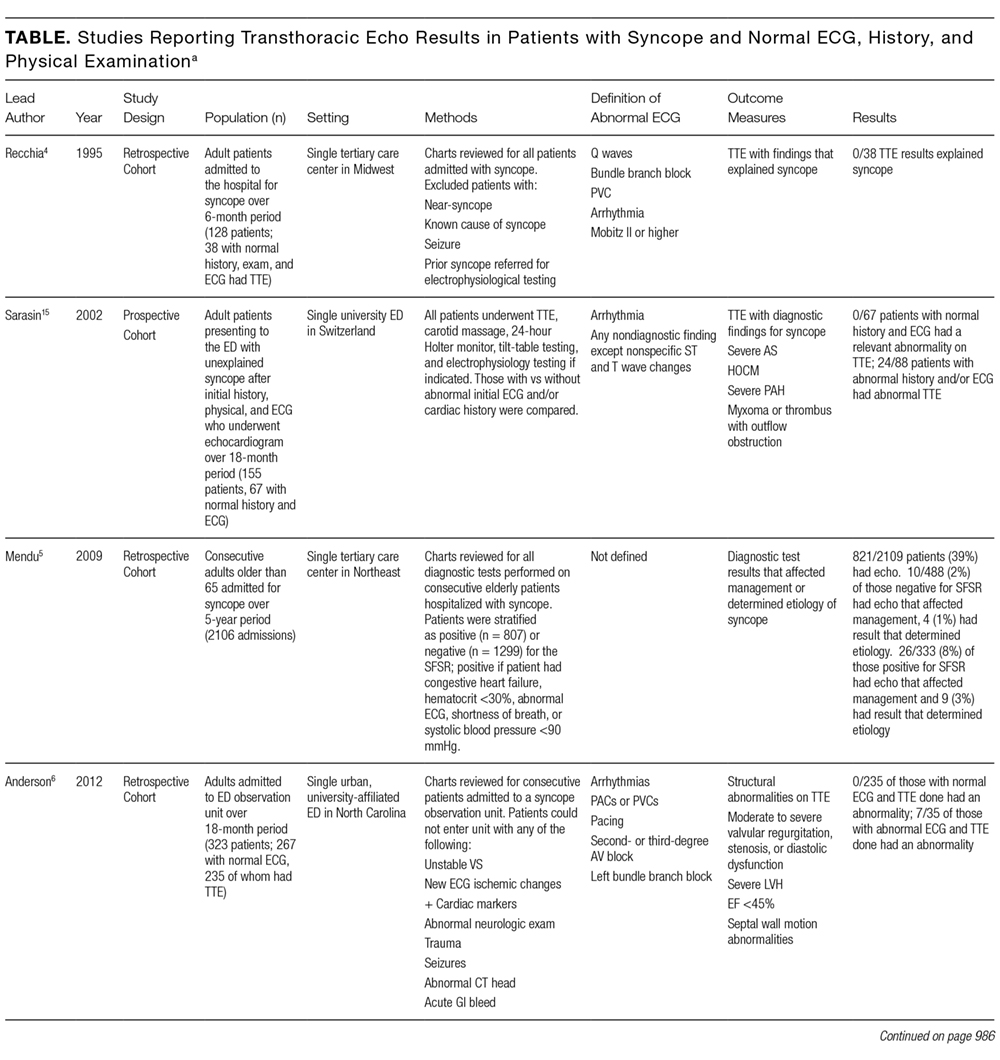

Mendu et al.5 performed a single-center, retrospective study of the diagnostic yield of testing for syncope in 2106 consecutive patients older than 65 admitted over the course of 5 years. They retrospectively applied the San Francisco Syncope Rule (SFSR), which patients met if they had congestive heart failure, hematocrit <30%, abnormal ECG, shortness of breath, or systolic blood pressure <90 mm Hg. There were 821 patients (39%) who underwent echocardiogram. Among the 488 with no SFSR criteria, 10 patients (2%) had echocardiogram results that affected management, and 4 patients (1%) had results that helped determine the etiology of syncope.
Anderson et al. studied 323 syncope patients in a single ED observation unit over 18 months.6 Patients with high-risk features, including unstable vital signs, abnormal cardiac biomarkers, or ischemic ECG changes, were excluded from the unit. The initial ECG was considered abnormal if it contained arrhythmia, premature atrial or ventricular contractions, pacing, second- or third-degree heart block, or left bundle branch block. Of the 235 patients with a normal ECG who underwent echocardiogram, none had an abnormal study.
Chang et al.7 performed a retrospective review of 468 patients admitted with syncope at a single hospital. Charts were reviewed for ECG and echocardiogram results. Abnormal ECGs were defined as those containing arrhythmias, Q waves, ischemic changes, second- and third-degree heart block, paced rhythm, corrected QT interval (QTc) >500 ms, left bundle branch or bifasicular block, Brugada pattern, or abnormal axis. Among 321 patients with normal ECGs, echocardiograms were performed in 192. Eleven of those echocardiograms were abnormal: 3 demonstrated aortic stenosis in patients who already carried the diagnosis, and the other 8 abnormal echocardiograms revealed unexpected left ventricular ejection fractions <45% or other nonaortic valvular pathology. None of the findings were felt to be the cause of syncope.
Han et al.8 performed a retrospective cohort study of all syncope patients presenting to a single ED over the course of 1 year. Patients were stratified as high risk if they had chest pain, palpitations, a history of cardiac disease (defined as prior arrhythmia, heart failure, coronary artery disease, or structural heart disease), abnormal cardiac biomarkers, or an abnormal ECG (defined as sinus bradycardia, arrhythmia, premature beats, second- or third-degree heart block, ventricular hypertrophy, ischemic Q or ST changes, or abnormal QT interval). Patients with none of those symptoms or findings were considered low risk. Of those categorized as low risk (n = 115), 47 underwent echocardiogram, only 1 of which was abnormal.
Across studies, the percentage of patients with a normal cardiac history, examination, and ECG with new, significant abnormalities on echocardiogram was 0% in 3 studies (n = 340),4,6,15 2% in 1 study (10/488 patients),5 2.1% in 1 study (1/47 patients),8 and 4.2% in 1 study (8/192 patients).7 The 11 echocardiograms with significant findings in the studies by Mendu et al.5 and Han et al.8 were not further described. The 8 patients with abnormal echocardiograms reported by Chang et al.7 had depressed left ventricular ejection fraction or nonaortic valvular disease that did not represent a definitive etiology of their syncope. Given the cost of $1,000 to $2,220 per study,16 routine echocardiograms in patients with a normal history, examination, and ECG would thus require $60,000 to $132,000 in spending to find 1 new significant abnormality, which may be unrelated to the actual cause of syncope.
SITUATIONS IN WHICH ECHOCARDIOGRAM MAY BE HELPFUL
The diagnostic yield of echocardiogram is higher in patients with a positive cardiac history or abnormal ECG. In the prospective study by Sarasin et al.15 a total of 27% of patients with a positive cardiac history or abnormal ECG were found to have an ejection fraction less than or equal to 40%. Other studies reporting percentages of abnormal echocardiograms in patients with abnormal history, ECG, or examination found rates of 8% (26/333),5 20% (7/35),6 28% (27/97),8 and 29% (27/93).7 It should be noted that not all of these abnormalities were felt to be the cause of syncope. For example, Sarasin et al.15 reported that only half of the patients with newly identified depressed ejection fraction were diagnosed with arrhythmia-related syncope. Chang et al7 reported that 6 of the 27 patients (22%) with abnormal ECG and echocardiogram had the cause of syncope established by echocardiogram.
Finally, some syncope patients will have cardiac biomarkers sent in the ED. Han et al.8 found that among patients with syncope, those with abnormal versus normal echocardiogram were more likely to have elevated BNP (70% vs 23%) and troponin (36% vs 12.4%). Thus, obtaining an echocardiogram in patients with syncope and abnormal cardiac biomarkers may be reasonable. It should be noted, however, that while some studies have suggested a role for biomarkers in differentiating cardiac from noncardiac syncope,17-20 current guidelines state that the usefulness of these tests is uncertain.1
WHAT YOU SHOULD DO INSTEAD OF ECHOCARDIOGRAM FOR ALL PATIENTS
Clinicians should carefully screen patients with syncope for abnormal findings suggesting cardiac disease on history, physical examination, and ECG. Relevant cardiac history includes known coronary artery disease, valvular heart disease, arrhythmia, congestive heart failure, and risk factors for cardiac syncope (supplemental Appendix). The definition of abnormal ECG varies among studies, but abnormalities that should prompt an echocardiogram include arrhythmia, premature atrial or ventricular contractions, second- or third-degree heart block, sinus bradycardia, bundle branch or fascicular blocks, left ventricular hypertrophy, ischemic ST or T wave changes, Q waves, or a prolonged QTc interval. New guidelines from the American College of Cardiology state, “Routine cardiac imaging is not useful in the evaluation of patients with syncope unless cardiac etiology is suspected on the basis of an initial evaluation, including history, physical examination, or ECG.”1
RECOMMENDATIONS
- All patients with syncope should receive a complete history, physical examination, orthostatic vital signs, and ECG.
- Perform echocardiogram on patients with syncope and a history of cardiac disease, examination suggestive of structural heart disease or congestive heart failure, or abnormal ECG.
- Echocardiogram may be reasonable in patients with syncope and abnormal cardiac biomarkers.
CONCLUSIONS
While commonly performed as part of syncope evaluations, echocardiogram has a very low diagnostic yield in patients with a normal history, physical, and ECG. The patient described in the initial case scenario would have an extremely low likelihood of having important diagnostic information found on echocardiogram.
Disclosure
The authors have no conflicts of interest relevant to this article.
1. Shen WK, Sheldon RS, Benditt DG, et al. 2017 ACC/AHA/HRS Guideline for the Evaluation and Management of Patients With Syncope: A Report of the American College of Cardiology/American Heart Association Task Force on Clinical Practice Guidelines, and the Heart Rhythm Society. J Am Coll Cardiol. 2017;70(5):620-633. PubMed
2. Sun BC, Emond JA, Camargo CA Jr. Characteristics and admission patterns of patients presenting with syncope to U.S. emergency departments, 1992-2000. Acad Emerg Med. 2004;11(10):1029-1034. PubMed
3. Soteriades ES, Evans JC, Larson MG, et al. Incidence and prognosis of syncope. N Engl J Med. 2002;347(12):878-885. PubMed
4. Recchia D, Barzilai B. Echocardiography in the evaluation of patients with syncope. J Gen Intern Med. 1995;10(12):649-655. PubMed
5. Mendu ML, McAvay G, Lampert R, Stoehr J, Tinetti ME. Yield of diagnostic tests in evaluating syncopal episodes in older patients. Arch Intern Med. 2009;169(14):1299-1305. PubMed
6. Anderson KL, Limkakeng A, Damuth E, Chandra A. Cardiac evaluation for structural abnormalities may not be required in patients presenting with syncope and a normal ECG result in an observation unit setting. Ann Emerg Med. 2012;60(4):478-484.e1. PubMed
7. Chang NL, Shah P, Bajaj S, Virk H, Bikkina M, Shamoon F. Diagnostic Yield of Echocardiography in Syncope Patients with Normal ECG. Cardiol Res Pract. 2016;2016:1251637. PubMed
8. Han SK, Yeom SR, Lee SH, et al. Transthoracic echocardiogram in syncope patients with normal initial evaluation. Am J Emerg Med. 2017;35(2):281-284. PubMed
9. Task Force for the Diagnosis and Management of Syncope, European Society of Cardiology, European Heart Rhythm Association, et al. Guidelines for the diagnosis and management of syncope (version 2009). Eur Heart J. 2009;30(21):2631-2671.
10. Alboni P, Brignole M, Menozzi C, et al. Diagnostic value of history in patients with syncope with or without heart disease. J Am Coll Cardiol. 2001;37(7):1921-1928. PubMed
11. Strickberger SA, Benson DW, Biaggioni I, et al. AHA/ACCF Scientific Statement on the evaluation of syncope: from the American Heart Association Councils on Clinical Cardiology, Cardiovascular Nursing, Cardiovascular Disease in the Young, and Stroke, and the Quality of Care and Outcomes Research Interdisciplinary Working Group; and the American College of Cardiology Foundation: in collaboration with the Heart Rhythm Society: endorsed by the American Autonomic Society. Circulation. 2006;113(2):316-327. PubMed
12. American College of Cardiology Foundation Appropriate Use Criteria Task Force, American Society of Echocardiography, American Heart Association, et al. ACCF/ASE/AHA/ASNC/HFSA/HRS/SCAI/SCCM/SCCT/SCMR 2011 Appropriate Use Criteria for Echocardiography. A Report of the American College of Cardiology Foundation Appropriate Use Criteria Task Force, American Society of Echocardiography, American Heart Association, American Society of Nuclear Cardiology, Heart Failure Society of America, Heart Rhythm Society, Society for Cardiovascular Angiography and Interventions, Society of Critical Care Medicine, Society of Cardiovascular Computed Tomography, and Society for Cardiovascular Magnetic Resonance Endorsed by the American College of Chest Physicians. J Am Coll Cardiol. 2011;57(9):1126-1166. PubMed
13. Crane SD. Risk stratification of patients with syncope in an accident and emergency department. Emerg Med J. 2002;19(1):23-27. PubMed
14. Croci F, Brignole M, Alboni P, et al. The application of a standardized strategy of evaluation in patients with syncope referred to three syncope units. Europace. 2002;4(4):351-355. PubMed
15. Sarasin FP, Junod AF, Carballo D, Slama S, Unger PF, Louis-Simonet M. Role of echocardiography in the evaluation of syncope: a prospective study. Heart. 2002;88(4):363-367. PubMed
16. Echocardiogram Cost. http://health.costhelper.com/echocardiograms.html. 2017. Accessed January 26, 2017.
17. Thiruganasambandamoorthy V, Ramaekers R, Rahman MO, et al. Prognostic value of cardiac biomarkers in the risk stratification of syncope: a systematic review. Intern Emerg Med. 2015;10(8):1003-1014. PubMed
18. Pfister R, Diedrichs H, Larbig R, Erdmann E, Schneider CA. NT-pro-BNP for differential diagnosis in patients with syncope. Int J Cardiol. 2009;133(1):51-54. PubMed
19. Reed MJ, Mills NL, Weir CJ. Sensitive troponin assay predicts outcome in syncope. Emerg Med J. 2012;29(12):1001-1003. PubMed
20. Tanimoto K, Yukiiri K, Mizushige K, et al. Usefulness of brain natriuretic peptide as a marker for separating cardiac and noncardiac causes of syncope. Am J Cardiol. 2004;93(2):228-230. PubMed
The “Things We Do for No Reason” (TWDFNR) series reviews practices that have become common parts of hospital care but which may provide little value to our patients. Practices reviewed in the TWDFNR series do not represent “black and white” conclusions or clinical practice standards, but are meant as a starting place for research and active discussions among hospitalists and patients. We invite you to be part of that discussion. https://www.choosingwisely.org/
Syncope is a common cause of emergency department (ED) visits and hospitalizations. Echocardiogram is frequently used as a diagnostic tool in the evaluation of syncope, performed in 39%-91% of patients.
CLINICAL SCENARIO
A 57-year-old woman presented to the ED after a syncopal episode. She had just eaten dinner when she slumped over and became unresponsive. Her husband estimated that she regained consciousness 30 seconds later and quickly returned to baseline mental status. She denied chest pain, shortness of breath, or palpitations. Her medical history included hypertension and hypothyroidism. Her medication regimen was unchanged.
Vital signs, including orthostatic blood pressures, were within normal ranges. A physical examination revealed regular heart sounds without murmur, rub, or gallop. ECG showed normal sinus rhythm, normal axis, and normal intervals. Chest radiograph, complete blood count, chemistry, pro-brain natriuretic peptide (pro-BNP), and troponin were within normal ranges.
BACKGROUND
Syncope, defined as “abrupt, transient, complete loss of consciousness, associated with inability to maintain postural tone, with rapid and spontaneous recovery,”1 is a common clinical problem, accounting for 1% of ED visits in the United States.2 As syncope has been shown to be associated with increased mortality,3 the primary goal of syncope evaluation is to identify modifiable underlying causes, particularly cardiac causes. Current guidelines recommend a complete history and physical, orthostatic blood pressure measurement, and ECG as the initial evaluation for syncope.1 Echocardiogram is a frequent additional test, performed in 39%-91% of patients.4-8
WHY YOU MAY THINK ECHOCARDIOGRAM IS HELPFUL
Echocardiogram may identify depressed ejection fraction, a risk factor for ventricular arrhythmias, along with structural causes of syncope, including aortic stenosis, pulmonary hypertension, and hypertrophic cardiomyopathy.9 Structural heart disease is the underlying etiology in about 3% of patients with syncope.10
Prior guidelines stated that “an echocardiogram is a helpful screening test if the history, physical examination, and ECG do not provide a diagnosis or if underlying heart disease is suspected.”11 A separate guideline for the appropriate use of echocardiogram assigned a score of appropriateness on a 1-9 scale based on increasing indication.12 Echocardiogram for syncope was scored a 7 in patients with “no other symptoms or signs of cardiovascular disease.”12 Only 25%-40% of patients with syncope will have a cause identified after the history, physical examination, and ECG,13,14 creating diagnostic uncertainty that often leads to further testing.
WHY ECHOCARDIOGRAM IS NOT NECESSARY IN ALL PATIENTS
Mendu et al.5 performed a single-center, retrospective study of the diagnostic yield of testing for syncope in 2106 consecutive patients older than 65 admitted over the course of 5 years. They retrospectively applied the San Francisco Syncope Rule (SFSR), which patients met if they had congestive heart failure, hematocrit <30%, abnormal ECG, shortness of breath, or systolic blood pressure <90 mm Hg. There were 821 patients (39%) who underwent echocardiogram. Among the 488 with no SFSR criteria, 10 patients (2%) had echocardiogram results that affected management, and 4 patients (1%) had results that helped determine the etiology of syncope.
Anderson et al. studied 323 syncope patients in a single ED observation unit over 18 months.6 Patients with high-risk features, including unstable vital signs, abnormal cardiac biomarkers, or ischemic ECG changes, were excluded from the unit. The initial ECG was considered abnormal if it contained arrhythmia, premature atrial or ventricular contractions, pacing, second- or third-degree heart block, or left bundle branch block. Of the 235 patients with a normal ECG who underwent echocardiogram, none had an abnormal study.
Chang et al.7 performed a retrospective review of 468 patients admitted with syncope at a single hospital. Charts were reviewed for ECG and echocardiogram results. Abnormal ECGs were defined as those containing arrhythmias, Q waves, ischemic changes, second- and third-degree heart block, paced rhythm, corrected QT interval (QTc) >500 ms, left bundle branch or bifasicular block, Brugada pattern, or abnormal axis. Among 321 patients with normal ECGs, echocardiograms were performed in 192. Eleven of those echocardiograms were abnormal: 3 demonstrated aortic stenosis in patients who already carried the diagnosis, and the other 8 abnormal echocardiograms revealed unexpected left ventricular ejection fractions <45% or other nonaortic valvular pathology. None of the findings were felt to be the cause of syncope.
Han et al.8 performed a retrospective cohort study of all syncope patients presenting to a single ED over the course of 1 year. Patients were stratified as high risk if they had chest pain, palpitations, a history of cardiac disease (defined as prior arrhythmia, heart failure, coronary artery disease, or structural heart disease), abnormal cardiac biomarkers, or an abnormal ECG (defined as sinus bradycardia, arrhythmia, premature beats, second- or third-degree heart block, ventricular hypertrophy, ischemic Q or ST changes, or abnormal QT interval). Patients with none of those symptoms or findings were considered low risk. Of those categorized as low risk (n = 115), 47 underwent echocardiogram, only 1 of which was abnormal.
Across studies, the percentage of patients with a normal cardiac history, examination, and ECG with new, significant abnormalities on echocardiogram was 0% in 3 studies (n = 340),4,6,15 2% in 1 study (10/488 patients),5 2.1% in 1 study (1/47 patients),8 and 4.2% in 1 study (8/192 patients).7 The 11 echocardiograms with significant findings in the studies by Mendu et al.5 and Han et al.8 were not further described. The 8 patients with abnormal echocardiograms reported by Chang et al.7 had depressed left ventricular ejection fraction or nonaortic valvular disease that did not represent a definitive etiology of their syncope. Given the cost of $1,000 to $2,220 per study,16 routine echocardiograms in patients with a normal history, examination, and ECG would thus require $60,000 to $132,000 in spending to find 1 new significant abnormality, which may be unrelated to the actual cause of syncope.
SITUATIONS IN WHICH ECHOCARDIOGRAM MAY BE HELPFUL
The diagnostic yield of echocardiogram is higher in patients with a positive cardiac history or abnormal ECG. In the prospective study by Sarasin et al.15 a total of 27% of patients with a positive cardiac history or abnormal ECG were found to have an ejection fraction less than or equal to 40%. Other studies reporting percentages of abnormal echocardiograms in patients with abnormal history, ECG, or examination found rates of 8% (26/333),5 20% (7/35),6 28% (27/97),8 and 29% (27/93).7 It should be noted that not all of these abnormalities were felt to be the cause of syncope. For example, Sarasin et al.15 reported that only half of the patients with newly identified depressed ejection fraction were diagnosed with arrhythmia-related syncope. Chang et al7 reported that 6 of the 27 patients (22%) with abnormal ECG and echocardiogram had the cause of syncope established by echocardiogram.
Finally, some syncope patients will have cardiac biomarkers sent in the ED. Han et al.8 found that among patients with syncope, those with abnormal versus normal echocardiogram were more likely to have elevated BNP (70% vs 23%) and troponin (36% vs 12.4%). Thus, obtaining an echocardiogram in patients with syncope and abnormal cardiac biomarkers may be reasonable. It should be noted, however, that while some studies have suggested a role for biomarkers in differentiating cardiac from noncardiac syncope,17-20 current guidelines state that the usefulness of these tests is uncertain.1
WHAT YOU SHOULD DO INSTEAD OF ECHOCARDIOGRAM FOR ALL PATIENTS
Clinicians should carefully screen patients with syncope for abnormal findings suggesting cardiac disease on history, physical examination, and ECG. Relevant cardiac history includes known coronary artery disease, valvular heart disease, arrhythmia, congestive heart failure, and risk factors for cardiac syncope (supplemental Appendix). The definition of abnormal ECG varies among studies, but abnormalities that should prompt an echocardiogram include arrhythmia, premature atrial or ventricular contractions, second- or third-degree heart block, sinus bradycardia, bundle branch or fascicular blocks, left ventricular hypertrophy, ischemic ST or T wave changes, Q waves, or a prolonged QTc interval. New guidelines from the American College of Cardiology state, “Routine cardiac imaging is not useful in the evaluation of patients with syncope unless cardiac etiology is suspected on the basis of an initial evaluation, including history, physical examination, or ECG.”1
RECOMMENDATIONS
- All patients with syncope should receive a complete history, physical examination, orthostatic vital signs, and ECG.
- Perform echocardiogram on patients with syncope and a history of cardiac disease, examination suggestive of structural heart disease or congestive heart failure, or abnormal ECG.
- Echocardiogram may be reasonable in patients with syncope and abnormal cardiac biomarkers.
CONCLUSIONS
While commonly performed as part of syncope evaluations, echocardiogram has a very low diagnostic yield in patients with a normal history, physical, and ECG. The patient described in the initial case scenario would have an extremely low likelihood of having important diagnostic information found on echocardiogram.
Disclosure
The authors have no conflicts of interest relevant to this article.
1. Shen WK, Sheldon RS, Benditt DG, et al. 2017 ACC/AHA/HRS Guideline for the Evaluation and Management of Patients With Syncope: A Report of the American College of Cardiology/American Heart Association Task Force on Clinical Practice Guidelines, and the Heart Rhythm Society. J Am Coll Cardiol. 2017;70(5):620-633. PubMed
2. Sun BC, Emond JA, Camargo CA Jr. Characteristics and admission patterns of patients presenting with syncope to U.S. emergency departments, 1992-2000. Acad Emerg Med. 2004;11(10):1029-1034. PubMed
3. Soteriades ES, Evans JC, Larson MG, et al. Incidence and prognosis of syncope. N Engl J Med. 2002;347(12):878-885. PubMed
4. Recchia D, Barzilai B. Echocardiography in the evaluation of patients with syncope. J Gen Intern Med. 1995;10(12):649-655. PubMed
5. Mendu ML, McAvay G, Lampert R, Stoehr J, Tinetti ME. Yield of diagnostic tests in evaluating syncopal episodes in older patients. Arch Intern Med. 2009;169(14):1299-1305. PubMed
6. Anderson KL, Limkakeng A, Damuth E, Chandra A. Cardiac evaluation for structural abnormalities may not be required in patients presenting with syncope and a normal ECG result in an observation unit setting. Ann Emerg Med. 2012;60(4):478-484.e1. PubMed
7. Chang NL, Shah P, Bajaj S, Virk H, Bikkina M, Shamoon F. Diagnostic Yield of Echocardiography in Syncope Patients with Normal ECG. Cardiol Res Pract. 2016;2016:1251637. PubMed
8. Han SK, Yeom SR, Lee SH, et al. Transthoracic echocardiogram in syncope patients with normal initial evaluation. Am J Emerg Med. 2017;35(2):281-284. PubMed
9. Task Force for the Diagnosis and Management of Syncope, European Society of Cardiology, European Heart Rhythm Association, et al. Guidelines for the diagnosis and management of syncope (version 2009). Eur Heart J. 2009;30(21):2631-2671.
10. Alboni P, Brignole M, Menozzi C, et al. Diagnostic value of history in patients with syncope with or without heart disease. J Am Coll Cardiol. 2001;37(7):1921-1928. PubMed
11. Strickberger SA, Benson DW, Biaggioni I, et al. AHA/ACCF Scientific Statement on the evaluation of syncope: from the American Heart Association Councils on Clinical Cardiology, Cardiovascular Nursing, Cardiovascular Disease in the Young, and Stroke, and the Quality of Care and Outcomes Research Interdisciplinary Working Group; and the American College of Cardiology Foundation: in collaboration with the Heart Rhythm Society: endorsed by the American Autonomic Society. Circulation. 2006;113(2):316-327. PubMed
12. American College of Cardiology Foundation Appropriate Use Criteria Task Force, American Society of Echocardiography, American Heart Association, et al. ACCF/ASE/AHA/ASNC/HFSA/HRS/SCAI/SCCM/SCCT/SCMR 2011 Appropriate Use Criteria for Echocardiography. A Report of the American College of Cardiology Foundation Appropriate Use Criteria Task Force, American Society of Echocardiography, American Heart Association, American Society of Nuclear Cardiology, Heart Failure Society of America, Heart Rhythm Society, Society for Cardiovascular Angiography and Interventions, Society of Critical Care Medicine, Society of Cardiovascular Computed Tomography, and Society for Cardiovascular Magnetic Resonance Endorsed by the American College of Chest Physicians. J Am Coll Cardiol. 2011;57(9):1126-1166. PubMed
13. Crane SD. Risk stratification of patients with syncope in an accident and emergency department. Emerg Med J. 2002;19(1):23-27. PubMed
14. Croci F, Brignole M, Alboni P, et al. The application of a standardized strategy of evaluation in patients with syncope referred to three syncope units. Europace. 2002;4(4):351-355. PubMed
15. Sarasin FP, Junod AF, Carballo D, Slama S, Unger PF, Louis-Simonet M. Role of echocardiography in the evaluation of syncope: a prospective study. Heart. 2002;88(4):363-367. PubMed
16. Echocardiogram Cost. http://health.costhelper.com/echocardiograms.html. 2017. Accessed January 26, 2017.
17. Thiruganasambandamoorthy V, Ramaekers R, Rahman MO, et al. Prognostic value of cardiac biomarkers in the risk stratification of syncope: a systematic review. Intern Emerg Med. 2015;10(8):1003-1014. PubMed
18. Pfister R, Diedrichs H, Larbig R, Erdmann E, Schneider CA. NT-pro-BNP for differential diagnosis in patients with syncope. Int J Cardiol. 2009;133(1):51-54. PubMed
19. Reed MJ, Mills NL, Weir CJ. Sensitive troponin assay predicts outcome in syncope. Emerg Med J. 2012;29(12):1001-1003. PubMed
20. Tanimoto K, Yukiiri K, Mizushige K, et al. Usefulness of brain natriuretic peptide as a marker for separating cardiac and noncardiac causes of syncope. Am J Cardiol. 2004;93(2):228-230. PubMed
© 2017 Society of Hospital Medicine
Hospital Perceptions of Medicare’s Sepsis Quality Reporting Initiative
Sepsis affects over 1 million Americans annually, resulting in significant morbidity, mortality, and costs for hospitalized patients.1-4 There is an increasing interest in policy-oriented approaches to improving sepsis care at both the state and national levels.5,6 The most prominent policy is the Centers for Medicare and Medicaid Services (CMS) Sepsis CMS Core (SEP-1) program, which was formally implemented in October 2015; the program mandates that hospitals report their compliance with a variety of sepsis treatment processes (Table 1). Academic quality experts generally applaud the increased attention to sepsis but are concerned that the measure’s design and specifications advance beyond the existing evidence base.7,8 However, remarkably little is known about how front-line hospital quality officials perceive the program and how they are responding or not responding, to the new requirements. This knowledge gap is a critical barrier to evaluating the program’s practical impact on sepsis treatment and outcomes.
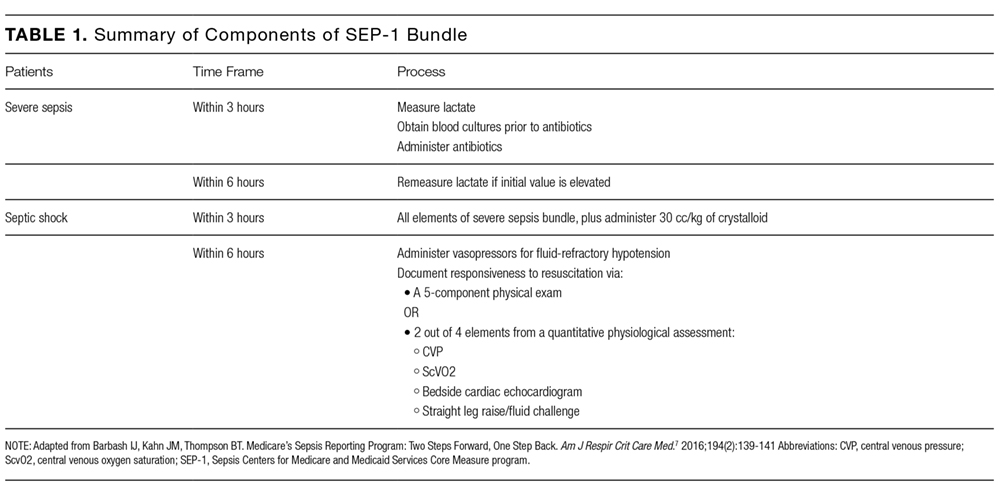
METHODS
Study Design, Setting, and Subjects
We conducted a qualitative study by using semistructured telephone interviews with hospital quality officers in the United States. We targeted hospital quality officers because they are in a position to provide overarching insights into hospitals’ perceptions of and responses to the SEP-1 program. We enrolled quality officers at general, short-stay, nonfederal acute care hospitals because those are the hospitals to which the SEP-1 program applies. We generated a stratified random sample of hospitals by using 2013 data from Medicare’s Healthcare Cost and Reporting Information System (HCRIS) database.10 We stratified by size (greater than or less than 200 total beds), teaching status (presence or absence of any resident physician trainees), and ownership (for-profit vs nonprofit), creating 8 mutually exclusive strata. This sampling frame was designed to ensure representativeness from a broad range of hospital types, not to enable comparisons across hospital types, which is outside the scope of qualitative research.
Within strata, we contacted hospitals in a random order by phone using the primary number listed in the HCRIS database. We asked the hospital operator to connect us to the chief quality officer or an appropriate alternative hospital administrator with knowledge of hospital quality-improvement activities. We limited participation to 1 respondent per hospital. We did not offer any specific incentives for participation.
The study was approved by the University of Pittsburgh Institutional Review Board with a waiver of signed informed consent.
Data Collection
Interviews were conducted by a trained research coordinator between February 2016 and October 2016. Interviews were conducted concurrently with data analysis by using a constant comparison approach.11 The constant comparison approach involves the iterative refinement of themes by comparing the existing themes to new data as they emerge during successive interviews. We chose a constant comparison approach because we wanted to systematically describe hospital responses to SEP-1 rather than specifically test individual hypotheses.11 As is typical in qualitative research, we did not set the sample size a priori but instead continued the interviews until we achieved thematic saturation.12,13
The interview script included a mix of directed and open-ended questions about respondents’ perspectives of and hospital responses to the SEP-1 program. The questions covered the following 4 domains: hospitals’ sepsis quality-improvement initiatives before and after the Medicare reporting program, reception of the hospital responses, the approach to data abstraction and reporting, and the overall impressions of the program and its impact.6-8,14 We allowed for updates and revisions of the interview guide as necessary to explore any new content and emergent themes. We piloted the interview guide on 2 hospital quality officers at our institution and then revised its structure again after interviews with the initial 6 hospitals. The complete final interview guide is available in the supplemental digital content.
Analysis
Interviews were audio recorded, transcribed, and loaded onto a secure server. We used NVivo 11 (QSR International, Cambridge, Massachusetts) for coding and analysis. We iteratively reviewed and thematically analyzed the transcripts for structural content and emergent themes, consistent with established qualitative methods.15 Three investigators reviewed the initial 20 transcripts and developed the codebook through iterative discussion and consensus. The codes were then organized into themes and subthemes. Subsequently, 1 investigator coded the remaining transcripts. The results are presented as a series of key themes supported by direct quotes from the interviews.
RESULTS
Sample Description
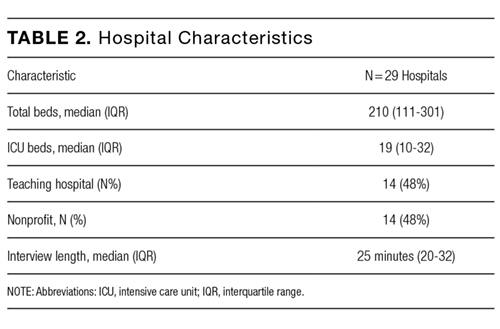
Perspectives on SEP-1

Responses to SEP-1

Efforts to Collect Data for SEP-1 Reporting
Respondents reported challenges in reliably and validly measuring and reporting data for the SEP-1 program. First, patient identification and the measurement of treatment processes depends largely on manual medical record review, which is subject to variation across coders. This presents a particular challenge because the clinical definition of sepsis itself is in evolution,1 creating the possibility that treating physicians could identify a given patient as having sepsis or septic shock based on the most up-to-date definitions but not based on the measure’s specifications or vice versa. Second, each case requires up to an hour of manual medical record review and patients who develop sepsis during prolonged hospitalizations can require several hours or more, which is an unprecedented length of time to spend abstracting data for a single measure.
In addressing these measurement challenges, investment in human resources is the rule. No respondent reported automating abstraction of all the SEP-1 data elements, underscoring concerns regarding the measurement burden of the SEP-1 program.7,8,14 Rather, hospitals with sufficient financial resources frequently employ full-time data abstractors and individuals responsible for ongoing performance feedback, which facilitates the iterative revision of sepsis quality-improvement initiatives. In contrast, hospitals with fewer resources often rely on contracts with third-party vendors, which delays reporting and complicates efforts to use the data for individualized performance improvement.
Efforts to Coordinate Hospital Responses Across Care Teams
Complying with the measure involves the longitudinal coordination of multiple care teams across different units, so planning and executing local hospital responses required interdepartmental and multidisciplinary stakeholder involvement. Respondents were uncertain about the ideal strategy to coordinate these quality-improvement efforts, yielding iterative changes to electronic health records (EHRs), education programs, and data collection methods. This “learning by doing” is necessary because no prior CMS quality measure is as complex as SEP-1 or as varied in the sources of data required to measure and report the results. By requiring hospitals to improve coordination of care throughout the hospital, SEP-1 presents a quality-improvement and measurement challenge that may ultimately drive innovation and better patient care.
Efforts to Improve Sepsis Diagnosis
Several hospitals are implementing sepsis screening and alerts to speed sepsis recognition and meet the measure’s time-sensitive treatment requirements. An example of a less-intensive alert is one hospital’s lowering of the threshold for lactate values that are viewed as “critical” (and thus requiring notification of the bedside clinician). Examples of more resource-intensive alerts included electronic screening for vital sign abnormalities that trigger bedside assessment for infection as well as nurse-driven manual sepsis screening tools.
Frequently, these more intensive efforts faced barriers to successful implementation related to the broader issues of performance measurement rather than the specifics of SEP-1. EHRs generally lacked built-in electronic screening capacity, and few hospitals had the resources required for customized EHR modification. Manual screening required nurses to spend time away from direct patient care. For both electronic and manual screening, respondents expressed concern about how these new alerts would fit into a care landscape already inundated with alerts, alarms, and care notifications.16,17
Efforts to Improve Sepsis Treatment
Many hospitals are implementing sepsis-specific treatment protocols and order sets designed to help meet SEP-1 treatment specifications. In hospitals and health systems with preexisting sepsis quality-improvement efforts, SEP-1 stimulated adaptation and acceleration of their efforts; in hospitals without preexisting sepsis-specific quality improvement, SEP-1 inspired de novo program development and implementation. These programs were wide ranging. Several hospitals implemented a process by which an initially elevated lactate value automates an order for a repeat lactate level, facilitating an assessment of the clinical response to treatment. Other examples include triggers for sepsis-specific treatment protocols and checklists that bedside nurses can begin without initial physician oversight. In 1 hospital, sepsis alerts triggered by emergency medical first responders initiate responses prior to hospital arrival in a manner analogous to prehospital alerts for myocardial infarction and stroke.18,19
Efforts to implement these protocols encountered several common challenges. Physicians were often resistant to adopting inflexible treatment rules that did not allow them to tailor therapies to individual patients. Furthermore, even protocols and order sets that worked in 1 setting did not necessarily generalize throughout the hospital or health system, reflecting the difficulty in implementing a highly specified measure across diverse treatment environments.
Efforts to Manage Clinician Attitudes Toward SEP-1 Implementation
In addition to addressing clinicians’ behaviors, hospitals sought to address stakeholders’ attitudes when those attitudes created barriers to SEP-1 implementation. First, hospitals frequently faced a lack of buy-in from clinicians who were resistant to the idea of protocolized care in general and who were specifically skeptical that initiatives designed to increase clinical documentation would drive improvements in patient-centered outcomes. Second, respondents had to confront a hierarchical hospital culture, which manifests not only in clinical care, but also in the quality-improvement infrastructure. Many respondents reported that physicians were more receptive to performance feedback from fellow physicians rather than nonphysician quality administrators.
Respondents described a range of approaches to counteract these attitudes. First, hospitals deployed department- and profession-specific “champions” to provide peer-to-peer performance feedback supported by data demonstrating a link between process improvements and patient outcomes. Second, many respondents noted that the addition of new clinical staff, who were often younger and more receptive to new initiatives, could alter a hospital’s quality culture; in smaller hospitals, just a few individuals could significantly alter the dynamic. Finally, when other efforts failed, some respondents indicated that top-down administrative support could persuade resistant individuals to change their approach. However, this solution worked best with employed physicians and was less effective with independent physician groups without direct financial ties to hospital performance. These efforts to overcome negative attitudes toward SEP-1 implementation required individuals’ time and energy, leading to frustration at times and adding to the resources required to comply with the program.
Planning for the Future of SEP-1
Respondents anticipate that performance of the SEP-1 measure will eventually become publicly reported and incorporated into value-based purchasing calculations. Hospitals are therefore seeking greater interaction with CMS as it makes iterative revisions to the measure because respondents expect that their hospitals’ level of performance, rather than just the act of participating, will affect hospital finances. Respondents expressed a desire for more live, interactive educational sessions with CMS moving forward, rather than limiting the opportunities for clarification to online comment forums or statements elsewhere in the public record. In addition, respondents hope that public reporting and pay-for-performance could be delayed to allow more time to work out the “kinks” in measurement and reporting.
DISCUSSION
We conducted semistructured telephone interviews with quality officers in U.S. hospitals in order to understand hospitals’ perceptions of and responses to Medicare’s SEP-1 sepsis quality-reporting program. Hospitals are struggling with the program’s complexity and investing considerable resources in order to iteratively revise their responses to the program. However, they generally believe that the program is bringing much-needed attention to sepsis diagnosis and treatment. These findings have several implications for the SEP-1 measure in particular and for hospital-based quality measurement and pay-for-performance policies in general.
First, we demonstrate that SEP-1 consistently requires a substantial investment of resources from hospitals already struggling under the weight of numerous local, state, and national quality-reporting and improvement programs.14,20,21 In aggregate, these programs can stretch hospitals’ resources to their limit. Respondents universally reported that the SEP-1 program is requiring dedicated staff to meet the data abstraction and reporting requirements as well as multicomponent quality-improvement initiatives. In the absence of well-established roadmaps for improving sepsis care, these sepsis quality-improvement efforts require experimentation and iterative revision, which can contribute to fatigue and frustration among quality officers and clinical staff. This process of innovation inherently involves successes, failures, and the risk of harm and opportunity costs that strain hospital resources.
Second, our study indicates how SEP-1 could exacerbate existing inequalities in our health system. Sepsis incidence and mortality are already higher in medically underserved regions.22 Given the resources required to respond to the SEP-1 program, optimal performance may be beyond the reach of smaller hospitals, or even larger hospitals, whose resources are already stretched to their limits. Public reporting and pay-for-performance can be adisadvantage to hospitals caring for underserved populations.23,24 To the extent that responding to sepsis-oriented public policy requires resources that certain hospitals cannot access, these policies could exacerbate existing health disparities.
Third, our findings highlight some specific ways that CMS could revise the SEP-1 program to better meet the needs of hospitals and improve outcomes for patients with sepsis. Primarily, although the program’s current specifications take an “all-or-none” approach to treatment success, a more flexible approach, such as a weighted score or composite measure that combines processes and outcomes,25,26 could allow hospitals to focus their efforts on those components of the bundle with the strongest evidence for improved patient outcomes.27 Second, policy makers need to reconcile the 2 existing clinical definitions for sepsis.1,28 CMS has already stated its plans to retain the preexisting sepsis definition,29 but this does not change the reality that frontline providers and quality officials face different, and at times conflicting, clinical definitions while caring for patients. Finally, current implementation challenges may support a delay in moving the measure toward public reporting and pay-for-performance. Hospitals are already responding to the measure in a substantial way, providing an opportunity for early quantitative evaluations of the program’s impact that could inform evidence-based revisions to the measure.
Our study has several limitations. First, by interviewing only individual quality officers within each hospital, it is possible that our findings were not representative of the perspectives of other individuals within their hospitals or the hospital as a whole; indeed, to the extent that quality officers “buy in” to quality measurement and reporting, their perspectives on SEP-1 may skew more positive than other hospital staff. Our respondents represented individuals from a range of positions within the quality infrastructure, whereas “hospital quality leaders” are often chief executive officers, chief medical officers, or vice presidents for quality.30 However, by virtue of our purposive sampling approach, we included respondents from a broad range of hospitals and found similar themes across these respondents, supporting the internal validity of our findings. Second, as is inherent in interview-based research, we cannot verify that respondents’ reports of hospital responses to SEP-1 match the actual changes implemented “on the ground.” We are reassured, however, by the fact that many of the perspectives and quality-improvement changes that respondents described align with the opinions and suggestions of academic quality experts, which are informed by clinical experience.6-8 Third, while respondents believe that hospital responses to SEP-1 are contributing to improvements in treatment and outcomes, we do not yet have robust objective data to support this opinion or to evaluate the association between quality officers’ perspectives and hospital performance. A quantitative evaluation of the clinical impact of SEP-1, as well as the relationship between hospital performance and quality officers’ perspectives on the measure, are important areas for future research.
CONCLUSIONS
In a qualitative study of hospital responses to Medicare’s SEP-1 program, we found that hospitals are implementing changes across a variety of domains and in ways that consistently require dedicated resources. Giving hospitals the flexibility to focus on treatment processes with the most direct impact on patient-centered outcomes might enhance the program’s effectiveness. Future work should quantify the program’s impact and develop novel approaches to data abstraction and quality improvement.
Disclosure
Aside from federal funding, the authors have no conflicts of interest to disclose. The authors received funding from the National Institutes of Health (IJB, F32HL132461) (JMK, K24HL133444). This work was submitted as an abstract to the 2017 American Thoracic Society International Conference, May 2017.
1. Singer M, Deutschman CS, Seymour CW, et al. The Third International Consensus Definitions for Sepsis and Septic Shock (Sepsis-3). JAMA. 2016;315(8):801-810. doi:10.1001/jama.2016.0287. PubMed
2. Angus DC, Linde-Zwirble WT, Lidicker J, Clermont G, Carcillo J, Pinsky MR. Epidemiology of severe sepsis in the United States: analysis of incidence, outcome, and associated costs of care. Crit Care Med. 2001;29(7):1303-1310. PubMed
3. Gaieski DF, Edwards JM, Kallan MJ, Carr BG. Benchmarking the incidence and mortality of severe sepsis in the United States. Crit Care Med. 2013;41(5):1167-1174. doi:10.1097/CCM.0b013e31827c09f8. PubMed
4. Liu V, Escobar GJ, Greene JD, et al. Hospital deaths in patients with sepsis from 2 independent cohorts. JAMA. 2014;312(1):90-92. doi:10.1001/jama.2014.5804. PubMed
5. Rhee C, Gohil S, Klompas M. Regulatory Mandates for Sepsis Care—Reasons for Caution. N Engl J Med. 2014;370(18):1673-1676. doi:10.1056/NEJMp1400276. PubMed
6. Cooke CR, Iwashyna TJ. Sepsis mandates: Improving inpatient care while advancing quality improvement. JAMA. 2014;312(14):1397-1398. doi:10.1001/jama.2014.11350. PubMed
7. Barbash IJ, Kahn JM, Thompson BT. Medicare’s Sepsis Reporting Program: Two Steps Forward, One Step Back. Am J Respir Crit Care Med. 2016;194(2):139-141. doi:10.1164/rccm.201604-0723ED. PubMed
8. Klompas M, Rhee C. The CMS Sepsis Mandate: Right Disease, Wrong Measure. Ann Intern Med. 2016;165(7):517-518. doi:10.7326/M16-0588. PubMed
9. Reade MC, Huang DT, Bell D, et al. Variability in management of early severe sepsis. Emerg Med J. 2010;27(2):110-115. doi:10.1136/emj.2008.070912. PubMed
10. Centers for Medicare & Medicaid Services. CMS Cost Reports. https://www.cms.gov/Research-Statistics-Data-and-Systems/Downloadable-Public-Use-Files/Cost-Reports/. Published 2017. Accessed on January 30, 2017.
11. Glaser BG. The Constant Comparative Method of Qualitative Analysis. Soc Probl. 1965;12(4):436-445. doi:10.2307/798843.
12. Morse JM. “Data Were Saturated...” Qual Health Res. 2015;25(5):587-588. doi:10.1177/1049732315576699. PubMed
13. Hennink MM, Kaiser BN, Marconi VC. Code Saturation Versus Meaning Saturation: How Many Interviews Are Enough? Qual Health Res. 2017;27(4):591-608. doi:10.1177/1049732316665344. PubMed
14. Wall MJ, Howell MD. Variation and Cost-effectiveness of Quality Measurement Programs. The Case of Sepsis Bundles. Ann Am Thorac Soc. 2015;12(11):1597-1599. doi:10.1513/AnnalsATS.201509-625ED. PubMed
15. Guest G, MacQueen KM. Handbook for Team-Based Qualitative Research. Plymouth: Altamira Press; 2008.
16. Kesselheim AS, Cresswell K, Phansalkar S, Bates DW, Sheikh A. Clinical decision support systems could be modified to reduce “alert fatigue” while still minimizing the risk of litigation. Health Aff (Millwood). 2011;30(12):2310-2317. doi:10.1377/hlthaff.2010.1111. PubMed
17. Sittig DF, Singh H. Electronic Health Records and National Patient-Safety Goals. N Engl J Med. 2012;367(19):1854-1860. doi:10.1056/NEJMsb1205420. PubMed
18. Kobayashi A, Misumida N, Aoi S, et al. STEMI notification by EMS predicts shorter door-to-balloon time and smaller infarct size. Am J Emerg Med. 2016;34(8):1610-1613. doi:10.1016/j.ajem.2016.06.022. PubMed
19. Lin CB, Peterson ED, Smith EE, et al. Emergency Medical Service Hospital Prenotification Is Associated With Improved Evaluation and Treatment of Acute Ischemic Stroke. Circ Cardiovasc Qual Outcomes. 2012;5(4):514-522. doi:10.1161/CIRCOUTCOMES.112.965210. PubMed
20. Meyer GS, Nelson EC, Pryor DB, et al. More quality measures versus measuring what matters: a call for balance and parsimony. BMJ Qual Saf. 2012;21(11):964-968. doi:10.1136/bmjqs-2012-001081. PubMed
21. Cassel CK, Conway PH, Delbanco SF, Jha AK, Saunders RS, Lee TH. Getting More Performance from Performance Measurement. N Engl J Med. 2014;371(23):2145-2147. doi:10.1056/NEJMp1408345. PubMed
22. Goodwin AJ, Nadig NR, McElligott JT, Simpson KN, Ford DW. Where You Live Matters: The Impact of Place of Residence on Severe Sepsis Incidence and Mortality. Chest. 2016;150(4):829-836. doi:10.1016/j.chest.2016.07.004. PubMed
23. Sjoding MW, Cooke CR. Readmission Penalties for Chronic Obstructive Pulmonary Disease Will Further Stress Hospitals Caring for Vulnerable Patient Populations. Am J Respir Crit Care Med. 2014;190(9):1072-1074. doi:10.1164/rccm.201407-1345LE. PubMed
24. Joynt KE, Jha AK. Characteristics of Hospitals Receiving Penalties Under the Hospital Readmissions Reduction Program. JAMA. 2013;309(4):342. doi:10.1001/jama.2012.94856. PubMed
25. Nolan T, Berwick DM. All-or-None Measurement Raises the Bar on Performance. JAMA. 2006;295(10):1168-1170. doi:10.1001/jama.295.10.1168. PubMed
26. Chen LM, Staiger DO, Birkmeyer JD, Ryan AM, Zhang W, Dimick JB. Composite quality measures for common inpatient medical conditions. Med Care. 2013;51(9):832-837. doi:10.1097/MLR.0b013e31829fa92a. PubMed
27. Rhodes A, Evans LE, Alhazzani W, et al. Surviving Sepsis Campaign: International Guidelines for Management of Sepsis and Septic Shock: 2016. Crit Care Med. 2017;45(3):486-552. doi:10.1097/CCM.0000000000002255. PubMed
28. Levy MM, Fink MP, Marshall JC, et al. 2001 SCCM/ESICM/ACCP/ATS/SIS International Sepsis Definitions Conference. Intensive Care Med. 2003;29(4):530-538. doi:10.1007/s00134-003-1662-x. PubMed
29. Townsend SR, Rivers E, Tefera L. Definitions for Sepsis and Septic Shock. JAMA. 2016;316(4):457-458. doi:10.1001/jama.2016.6374. PubMed
30. Lindenauer PK, Lagu T, Ross JS, et al. Attitudes of hospital leaders toward publicly reported measures of health care quality. JAMA Intern Med. 2014;174(12):1904-1911. doi:10.1001/jamainternmed.2014.5161. PubMed
Sepsis affects over 1 million Americans annually, resulting in significant morbidity, mortality, and costs for hospitalized patients.1-4 There is an increasing interest in policy-oriented approaches to improving sepsis care at both the state and national levels.5,6 The most prominent policy is the Centers for Medicare and Medicaid Services (CMS) Sepsis CMS Core (SEP-1) program, which was formally implemented in October 2015; the program mandates that hospitals report their compliance with a variety of sepsis treatment processes (Table 1). Academic quality experts generally applaud the increased attention to sepsis but are concerned that the measure’s design and specifications advance beyond the existing evidence base.7,8 However, remarkably little is known about how front-line hospital quality officials perceive the program and how they are responding or not responding, to the new requirements. This knowledge gap is a critical barrier to evaluating the program’s practical impact on sepsis treatment and outcomes.
METHODS
Study Design, Setting, and Subjects
We conducted a qualitative study by using semistructured telephone interviews with hospital quality officers in the United States. We targeted hospital quality officers because they are in a position to provide overarching insights into hospitals’ perceptions of and responses to the SEP-1 program. We enrolled quality officers at general, short-stay, nonfederal acute care hospitals because those are the hospitals to which the SEP-1 program applies. We generated a stratified random sample of hospitals by using 2013 data from Medicare’s Healthcare Cost and Reporting Information System (HCRIS) database.10 We stratified by size (greater than or less than 200 total beds), teaching status (presence or absence of any resident physician trainees), and ownership (for-profit vs nonprofit), creating 8 mutually exclusive strata. This sampling frame was designed to ensure representativeness from a broad range of hospital types, not to enable comparisons across hospital types, which is outside the scope of qualitative research.
Within strata, we contacted hospitals in a random order by phone using the primary number listed in the HCRIS database. We asked the hospital operator to connect us to the chief quality officer or an appropriate alternative hospital administrator with knowledge of hospital quality-improvement activities. We limited participation to 1 respondent per hospital. We did not offer any specific incentives for participation.
The study was approved by the University of Pittsburgh Institutional Review Board with a waiver of signed informed consent.
Data Collection
Interviews were conducted by a trained research coordinator between February 2016 and October 2016. Interviews were conducted concurrently with data analysis by using a constant comparison approach.11 The constant comparison approach involves the iterative refinement of themes by comparing the existing themes to new data as they emerge during successive interviews. We chose a constant comparison approach because we wanted to systematically describe hospital responses to SEP-1 rather than specifically test individual hypotheses.11 As is typical in qualitative research, we did not set the sample size a priori but instead continued the interviews until we achieved thematic saturation.12,13
The interview script included a mix of directed and open-ended questions about respondents’ perspectives of and hospital responses to the SEP-1 program. The questions covered the following 4 domains: hospitals’ sepsis quality-improvement initiatives before and after the Medicare reporting program, reception of the hospital responses, the approach to data abstraction and reporting, and the overall impressions of the program and its impact.6-8,14 We allowed for updates and revisions of the interview guide as necessary to explore any new content and emergent themes. We piloted the interview guide on 2 hospital quality officers at our institution and then revised its structure again after interviews with the initial 6 hospitals. The complete final interview guide is available in the supplemental digital content.
Analysis
Interviews were audio recorded, transcribed, and loaded onto a secure server. We used NVivo 11 (QSR International, Cambridge, Massachusetts) for coding and analysis. We iteratively reviewed and thematically analyzed the transcripts for structural content and emergent themes, consistent with established qualitative methods.15 Three investigators reviewed the initial 20 transcripts and developed the codebook through iterative discussion and consensus. The codes were then organized into themes and subthemes. Subsequently, 1 investigator coded the remaining transcripts. The results are presented as a series of key themes supported by direct quotes from the interviews.
RESULTS
Sample Description
Perspectives on SEP-1
Responses to SEP-1
Efforts to Collect Data for SEP-1 Reporting
Respondents reported challenges in reliably and validly measuring and reporting data for the SEP-1 program. First, patient identification and the measurement of treatment processes depends largely on manual medical record review, which is subject to variation across coders. This presents a particular challenge because the clinical definition of sepsis itself is in evolution,1 creating the possibility that treating physicians could identify a given patient as having sepsis or septic shock based on the most up-to-date definitions but not based on the measure’s specifications or vice versa. Second, each case requires up to an hour of manual medical record review and patients who develop sepsis during prolonged hospitalizations can require several hours or more, which is an unprecedented length of time to spend abstracting data for a single measure.
In addressing these measurement challenges, investment in human resources is the rule. No respondent reported automating abstraction of all the SEP-1 data elements, underscoring concerns regarding the measurement burden of the SEP-1 program.7,8,14 Rather, hospitals with sufficient financial resources frequently employ full-time data abstractors and individuals responsible for ongoing performance feedback, which facilitates the iterative revision of sepsis quality-improvement initiatives. In contrast, hospitals with fewer resources often rely on contracts with third-party vendors, which delays reporting and complicates efforts to use the data for individualized performance improvement.
Efforts to Coordinate Hospital Responses Across Care Teams
Complying with the measure involves the longitudinal coordination of multiple care teams across different units, so planning and executing local hospital responses required interdepartmental and multidisciplinary stakeholder involvement. Respondents were uncertain about the ideal strategy to coordinate these quality-improvement efforts, yielding iterative changes to electronic health records (EHRs), education programs, and data collection methods. This “learning by doing” is necessary because no prior CMS quality measure is as complex as SEP-1 or as varied in the sources of data required to measure and report the results. By requiring hospitals to improve coordination of care throughout the hospital, SEP-1 presents a quality-improvement and measurement challenge that may ultimately drive innovation and better patient care.
Efforts to Improve Sepsis Diagnosis
Several hospitals are implementing sepsis screening and alerts to speed sepsis recognition and meet the measure’s time-sensitive treatment requirements. An example of a less-intensive alert is one hospital’s lowering of the threshold for lactate values that are viewed as “critical” (and thus requiring notification of the bedside clinician). Examples of more resource-intensive alerts included electronic screening for vital sign abnormalities that trigger bedside assessment for infection as well as nurse-driven manual sepsis screening tools.
Frequently, these more intensive efforts faced barriers to successful implementation related to the broader issues of performance measurement rather than the specifics of SEP-1. EHRs generally lacked built-in electronic screening capacity, and few hospitals had the resources required for customized EHR modification. Manual screening required nurses to spend time away from direct patient care. For both electronic and manual screening, respondents expressed concern about how these new alerts would fit into a care landscape already inundated with alerts, alarms, and care notifications.16,17
Efforts to Improve Sepsis Treatment
Many hospitals are implementing sepsis-specific treatment protocols and order sets designed to help meet SEP-1 treatment specifications. In hospitals and health systems with preexisting sepsis quality-improvement efforts, SEP-1 stimulated adaptation and acceleration of their efforts; in hospitals without preexisting sepsis-specific quality improvement, SEP-1 inspired de novo program development and implementation. These programs were wide ranging. Several hospitals implemented a process by which an initially elevated lactate value automates an order for a repeat lactate level, facilitating an assessment of the clinical response to treatment. Other examples include triggers for sepsis-specific treatment protocols and checklists that bedside nurses can begin without initial physician oversight. In 1 hospital, sepsis alerts triggered by emergency medical first responders initiate responses prior to hospital arrival in a manner analogous to prehospital alerts for myocardial infarction and stroke.18,19
Efforts to implement these protocols encountered several common challenges. Physicians were often resistant to adopting inflexible treatment rules that did not allow them to tailor therapies to individual patients. Furthermore, even protocols and order sets that worked in 1 setting did not necessarily generalize throughout the hospital or health system, reflecting the difficulty in implementing a highly specified measure across diverse treatment environments.
Efforts to Manage Clinician Attitudes Toward SEP-1 Implementation
In addition to addressing clinicians’ behaviors, hospitals sought to address stakeholders’ attitudes when those attitudes created barriers to SEP-1 implementation. First, hospitals frequently faced a lack of buy-in from clinicians who were resistant to the idea of protocolized care in general and who were specifically skeptical that initiatives designed to increase clinical documentation would drive improvements in patient-centered outcomes. Second, respondents had to confront a hierarchical hospital culture, which manifests not only in clinical care, but also in the quality-improvement infrastructure. Many respondents reported that physicians were more receptive to performance feedback from fellow physicians rather than nonphysician quality administrators.
Respondents described a range of approaches to counteract these attitudes. First, hospitals deployed department- and profession-specific “champions” to provide peer-to-peer performance feedback supported by data demonstrating a link between process improvements and patient outcomes. Second, many respondents noted that the addition of new clinical staff, who were often younger and more receptive to new initiatives, could alter a hospital’s quality culture; in smaller hospitals, just a few individuals could significantly alter the dynamic. Finally, when other efforts failed, some respondents indicated that top-down administrative support could persuade resistant individuals to change their approach. However, this solution worked best with employed physicians and was less effective with independent physician groups without direct financial ties to hospital performance. These efforts to overcome negative attitudes toward SEP-1 implementation required individuals’ time and energy, leading to frustration at times and adding to the resources required to comply with the program.
Planning for the Future of SEP-1
Respondents anticipate that performance of the SEP-1 measure will eventually become publicly reported and incorporated into value-based purchasing calculations. Hospitals are therefore seeking greater interaction with CMS as it makes iterative revisions to the measure because respondents expect that their hospitals’ level of performance, rather than just the act of participating, will affect hospital finances. Respondents expressed a desire for more live, interactive educational sessions with CMS moving forward, rather than limiting the opportunities for clarification to online comment forums or statements elsewhere in the public record. In addition, respondents hope that public reporting and pay-for-performance could be delayed to allow more time to work out the “kinks” in measurement and reporting.
DISCUSSION
We conducted semistructured telephone interviews with quality officers in U.S. hospitals in order to understand hospitals’ perceptions of and responses to Medicare’s SEP-1 sepsis quality-reporting program. Hospitals are struggling with the program’s complexity and investing considerable resources in order to iteratively revise their responses to the program. However, they generally believe that the program is bringing much-needed attention to sepsis diagnosis and treatment. These findings have several implications for the SEP-1 measure in particular and for hospital-based quality measurement and pay-for-performance policies in general.
First, we demonstrate that SEP-1 consistently requires a substantial investment of resources from hospitals already struggling under the weight of numerous local, state, and national quality-reporting and improvement programs.14,20,21 In aggregate, these programs can stretch hospitals’ resources to their limit. Respondents universally reported that the SEP-1 program is requiring dedicated staff to meet the data abstraction and reporting requirements as well as multicomponent quality-improvement initiatives. In the absence of well-established roadmaps for improving sepsis care, these sepsis quality-improvement efforts require experimentation and iterative revision, which can contribute to fatigue and frustration among quality officers and clinical staff. This process of innovation inherently involves successes, failures, and the risk of harm and opportunity costs that strain hospital resources.
Second, our study indicates how SEP-1 could exacerbate existing inequalities in our health system. Sepsis incidence and mortality are already higher in medically underserved regions.22 Given the resources required to respond to the SEP-1 program, optimal performance may be beyond the reach of smaller hospitals, or even larger hospitals, whose resources are already stretched to their limits. Public reporting and pay-for-performance can be adisadvantage to hospitals caring for underserved populations.23,24 To the extent that responding to sepsis-oriented public policy requires resources that certain hospitals cannot access, these policies could exacerbate existing health disparities.
Third, our findings highlight some specific ways that CMS could revise the SEP-1 program to better meet the needs of hospitals and improve outcomes for patients with sepsis. Primarily, although the program’s current specifications take an “all-or-none” approach to treatment success, a more flexible approach, such as a weighted score or composite measure that combines processes and outcomes,25,26 could allow hospitals to focus their efforts on those components of the bundle with the strongest evidence for improved patient outcomes.27 Second, policy makers need to reconcile the 2 existing clinical definitions for sepsis.1,28 CMS has already stated its plans to retain the preexisting sepsis definition,29 but this does not change the reality that frontline providers and quality officials face different, and at times conflicting, clinical definitions while caring for patients. Finally, current implementation challenges may support a delay in moving the measure toward public reporting and pay-for-performance. Hospitals are already responding to the measure in a substantial way, providing an opportunity for early quantitative evaluations of the program’s impact that could inform evidence-based revisions to the measure.
Our study has several limitations. First, by interviewing only individual quality officers within each hospital, it is possible that our findings were not representative of the perspectives of other individuals within their hospitals or the hospital as a whole; indeed, to the extent that quality officers “buy in” to quality measurement and reporting, their perspectives on SEP-1 may skew more positive than other hospital staff. Our respondents represented individuals from a range of positions within the quality infrastructure, whereas “hospital quality leaders” are often chief executive officers, chief medical officers, or vice presidents for quality.30 However, by virtue of our purposive sampling approach, we included respondents from a broad range of hospitals and found similar themes across these respondents, supporting the internal validity of our findings. Second, as is inherent in interview-based research, we cannot verify that respondents’ reports of hospital responses to SEP-1 match the actual changes implemented “on the ground.” We are reassured, however, by the fact that many of the perspectives and quality-improvement changes that respondents described align with the opinions and suggestions of academic quality experts, which are informed by clinical experience.6-8 Third, while respondents believe that hospital responses to SEP-1 are contributing to improvements in treatment and outcomes, we do not yet have robust objective data to support this opinion or to evaluate the association between quality officers’ perspectives and hospital performance. A quantitative evaluation of the clinical impact of SEP-1, as well as the relationship between hospital performance and quality officers’ perspectives on the measure, are important areas for future research.
CONCLUSIONS
In a qualitative study of hospital responses to Medicare’s SEP-1 program, we found that hospitals are implementing changes across a variety of domains and in ways that consistently require dedicated resources. Giving hospitals the flexibility to focus on treatment processes with the most direct impact on patient-centered outcomes might enhance the program’s effectiveness. Future work should quantify the program’s impact and develop novel approaches to data abstraction and quality improvement.
Disclosure
Aside from federal funding, the authors have no conflicts of interest to disclose. The authors received funding from the National Institutes of Health (IJB, F32HL132461) (JMK, K24HL133444). This work was submitted as an abstract to the 2017 American Thoracic Society International Conference, May 2017.
1. Singer M, Deutschman CS, Seymour CW, et al. The Third International Consensus Definitions for Sepsis and Septic Shock (Sepsis-3). JAMA. 2016;315(8):801-810. doi:10.1001/jama.2016.0287. PubMed
2. Angus DC, Linde-Zwirble WT, Lidicker J, Clermont G, Carcillo J, Pinsky MR. Epidemiology of severe sepsis in the United States: analysis of incidence, outcome, and associated costs of care. Crit Care Med. 2001;29(7):1303-1310. PubMed
3. Gaieski DF, Edwards JM, Kallan MJ, Carr BG. Benchmarking the incidence and mortality of severe sepsis in the United States. Crit Care Med. 2013;41(5):1167-1174. doi:10.1097/CCM.0b013e31827c09f8. PubMed
4. Liu V, Escobar GJ, Greene JD, et al. Hospital deaths in patients with sepsis from 2 independent cohorts. JAMA. 2014;312(1):90-92. doi:10.1001/jama.2014.5804. PubMed
5. Rhee C, Gohil S, Klompas M. Regulatory Mandates for Sepsis Care—Reasons for Caution. N Engl J Med. 2014;370(18):1673-1676. doi:10.1056/NEJMp1400276. PubMed
6. Cooke CR, Iwashyna TJ. Sepsis mandates: Improving inpatient care while advancing quality improvement. JAMA. 2014;312(14):1397-1398. doi:10.1001/jama.2014.11350. PubMed
7. Barbash IJ, Kahn JM, Thompson BT. Medicare’s Sepsis Reporting Program: Two Steps Forward, One Step Back. Am J Respir Crit Care Med. 2016;194(2):139-141. doi:10.1164/rccm.201604-0723ED. PubMed
8. Klompas M, Rhee C. The CMS Sepsis Mandate: Right Disease, Wrong Measure. Ann Intern Med. 2016;165(7):517-518. doi:10.7326/M16-0588. PubMed
9. Reade MC, Huang DT, Bell D, et al. Variability in management of early severe sepsis. Emerg Med J. 2010;27(2):110-115. doi:10.1136/emj.2008.070912. PubMed
10. Centers for Medicare & Medicaid Services. CMS Cost Reports. https://www.cms.gov/Research-Statistics-Data-and-Systems/Downloadable-Public-Use-Files/Cost-Reports/. Published 2017. Accessed on January 30, 2017.
11. Glaser BG. The Constant Comparative Method of Qualitative Analysis. Soc Probl. 1965;12(4):436-445. doi:10.2307/798843.
12. Morse JM. “Data Were Saturated...” Qual Health Res. 2015;25(5):587-588. doi:10.1177/1049732315576699. PubMed
13. Hennink MM, Kaiser BN, Marconi VC. Code Saturation Versus Meaning Saturation: How Many Interviews Are Enough? Qual Health Res. 2017;27(4):591-608. doi:10.1177/1049732316665344. PubMed
14. Wall MJ, Howell MD. Variation and Cost-effectiveness of Quality Measurement Programs. The Case of Sepsis Bundles. Ann Am Thorac Soc. 2015;12(11):1597-1599. doi:10.1513/AnnalsATS.201509-625ED. PubMed
15. Guest G, MacQueen KM. Handbook for Team-Based Qualitative Research. Plymouth: Altamira Press; 2008.
16. Kesselheim AS, Cresswell K, Phansalkar S, Bates DW, Sheikh A. Clinical decision support systems could be modified to reduce “alert fatigue” while still minimizing the risk of litigation. Health Aff (Millwood). 2011;30(12):2310-2317. doi:10.1377/hlthaff.2010.1111. PubMed
17. Sittig DF, Singh H. Electronic Health Records and National Patient-Safety Goals. N Engl J Med. 2012;367(19):1854-1860. doi:10.1056/NEJMsb1205420. PubMed
18. Kobayashi A, Misumida N, Aoi S, et al. STEMI notification by EMS predicts shorter door-to-balloon time and smaller infarct size. Am J Emerg Med. 2016;34(8):1610-1613. doi:10.1016/j.ajem.2016.06.022. PubMed
19. Lin CB, Peterson ED, Smith EE, et al. Emergency Medical Service Hospital Prenotification Is Associated With Improved Evaluation and Treatment of Acute Ischemic Stroke. Circ Cardiovasc Qual Outcomes. 2012;5(4):514-522. doi:10.1161/CIRCOUTCOMES.112.965210. PubMed
20. Meyer GS, Nelson EC, Pryor DB, et al. More quality measures versus measuring what matters: a call for balance and parsimony. BMJ Qual Saf. 2012;21(11):964-968. doi:10.1136/bmjqs-2012-001081. PubMed
21. Cassel CK, Conway PH, Delbanco SF, Jha AK, Saunders RS, Lee TH. Getting More Performance from Performance Measurement. N Engl J Med. 2014;371(23):2145-2147. doi:10.1056/NEJMp1408345. PubMed
22. Goodwin AJ, Nadig NR, McElligott JT, Simpson KN, Ford DW. Where You Live Matters: The Impact of Place of Residence on Severe Sepsis Incidence and Mortality. Chest. 2016;150(4):829-836. doi:10.1016/j.chest.2016.07.004. PubMed
23. Sjoding MW, Cooke CR. Readmission Penalties for Chronic Obstructive Pulmonary Disease Will Further Stress Hospitals Caring for Vulnerable Patient Populations. Am J Respir Crit Care Med. 2014;190(9):1072-1074. doi:10.1164/rccm.201407-1345LE. PubMed
24. Joynt KE, Jha AK. Characteristics of Hospitals Receiving Penalties Under the Hospital Readmissions Reduction Program. JAMA. 2013;309(4):342. doi:10.1001/jama.2012.94856. PubMed
25. Nolan T, Berwick DM. All-or-None Measurement Raises the Bar on Performance. JAMA. 2006;295(10):1168-1170. doi:10.1001/jama.295.10.1168. PubMed
26. Chen LM, Staiger DO, Birkmeyer JD, Ryan AM, Zhang W, Dimick JB. Composite quality measures for common inpatient medical conditions. Med Care. 2013;51(9):832-837. doi:10.1097/MLR.0b013e31829fa92a. PubMed
27. Rhodes A, Evans LE, Alhazzani W, et al. Surviving Sepsis Campaign: International Guidelines for Management of Sepsis and Septic Shock: 2016. Crit Care Med. 2017;45(3):486-552. doi:10.1097/CCM.0000000000002255. PubMed
28. Levy MM, Fink MP, Marshall JC, et al. 2001 SCCM/ESICM/ACCP/ATS/SIS International Sepsis Definitions Conference. Intensive Care Med. 2003;29(4):530-538. doi:10.1007/s00134-003-1662-x. PubMed
29. Townsend SR, Rivers E, Tefera L. Definitions for Sepsis and Septic Shock. JAMA. 2016;316(4):457-458. doi:10.1001/jama.2016.6374. PubMed
30. Lindenauer PK, Lagu T, Ross JS, et al. Attitudes of hospital leaders toward publicly reported measures of health care quality. JAMA Intern Med. 2014;174(12):1904-1911. doi:10.1001/jamainternmed.2014.5161. PubMed
© 2017 Society of Hospital Medicine
A Randomized Cohort Controlled Trial to Compare Intern Sign-Out Training Interventions
Patient sign-outs are defined as the transition of patient care that includes the transfer of information, task accountability, and personal responsibility between providers.1-3 The adoption of mnemonics as a memory aid has been used to improve the transfer of patient information between providers.4 In the transfer of task accountability, providers transfer follow-up tasks to on-call or coverage providers and ensure that directives are understood. Joint task accountability is enhanced through collaborative giving and cross-checking of information received through assertive questioning to detect errors, and it also enables the receiver to codevelop an understanding of a patient’s condition.5-8 In the transfer of personal responsibility for the primary team’s patients, the provision of anticipatory guidance enables the coverage provider to have prospective information about potential, upcoming issues to facilitate care plans.6 Enabling coverage providers to anticipate overnight events helps them exercise responsibility for patients who are under their temporary care.2
The Accreditation Council for Graduate Medical Education requires residency programs to provide formal instruction on sign-outs.9 Yet, variability across training programs exists,8,10 with training emphasis on the transfer of information over accountability or responsibility.11 Previous studies have demonstrated the efficacy of sign-out training, such as the illness severity, patient summary, action list, situation awareness and contingency planning, and synthesis by reviewer (I-PASS) bundle.3 Yet, participation is far from 100% because the I-PASS bundle requires in-person workshops, e-learning platforms, organizational change campaigns, and faculty participation,12 involving resource and time commitments that few programs can afford. To address this issue, we seek to compare resource-efficient, knowledge-based, skill-based, compliance-based, and learner-initiated sign-out training pedagogies. We focused on the evening sign-out because it is a high-risk period when care for inpatients is transferred to smaller coverage intern teams.
METHODS
Setting and Study Design
A prospective, randomized cohort trial of 4 training interventions was conducted at an internal medicine residency program at a Mid-Atlantic, academic, tertiary-care hospital with 1192 inpatient beds. The 52 interns admitted to the program were randomly assigned to 4 firms caring for up to 25 inpatients on each floor of the hospital. The case mix faced by each firm was similar because patients were randomly assigned to firms based on bed availability. Teams of 5 interns in each firm worked in 5-day duty cycles, during which each intern rotated as a night cover for his or her firm. Interns remain in their firm throughout their residency. Sign-outs were conducted face to face with a computer. Receivers printed sign-out sheets populated with patient information and took notes when senders communicated information from the computer. The hospital’s institutional review board approved this study.
Interventions
The firms were randomly assigned to 1 of 4 one-hour quality-improvement training interventions delivered at the same time and day in November 2014 at each firm’s office, located on different floors of the hospital. There was virtually no cross-talk among the firms in the first year, which ensured the integrity of the cohort randomization and interventions. Faculty from an affiliated business school of the academic center worked with attending physicians to train the firms.
All interventions took 1 hour at noontime. Firm 1 (the control) received a didactic lecture on sign-out, which participants heard during orientation. Repeating that lecture reinforced their knowledge of sign-outs. Firm 2 was trained on the I-PASS mnemonic with a predictable progression of information elements to transfer.3,12 Interns role-played 3 scenarios to practice sign-out.3 They received skills feedback and a debriefing to link I-PASS with information elements to transfer. Firm 3 was dealt a policy mandate by the interns’ attending physician to perform specific tasks at sign-out. Senders were to provide the night cover with to-do tasks, and receivers were to actively discuss and verify these tasks to ensure task accountability.13 Firm 4 was trained on a Plan-Do-Study-Act (PDSA) protocol to identify and solve perceived barriers to sign-outs. Firm 4 agreed to solve the problem of the lack of care plans by the day team to the night cover. An ad hoc team in Firm 4 refined, pilot tested, and rolled out the solution within a month. Its protocol emphasized information on anticipated changes in patient status, providing contingency plans and their rationale as well as discussions to clarify care plans. Details of the 4 interventions are shown in the Table.
Data Collection Process
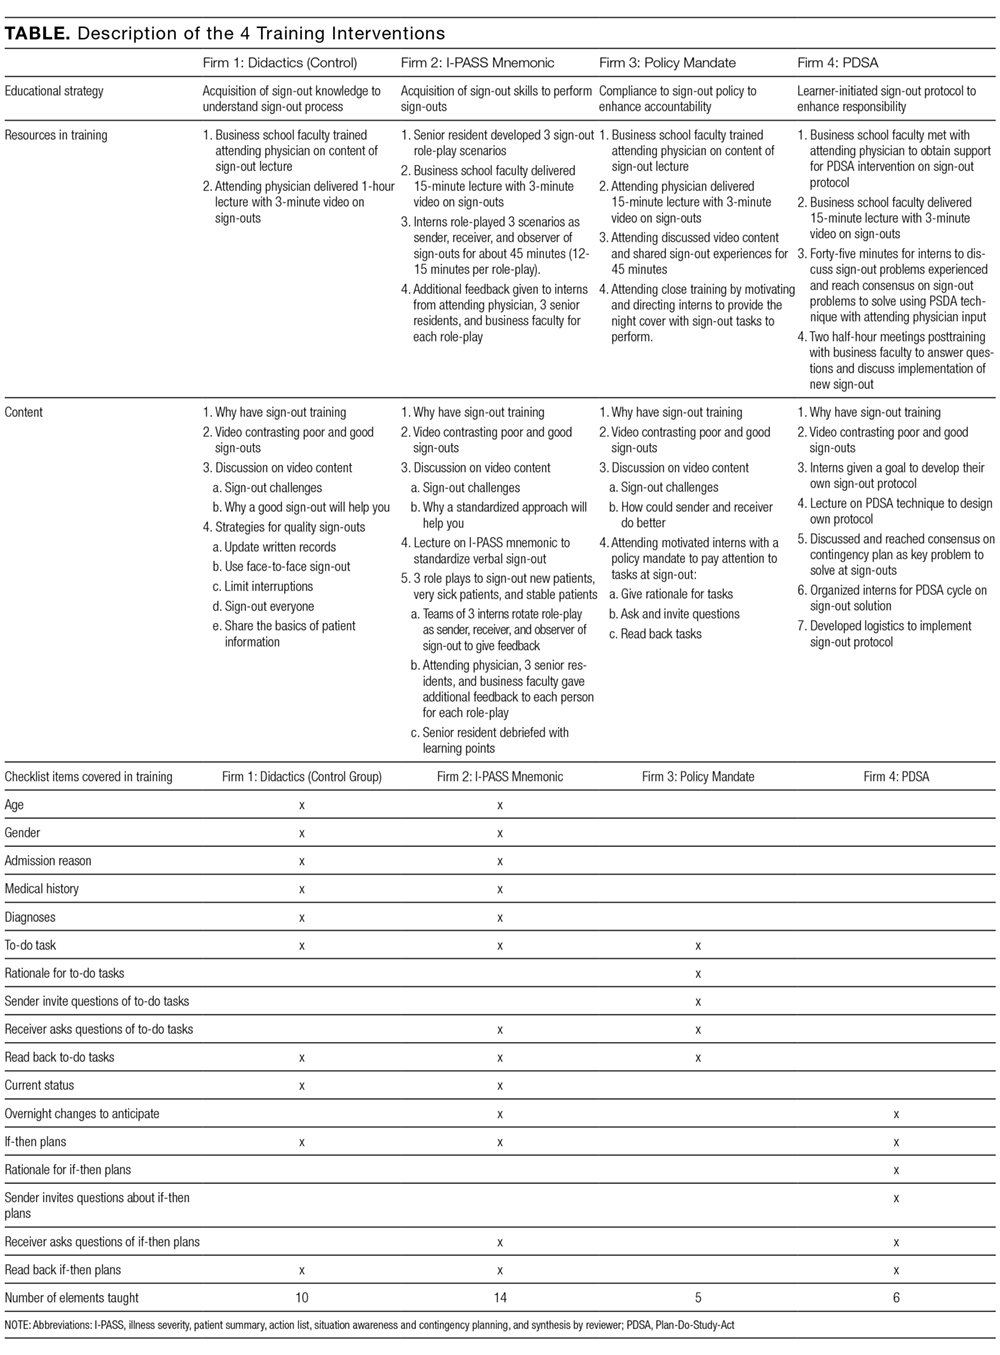
Outcomes
We measured improvements in sign-out quality by the mean percentage differences for each of the 3 dimensions of sign-out, as well as a multidimensional measure of sign-out comprising the 3 dimensions for each firm in 2 ways: (1) pre- and postintervention, and (2) vis-à-vis the control group postintervention.
Statistical Analysis
We factor analyzed the 17 sign-out elements using principal components analysis with varimax rotation to confirm their groupings within the 3 dimensions of sign-out using Statistical Package for the Social Sciences (SPSS) version 24 (IBM, North Castle, NY). We calculated the mean percentage differences and used Student t tests to evaluate statistical differences at P < 0.05.
RESULTS
Five hundred and sixty-three patient sign-outs were observed prior to the training interventions (κ = 0.646), and 620 patient sign-outs were observed after the interventions (κ = 0.648). Kappa values derived from SPSS were within acceptable interrater agreement ranges. Factor analysis of the 17 sign-out elements yielded 3 factors that we named patient information, task accountability, and responsibility, as shown in the supporting Table.
DISCUSSION
The results indicated that after only 1 hour of training, skill-based, compliance-based, and learner-initiated sign-out training improved sign-out quality beyond knowledge-based didactics even though the number of sign-out elements taught in the latter 2 was lower than in the didactics group. Different training emphases influenced different dimensions of sign-out quality so that training interns to focus on task accountability or responsibility led to improvements in those dimensions only. The lower scores in other dimensions suggest potential risks in sign-out quality from focusing attention on 1 dimension at the expense of other dimensions. I-PASS, which covered the most sign-out elements and utilized 5 facilitators, led to the best overall improvement in sign-out quality, which is consistent with previous studies.3,12 We demonstrated that only 1 hour of training on the I-PASS mnemonics using video, role-playing, and feedback led to significant improvements. This approach is portable and easily applied to any program. Potential improvements in I-PASS training could be obtained by emphasizing task accountability and responsibility because the mandate and PDSA groups obtained higher scores than the I-PASS group in these dimensions.
Limitations
We measured sign-out quality in the evening at this site because it was at greatest risk for errors. Future studies should consider daytime sign-outs, interunit handoffs, and other hospital settings, such as community or rural hospitals and nonacute patient settings, to ascertain generalizability. Data were collected from observations, so Hawthorne effects may introduce bias. However, we believe that using a standardized checklist, a control group, and assessing relative changes minimized this risk. Although we observed almost 1200 patient sign-outs over 80 shift changes, we were not able to observe every intern in every firm. Finally, no sentinel events were reported during the study period, and we did not include other measures of clinical outcomes, which represent an opportunity for future researchers to test which specific sign-out elements or dimensions are related to clinical outcomes or are relevant to specific patient types.
CONCLUSION
The results of this study indicate that 1 hour of formal training can improve sign-out quality. Program directors should consider including I-PASS with additional focus on task accountability and personal responsibility in their sign-out training plans.
Disclosure
The authors have nothing to disclose.
1. Darbyshire D, Gordon M, Baker P. Teaching handover of care to medical students. Clin Teach. 2013;10:32-37. PubMed
2. Lee SH, Phan PH, Dorman T, Weaver SJ, Pronovost PJ. Handoffs, safety culture, and practices: evidence from the hospital survey on patient safety culture. BMJ Health Serv Res. 2016;16:254. DOI 10.1186/s12913-016-1502-7. PubMed
3. Starmer AJ, O’Toole JK, Rosenbluth G, et al. Development, implementation, and dissemination of the I-PASS handoff curriculum: a multisite educational intervention to improve patient handoffs. Acad Med. 2014:89:876-884. PubMed
4. Riesenberg LA, Leitzsch J, Little BW. Systematic review of handoff mnemonics literature. Am J Med Qual. 2009;24:196-204. PubMed
5. Cohen MD, Hilligoss B, Kajdacsy-Balla A. A handoff is not a telegram: an understanding of the patient is co-constructed. Crit Care. 2012;16:303. PubMed
6. McMullan A, Parush A, Momtahan K. Transferring patient care: patterns of synchronous bidisciplinary communication between physicians and nurses during handoffs in a critical care unit. J Perianesth Nurs. 2015;30:92-104. PubMed
7. Rayo MF, Mount-Campbell AF, O’Brien JM, et al. Interactive questioning in critical care during handovers: a transcript analysis of communication behaviours by physicians, nurses and nurse practitioners. BMJ Qual Saf. 2014;23:483-489. PubMed
8. Gordon M, Findley R. Educational interventions to improve handover in health care: a systematic review. Med Educ. 2011;45:1081-1089. PubMed
9. Nasca TJ, Day SH, Amis ES Jr; ACGME Duty Hour Task Force. The new recommendations on duty hours from the ACGME Task Force. N Engl J Med. 2010;363:e3. PubMed
10. Wohlauer MV, Arora VM, Horwitz LI, et al. The patient handoff: a comprehensive curricular blueprint for resident education to improve continuity of care. Acad Med. 2012;87:411-418. PubMed
11. Riesenberg LA, Leitzsch J, Massucci JL, et al. Residents’ and attending physicians’ handoffs: a systematic review of the literature. Acad Med. 2009;84:1775-1787. PubMed
12. Huth K, Hart F, Moreau K, et al. Real-world implementation of a standardized handover program (I-PASS) on a pediatric clinical teaching unit. Acad Ped. 2016;16:532-539. PubMed
13. Jonas E, Schulz-Hardt S, Frey D, Thelen N. Confirmation bias in sequential information search after preliminary decisions: An expansion of dissonance theoretical research on selective exposure to information. J Per Soc Psy. 2001;80:557-571. PubMed
14. Joint Commission. Improving handoff communications: Meeting national patient safety goal 2E. Jt Pers Patient Saf. 2006;6:9-15.
15. Improving Hand-off Communication. Joint Commission Resources. 2007. PubMed
Patient sign-outs are defined as the transition of patient care that includes the transfer of information, task accountability, and personal responsibility between providers.1-3 The adoption of mnemonics as a memory aid has been used to improve the transfer of patient information between providers.4 In the transfer of task accountability, providers transfer follow-up tasks to on-call or coverage providers and ensure that directives are understood. Joint task accountability is enhanced through collaborative giving and cross-checking of information received through assertive questioning to detect errors, and it also enables the receiver to codevelop an understanding of a patient’s condition.5-8 In the transfer of personal responsibility for the primary team’s patients, the provision of anticipatory guidance enables the coverage provider to have prospective information about potential, upcoming issues to facilitate care plans.6 Enabling coverage providers to anticipate overnight events helps them exercise responsibility for patients who are under their temporary care.2
The Accreditation Council for Graduate Medical Education requires residency programs to provide formal instruction on sign-outs.9 Yet, variability across training programs exists,8,10 with training emphasis on the transfer of information over accountability or responsibility.11 Previous studies have demonstrated the efficacy of sign-out training, such as the illness severity, patient summary, action list, situation awareness and contingency planning, and synthesis by reviewer (I-PASS) bundle.3 Yet, participation is far from 100% because the I-PASS bundle requires in-person workshops, e-learning platforms, organizational change campaigns, and faculty participation,12 involving resource and time commitments that few programs can afford. To address this issue, we seek to compare resource-efficient, knowledge-based, skill-based, compliance-based, and learner-initiated sign-out training pedagogies. We focused on the evening sign-out because it is a high-risk period when care for inpatients is transferred to smaller coverage intern teams.
METHODS
Setting and Study Design
A prospective, randomized cohort trial of 4 training interventions was conducted at an internal medicine residency program at a Mid-Atlantic, academic, tertiary-care hospital with 1192 inpatient beds. The 52 interns admitted to the program were randomly assigned to 4 firms caring for up to 25 inpatients on each floor of the hospital. The case mix faced by each firm was similar because patients were randomly assigned to firms based on bed availability. Teams of 5 interns in each firm worked in 5-day duty cycles, during which each intern rotated as a night cover for his or her firm. Interns remain in their firm throughout their residency. Sign-outs were conducted face to face with a computer. Receivers printed sign-out sheets populated with patient information and took notes when senders communicated information from the computer. The hospital’s institutional review board approved this study.
Interventions
The firms were randomly assigned to 1 of 4 one-hour quality-improvement training interventions delivered at the same time and day in November 2014 at each firm’s office, located on different floors of the hospital. There was virtually no cross-talk among the firms in the first year, which ensured the integrity of the cohort randomization and interventions. Faculty from an affiliated business school of the academic center worked with attending physicians to train the firms.
All interventions took 1 hour at noontime. Firm 1 (the control) received a didactic lecture on sign-out, which participants heard during orientation. Repeating that lecture reinforced their knowledge of sign-outs. Firm 2 was trained on the I-PASS mnemonic with a predictable progression of information elements to transfer.3,12 Interns role-played 3 scenarios to practice sign-out.3 They received skills feedback and a debriefing to link I-PASS with information elements to transfer. Firm 3 was dealt a policy mandate by the interns’ attending physician to perform specific tasks at sign-out. Senders were to provide the night cover with to-do tasks, and receivers were to actively discuss and verify these tasks to ensure task accountability.13 Firm 4 was trained on a Plan-Do-Study-Act (PDSA) protocol to identify and solve perceived barriers to sign-outs. Firm 4 agreed to solve the problem of the lack of care plans by the day team to the night cover. An ad hoc team in Firm 4 refined, pilot tested, and rolled out the solution within a month. Its protocol emphasized information on anticipated changes in patient status, providing contingency plans and their rationale as well as discussions to clarify care plans. Details of the 4 interventions are shown in the Table.
Data Collection Process
Outcomes
We measured improvements in sign-out quality by the mean percentage differences for each of the 3 dimensions of sign-out, as well as a multidimensional measure of sign-out comprising the 3 dimensions for each firm in 2 ways: (1) pre- and postintervention, and (2) vis-à-vis the control group postintervention.
Statistical Analysis
We factor analyzed the 17 sign-out elements using principal components analysis with varimax rotation to confirm their groupings within the 3 dimensions of sign-out using Statistical Package for the Social Sciences (SPSS) version 24 (IBM, North Castle, NY). We calculated the mean percentage differences and used Student t tests to evaluate statistical differences at P < 0.05.
RESULTS
Five hundred and sixty-three patient sign-outs were observed prior to the training interventions (κ = 0.646), and 620 patient sign-outs were observed after the interventions (κ = 0.648). Kappa values derived from SPSS were within acceptable interrater agreement ranges. Factor analysis of the 17 sign-out elements yielded 3 factors that we named patient information, task accountability, and responsibility, as shown in the supporting Table.
DISCUSSION
The results indicated that after only 1 hour of training, skill-based, compliance-based, and learner-initiated sign-out training improved sign-out quality beyond knowledge-based didactics even though the number of sign-out elements taught in the latter 2 was lower than in the didactics group. Different training emphases influenced different dimensions of sign-out quality so that training interns to focus on task accountability or responsibility led to improvements in those dimensions only. The lower scores in other dimensions suggest potential risks in sign-out quality from focusing attention on 1 dimension at the expense of other dimensions. I-PASS, which covered the most sign-out elements and utilized 5 facilitators, led to the best overall improvement in sign-out quality, which is consistent with previous studies.3,12 We demonstrated that only 1 hour of training on the I-PASS mnemonics using video, role-playing, and feedback led to significant improvements. This approach is portable and easily applied to any program. Potential improvements in I-PASS training could be obtained by emphasizing task accountability and responsibility because the mandate and PDSA groups obtained higher scores than the I-PASS group in these dimensions.
Limitations
We measured sign-out quality in the evening at this site because it was at greatest risk for errors. Future studies should consider daytime sign-outs, interunit handoffs, and other hospital settings, such as community or rural hospitals and nonacute patient settings, to ascertain generalizability. Data were collected from observations, so Hawthorne effects may introduce bias. However, we believe that using a standardized checklist, a control group, and assessing relative changes minimized this risk. Although we observed almost 1200 patient sign-outs over 80 shift changes, we were not able to observe every intern in every firm. Finally, no sentinel events were reported during the study period, and we did not include other measures of clinical outcomes, which represent an opportunity for future researchers to test which specific sign-out elements or dimensions are related to clinical outcomes or are relevant to specific patient types.
CONCLUSION
The results of this study indicate that 1 hour of formal training can improve sign-out quality. Program directors should consider including I-PASS with additional focus on task accountability and personal responsibility in their sign-out training plans.
Disclosure
The authors have nothing to disclose.
1. Darbyshire D, Gordon M, Baker P. Teaching handover of care to medical students. Clin Teach. 2013;10:32-37. PubMed
2. Lee SH, Phan PH, Dorman T, Weaver SJ, Pronovost PJ. Handoffs, safety culture, and practices: evidence from the hospital survey on patient safety culture. BMJ Health Serv Res. 2016;16:254. DOI 10.1186/s12913-016-1502-7. PubMed
3. Starmer AJ, O’Toole JK, Rosenbluth G, et al. Development, implementation, and dissemination of the I-PASS handoff curriculum: a multisite educational intervention to improve patient handoffs. Acad Med. 2014:89:876-884. PubMed
4. Riesenberg LA, Leitzsch J, Little BW. Systematic review of handoff mnemonics literature. Am J Med Qual. 2009;24:196-204. PubMed
5. Cohen MD, Hilligoss B, Kajdacsy-Balla A. A handoff is not a telegram: an understanding of the patient is co-constructed. Crit Care. 2012;16:303. PubMed
6. McMullan A, Parush A, Momtahan K. Transferring patient care: patterns of synchronous bidisciplinary communication between physicians and nurses during handoffs in a critical care unit. J Perianesth Nurs. 2015;30:92-104. PubMed
7. Rayo MF, Mount-Campbell AF, O’Brien JM, et al. Interactive questioning in critical care during handovers: a transcript analysis of communication behaviours by physicians, nurses and nurse practitioners. BMJ Qual Saf. 2014;23:483-489. PubMed
8. Gordon M, Findley R. Educational interventions to improve handover in health care: a systematic review. Med Educ. 2011;45:1081-1089. PubMed
9. Nasca TJ, Day SH, Amis ES Jr; ACGME Duty Hour Task Force. The new recommendations on duty hours from the ACGME Task Force. N Engl J Med. 2010;363:e3. PubMed
10. Wohlauer MV, Arora VM, Horwitz LI, et al. The patient handoff: a comprehensive curricular blueprint for resident education to improve continuity of care. Acad Med. 2012;87:411-418. PubMed
11. Riesenberg LA, Leitzsch J, Massucci JL, et al. Residents’ and attending physicians’ handoffs: a systematic review of the literature. Acad Med. 2009;84:1775-1787. PubMed
12. Huth K, Hart F, Moreau K, et al. Real-world implementation of a standardized handover program (I-PASS) on a pediatric clinical teaching unit. Acad Ped. 2016;16:532-539. PubMed
13. Jonas E, Schulz-Hardt S, Frey D, Thelen N. Confirmation bias in sequential information search after preliminary decisions: An expansion of dissonance theoretical research on selective exposure to information. J Per Soc Psy. 2001;80:557-571. PubMed
14. Joint Commission. Improving handoff communications: Meeting national patient safety goal 2E. Jt Pers Patient Saf. 2006;6:9-15.
15. Improving Hand-off Communication. Joint Commission Resources. 2007. PubMed
© 2017 Society of Hospital Medicine