User login
A Randomized Cohort Controlled Trial to Compare Intern Sign-Out Training Interventions
Patient sign-outs are defined as the transition of patient care that includes the transfer of information, task accountability, and personal responsibility between providers.1-3 The adoption of mnemonics as a memory aid has been used to improve the transfer of patient information between providers.4 In the transfer of task accountability, providers transfer follow-up tasks to on-call or coverage providers and ensure that directives are understood. Joint task accountability is enhanced through collaborative giving and cross-checking of information received through assertive questioning to detect errors, and it also enables the receiver to codevelop an understanding of a patient’s condition.5-8 In the transfer of personal responsibility for the primary team’s patients, the provision of anticipatory guidance enables the coverage provider to have prospective information about potential, upcoming issues to facilitate care plans.6 Enabling coverage providers to anticipate overnight events helps them exercise responsibility for patients who are under their temporary care.2
The Accreditation Council for Graduate Medical Education requires residency programs to provide formal instruction on sign-outs.9 Yet, variability across training programs exists,8,10 with training emphasis on the transfer of information over accountability or responsibility.11 Previous studies have demonstrated the efficacy of sign-out training, such as the illness severity, patient summary, action list, situation awareness and contingency planning, and synthesis by reviewer (I-PASS) bundle.3 Yet, participation is far from 100% because the I-PASS bundle requires in-person workshops, e-learning platforms, organizational change campaigns, and faculty participation,12 involving resource and time commitments that few programs can afford. To address this issue, we seek to compare resource-efficient, knowledge-based, skill-based, compliance-based, and learner-initiated sign-out training pedagogies. We focused on the evening sign-out because it is a high-risk period when care for inpatients is transferred to smaller coverage intern teams.
METHODS
Setting and Study Design
A prospective, randomized cohort trial of 4 training interventions was conducted at an internal medicine residency program at a Mid-Atlantic, academic, tertiary-care hospital with 1192 inpatient beds. The 52 interns admitted to the program were randomly assigned to 4 firms caring for up to 25 inpatients on each floor of the hospital. The case mix faced by each firm was similar because patients were randomly assigned to firms based on bed availability. Teams of 5 interns in each firm worked in 5-day duty cycles, during which each intern rotated as a night cover for his or her firm. Interns remain in their firm throughout their residency. Sign-outs were conducted face to face with a computer. Receivers printed sign-out sheets populated with patient information and took notes when senders communicated information from the computer. The hospital’s institutional review board approved this study.
Interventions
The firms were randomly assigned to 1 of 4 one-hour quality-improvement training interventions delivered at the same time and day in November 2014 at each firm’s office, located on different floors of the hospital. There was virtually no cross-talk among the firms in the first year, which ensured the integrity of the cohort randomization and interventions. Faculty from an affiliated business school of the academic center worked with attending physicians to train the firms.
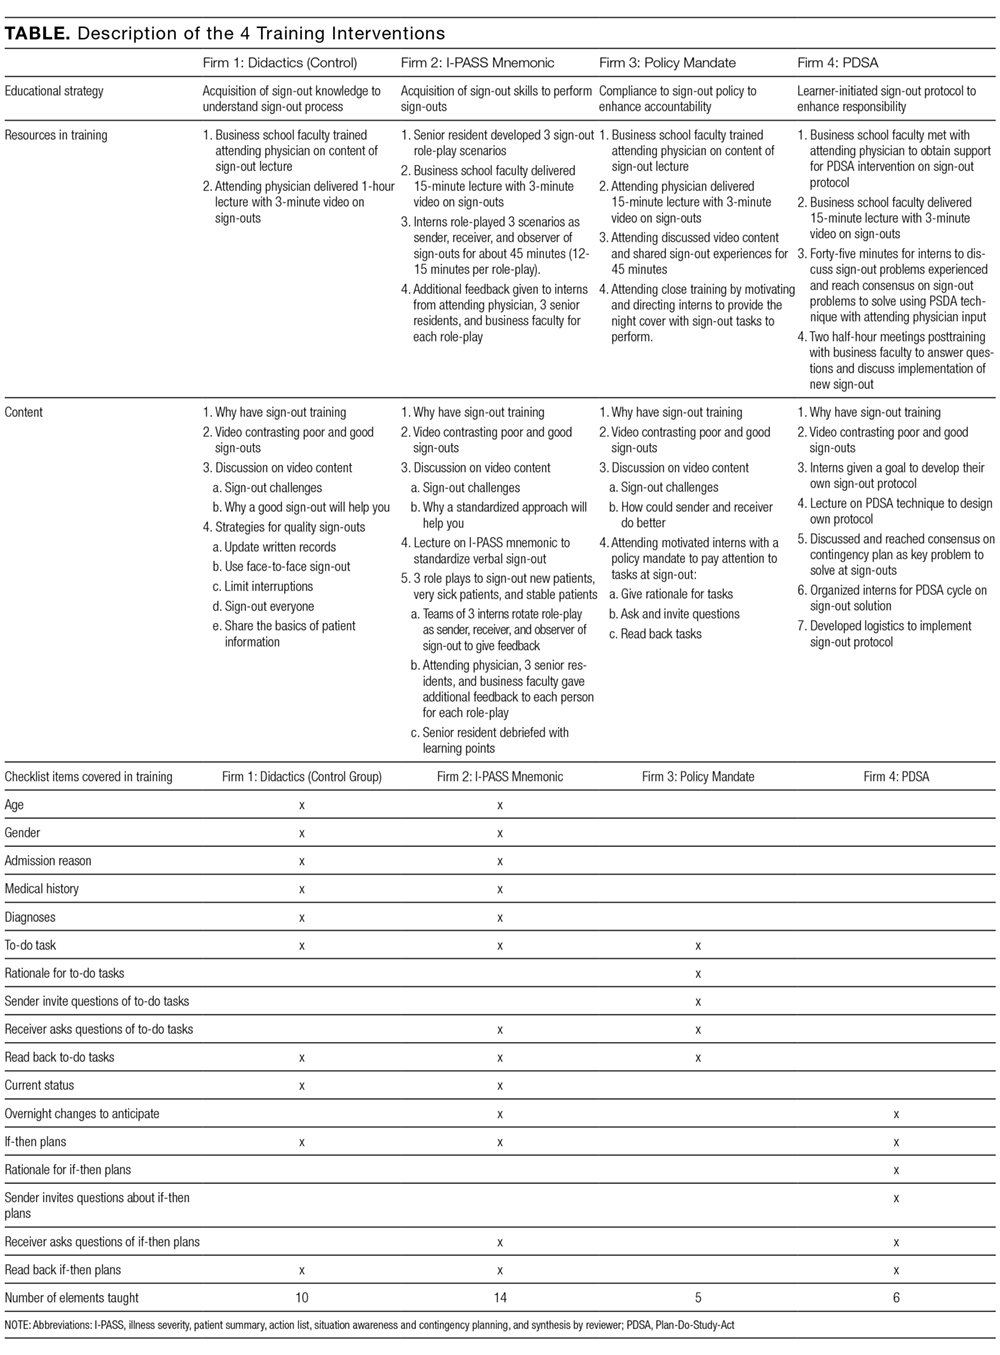
All interventions took 1 hour at noontime. Firm 1 (the control) received a didactic lecture on sign-out, which participants heard during orientation. Repeating that lecture reinforced their knowledge of sign-outs. Firm 2 was trained on the I-PASS mnemonic with a predictable progression of information elements to transfer.3,12 Interns role-played 3 scenarios to practice sign-out.3 They received skills feedback and a debriefing to link I-PASS with information elements to transfer. Firm 3 was dealt a policy mandate by the interns’ attending physician to perform specific tasks at sign-out. Senders were to provide the night cover with to-do tasks, and receivers were to actively discuss and verify these tasks to ensure task accountability.13 Firm 4 was trained on a Plan-Do-Study-Act (PDSA) protocol to identify and solve perceived barriers to sign-outs. Firm 4 agreed to solve the problem of the lack of care plans by the day team to the night cover. An ad hoc team in Firm 4 refined, pilot tested, and rolled out the solution within a month. Its protocol emphasized information on anticipated changes in patient status, providing contingency plans and their rationale as well as discussions to clarify care plans. Details of the 4 interventions are shown in the Table.
Data Collection Process
Outcomes
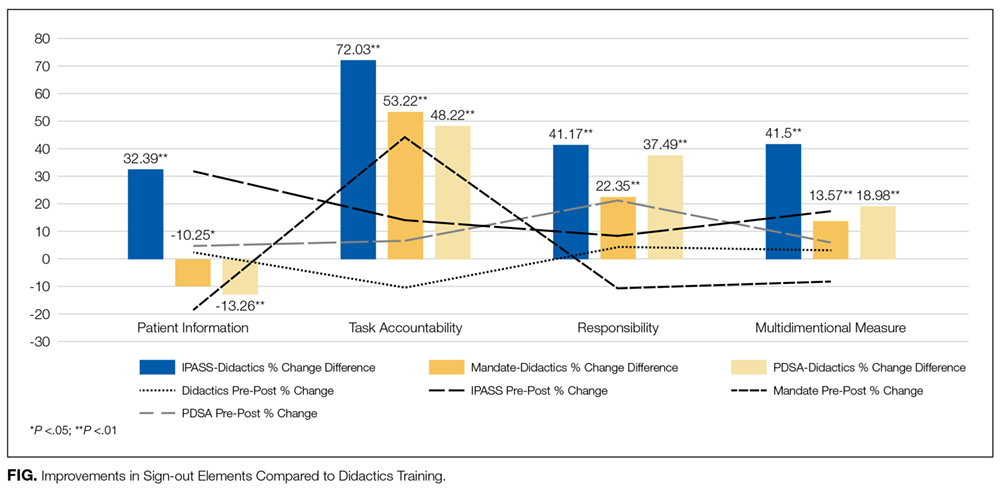
We measured improvements in sign-out quality by the mean percentage differences for each of the 3 dimensions of sign-out, as well as a multidimensional measure of sign-out comprising the 3 dimensions for each firm in 2 ways: (1) pre- and postintervention, and (2) vis-à-vis the control group postintervention.
Statistical Analysis
We factor analyzed the 17 sign-out elements using principal components analysis with varimax rotation to confirm their groupings within the 3 dimensions of sign-out using Statistical Package for the Social Sciences (SPSS) version 24 (IBM, North Castle, NY). We calculated the mean percentage differences and used Student t tests to evaluate statistical differences at P < 0.05.
RESULTS
Five hundred and sixty-three patient sign-outs were observed prior to the training interventions (κ = 0.646), and 620 patient sign-outs were observed after the interventions (κ = 0.648). Kappa values derived from SPSS were within acceptable interrater agreement ranges. Factor analysis of the 17 sign-out elements yielded 3 factors that we named patient information, task accountability, and responsibility, as shown in the supporting Table.
DISCUSSION
The results indicated that after only 1 hour of training, skill-based, compliance-based, and learner-initiated sign-out training improved sign-out quality beyond knowledge-based didactics even though the number of sign-out elements taught in the latter 2 was lower than in the didactics group. Different training emphases influenced different dimensions of sign-out quality so that training interns to focus on task accountability or responsibility led to improvements in those dimensions only. The lower scores in other dimensions suggest potential risks in sign-out quality from focusing attention on 1 dimension at the expense of other dimensions. I-PASS, which covered the most sign-out elements and utilized 5 facilitators, led to the best overall improvement in sign-out quality, which is consistent with previous studies.3,12 We demonstrated that only 1 hour of training on the I-PASS mnemonics using video, role-playing, and feedback led to significant improvements. This approach is portable and easily applied to any program. Potential improvements in I-PASS training could be obtained by emphasizing task accountability and responsibility because the mandate and PDSA groups obtained higher scores than the I-PASS group in these dimensions.
Limitations
We measured sign-out quality in the evening at this site because it was at greatest risk for errors. Future studies should consider daytime sign-outs, interunit handoffs, and other hospital settings, such as community or rural hospitals and nonacute patient settings, to ascertain generalizability. Data were collected from observations, so Hawthorne effects may introduce bias. However, we believe that using a standardized checklist, a control group, and assessing relative changes minimized this risk. Although we observed almost 1200 patient sign-outs over 80 shift changes, we were not able to observe every intern in every firm. Finally, no sentinel events were reported during the study period, and we did not include other measures of clinical outcomes, which represent an opportunity for future researchers to test which specific sign-out elements or dimensions are related to clinical outcomes or are relevant to specific patient types.
CONCLUSION
The results of this study indicate that 1 hour of formal training can improve sign-out quality. Program directors should consider including I-PASS with additional focus on task accountability and personal responsibility in their sign-out training plans.
Disclosure
The authors have nothing to disclose.
1. Darbyshire D, Gordon M, Baker P. Teaching handover of care to medical students. Clin Teach. 2013;10:32-37. PubMed
2. Lee SH, Phan PH, Dorman T, Weaver SJ, Pronovost PJ. Handoffs, safety culture, and practices: evidence from the hospital survey on patient safety culture. BMJ Health Serv Res. 2016;16:254. DOI 10.1186/s12913-016-1502-7. PubMed
3. Starmer AJ, O’Toole JK, Rosenbluth G, et al. Development, implementation, and dissemination of the I-PASS handoff curriculum: a multisite educational intervention to improve patient handoffs. Acad Med. 2014:89:876-884. PubMed
4. Riesenberg LA, Leitzsch J, Little BW. Systematic review of handoff mnemonics literature. Am J Med Qual. 2009;24:196-204. PubMed
5. Cohen MD, Hilligoss B, Kajdacsy-Balla A. A handoff is not a telegram: an understanding of the patient is co-constructed. Crit Care. 2012;16:303. PubMed
6. McMullan A, Parush A, Momtahan K. Transferring patient care: patterns of synchronous bidisciplinary communication between physicians and nurses during handoffs in a critical care unit. J Perianesth Nurs. 2015;30:92-104. PubMed
7. Rayo MF, Mount-Campbell AF, O’Brien JM, et al. Interactive questioning in critical care during handovers: a transcript analysis of communication behaviours by physicians, nurses and nurse practitioners. BMJ Qual Saf. 2014;23:483-489. PubMed
8. Gordon M, Findley R. Educational interventions to improve handover in health care: a systematic review. Med Educ. 2011;45:1081-1089. PubMed
9. Nasca TJ, Day SH, Amis ES Jr; ACGME Duty Hour Task Force. The new recommendations on duty hours from the ACGME Task Force. N Engl J Med. 2010;363:e3. PubMed
10. Wohlauer MV, Arora VM, Horwitz LI, et al. The patient handoff: a comprehensive curricular blueprint for resident education to improve continuity of care. Acad Med. 2012;87:411-418. PubMed
11. Riesenberg LA, Leitzsch J, Massucci JL, et al. Residents’ and attending physicians’ handoffs: a systematic review of the literature. Acad Med. 2009;84:1775-1787. PubMed
12. Huth K, Hart F, Moreau K, et al. Real-world implementation of a standardized handover program (I-PASS) on a pediatric clinical teaching unit. Acad Ped. 2016;16:532-539. PubMed
13. Jonas E, Schulz-Hardt S, Frey D, Thelen N. Confirmation bias in sequential information search after preliminary decisions: An expansion of dissonance theoretical research on selective exposure to information. J Per Soc Psy. 2001;80:557-571. PubMed
14. Joint Commission. Improving handoff communications: Meeting national patient safety goal 2E. Jt Pers Patient Saf. 2006;6:9-15.
15. Improving Hand-off Communication. Joint Commission Resources. 2007. PubMed
Patient sign-outs are defined as the transition of patient care that includes the transfer of information, task accountability, and personal responsibility between providers.1-3 The adoption of mnemonics as a memory aid has been used to improve the transfer of patient information between providers.4 In the transfer of task accountability, providers transfer follow-up tasks to on-call or coverage providers and ensure that directives are understood. Joint task accountability is enhanced through collaborative giving and cross-checking of information received through assertive questioning to detect errors, and it also enables the receiver to codevelop an understanding of a patient’s condition.5-8 In the transfer of personal responsibility for the primary team’s patients, the provision of anticipatory guidance enables the coverage provider to have prospective information about potential, upcoming issues to facilitate care plans.6 Enabling coverage providers to anticipate overnight events helps them exercise responsibility for patients who are under their temporary care.2
The Accreditation Council for Graduate Medical Education requires residency programs to provide formal instruction on sign-outs.9 Yet, variability across training programs exists,8,10 with training emphasis on the transfer of information over accountability or responsibility.11 Previous studies have demonstrated the efficacy of sign-out training, such as the illness severity, patient summary, action list, situation awareness and contingency planning, and synthesis by reviewer (I-PASS) bundle.3 Yet, participation is far from 100% because the I-PASS bundle requires in-person workshops, e-learning platforms, organizational change campaigns, and faculty participation,12 involving resource and time commitments that few programs can afford. To address this issue, we seek to compare resource-efficient, knowledge-based, skill-based, compliance-based, and learner-initiated sign-out training pedagogies. We focused on the evening sign-out because it is a high-risk period when care for inpatients is transferred to smaller coverage intern teams.
METHODS
Setting and Study Design
A prospective, randomized cohort trial of 4 training interventions was conducted at an internal medicine residency program at a Mid-Atlantic, academic, tertiary-care hospital with 1192 inpatient beds. The 52 interns admitted to the program were randomly assigned to 4 firms caring for up to 25 inpatients on each floor of the hospital. The case mix faced by each firm was similar because patients were randomly assigned to firms based on bed availability. Teams of 5 interns in each firm worked in 5-day duty cycles, during which each intern rotated as a night cover for his or her firm. Interns remain in their firm throughout their residency. Sign-outs were conducted face to face with a computer. Receivers printed sign-out sheets populated with patient information and took notes when senders communicated information from the computer. The hospital’s institutional review board approved this study.
Interventions
The firms were randomly assigned to 1 of 4 one-hour quality-improvement training interventions delivered at the same time and day in November 2014 at each firm’s office, located on different floors of the hospital. There was virtually no cross-talk among the firms in the first year, which ensured the integrity of the cohort randomization and interventions. Faculty from an affiliated business school of the academic center worked with attending physicians to train the firms.
All interventions took 1 hour at noontime. Firm 1 (the control) received a didactic lecture on sign-out, which participants heard during orientation. Repeating that lecture reinforced their knowledge of sign-outs. Firm 2 was trained on the I-PASS mnemonic with a predictable progression of information elements to transfer.3,12 Interns role-played 3 scenarios to practice sign-out.3 They received skills feedback and a debriefing to link I-PASS with information elements to transfer. Firm 3 was dealt a policy mandate by the interns’ attending physician to perform specific tasks at sign-out. Senders were to provide the night cover with to-do tasks, and receivers were to actively discuss and verify these tasks to ensure task accountability.13 Firm 4 was trained on a Plan-Do-Study-Act (PDSA) protocol to identify and solve perceived barriers to sign-outs. Firm 4 agreed to solve the problem of the lack of care plans by the day team to the night cover. An ad hoc team in Firm 4 refined, pilot tested, and rolled out the solution within a month. Its protocol emphasized information on anticipated changes in patient status, providing contingency plans and their rationale as well as discussions to clarify care plans. Details of the 4 interventions are shown in the Table.
Data Collection Process
Outcomes
We measured improvements in sign-out quality by the mean percentage differences for each of the 3 dimensions of sign-out, as well as a multidimensional measure of sign-out comprising the 3 dimensions for each firm in 2 ways: (1) pre- and postintervention, and (2) vis-à-vis the control group postintervention.
Statistical Analysis
We factor analyzed the 17 sign-out elements using principal components analysis with varimax rotation to confirm their groupings within the 3 dimensions of sign-out using Statistical Package for the Social Sciences (SPSS) version 24 (IBM, North Castle, NY). We calculated the mean percentage differences and used Student t tests to evaluate statistical differences at P < 0.05.
RESULTS
Five hundred and sixty-three patient sign-outs were observed prior to the training interventions (κ = 0.646), and 620 patient sign-outs were observed after the interventions (κ = 0.648). Kappa values derived from SPSS were within acceptable interrater agreement ranges. Factor analysis of the 17 sign-out elements yielded 3 factors that we named patient information, task accountability, and responsibility, as shown in the supporting Table.
DISCUSSION
The results indicated that after only 1 hour of training, skill-based, compliance-based, and learner-initiated sign-out training improved sign-out quality beyond knowledge-based didactics even though the number of sign-out elements taught in the latter 2 was lower than in the didactics group. Different training emphases influenced different dimensions of sign-out quality so that training interns to focus on task accountability or responsibility led to improvements in those dimensions only. The lower scores in other dimensions suggest potential risks in sign-out quality from focusing attention on 1 dimension at the expense of other dimensions. I-PASS, which covered the most sign-out elements and utilized 5 facilitators, led to the best overall improvement in sign-out quality, which is consistent with previous studies.3,12 We demonstrated that only 1 hour of training on the I-PASS mnemonics using video, role-playing, and feedback led to significant improvements. This approach is portable and easily applied to any program. Potential improvements in I-PASS training could be obtained by emphasizing task accountability and responsibility because the mandate and PDSA groups obtained higher scores than the I-PASS group in these dimensions.
Limitations
We measured sign-out quality in the evening at this site because it was at greatest risk for errors. Future studies should consider daytime sign-outs, interunit handoffs, and other hospital settings, such as community or rural hospitals and nonacute patient settings, to ascertain generalizability. Data were collected from observations, so Hawthorne effects may introduce bias. However, we believe that using a standardized checklist, a control group, and assessing relative changes minimized this risk. Although we observed almost 1200 patient sign-outs over 80 shift changes, we were not able to observe every intern in every firm. Finally, no sentinel events were reported during the study period, and we did not include other measures of clinical outcomes, which represent an opportunity for future researchers to test which specific sign-out elements or dimensions are related to clinical outcomes or are relevant to specific patient types.
CONCLUSION
The results of this study indicate that 1 hour of formal training can improve sign-out quality. Program directors should consider including I-PASS with additional focus on task accountability and personal responsibility in their sign-out training plans.
Disclosure
The authors have nothing to disclose.
1. Darbyshire D, Gordon M, Baker P. Teaching handover of care to medical students. Clin Teach. 2013;10:32-37. PubMed
2. Lee SH, Phan PH, Dorman T, Weaver SJ, Pronovost PJ. Handoffs, safety culture, and practices: evidence from the hospital survey on patient safety culture. BMJ Health Serv Res. 2016;16:254. DOI 10.1186/s12913-016-1502-7. PubMed
3. Starmer AJ, O’Toole JK, Rosenbluth G, et al. Development, implementation, and dissemination of the I-PASS handoff curriculum: a multisite educational intervention to improve patient handoffs. Acad Med. 2014:89:876-884. PubMed
4. Riesenberg LA, Leitzsch J, Little BW. Systematic review of handoff mnemonics literature. Am J Med Qual. 2009;24:196-204. PubMed
5. Cohen MD, Hilligoss B, Kajdacsy-Balla A. A handoff is not a telegram: an understanding of the patient is co-constructed. Crit Care. 2012;16:303. PubMed
6. McMullan A, Parush A, Momtahan K. Transferring patient care: patterns of synchronous bidisciplinary communication between physicians and nurses during handoffs in a critical care unit. J Perianesth Nurs. 2015;30:92-104. PubMed
7. Rayo MF, Mount-Campbell AF, O’Brien JM, et al. Interactive questioning in critical care during handovers: a transcript analysis of communication behaviours by physicians, nurses and nurse practitioners. BMJ Qual Saf. 2014;23:483-489. PubMed
8. Gordon M, Findley R. Educational interventions to improve handover in health care: a systematic review. Med Educ. 2011;45:1081-1089. PubMed
9. Nasca TJ, Day SH, Amis ES Jr; ACGME Duty Hour Task Force. The new recommendations on duty hours from the ACGME Task Force. N Engl J Med. 2010;363:e3. PubMed
10. Wohlauer MV, Arora VM, Horwitz LI, et al. The patient handoff: a comprehensive curricular blueprint for resident education to improve continuity of care. Acad Med. 2012;87:411-418. PubMed
11. Riesenberg LA, Leitzsch J, Massucci JL, et al. Residents’ and attending physicians’ handoffs: a systematic review of the literature. Acad Med. 2009;84:1775-1787. PubMed
12. Huth K, Hart F, Moreau K, et al. Real-world implementation of a standardized handover program (I-PASS) on a pediatric clinical teaching unit. Acad Ped. 2016;16:532-539. PubMed
13. Jonas E, Schulz-Hardt S, Frey D, Thelen N. Confirmation bias in sequential information search after preliminary decisions: An expansion of dissonance theoretical research on selective exposure to information. J Per Soc Psy. 2001;80:557-571. PubMed
14. Joint Commission. Improving handoff communications: Meeting national patient safety goal 2E. Jt Pers Patient Saf. 2006;6:9-15.
15. Improving Hand-off Communication. Joint Commission Resources. 2007. PubMed
© 2017 Society of Hospital Medicine
Health Literacy and Hospital Length of Stay: An Inpatient Cohort Study
Health literacy (HL), defined as patients’ ability to understand health information and make health decisions,1 is a prevalent problem in the outpatient and inpatient settings.2,3 In both settings, low HL has adverse implications for self-care including interpreting health labels4 and taking medications correctly.5 Among outpatient cohorts, HL has been associated with worse outcomes and acute care utilization.6 Associations with low HL include increased hospitalizations,7 rehospitalizations,8,9 emergency department visits,10 and decreased preventative care use.11 Among the elderly, low HL is associated with increased mortality12 and decreased self-perception of health.13
A systematic review revealed that most high-quality HL outcome studies were conducted in the outpatient setting.6 There have been very few studies assessing effects of low HL in an acute-care setting.7,14 These studies have evaluated postdischarge outcomes, including admissions or readmissions,7-9 and medication knowledge.14 To the best of our knowledge, there are no studies evaluating associations between HL and hospital length of stay (LOS).
LOS has received much attention as providers and payers focus more on resource utilization and eliminating adverse effects of prolonged hospitalization.15 LOS is multifactorial, depending on clinical characteristics like disease severity, as well as on sociocultural, demographic, and geographic factors.16 Despite evidence that LOS reductions translate into improved resource allocation and potentially fewer complications, there remains a tension between the appropriate LOS and one that is too short for a given condition.17
Because low HL is associated with inefficient resource utilization, we hypothesized that low HL would be associated with increased LOS after controlling for illness severity. Our objectives were to evaluate the association between low HL and LOS and whether such an association was modified by illness severity and sociodemographics.
METHODS
Study Design, Setting, Participants
An in-hospital, cohort study design of patients who were admitted or transferred to the general medicine service at the University of Chicago between October 2012 and November 2015 and screened for inclusion as part of a large, ongoing study of inpatient care quality was conducted.18 Exclusion criteria included observation status, age under 18 years, non-English speaking, and repeat participants. Those who died during hospitalization or whose discharge status was missing were excluded because the primary goal was to examine the association of HL and time to discharge, which could not be evaluated among those who died. We excluded participants with LOS >30 days to limit overly influential effects of extreme outliers (1% of the population).
Variables
HL was screened using the Brief Health Literacy Screen (BHLS), a validated, 3-question verbal survey not requiring adequate visual acuity to assess HL.19,20 The 3 questions are as follows: (1) “How confident are you filling out medical forms by yourself?”, (2) “How often do you have someone help you read hospital materials?”, and (3) “How often do you have problems learning about your medical condition because of difficulty understanding written information?” Responses to the questions were scored on a 5-point Likert scale in which higher scores corresponded to higher HL.21,22 The scores for each of the 3 questions were summed to yield a range between 3 and 15. On the individual questions, prior work has demonstrated improved test performance with a cutoff of ≤3, which corresponds to a response of “some of the time” or “somewhat”; therefore, when the 3 questions were summed together, scores of ≤9 were considered indicative of low HL.21,23
For severity of illness adjustment, we used relative weights derived from the 3M (3M, Maplewood, MN) All Patient Refined Diagnosis Related Groups (APR-DRG) classification system, which uses administrative data to classify the severity. The APR-DRG system assigns each admission to a DRG based on principal diagnosis; for each DRG, patients are then subdivided into 4 severity classes based on age, comorbidity, and interactions between these variables and the admitting diagnosis.24 Using the base DRG and severity score, the system assigns relative weights that reflect differences in expected hospital resource utilization.
LOS was derived from hospital administrative data and counted from the date of admission to the hospital. Participants who were discharged on the day of admission were counted as having an LOS of 1. Insurance status (Medicare, Medicaid, no payer, private) also was obtained from administrative data. Age, sex (male or female), education (junior high or less, some high school, high school graduate, some college, college graduate, postgraduate), and race (black/African American, white, Asian or Pacific Islander [including Asian Indian, Chinese, Filipino, Japanese, Korean, Vietnamese, other Asian, Native Hawaiian, Guam/Chamorro, Samoan, other Pacific], American Indian or Alaskan Native, multiple race) were obtained from administrative data based on information provided by the patient. Participants with missing data on any of the sociodemographic variables or on the APR-DRG score were excluded from the analysis.
Statistical Analysis
χ2 and 2-tailed t tests were used to compare categorical and continuous variables, respectively. Multivariate linear regressions were employed to measure associations between the independent variables (HL, illness severity, race, gender, education, and insurance status) and the dependent variable, LOS. Independent variables were chosen for clinical significance and retained in the model regardless of statistical significance. The adjusted R2 values of models with and without the HL variable included were reported to provide information on the contribution of HL to the overall model.
Because LOS was observed to be right skewed and residuals of the untransformed regression were observed to be non-normally distributed, the decision was made to natural log transform LOS, which is consistent with previous hospital LOS studies.16 Regression coefficients and confidence intervals were then transformed into percentage estimates using the following equation: 100(eβ–1). Adjusted R2 was reported for the transformed regression.
The APR-DRG relative weight was treated as a continuous variable. Sociodemographic variables were dichotomized as follows: female vs male; high school graduates vs not; African American vs not; Medicaid/no payer vs Medicare/private payer. Age was not included in the multivariate model because it has been incorporated into the weighted APR-DRG illness severity scores.
Each of the sociodemographic variables and the APR-DRG score were examined for effect modification via the same multivariate linear equation described above, with the addition of an interaction term. A separate regression was performed with an interaction term between age (dichotomized at ≥65) and HL to investigate whether age modified the association between HL and LOS. Finally, we explored whether effects were isolated to long vs short LOS by dividing the sample based on the mean LOS (≥6 days) and performing separate multivariate comparisons.
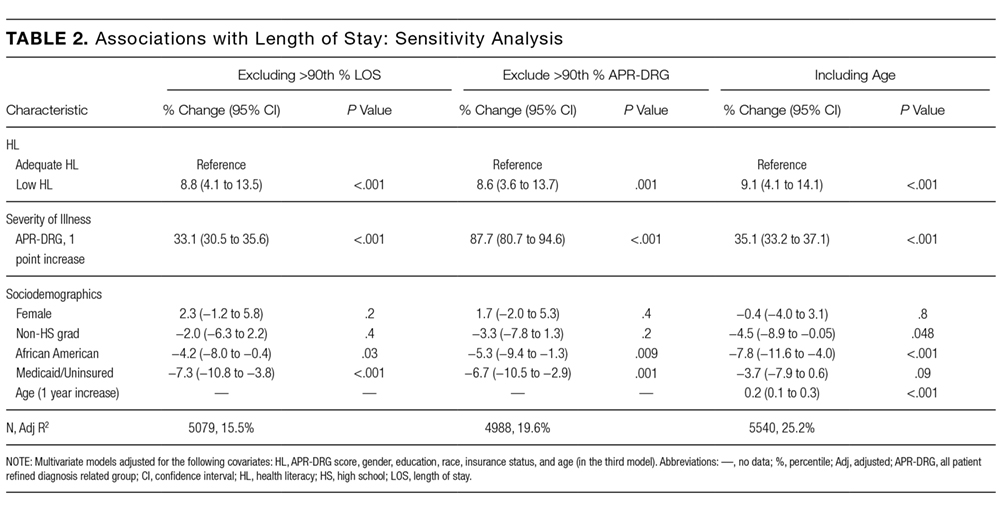
Sensitivity analyses were performed to exclude those with LOS greater than the 90th percentile and those with APR-DRG score greater than the 90th percentile; age was added to the model as a continuous variable to evaluate whether the illness severity score fully adjusted for the effects of age on LOS. Furthermore, we compared the participants with missing data to those with complete data across both dependent and independent variables. Alpha was set at 0.05; analyses were performed using Stata Version 14 (Stata, College Station, TX).
RESULTS
A total of 5983 participants met inclusion criteria and completed the HL assessment; of these participants, 75 (1%) died during hospitalization, 9 (0.2%) had missing discharge status, and 79 (1%) had LOS >30 days. Two hundred eighty (5%) were missing data on sociodemographic variables or APR-DRG score. Of the remaining (n = 5540), the mean age was 57 years (standard deviation [SD] = 19 years), over half of participants were female (57%), and the majority were African American (73%) and had graduated from high school (81%). The sample was divided into those with private insurance (25%), those with Medicare (46%), and those with Medicaid (26%); 2% had no payer. The mean APR-DRG score was 1.3 (SD = 1.2), and the scores ranged from 0.3 to 15.8.
On the BHLS screen for HL, 20% (1104/5540) had inadequate HL. Participants with low HL had higher weighted illness severity scores (average 1.4 vs 1.3; P = 0.003). Participants with low HL were also more likely to be 65 or older (55% vs 33%; P < 0.001), non-high school graduates (35% vs 15%; P < 0.001), and African American (78% vs 72%; P < 0.001), and to have Medicare or private insurance (75% vs 71%; P = 0.02). There was no significant difference with respect to gender (54% male vs 57% female; P = 0.1)
Finally, we compared the group with missing data (n = 280) to the group with complete data (n = 5540). The participants with missing data were more likely to have low HL (31% [86/280] vs 20%; P < 0.001) and to have Medicare or private insurance (82% [177/217] vs 72%; P = 0.002); however, they were not more likely to be 65 or older (40% [112/280] vs 37%; P = 0.3), high school graduates (88% [113/129] vs 81%; P = 0.06), African American (69% [177/256] vs 73%; P = 0.1), or female (57% [158/279] vs 57%; P = 1), nor were they more likely to have longer LOS (5.7 [n = 280] vs 5.5 days; P = 0.6) or higher illness severity scores (1.3 [n = 231] vs 1.3; P = 0.7).
DISCUSSION
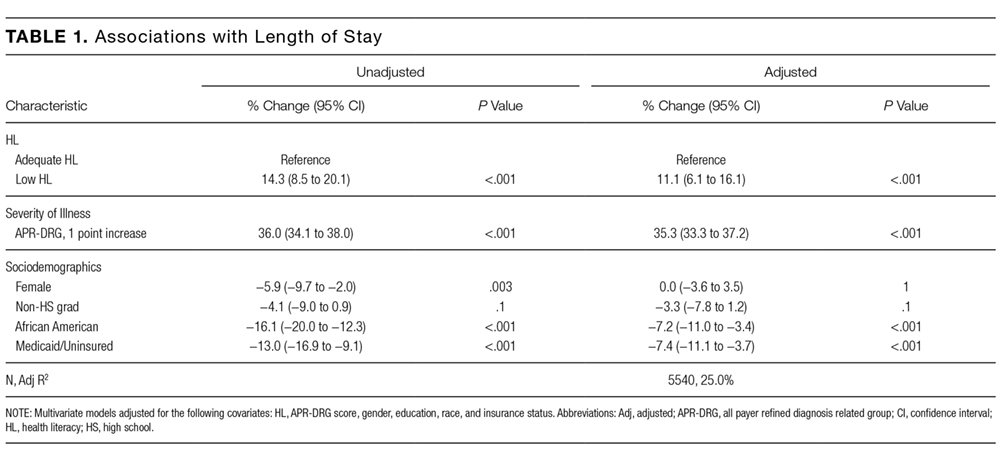
To our knowledge, this study is the first to evaluate the association between low HL and an important in-hospital outcome measure, hospital LOS. We found that low HL was associated with a longer hospital LOS, a result which remained significant when controlling for severity of illness and sociodemographic variables and when testing the model for sensitivity to the highest values of LOS and illness severity. Additionally, the association of HL with LOS appeared concentrated among participants with shorter LOS. Relative to other predictors, the contribution of HL to the overall LOS model was small, as evidenced by the change in adjusted R2 values with HL excluded.
Among the covariates, only gender modified the association between HL and LOS; the findings suggested that men were more susceptible to the effect of low HL on increased LOS. Illness severity and other sociodemographics, including age ≥65, did not appear to modify the association. We also found that being African American and having Medicaid or no insurance were associated with a significantly shorter LOS in multivariate analysis.
Previous work suggested that the adverse health effects of low HL may be mediated through several pathways, including health knowledge, self-efficacy, health skills, and illness stigma.25-27 The finding of a small but significant relationship between HL and LOS was not surprising given these known associations; nevertheless, there may be an additional patient-dependent effect of low HL on LOS not discovered here. For instance, patients with poor health knowledge and self-efficacy might stay in the hospital longer if they or their providers do not feel comfortable with their self-care ability.
This finding may be useful in developing hospital-based interventions. HL-specific interventions, several of which have been tested in the inpatient setting,14,28,29 have shown promise toward improving health knowledge,30 disease severity,31 and health resource utilization.32
Those with low HL may lack the self-efficacy to participate in discharge planning; in fact, previous work has related low HL to posthospital readmissions.8,9 Conversely, patients with low HL might struggle to engage in the inpatient milieu, advocating for shorter LOS if they feel alienated by the inpatient experience.
These possibilities show that LOS is a complex measure shown to depend on patient-level characteristics and on provider-based, geographical, and sociocultural factors.16,33 With these forces at play, additional effects of lower levels of HL may be lost without phenotyping patients by both level of HL and related characteristics, such as self-efficacy, health skills, and stigma. By gathering these additional data, future work should explore whether subpopulations of patients with low HL may be at risk for too-short vs too-long hospital admissions.
For instance, in this study, both race and Medicaid insurance were associated with shorter LOS. Being African American was associated with shorter LOS in our study but has been found to be associated with longer LOS in another study specifically focused on diabetes.34 Prior findings found uninsured patients have shorter LOS.35 Therefore, these findings in our study are difficult to explain without further work to understand whether there are health disparities in the way patients are cared for during hospitalization that may shorten or lengthen their LOS because of factors outside of their clinical need.
The finding that gender modified the effect of low HL on LOS was unexpected. There were similar proportions of men and women with low HL. There is evidence to support that women make the majority of health decisions for themselves and their familes36; therefore, there may be unmeasured aspects of HL that provide an advantage for female vs male inpatients. Furthermore, omitted confounders, such as social support, may not fully capture potential gender-related differences. Future work is needed to understand the role of gender in relationship to HL and LOS.
Limitations of this study include its observational, single-centered design with information derived from administrative data; positive and negative confounding cannot be ruled out. For instance, we did not control for complex aspects affecting LOS, such as discharge disposition and goals of care (eg, aggressive care after discharge vs hospice). To address this limitation, multivariate analyses were performed, which were adjusted for illness severity scores and took into account both comorbidity and severity of the current illness. Additionally, although it is important to study such populations, our largely urban, minority sample is not representative of the U.S. population, and within our large sample, there were participants with missing data who had lower HL on average, although this group represented only 5% of the sample. Finally, different HL tools have noncomplete concordance, which has been seen when comparing the BHLS with more objective tools.20,37 Furthermore, certain in-hospital clinical scenarios (eg, recent stroke or prolonged intensive care unit stay) may present unique challenges in establishing a baseline HL level. However, the BHLS was used in this study because of its greater feasibility.
In conclusion, this study is the first to evaluate the relationship between low HL and LOS. The findings suggest that HL may play a role in shaping outcomes in the inpatient setting and that targeting interventions toward screened patients may be a pathway toward mitigating adverse effects. Our findings need to be replicated in larger, more representative samples, and further work understanding subpopulations within the low HL population is needed. Future work should measure this association in diverse inpatient settings (eg, psychiatric, surgical, and specialty), in addition to assessing associations between HL and other important in-hospital outcome measures, including mortality and discharge disposition.
Acknowledgments
The authors thank the Hospitalist Project team for their assistance with data collection. The authors especially thank Chuanhong Liao and Ashley Snyder for assistance with statistical analyses; Andrea Flores, Ainoa Coltri, and Tom Best for their assistance with data management. The authors would also like to thank Nicole Twu for her help with preparing and editing the manuscript.
Disclosures
Dr. Jaffee was supported by a Calvin Fentress Research Fellowship and NIH R25MH094612. Dr. Press was supported by a career development award (NHLBI K23HL118151). This work was also supported by a seed grant from the Center for Health Administration Studies. All other authors declare no conflicts of interest.
1. U.S. Department of Health and Human Services. Healthy People 2010: Understanding and Improving Health. Washington, DC: U.S. Government Printing Office; 2000.
2. “What Did the Doctor Say”? Improving Health Literacy to Protect Patient Safety. The Joint Commission; 2007.
3. Kutner M, Greenberg E, Jin Y, Paulsen C. The Health Literacy of America’s Adults: Results from the 2003 National Assessment of Adult Literacy. National Center for Education Statistics; 2006.
4. Davis TC, Wolf MS, Bass PF, et al. Literacy and misunderstanding prescription drug labels. Ann Intern Med. 2006;145(12):887-894. PubMed
5. Kripalani S, Henderson LE, Chiu EY, Robertson R, Kolm P, Jacobson TA. Predictors of medication self-management skill in a low-literacy population. J Gen Intern Med. 2006;21(8):852-856. PubMed
6. Berkman ND, Sheridan SL, Donahue KE, Halpern DJ, Crotty K. Low health literacy and health outcomes: an updated systematic review. Ann Intern Med. 2011;155(2):97-107. PubMed
7. Baker DW, Parker RM, Williams MV, Clark WS. Health literacy and the risk of hospital admission. J Gen Intern Med. 1998;13(12):791-798. PubMed
8. Mitchell SE, Sadikova E, Jack BW, Paasche-Orlow MK. Health literacy and 30-day postdischarge hospital utilization. J Health Commun. 2012;17(Suppl 3):325-338. PubMed
9. Jaffee EG, Arora VM, Matthiesen MI, Hariprasad SM, Meltzer DO, Press VG. Postdischarge Falls and Readmissions: Associations with Insufficient Vision and Low Health Literacy among Hospitalized Seniors. J Health Commun. 2016;21(sup2):135-140. PubMed
10. Hope CJ, Wu J, Tu W, Young J, Murray MD. Association of medication adherence, knowledge, and skills with emergency department visits by adults 50 years or older with congestive heart failure. Am J Health Syst Pharm. 2004;61(19):2043-2049. PubMed
11. Bennett IM, Chen J, Soroui JS, White S. The contribution of health literacy to disparities in self-rated health status and preventive health behaviors in older adults. Ann Fam Med. 2009;7(3):204-211. PubMed
12. Baker DW, Wolf MS, Feinglass J, Thompson JA. Health literacy, cognitive abilities, and mortality among elderly persons. J Gen Intern Med. 2008;23(6):723-726. PubMed
13. Cho YI, Lee SY, Arozullah AM, Crittenden KS. Effects of health literacy on health status and health service utilization amongst the elderly. Soc Sci Med. 2008;66(8):1809-1816. PubMed
14. Paasche-Orlow MK, Riekert KA, Bilderback A, et al. Tailored education may reduce health literacy disparities in asthma self-management. Am J Respir Crit Care Med. 2005;172(8):980-986. PubMed
15. Soria-Aledo V, Carrillo-Alcaraz A, Campillo-Soto Á, et al. Associated factors and cost of inappropriate hospital admissions and stays in a second-level hospital. Am J Med Qual. 2009;24(4):321-332. PubMed
16. Lu M, Sajobi T, Lucyk K, Lorenzetti D, Quan H. Systematic review of risk adjustment models of hospital length of stay (LOS). Med Care. 2015;53(4):355-365. PubMed
17. Clarke A, Rosen R. Length of stay. How short should hospital care be? Eur J Public Health. 2001;11(2):166-170. PubMed
18. Meltzer D, Manning WG, Morrison J, et al. Effects of physician experience on costs and outcomes on an academic general medicine service: results of a trial of hospitalists. Ann Intern Med. 2002;137(11):866-874. PubMed
19. Chew LD, Bradley KA, Boyko EJ. Brief questions to identify patients with inadequate health literacy. Fam Med. 2004;36(8):588-594. PubMed
20. Press VG, Shapiro MI, Mayo AM, Meltzer DO, Arora VM. More than meets the eye: relationship between low health literacy and poor vision in hospitalized patients. J Health Commun. 2013;18 Suppl 1:197-204. PubMed
21. Willens DE, Kripalani S, Schildcrout JS, et al. Association of brief health literacy screening and blood pressure in primary care. J Health Commun. 2013;18 Suppl 1:129-142. PubMed
22. Peterson PN, Shetterly SM, Clarke CL, et al. Health literacy and outcomes among patients with heart failure. JAMA. 2011;305(16):1695-1701. PubMed
23. Chew LD, Griffin JM, Partin MR, et al. Validation of screening questions for limited health literacy in a large VA outpatient population. J Gen Intern Med. 2008;23(5):561-566. PubMed
24. Averill RF, Goldfield N, Hughes JS, et al. All Patient Refined Diagnosis Related Groups (APR-DRGs): Methodology Overview. 3M Health Information Systems; 2003.
25. Waite KR, Paasche-Orlow M, Rintamaki LS, Davis TC, Wolf MS. Literacy, social stigma, and HIV medication adherence. J Gen Intern Med. 2008;23(9):1367-1372. PubMed
26. Paasche-Orlow MK, Wolf MS. The causal pathways linking health literacy to health outcomes. Am J Health Behav. 2007;31 Suppl 1:S19-26. PubMed
27. Berkman ND, Sheridan SL, Donahue KE, et al. Health literacy interventions and outcomes: an updated systematic review. Evid Rep Technol Assess (Full Rep). 2011;(199):1-941. PubMed
28. Kripalani S, Roumie CL, Dalal AK, et al. Effect of a pharmacist intervention on clinically important medication errors after hospital discharge: a randomized trial. Ann Intern Med. 2012;157(1):1-10. PubMed
29. Press VG, Arora VM, Shah LM, et al. Teaching the use of respiratory inhalers to hospitalized patients with asthma or COPD: a randomized trial. J Gen Intern Med. 2012;27(10):1317-1325. PubMed
30. Sobel RM, Paasche-Orlow MK, Waite KR, Rittner SS, Wilson EAH, Wolf MS. Asthma 1-2-3: a low literacy multimedia tool to educate African American adults about asthma. J Community Health. 2009;34(4):321-327. PubMed
31. Rothman RL, DeWalt DA, Malone R, et al. Influence of patient literacy on the effectiveness of a primary care-based diabetes disease management program. JAMA. 2004;292(14):1711-1716. PubMed
32. DeWalt DA, Malone RM, Bryant ME, et al. A heart failure self-management
program for patients of all literacy levels: a randomized, controlled trial [ISRCTN11535170].
BMC Health Serv Res. 2006;6:30. PubMed
33. Hasan O, Orav EJ, Hicks LS. Insurance status and hospital care for myocardial
infarction, stroke, and pneumonia. J Hosp Med. 2010;5(8):452-459. PubMed
34. Cook CB, Naylor DB, Hentz JG, et al. Disparities in diabetes-related hospitalizations:
relationship of age, sex, and race/ethnicity with hospital discharges, lengths
of stay, and direct inpatient charges. Ethn Dis. 2006;16(1):126-131. PubMed
35. Hadley J, Steinberg EP, Feder J. Comparison of uninsured and privately insured
hospital patients. Condition on admission, resource use, and outcome. JAMA.
1991;265(3):374-379. PubMed
36. Women’s Health Care Chartbook: Key Findings From the Kaiser Women’s
Health Survey. May 2011. https://kaiserfamilyfoundation.files.wordpress.
com/2013/01/8164.pdf. Accessed August 1, 2017.
37. Louis AJ, Arora VM, Matthiesen MI, Meltzer DO, Press VG. Screening Hospitalized Patients for Low Health Literacy: Beyond the REALM of Possibility? PubMed
Health literacy (HL), defined as patients’ ability to understand health information and make health decisions,1 is a prevalent problem in the outpatient and inpatient settings.2,3 In both settings, low HL has adverse implications for self-care including interpreting health labels4 and taking medications correctly.5 Among outpatient cohorts, HL has been associated with worse outcomes and acute care utilization.6 Associations with low HL include increased hospitalizations,7 rehospitalizations,8,9 emergency department visits,10 and decreased preventative care use.11 Among the elderly, low HL is associated with increased mortality12 and decreased self-perception of health.13
A systematic review revealed that most high-quality HL outcome studies were conducted in the outpatient setting.6 There have been very few studies assessing effects of low HL in an acute-care setting.7,14 These studies have evaluated postdischarge outcomes, including admissions or readmissions,7-9 and medication knowledge.14 To the best of our knowledge, there are no studies evaluating associations between HL and hospital length of stay (LOS).
LOS has received much attention as providers and payers focus more on resource utilization and eliminating adverse effects of prolonged hospitalization.15 LOS is multifactorial, depending on clinical characteristics like disease severity, as well as on sociocultural, demographic, and geographic factors.16 Despite evidence that LOS reductions translate into improved resource allocation and potentially fewer complications, there remains a tension between the appropriate LOS and one that is too short for a given condition.17
Because low HL is associated with inefficient resource utilization, we hypothesized that low HL would be associated with increased LOS after controlling for illness severity. Our objectives were to evaluate the association between low HL and LOS and whether such an association was modified by illness severity and sociodemographics.
METHODS
Study Design, Setting, Participants
An in-hospital, cohort study design of patients who were admitted or transferred to the general medicine service at the University of Chicago between October 2012 and November 2015 and screened for inclusion as part of a large, ongoing study of inpatient care quality was conducted.18 Exclusion criteria included observation status, age under 18 years, non-English speaking, and repeat participants. Those who died during hospitalization or whose discharge status was missing were excluded because the primary goal was to examine the association of HL and time to discharge, which could not be evaluated among those who died. We excluded participants with LOS >30 days to limit overly influential effects of extreme outliers (1% of the population).
Variables
HL was screened using the Brief Health Literacy Screen (BHLS), a validated, 3-question verbal survey not requiring adequate visual acuity to assess HL.19,20 The 3 questions are as follows: (1) “How confident are you filling out medical forms by yourself?”, (2) “How often do you have someone help you read hospital materials?”, and (3) “How often do you have problems learning about your medical condition because of difficulty understanding written information?” Responses to the questions were scored on a 5-point Likert scale in which higher scores corresponded to higher HL.21,22 The scores for each of the 3 questions were summed to yield a range between 3 and 15. On the individual questions, prior work has demonstrated improved test performance with a cutoff of ≤3, which corresponds to a response of “some of the time” or “somewhat”; therefore, when the 3 questions were summed together, scores of ≤9 were considered indicative of low HL.21,23
For severity of illness adjustment, we used relative weights derived from the 3M (3M, Maplewood, MN) All Patient Refined Diagnosis Related Groups (APR-DRG) classification system, which uses administrative data to classify the severity. The APR-DRG system assigns each admission to a DRG based on principal diagnosis; for each DRG, patients are then subdivided into 4 severity classes based on age, comorbidity, and interactions between these variables and the admitting diagnosis.24 Using the base DRG and severity score, the system assigns relative weights that reflect differences in expected hospital resource utilization.
LOS was derived from hospital administrative data and counted from the date of admission to the hospital. Participants who were discharged on the day of admission were counted as having an LOS of 1. Insurance status (Medicare, Medicaid, no payer, private) also was obtained from administrative data. Age, sex (male or female), education (junior high or less, some high school, high school graduate, some college, college graduate, postgraduate), and race (black/African American, white, Asian or Pacific Islander [including Asian Indian, Chinese, Filipino, Japanese, Korean, Vietnamese, other Asian, Native Hawaiian, Guam/Chamorro, Samoan, other Pacific], American Indian or Alaskan Native, multiple race) were obtained from administrative data based on information provided by the patient. Participants with missing data on any of the sociodemographic variables or on the APR-DRG score were excluded from the analysis.
Statistical Analysis
χ2 and 2-tailed t tests were used to compare categorical and continuous variables, respectively. Multivariate linear regressions were employed to measure associations between the independent variables (HL, illness severity, race, gender, education, and insurance status) and the dependent variable, LOS. Independent variables were chosen for clinical significance and retained in the model regardless of statistical significance. The adjusted R2 values of models with and without the HL variable included were reported to provide information on the contribution of HL to the overall model.
Because LOS was observed to be right skewed and residuals of the untransformed regression were observed to be non-normally distributed, the decision was made to natural log transform LOS, which is consistent with previous hospital LOS studies.16 Regression coefficients and confidence intervals were then transformed into percentage estimates using the following equation: 100(eβ–1). Adjusted R2 was reported for the transformed regression.
The APR-DRG relative weight was treated as a continuous variable. Sociodemographic variables were dichotomized as follows: female vs male; high school graduates vs not; African American vs not; Medicaid/no payer vs Medicare/private payer. Age was not included in the multivariate model because it has been incorporated into the weighted APR-DRG illness severity scores.
Each of the sociodemographic variables and the APR-DRG score were examined for effect modification via the same multivariate linear equation described above, with the addition of an interaction term. A separate regression was performed with an interaction term between age (dichotomized at ≥65) and HL to investigate whether age modified the association between HL and LOS. Finally, we explored whether effects were isolated to long vs short LOS by dividing the sample based on the mean LOS (≥6 days) and performing separate multivariate comparisons.
Sensitivity analyses were performed to exclude those with LOS greater than the 90th percentile and those with APR-DRG score greater than the 90th percentile; age was added to the model as a continuous variable to evaluate whether the illness severity score fully adjusted for the effects of age on LOS. Furthermore, we compared the participants with missing data to those with complete data across both dependent and independent variables. Alpha was set at 0.05; analyses were performed using Stata Version 14 (Stata, College Station, TX).
RESULTS
A total of 5983 participants met inclusion criteria and completed the HL assessment; of these participants, 75 (1%) died during hospitalization, 9 (0.2%) had missing discharge status, and 79 (1%) had LOS >30 days. Two hundred eighty (5%) were missing data on sociodemographic variables or APR-DRG score. Of the remaining (n = 5540), the mean age was 57 years (standard deviation [SD] = 19 years), over half of participants were female (57%), and the majority were African American (73%) and had graduated from high school (81%). The sample was divided into those with private insurance (25%), those with Medicare (46%), and those with Medicaid (26%); 2% had no payer. The mean APR-DRG score was 1.3 (SD = 1.2), and the scores ranged from 0.3 to 15.8.
On the BHLS screen for HL, 20% (1104/5540) had inadequate HL. Participants with low HL had higher weighted illness severity scores (average 1.4 vs 1.3; P = 0.003). Participants with low HL were also more likely to be 65 or older (55% vs 33%; P < 0.001), non-high school graduates (35% vs 15%; P < 0.001), and African American (78% vs 72%; P < 0.001), and to have Medicare or private insurance (75% vs 71%; P = 0.02). There was no significant difference with respect to gender (54% male vs 57% female; P = 0.1)
Finally, we compared the group with missing data (n = 280) to the group with complete data (n = 5540). The participants with missing data were more likely to have low HL (31% [86/280] vs 20%; P < 0.001) and to have Medicare or private insurance (82% [177/217] vs 72%; P = 0.002); however, they were not more likely to be 65 or older (40% [112/280] vs 37%; P = 0.3), high school graduates (88% [113/129] vs 81%; P = 0.06), African American (69% [177/256] vs 73%; P = 0.1), or female (57% [158/279] vs 57%; P = 1), nor were they more likely to have longer LOS (5.7 [n = 280] vs 5.5 days; P = 0.6) or higher illness severity scores (1.3 [n = 231] vs 1.3; P = 0.7).
DISCUSSION
To our knowledge, this study is the first to evaluate the association between low HL and an important in-hospital outcome measure, hospital LOS. We found that low HL was associated with a longer hospital LOS, a result which remained significant when controlling for severity of illness and sociodemographic variables and when testing the model for sensitivity to the highest values of LOS and illness severity. Additionally, the association of HL with LOS appeared concentrated among participants with shorter LOS. Relative to other predictors, the contribution of HL to the overall LOS model was small, as evidenced by the change in adjusted R2 values with HL excluded.
Among the covariates, only gender modified the association between HL and LOS; the findings suggested that men were more susceptible to the effect of low HL on increased LOS. Illness severity and other sociodemographics, including age ≥65, did not appear to modify the association. We also found that being African American and having Medicaid or no insurance were associated with a significantly shorter LOS in multivariate analysis.
Previous work suggested that the adverse health effects of low HL may be mediated through several pathways, including health knowledge, self-efficacy, health skills, and illness stigma.25-27 The finding of a small but significant relationship between HL and LOS was not surprising given these known associations; nevertheless, there may be an additional patient-dependent effect of low HL on LOS not discovered here. For instance, patients with poor health knowledge and self-efficacy might stay in the hospital longer if they or their providers do not feel comfortable with their self-care ability.
This finding may be useful in developing hospital-based interventions. HL-specific interventions, several of which have been tested in the inpatient setting,14,28,29 have shown promise toward improving health knowledge,30 disease severity,31 and health resource utilization.32
Those with low HL may lack the self-efficacy to participate in discharge planning; in fact, previous work has related low HL to posthospital readmissions.8,9 Conversely, patients with low HL might struggle to engage in the inpatient milieu, advocating for shorter LOS if they feel alienated by the inpatient experience.
These possibilities show that LOS is a complex measure shown to depend on patient-level characteristics and on provider-based, geographical, and sociocultural factors.16,33 With these forces at play, additional effects of lower levels of HL may be lost without phenotyping patients by both level of HL and related characteristics, such as self-efficacy, health skills, and stigma. By gathering these additional data, future work should explore whether subpopulations of patients with low HL may be at risk for too-short vs too-long hospital admissions.
For instance, in this study, both race and Medicaid insurance were associated with shorter LOS. Being African American was associated with shorter LOS in our study but has been found to be associated with longer LOS in another study specifically focused on diabetes.34 Prior findings found uninsured patients have shorter LOS.35 Therefore, these findings in our study are difficult to explain without further work to understand whether there are health disparities in the way patients are cared for during hospitalization that may shorten or lengthen their LOS because of factors outside of their clinical need.
The finding that gender modified the effect of low HL on LOS was unexpected. There were similar proportions of men and women with low HL. There is evidence to support that women make the majority of health decisions for themselves and their familes36; therefore, there may be unmeasured aspects of HL that provide an advantage for female vs male inpatients. Furthermore, omitted confounders, such as social support, may not fully capture potential gender-related differences. Future work is needed to understand the role of gender in relationship to HL and LOS.
Limitations of this study include its observational, single-centered design with information derived from administrative data; positive and negative confounding cannot be ruled out. For instance, we did not control for complex aspects affecting LOS, such as discharge disposition and goals of care (eg, aggressive care after discharge vs hospice). To address this limitation, multivariate analyses were performed, which were adjusted for illness severity scores and took into account both comorbidity and severity of the current illness. Additionally, although it is important to study such populations, our largely urban, minority sample is not representative of the U.S. population, and within our large sample, there were participants with missing data who had lower HL on average, although this group represented only 5% of the sample. Finally, different HL tools have noncomplete concordance, which has been seen when comparing the BHLS with more objective tools.20,37 Furthermore, certain in-hospital clinical scenarios (eg, recent stroke or prolonged intensive care unit stay) may present unique challenges in establishing a baseline HL level. However, the BHLS was used in this study because of its greater feasibility.
In conclusion, this study is the first to evaluate the relationship between low HL and LOS. The findings suggest that HL may play a role in shaping outcomes in the inpatient setting and that targeting interventions toward screened patients may be a pathway toward mitigating adverse effects. Our findings need to be replicated in larger, more representative samples, and further work understanding subpopulations within the low HL population is needed. Future work should measure this association in diverse inpatient settings (eg, psychiatric, surgical, and specialty), in addition to assessing associations between HL and other important in-hospital outcome measures, including mortality and discharge disposition.
Acknowledgments
The authors thank the Hospitalist Project team for their assistance with data collection. The authors especially thank Chuanhong Liao and Ashley Snyder for assistance with statistical analyses; Andrea Flores, Ainoa Coltri, and Tom Best for their assistance with data management. The authors would also like to thank Nicole Twu for her help with preparing and editing the manuscript.
Disclosures
Dr. Jaffee was supported by a Calvin Fentress Research Fellowship and NIH R25MH094612. Dr. Press was supported by a career development award (NHLBI K23HL118151). This work was also supported by a seed grant from the Center for Health Administration Studies. All other authors declare no conflicts of interest.
1. U.S. Department of Health and Human Services. Healthy People 2010: Understanding and Improving Health. Washington, DC: U.S. Government Printing Office; 2000.
2. “What Did the Doctor Say”? Improving Health Literacy to Protect Patient Safety. The Joint Commission; 2007.
3. Kutner M, Greenberg E, Jin Y, Paulsen C. The Health Literacy of America’s Adults: Results from the 2003 National Assessment of Adult Literacy. National Center for Education Statistics; 2006.
4. Davis TC, Wolf MS, Bass PF, et al. Literacy and misunderstanding prescription drug labels. Ann Intern Med. 2006;145(12):887-894. PubMed
5. Kripalani S, Henderson LE, Chiu EY, Robertson R, Kolm P, Jacobson TA. Predictors of medication self-management skill in a low-literacy population. J Gen Intern Med. 2006;21(8):852-856. PubMed
6. Berkman ND, Sheridan SL, Donahue KE, Halpern DJ, Crotty K. Low health literacy and health outcomes: an updated systematic review. Ann Intern Med. 2011;155(2):97-107. PubMed
7. Baker DW, Parker RM, Williams MV, Clark WS. Health literacy and the risk of hospital admission. J Gen Intern Med. 1998;13(12):791-798. PubMed
8. Mitchell SE, Sadikova E, Jack BW, Paasche-Orlow MK. Health literacy and 30-day postdischarge hospital utilization. J Health Commun. 2012;17(Suppl 3):325-338. PubMed
9. Jaffee EG, Arora VM, Matthiesen MI, Hariprasad SM, Meltzer DO, Press VG. Postdischarge Falls and Readmissions: Associations with Insufficient Vision and Low Health Literacy among Hospitalized Seniors. J Health Commun. 2016;21(sup2):135-140. PubMed
10. Hope CJ, Wu J, Tu W, Young J, Murray MD. Association of medication adherence, knowledge, and skills with emergency department visits by adults 50 years or older with congestive heart failure. Am J Health Syst Pharm. 2004;61(19):2043-2049. PubMed
11. Bennett IM, Chen J, Soroui JS, White S. The contribution of health literacy to disparities in self-rated health status and preventive health behaviors in older adults. Ann Fam Med. 2009;7(3):204-211. PubMed
12. Baker DW, Wolf MS, Feinglass J, Thompson JA. Health literacy, cognitive abilities, and mortality among elderly persons. J Gen Intern Med. 2008;23(6):723-726. PubMed
13. Cho YI, Lee SY, Arozullah AM, Crittenden KS. Effects of health literacy on health status and health service utilization amongst the elderly. Soc Sci Med. 2008;66(8):1809-1816. PubMed
14. Paasche-Orlow MK, Riekert KA, Bilderback A, et al. Tailored education may reduce health literacy disparities in asthma self-management. Am J Respir Crit Care Med. 2005;172(8):980-986. PubMed
15. Soria-Aledo V, Carrillo-Alcaraz A, Campillo-Soto Á, et al. Associated factors and cost of inappropriate hospital admissions and stays in a second-level hospital. Am J Med Qual. 2009;24(4):321-332. PubMed
16. Lu M, Sajobi T, Lucyk K, Lorenzetti D, Quan H. Systematic review of risk adjustment models of hospital length of stay (LOS). Med Care. 2015;53(4):355-365. PubMed
17. Clarke A, Rosen R. Length of stay. How short should hospital care be? Eur J Public Health. 2001;11(2):166-170. PubMed
18. Meltzer D, Manning WG, Morrison J, et al. Effects of physician experience on costs and outcomes on an academic general medicine service: results of a trial of hospitalists. Ann Intern Med. 2002;137(11):866-874. PubMed
19. Chew LD, Bradley KA, Boyko EJ. Brief questions to identify patients with inadequate health literacy. Fam Med. 2004;36(8):588-594. PubMed
20. Press VG, Shapiro MI, Mayo AM, Meltzer DO, Arora VM. More than meets the eye: relationship between low health literacy and poor vision in hospitalized patients. J Health Commun. 2013;18 Suppl 1:197-204. PubMed
21. Willens DE, Kripalani S, Schildcrout JS, et al. Association of brief health literacy screening and blood pressure in primary care. J Health Commun. 2013;18 Suppl 1:129-142. PubMed
22. Peterson PN, Shetterly SM, Clarke CL, et al. Health literacy and outcomes among patients with heart failure. JAMA. 2011;305(16):1695-1701. PubMed
23. Chew LD, Griffin JM, Partin MR, et al. Validation of screening questions for limited health literacy in a large VA outpatient population. J Gen Intern Med. 2008;23(5):561-566. PubMed
24. Averill RF, Goldfield N, Hughes JS, et al. All Patient Refined Diagnosis Related Groups (APR-DRGs): Methodology Overview. 3M Health Information Systems; 2003.
25. Waite KR, Paasche-Orlow M, Rintamaki LS, Davis TC, Wolf MS. Literacy, social stigma, and HIV medication adherence. J Gen Intern Med. 2008;23(9):1367-1372. PubMed
26. Paasche-Orlow MK, Wolf MS. The causal pathways linking health literacy to health outcomes. Am J Health Behav. 2007;31 Suppl 1:S19-26. PubMed
27. Berkman ND, Sheridan SL, Donahue KE, et al. Health literacy interventions and outcomes: an updated systematic review. Evid Rep Technol Assess (Full Rep). 2011;(199):1-941. PubMed
28. Kripalani S, Roumie CL, Dalal AK, et al. Effect of a pharmacist intervention on clinically important medication errors after hospital discharge: a randomized trial. Ann Intern Med. 2012;157(1):1-10. PubMed
29. Press VG, Arora VM, Shah LM, et al. Teaching the use of respiratory inhalers to hospitalized patients with asthma or COPD: a randomized trial. J Gen Intern Med. 2012;27(10):1317-1325. PubMed
30. Sobel RM, Paasche-Orlow MK, Waite KR, Rittner SS, Wilson EAH, Wolf MS. Asthma 1-2-3: a low literacy multimedia tool to educate African American adults about asthma. J Community Health. 2009;34(4):321-327. PubMed
31. Rothman RL, DeWalt DA, Malone R, et al. Influence of patient literacy on the effectiveness of a primary care-based diabetes disease management program. JAMA. 2004;292(14):1711-1716. PubMed
32. DeWalt DA, Malone RM, Bryant ME, et al. A heart failure self-management
program for patients of all literacy levels: a randomized, controlled trial [ISRCTN11535170].
BMC Health Serv Res. 2006;6:30. PubMed
33. Hasan O, Orav EJ, Hicks LS. Insurance status and hospital care for myocardial
infarction, stroke, and pneumonia. J Hosp Med. 2010;5(8):452-459. PubMed
34. Cook CB, Naylor DB, Hentz JG, et al. Disparities in diabetes-related hospitalizations:
relationship of age, sex, and race/ethnicity with hospital discharges, lengths
of stay, and direct inpatient charges. Ethn Dis. 2006;16(1):126-131. PubMed
35. Hadley J, Steinberg EP, Feder J. Comparison of uninsured and privately insured
hospital patients. Condition on admission, resource use, and outcome. JAMA.
1991;265(3):374-379. PubMed
36. Women’s Health Care Chartbook: Key Findings From the Kaiser Women’s
Health Survey. May 2011. https://kaiserfamilyfoundation.files.wordpress.
com/2013/01/8164.pdf. Accessed August 1, 2017.
37. Louis AJ, Arora VM, Matthiesen MI, Meltzer DO, Press VG. Screening Hospitalized Patients for Low Health Literacy: Beyond the REALM of Possibility? PubMed
© 2017 Society of Hospital Medicine
Trends in Troponin-Only Testing for AMI in Academic Teaching Hospitals and the Impact of Choosing Wisely®
Evidence suggests that troponin-only testing is the superior strategy to diagnose acute myocardial infarction (AMI).1 Because of this, in February 2015, the Choosing Wisely® campaign issued a recommendation to use troponin I or T to diagnose AMI, and not to test for myoglobin or creatine kinase-MB (CK-MB).2 This recommendation was in line with guidelines from the American Heart Association and the American College of Cardiology, which recommended that myoglobin and CK-MB are not useful and offer no benefit for the diagnosis of acute coronary syndrome.3 Some institutions have developed interventions to promote troponin-only testing, reporting substantial cost savings and no negative consequences.4,5
Despite these successes, it is likely that institutions vary with respect to the adoption of the Choosing Wisely® troponin-only testing recommendation.6 Implementing this recommendation requires both promoting clinician behavior change and a strong institutional culture of high-value care.7 Understanding the variation across institutions of troponin-only testing could inform how to promote high-value care recommendations nationwide. We aimed to describe patterns of troponin, myoglobin, and CK-MB testing in a sample of academic teaching hospitals before and after the Choosing Wisely® recommendation.
METHODS
Troponin, myoglobin, and CK-MB ordering data were extracted from Vizient’s (formerly University HealthSystem Consortium, Chicago, IL) Clinical Database/Resource Manager (CDB/RM®) for all patients with a principal discharge diagnosis of AMI at all hospitals reporting all 36 months from the fourth quarter of 2013 through the third quarter of 2016. This period includes time both before and after the Choosing Wisely® recommendation, which was released in the first quarter of 2015. Vizient’s CDB/RM contains ordering data for 300 academic medical centers and their affiliated hospitals and includes the discharge diagnoses for patients cared for by these institutions. Only patients with a principal discharge diagnosis of AMI were included because the Choosing Wisely® recommendation is specific with regard to troponin-only testing for the diagnosis of AMI. Patients with a principal diagnosis code for subcategories of myocardial ischemia (eg, stable angina, unstable angina) were not included because of the large number of diagnosis codes for these subcategories (more than 100 in the International Classification of Diseases, Ninth Revision and the International Classification of Diseases, Tenth Revision) and because the variation in their use across institutions within the dataset limited the utility of using these codes to consistently and accurately identify patients with myocardial ischemia. Moreover, the diagnosis of AMI encompasses the subcategories of myocardial ischemia.8
Hospital rates of ordering cardiac biomarkers (troponin-only or troponin and myoglobin/CK-MB) were determined overall for the entire study period and for each quarter of the study period based on the total patients with a discharge diagnosis of AMI. For each quarter of the 12 study quarters, all the hospitals were divided into tertiles based on their rate of troponin-only testing per discharge diagnosis of AMI. Hospitals were then classified into 3 groups based on their tertile ranking over the full 12 study quarters. The first group included hospitals whose rate of troponin-only testing placed them in the top tertile for each and all quarters throughout the study period. The second group included hospitals whose troponin-only testing rate placed them in the bottom tertile for each and all quarters throughout the study period. The third group included hospitals whose troponin-only testing rate each quarter led to either an increase or decrease in their tertile ranking throughout the study period. χ2 tests were used to test for bivariate associations among hospitals based on their rate of troponin-only testing and hospital size (number of beds), their regional geographic location, the volume of AMI patients seen at the hospital, whether the primary physician during the hospitalization was a cardiologist or other provider, and the hospitals’ quality ratings. Quality rating was based on an internal Vizient rating and the “Best Hospitals for Cardiology and Heart Surgery Rankings” as published in the US News & World Report.9 The Vizient quality rating is based on a composite score that combines scores from the domains of quality (hospital quality incentive scores), safety (patient safety indicators), patient-centeredness (Hospital Consumer Assessment of Healthcare Providers and Systems Hospital Survey), and equity (distribution of care by race/ethnicity, gender, and age). Simple slopes were calculated to determine the rate of change in troponin-only testing for each study quarter, and Student t tests were used to compare the rates of change of these simple slopes across study quarters.
RESULTS
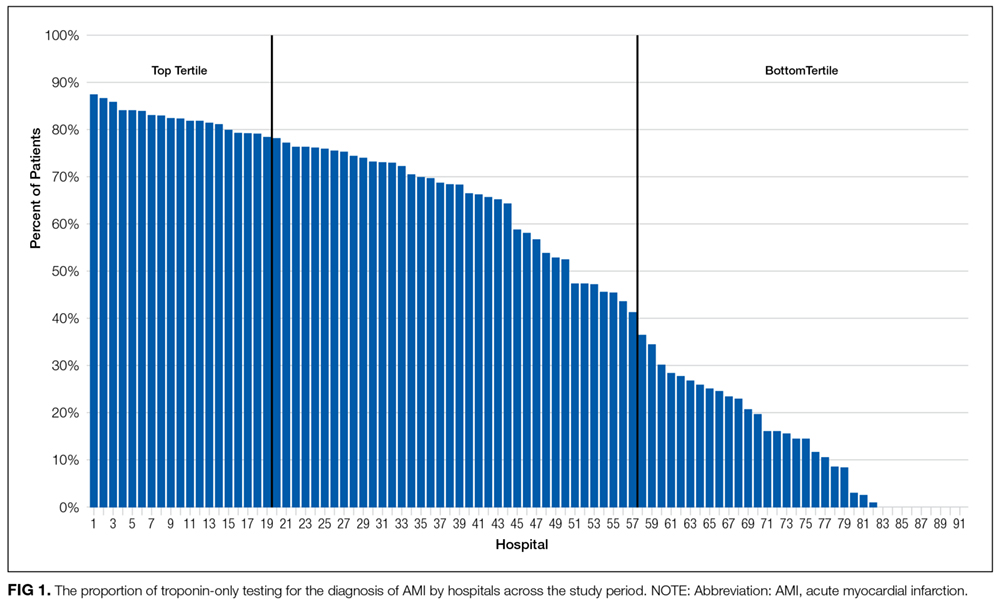
Pattern of Troponin-Only Testing by Hospital Size
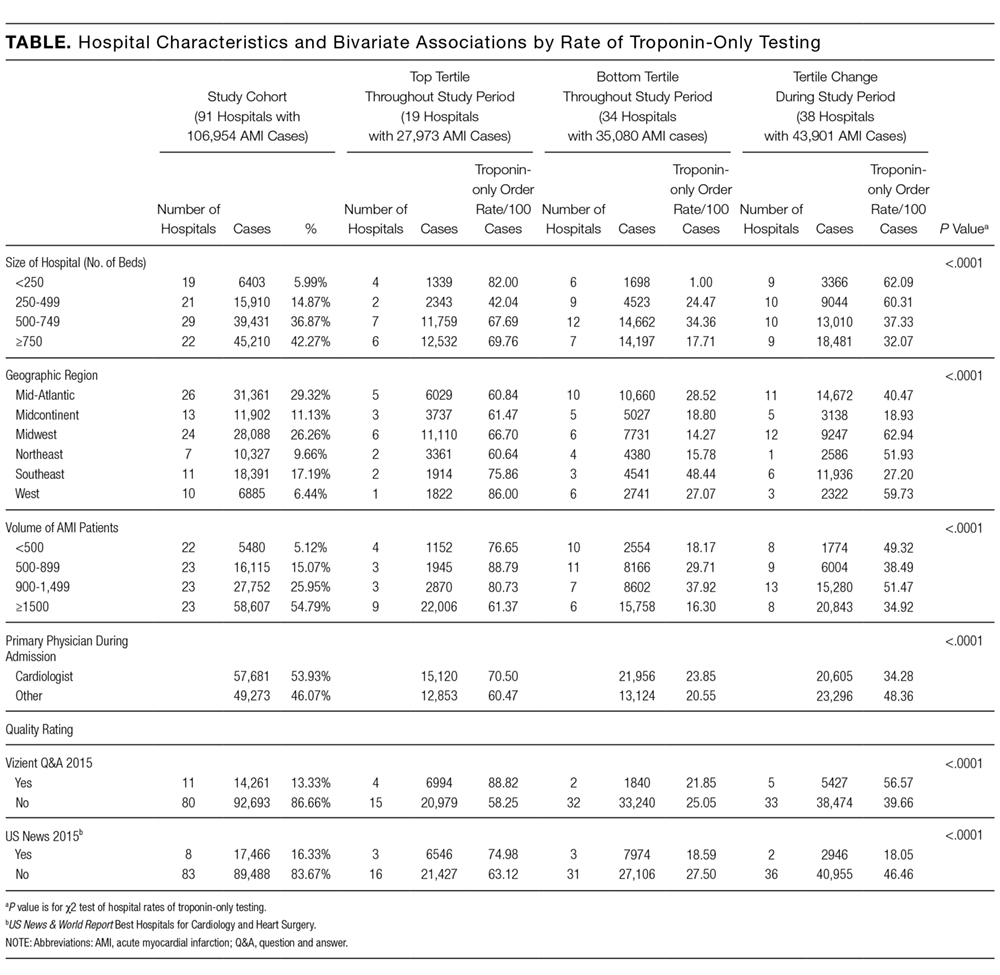
Pattern of Troponin-Only Testing by Geographic Region
The rate of troponin-only testing also varied and was statistically significantly different when comparing the 3 groups of hospitals across geographic regions of the country (P < 0.0001). Of the hospitals in the top tertile of troponin-only testing throughout the study period, the majority were in the Midwest (n = 6) and Mid-Atlantic (n = 5) regions. However, the rate of troponin-only testing for AMI in this group was highest in hospitals in the West (86/100 patients) and/or Southeast (75/100 patients) regions, although this rate was based on a small number of hospitals in these geographic areas (n = 1 in the West, n = 2 in the Southeast). Of hospitals in the bottom tertile of troponin-only testing throughout the study period, the majority were in the Mid-Atlantic region (n = 10). Hospitals that increased their troponin-only testing during the study period were predominantly in the Midwest (n = 12) and Mid-Atlantic regions (n = 11; Table), with the hospitals in the Midwest having the highest rate of troponin-only testing in this group.
Pattern of Troponin-Only Testing by Volume of AMI Patients
Of the hospitals in the top tertile of troponin-only testing during the study period, the majority cared for ≥1500 AMI patients (n = 9), but interestingly, among these hospitals, those caring for a smaller volume of AMI patients all had higher rates of troponin-only testing per 100 patients (P < 0.0001; Table). There was no other obvious pattern of troponin-only testing based on the volume of AMI patients cared for in hospitals in either the bottom tertile of troponin-only testing or hospitals that improved troponin-only testing during the study period.
Pattern of Troponin-Only Testing by Physician Type
Of the hospitals in the top tertile of troponin-only testing throughout the study period, those where a cardiologist cared for patients with AMI had higher rates of troponin-only testing (71/100 patients) than did hospitals where patients were cared for by a noncardiologist (60/100 patients). However, of the hospitals that improved their troponin-only testing during the study period, higher rates of troponin-only testing were seen in hospitals where patients were cared for by a noncardiologist (48/100 patients) compared with patients cared for by a cardiologist (34/100 patients; Table). These differences in hospital rates of troponin-only testing during the study period based on physician type were statistically significant (P < 0.0001; Table).
Pattern of Troponin-Only Testing by Quality Rating
Hospitals that were in the top tertile of troponin-only testing and were rated highly by Vizient’s quality rating or recognized as a top hospital by the US News & World Report had higher rates of troponin-only testing per 100 patients than did hospitals in the top tertile that were not ranked highly by Vizient’s quality rating or recognized as a top hospital by the US News & World Report. However, the majority of hospitals in the top tertile of troponin-only testing were not rated highly by Vizient (n = 15) or recognized as a top hospital by the US News & World Report (n = 16). The large majority of hospitals in the bottom tertile of troponin-only testing were not recognized as high-quality hospitals by Vizient (n = 32) or the US News & World Report (n = 31). Of the hospitals that improved their troponin-only testing during the study period, the majority were not recognized as high-quality hospitals by Vizient (n = 33) or the US News & World Report (n = 36), but among this group, those hospitals recognized by Vizient as high quality (n = 5) had the highest rate of troponin-only testing (57/100 patients). The differences in the rate of troponin-only testing across the different groups of hospitals and quality ratings were statistically significant (P < 0.0001; Table).
The Effect of Choosing Wisely® on Troponin-Only Testing
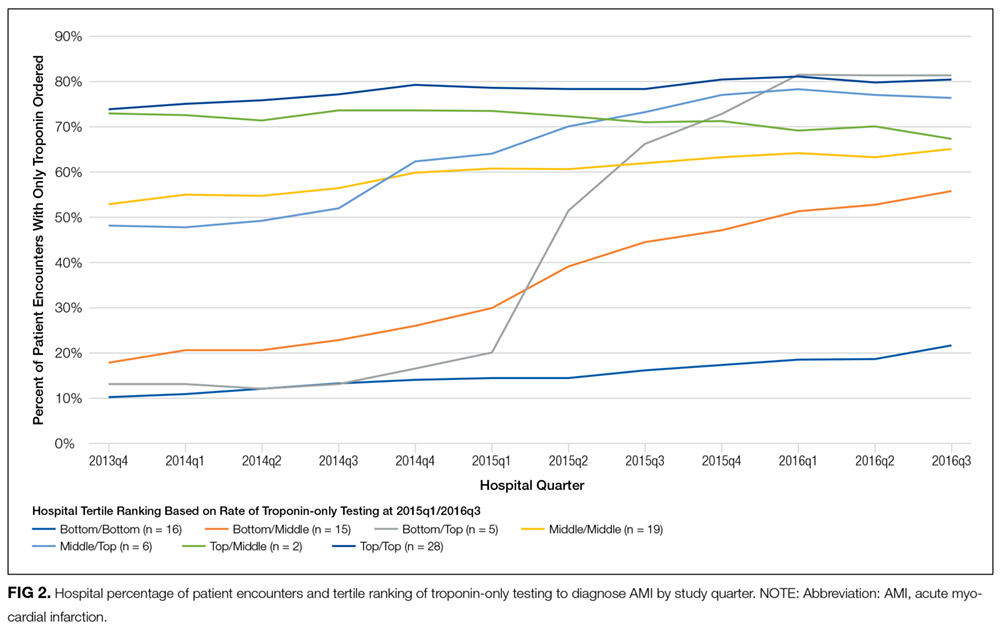
DISCUSSION
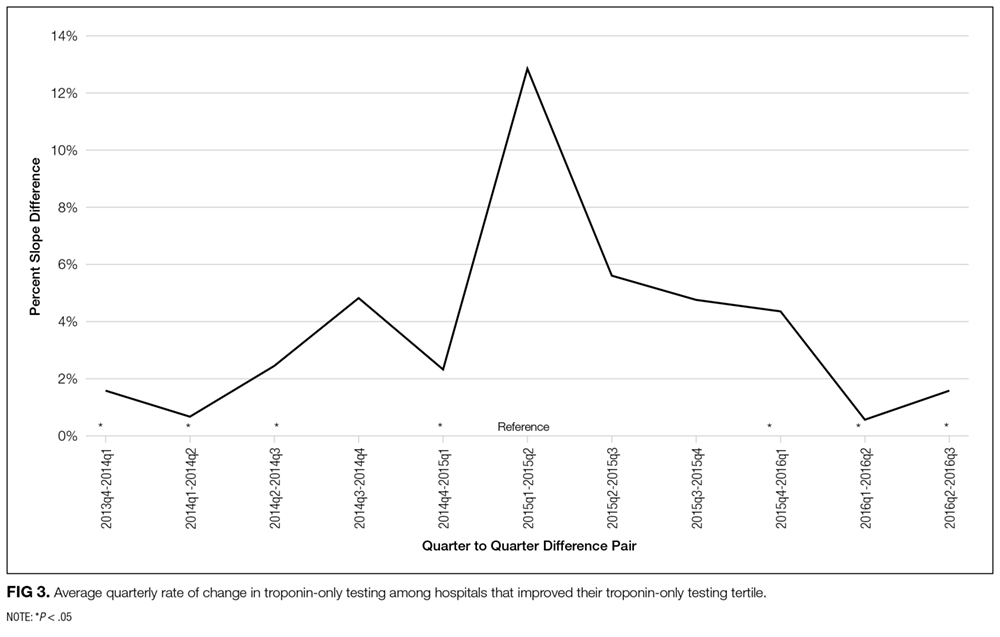
In the hospitals that demonstrated increasing adoption of troponin-only testing, there are several interesting patterns. First, among these hospitals, smaller hospitals tended to have higher overall rates of troponin-only testing per 100 patients than larger hospitals. Additionally, the hospitals with the highest rates were located in the Midwest region. These hospitals may be learning from and following the high-performing institutions observed in our data that are also located in the Midwest. Additionally, among the hospitals that significantly increased their rate of troponin-only testing, we see that the Choosing Wisely® recommendation appeared to facilitate accelerated adoption of troponin-only testing. In these institutions, it is likely that the impact of Choosing Wisely® was significant because there was attention to high-value care and already an existing movement underway to institute such high-value practices. For example, natural champions, leadership, infrastructure, and a supportive culture may all be prerequisites for Choosing Wisely® recommendations to become institutionally adopted.
Lastly, in the hospitals that have continued to order myoglobin and CK-MB, future work is needed to understand and overcome barriers to adopting high-value care practices.
There are several limitations to this study. First, because this was an observational study, we cannot prove a causal relationship between the Choosing Wisely® recommendation and the increased rates of troponin-only testing. Additionally, the Vizient CDB/RM contains reporting data for a limited number of academic medical centers only, and therefore, these results may not represent practices at nonacademic or even other academic medical centers. Our study only included patients with a principal discharge diagnosis of AMI because the Choosing Wisely® recommendation to order troponin-only is specific for diagnosing patients with AMI. However, it is possible that the Choosing Wisely® recommendation also has affected provider ordering in patients with diagnoses such as chest pain or angina, and these affects would not be captured in our study. Lastly, because instituting high-value care practices take time, our follow-up time may not have been long enough to capture improvement in troponin-only testing at institutions responding to and attempting to adhere to the Choosing Wisely® recommendation to order troponin-only testing for patients with AMI.
Disclosure
No other individuals besides the authors contributed to this work. This project was not funded or supported by any external grant or agency. Dr. Prochaska’s institute received funding from the Agency for Research Healthcare and Quality for a K12 Career Development Grant (AHRQ K12 HS023007) outside the submitted work. Dr. Hohmann and Dr Modes have nothing to disclose. Dr. Arora receives financial compensation as a member of the Board of Directors for the American Board of Internal Medicine and has received grant funding from the ABIM Foundation. She also receives royalties from McGraw Hill.
1. Pickering JW, Than MP, Cullen L, et al. Rapid rule-out of acute myocardial infarction with a single high-sensitivity cardiac troponin t measurement below the limit of detection: A collaborative meta-analysis. Ann Intern Med. 2017;166(10):715-724. PubMed
2. American Society for Clinical Pathology. Don’t test for myoglobin or CK-MB in the diagnosis of acute myocardial infarction (AMI). Instead, use troponin I or T. http://www.choosingwisely.org/clinician-lists/american-society-clinical-pathology-myoglobin-to-diagnose-acute-myocardial-infarction/. Accessed August 3, 2016.
3. Amsterdam EA, Wenger NK, Brindis RG, et al. 2014 AHA/ACC guideline for the management of patients with non–st-elevation acute coronary syndromes. Circulation. 2014;130(25):e344-e426. PubMed
4. Larochelle MR, Knight AM, Pantle H, Riedel S, Trost JC. Reducing excess cardiac biomarker testing at an academic medical center. J Gen Intern Med. 2014;29(11):1468-1474. PubMed
5. Le RD, Kosowsky JM, Landman AB, Bixho I, Melanson SEF, Tanasijevic MJ. Clinical and financial impact of removing creatine kinase-MB from the routine testing menu in the emergency setting. Am J Emerg Med. 2015;33(1):72-75. PubMed
6. Rosenberg A, Agiro A, Gottlieb M, et al. Early trends among seven recommendations from the choosing wisely campaign. JAMA Intern Med. 2015;175(12):1913. PubMed
7. Wolfson DB. Choosing Wisely recommendations using administrative claims data. JAMA Intern Med. 2016;176(4):565-565. PubMed
8. Thygesen K, Alpert JS, Jaffe AS, Simoons ML, Chaitman BR, White HD. Third universal definition of myocardial infarction. Circulation. 2012;126(16):2020-2035. PubMed
9. US News & World Report. Best hospitals for cardiology & heart surgery. http://health.usnews.com/best-hospitals/rankings/cardiology-and-heart-surgery. Accessed April 19, 2017.
10. Bradley EH, Curry LA, Ramanadhan S, Rowe L, Nembhard IM, Krumholz HM. Research in action: using positive deviance to improve quality of health care. Implement Sci IS. 2009;4:25. PubMed
Evidence suggests that troponin-only testing is the superior strategy to diagnose acute myocardial infarction (AMI).1 Because of this, in February 2015, the Choosing Wisely® campaign issued a recommendation to use troponin I or T to diagnose AMI, and not to test for myoglobin or creatine kinase-MB (CK-MB).2 This recommendation was in line with guidelines from the American Heart Association and the American College of Cardiology, which recommended that myoglobin and CK-MB are not useful and offer no benefit for the diagnosis of acute coronary syndrome.3 Some institutions have developed interventions to promote troponin-only testing, reporting substantial cost savings and no negative consequences.4,5
Despite these successes, it is likely that institutions vary with respect to the adoption of the Choosing Wisely® troponin-only testing recommendation.6 Implementing this recommendation requires both promoting clinician behavior change and a strong institutional culture of high-value care.7 Understanding the variation across institutions of troponin-only testing could inform how to promote high-value care recommendations nationwide. We aimed to describe patterns of troponin, myoglobin, and CK-MB testing in a sample of academic teaching hospitals before and after the Choosing Wisely® recommendation.
METHODS
Troponin, myoglobin, and CK-MB ordering data were extracted from Vizient’s (formerly University HealthSystem Consortium, Chicago, IL) Clinical Database/Resource Manager (CDB/RM®) for all patients with a principal discharge diagnosis of AMI at all hospitals reporting all 36 months from the fourth quarter of 2013 through the third quarter of 2016. This period includes time both before and after the Choosing Wisely® recommendation, which was released in the first quarter of 2015. Vizient’s CDB/RM contains ordering data for 300 academic medical centers and their affiliated hospitals and includes the discharge diagnoses for patients cared for by these institutions. Only patients with a principal discharge diagnosis of AMI were included because the Choosing Wisely® recommendation is specific with regard to troponin-only testing for the diagnosis of AMI. Patients with a principal diagnosis code for subcategories of myocardial ischemia (eg, stable angina, unstable angina) were not included because of the large number of diagnosis codes for these subcategories (more than 100 in the International Classification of Diseases, Ninth Revision and the International Classification of Diseases, Tenth Revision) and because the variation in their use across institutions within the dataset limited the utility of using these codes to consistently and accurately identify patients with myocardial ischemia. Moreover, the diagnosis of AMI encompasses the subcategories of myocardial ischemia.8
Hospital rates of ordering cardiac biomarkers (troponin-only or troponin and myoglobin/CK-MB) were determined overall for the entire study period and for each quarter of the study period based on the total patients with a discharge diagnosis of AMI. For each quarter of the 12 study quarters, all the hospitals were divided into tertiles based on their rate of troponin-only testing per discharge diagnosis of AMI. Hospitals were then classified into 3 groups based on their tertile ranking over the full 12 study quarters. The first group included hospitals whose rate of troponin-only testing placed them in the top tertile for each and all quarters throughout the study period. The second group included hospitals whose troponin-only testing rate placed them in the bottom tertile for each and all quarters throughout the study period. The third group included hospitals whose troponin-only testing rate each quarter led to either an increase or decrease in their tertile ranking throughout the study period. χ2 tests were used to test for bivariate associations among hospitals based on their rate of troponin-only testing and hospital size (number of beds), their regional geographic location, the volume of AMI patients seen at the hospital, whether the primary physician during the hospitalization was a cardiologist or other provider, and the hospitals’ quality ratings. Quality rating was based on an internal Vizient rating and the “Best Hospitals for Cardiology and Heart Surgery Rankings” as published in the US News & World Report.9 The Vizient quality rating is based on a composite score that combines scores from the domains of quality (hospital quality incentive scores), safety (patient safety indicators), patient-centeredness (Hospital Consumer Assessment of Healthcare Providers and Systems Hospital Survey), and equity (distribution of care by race/ethnicity, gender, and age). Simple slopes were calculated to determine the rate of change in troponin-only testing for each study quarter, and Student t tests were used to compare the rates of change of these simple slopes across study quarters.
RESULTS
Pattern of Troponin-Only Testing by Hospital Size
Pattern of Troponin-Only Testing by Geographic Region
The rate of troponin-only testing also varied and was statistically significantly different when comparing the 3 groups of hospitals across geographic regions of the country (P < 0.0001). Of the hospitals in the top tertile of troponin-only testing throughout the study period, the majority were in the Midwest (n = 6) and Mid-Atlantic (n = 5) regions. However, the rate of troponin-only testing for AMI in this group was highest in hospitals in the West (86/100 patients) and/or Southeast (75/100 patients) regions, although this rate was based on a small number of hospitals in these geographic areas (n = 1 in the West, n = 2 in the Southeast). Of hospitals in the bottom tertile of troponin-only testing throughout the study period, the majority were in the Mid-Atlantic region (n = 10). Hospitals that increased their troponin-only testing during the study period were predominantly in the Midwest (n = 12) and Mid-Atlantic regions (n = 11; Table), with the hospitals in the Midwest having the highest rate of troponin-only testing in this group.
Pattern of Troponin-Only Testing by Volume of AMI Patients
Of the hospitals in the top tertile of troponin-only testing during the study period, the majority cared for ≥1500 AMI patients (n = 9), but interestingly, among these hospitals, those caring for a smaller volume of AMI patients all had higher rates of troponin-only testing per 100 patients (P < 0.0001; Table). There was no other obvious pattern of troponin-only testing based on the volume of AMI patients cared for in hospitals in either the bottom tertile of troponin-only testing or hospitals that improved troponin-only testing during the study period.
Pattern of Troponin-Only Testing by Physician Type
Of the hospitals in the top tertile of troponin-only testing throughout the study period, those where a cardiologist cared for patients with AMI had higher rates of troponin-only testing (71/100 patients) than did hospitals where patients were cared for by a noncardiologist (60/100 patients). However, of the hospitals that improved their troponin-only testing during the study period, higher rates of troponin-only testing were seen in hospitals where patients were cared for by a noncardiologist (48/100 patients) compared with patients cared for by a cardiologist (34/100 patients; Table). These differences in hospital rates of troponin-only testing during the study period based on physician type were statistically significant (P < 0.0001; Table).
Pattern of Troponin-Only Testing by Quality Rating
Hospitals that were in the top tertile of troponin-only testing and were rated highly by Vizient’s quality rating or recognized as a top hospital by the US News & World Report had higher rates of troponin-only testing per 100 patients than did hospitals in the top tertile that were not ranked highly by Vizient’s quality rating or recognized as a top hospital by the US News & World Report. However, the majority of hospitals in the top tertile of troponin-only testing were not rated highly by Vizient (n = 15) or recognized as a top hospital by the US News & World Report (n = 16). The large majority of hospitals in the bottom tertile of troponin-only testing were not recognized as high-quality hospitals by Vizient (n = 32) or the US News & World Report (n = 31). Of the hospitals that improved their troponin-only testing during the study period, the majority were not recognized as high-quality hospitals by Vizient (n = 33) or the US News & World Report (n = 36), but among this group, those hospitals recognized by Vizient as high quality (n = 5) had the highest rate of troponin-only testing (57/100 patients). The differences in the rate of troponin-only testing across the different groups of hospitals and quality ratings were statistically significant (P < 0.0001; Table).
The Effect of Choosing Wisely® on Troponin-Only Testing
DISCUSSION
In the hospitals that demonstrated increasing adoption of troponin-only testing, there are several interesting patterns. First, among these hospitals, smaller hospitals tended to have higher overall rates of troponin-only testing per 100 patients than larger hospitals. Additionally, the hospitals with the highest rates were located in the Midwest region. These hospitals may be learning from and following the high-performing institutions observed in our data that are also located in the Midwest. Additionally, among the hospitals that significantly increased their rate of troponin-only testing, we see that the Choosing Wisely® recommendation appeared to facilitate accelerated adoption of troponin-only testing. In these institutions, it is likely that the impact of Choosing Wisely® was significant because there was attention to high-value care and already an existing movement underway to institute such high-value practices. For example, natural champions, leadership, infrastructure, and a supportive culture may all be prerequisites for Choosing Wisely® recommendations to become institutionally adopted.
Lastly, in the hospitals that have continued to order myoglobin and CK-MB, future work is needed to understand and overcome barriers to adopting high-value care practices.
There are several limitations to this study. First, because this was an observational study, we cannot prove a causal relationship between the Choosing Wisely® recommendation and the increased rates of troponin-only testing. Additionally, the Vizient CDB/RM contains reporting data for a limited number of academic medical centers only, and therefore, these results may not represent practices at nonacademic or even other academic medical centers. Our study only included patients with a principal discharge diagnosis of AMI because the Choosing Wisely® recommendation to order troponin-only is specific for diagnosing patients with AMI. However, it is possible that the Choosing Wisely® recommendation also has affected provider ordering in patients with diagnoses such as chest pain or angina, and these affects would not be captured in our study. Lastly, because instituting high-value care practices take time, our follow-up time may not have been long enough to capture improvement in troponin-only testing at institutions responding to and attempting to adhere to the Choosing Wisely® recommendation to order troponin-only testing for patients with AMI.
Disclosure
No other individuals besides the authors contributed to this work. This project was not funded or supported by any external grant or agency. Dr. Prochaska’s institute received funding from the Agency for Research Healthcare and Quality for a K12 Career Development Grant (AHRQ K12 HS023007) outside the submitted work. Dr. Hohmann and Dr Modes have nothing to disclose. Dr. Arora receives financial compensation as a member of the Board of Directors for the American Board of Internal Medicine and has received grant funding from the ABIM Foundation. She also receives royalties from McGraw Hill.
1. Pickering JW, Than MP, Cullen L, et al. Rapid rule-out of acute myocardial infarction with a single high-sensitivity cardiac troponin t measurement below the limit of detection: A collaborative meta-analysis. Ann Intern Med. 2017;166(10):715-724. PubMed
2. American Society for Clinical Pathology. Don’t test for myoglobin or CK-MB in the diagnosis of acute myocardial infarction (AMI). Instead, use troponin I or T. http://www.choosingwisely.org/clinician-lists/american-society-clinical-pathology-myoglobin-to-diagnose-acute-myocardial-infarction/. Accessed August 3, 2016.
3. Amsterdam EA, Wenger NK, Brindis RG, et al. 2014 AHA/ACC guideline for the management of patients with non–st-elevation acute coronary syndromes. Circulation. 2014;130(25):e344-e426. PubMed
4. Larochelle MR, Knight AM, Pantle H, Riedel S, Trost JC. Reducing excess cardiac biomarker testing at an academic medical center. J Gen Intern Med. 2014;29(11):1468-1474. PubMed
5. Le RD, Kosowsky JM, Landman AB, Bixho I, Melanson SEF, Tanasijevic MJ. Clinical and financial impact of removing creatine kinase-MB from the routine testing menu in the emergency setting. Am J Emerg Med. 2015;33(1):72-75. PubMed
6. Rosenberg A, Agiro A, Gottlieb M, et al. Early trends among seven recommendations from the choosing wisely campaign. JAMA Intern Med. 2015;175(12):1913. PubMed
7. Wolfson DB. Choosing Wisely recommendations using administrative claims data. JAMA Intern Med. 2016;176(4):565-565. PubMed
8. Thygesen K, Alpert JS, Jaffe AS, Simoons ML, Chaitman BR, White HD. Third universal definition of myocardial infarction. Circulation. 2012;126(16):2020-2035. PubMed
9. US News & World Report. Best hospitals for cardiology & heart surgery. http://health.usnews.com/best-hospitals/rankings/cardiology-and-heart-surgery. Accessed April 19, 2017.
10. Bradley EH, Curry LA, Ramanadhan S, Rowe L, Nembhard IM, Krumholz HM. Research in action: using positive deviance to improve quality of health care. Implement Sci IS. 2009;4:25. PubMed
© 2017 Society of Hospital Medicine
Returns to Emergency Department, Observation, or Inpatient Care Within 30 Days After Hospitalization in 4 States, 2009 and 2010 Versus 2013 and 2014
Given the frequency, potential preventability, and costs associated with hospital readmissions, reducing readmissions is a priority in efforts to improve the quality and value of healthcare.1,2 State and national bodies have created diverse initiatives to facilitate improvements in hospital discharge practices and reduce 30-day readmission rates across payers.3-5 For example, the Agency for Healthcare Research and Quality (AHRQ) and the Institute for Healthcare Improvement have published tools for improving discharge practices.6,7 Medicare instituted financial penalties for hospitals with higher-than-expected readmission rates for acute myocardial infarction (AMI), heart failure (HF), and pneumonia in 2012, while private payers and Medicaid programs have established their own policies.8-13 Furthermore, private payers and Medicaid programs shifted toward capitated and value-based reimbursement models in which readmissions lead to financial losses for hospitals.14,15 Accordingly, hospitals have implemented diverse interventions to reduce readmissions.16,17 From 2009 to 2013, 30-day readmissions declined among privately insured adults (from 12.4% to 11.7%), Medicare patients (from 22.0% to 20.0%), and uninsured individuals (11.5% to 11.0%) but climbed among patients with Medicaid (from 19.8% to 20.5%) after index admissions for AMI, HF, pneumonia, or chronic obstructive pulmonary disease.18
To date, research, policies, and quality improvement interventions have largely focused on improvements to one aspect of the system of care—that provided in the inpatient setting—among older adults with Medicare. Yet, inpatient readmissions may underestimate how often patients return to the hospital because patients can be placed under observation or stabilized and discharged from the emergency department (ED) instead of being readmitted. Observation and ED visits are less costly to payers than inpatient admissions.19 Thus, information about utilization of inpatient, observation, and ED visits within 30 days of hospital discharge may be more informative than inpatient readmissions alone. However, little is known about trends in returns to the hospital for observation and ED visits and whether such trends vary by payer.
Our objective was to assess whether changes have occurred in rates of total 30-day, all-cause, unplanned returns to the hospital among adults with index admissions for AMI, HF, and pneumonia in which returns to the hospital included inpatient readmissions, observation visits, and ED visits. We also assessed whether changes in the rate of hospital inpatient readmissions coincided with changes in rates of returns for ED or observation visits. To examine the effects of readmission policies implemented by diverse payers and broad changes to the health system following the Affordable Care Act, we compared data from 201 hospitals in 4 states in 2009 and 2010 with data from the same hospitals for 2013 and 2014.
METHODS
Data Sources, Populations, and Study Variables
We used Healthcare Cost and Utilization Project (HCUP) State Inpatient Databases, State Emergency Department Databases, and State Ambulatory Surgery and Services Databases from Georgia, Nebraska, South Carolina, and Tennessee. These states comprise 7% of the US population and were the only states with data that included all observation and ED visits as well as encrypted patient identification numbers that permitted linkage across facilities and hospitals.20
Index admissions for patients aged 18 years and older were eligible if they occurred at nonfederal general medical/surgical hospitals (excluding critical access hospitals) that had at least 1 index admission per target condition per year and at least 5 inpatient, observation, and ED visits for any condition per year.
We classified patients into the following 4 populations by age and insurance coverage: 18 to 64 years with private insurance, 65 years and older with Medicare (excluding younger adults with Medicare), 18 to 64 years with Medicaid, and 18 to 64 years without insurance. We identified patients aged 65 years and older with Medicare by using the primary or secondary expected payer for the index admission. This group included patients who were dually eligible for Medicare and Medicaid. If Medicare was not the primary or secondary payer, we used the primary payer to identify Medicaid, privately insured, and uninsured patients aged 18 to 64 years. None of the states expanded Medicaid coverage during the years studied.
The primary outcome of interest was the rate of having 1 or more all-cause, unplanned return(s) to an acute care hospital within 30 days of discharge after an index admission for AMI, HF, and pneumonia as defined by a modified version of Centers for Medicare & Medicaid Services’ readmission metrics.21,22 We examined total return rates as well as rates for inpatient, observation, and ED care. We also examined the leading diagnoses associated with returns to the hospital. For each index admission, we included only 1 return visit, giving priority to inpatient readmissions, then observation visits, and then ED visits.
The HCUP databases are consistent with the definition of limited data sets under the Health Insurance Portability and Accountability Act Privacy Rule and contain no direct patient identifiers. The AHRQ Institutional Review Board considers research using HCUP data to have exempt status.
Statistical Analysis
To compare rates at which patients returned to the hospital during 2 cohort periods (2009 and 2010 vs 2013 and 2014), we used coarsened exact matching, a well-established matching technique for balancing covariates between 2 populations of patients that may be related to the outcome.23 For observational datasets, coarsened exact matching is preferable to traditional matching because it enables the investigator to assess balance between the 2 populations, select the desired degree of balance, and eliminate observations for which comparable matches cannot be found.
We assembled sets of index admissions in each study period that were similar with respect to payer, primary diagnosis, and other factors. Matching variables included the patient’s age group, sex, and Elixhauser Comorbidity Index24 (in deciles), as well as the hospital’s ratio of observation visits relative to inpatient admissions in 2009 and 2010 combined (in quartiles; see supplementary Appendix). For Medicare beneficiaries, we also matched on dual enrollment in Medicaid.
We conducted the matching process separately for each target condition and payer population. First, we grouped index admissions in both periods into strata defined by all possible combinations of the matching variables and allowing one-to-many random matching within strata. We then dropped records in any strata for which there were no records in 1 of the time periods. Finally, we calculated weights based on the size of each stratum. We used these weights to account for the different numbers of index admissions in each stratum between the 2 study periods. For example, if a stratum contained 10 index admissions in 2009 and 2010 combined and 20 in 2013 and 2014 combined, an admission weighed double in the earlier period. After weighting, the index admissions in each period (2009 and 2010; 2013 and 2014) had similar characteristics (Table 1).
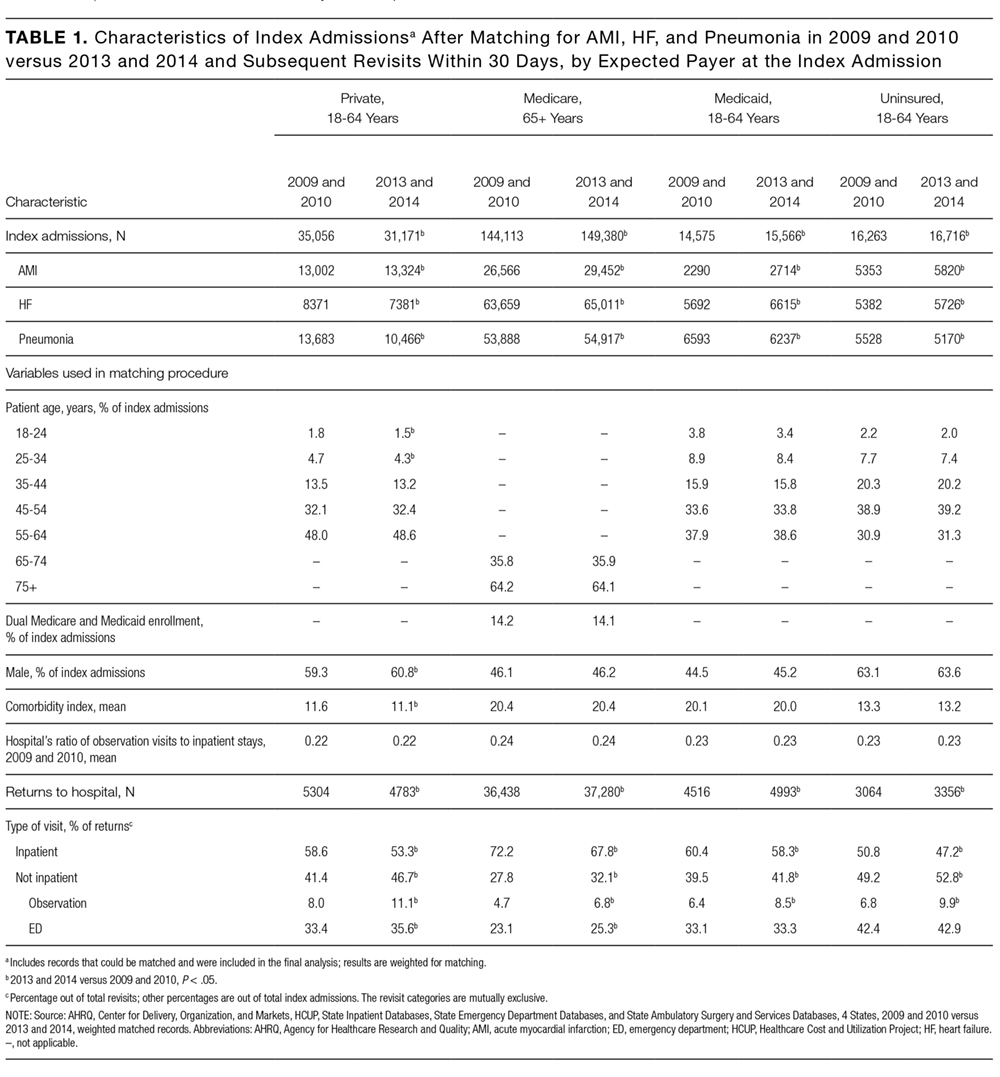
RESULTS
There were 423,503 eligible index admissions for AMI, HF, and pneumonia in the 2 periods combined; 422,840 (99.8%) were successfully matched and included in this analysis. After matching weights were applied, there were few statistically significant differences across the 2 time periods (see Table 1 and supplementary Appendix).
From 2009 and 2010 to 2013 and 2014, the percentage of patients hospitalized for AMI, HF, and pneumonia who had only observation or ED visits when they returned to the hospital increased from 41.4% to 46.7% among patients with private insurance (P < 0.001), from 27.8% to 32.1% among older patients with Medicare (P < 0.001), from 39.5% to 41.8% among patients with Medicaid (P = 0.03), and from 49.2% to 52.8% among patients without insurance (P = 0.004; Table 1). The percentage of returns to the hospital for observation increased across all payers (P < 0.001); in 2013 and 2014 combined, observation visits ranged from 6.8% of hospital returns among patients with Medicare to 11.1% among patients with private insurance. The percentage of returns to the hospital for an ED visit increased among patients with private insurance (P = 0.02) and Medicare (P < 0.001); in 2013 and 2014, ED visits ranged from 25.3% of returns to the hospital among patients with Medicare to 42.9% among uninsured patients.
The increases in 30-day observation and ED visits coincided with reductions in inpatient readmissions among patients with private insurance and Medicare and contributed to growth in total returns to the hospital among patients with Medicaid or no insurance (Figure 1).
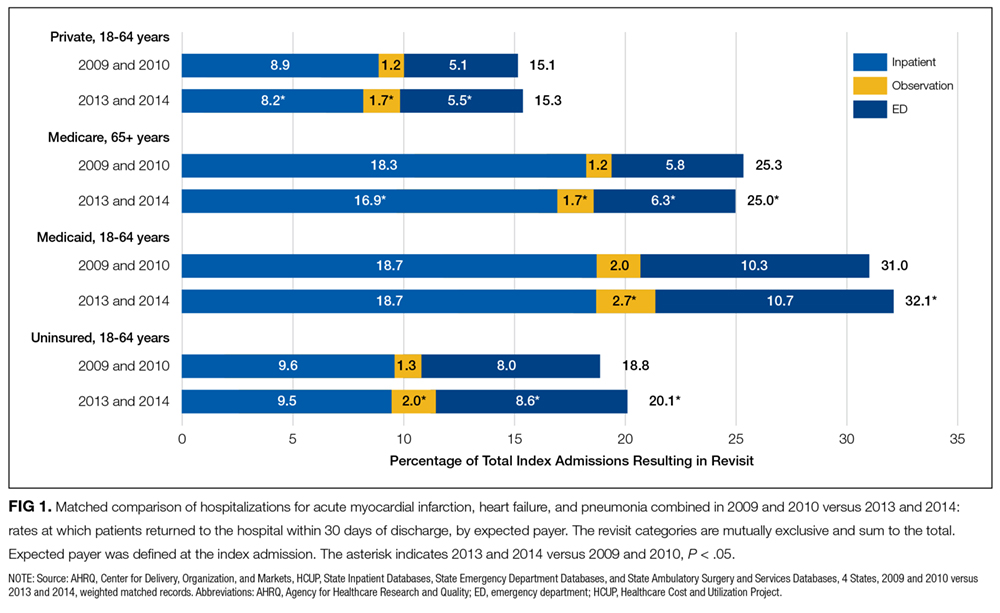
Figure 2
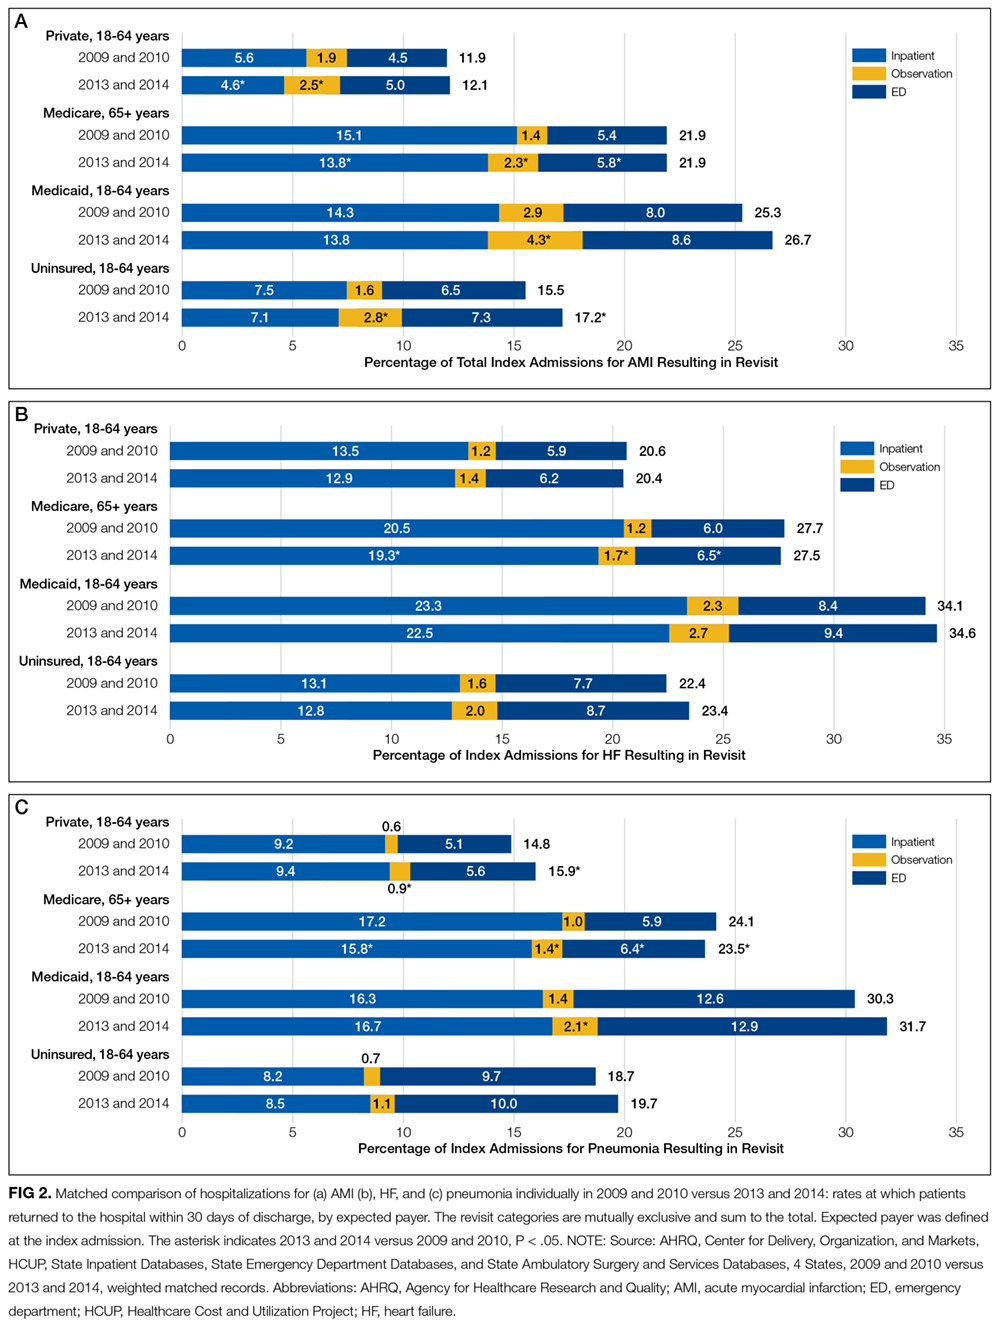
Patients initially hospitalized for HF and pneumonia who returned to the hospital within 30 days often returned for the same conditions (Table 2).
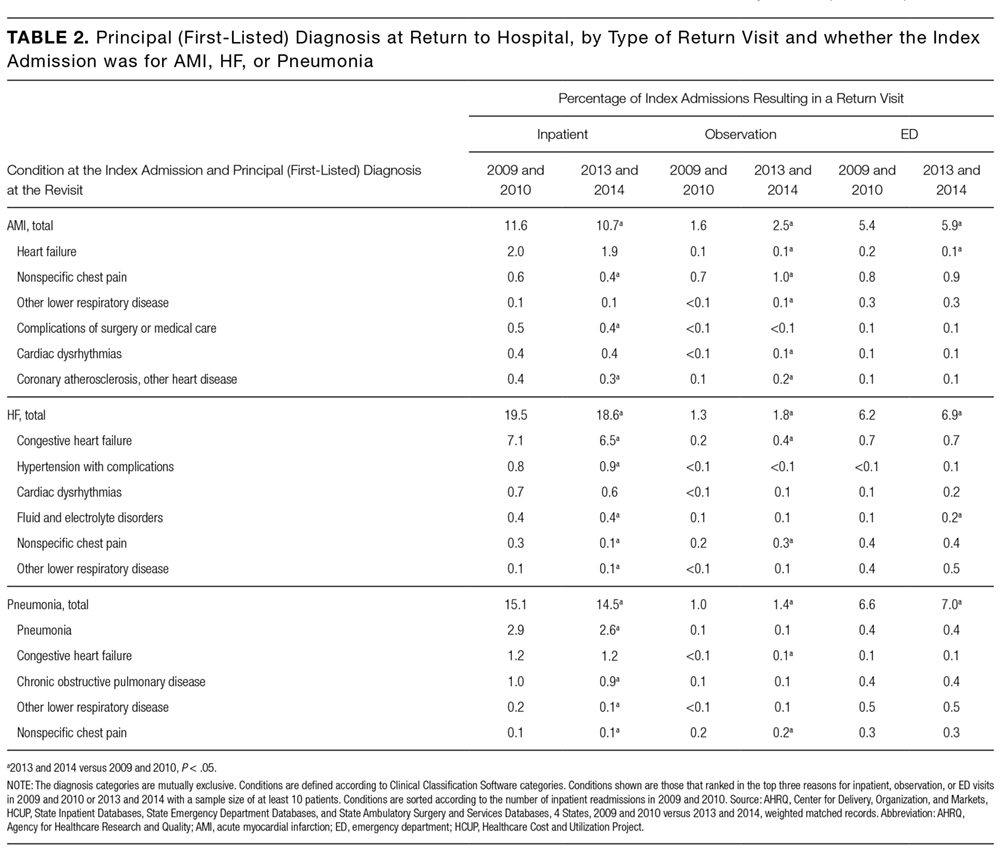
DISCUSSION
Matching index admissions for AMI, HF, or pneumonia in 201 hospitals in 2009 and 2010 with those in 2013 and 2014, we observed that increases in observation and ED visits coincided with reductions in inpatient readmissions among patients with private insurance and Medicare and contributed to growth in total returns to the hospital among patients with Medicaid or no insurance. Among patients with private insurance and Medicare, inpatient readmissions declined significantly for all 3 target conditions, but total returns to the hospital remained constant for AMI and HF, rose for privately insured patients with pneumonia, and declined modestly for Medicare patients with pneumonia. Inpatient readmissions were unchanged for adults aged 18 to 64 years with Medicaid or no insurance, but total returns to the hospital increased significantly, reaching 32% among those with Medicaid.
These findings add to recent literature, which has primarily emphasized inpatient readmissions among Medicare beneficiaries with several exceptions. A prior analysis indicates that readmissions have declined among diverse payer populations nationally.18 Gerhardt et al25 found that from 2011 to 2012, all-cause 30-day readmissions declined among fee-for-service (FFS) Medicare beneficiaries following any index admission, while ED revisits remained stable and observation revisits increased slightly. Evaluating the CMS Hospital Readmission Reductions Program (HRRP), Zuckerman et al17 reported that from 2007 to 2015, inpatient readmissions declined among FFS Medicare beneficiaries aged 65 years and older who were hospitalized with AMI, HF, or pneumonia, while returns to the hospital for observation rose approximately 2%; ED visits were not included. We found that Medicare (FFS and Medicare Advantage) patients with AMI and HF returned to the hospital with the same frequency in 2009 and 2010 as in 2013 and 2014, and those patients with pneumonia returned slightly less often. In aggregate, declines in inpatient readmissions in the 4 states we studied coincided with increases in observation and ED care. Moreover, these shifts occurred not only among Medicare beneficiaries but also among privately insured adults, Medicaid recipients, and the uninsured.
Three factors may have contributed to these apparent shifts from readmissions to observation and ED visits. First, some authors have suggested that hospitals may reduce readmissions by intentionally placing some of the patients who return to the hospital under observation instead of admitting them.17,26 If true, hospitals with greater declines in readmissions would have larger increases in observation revisits. Zuckerman et al17 found no correlation among Medicare beneficiaries between hospital-level trends in observation revisits and readmissions, but returns to observation rose more rapidly for AMI, HF, and pneumonia (compared with other conditions) during long term follow-up than during the HRRP implementation period. Other authors have documented that declines in readmissions have been greatest at hospitals with the highest baseline readmission rates,27,28 and hospitals with lower readmission rates have more observation return visits.29
Second, shifts from inpatient readmissions to return visits for observation may reflect unintentional rather than intentional changes in the services provided. Clinical practice patterns are evolving such that patients who present to the hospital for acute care increasingly are placed under observation or discharged from the ED instead of being admitted, regardless of whether they recently were hospitalized.30 Inpatient admissions, which are strongly correlated with readmission rates,28,31 are declining nationally,32 and both observation and ED visits are rising.33-35 Although little is known about effects on health outcomes and patient out-of-pocket costs,shifts from inpatient admissions to observation and ED visits reduce costs to payers.36,37
Third, instead of substitution, more patients may be returning for lower-acuity conditions that can be treated in the ED or under observation. Hospitals are implementing diverse and multifaceted interventions to reduce readmissions that can involve assessing patient needs and the risk for readmission, educating patients about self-care and risks after discharge, reconciling medication, scheduling follow-up visits, and monitoring patients through telephone calls and home nursing visits.26,38,39 Although the intent may be to reduce patients’ need to return to the hospital, interventions that educate patients about risks after discharge may lower the threshold at which they find symptoms worrisome enough to return. This could increase lower-acuity return visits. We found that reasons for returning were similar in 2009 and 2010 versus 2013 and 2014, but we did not examine acuity of illness at the time of return.
Other areas of concern are the high rates at which Medicaid patients are returning to the hospital and the increases in rates of returns among Medicaid patients and the uninsured. Individuals in these disadvantaged populations may be having difficulty accessing ambulatory care or may be turning to the ED more often for lower acuity problems that arise after discharge. In 3 of the 4 states we studied, 15% to 16% of adults live in poverty and 10% to 30% live in primary care health professional shortage areas.40,41 Given the implications for patient outcomes and costs, trends among these populations warrant further scrutiny.42,43
This analysis has several limitations. Data were from 4 states, but trends in readmissions are similar nationally. From 2010 through 2015, the all-condition readmission rate declined by 8% among Medicare beneficiaries nationally and by 6.1% in South Carolina, 7.4% in Georgia, 8.3% in Nebraska, and 8.7% in Tennessee.44 We report trends across hospitals and did not examine hospital-level revisits. Therefore, further research is needed to determine whether these findings are related to co-occurring trends, intentional substitution, or other factors.
In conclusion, measuring inpatient readmissions without accounting for return visits to the ED and observation underestimates the rate at which patients return to the hospital following an inpatient hospitalization. Because of growth in observation and ED visits, trends in the total rates at which patients return to the hospital can differ from trends in inpatient readmissions. In the 4 states we studied, total return rates were particularly high and rising among patients with Medicaid and lower, but also rising, among the uninsured. Policy analysts and researchers should investigate the factors contributing to growth in readmissions in these vulnerable populations and determine whether similar trends are occurring nationwide. Hospitalists play critical roles in admitting and discharging inpatients, caring for patients under observation, and implementing quality improvement programs. Irrespective of payer, hospitalists’ efforts to improve the quality and value of care should include observation and ED visits as well as inpatient readmissions.
Acknowledgments
The authors gratefully acknowledge Minya Sheng, M.S. (Truven Health Analytics) for assistance in programming and data management and Linda Lee, Ph.D. (Truven Health Analytics) for providing editorial review of the manuscript. We also wish to acknowledge the 4 HCUP Partner organizations that contributed to the HCUP State Databases used in this study: Georgia Hospital Association, Nebraska Hospital Association, South Carolina Revenue and Fiscal Affairs Office, and Tennessee Hospital Association.
Disclosure
Funding for this study was provided by the AHRQ Center for Delivery, Organization, and Markets, HCUP (Contract No. HHSA-290-2013-00002-C). The views expressed in this article are those of the authors and do not necessarily reflect those of the AHRQ or the U.S. Department of Health and Human Services. The authors have no conflicts of interest or financial disclosures to declare.
1. Jencks SF, Williams MV, Coleman EA. Rehospitalizations among patients in the Medicare fee-for-service program. N Engl J Med. 2009;360(14):1418-1428. PubMed
2. Lum HD, Studenski SA, Degenholtz HB, Hardy SE. Early hospital readmission is a predictor of one-year mortality in community-dwelling older Medicare beneficiaries. J Gen Intern Med. 2012;27(11):1467-1474. PubMed
3. Peach State Health Plan. New Peach State Health Plan 30-Day Readmission Payment Policy. https://www.pshpgeorgia.com/newsroom/30-day-readmission-payment-policy.html . Accessed September 26, 2017.
4. Axon RN, Cole L, Moonan A, et al. Evolution and Initial Experience of a Statewide Care Transitions Quality Improvement Collaborative: Preventing Avoidable Readmissions Together. Popul Health Manag. 2016 Feb;19(1):4-10. PubMed
5. Nebraska Hospital Association. Quality and Safety. http://www.nebraskahospitals.org/quality_and_safety/qs_home.html. Accessed July 25, 2017.
6. Agency for Healthcare Research and Quality. Re-Engineered Discharge (RED) Toolkit. http://www.ahrq.gov/professionals/systems/hospital/red/toolkit/index.html. Accessed July 25, 2017.
7. Institute for Healthcare Improvement. Readmissions. http://www.ihi.org/Topics/Readmissions/Pages/default.aspx. Accessed July 25, 2017.
8. Centers for Medicare & Medicaid Services (CMS). Readmissions Reduction Program (HRRP). https://www.cms.gov/medicare/medicare-fee-for-service-payment/acuteinpatientpps/readmissions-reduction-program.html. Accessed July 19, 2016.
9. Polinski JM, Moore JM, Kyrychenko P, et al. An insurer’s care transition program emphasizes medication reconciliation, reduces readmissions and costs. Health Aff (Millwood). 2016;35(7):1222-1229. PubMed
10. BlueCross BlueShield. Highmark’s Quality Blue Program helps hospitals reduce readmissions and infections for members. http://www.bcbs.com/healthcare-news/plans/highmark-quality-blue-program-helps-hospitals-reduce-readmissions-and-infections-for-members.html. Accessed November 7, 2016.
11. Agency for Healthcare Research and Quality (AHRQ). Designing and delivering whole-person transitional care: the hospital guide to reducing Medicaid readmissions. Rockville, MD: AHRQ; September 2016. AHRQ Pub. No. 16-0047-EF. http://www.ahrq.gov/sites/default/files/wysiwyg/professionals/systems/hospital/medicaidreadmitguide/medicaidreadmissions.pdf. Accessed March 15, 2017.
12. Aetna. Aetna, Genesis HealthCare take aim at preventing hospital readmissions. https://news.aetna.com/news-releases/aetna-genesis-healthcare-take-aim-at-preventing-hospital-readmissions/. Accessed November 7, 2016.
13. Molina Healthcare. Medical Management Program.http://www.molinahealthcare.com/providers/wi/medicaid/manual/PDF/manual_WI_19_Medical_Management.pdf. Accessed March 15, 2017.
14. Kaiser Family Foundation. Total Medicaid MCOs. State health facts, 2016. http://kff.org/other/state-indicator/total-medicaid-mcos/. Accessed July 19, 2016.
15. Muhlestein D, McClellan M. Accountable care organizations in 2016: private and public-sector growth and dispersion. Health Affairs blog. April 21, 2016. http://healthaffairs.org/blog/2016/04/21/accountable-care-organizations-in-2016-private-and-public-sector-growth-and-dispersion/. Accessed November 7, 2016.
16. Leppin AL, Gionfriddo MR, Kessler M, et al. Preventing 30-day hospital readmissions: a systematic review and meta-analysis of randomized trials. JAMA Intern Med. 2014;174(7):1095-1107. PubMed
17. Zuckerman RB, Sheingold SH, Orav EJ, Ruhter J, Epstein AM. Readmissions, observation, and the Hospital Readmissions Reduction Program. N Engl J Med. 2016;374(16):1543-1551. PubMed
18. Fingar KR, Washington R. Trends in hospital readmissions for four high-volume conditions, 2009–2013. Rockville, MD: Agency for Healthcare Research and Quality; November 2015. Statistical Brief No. 196. https://www.hcup-us.ahrq.gov/reports/statbriefs/sb196-Readmissions-Trends-High-Volume-Conditions.pdf. Accessed March 15, 2017.
19. Ross MA, Hockenberry JM, Mutter R, Barrett M, Wheatley M, Pitts SR. Protocol-driven emergency department observation units offer savings, shorter stays, and reduced admissions. Health Aff (Millwood). 2013;32(12):2149-2156. PubMed
20. Healthcare Cost and Utilization Project (HCUP). HCUP Databases. Rockville, MD: Agency for Healthcare Research and Quality; November 2016. www.hcup-us.ahrq.gov/databases.jsp. Accessed March 15, 2017.
21. QualityNet. Archived resources: readmission measures and measure methodology. https://www.qualitynet.org/dcs/ContentServer?cid=1228774371008&pagename=QnetPublic%2FPage%2FQnetTier4&c=Page. Accessed November 7, 2016.
22. Centers for Medicare & Medicaid Services. 2014 measures updates and specifications report: hospital-level 30-day risk-standardized readmission measures: acute myocardial infarction, heart failure, pneumonia, chronic obstructive pulmonary disease, stroke. March 2014. https://www.cms.gov/Medicare/Quality-Initiatives-Patient-Assessment-Instruments/HospitalQualityInits/Measure-Methodology.html. Accessed September 26, 2017.
23. Iacus SM, King G, Porro G. Causal inference without balance checking: coarsened exact matching. Political Analysis. 2012;20(1):1-24.
24. Moore BJ, White S, Washington R, Coenen N, Elixhauser A. Identifying increased risk of readmission and in-hospital mortality using hospital administrative data: The AHRQ Elixhauser Comorbidity Index. Med Care. 2017;55(7):698-705. PubMed
25. Gerhardt G, Yemane A, Apostle K, Oelschlaeger A, Rollins E, Brennan N. Evaluating whether changes in utilization of hospital outpatient services contributed to lower Medicare readmission rate. Medicare Medicaid Res Rev. 2014;4(1):mmrr2014.004.01.b03. PubMed
26. Kripalani S, Theobald CN, Anctil B, Vasilevskis EE. Reducing hospital readmission rates: current strategies and future directions. Annu Rev Med. 2014;65:471-485. PubMed
27. Desai NR, Ross JS, Kwon JY, et al. Association between hospital penalty status under the hospital readmission reduction program and readmission rates for target and nontarget conditions. JAMA. 2016;316(24):2647-2656. PubMed
28. Epstein AM, Jha AK, Orav EJ. The relationship between hospital admission rates and rehospitalizations. N Engl J Med. 2011;365(24):2287-2295. PubMed
29. Venkatesh AK, Wang C, Ross JS, et al. Hospital use of observation stays: cross sectional study of the impact on readmission rates. Med Care. 2016;54(12)1070-1077. PubMed
30. Nuckols TK, Fingar KR, Barrett M, Steiner CA, Stocks C, Owens PL. The shifting landscape in utilization of inpatient, observation, and emergency department Services Across Payers. J Hosp Med. 2017;12(6):443-446. PubMed
31. Dharmarajan K, Qin L, Lin Z, et al. Declining admission rates and thirty-day readmission rates positively associated even though patients grew sicker over time. Health Aff (Millwood). 2016;35(7):1294-1302. PubMed
32. Grube M, Kaufman K, York R. Decline in utilization rates signals a change in the inpatient business model. Health Affairs blog. March 8, 2013. http://healthaffairs.org/blog/2013/03/08/decline-in-utilization-rates-signals-a-change-in-the-inpatient-business-model/. Accessed November 7, 2016.
33. Feng Z, Wright B, Mor V. Sharp rise in Medicare enrollees being held in hospitals for observation raises concerns about causes and consequences. Health Aff (Millwood). 2012;31(6):1251-1259. PubMed
34. Venkatesh AK, Geisler BP, Gibson Chambers JJ, et al. Use of observation care in US emergency departments, 2001 to 2008. PLoS One. 2011;6(9):e24326. PubMed
35. Schuur JD, Venkatesh AK. The growing role of emergency departments in hospital admissions. N Engl J Med. 2012;367(5):391-393. PubMed
36. Kangovi S, Cafardi SG, Smith RA, Kulkarni R, Grande D. Patient financial responsibility for observation care. J Hosp Med. 2015;10(11):718-723. PubMed
37. Doyle BJ, Ettner SL, Nuckols TK. Supplemental insurance reduces out-of-pocket costs in Medicare observation services. J Hosp Med. 2016;11(7):502-504. doi:10.1002/jhm.2588. PubMed
38. Hansen LO, Young RS, Hinami K, Leung A, Williams MV. Interventions to reduce 30-day rehospitalization: a systematic review. Ann Intern Med. 2011;155(8):520-528. PubMed
39. Bradley EH, Curry L, Horwitz LI, et al. Hospital strategies associated with 30-day readmission rates for patients with heart failure. Circ Cardiovasc Qual Outcomes. 2013;6(4):444-450. PubMed
40. US Census Bureau. American Fact Finder: community facts. http://factfinder.census.gov/faces/nav/jsf/pages/index.xhtml. Accessed November 1, 2016.
41. Van Vleet A, Paradise J. Tapping nurse practitioners to meet rising demand for primary care. Kaiser Family Foundation Issue Brief. January 20, 2015. http://kff.org/medicaid/issue-brief/tapping-nurse-practitioners-to-meet-rising-demand-for-primary-care/. Accessed November 7, 2016.
42. Agency for Healthcare Research and Quality (AHRQ). Hospital guide to reducing Medicaid readmissions. Rockville, MD: AHRQ; August 2014. AHRQ Publication No. 14-0050-EF. http://www.ahrq.gov/sites/default/files/publications/files/medreadmissions.pdf. Accessed March 15, 2017.
43. Boccuti C, Casillas G. Aiming for fewer hospital U-turns: The Medicare Hospital Readmissions Reduction Program. Kaiser Family Foundation Issue Brief. March 10, 2017. http://kff.org/medicare/issue-brief/aiming-for-fewer-hospital-u-turns-the-medicare-hospital-readmission-reduction-program/. Accessed November 7, 2016.
44. Conway P, Gronniger T. New data: 49 states plus DC reduce avoidable hospital readmissions. Centers for Medicare & Medicaid Services blog. September 13, 2016. http://medtecheng.com/new-data-49-states-plus-dc-reduce-avoidable-hospital-readmissions/. Accessed September 26, 2017.
Given the frequency, potential preventability, and costs associated with hospital readmissions, reducing readmissions is a priority in efforts to improve the quality and value of healthcare.1,2 State and national bodies have created diverse initiatives to facilitate improvements in hospital discharge practices and reduce 30-day readmission rates across payers.3-5 For example, the Agency for Healthcare Research and Quality (AHRQ) and the Institute for Healthcare Improvement have published tools for improving discharge practices.6,7 Medicare instituted financial penalties for hospitals with higher-than-expected readmission rates for acute myocardial infarction (AMI), heart failure (HF), and pneumonia in 2012, while private payers and Medicaid programs have established their own policies.8-13 Furthermore, private payers and Medicaid programs shifted toward capitated and value-based reimbursement models in which readmissions lead to financial losses for hospitals.14,15 Accordingly, hospitals have implemented diverse interventions to reduce readmissions.16,17 From 2009 to 2013, 30-day readmissions declined among privately insured adults (from 12.4% to 11.7%), Medicare patients (from 22.0% to 20.0%), and uninsured individuals (11.5% to 11.0%) but climbed among patients with Medicaid (from 19.8% to 20.5%) after index admissions for AMI, HF, pneumonia, or chronic obstructive pulmonary disease.18
To date, research, policies, and quality improvement interventions have largely focused on improvements to one aspect of the system of care—that provided in the inpatient setting—among older adults with Medicare. Yet, inpatient readmissions may underestimate how often patients return to the hospital because patients can be placed under observation or stabilized and discharged from the emergency department (ED) instead of being readmitted. Observation and ED visits are less costly to payers than inpatient admissions.19 Thus, information about utilization of inpatient, observation, and ED visits within 30 days of hospital discharge may be more informative than inpatient readmissions alone. However, little is known about trends in returns to the hospital for observation and ED visits and whether such trends vary by payer.
Our objective was to assess whether changes have occurred in rates of total 30-day, all-cause, unplanned returns to the hospital among adults with index admissions for AMI, HF, and pneumonia in which returns to the hospital included inpatient readmissions, observation visits, and ED visits. We also assessed whether changes in the rate of hospital inpatient readmissions coincided with changes in rates of returns for ED or observation visits. To examine the effects of readmission policies implemented by diverse payers and broad changes to the health system following the Affordable Care Act, we compared data from 201 hospitals in 4 states in 2009 and 2010 with data from the same hospitals for 2013 and 2014.
METHODS
Data Sources, Populations, and Study Variables
We used Healthcare Cost and Utilization Project (HCUP) State Inpatient Databases, State Emergency Department Databases, and State Ambulatory Surgery and Services Databases from Georgia, Nebraska, South Carolina, and Tennessee. These states comprise 7% of the US population and were the only states with data that included all observation and ED visits as well as encrypted patient identification numbers that permitted linkage across facilities and hospitals.20
Index admissions for patients aged 18 years and older were eligible if they occurred at nonfederal general medical/surgical hospitals (excluding critical access hospitals) that had at least 1 index admission per target condition per year and at least 5 inpatient, observation, and ED visits for any condition per year.
We classified patients into the following 4 populations by age and insurance coverage: 18 to 64 years with private insurance, 65 years and older with Medicare (excluding younger adults with Medicare), 18 to 64 years with Medicaid, and 18 to 64 years without insurance. We identified patients aged 65 years and older with Medicare by using the primary or secondary expected payer for the index admission. This group included patients who were dually eligible for Medicare and Medicaid. If Medicare was not the primary or secondary payer, we used the primary payer to identify Medicaid, privately insured, and uninsured patients aged 18 to 64 years. None of the states expanded Medicaid coverage during the years studied.
The primary outcome of interest was the rate of having 1 or more all-cause, unplanned return(s) to an acute care hospital within 30 days of discharge after an index admission for AMI, HF, and pneumonia as defined by a modified version of Centers for Medicare & Medicaid Services’ readmission metrics.21,22 We examined total return rates as well as rates for inpatient, observation, and ED care. We also examined the leading diagnoses associated with returns to the hospital. For each index admission, we included only 1 return visit, giving priority to inpatient readmissions, then observation visits, and then ED visits.
The HCUP databases are consistent with the definition of limited data sets under the Health Insurance Portability and Accountability Act Privacy Rule and contain no direct patient identifiers. The AHRQ Institutional Review Board considers research using HCUP data to have exempt status.
Statistical Analysis
To compare rates at which patients returned to the hospital during 2 cohort periods (2009 and 2010 vs 2013 and 2014), we used coarsened exact matching, a well-established matching technique for balancing covariates between 2 populations of patients that may be related to the outcome.23 For observational datasets, coarsened exact matching is preferable to traditional matching because it enables the investigator to assess balance between the 2 populations, select the desired degree of balance, and eliminate observations for which comparable matches cannot be found.
We assembled sets of index admissions in each study period that were similar with respect to payer, primary diagnosis, and other factors. Matching variables included the patient’s age group, sex, and Elixhauser Comorbidity Index24 (in deciles), as well as the hospital’s ratio of observation visits relative to inpatient admissions in 2009 and 2010 combined (in quartiles; see supplementary Appendix). For Medicare beneficiaries, we also matched on dual enrollment in Medicaid.
We conducted the matching process separately for each target condition and payer population. First, we grouped index admissions in both periods into strata defined by all possible combinations of the matching variables and allowing one-to-many random matching within strata. We then dropped records in any strata for which there were no records in 1 of the time periods. Finally, we calculated weights based on the size of each stratum. We used these weights to account for the different numbers of index admissions in each stratum between the 2 study periods. For example, if a stratum contained 10 index admissions in 2009 and 2010 combined and 20 in 2013 and 2014 combined, an admission weighed double in the earlier period. After weighting, the index admissions in each period (2009 and 2010; 2013 and 2014) had similar characteristics (Table 1).
RESULTS
There were 423,503 eligible index admissions for AMI, HF, and pneumonia in the 2 periods combined; 422,840 (99.8%) were successfully matched and included in this analysis. After matching weights were applied, there were few statistically significant differences across the 2 time periods (see Table 1 and supplementary Appendix).
From 2009 and 2010 to 2013 and 2014, the percentage of patients hospitalized for AMI, HF, and pneumonia who had only observation or ED visits when they returned to the hospital increased from 41.4% to 46.7% among patients with private insurance (P < 0.001), from 27.8% to 32.1% among older patients with Medicare (P < 0.001), from 39.5% to 41.8% among patients with Medicaid (P = 0.03), and from 49.2% to 52.8% among patients without insurance (P = 0.004; Table 1). The percentage of returns to the hospital for observation increased across all payers (P < 0.001); in 2013 and 2014 combined, observation visits ranged from 6.8% of hospital returns among patients with Medicare to 11.1% among patients with private insurance. The percentage of returns to the hospital for an ED visit increased among patients with private insurance (P = 0.02) and Medicare (P < 0.001); in 2013 and 2014, ED visits ranged from 25.3% of returns to the hospital among patients with Medicare to 42.9% among uninsured patients.
The increases in 30-day observation and ED visits coincided with reductions in inpatient readmissions among patients with private insurance and Medicare and contributed to growth in total returns to the hospital among patients with Medicaid or no insurance (Figure 1).
Figure 2
Patients initially hospitalized for HF and pneumonia who returned to the hospital within 30 days often returned for the same conditions (Table 2).
DISCUSSION
Matching index admissions for AMI, HF, or pneumonia in 201 hospitals in 2009 and 2010 with those in 2013 and 2014, we observed that increases in observation and ED visits coincided with reductions in inpatient readmissions among patients with private insurance and Medicare and contributed to growth in total returns to the hospital among patients with Medicaid or no insurance. Among patients with private insurance and Medicare, inpatient readmissions declined significantly for all 3 target conditions, but total returns to the hospital remained constant for AMI and HF, rose for privately insured patients with pneumonia, and declined modestly for Medicare patients with pneumonia. Inpatient readmissions were unchanged for adults aged 18 to 64 years with Medicaid or no insurance, but total returns to the hospital increased significantly, reaching 32% among those with Medicaid.
These findings add to recent literature, which has primarily emphasized inpatient readmissions among Medicare beneficiaries with several exceptions. A prior analysis indicates that readmissions have declined among diverse payer populations nationally.18 Gerhardt et al25 found that from 2011 to 2012, all-cause 30-day readmissions declined among fee-for-service (FFS) Medicare beneficiaries following any index admission, while ED revisits remained stable and observation revisits increased slightly. Evaluating the CMS Hospital Readmission Reductions Program (HRRP), Zuckerman et al17 reported that from 2007 to 2015, inpatient readmissions declined among FFS Medicare beneficiaries aged 65 years and older who were hospitalized with AMI, HF, or pneumonia, while returns to the hospital for observation rose approximately 2%; ED visits were not included. We found that Medicare (FFS and Medicare Advantage) patients with AMI and HF returned to the hospital with the same frequency in 2009 and 2010 as in 2013 and 2014, and those patients with pneumonia returned slightly less often. In aggregate, declines in inpatient readmissions in the 4 states we studied coincided with increases in observation and ED care. Moreover, these shifts occurred not only among Medicare beneficiaries but also among privately insured adults, Medicaid recipients, and the uninsured.
Three factors may have contributed to these apparent shifts from readmissions to observation and ED visits. First, some authors have suggested that hospitals may reduce readmissions by intentionally placing some of the patients who return to the hospital under observation instead of admitting them.17,26 If true, hospitals with greater declines in readmissions would have larger increases in observation revisits. Zuckerman et al17 found no correlation among Medicare beneficiaries between hospital-level trends in observation revisits and readmissions, but returns to observation rose more rapidly for AMI, HF, and pneumonia (compared with other conditions) during long term follow-up than during the HRRP implementation period. Other authors have documented that declines in readmissions have been greatest at hospitals with the highest baseline readmission rates,27,28 and hospitals with lower readmission rates have more observation return visits.29
Second, shifts from inpatient readmissions to return visits for observation may reflect unintentional rather than intentional changes in the services provided. Clinical practice patterns are evolving such that patients who present to the hospital for acute care increasingly are placed under observation or discharged from the ED instead of being admitted, regardless of whether they recently were hospitalized.30 Inpatient admissions, which are strongly correlated with readmission rates,28,31 are declining nationally,32 and both observation and ED visits are rising.33-35 Although little is known about effects on health outcomes and patient out-of-pocket costs,shifts from inpatient admissions to observation and ED visits reduce costs to payers.36,37
Third, instead of substitution, more patients may be returning for lower-acuity conditions that can be treated in the ED or under observation. Hospitals are implementing diverse and multifaceted interventions to reduce readmissions that can involve assessing patient needs and the risk for readmission, educating patients about self-care and risks after discharge, reconciling medication, scheduling follow-up visits, and monitoring patients through telephone calls and home nursing visits.26,38,39 Although the intent may be to reduce patients’ need to return to the hospital, interventions that educate patients about risks after discharge may lower the threshold at which they find symptoms worrisome enough to return. This could increase lower-acuity return visits. We found that reasons for returning were similar in 2009 and 2010 versus 2013 and 2014, but we did not examine acuity of illness at the time of return.
Other areas of concern are the high rates at which Medicaid patients are returning to the hospital and the increases in rates of returns among Medicaid patients and the uninsured. Individuals in these disadvantaged populations may be having difficulty accessing ambulatory care or may be turning to the ED more often for lower acuity problems that arise after discharge. In 3 of the 4 states we studied, 15% to 16% of adults live in poverty and 10% to 30% live in primary care health professional shortage areas.40,41 Given the implications for patient outcomes and costs, trends among these populations warrant further scrutiny.42,43
This analysis has several limitations. Data were from 4 states, but trends in readmissions are similar nationally. From 2010 through 2015, the all-condition readmission rate declined by 8% among Medicare beneficiaries nationally and by 6.1% in South Carolina, 7.4% in Georgia, 8.3% in Nebraska, and 8.7% in Tennessee.44 We report trends across hospitals and did not examine hospital-level revisits. Therefore, further research is needed to determine whether these findings are related to co-occurring trends, intentional substitution, or other factors.
In conclusion, measuring inpatient readmissions without accounting for return visits to the ED and observation underestimates the rate at which patients return to the hospital following an inpatient hospitalization. Because of growth in observation and ED visits, trends in the total rates at which patients return to the hospital can differ from trends in inpatient readmissions. In the 4 states we studied, total return rates were particularly high and rising among patients with Medicaid and lower, but also rising, among the uninsured. Policy analysts and researchers should investigate the factors contributing to growth in readmissions in these vulnerable populations and determine whether similar trends are occurring nationwide. Hospitalists play critical roles in admitting and discharging inpatients, caring for patients under observation, and implementing quality improvement programs. Irrespective of payer, hospitalists’ efforts to improve the quality and value of care should include observation and ED visits as well as inpatient readmissions.
Acknowledgments
The authors gratefully acknowledge Minya Sheng, M.S. (Truven Health Analytics) for assistance in programming and data management and Linda Lee, Ph.D. (Truven Health Analytics) for providing editorial review of the manuscript. We also wish to acknowledge the 4 HCUP Partner organizations that contributed to the HCUP State Databases used in this study: Georgia Hospital Association, Nebraska Hospital Association, South Carolina Revenue and Fiscal Affairs Office, and Tennessee Hospital Association.
Disclosure
Funding for this study was provided by the AHRQ Center for Delivery, Organization, and Markets, HCUP (Contract No. HHSA-290-2013-00002-C). The views expressed in this article are those of the authors and do not necessarily reflect those of the AHRQ or the U.S. Department of Health and Human Services. The authors have no conflicts of interest or financial disclosures to declare.
1. Jencks SF, Williams MV, Coleman EA. Rehospitalizations among patients in the Medicare fee-for-service program. N Engl J Med. 2009;360(14):1418-1428. PubMed
2. Lum HD, Studenski SA, Degenholtz HB, Hardy SE. Early hospital readmission is a predictor of one-year mortality in community-dwelling older Medicare beneficiaries. J Gen Intern Med. 2012;27(11):1467-1474. PubMed
3. Peach State Health Plan. New Peach State Health Plan 30-Day Readmission Payment Policy. https://www.pshpgeorgia.com/newsroom/30-day-readmission-payment-policy.html . Accessed September 26, 2017.
4. Axon RN, Cole L, Moonan A, et al. Evolution and Initial Experience of a Statewide Care Transitions Quality Improvement Collaborative: Preventing Avoidable Readmissions Together. Popul Health Manag. 2016 Feb;19(1):4-10. PubMed
5. Nebraska Hospital Association. Quality and Safety. http://www.nebraskahospitals.org/quality_and_safety/qs_home.html. Accessed July 25, 2017.
6. Agency for Healthcare Research and Quality. Re-Engineered Discharge (RED) Toolkit. http://www.ahrq.gov/professionals/systems/hospital/red/toolkit/index.html. Accessed July 25, 2017.
7. Institute for Healthcare Improvement. Readmissions. http://www.ihi.org/Topics/Readmissions/Pages/default.aspx. Accessed July 25, 2017.
8. Centers for Medicare & Medicaid Services (CMS). Readmissions Reduction Program (HRRP). https://www.cms.gov/medicare/medicare-fee-for-service-payment/acuteinpatientpps/readmissions-reduction-program.html. Accessed July 19, 2016.
9. Polinski JM, Moore JM, Kyrychenko P, et al. An insurer’s care transition program emphasizes medication reconciliation, reduces readmissions and costs. Health Aff (Millwood). 2016;35(7):1222-1229. PubMed
10. BlueCross BlueShield. Highmark’s Quality Blue Program helps hospitals reduce readmissions and infections for members. http://www.bcbs.com/healthcare-news/plans/highmark-quality-blue-program-helps-hospitals-reduce-readmissions-and-infections-for-members.html. Accessed November 7, 2016.
11. Agency for Healthcare Research and Quality (AHRQ). Designing and delivering whole-person transitional care: the hospital guide to reducing Medicaid readmissions. Rockville, MD: AHRQ; September 2016. AHRQ Pub. No. 16-0047-EF. http://www.ahrq.gov/sites/default/files/wysiwyg/professionals/systems/hospital/medicaidreadmitguide/medicaidreadmissions.pdf. Accessed March 15, 2017.
12. Aetna. Aetna, Genesis HealthCare take aim at preventing hospital readmissions. https://news.aetna.com/news-releases/aetna-genesis-healthcare-take-aim-at-preventing-hospital-readmissions/. Accessed November 7, 2016.
13. Molina Healthcare. Medical Management Program.http://www.molinahealthcare.com/providers/wi/medicaid/manual/PDF/manual_WI_19_Medical_Management.pdf. Accessed March 15, 2017.
14. Kaiser Family Foundation. Total Medicaid MCOs. State health facts, 2016. http://kff.org/other/state-indicator/total-medicaid-mcos/. Accessed July 19, 2016.
15. Muhlestein D, McClellan M. Accountable care organizations in 2016: private and public-sector growth and dispersion. Health Affairs blog. April 21, 2016. http://healthaffairs.org/blog/2016/04/21/accountable-care-organizations-in-2016-private-and-public-sector-growth-and-dispersion/. Accessed November 7, 2016.
16. Leppin AL, Gionfriddo MR, Kessler M, et al. Preventing 30-day hospital readmissions: a systematic review and meta-analysis of randomized trials. JAMA Intern Med. 2014;174(7):1095-1107. PubMed
17. Zuckerman RB, Sheingold SH, Orav EJ, Ruhter J, Epstein AM. Readmissions, observation, and the Hospital Readmissions Reduction Program. N Engl J Med. 2016;374(16):1543-1551. PubMed
18. Fingar KR, Washington R. Trends in hospital readmissions for four high-volume conditions, 2009–2013. Rockville, MD: Agency for Healthcare Research and Quality; November 2015. Statistical Brief No. 196. https://www.hcup-us.ahrq.gov/reports/statbriefs/sb196-Readmissions-Trends-High-Volume-Conditions.pdf. Accessed March 15, 2017.
19. Ross MA, Hockenberry JM, Mutter R, Barrett M, Wheatley M, Pitts SR. Protocol-driven emergency department observation units offer savings, shorter stays, and reduced admissions. Health Aff (Millwood). 2013;32(12):2149-2156. PubMed
20. Healthcare Cost and Utilization Project (HCUP). HCUP Databases. Rockville, MD: Agency for Healthcare Research and Quality; November 2016. www.hcup-us.ahrq.gov/databases.jsp. Accessed March 15, 2017.
21. QualityNet. Archived resources: readmission measures and measure methodology. https://www.qualitynet.org/dcs/ContentServer?cid=1228774371008&pagename=QnetPublic%2FPage%2FQnetTier4&c=Page. Accessed November 7, 2016.
22. Centers for Medicare & Medicaid Services. 2014 measures updates and specifications report: hospital-level 30-day risk-standardized readmission measures: acute myocardial infarction, heart failure, pneumonia, chronic obstructive pulmonary disease, stroke. March 2014. https://www.cms.gov/Medicare/Quality-Initiatives-Patient-Assessment-Instruments/HospitalQualityInits/Measure-Methodology.html. Accessed September 26, 2017.
23. Iacus SM, King G, Porro G. Causal inference without balance checking: coarsened exact matching. Political Analysis. 2012;20(1):1-24.
24. Moore BJ, White S, Washington R, Coenen N, Elixhauser A. Identifying increased risk of readmission and in-hospital mortality using hospital administrative data: The AHRQ Elixhauser Comorbidity Index. Med Care. 2017;55(7):698-705. PubMed
25. Gerhardt G, Yemane A, Apostle K, Oelschlaeger A, Rollins E, Brennan N. Evaluating whether changes in utilization of hospital outpatient services contributed to lower Medicare readmission rate. Medicare Medicaid Res Rev. 2014;4(1):mmrr2014.004.01.b03. PubMed
26. Kripalani S, Theobald CN, Anctil B, Vasilevskis EE. Reducing hospital readmission rates: current strategies and future directions. Annu Rev Med. 2014;65:471-485. PubMed
27. Desai NR, Ross JS, Kwon JY, et al. Association between hospital penalty status under the hospital readmission reduction program and readmission rates for target and nontarget conditions. JAMA. 2016;316(24):2647-2656. PubMed
28. Epstein AM, Jha AK, Orav EJ. The relationship between hospital admission rates and rehospitalizations. N Engl J Med. 2011;365(24):2287-2295. PubMed
29. Venkatesh AK, Wang C, Ross JS, et al. Hospital use of observation stays: cross sectional study of the impact on readmission rates. Med Care. 2016;54(12)1070-1077. PubMed
30. Nuckols TK, Fingar KR, Barrett M, Steiner CA, Stocks C, Owens PL. The shifting landscape in utilization of inpatient, observation, and emergency department Services Across Payers. J Hosp Med. 2017;12(6):443-446. PubMed
31. Dharmarajan K, Qin L, Lin Z, et al. Declining admission rates and thirty-day readmission rates positively associated even though patients grew sicker over time. Health Aff (Millwood). 2016;35(7):1294-1302. PubMed
32. Grube M, Kaufman K, York R. Decline in utilization rates signals a change in the inpatient business model. Health Affairs blog. March 8, 2013. http://healthaffairs.org/blog/2013/03/08/decline-in-utilization-rates-signals-a-change-in-the-inpatient-business-model/. Accessed November 7, 2016.
33. Feng Z, Wright B, Mor V. Sharp rise in Medicare enrollees being held in hospitals for observation raises concerns about causes and consequences. Health Aff (Millwood). 2012;31(6):1251-1259. PubMed
34. Venkatesh AK, Geisler BP, Gibson Chambers JJ, et al. Use of observation care in US emergency departments, 2001 to 2008. PLoS One. 2011;6(9):e24326. PubMed
35. Schuur JD, Venkatesh AK. The growing role of emergency departments in hospital admissions. N Engl J Med. 2012;367(5):391-393. PubMed
36. Kangovi S, Cafardi SG, Smith RA, Kulkarni R, Grande D. Patient financial responsibility for observation care. J Hosp Med. 2015;10(11):718-723. PubMed
37. Doyle BJ, Ettner SL, Nuckols TK. Supplemental insurance reduces out-of-pocket costs in Medicare observation services. J Hosp Med. 2016;11(7):502-504. doi:10.1002/jhm.2588. PubMed
38. Hansen LO, Young RS, Hinami K, Leung A, Williams MV. Interventions to reduce 30-day rehospitalization: a systematic review. Ann Intern Med. 2011;155(8):520-528. PubMed
39. Bradley EH, Curry L, Horwitz LI, et al. Hospital strategies associated with 30-day readmission rates for patients with heart failure. Circ Cardiovasc Qual Outcomes. 2013;6(4):444-450. PubMed
40. US Census Bureau. American Fact Finder: community facts. http://factfinder.census.gov/faces/nav/jsf/pages/index.xhtml. Accessed November 1, 2016.
41. Van Vleet A, Paradise J. Tapping nurse practitioners to meet rising demand for primary care. Kaiser Family Foundation Issue Brief. January 20, 2015. http://kff.org/medicaid/issue-brief/tapping-nurse-practitioners-to-meet-rising-demand-for-primary-care/. Accessed November 7, 2016.
42. Agency for Healthcare Research and Quality (AHRQ). Hospital guide to reducing Medicaid readmissions. Rockville, MD: AHRQ; August 2014. AHRQ Publication No. 14-0050-EF. http://www.ahrq.gov/sites/default/files/publications/files/medreadmissions.pdf. Accessed March 15, 2017.
43. Boccuti C, Casillas G. Aiming for fewer hospital U-turns: The Medicare Hospital Readmissions Reduction Program. Kaiser Family Foundation Issue Brief. March 10, 2017. http://kff.org/medicare/issue-brief/aiming-for-fewer-hospital-u-turns-the-medicare-hospital-readmission-reduction-program/. Accessed November 7, 2016.
44. Conway P, Gronniger T. New data: 49 states plus DC reduce avoidable hospital readmissions. Centers for Medicare & Medicaid Services blog. September 13, 2016. http://medtecheng.com/new-data-49-states-plus-dc-reduce-avoidable-hospital-readmissions/. Accessed September 26, 2017.
© 2017 Society of Hospital Medicine
Hospital Administrators’ Perspectives on Physician Engagement: A Qualitative Study
Disengaged physicians perform worse on multiple quality metrics and are more likely to make clinical errors.1,2 A growing body of literature has examined factors contributing to rising physician burnout, yet limited research has explored elements of physician engagement.3 Although some have described engagement as the polar opposite of burnout, addressing factors that contribute to burnout may not necessarily build physician engagement.4 The National Health Service (NHS) in the United Kingdom defines physician engagement as “the degree to which an employee is satisfied in their work, motivated to perform well, able to suggest and implement ideas for improvement, and their willingness to act as an advocate for their organization by recommending it as a place to work or be treated.”5
Few studies have attempted to document and interpret the variety of approaches that healthcare organizations have taken to identify and address this problem.6 The purpose of this study was to understand hospital administrators’ perspectives on issues related to physician engagement, including determinants of physician engagement, organizational efforts to improve physician engagement, and barriers to improving physician engagement.
METHODS
We conducted a qualitative study of hospital administrators by using an online anonymous questionnaire to explore perspectives on physician engagement. We used a convenience sample of hospital administrators affiliated with Vizient Inc. member hospitals. Vizient is the largest member-owned healthcare services company in the United States; and at the time of the study, it was composed of 1519 hospitals. Eligible hospital administrators included 2 hospital executive positions: Chief Medical Officers (CMOs) and Chief Quality Officers (CQOs). We chose to focus on CMOs and CQOs because their leadership roles overseeing physician employees may require them to address challenges with physician engagement.
The questionnaire focused on administrators’ perspectives on physician engagement, which we defined using the NHS definition stated above. Questions addressed perceived determinants of engagement, effective organizational efforts to improve engagement, and perceived barriers to improving engagement (supplementary Appendix 1). We included 2 yes/no questions and 4 open-ended questions. In May and June of 2016, we sent an e-mail to 432 unique hospital administrators explaining the purpose of the study and requested their participation through a hyperlink to an online questionnaire.
We used summary statistics to report results of yes/no questions and qualitative methods to analyze open-ended responses according to the principles of conventional content analysis, which avoids using preconceived categories and instead relies on inductive methods to allow categories to emerge from the data.7 Team members (T.J.R., K.O., and S.T.R.) performed close readings of responses and coded segments representing important concepts. Through iterative discussion, members of the research team reached consensus on the final code structure.
RESULTS
Our analyses focused on responses from 39 administrators that contained the most substantial qualitative information to the 4 open-ended questions included in the questionnaire. Among these respondents, 31 (79%) indicated that their hospital had surveyed physicians to assess their level of engagement, and 32 (82%) indicated that their hospital had implemented organizational efforts to improve physician engagement within the previous 3 years. Content analysis of open-ended responses yielded 5 themes that summarized perceived contributing factors to physician engagement: (1) physician-administration alignment, (2) physician input in decision-making, (3) appreciation of physician contributions, (4) communication between physicians and administration, and (5) hospital systems and workflow. In the Table, we present exemplary quotations for each theme and the question that prompted the quote.

DISCUSSION
Results of this study provide insight into administrators’ perspectives on organizational factors affecting physician engagement in hospital settings. The majority of respondents believed physician engagement was sufficiently important to survey physicians to assess their level of engagement and implement interventions to improve engagement. We identified several overarching themes that transcend individual questions related to the determinants of engagement, organizational efforts to improve engagement, and barriers to improving engagement. Many responses focused on the relationship between administrators and physicians. Administrators in our study may also have backgrounds as physicians, providing them with a unique perspective on the importance of this relationship.
The evolution of healthcare over the past several decades has shifted power dynamics away from autonomous physician practices, particularly in hospital settings.8 Our study suggests that hospital administrators recognize the potential impact these changes have had on physician engagement and are attempting to address the detrimental effects. Furthermore, administrators acknowledged the importance of organization-directed solutions to address problems with physician morale. This finding represents a paradigm shift away from previous approaches that involved interventions directed at individual physicians.9
Our results represent a call to action for both physicians and administrators to work together to develop organizational solutions to improve physician engagement. Further research is needed to investigate the most effective ways to improve and sustain engagement. At a time when physicians are increasingly dissatisfied with their current work, understanding how to improve physician engagement is critical to maintaining a healthy and productive physician workforce.
Disclosure
Will Dardani is an employee of Vizient Inc. No other authors have conflicts of interest to declare.
1. West MA, Dawson JF. Employee engagement and NHS performance. https://www.kingsfund.org.uk/sites/default/files/employee-engagement-nhs-performance-west-dawson-leadership-review2012-paper.pdf. Accessed July 9, 2017
2. Prins JT, Hoekstra-Weebers JE, Gazendam-Donofrio SM, et al. Burnout and engagement among resident doctors in the Netherlands: a national study. Med Educ. 2010;44(3):236-247. PubMed
3. Ruotsalainen JH, Verbeek JH, Marine A, Serra C. Preventing occupational stress in healthcare workers. Cochrane Database Syst Rev. 2015(4):CD002892. PubMed
4. Gonzalez-Roma V, Schaufeli WB, Bakker AB, Lloret S. Burnout and work engagement: Independent factors or opposite poles. J Vocat Behav. 2006;60(1):165-174.
5. National Health Service. The staff engagement challenge–a factsheet for chief executives. http://www.nhsemployers.org/~/media/Employers/Documents/Retain%20and%20improve/23705%20Chief-executive%20Factsheet _WEB.pdf. Accessed July 9, 2017
6. Taitz JM, Lee TH, Sequist TD. A framework for engaging physicians in quality and safety. BMJ Qual Saf. 2012;21(9):722-728. PubMed
7. Hsieh HF, Shannon SE. Three approaches to qualitative content analysis. Qual Health Res. 2005;15(9):1277-1288. PubMed
8. Emanuel EJ, Pearson SD. Physician autonomy and health care reform. JAMA. 2012;307(4):367-368. PubMed
9. Panagioti M, Panagopoulou E, Bower P, et al. Controlled Interventions to Reduce Burnout in Physicians: A Systematic Review and Meta-analysis. JAMA Intern Med. 2017;177(2):195-205. PubMed
Disengaged physicians perform worse on multiple quality metrics and are more likely to make clinical errors.1,2 A growing body of literature has examined factors contributing to rising physician burnout, yet limited research has explored elements of physician engagement.3 Although some have described engagement as the polar opposite of burnout, addressing factors that contribute to burnout may not necessarily build physician engagement.4 The National Health Service (NHS) in the United Kingdom defines physician engagement as “the degree to which an employee is satisfied in their work, motivated to perform well, able to suggest and implement ideas for improvement, and their willingness to act as an advocate for their organization by recommending it as a place to work or be treated.”5
Few studies have attempted to document and interpret the variety of approaches that healthcare organizations have taken to identify and address this problem.6 The purpose of this study was to understand hospital administrators’ perspectives on issues related to physician engagement, including determinants of physician engagement, organizational efforts to improve physician engagement, and barriers to improving physician engagement.
METHODS
We conducted a qualitative study of hospital administrators by using an online anonymous questionnaire to explore perspectives on physician engagement. We used a convenience sample of hospital administrators affiliated with Vizient Inc. member hospitals. Vizient is the largest member-owned healthcare services company in the United States; and at the time of the study, it was composed of 1519 hospitals. Eligible hospital administrators included 2 hospital executive positions: Chief Medical Officers (CMOs) and Chief Quality Officers (CQOs). We chose to focus on CMOs and CQOs because their leadership roles overseeing physician employees may require them to address challenges with physician engagement.
The questionnaire focused on administrators’ perspectives on physician engagement, which we defined using the NHS definition stated above. Questions addressed perceived determinants of engagement, effective organizational efforts to improve engagement, and perceived barriers to improving engagement (supplementary Appendix 1). We included 2 yes/no questions and 4 open-ended questions. In May and June of 2016, we sent an e-mail to 432 unique hospital administrators explaining the purpose of the study and requested their participation through a hyperlink to an online questionnaire.
We used summary statistics to report results of yes/no questions and qualitative methods to analyze open-ended responses according to the principles of conventional content analysis, which avoids using preconceived categories and instead relies on inductive methods to allow categories to emerge from the data.7 Team members (T.J.R., K.O., and S.T.R.) performed close readings of responses and coded segments representing important concepts. Through iterative discussion, members of the research team reached consensus on the final code structure.
RESULTS
Our analyses focused on responses from 39 administrators that contained the most substantial qualitative information to the 4 open-ended questions included in the questionnaire. Among these respondents, 31 (79%) indicated that their hospital had surveyed physicians to assess their level of engagement, and 32 (82%) indicated that their hospital had implemented organizational efforts to improve physician engagement within the previous 3 years. Content analysis of open-ended responses yielded 5 themes that summarized perceived contributing factors to physician engagement: (1) physician-administration alignment, (2) physician input in decision-making, (3) appreciation of physician contributions, (4) communication between physicians and administration, and (5) hospital systems and workflow. In the Table, we present exemplary quotations for each theme and the question that prompted the quote.
DISCUSSION
Results of this study provide insight into administrators’ perspectives on organizational factors affecting physician engagement in hospital settings. The majority of respondents believed physician engagement was sufficiently important to survey physicians to assess their level of engagement and implement interventions to improve engagement. We identified several overarching themes that transcend individual questions related to the determinants of engagement, organizational efforts to improve engagement, and barriers to improving engagement. Many responses focused on the relationship between administrators and physicians. Administrators in our study may also have backgrounds as physicians, providing them with a unique perspective on the importance of this relationship.
The evolution of healthcare over the past several decades has shifted power dynamics away from autonomous physician practices, particularly in hospital settings.8 Our study suggests that hospital administrators recognize the potential impact these changes have had on physician engagement and are attempting to address the detrimental effects. Furthermore, administrators acknowledged the importance of organization-directed solutions to address problems with physician morale. This finding represents a paradigm shift away from previous approaches that involved interventions directed at individual physicians.9
Our results represent a call to action for both physicians and administrators to work together to develop organizational solutions to improve physician engagement. Further research is needed to investigate the most effective ways to improve and sustain engagement. At a time when physicians are increasingly dissatisfied with their current work, understanding how to improve physician engagement is critical to maintaining a healthy and productive physician workforce.
Disclosure
Will Dardani is an employee of Vizient Inc. No other authors have conflicts of interest to declare.
1. West MA, Dawson JF. Employee engagement and NHS performance. https://www.kingsfund.org.uk/sites/default/files/employee-engagement-nhs-performance-west-dawson-leadership-review2012-paper.pdf. Accessed July 9, 2017
2. Prins JT, Hoekstra-Weebers JE, Gazendam-Donofrio SM, et al. Burnout and engagement among resident doctors in the Netherlands: a national study. Med Educ. 2010;44(3):236-247. PubMed
3. Ruotsalainen JH, Verbeek JH, Marine A, Serra C. Preventing occupational stress in healthcare workers. Cochrane Database Syst Rev. 2015(4):CD002892. PubMed
4. Gonzalez-Roma V, Schaufeli WB, Bakker AB, Lloret S. Burnout and work engagement: Independent factors or opposite poles. J Vocat Behav. 2006;60(1):165-174.
5. National Health Service. The staff engagement challenge–a factsheet for chief executives. http://www.nhsemployers.org/~/media/Employers/Documents/Retain%20and%20improve/23705%20Chief-executive%20Factsheet _WEB.pdf. Accessed July 9, 2017
6. Taitz JM, Lee TH, Sequist TD. A framework for engaging physicians in quality and safety. BMJ Qual Saf. 2012;21(9):722-728. PubMed
7. Hsieh HF, Shannon SE. Three approaches to qualitative content analysis. Qual Health Res. 2005;15(9):1277-1288. PubMed
8. Emanuel EJ, Pearson SD. Physician autonomy and health care reform. JAMA. 2012;307(4):367-368. PubMed
9. Panagioti M, Panagopoulou E, Bower P, et al. Controlled Interventions to Reduce Burnout in Physicians: A Systematic Review and Meta-analysis. JAMA Intern Med. 2017;177(2):195-205. PubMed
© 2017 Society of Hospital Medicine
Hospitalist Perspective of Interactions with Medicine Subspecialty Consult Services
Hospitalist physicians care for an increasing proportion of general medicine inpatients and request a significant share of all subspecialty consultations.1 Subspecialty consultation in inpatient care is increasing,2,3 and effective hospitalist–consulting service interactions may affect team communication, patient care, and hospitalist learning. Therefore, enhancing hospitalist–consulting service interactions may have a broad-reaching, positive impact. Researchers in previous studies have explored resident–fellow consult interactions in the inpatient and emergency department settings as well as attending-to-attending consultation in the outpatient setting.4-7 However, to our knowledge, hospitalist–consulting team interactions have not been previously described. In academic medical centers, hospitalists are attending physicians who interact with both fellows (supervised by attending consultants) and directly with subspecialty attendings. Therefore, the exploration of the hospitalist–consultant interaction requires an evaluation of hospitalist–fellow and hospitalist–subspecialty attending interactions. The hospitalist–fellow interaction in particular is unique because it represents an unusual dynamic, in which an attending physician is primarily communicating with a trainee when requesting assistance with patient care.8 In order to explore hospitalist–consultant interactions (herein, the term “consultant” includes both fellow and attending consultants), we conducted a survey study in which we examine hospitalist practices and attitudes regarding consultation, with a specific focus on hospitalist consultation with internal medicine subspecialty consult services. In addition, we compared fellow–hospitalist and attending–hospitalist interactions and explored barriers to and facilitating factors of an effective hospitalist–consultant relationship.
METHODS
Survey Development
The survey instrument was developed by the authors based on findings of prior studies in which researchers examined consultation.2-6,9-16 The survey contained 31 questions (supplementary Appendix A) and evaluated 4 domains of the use of medical subspecialty consultation in direct patient care: (1) current consultation practices, (2) preferences regarding consultants, (3) barriers to and facilitating factors of effective consultation (both with respect to hospitalist learning and patient care), and (4) a comparison between hospitalist–fellow and hospitalist–subspecialty attending interactions. An evaluation of current consultation practices included a focus on communication methods (eg, in person, over the phone, through paging, or notes) because these have been found to be important during consultation.5,6,9,15,16 In order to explore hospitalist preferences regarding consult interactions and investigate perceptions of barriers to and facilitating factors of effective consultation, questions were developed based on previous literature, including our qualitative work examining resident–fellow interactions during consultation.4-6,9,12 We compared hospitalist consultation experiences among attending and fellow consultants because the interaction in which an attending hospitalist physician is primarily communicating with a trainee may differ from a consultation between a hospitalist attending and a subspecialty attending.8 Participants were asked to exclude their experiences when working on teaching services, during which students or housestaff often interact with consultants. The survey was cognitively tested with both hospitalist and non-hospitalist attending physicians not participating in the study and was revised by the authors using an iterative approach.
Study Participants
Hospitalist attending physicians at University of Texas Southwestern (UTSW) Medical Center, Emory University School of Medicine, Massachusetts General Hospital (MGH), and the Medical University of South Carolina (MUSC) were eligible to participate in the study. Consult team structures at each institution were composed of either a subspecialist-attending-only or a fellow-and-subspecialty-attending team. Fellows at all institutions are supervised by a subspecialty attending when performing consultations. Respondents who self-identified as nurse practitioners or physician assistants were excluded from the analysis. Hospitalists employed by the Veterans Affairs hospital system were also excluded. The study was approved by the institutional review boards of UTSW, Emory, MUSC, and MGH.
The survey was anonymous and administered to all hospitalists at participating institutions via a web-based survey tool (Qualtrics, Provo, UT). Participants were eligible to enter a raffle for a $500 gift card, and completion of the survey was not required for entry into the raffle.
Statistics
Results were summarized using the mean with standard deviation for continuous variables and the frequency with percentage for categorical variables after excluding missing values. All analyses were conducted using SAS version 9.4 (SAS Institute, Cary, NC). A 2-sided P value of ≤0.05 was considered statistically significant.
RESULTS
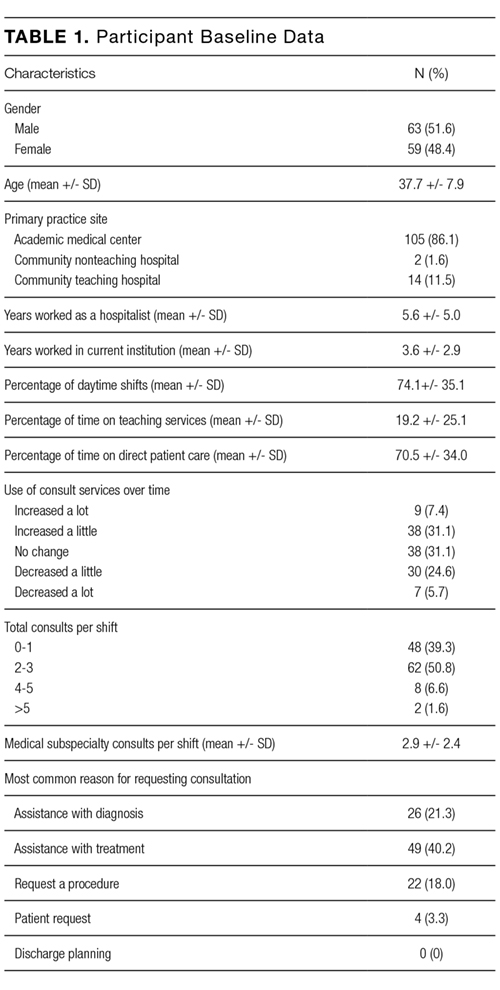
Current Consultation Practices
Current consultation practices and descriptions of hospitalist–consultant communication are shown in Table 2. Forty percent of respondents requested 0-1 consults per day, while 51.7% requested 2-3 per day. The most common reasons for requesting a consultation were assistance with treatment (48.5%), assistance with diagnosis (25.7%), and request for a procedure (21.8%). When asked whether the frequency of consultation is changing, slightly more hospitalists felt that their personal use of consultation was increasing as compared to those who felt that it was decreasing (38.5% vs 30.3%, respectively).
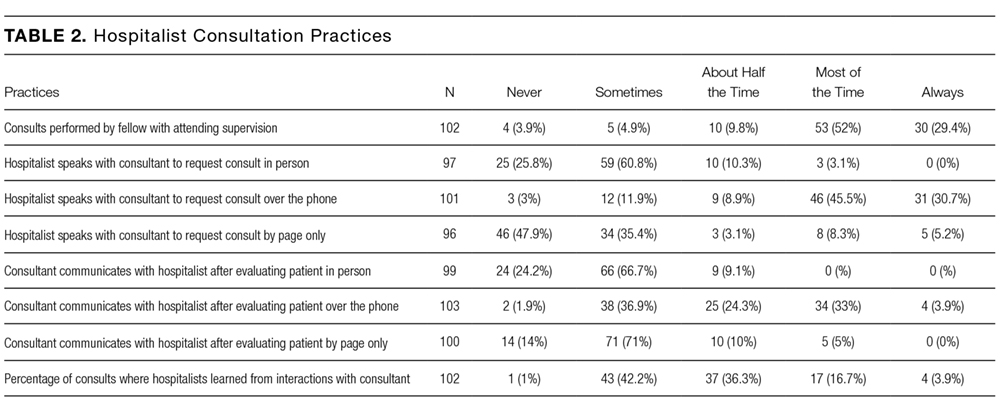
Hospitalist Preferences
Eighty-six percent of respondents agreed that consultants should be required to communicate their recommendations either in person or over the phone. Eighty-three percent of hospitalists agreed that they would like to receive more teaching from the consulting services, and 74.0% agreed that consultants should attempt to teach hospitalists during consult interactions regardless of whether the hospitalist initiates the teaching–learning interaction.
Barriers to and Facilitating Factors of Effective Consultation
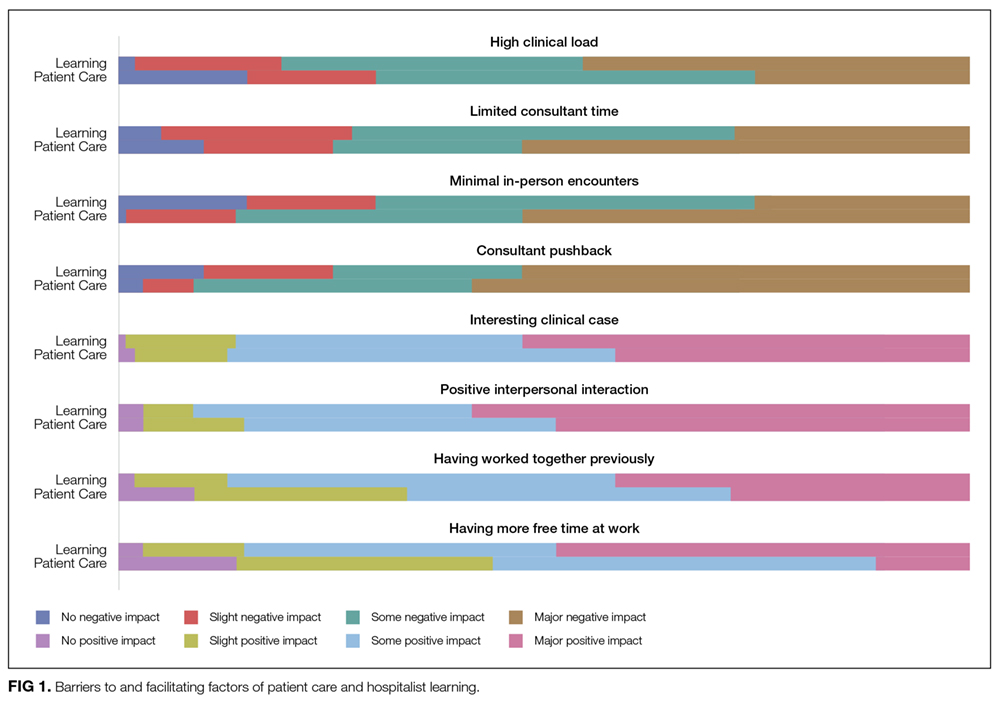
Participants reported that multiple factors affected patient care and their own learning during inpatient consultation (Figure 1). Consultant pushback, high hospitalist clinical workload, a perception that consultants had limited time, and minimal in-person interactions were all seen as factors that negatively affected the consult interaction. These generally affected both learning and patient care. Conversely, working on an interesting clinical case, more hospitalist free time, positive interaction with the consultant, and having previously worked with the consultant positively affected both learning and patient care (Figure 1).
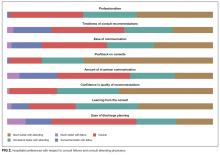
Fellow Versus Attending Interactions
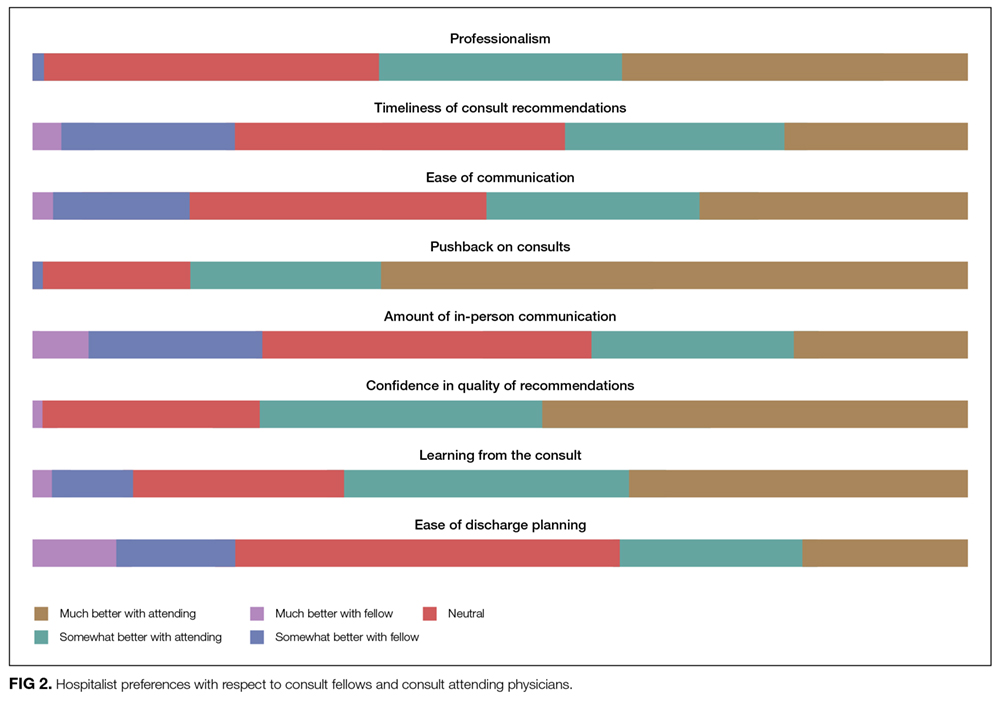
Respondents indicated that interacting directly with the consult attending was superior to hospitalist–fellow interactions in all aspects of care but particularly with respect to pushback, confidence in recommendations, professionalism, and hospitalist learning (Figure 2).
DISCUSSION
To our knowledge, this is the first study to describe hospitalist attending practices, attitudes, and perceptions of internal medicine subspecialty consultation. Our findings, which focus on the interaction between hospitalists and internal medicine subspecialty attendings and fellows, outline the hospitalist perspective on consultant interactions and identify a number of factors that are amenable to intervention. We found that hospitalists perceive the consult interaction to be important for patient care and a valuable opportunity for their own learning. In-person communication was seen as an important component of effective consultation but was reported to occur in a minority of consultations. We demonstrate that hospitalist–subspecialty attending consult interactions are perceived more positively than hospitalist–fellow interactions. Finally, we describe barriers and facilitating factors that may inform future interventions targeting this important interaction.
Effective communication between consultants and the primary team is critical for both patient care and teaching interactions.4-7 Pushback on consultation was reported to be the most significant barrier to hospitalist learning and had a major impact on patient care. Because hospitalists are attending physicians, we hypothesized that they may perceive pushback from fellows less frequently than residents.4 However, in our study, hospitalists reported pushback to be relatively frequent in their daily practice. Moreover, hospitalists reported a strong preference for in-person interactions with consultants, but our study demonstrated that such interactions are relatively infrequent. Researchers in studies of resident–fellow consult interactions have noted similar findings, suggesting that hospitalists and internal medicine residents face similar challenges during consultation.4-6 Hospitalists reported that positive interpersonal interactions and personal familiarity with the consultant positively affected the consult interaction. Most importantly, these effects were perceived to affect both hospitalist learning and patient care, suggesting the importance of interpersonal interactions in consultative medicine.
In an era of increasing clinical workload, the consult interaction represents an important workplace-based learning opportunity.4 Centered on a consult question, the hospitalist–consultant interaction embodies a teachable moment and can be an efficient opportunity to learn because both parties are familiar with the patient. Indeed, survey respondents reported that they frequently learned from consultation, and there was a strong preference for more teaching from consultants in this setting. However, the hospitalist–fellow consult interaction is unique because attending hospitalists are frequently communicating with fellow trainees, which could limit fellows’ confidence in their role as teachers and hospitalists’ perception of their role as learners. Our study identifies a number of barriers and facilitating factors (including communication, pushback, familiarity, and clinical workload) that affect the hospitalist–consultant teaching interaction and may be amenable to intervention.
Hospitalists expressed a consistent preference for interacting with attending subspecialists compared to clinical fellows during consultation. Preference for interaction with attendings was strongest in the areas of pushback, confidence in recommendations, professionalism, and learning from consultation. Some of the factors that relate to consult service structure and fellow experience, such as timeliness of consultation and confidence in recommendations, may not be amenable to intervention. For instance, fellows must first see and then staff the consult with their attending prior to leaving formal recommendations, which makes their communication less timely than that of attending physicians, when they are the primary consultant. However, aspects of the hospitalist–consultant interaction (such as professionalism, ease of communication, and pushback) should not be affected by the difference in experience between fellows and attending physicians. The reasons for such perceptions deserve further exploration; however, differences in incentive structures, workload, and communication skills between fellows and attending consultants may be potential explanations.
Our findings suggest that interventions aimed at enhancing hospitalist–consultant interactions focus on enhancing direct communication and teaching while limiting the perception of pushback. A number of interventions that are primarily focused on instituting a systematic approach to requesting consultation have shown an improvement in resident and medical student consult communication17,18 as well as resident–fellow teaching interactions.9 However, it is not clear whether these interventions would be effective given that hospitalists have more experience communicating with consultants than trainees. Given the unique nature of the hospitalist–consultant interaction, multiple barriers may need to be addressed in order to have a significant impact. Efforts to increase direct communication, such as a mechanism for hospitalists to make and request in-person or direct verbal communication about a particular consultation during the consult request, can help consultants prioritize direct communication with hospitalists for specific patients. Familiarizing fellows with hospitalist workflow and the locations of hospitalist workrooms also may promote in-person communication. Fellowship training can focus on enhancing fellow teaching and communication skills,19-22 particularly as they relate to hospitalists. Fellows in particular may benefit because the hospitalist–fellow teaching interaction may be bidirectional, with hospitalists having expertise in systems practice and quality efforts that can inform fellows’ practice. Furthermore, interacting with hospitalists is an opportunity for fellows to practice professional interactions, which will be critical to their careers. Increasing familiarity between fellows and hospitalists through joint events may also serve to enhance the interaction. Finally, enabling hospitalists to provide feedback to fellows stands to benefit both parties because multisource feedback is an important tool in assessing trainee competence and improving performance.23 However, we should note that because our study focused on hospitalist perceptions, an exploration of subspecialty fellows’ and attendings’ perceptions of the hospitalist–consultant interaction would provide additional, important data for shaping interventions.
Strengths of our study include the inclusion of multiple study sites, which may increase generalizability; however, our study has several limitations. The incomplete response rate reduces both generalizability and statistical power and may have created selection or nonresponder bias. However, low response rates occur commonly when surveying medical professionals, and our results are consistent with many prior hospitalist survey studies.24-26 Further, we conducted our study at a single time point; therefore, we could not evaluate the effect of fellow experience on hospitalist perceptions. However, we conducted our study in the second half of the academic year, when fellows had already gained considerable experience in the consultation setting. We did not capture participants’ institutional affiliations; therefore, a subgroup analysis by institution could not be performed. Additionally, our study reflects hospitalist perception rather than objectively measured communication practices between hospitalists and consultants, and it does not include the perspective of subspecialists. The specific needs of nurse practitioners and physicians’ assistants, who were excluded from this study, should also be evaluated in future research. Lastly, this is a hypothesis-generating study and should be replicated in a national cohort.
CONCLUSION
The hospitalists represented in our sample population perceived the consult interaction to be important for patient care and a valuable opportunity for their own learning. Participants expressed that they would like to increase direct communication with consultants and enhance consultant–hospitalist teaching interactions. Multiple barriers to effective hospitalist–consultant interactions (including communication, pushback, and hospitalist–consultant familiarity) are amenable to intervention.
Disclosure
The authors have no financial disclosures or conflicts of interest.
1. Kravolec PD, Miller JA, Wellikson L, Huddleston JM. The status of hospital medicine groups in the United States. J Hosp Med.2006;1(2):75-80. PubMed
2. Cai Q, Bruno CJ, Hagedorn CH, Desbiens NA. Temporal trends over ten years in formal inpatient gastroenterology consultations at an inner-city hospital. J Clin Gastroenterol. 2003;36(1):34-38. PubMed
3. Ta K, Gardner GC. Evaluation of the activity of an academic rheumatology consult service over 10 years: using data to shape curriculum. J Rheumatol. 2007;34(3):563-566. PubMed
4. Miloslavsky EM, McSparron JI, Richards JB, Puig A, Sullivan AM. Teaching during consultation: factors affecting the resident-fellow teaching interaction. Med Educ. 2015;49(7):717-730. PubMed
5. Chan T, Sabir K, Sanhan S, Sherbino J. Understanding the impact of residents’ interpersonal relationships during emergency department referrals and consultations. J Grad Med Educ. 2013;5(4):576-581. PubMed
6. Chan T, Bakewell F, Orlich D, Sherbino J. Conflict prevention, conflict mitigation, and manifestations of conflict during emergency department consultations. Acad Emerg Med. 2014;21(3):308-313. PubMed
7. Goldman L, Lee T, Rudd P. Ten commandments for effective consultations. Arch Intern Med. 1983;143(9):1753-1755. PubMed
8. Adams T. Barriers to hospitalist fellow interactions. Med Educ. 2016;50(3):370. PubMed
9. Gupta S, Alladina J, Heaton K, Miloslavsky E. A randomized trial of an intervention to improve resident-fellow teaching interaction on the wards. BMC Med Educ. 2016;16(1):276. PubMed
10. Day LW, Cello JP, Madden E, Segal M. Prospective assessment of inpatient gastrointestinal consultation requests in an academic teaching hospital. Am J Gastroenterol. 2010;105(3):484-489. PubMed
11. Kessler C, Kutka BM, Badillo C. Consultation in the emergency department: a qualitative analysis and review. J Emerg Med. 2012;42(6):704-711. PubMed
12. Salerno SM, Hurst FP, Halvorson S, Mercado DL. Principles of effective consultation: an update for the 21st-century consultant. Arch Intern Med. 2007;167(3):271-275. PubMed
13. Muzin LJ. Understanding the process of medical referral: part 1: critique of the literature. Can Fam Physician. 1991;37:2155-2161. PubMed
14. Muzin LJ. Understanding the process of medical referral: part 5: communication. Can Fam Physician. 1992;38:301-307. PubMed
15. Wadhwa A, Lingard L. A qualitative study examining tensions in interdoctor telephone consultations. Med Educ. 2006;40(8):759-767. PubMed
16. Grant IN, Dixon AS. “Thank you for seeing this patient”: studying the quality of communication between physicians. Can Fam Physician. 1987;33:605-611. PubMed
17. Kessler CS, Afshar Y, Sardar G, Yudkowsky R, Ankel F, Schwartz A. A prospective, randomized, controlled study demonstrating a novel, effective model of transfer of care between physicians: the 5 Cs of consultation. Acad Emerg Med. 2012;19(8):968-974. PubMed
18. Podolsky A, Stern DTP. The courteous consult: a CONSULT card and training to improve resident consults. J Grad Med Educ. 2015;7(1):113-117. PubMed
19. Tofil NM, Peterson DT, Harrington KF, et al. A novel iterative-learner simulation model: fellows as teachers. J. Grad. Med. Educ. 2014;6(1):127-132. PubMed
20. Kempainen RR, Hallstrand TS, Culver BH, Tonelli MR. Fellows as teachers: the teacher-assistant experience during pulmonary subspecialty training. Chest. 2005;128(1):401-406. PubMed
21. Backes CH, Reber KM, Trittmann JK, et al. Fellows as teachers: a model to enhance pediatric resident education. Med. Educ. Online. 2011;16:7205. PubMed
22. Miloslavsky EM, Degnan K, McNeill J, McSparron JI. Use of Fellow as Clinical Teacher (FACT) Curriculum for Teaching During Consultation: Effect on Subspecialty Fellow Teaching Skills. J Grad Med Educ. 2017;9(3):345-350 PubMed
23. Donnon T, Al Ansari A, Al Alawi S, Violato C. The reliability, validity, and feasibility of multisource feedback physician assessment: a systematic review. Acad. Med. 2014;89(3):511-516. PubMed
24. Monash B, Najafi N, Mourad M, et al. Standardized attending rounds to improve the patient experience: A pragmatic cluster randomized controlled trial. J Hosp Med. 2017;12(3):143-149. PubMed
25. Allen-Dicker J, Auerbach A, Herzig SJ. Perceived safety and value of inpatient “very important person” services. J Hosp Med. 2017;12(3):177-179. PubMed
26. Do D, Munchhof AM, Terry C, Emmett T, Kara A. Research and publication trends in hospital medicine. J Hosp Med. 2014;9(3):148-154. PubMed
Hospitalist physicians care for an increasing proportion of general medicine inpatients and request a significant share of all subspecialty consultations.1 Subspecialty consultation in inpatient care is increasing,2,3 and effective hospitalist–consulting service interactions may affect team communication, patient care, and hospitalist learning. Therefore, enhancing hospitalist–consulting service interactions may have a broad-reaching, positive impact. Researchers in previous studies have explored resident–fellow consult interactions in the inpatient and emergency department settings as well as attending-to-attending consultation in the outpatient setting.4-7 However, to our knowledge, hospitalist–consulting team interactions have not been previously described. In academic medical centers, hospitalists are attending physicians who interact with both fellows (supervised by attending consultants) and directly with subspecialty attendings. Therefore, the exploration of the hospitalist–consultant interaction requires an evaluation of hospitalist–fellow and hospitalist–subspecialty attending interactions. The hospitalist–fellow interaction in particular is unique because it represents an unusual dynamic, in which an attending physician is primarily communicating with a trainee when requesting assistance with patient care.8 In order to explore hospitalist–consultant interactions (herein, the term “consultant” includes both fellow and attending consultants), we conducted a survey study in which we examine hospitalist practices and attitudes regarding consultation, with a specific focus on hospitalist consultation with internal medicine subspecialty consult services. In addition, we compared fellow–hospitalist and attending–hospitalist interactions and explored barriers to and facilitating factors of an effective hospitalist–consultant relationship.
METHODS
Survey Development
The survey instrument was developed by the authors based on findings of prior studies in which researchers examined consultation.2-6,9-16 The survey contained 31 questions (supplementary Appendix A) and evaluated 4 domains of the use of medical subspecialty consultation in direct patient care: (1) current consultation practices, (2) preferences regarding consultants, (3) barriers to and facilitating factors of effective consultation (both with respect to hospitalist learning and patient care), and (4) a comparison between hospitalist–fellow and hospitalist–subspecialty attending interactions. An evaluation of current consultation practices included a focus on communication methods (eg, in person, over the phone, through paging, or notes) because these have been found to be important during consultation.5,6,9,15,16 In order to explore hospitalist preferences regarding consult interactions and investigate perceptions of barriers to and facilitating factors of effective consultation, questions were developed based on previous literature, including our qualitative work examining resident–fellow interactions during consultation.4-6,9,12 We compared hospitalist consultation experiences among attending and fellow consultants because the interaction in which an attending hospitalist physician is primarily communicating with a trainee may differ from a consultation between a hospitalist attending and a subspecialty attending.8 Participants were asked to exclude their experiences when working on teaching services, during which students or housestaff often interact with consultants. The survey was cognitively tested with both hospitalist and non-hospitalist attending physicians not participating in the study and was revised by the authors using an iterative approach.
Study Participants
Hospitalist attending physicians at University of Texas Southwestern (UTSW) Medical Center, Emory University School of Medicine, Massachusetts General Hospital (MGH), and the Medical University of South Carolina (MUSC) were eligible to participate in the study. Consult team structures at each institution were composed of either a subspecialist-attending-only or a fellow-and-subspecialty-attending team. Fellows at all institutions are supervised by a subspecialty attending when performing consultations. Respondents who self-identified as nurse practitioners or physician assistants were excluded from the analysis. Hospitalists employed by the Veterans Affairs hospital system were also excluded. The study was approved by the institutional review boards of UTSW, Emory, MUSC, and MGH.
The survey was anonymous and administered to all hospitalists at participating institutions via a web-based survey tool (Qualtrics, Provo, UT). Participants were eligible to enter a raffle for a $500 gift card, and completion of the survey was not required for entry into the raffle.
Statistics
Results were summarized using the mean with standard deviation for continuous variables and the frequency with percentage for categorical variables after excluding missing values. All analyses were conducted using SAS version 9.4 (SAS Institute, Cary, NC). A 2-sided P value of ≤0.05 was considered statistically significant.
RESULTS
Current Consultation Practices
Current consultation practices and descriptions of hospitalist–consultant communication are shown in Table 2. Forty percent of respondents requested 0-1 consults per day, while 51.7% requested 2-3 per day. The most common reasons for requesting a consultation were assistance with treatment (48.5%), assistance with diagnosis (25.7%), and request for a procedure (21.8%). When asked whether the frequency of consultation is changing, slightly more hospitalists felt that their personal use of consultation was increasing as compared to those who felt that it was decreasing (38.5% vs 30.3%, respectively).
Hospitalist Preferences
Eighty-six percent of respondents agreed that consultants should be required to communicate their recommendations either in person or over the phone. Eighty-three percent of hospitalists agreed that they would like to receive more teaching from the consulting services, and 74.0% agreed that consultants should attempt to teach hospitalists during consult interactions regardless of whether the hospitalist initiates the teaching–learning interaction.
Barriers to and Facilitating Factors of Effective Consultation
Participants reported that multiple factors affected patient care and their own learning during inpatient consultation (Figure 1). Consultant pushback, high hospitalist clinical workload, a perception that consultants had limited time, and minimal in-person interactions were all seen as factors that negatively affected the consult interaction. These generally affected both learning and patient care. Conversely, working on an interesting clinical case, more hospitalist free time, positive interaction with the consultant, and having previously worked with the consultant positively affected both learning and patient care (Figure 1).
Fellow Versus Attending Interactions
Respondents indicated that interacting directly with the consult attending was superior to hospitalist–fellow interactions in all aspects of care but particularly with respect to pushback, confidence in recommendations, professionalism, and hospitalist learning (Figure 2).
DISCUSSION
To our knowledge, this is the first study to describe hospitalist attending practices, attitudes, and perceptions of internal medicine subspecialty consultation. Our findings, which focus on the interaction between hospitalists and internal medicine subspecialty attendings and fellows, outline the hospitalist perspective on consultant interactions and identify a number of factors that are amenable to intervention. We found that hospitalists perceive the consult interaction to be important for patient care and a valuable opportunity for their own learning. In-person communication was seen as an important component of effective consultation but was reported to occur in a minority of consultations. We demonstrate that hospitalist–subspecialty attending consult interactions are perceived more positively than hospitalist–fellow interactions. Finally, we describe barriers and facilitating factors that may inform future interventions targeting this important interaction.
Effective communication between consultants and the primary team is critical for both patient care and teaching interactions.4-7 Pushback on consultation was reported to be the most significant barrier to hospitalist learning and had a major impact on patient care. Because hospitalists are attending physicians, we hypothesized that they may perceive pushback from fellows less frequently than residents.4 However, in our study, hospitalists reported pushback to be relatively frequent in their daily practice. Moreover, hospitalists reported a strong preference for in-person interactions with consultants, but our study demonstrated that such interactions are relatively infrequent. Researchers in studies of resident–fellow consult interactions have noted similar findings, suggesting that hospitalists and internal medicine residents face similar challenges during consultation.4-6 Hospitalists reported that positive interpersonal interactions and personal familiarity with the consultant positively affected the consult interaction. Most importantly, these effects were perceived to affect both hospitalist learning and patient care, suggesting the importance of interpersonal interactions in consultative medicine.
In an era of increasing clinical workload, the consult interaction represents an important workplace-based learning opportunity.4 Centered on a consult question, the hospitalist–consultant interaction embodies a teachable moment and can be an efficient opportunity to learn because both parties are familiar with the patient. Indeed, survey respondents reported that they frequently learned from consultation, and there was a strong preference for more teaching from consultants in this setting. However, the hospitalist–fellow consult interaction is unique because attending hospitalists are frequently communicating with fellow trainees, which could limit fellows’ confidence in their role as teachers and hospitalists’ perception of their role as learners. Our study identifies a number of barriers and facilitating factors (including communication, pushback, familiarity, and clinical workload) that affect the hospitalist–consultant teaching interaction and may be amenable to intervention.
Hospitalists expressed a consistent preference for interacting with attending subspecialists compared to clinical fellows during consultation. Preference for interaction with attendings was strongest in the areas of pushback, confidence in recommendations, professionalism, and learning from consultation. Some of the factors that relate to consult service structure and fellow experience, such as timeliness of consultation and confidence in recommendations, may not be amenable to intervention. For instance, fellows must first see and then staff the consult with their attending prior to leaving formal recommendations, which makes their communication less timely than that of attending physicians, when they are the primary consultant. However, aspects of the hospitalist–consultant interaction (such as professionalism, ease of communication, and pushback) should not be affected by the difference in experience between fellows and attending physicians. The reasons for such perceptions deserve further exploration; however, differences in incentive structures, workload, and communication skills between fellows and attending consultants may be potential explanations.
Our findings suggest that interventions aimed at enhancing hospitalist–consultant interactions focus on enhancing direct communication and teaching while limiting the perception of pushback. A number of interventions that are primarily focused on instituting a systematic approach to requesting consultation have shown an improvement in resident and medical student consult communication17,18 as well as resident–fellow teaching interactions.9 However, it is not clear whether these interventions would be effective given that hospitalists have more experience communicating with consultants than trainees. Given the unique nature of the hospitalist–consultant interaction, multiple barriers may need to be addressed in order to have a significant impact. Efforts to increase direct communication, such as a mechanism for hospitalists to make and request in-person or direct verbal communication about a particular consultation during the consult request, can help consultants prioritize direct communication with hospitalists for specific patients. Familiarizing fellows with hospitalist workflow and the locations of hospitalist workrooms also may promote in-person communication. Fellowship training can focus on enhancing fellow teaching and communication skills,19-22 particularly as they relate to hospitalists. Fellows in particular may benefit because the hospitalist–fellow teaching interaction may be bidirectional, with hospitalists having expertise in systems practice and quality efforts that can inform fellows’ practice. Furthermore, interacting with hospitalists is an opportunity for fellows to practice professional interactions, which will be critical to their careers. Increasing familiarity between fellows and hospitalists through joint events may also serve to enhance the interaction. Finally, enabling hospitalists to provide feedback to fellows stands to benefit both parties because multisource feedback is an important tool in assessing trainee competence and improving performance.23 However, we should note that because our study focused on hospitalist perceptions, an exploration of subspecialty fellows’ and attendings’ perceptions of the hospitalist–consultant interaction would provide additional, important data for shaping interventions.
Strengths of our study include the inclusion of multiple study sites, which may increase generalizability; however, our study has several limitations. The incomplete response rate reduces both generalizability and statistical power and may have created selection or nonresponder bias. However, low response rates occur commonly when surveying medical professionals, and our results are consistent with many prior hospitalist survey studies.24-26 Further, we conducted our study at a single time point; therefore, we could not evaluate the effect of fellow experience on hospitalist perceptions. However, we conducted our study in the second half of the academic year, when fellows had already gained considerable experience in the consultation setting. We did not capture participants’ institutional affiliations; therefore, a subgroup analysis by institution could not be performed. Additionally, our study reflects hospitalist perception rather than objectively measured communication practices between hospitalists and consultants, and it does not include the perspective of subspecialists. The specific needs of nurse practitioners and physicians’ assistants, who were excluded from this study, should also be evaluated in future research. Lastly, this is a hypothesis-generating study and should be replicated in a national cohort.
CONCLUSION
The hospitalists represented in our sample population perceived the consult interaction to be important for patient care and a valuable opportunity for their own learning. Participants expressed that they would like to increase direct communication with consultants and enhance consultant–hospitalist teaching interactions. Multiple barriers to effective hospitalist–consultant interactions (including communication, pushback, and hospitalist–consultant familiarity) are amenable to intervention.
Disclosure
The authors have no financial disclosures or conflicts of interest.
1. Kravolec PD, Miller JA, Wellikson L, Huddleston JM. The status of hospital medicine groups in the United States. J Hosp Med.2006;1(2):75-80. PubMed
2. Cai Q, Bruno CJ, Hagedorn CH, Desbiens NA. Temporal trends over ten years in formal inpatient gastroenterology consultations at an inner-city hospital. J Clin Gastroenterol. 2003;36(1):34-38. PubMed
3. Ta K, Gardner GC. Evaluation of the activity of an academic rheumatology consult service over 10 years: using data to shape curriculum. J Rheumatol. 2007;34(3):563-566. PubMed
4. Miloslavsky EM, McSparron JI, Richards JB, Puig A, Sullivan AM. Teaching during consultation: factors affecting the resident-fellow teaching interaction. Med Educ. 2015;49(7):717-730. PubMed
5. Chan T, Sabir K, Sanhan S, Sherbino J. Understanding the impact of residents’ interpersonal relationships during emergency department referrals and consultations. J Grad Med Educ. 2013;5(4):576-581. PubMed
6. Chan T, Bakewell F, Orlich D, Sherbino J. Conflict prevention, conflict mitigation, and manifestations of conflict during emergency department consultations. Acad Emerg Med. 2014;21(3):308-313. PubMed
7. Goldman L, Lee T, Rudd P. Ten commandments for effective consultations. Arch Intern Med. 1983;143(9):1753-1755. PubMed
8. Adams T. Barriers to hospitalist fellow interactions. Med Educ. 2016;50(3):370. PubMed
9. Gupta S, Alladina J, Heaton K, Miloslavsky E. A randomized trial of an intervention to improve resident-fellow teaching interaction on the wards. BMC Med Educ. 2016;16(1):276. PubMed
10. Day LW, Cello JP, Madden E, Segal M. Prospective assessment of inpatient gastrointestinal consultation requests in an academic teaching hospital. Am J Gastroenterol. 2010;105(3):484-489. PubMed
11. Kessler C, Kutka BM, Badillo C. Consultation in the emergency department: a qualitative analysis and review. J Emerg Med. 2012;42(6):704-711. PubMed
12. Salerno SM, Hurst FP, Halvorson S, Mercado DL. Principles of effective consultation: an update for the 21st-century consultant. Arch Intern Med. 2007;167(3):271-275. PubMed
13. Muzin LJ. Understanding the process of medical referral: part 1: critique of the literature. Can Fam Physician. 1991;37:2155-2161. PubMed
14. Muzin LJ. Understanding the process of medical referral: part 5: communication. Can Fam Physician. 1992;38:301-307. PubMed
15. Wadhwa A, Lingard L. A qualitative study examining tensions in interdoctor telephone consultations. Med Educ. 2006;40(8):759-767. PubMed
16. Grant IN, Dixon AS. “Thank you for seeing this patient”: studying the quality of communication between physicians. Can Fam Physician. 1987;33:605-611. PubMed
17. Kessler CS, Afshar Y, Sardar G, Yudkowsky R, Ankel F, Schwartz A. A prospective, randomized, controlled study demonstrating a novel, effective model of transfer of care between physicians: the 5 Cs of consultation. Acad Emerg Med. 2012;19(8):968-974. PubMed
18. Podolsky A, Stern DTP. The courteous consult: a CONSULT card and training to improve resident consults. J Grad Med Educ. 2015;7(1):113-117. PubMed
19. Tofil NM, Peterson DT, Harrington KF, et al. A novel iterative-learner simulation model: fellows as teachers. J. Grad. Med. Educ. 2014;6(1):127-132. PubMed
20. Kempainen RR, Hallstrand TS, Culver BH, Tonelli MR. Fellows as teachers: the teacher-assistant experience during pulmonary subspecialty training. Chest. 2005;128(1):401-406. PubMed
21. Backes CH, Reber KM, Trittmann JK, et al. Fellows as teachers: a model to enhance pediatric resident education. Med. Educ. Online. 2011;16:7205. PubMed
22. Miloslavsky EM, Degnan K, McNeill J, McSparron JI. Use of Fellow as Clinical Teacher (FACT) Curriculum for Teaching During Consultation: Effect on Subspecialty Fellow Teaching Skills. J Grad Med Educ. 2017;9(3):345-350 PubMed
23. Donnon T, Al Ansari A, Al Alawi S, Violato C. The reliability, validity, and feasibility of multisource feedback physician assessment: a systematic review. Acad. Med. 2014;89(3):511-516. PubMed
24. Monash B, Najafi N, Mourad M, et al. Standardized attending rounds to improve the patient experience: A pragmatic cluster randomized controlled trial. J Hosp Med. 2017;12(3):143-149. PubMed
25. Allen-Dicker J, Auerbach A, Herzig SJ. Perceived safety and value of inpatient “very important person” services. J Hosp Med. 2017;12(3):177-179. PubMed
26. Do D, Munchhof AM, Terry C, Emmett T, Kara A. Research and publication trends in hospital medicine. J Hosp Med. 2014;9(3):148-154. PubMed
©2017 Society of Hospital Medicine
The ‘Virtual Radiology Resident’—Coming to a Computer Near You
Researchers around the world may be able to teach computers how to better detect and diagnose disease, thanks to > 100,000 chest x-ray images and corresponding data recently released by the NIH Clinical Center.
Reading and diagnosing chest x-rays requires careful observation, as well as knowledge of anatomy, physiology, and pathology. When that is combined with the need to consider all common thoracic diseases, it becomes hard to automate a consistent technique for reading images, the NIH says. With the free dataset, the hope is that academic and research institution staff will be able to teach their computers to read and process enormous amounts of scans, to confirm radiologists’ results, and potentially identify anything that may have been overlooked.
The NIH says in addition to being a “virtual radiology resident,” advanced computer technology has other potential benefits: For instance, it could identify slow changes occurring over the course of multiple chest x-rays that might otherwise be overlooked. The technology also would be useful in poor countries that lack radiologists. And in the future, the “resident” might be taught to read more complex images, such as CT and MRI.
The dataset, compiled from scans from > 30,000 patients, including many with advanced lung disease, was scrubbed of private information before release. The images are available via Box at https://nihcc.app.box.com/v/ChestXray-NIHCC.
The Return of Scarlet Fever?
Is scarlet fever—long thought to be eradicated—reemerging as a health threat? China, the United Kingdom, and Hong Kong have seen upsurges in scarlet fever cases in the past few years.
Hong Kong has seen a more than 10-fold increase over the previous incidence rate. In a study of 7,266 patients aged ≤ 14 years (3,304 with laboratory-confirmed diagnosis), researchers from University of Hong Kong found a “sharp peak” in 2011: 1,438 cases were reported, exceeding the total number of 1,117 in the previous 6 years. Since then, the annual number of reported cases has remained at a “relatively high level,” the researchers say, with an average of 14.5 cases per 10,000 children during 2012-2015.
The elevated pattern was more apparent in children aged ≤ 5 years. In that age group, annual incidence averaged 3.3 per 10,000 during 2005-2010, then jumped dramatically to 23.9 per 10,000 in 2011. It dropped slightly to 18.1 per 10,000 in 2012-2015.
The cause is unclear, the researchers say. They cite 1 report that suggests toxin acquisition and multidrug resistance may have contributed. School is probably a major transmission site. Incidence was higher among younger children entering school and during school days. The researchers say boys were more at risk than girls, possibly because they have more physical interactions or poorer personal hygiene. Thus, school-based control measures—especially for boys aged 3 to 5 years—could be “particularly important.”
Interhospital Transfer and Receipt of Specialty Procedures
Patients who undergo interhospital transfer (IHT) are felt to benefit from receipt of unique specialty care at the receiving hospital.1 Although only 1.5% of all hospitalized Medicare patients undergo hospital transfer,2 the frequency of transfer is much greater within certain patient populations, as may be expected with diagnoses requiring specialty care.3,4 Existent data demonstrate that 5% of Medicare patients admitted to the intensive care unit (ICU)5 and up to 50% of patients presenting with acute myocardial infarction (AMI) undergo IHT.6
More recent data suggest variability in hospital transfer practices not accounted for by differences in patient or hospital characteristics.2 Although disease-specific guidelines for IHT exist for certain diagnoses,3,4 the process remains largely nonstandardized for many patients,7 leading to ambiguity surrounding indications for transfer. Because limited data suggest worse outcomes for transferred versus nontransferred patients,8 a better understanding of the specialized care patients actually receive across the transfer continuum may help to elucidate potential indications for transfer and ultimately help delineate which patients are most (or least) likely to benefit from transfer and why.
In this national study, we examined a select cohort of transferred patients with diagnoses associated with specific specialty procedural services to determine if they received these procedures and where along the transfer continuum they were performed.
METHODS
We performed a cross-sectional analysis using the Center for Medicare and Medicaid Services 2013 100% Master Beneficiary Summary and Inpatient claims files. Our study protocol was approved by the Partners Healthcare Human Subjects Review Committee.
Beneficiaries were eligible for inclusion if they were aged ≥65 years, continuously enrolled in Medicare A and B, and with an acute care hospitalization claim in 2013, excluding Medicare managed care and end stage renal disease beneficiaries due to incomplete claims data in these groups. We additionally excluded beneficiaries hospitalized at federal or nonacute care hospitals, or critical access hospitals given their mission to stabilize and then transfer patients to referral hospitals.9
Transferred patients were defined as beneficiaries with corresponding “transfer in” and “transfer out” claims, or those with either claim and a corresponding date of admission/discharge from another hospital within 1 day of the claim, as we used in our prior research.2 Beneficiaries transferred to the same hospital, those with greater than 1 transfer within the same hospitalization, or those cared for at hospitals with “outlier” transfer-in rates equal to 100% or transfer-out rates greater than 35% were excluded from analysis given the suggestion of nonstandard claims practices.
We first identified the top 15 primary diagnoses at time of transfer using International Classification of Diseases, Ninth Revision (ICD-9) codes (supplementary Appendix), and then identified those 4 most likely to require specialty procedural services: AMI, gastrointestinal bleed (GI bleed), renal failure, and hip fracture/dislocation. We then chose associated ICD-9 procedure codes for each diagnosis, via expert opinion (authors SM and JS, hospitalist physicians with greater than 20 years of combined clinical experience), erring on overinclusion of procedure codes. We then quantified receipt of associated procedures at transferring and receiving hospitals, stratified by diagnosis.
We further explored the cohort of patients with hip fracture/dislocation who underwent an associated procedure at the transferring but not receiving hospital, examining the frequency with which these patients had other (nonrelated) procedures at the receiving hospital, and identifying which procedures they received.
RESULTS
Of the 101,507 patients transferred to another hospital, 19,613 (19.3%) had a primary diagnosis of AMI, GI bleed, renal failure, or hip fracture/dislocation. Table 1 lists the ICD-9 procedure codes associated with each diagnosis.
Distribution of receipt of specialty procedures at the transferring and receiving hospitals varied by disease (Figure). With the exception of GI bleed, patients more often received specialty procedural care at the receiving than the transferring hospital. Depending on primary diagnosis, between 32.4% and 89.1% of patients did not receive any associated specialty procedure at the receiving hospital.
Of the 370 (22.1%) hip fracture/dislocation patients that received a specialty procedure at the transferring but not receiving hospital, 132 (35.7%) did not receive any procedure at the receiving hospital, whereas the remaining 238 (64.3%) received an unrelated (not associated with the primary diagnosis) procedure. There was great variety in the types of procedures received, the most common being transfusion of blood products (ICD-9 Clinical Modification 9904).
DISCUSSION
Among transferred patients with primary diagnoses that have clearly associated specialized procedural services, we found that patients received these procedures at varying frequency and locations across the transfer continuum. Across 4 diagnoses, receipt of associated procedures was more common at the receiving than the transferring hospital, with the exception being patients with GI bleed. We additionally found that many transferred patients did not receive any associated specialty procedure at the receiving hospital. These findings suggest the strong likelihood of more diverse underlying reasons for transfer rather than solely receipt of specialized procedural care.
Despite the frequency with which AMI patients are transferred,6 and American Heart Association guidelines directing hospitals to transfer AMI patients to institutions able to provide necessary invasive treatments,4 prior studies suggest these patients inconsistently receive specialty intervention following transfer, including stress testing, cardiac catheterization, or coronary artery bypass graft surgery.10,11 Our findings add to these data, demonstrating that only 47.3% of patients transferred with AMI received any cardiac-related procedure at the receiving hospital. Additionally, we found that 38.1% of AMI patients do not receive any specialty procedures at either the transferring or the receiving hospital. Taken together, these data suggest possible discrepancies in the perceived need for these procedures between transferring and receiving hospitals, reasons for transfer related to these conditions that don’t involve an associated procedure, or reasons for transfer unrelated to specialty care of the primary diagnosis (such as care of comorbidities, hospital location, prior relationships with that hospital, or desire for a second opinion). Although some of these alternate reasons for transfer likely still benefit the patient, some of these reasons may not justify the increased risks of discontinuity of care created by IHT.
Given limited data looking at IHT practices for patients with other diagnoses, the varying patterns of specialty procedural interventions we observed among transferred patients with GI bleed, renal failure, and hip fracture/dislocation are novel contributions to this topic. Notably, we found that among patients transferred with a primary diagnosis of renal failure, the vast majority (84.1%) did not receive any associated procedure at either the transferring or the receiving hospital. It is possible that although these patients carried the diagnosis of renal failure, their clinical phenotype is more heterogeneous, and they could still be managed conservatively without receipt of invasive procedures such as hemodialysis.
Conversely, patients transferred with primary diagnosis of hip fracture/dislocation were far more likely to receive associated specialty procedural intervention at the receiving hospital, presumably reflective of the evidence demonstrating improved outcomes with early surgical intervention.12 However, these data do not explain the reasoning behind the substantial minority of patients who received specialty intervention at the transferring hospital prior to transfer or those that did not receive any specialty intervention at either the transferring or receiving hospital. Our secondary analysis demonstrating great variety in receipt and type of nonassociated procedures provided at the receiving hospital did not help to elucidate potential underlying reasons for transfer.
Notably, among patients transferred with primary diagnosis of GI bleed, receipt of specialty procedures was more common at the transferring (77.7%) than receiving (63.2%) hospital, with nearly half (49.3%) undergoing specialty procedures at both hospitals. It is possible that these findings are reflective of the broad array of specialty procedures examined within this diagnosis. For example, it is reasonable to consider that a patient may be stabilized with receipt of a blood transfusion at the transferring hospital, then transferred to undergo a diagnostic/therapeutic procedure (ie, endoscopy/colonoscopy) at the receiving hospital, as is suggested by our results.
Our study is subject to several limitations. First, given the criteria we used to define transfer, it is possible that we included nontransferred patients within our transferred cohort if they were discharged from one hospital and admitted to a different hospital within 1 day, although quality assurance analyses we conducted in prior studies on these data support the validity of the criteria used.2 Second, we cannot exclude the possibility that patients received nonprocedural specialty care (ie, expert opinion, specialized imaging, medical management, management of secondary diagnoses, etc.) not available at the transferring hospital, although, arguably, in select patients, such input could be obtained without physical transfer of the patient (ie, tele-consult). And even in patients transferred with intent to receive procedural care who did not ultimately receive that care, there is likely an appropriate “nonprocedure” rate, where patients who might benefit from a procedure receive a timely evaluation to reduce the risk of missing the opportunity to receive it. This would be analogous to transferring a patient to an ICU even if they do not end up requiring intubation or pressor therapy. However, given the likelihood of higher risks of IHT compared with intrahospital transfers, one could argue that the threshold of perceived benefit might be different in patients being considered for IHT. Additionally, we limited our analyses to only 4 diagnoses; thus, our findings may not be generalizable to other diagnoses of transferred patients. However, because the diagnoses we examined were ones considered most effectively treated with specialty procedural interventions, it is reasonable to presume that the variability in receipt of specialty procedures observed within these diagnoses is also present, if not greater, across other diagnoses. Third, although we intentionally included a broad array of specialty procedures associated with each diagnosis, it is possible that we overlooked particular specialty interventions. For example, in assuming that patients are most likely to be transferred to receive procedural services associated with their primary diagnosis, we may have missed alternate indications for transfer, including need for procedural care related to secondary or subsequent diagnoses (ie, a patient may have presented with GI bleed
CONCLUSIONS
We found that Medicare patients who undergo IHT with primary diagnoses of AMI, GI bleed, renal failure, and hip fracture/dislocation receive associated specialty interventions at varying frequency and locations, and many patients do not receive any associated procedures at receiving hospitals. Our findings suggest that specialty procedural care of patients, even those with primary diagnoses that often warrant specialized intervention, may not be the primary driver of IHT as commonly suggested, although underlying reasons for transfer in these and other “nonprocedural” transferred patients remains obscure. Given known ambiguity in the transfer process,7 and unclear benefit of IHT,8 additional research is required to further identify and evaluate other potential underlying reasons for transfer and to examine these in the context of patient outcomes, in order to understand which patients may or may not benefit from transfer and why.
Disclosure
The authors have nothing to disclose.
1. Iwashyna TJ. The incomplete infrastructure for interhospital patient transfer. Crit Care Med. 2012;40(8):2470-2478. PubMed
2. Mueller SK, Zheng J, Orav EJ, Schnipper JL. Rates, Predictors and Variability of Interhospital Transfers: A National Evaluation. J Hosp Med. 2017;12(6):435-442. PubMed
3. Guidelines for the transfer of critically ill patients. Guidelines Committee of the American College of Critical Care Medicine; Society of Critical Care Medicine and American Association of Critical-Care Nurses Transfer Guidelines Task Force. Crit Care Med. 1993;21(6):931-937. PubMed
4. Anderson JL, Adams CD, Antman EM, et al. 2011 ACCF/AHA Focused Update Incorporated Into the ACC/AHA 2007 Guidelines for the Management of Patients With Unstable Angina/Non-ST-Elevation Myocardial Infarction: a report of the American College of Cardiology Foundation/American Heart Association Task Force on Practice Guidelines. Circulation. 2011;123(18):e426-e579. PubMed
5. Iwashyna TJ, Christie JD, Moody J, Kahn JM, Asch DA. The structure of critical care transfer networks. Med Care. 2009;47(7):787-793. PubMed
6. Iwashyna TJ, Kahn JM, Hayward RA, Nallamothu BK. Interhospital transfers among Medicare beneficiaries admitted for acute myocardial infarction at nonrevascularization hospitals. Circ Cardiovasc Qual Outcomes. 2010;3(5):468-475. PubMed
7. Bosk EA, Veinot T, Iwashyna TJ. Which patients and where: a qualitative study of patient transfers from community hospitals. Med Care. 2011;49(6):592-598. PubMed
8. Sokol-Hessner L, White AA, Davis KF, Herzig SJ, Hohmann SF. Interhospital transfer patients discharged by academic hospitalists and general internists: Characteristics and outcomes. J Hosp Med. 2016;11(4):245-250. PubMed
9. Department of Health and Human Services, Center for Medicare & Medicaid Services: Critical Access Hospitals. https://www.cms.gov/Outreach-and-Education/Medicare-Learning-Network-MLN/MLNProducts/downloads/CritAccessHospfctsht.pdf. Accessed June 29, 2017. PubMed
10. Roe MT, Chen AY, Delong ER, et al. Patterns of transfer for patients with non-ST-segment elevation acute coronary syndrome from community to tertiary care hospitals. Am Heart J. 2008;156(1):185-192. PubMed
11. Barreto-Filho JA, Wang Y, Rathore SS, et al. Transfer rates from nonprocedure hospitals after initial admission and outcomes among elderly patients with acute myocardial infarction. JAMA Intern Med. 2014;174(2):213-222. PubMed
12. Doruk H, Mas MR, Yildiz C, Sonmez A, Kyrdemir V. The effect of the timing of hip fracture surgery on the activity of daily living and mortality in elderly. Arch Gerontol Geriatr. 2004;39(2):179-185. PubMed
Patients who undergo interhospital transfer (IHT) are felt to benefit from receipt of unique specialty care at the receiving hospital.1 Although only 1.5% of all hospitalized Medicare patients undergo hospital transfer,2 the frequency of transfer is much greater within certain patient populations, as may be expected with diagnoses requiring specialty care.3,4 Existent data demonstrate that 5% of Medicare patients admitted to the intensive care unit (ICU)5 and up to 50% of patients presenting with acute myocardial infarction (AMI) undergo IHT.6
More recent data suggest variability in hospital transfer practices not accounted for by differences in patient or hospital characteristics.2 Although disease-specific guidelines for IHT exist for certain diagnoses,3,4 the process remains largely nonstandardized for many patients,7 leading to ambiguity surrounding indications for transfer. Because limited data suggest worse outcomes for transferred versus nontransferred patients,8 a better understanding of the specialized care patients actually receive across the transfer continuum may help to elucidate potential indications for transfer and ultimately help delineate which patients are most (or least) likely to benefit from transfer and why.
In this national study, we examined a select cohort of transferred patients with diagnoses associated with specific specialty procedural services to determine if they received these procedures and where along the transfer continuum they were performed.
METHODS
We performed a cross-sectional analysis using the Center for Medicare and Medicaid Services 2013 100% Master Beneficiary Summary and Inpatient claims files. Our study protocol was approved by the Partners Healthcare Human Subjects Review Committee.
Beneficiaries were eligible for inclusion if they were aged ≥65 years, continuously enrolled in Medicare A and B, and with an acute care hospitalization claim in 2013, excluding Medicare managed care and end stage renal disease beneficiaries due to incomplete claims data in these groups. We additionally excluded beneficiaries hospitalized at federal or nonacute care hospitals, or critical access hospitals given their mission to stabilize and then transfer patients to referral hospitals.9
Transferred patients were defined as beneficiaries with corresponding “transfer in” and “transfer out” claims, or those with either claim and a corresponding date of admission/discharge from another hospital within 1 day of the claim, as we used in our prior research.2 Beneficiaries transferred to the same hospital, those with greater than 1 transfer within the same hospitalization, or those cared for at hospitals with “outlier” transfer-in rates equal to 100% or transfer-out rates greater than 35% were excluded from analysis given the suggestion of nonstandard claims practices.
We first identified the top 15 primary diagnoses at time of transfer using International Classification of Diseases, Ninth Revision (ICD-9) codes (supplementary Appendix), and then identified those 4 most likely to require specialty procedural services: AMI, gastrointestinal bleed (GI bleed), renal failure, and hip fracture/dislocation. We then chose associated ICD-9 procedure codes for each diagnosis, via expert opinion (authors SM and JS, hospitalist physicians with greater than 20 years of combined clinical experience), erring on overinclusion of procedure codes. We then quantified receipt of associated procedures at transferring and receiving hospitals, stratified by diagnosis.
We further explored the cohort of patients with hip fracture/dislocation who underwent an associated procedure at the transferring but not receiving hospital, examining the frequency with which these patients had other (nonrelated) procedures at the receiving hospital, and identifying which procedures they received.
RESULTS
Of the 101,507 patients transferred to another hospital, 19,613 (19.3%) had a primary diagnosis of AMI, GI bleed, renal failure, or hip fracture/dislocation. Table 1 lists the ICD-9 procedure codes associated with each diagnosis.
Distribution of receipt of specialty procedures at the transferring and receiving hospitals varied by disease (Figure). With the exception of GI bleed, patients more often received specialty procedural care at the receiving than the transferring hospital. Depending on primary diagnosis, between 32.4% and 89.1% of patients did not receive any associated specialty procedure at the receiving hospital.
Of the 370 (22.1%) hip fracture/dislocation patients that received a specialty procedure at the transferring but not receiving hospital, 132 (35.7%) did not receive any procedure at the receiving hospital, whereas the remaining 238 (64.3%) received an unrelated (not associated with the primary diagnosis) procedure. There was great variety in the types of procedures received, the most common being transfusion of blood products (ICD-9 Clinical Modification 9904).
DISCUSSION
Among transferred patients with primary diagnoses that have clearly associated specialized procedural services, we found that patients received these procedures at varying frequency and locations across the transfer continuum. Across 4 diagnoses, receipt of associated procedures was more common at the receiving than the transferring hospital, with the exception being patients with GI bleed. We additionally found that many transferred patients did not receive any associated specialty procedure at the receiving hospital. These findings suggest the strong likelihood of more diverse underlying reasons for transfer rather than solely receipt of specialized procedural care.
Despite the frequency with which AMI patients are transferred,6 and American Heart Association guidelines directing hospitals to transfer AMI patients to institutions able to provide necessary invasive treatments,4 prior studies suggest these patients inconsistently receive specialty intervention following transfer, including stress testing, cardiac catheterization, or coronary artery bypass graft surgery.10,11 Our findings add to these data, demonstrating that only 47.3% of patients transferred with AMI received any cardiac-related procedure at the receiving hospital. Additionally, we found that 38.1% of AMI patients do not receive any specialty procedures at either the transferring or the receiving hospital. Taken together, these data suggest possible discrepancies in the perceived need for these procedures between transferring and receiving hospitals, reasons for transfer related to these conditions that don’t involve an associated procedure, or reasons for transfer unrelated to specialty care of the primary diagnosis (such as care of comorbidities, hospital location, prior relationships with that hospital, or desire for a second opinion). Although some of these alternate reasons for transfer likely still benefit the patient, some of these reasons may not justify the increased risks of discontinuity of care created by IHT.
Given limited data looking at IHT practices for patients with other diagnoses, the varying patterns of specialty procedural interventions we observed among transferred patients with GI bleed, renal failure, and hip fracture/dislocation are novel contributions to this topic. Notably, we found that among patients transferred with a primary diagnosis of renal failure, the vast majority (84.1%) did not receive any associated procedure at either the transferring or the receiving hospital. It is possible that although these patients carried the diagnosis of renal failure, their clinical phenotype is more heterogeneous, and they could still be managed conservatively without receipt of invasive procedures such as hemodialysis.
Conversely, patients transferred with primary diagnosis of hip fracture/dislocation were far more likely to receive associated specialty procedural intervention at the receiving hospital, presumably reflective of the evidence demonstrating improved outcomes with early surgical intervention.12 However, these data do not explain the reasoning behind the substantial minority of patients who received specialty intervention at the transferring hospital prior to transfer or those that did not receive any specialty intervention at either the transferring or receiving hospital. Our secondary analysis demonstrating great variety in receipt and type of nonassociated procedures provided at the receiving hospital did not help to elucidate potential underlying reasons for transfer.
Notably, among patients transferred with primary diagnosis of GI bleed, receipt of specialty procedures was more common at the transferring (77.7%) than receiving (63.2%) hospital, with nearly half (49.3%) undergoing specialty procedures at both hospitals. It is possible that these findings are reflective of the broad array of specialty procedures examined within this diagnosis. For example, it is reasonable to consider that a patient may be stabilized with receipt of a blood transfusion at the transferring hospital, then transferred to undergo a diagnostic/therapeutic procedure (ie, endoscopy/colonoscopy) at the receiving hospital, as is suggested by our results.
Our study is subject to several limitations. First, given the criteria we used to define transfer, it is possible that we included nontransferred patients within our transferred cohort if they were discharged from one hospital and admitted to a different hospital within 1 day, although quality assurance analyses we conducted in prior studies on these data support the validity of the criteria used.2 Second, we cannot exclude the possibility that patients received nonprocedural specialty care (ie, expert opinion, specialized imaging, medical management, management of secondary diagnoses, etc.) not available at the transferring hospital, although, arguably, in select patients, such input could be obtained without physical transfer of the patient (ie, tele-consult). And even in patients transferred with intent to receive procedural care who did not ultimately receive that care, there is likely an appropriate “nonprocedure” rate, where patients who might benefit from a procedure receive a timely evaluation to reduce the risk of missing the opportunity to receive it. This would be analogous to transferring a patient to an ICU even if they do not end up requiring intubation or pressor therapy. However, given the likelihood of higher risks of IHT compared with intrahospital transfers, one could argue that the threshold of perceived benefit might be different in patients being considered for IHT. Additionally, we limited our analyses to only 4 diagnoses; thus, our findings may not be generalizable to other diagnoses of transferred patients. However, because the diagnoses we examined were ones considered most effectively treated with specialty procedural interventions, it is reasonable to presume that the variability in receipt of specialty procedures observed within these diagnoses is also present, if not greater, across other diagnoses. Third, although we intentionally included a broad array of specialty procedures associated with each diagnosis, it is possible that we overlooked particular specialty interventions. For example, in assuming that patients are most likely to be transferred to receive procedural services associated with their primary diagnosis, we may have missed alternate indications for transfer, including need for procedural care related to secondary or subsequent diagnoses (ie, a patient may have presented with GI bleed
CONCLUSIONS
We found that Medicare patients who undergo IHT with primary diagnoses of AMI, GI bleed, renal failure, and hip fracture/dislocation receive associated specialty interventions at varying frequency and locations, and many patients do not receive any associated procedures at receiving hospitals. Our findings suggest that specialty procedural care of patients, even those with primary diagnoses that often warrant specialized intervention, may not be the primary driver of IHT as commonly suggested, although underlying reasons for transfer in these and other “nonprocedural” transferred patients remains obscure. Given known ambiguity in the transfer process,7 and unclear benefit of IHT,8 additional research is required to further identify and evaluate other potential underlying reasons for transfer and to examine these in the context of patient outcomes, in order to understand which patients may or may not benefit from transfer and why.
Disclosure
The authors have nothing to disclose.
1. Iwashyna TJ. The incomplete infrastructure for interhospital patient transfer. Crit Care Med. 2012;40(8):2470-2478. PubMed
2. Mueller SK, Zheng J, Orav EJ, Schnipper JL. Rates, Predictors and Variability of Interhospital Transfers: A National Evaluation. J Hosp Med. 2017;12(6):435-442. PubMed
3. Guidelines for the transfer of critically ill patients. Guidelines Committee of the American College of Critical Care Medicine; Society of Critical Care Medicine and American Association of Critical-Care Nurses Transfer Guidelines Task Force. Crit Care Med. 1993;21(6):931-937. PubMed
4. Anderson JL, Adams CD, Antman EM, et al. 2011 ACCF/AHA Focused Update Incorporated Into the ACC/AHA 2007 Guidelines for the Management of Patients With Unstable Angina/Non-ST-Elevation Myocardial Infarction: a report of the American College of Cardiology Foundation/American Heart Association Task Force on Practice Guidelines. Circulation. 2011;123(18):e426-e579. PubMed
5. Iwashyna TJ, Christie JD, Moody J, Kahn JM, Asch DA. The structure of critical care transfer networks. Med Care. 2009;47(7):787-793. PubMed
6. Iwashyna TJ, Kahn JM, Hayward RA, Nallamothu BK. Interhospital transfers among Medicare beneficiaries admitted for acute myocardial infarction at nonrevascularization hospitals. Circ Cardiovasc Qual Outcomes. 2010;3(5):468-475. PubMed
7. Bosk EA, Veinot T, Iwashyna TJ. Which patients and where: a qualitative study of patient transfers from community hospitals. Med Care. 2011;49(6):592-598. PubMed
8. Sokol-Hessner L, White AA, Davis KF, Herzig SJ, Hohmann SF. Interhospital transfer patients discharged by academic hospitalists and general internists: Characteristics and outcomes. J Hosp Med. 2016;11(4):245-250. PubMed
9. Department of Health and Human Services, Center for Medicare & Medicaid Services: Critical Access Hospitals. https://www.cms.gov/Outreach-and-Education/Medicare-Learning-Network-MLN/MLNProducts/downloads/CritAccessHospfctsht.pdf. Accessed June 29, 2017. PubMed
10. Roe MT, Chen AY, Delong ER, et al. Patterns of transfer for patients with non-ST-segment elevation acute coronary syndrome from community to tertiary care hospitals. Am Heart J. 2008;156(1):185-192. PubMed
11. Barreto-Filho JA, Wang Y, Rathore SS, et al. Transfer rates from nonprocedure hospitals after initial admission and outcomes among elderly patients with acute myocardial infarction. JAMA Intern Med. 2014;174(2):213-222. PubMed
12. Doruk H, Mas MR, Yildiz C, Sonmez A, Kyrdemir V. The effect of the timing of hip fracture surgery on the activity of daily living and mortality in elderly. Arch Gerontol Geriatr. 2004;39(2):179-185. PubMed
© 2017 Society of Hospital Medicine
617-732-7072; E-mail: smueller1@bwh.harvard.edu
Primary Care Provider Preferences for Communication with Inpatient Teams: One Size Does Not Fit All
As the hospitalist’s role in medicine grows, the transition of care from inpatient to primary care providers (PCPs, including primary care physicians, nurse practitioners, or physician assistants), becomes increasingly important. Inadequate communication at this transition is associated with preventable adverse events leading to rehospitalization, disability, and death.1-
Providing PCPs access to the inpatient electronic health record (EHR) may reduce the need for active communication. However, a recent survey of PCPs in the general internal medicine division of an academic hospital found a strong preference for additional communication with inpatient providers, despite a shared EHR.5
We examined communication preferences of general internal medicine PCPs at a different academic institution and extended our study to include community-based PCPs who were both affiliated and unaffiliated with the institution.
METHODS
Between October 2015 and June 2016, we surveyed PCPs from 3 practice groups with institutional affiliation or proximity to The Johns Hopkins Hospital: all general internal medicine faculty with outpatient practices (“academic,” 2 practice sites, n = 35), all community-based PCPs affiliated with the health system (“community,” 36 practice sites, n = 220), and all PCPs from an unaffiliated managed care organization (“unaffiliated,” 5 practice sites ranging from 0.3 to 4 miles from The Johns Hopkins Hospital, n = 29).
All groups have work-sponsored e-mail services. At the time of the survey, both the academic and community groups used an EHR that allowed access to inpatient laboratory and radiology data and discharge summaries. The unaffiliated group used paper health records. The hospital faxes discharge summaries to all PCPs who are identified by patients.
The investigators and representatives from each practice group collaborated to develop 15 questions with mutually exclusive answers to evaluate PCP experiences with and preferences for communication with inpatient teams. The survey was constructed and administered through Qualtrics’ online platform (Qualtrics, Provo, UT) and distributed via e-mail. The study was reviewed and acknowledged by the Johns Hopkins institutional review board as quality improvement activity.
The survey contained branching logic. Only respondents who indicated preference for communication received questions regarding preferred mode of communication. We used the preferred mode of communication for initial contact from the inpatient team in our analysis. χ2 and Fischer’s exact tests were performed with JMP 12 software (SAS Institute Inc, Cary, NC).
RESULTS
Fourteen (40%) academic, 43 (14%) community, and 16 (55%) unaffiliated PCPs completed the survey, for 73 total responses from 284 surveys distributed (26%).
Among the 73 responding PCPs, 31 (42%) reported receiving notification of admission during “every” or “almost every” hospitalization, with no significant variation across practice groups (P = 0.5).
Across all groups, 64 PCPs (88%) preferred communication at 1 or more points during hospitalizations (panel A of Figure). “Both upon admission and prior to discharge” was selected most frequently, and there were no differences between practice groups (P = 0.2).
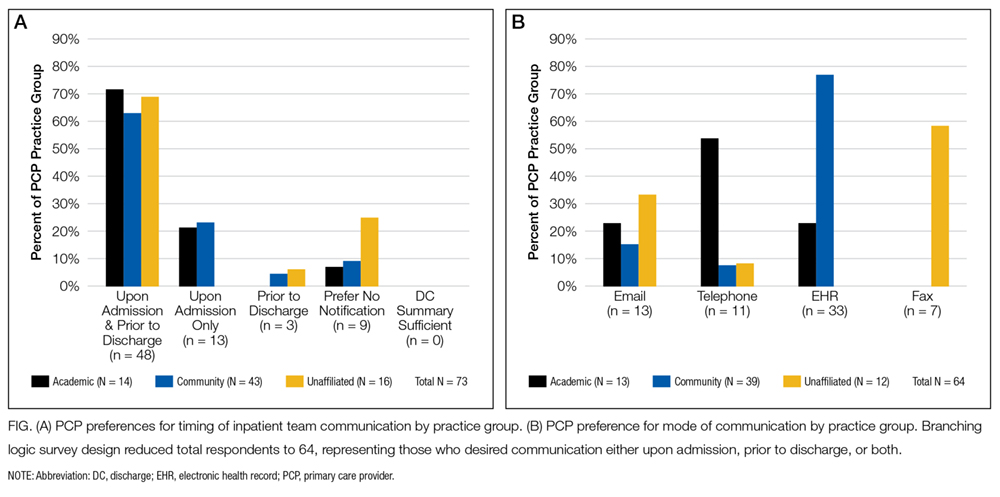
Preferred mode of communication, however, differed significantly between groups (panel B of Figure). The academic group had a greater preference for telephone (54%) than the community (8%; P < 0.001) and unaffiliated groups (8%; P < 0.001), the community group a greater preference for EHR (77%) than the academic (23%; P = 0.002) and unaffiliated groups (0%; P < 0.001), and the unaffiliated group a greater preference for fax (58%) than the other groups (both 0%; P < 0.001).
DISCUSSION
Our findings add to previous evidence of low rates of communication between inpatient providers and PCPs6 and a preference from PCPs for communication during hospitalizations despite shared EHRs.5 We extend previous work by demonstrating that PCP preferences for mode of communication vary by practice setting. Our findings lead us to hypothesize that identifying and incorporating PCP preferences may improve communication, though at the potential expense of standardization and efficiency.
There may be several reasons for the differing communication preferences observed. Most academic PCPs are located near or have admitting privileges to the hospital and are not in clinic full time. Their preference for the telephone may thus result from interpersonal relationships born from proximity and greater availability for telephone calls, or reduced fluency with the EHR compared to full-time community clinicians.
The unaffiliated group’s preference for fax may reflect a desire for communication that integrates easily with paper charts and is least disruptive to workflow, or concerns about health information confidentiality in e-mails.
Our study’s generalizability is limited by a low response rate, though it is comparable to prior studies.7 The unaffiliated group was accessed by convenience (acquaintance with the medical director); however, we note it had the highest response rate (55%).
In summary, we found low rates of communication between inpatient providers and PCPs, despite a strong preference from most PCPs for such communication during hospitalizations. PCPs’ preferred mode of communication differed based on practice setting. Addressing PCP communication preferences may be important to future care transition interventions.
Disclosure
The authors report no conflicts of interest.
1. Forster AJ, Murff HJ, Peterson JF, Gandhi TK, Bates DW. The incidence and severity of adverse events affecting patients after discharge from the hospital. Ann Intern Med. 2003;138(3):161-174. PubMed
2. Moore C, Wisnivesky J, Williams S, McGinn T. Medical errors related to discontinuity of care from an inpatient to an outpatient setting. J Gen Intern Med. 2003;18(8):646-651. PubMed
3. van Walraven C, Mamdani M, Fang J, Austin PC. Continuity of care and patient outcomes after hospital discharge. J Gen Intern Med. 2004;19(6):624-631. PubMed
4. Snow V, Beck D, Budnitz T, et al. Transitions of Care Consensus policy statement: American College of Physicians, Society of General Internal Medicine, Society of Hospital Medicine, American Geriatrics Society, American College Of Emergency Physicians, and Society for Academic Emergency M. J Hosp Med. 2009;4(6):364-370. PubMed
5. Sheu L, Fung K, Mourad M, Ranji S, Wu E. We need to talk: Primary care provider communication at discharge in the era of a shared electronic medical record. J Hosp Med. 2015;10(5):307-310. PubMed
6. Kripalani S, LeFevre F, Phillips CO, Williams MV, Basaviah P, Baker DW. Deficits in communication and information transfer between hospital-based and primary care physicians. JAMA. 2007;297(8):831-841. PubMed
7. Pantilat SZ, Lindenauer PK, Katz PP, Wachter RM. Primary care physician attitudes regarding communication with hospitalists. Am J Med. 2001(9B);111:15-20. PubMed
As the hospitalist’s role in medicine grows, the transition of care from inpatient to primary care providers (PCPs, including primary care physicians, nurse practitioners, or physician assistants), becomes increasingly important. Inadequate communication at this transition is associated with preventable adverse events leading to rehospitalization, disability, and death.1-
Providing PCPs access to the inpatient electronic health record (EHR) may reduce the need for active communication. However, a recent survey of PCPs in the general internal medicine division of an academic hospital found a strong preference for additional communication with inpatient providers, despite a shared EHR.5
We examined communication preferences of general internal medicine PCPs at a different academic institution and extended our study to include community-based PCPs who were both affiliated and unaffiliated with the institution.
METHODS
Between October 2015 and June 2016, we surveyed PCPs from 3 practice groups with institutional affiliation or proximity to The Johns Hopkins Hospital: all general internal medicine faculty with outpatient practices (“academic,” 2 practice sites, n = 35), all community-based PCPs affiliated with the health system (“community,” 36 practice sites, n = 220), and all PCPs from an unaffiliated managed care organization (“unaffiliated,” 5 practice sites ranging from 0.3 to 4 miles from The Johns Hopkins Hospital, n = 29).
All groups have work-sponsored e-mail services. At the time of the survey, both the academic and community groups used an EHR that allowed access to inpatient laboratory and radiology data and discharge summaries. The unaffiliated group used paper health records. The hospital faxes discharge summaries to all PCPs who are identified by patients.
The investigators and representatives from each practice group collaborated to develop 15 questions with mutually exclusive answers to evaluate PCP experiences with and preferences for communication with inpatient teams. The survey was constructed and administered through Qualtrics’ online platform (Qualtrics, Provo, UT) and distributed via e-mail. The study was reviewed and acknowledged by the Johns Hopkins institutional review board as quality improvement activity.
The survey contained branching logic. Only respondents who indicated preference for communication received questions regarding preferred mode of communication. We used the preferred mode of communication for initial contact from the inpatient team in our analysis. χ2 and Fischer’s exact tests were performed with JMP 12 software (SAS Institute Inc, Cary, NC).
RESULTS
Fourteen (40%) academic, 43 (14%) community, and 16 (55%) unaffiliated PCPs completed the survey, for 73 total responses from 284 surveys distributed (26%).
Among the 73 responding PCPs, 31 (42%) reported receiving notification of admission during “every” or “almost every” hospitalization, with no significant variation across practice groups (P = 0.5).
Across all groups, 64 PCPs (88%) preferred communication at 1 or more points during hospitalizations (panel A of Figure). “Both upon admission and prior to discharge” was selected most frequently, and there were no differences between practice groups (P = 0.2).
Preferred mode of communication, however, differed significantly between groups (panel B of Figure). The academic group had a greater preference for telephone (54%) than the community (8%; P < 0.001) and unaffiliated groups (8%; P < 0.001), the community group a greater preference for EHR (77%) than the academic (23%; P = 0.002) and unaffiliated groups (0%; P < 0.001), and the unaffiliated group a greater preference for fax (58%) than the other groups (both 0%; P < 0.001).
DISCUSSION
Our findings add to previous evidence of low rates of communication between inpatient providers and PCPs6 and a preference from PCPs for communication during hospitalizations despite shared EHRs.5 We extend previous work by demonstrating that PCP preferences for mode of communication vary by practice setting. Our findings lead us to hypothesize that identifying and incorporating PCP preferences may improve communication, though at the potential expense of standardization and efficiency.
There may be several reasons for the differing communication preferences observed. Most academic PCPs are located near or have admitting privileges to the hospital and are not in clinic full time. Their preference for the telephone may thus result from interpersonal relationships born from proximity and greater availability for telephone calls, or reduced fluency with the EHR compared to full-time community clinicians.
The unaffiliated group’s preference for fax may reflect a desire for communication that integrates easily with paper charts and is least disruptive to workflow, or concerns about health information confidentiality in e-mails.
Our study’s generalizability is limited by a low response rate, though it is comparable to prior studies.7 The unaffiliated group was accessed by convenience (acquaintance with the medical director); however, we note it had the highest response rate (55%).
In summary, we found low rates of communication between inpatient providers and PCPs, despite a strong preference from most PCPs for such communication during hospitalizations. PCPs’ preferred mode of communication differed based on practice setting. Addressing PCP communication preferences may be important to future care transition interventions.
Disclosure
The authors report no conflicts of interest.
1. Forster AJ, Murff HJ, Peterson JF, Gandhi TK, Bates DW. The incidence and severity of adverse events affecting patients after discharge from the hospital. Ann Intern Med. 2003;138(3):161-174. PubMed
2. Moore C, Wisnivesky J, Williams S, McGinn T. Medical errors related to discontinuity of care from an inpatient to an outpatient setting. J Gen Intern Med. 2003;18(8):646-651. PubMed
3. van Walraven C, Mamdani M, Fang J, Austin PC. Continuity of care and patient outcomes after hospital discharge. J Gen Intern Med. 2004;19(6):624-631. PubMed
4. Snow V, Beck D, Budnitz T, et al. Transitions of Care Consensus policy statement: American College of Physicians, Society of General Internal Medicine, Society of Hospital Medicine, American Geriatrics Society, American College Of Emergency Physicians, and Society for Academic Emergency M. J Hosp Med. 2009;4(6):364-370. PubMed
5. Sheu L, Fung K, Mourad M, Ranji S, Wu E. We need to talk: Primary care provider communication at discharge in the era of a shared electronic medical record. J Hosp Med. 2015;10(5):307-310. PubMed
6. Kripalani S, LeFevre F, Phillips CO, Williams MV, Basaviah P, Baker DW. Deficits in communication and information transfer between hospital-based and primary care physicians. JAMA. 2007;297(8):831-841. PubMed
7. Pantilat SZ, Lindenauer PK, Katz PP, Wachter RM. Primary care physician attitudes regarding communication with hospitalists. Am J Med. 2001(9B);111:15-20. PubMed
© 2017 Society of Hospital Medicine
sberry8@jhmi.edu