User login
Proposed In-Training Electrocardiogram Interpretation Competencies for Undergraduate and Postgraduate Trainees
The 12-lead electrocardiogram (ECG) remains one of the most widely used and readily available diagnostic tests in modern medicine.1 Reflecting the electrical behavior of the heart, this point-of-care diagnostic test is used in almost every area of medicine for diagnosis, prognostication, and selection of appropriate treatment. The ECG is sometimes the only and most efficient way of detecting life-threatening conditions, thus allowing a timely delivery of emergency care.2 However, the practical power of the 12-lead ECG relies on the ability of the clinician to interpret this test correctly.
For decades, ECG interpretation has been a core component of undergraduate and postgraduate medical training.3-5 Unfortunately, numerous studies have demonstrated alarming rates of inaccuracy and variability in interpreting ECGs among trainees at all levels of education.4,6,7 Senior medical students have been repeatedly shown to miss 26% to 62% of acute myocardial infarctions (MI).6,8-10 Another recent study involving internal medicine residents demonstrated that only half of the straightforward common ECGs were interpreted correctly, while 26% of trainees missed an acute MI and 56% missed ventricular tachycardia (VT).11 Even cardiology subspecialty fellows demonstrated poor performance, missing up to 26% of ST-elevation MIs on ECGs that had multiple findings.12 Inaccurate interpretations of ECGs can lead to inappropriate management decisions, adverse patient outcomes, unnecessary additional testing, and even preventable deaths.4,13-15
Several guidelines have emphasized the importance of teaching trainees 12-lead ECG interpretation and have recognized the value of assessments in ensuring that learners acquire the necessary competencies.16-19 Similarly, there have been many calls for more rigorous and structured curricula for ECG interpretation throughout undergraduate and postgraduate medical education.11,16 However, we still lack a thoughtful guideline outlining the specific competencies that medical trainees should attain. This includes medical students, nurses working in hospital and in out-of-hospital settings, and residents of different specialties, including emergency medicine, cardiology, and electrophysiology (EP) fellows.
Setting goals and objectives for target learners is recognized to be the initial step and a core prerequisite for effective curriculum development.20 In this publication, we summarize the objectives from previously published trainee assessments and propose reasonably attainable ECG interpretation competencies for both graduating medical students and residents at the end of their postgraduate training. This document is being endorsed by researchers and educators of 2 international societies dedicated to the study of electrical heart diseases: the International Society of Electrocardiology (ISE) and the International Society of Holter and Noninvasive Electrocardiology (ISHNE).
METHODS
Current Competencies in Literature
We performed a systematic search to identify ECG competencies that are currently mentioned in the literature. Information was retrieved from MEDLINE (1946-2016) and EMBASE (1947-2016) by using the following MeSH terms: electrocardiogram, electrocardiography, electrocardiogram interpretation, electrocardiogram competency, medical school, medical student, undergraduate medicine, undergraduate medical education, residency education, internship, and residency. Our search was limited to English-language articles that studied physician trainees. The references of the full-length articles were examined for additional citations. The search revealed a total of 65 publications involving medical students and 120 publications involving residents. Abstracts of publications were then assessed for relevance, and the methods of the remaining articles were scrutinized for references to specific ECG interpretation objectives. This strategy narrowed the search to 9 and 14 articles involving medical students and residents, respectively. Studies were not graded for quality because the purpose of the search was to identify the specific ECG competencies that authors expected trainees to obtain. Almost all the articles proposed teaching tools and specific objectives that were defined by the investigators arbitrarily and assessed the trainee’s ability to interpret ECGs (summarized in supplementary Table).
Defining ECG Interpretation Competencies
The initial draft of proposed ECG interpretation competencies was developed at Queen’s University in Ontario, Canada. A list of ECG patterns and diagnoses previously mentioned in literature was used as a starting point. From there, each item was refined and organized into 4 main categories (see Figures 1 and 2).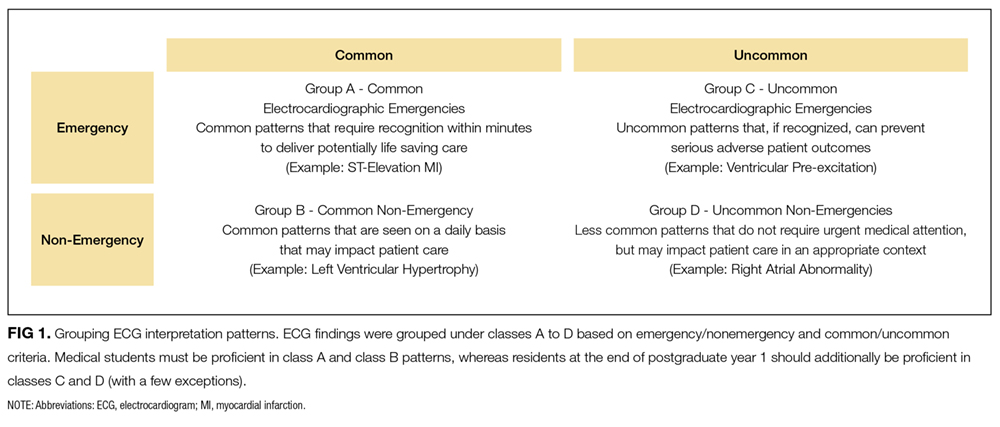
Class A “Common electrocardiographic emergencies” represent patterns that are frequently seen in hospitals, in which accurate interpretation of the ECG within minutes is essential for delivering care that is potentially lifesaving to the patient (eg, ST-elevation MI).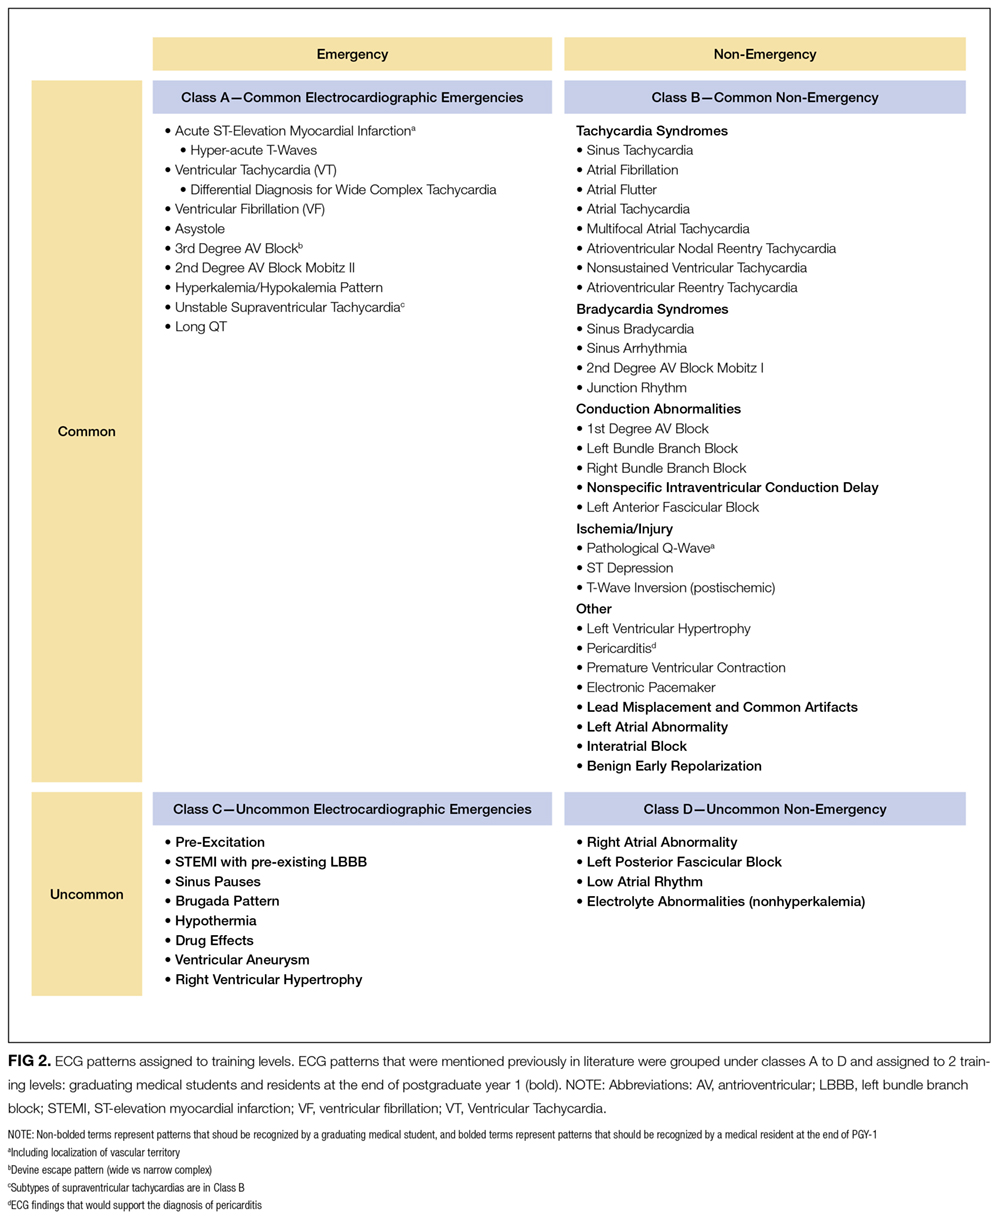
Class B “Common nonemergency patterns” represent ECG findings that are encountered daily in patients who are not acutely ill, which may impact their care in the appropriate clinical context (eg, left ventricular hypertrophy).
Class C “Uncommon electrocardiographic emergencies” represent ECG findings that are not encountered on a daily basis but can be potentially lifesaving if recognized (eg ventricular preexcitation).
Class D “Uncommon nonemergency patterns” represent findings that are uncommon but may diagnostically contribute to patient care in a clinically appropriate setting (eg, right atrial abnormality).
ECG interpretation patterns were then assigned to medical students and residents based on the specific goals of training. At the time of graduation, medical students should develop the foundation for learning ECG interpretation in residency training, provide ECG interpretation and initial management for electrocardiographic emergencies, and obtain assistance from a more senior medical professional within a clinically appropriate time frame. The training goal for a resident is to develop ECG interpretation competencies for safe independent clinical practice (Figure 1).
The final segregated ECG interpretation competencies were distributed to members of ISE and ISHNE for input, modifications, and revisions. The proposed list of competencies went through several revisions until a consensus was reached.
RESULTS
The final distribution of ECG patterns is illustrated in Figure 2. (Figure 3 defines the learning objectives for each ECG pattern defined in Figure 2.) Here, we provide a rationale for 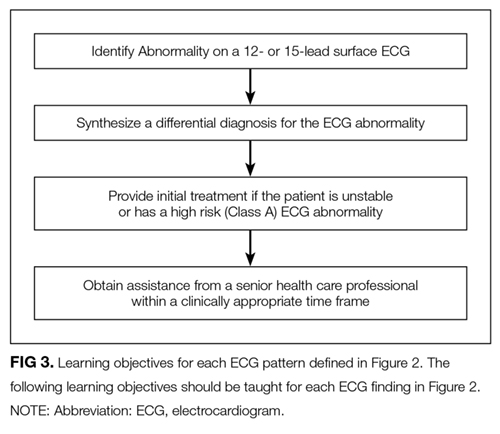
Class A: Common Electrocardiographic Emergencies
This group contains ECG findings that require recognition within minutes to deliver potentially lifesaving care. For this reason, undergraduate medical education programs should prioritize mastering class A conditions to minimize the risk of misdiagnosis and late recognition.
Class A patterns include ST elevation MI (STEMI) and localization of territory to ensure ST-segment elevations are seen in contiguous leads.29,30 Students should learn the criteria for STEMI as per the “Universal Definition of Myocardial Infarction” and be aware of early signs of STEMI that may be seen prior to ST-segment changes, such as hyper-acute T-waves (increased amplitude and symmetrical).30
Asystole, wide complex tachycardias, and ventricular fibrillation (VF) are all crucial ECG patterns that must be identified to deliver advanced cardiac life support (ACLS) care as per the 2010 AHA Guidelines for cardiopulmonary resuscitation and emergency cardio care.31 Of note, students should understand the differential diagnosis of wide complex tachycardias and should be able to suspect VF in clinically appropriate scenarios. We included the category “unstable/symptomatic supraventricular tachycardia” to represent rapid rhythms that are supraventricular in origin, which either produce symptoms or cause impairment of vital organ function.31 In emergency situations, it may not be crucial to correctly identify the specific supraventricular rhythm to deliver ACLS care; hence, the specific supraventricular tachycardia diagnoses were included in Class B.
Finally, we believe that medical students should be able to recognize long QT, hypo/hyperkalemia, and distinguish types of atrioventricular (AV) block. Distinguishing types of AV block is important because both third degree AV block and second degree AV block Mobitz II can be life threatening and require further investigation or emergency treatment in an inpatient setting.32 Prompt recognition of long QT is crucial because it can be associated with ventricular tachyarrhythmias. This includes a polymorphic pattern characterized by the twisting of QRS peaks around the baseline (torsades des pointes), which can eventually lead to VF.
Class B: Common Nonemergency Patterns
Class B patterns represent common findings that are seen on a daily basis that may impact patient care in a clinically appropriate context. Diagnoses in this section were divided into “tachycardia syndromes,” “bradycardia syndromes,” “conduction abnormalities,” “ischemia,” and “other.”
Undergraduate trainees should become proficient in identifying the cause of bradycardia and distinguishing types of AV blocks. Similarly, they should also have an approach to differentiate tachycardia syndromes.33,34 These skills are required to correctly manage patients in both inpatient and outpatient settings. They should be taught in undergraduate programs and reinforced in postgraduate training.
Common findings, such as bundle branch blocks, left anterior fascicular block, premature ventricular/atrial complexes, electronic pacemakers, and left ventricular hypertrophy, are essential to the daily interpretation of ECGs. Junior learners should be proficient in recognizing these patterns. Findings consistent with pericarditis are not uncommon and can be very helpful to guide the clinician to the diagnosis. Notable exceptions from the medical student competency list include detection of lead misplacement, common artifacts, nonspecific intraventricular conduction delay, interatrial block, and benign early repolarization. These findings require a deeper understanding of electrocardiography and would be more appropriate for senior learners.
Class C: Uncommon Electrocardiographic Emergencies
Class C findings represent uncommon conditions that, if recognized, can prevent serious adverse patient outcomes. These include preexcitation, STEMI with preexisting left bundle branch block sinus pauses, Brugada pattern, hypothermia, effects of toxic drugs, ventricular aneurysm, and right ventricular hypertrophy. The recognition of these patterns is crucial to avoid severe adverse patient outcomes, and independent practicing physicians should be aware of these findings. However, given that a high proportion of senior medical students miss common electrocardiographic emergencies, undergraduate medical education programs should instead focus resources on ensuring medical students are proficient in identifying class A and class B conditions.6,8-10 Postgraduate programs should ensure that postgraduate trainees can identify these potentially life-threatening conditions (see section “How to Teach Electrocardiology”).
Class D: Uncommon and Nonemergency Patterns
Class D findings represent less common findings that are not seen every day and do not require urgent medical attention. These include right atrial abnormality, left posterior fascicular block, low atrial rhythms, and electrolyte abnormalities that exclude potassium. Notably, electrolyte abnormalities are important to identify; however, typically, treatment is guided by the lab results.35 Overall, postgraduate trainees should certainly be aware of these findings, but medical student training should instead focus on learning the framework and correctly identifying class A and class B ECG patterns.
HOW TO TEACH ELECTROCARDIOLOGY
Teaching ECG Interpretation Strategies
No clear teaching approaches to ECG interpretation have been described in the literature, and no recommendations on knowledge translation have been formally explored. A possible educational approach to the teaching of electrocardiology could involve several methods for helping students with ECG interpretation:36
1. Pattern recognition: The ECG, at its most immediate level, is a graphic image, and recognition of images is essentially recognition of patterns. These patterns can only be learned through repeated visualization of examples with a written or verbal explanation. Repeated visualization over time will help avoid “erosion” of knowledge. Examples of learning tools include periodic in-person ECG rounds, well-illustrated books or atlases, and online tools with good quality ECGs and explanations. These learning opportunities are strongly reinforced by collecting cases from the clinical encounters of the trainee that illustrate the aforementioned patterns. Some of these patterns can be found in guidelines, such as the one published by the AHA and ACC.29
2. Application of published criteria: Guidelines, review papers, and books offer diagnostic criteria for many entities, such as chamber enlargement, bundle branch blocks, and abnormal Q waves. Learning these criteria and applying them to the analysis of ECGs is a commonly used learning strategy.
3. Inductive-deductive reasoning: This strategy requires a deeper understanding of the pathophysiology behind ECG patterns. It requires ECGs to be interpreted in a certain clinical context, and the goal of ECG interpretation is to answer a clinical question that is used to guide patient care. This strategy typically employs the use of algorithms to lead the interpreter to the correct diagnosis, and mastery of this skill grows from ongoing clinical experience. Examples of the “inductive-deductive reasoning” are localizing an accessory AV pathway, the differential diagnosis of narrow or wide complex tachycardias, and identifying the site of coronary artery occlusion in a patient with a STEMI.
4. Ladder diagrams: Ladder diagrams have been used for over 100 years to graphically illustrate the mechanism of arrhythmias. They can be incredibly useful to help learners visualize impulse conduction in reentry mechanisms as well as other abnormal rhythms. However, there are some rhythms that are difficult to illustrate on ladder diagrams.37
5. Peer and near-peer teaching: Peer teaching occurs when learners prepare and deliver teaching material to learners of a similar training level. The expectation to deliver a teaching session encourages students to learn and organize information in thoughtful ways. It builds strong teamwork skills and has been shown to positively affect all involved learners.38-40
Each ECG interpretation strategy has its advantages, and we recommend that students be exposed to all available approaches if teaching resources are available.
Teaching Delivery Format
Each of the above teaching strategies can be delivered to students in various ways. The following teaching formats have been previously documented in the literature:
1. Classroom-based teaching: This is a traditional learning format that takes place in a large- or small-group classroom. Typically, these sessions are led by a single instructor, and they are focused on the direct sharing of information and group discussion.41
2. Electronic practice tools: Numerous electronic tools have been developed with the purpose of providing deliberate practice to master ECG interpretation. Some of these tools employ active learner engagement, while others provide a bank of ECGs for self-directed passive learning.42-46
3. Video lectures: Short video lectures have been created to facilitate self-directed lecture based learning. These lectures are hosted on a variety of web-based platforms, including YouTube and Vimeo.47
4. Traditional and electronic books: Numerous traditional textbooks have been published on ECG interpretation and are designed to facilitate independent learning. Some textbooks directly deliver teaching material, while others contain sets of ECGs to allow for repetitive practice. More recently, iBooks incorporating self-assessment tools have been used to assist ECG teaching.34 The advantage of these tools is that they can also be used to supplement in-person classes.
5. Games: A unique ECG interpretation learning strategy consists of using puzzles and games to learn ECGs. This is meant to improve student engagement and interest in learning ECG interpretation.48
Given that there is currently a lack of evidence-based data to support 1 instructional format over another, we do not favor any particular one. This decision should be left to instructors and individual learners based on their preference and available resources. Further studies would be helpful to determine the effectiveness of various methods in teaching ECG interpretation and to identify any additional specific factors that facilitate learning.
Evaluation Strategies
1. Longitudinal ongoing feedback: This form of feedback universally takes place in all training programs and focuses on direct observation and point-of-care feedback by a senior healthcare professional during clinical practice. Typically, the feedback is informal and is centered around specific case presentations.
2. Formative testing: This assessment strategy is aimed at monitoring the learning of trainees and providing them with appropriate feedback. Tutors and teachers can use this data to individualize instruction and fill any training gaps that individuals and the class may have. Students themselves can use this information to encourage additional study to ensure they acquire required skills. Examples of formative testing are low-stakes in-training exams and asking audience questions during a workshop or lecture.49
3. Summative testing: Summative assessments are created to measure the level of proficiency developed by a learner and compare it against some standard or benchmark. This form of assessment establishes the extent to which educational objectives have been met. The most common example is an end-of-term examination.
Online ECG examination has been successfully used to provide methods of testing. They are easy to distribute, highly convenient for learners, and allow the display of high-quality graphics. They can also be graded electronically, thereby minimizing the resources required to administer and grade exams.36,50
We recommend using a combination of assessment formats to ensure the optimal evaluation of learner skill and to focus learning on areas of weakness. Summative assessments are highly valuable to ensure learners acquired the necessary ECG interpretation competencies. Remediation strategies should be available to provide additional practice to learners who do not meet competencies expected at their level of training.
DISCUSSION
The Need for ECG Interpretation Competencies and Milestones
Since the introduction of ECG in the late 1800s, there continues to be a significant variation in ECG interpretation skills among trainees and medical professionals.4,6-12 Concerns continue to exist about the rate of missed diagnoses involving critical ECGs, leading to inappropriate patient management decisions. Despite the obvious need, teaching ECG interpretation is given little emphasis in medical education, and the curriculum remains quite disorganized. In this position paper, we call for a more structured ECG interpretation curriculum in medical education and hope to assist this process by assigning ECG patterns to 2 milestones in training: graduating medical students and first year postgraduate medical residents.
Defining competencies would help medical education programs to focus resources on teaching clinically important conditions for the appropriate level of training. We divide ECG findings into 4 categories (classes A to D), and we place emphasis on learning electrocardiographic emergencies early in training and spending less time on ECG findings that are unlikely to change patient management.
The goal is to ensure 100% recognition of class A (electrocardiographic emergencies) by the end of medical school. To ensure each medical education program fulfils this goal, a structured curriculum including a summative assessment is required.
Methods of Teaching
Various instructional mediums have been successfully implemented to teach ECG interpretation competencies, including lectures, puzzles, web-based programs, iBooks, and YouTube.34-41-44,47,48.51-53 A survey of clerkship directors in internal medicine revealed that 75% of clerkship programs teach ECG interpretation in a classroom lecture-based setting, 44% use teaching rounds, and only 17% utilize online/web-based instruction.3 Canadian family medicine programs have a relatively equal distribution between classroom-based, computer-based, and bedside teaching.5
In comparing the efficacy of instructional styles, several small comparative studies favor an electronic teaching format because of the enhanced learner interaction and visual learning, but there does not appear to be a consistently proven large advantage of 1 teaching format over another.43,48,51,54 The overall theme emerging from this literature is the importance of repetition and active engagement in ECG interpretation, which appear to be more important than 1 particular strategy.22 Computer-based training appears to deliver these 2 qualities, unlike the traditional lecture-style passive learning model. The concept of repetition and engagement is also well supported in medical education literature outside ECG interpretation.55,56
Given these data, we recommend that each medical education program select teaching methods based on their available resources, as long as adequate teaching time is allotted to ensure that trainees acquire the competencies defined in this publication.
Assessment Methods
It appears that the larger factor in determining ECG interpretation performance is not the learning format, but the form of assessment. Two studies have demonstrated that summative assessment substantially improves ECG interpretation performance when compared with formative assessment; in fact, this effect was so large that it overshadowed any small difference in teaching formats.57,58 This concept aligns with medical education literature, which acknowledges that assessment drives learning by raising the stakes, thereby boosting student effort and encouraging learning to an effect much larger than can be generated by any particular learning style.57,59 Nevertheless, well-designed formative assessment can focus students on effective learning by identifying gaps and important information.60 Only 33% of Canadian family medicine residency programs and 71% of American clerkship programs have formal assessment of ECG interpretation skills.3,5 There is no doubt that assessment, both formative and summative, should be implemented in all undergraduate and postgraduate medical training programs. Online assessment methods have the advantage of delivering high-quality images and a variety of question formats; hence, their use should be encouraged.36,50,61-63
Teaching Personnel and Timing of Training
Who should teach ECG interpretation and when should this teaching take place? ECG interpretation in training programs is typically taught by attending physicians in each respective field. However, given that there is a large ECG interpretation error rate by noncardiologist physicians, we advise that ECG training content be created with input from own-specialty attending physicians and cardiologists.4 This teaching should take place early in medical school at the time medical students learn pathophysiology of the heart and should continue throughout training. Longitudinal training is preferred to block-based training because of improved resident satisfaction, but medical education literature did not reveal a difference in student performance with either strategy.64-66
CONCLUSIONS
Despite its immense clinical value, there continues to be a lack of a comprehensive ECG interpretation curriculum in medical education programs. The goal of this position paper is to encourage the development of organized curricula in undergraduate and postgraduate medical education programs, and to ensure the acquisition of level-appropriate ECG interpretation skills while maintaining patient safety. We assist this process by grouping ECG findings into 4 classes (A to D) based on the frequency of encounter and emergent nature and by assigning them to each level of training. Methods of teaching ECG interpretation are less important and can be selected based on the available resources of each education program and student preference; however, online learning is encouraged. We also recommend that summative trainee evaluation methods be implemented in all programs to ensure that appropriate competencies are acquired and to further encourage self-directed learning. Resources should be allocated to ensure that every trainee is reaching their training milestones and should ensure that no electrocardiographic emergency (class A condition) is ever missed by a trainee. We hope that these guidelines will inform medical education systems and help prevent adverse patient outcomes caused by the misinterpretation of this valuable clinical diagnostic tool.
Disclosure
On behalf of all authors, the corresponding author states that there is no conflict of interest. This manuscript did not utilize any sources of funding.
1. Baranchuk A, Chiale PA, Green M, Caldwell JC. Editorial: surface electrocardiogram remains alive in the XXI century. Curr Cardiol Rev. 2014;10(3):173-174. http://www.ncbi.nlm.nih.gov/pubmed/24856069. Accessed January 4, 2017. PubMed
2. Fisch C. Evolution of the clinical electrocardiogram. J Am Coll Cardiol. 1989;14(5):1127-1138. doi:10.1016/0735-1097(89)90407-5. PubMed
3. O’Brien KE, Cannarozzi ML, Torre DM, Mechaber AJ, Durning SJ. Training and assessment of ECG interpretation skills: results from the 2005 CDIM survey. Teach Learn Med. 2005;21(2):111-115. doi:10.1080/10401330902791255. PubMed
4. Salerno SM, Alguire PC, Waxman HS. Competency in Interpretation of 12-Lead Electrocardiograms: A Summary and Appraisal of Published Evidence. Ann Intern Med. 2003;138(9):751-760. doi:10.1016/S1062-1458(03)00283-6. PubMed
5. Paul B, Baranchuk A. Electrocardiography teaching in Canadian family medicine residency programs: A national survey. Fam Med. 2011;43(4):267-271. http://www.ncbi.nlm.nih.gov/pubmed/21500000. Accessed January 4, 2017. PubMed
6. Jablonover RS, Lundberg E, Zhang Y, Stagnaro-Green A. Competency in electrocardiogram interpretation among graduating medical students. Teach Learn Med. 2014;26(3):279-284. doi:10.1080/10401334.2014.918882. PubMed
7. Elnicki DM, van Londen J, Hemmer PA, Fagan M, Wong R. US and Canadian internal medicine clerkship directors’ opinions about teaching procedural and interpretive skills to medical students. Acad Med. 2004;79(11):1108-1113. http://www.ncbi.nlm.nih.gov/pubmed/15504782. Accessed January 31, 2017. PubMed
8. Shams M, Sullivan A, Abudureyimu S, et al. Optimizing Electrocardiogram Interpretation and Catheterization Laboratory Activation in St-Segment Elevation Myocardial Infarction: a Teaching Module for Medical Students. J Am Coll Cardiol. 2016;67(13):643. doi:10.1016/S0735-1097(16)30644-1.
9. Grum CM, Gruppen LD, Woolliscroft JO. The influence of vignettes on EKG interpretation by third-year students. Acad Med. 1993;68:S61-S63. PubMed
10. Little B, Ho KJ, Scott L. Electrocardiogram and rhythm strip interpretation by final year medical students. Ulster Med J. 2001;70(2):108-110. PubMed
11. Eslava D, Dhillon S, Berger J, Homel P, Bergmann S. Interpretation of electrocardiograms by first-year residents: the need for change. J Electrocardiol. 2009;42(6):693-697. doi:10.1016/j.jelectrocard.2009.07.020. PubMed
12. Sibbald M, Davies EG, Dorian P, Yu EHC. Electrocardiographic Interpretation Skills of Cardiology Residents: Are They Competent? Can J Cardiol. 2014;30(12):1721-1724. doi:10.1016/j.cjca.2014.08.026. PubMed
13. Lee TH, Rouan GW, Weisberg MC, et al. Clinical characteristics and natural history of patients with acute myocardial infarction sent home from the emergency room. Am J Cardiol. 1987;60(4):219-224. Accessed January 4, 2017. PubMed
14. Todd KH, Hoffman JR, Morgan MT. Effect of cardiologist ECG review on emergency department practice. Ann Emerg Med. 1996;27(1):16-21. Accessed January 4, 2017. PubMed
15. Denes P, Larson JC, Lloyd-Jones DM, Prineas RJ, Greenland P. Major and Minor ECG Abnormalities in Asymptomatic Women and Risk of Cardiovascular Events and Mortality. JAMA. 2007;297(9):978. doi:10.1001/jama.297.9.978. PubMed
16. Salerno SM, Alguire PC, Waxman HS. Training and Competency Evaluation for Interpretation of 12-Lead Electrocardiograms: Recommendations from the American College of Physicians. Ann Intern Med. 2003;138(9):747-750. doi:10.7326/0003-4819-138-9-200305060-00012. PubMed
17. Accreditation Council for Graduate Medical Education. ACGME Program Requirements for Graduate Medical Education in Cardiovascular Disease (Internal Medicine); 2016. https://www.acgme.org/Portals/0/PFAssets/ProgramRequirements/152_interventional_cardiology_2017-07-01.pdf. Accessed January 4, 2017.
18. American Board of Internal Medicine. Policies and Procedures For Certification; 2016. http://www.abim.org/~/media/ABIM Public/Files/pdf/publications/certification-guides/policies-and-procedures.pdf. Accessed January 4, 2017.
19. Kadish AH, Buxton AE, Kennedy HL, et al. ACC/AHA Clinical Competence Statement on Electrocardiography and Ambulatory Electrocardiography. J Am Coll Cardiol. 2001;38(7):3169-3178. PubMed
20. Kern D, Thomas PA, Hughes MT, editors. Curriculum Development for Medical Education: A Six-Step Approach. 2nd edition. Baltimore: The Johns Hopkins University Press; 2009.
21. De Fer T, Fazio S, Goroll A. Core Medicine Clerkship: Curriculum Guide V3.0. Alliance for Academic Internal Medicine; 2006. http://www.im.org/p/cm/ld/fid=385. Accessed January 12, 2017.
22. Hatala RM, Brooks LR, Norman GR. Practice makes perfect: The critical role of mixed practice in the acquisition of ECG interpretation skills. Adv Heal Sci Educ. 2003;8(1):17-26. doi:10.1023/A:1022687404380. PubMed
23. Bayes de Luna A. ECGs For Beginners. Barcelona: Wiley Blackwell; 2014.
24. O’Keefe J, Hammill S, Freed M, Pogwizd S. The Complete Guide to ECGs. Third edition. Kansas City: Physicians’ Press - Jones and Bartlett Publishers; 2008.
25. Khan G. Rapid ECG Interpretation. Third edition. Ottawa: Humana Press (Springer Science); 2008.
26. Garcia T. 12-Lead ECG: The Art of Interpretation. Second edition. Burlington: Jones & Bartlett Learning; 2015.
27. Olson CW, Warner RA, Wagner GS, Selvester RH. A dynamic three-dimensional display of ventricular excitation and the generation of the vector and electrocardiogram. J Electrocardiol. 2001;34 Suppl:7-15. doi:10.1054/jelc.2001.29793. PubMed
28. Olson CW, Lange D, Chan JK, et al. 3D Heart: A new visual training method for Electrocardiographic Analysis. J Electrocardiol. 2007;40(5):1-7. doi:10.1016/j.jelectrocard.2007.04.001. PubMed
29. Wagner GS, Macfarlane P, Wellens H, et al. AHA/ACCF/HRS Recommendations for the Standardization and Interpretation of the Electrocardiogram. Part VI: Acute Ischemia/Infarction A Scientific Statement From the American Heart Association Electrocardiography and Arrhythmias Committee, Council on Clinical Cardiology; the American College of Cardiology Foundation; and the Heart Rhythm Society. Endorsed by the International Society for Computerized Electrocardiology. J Am Coll Cardiol. 2009;53(11):1003-1011. doi:10.1016/j.jacc.2008.12.016. PubMed
30. Thygesen K, Alpert JS, White HD. Universal definition of myocardial infarction. Eur Heart J. 2007;28(20):2525-2538. doi:10.1093/eurheartj/ehm355. PubMed
31. Neumar RW, Otto CW, Link MS, et al. Part 8: Adult advanced cardiovascular life support: 2010 American Heart Association Guidelines for Cardiopulmonary Resuscitation and Emergency Cardiovascular Care. Circulation. 2010;122(Suppl 3). doi:10.1161/CIRCULATIONAHA.110.970988. PubMed
32. Barold SS, Hayes DL. Second-Degree Atrioventricular Block: A Reappraisal. Mayo Clin Proc. 2001;76(1):44-57. doi:10.4065/76.1.44. PubMed
 33. Borloz MP, Mark DG, Pines JM, Brady WJ. Electrocardiographic differential diagnosis of narrow QRS complex tachycardia: an ED-oriented algorithmic approach. Am J Emerg Med. 2010;28(3):378-381. doi:10.1016/j.ajem.2008.12.019. PubMed
34. Nadeau-Routhier C, Baranchuk A. Electrocardiography in Practice: What to Do? 1st ed. Kingston: Apple Inc. iBook; 2015.
35. Diercks DB, Shumaik GM, Harrigan RA, Brady WJ, Chan TC. Electrocardiographic manifestations: electrolyte abnormalities. J Emerg Med. 2004;27(2):153-160. doi:10.1016/j.jemermed.2004.04.006. PubMed
36. Quinn KL, Crystal E, Lashevsky I, Arouny B, Baranchuk A. Validation of a Novel Digital Tool in Automatic Scoring of an Online ECG Examination at an International Cardiology Meeting. Ann Noninvasive Electrocardiol. 2016;21(4):376-381. doi:10.1111/anec.12311. PubMed
37. Johnson NP, Denes P. The Ladder Diagram (A 100+ Year History). Am J Cardiol. 2008;101(12):1801-1804. doi:10.1016/j.amjcard.2008.02.085. PubMed
38. Bulte C, Betts A, Garner K, Durning S. Student teaching: views of student near-peer teachers and learners. Med Teach. 2007;29(0):583-590. doi:10.1080/01421590701583824. PubMed
39. Nestojko JF, Bui DC, Kornell N, Ligon Bjork E. Expecting to teach enhances learning and organization of knowledge in free recall of text passages. Mem Cogn. 2014;42:1038-1048. doi:10.3758/s13421-014-0416-z. PubMed
40. Bené KL, Bergus G. When learners become teachers: A review of peer teaching in medical student education. Fam Med. 2014;46(10):783-787. doi:10.4300/JGME-D-13-00426. PubMed
41. Lucas J, McKay S, Baxley E. EKG arrhythmia recognition: a third-year clerkship teaching experience. Fam Med. 2003;35(3):163-164. Accessed January 31, 2017. PubMed
42. DeBonis K, Blair TR, Payne ST, Wigan K, Kim S. Viability of a Web-Based Module for Teaching Electrocardiogram Reading Skills to Psychiatry Residents: Learning Outcomes and Trainee Interest. Acad Psychiatry. 2015;39(6):645-648. doi:10.1007/s40596-014-0249-x. PubMed
43. Chudgar SM, Engle DL, Grochowski COC, Gagliardi JP. Teaching crucial skills: An electrocardiogram teaching module for medical students. J Electrocardiol. 2016;49(4):490-495. doi:10.1016/j.jelectrocard.2016.03.021. PubMed
44. Nathanson LA, Safran C, McClennen S, Goldberger AL. ECG Wave-Maven: a self-assessment program for students and clinicians. Proc AMIA Symp. 2001:488-492. Accessed January 31, 2017. PubMed
45. Farré J, Wellens H. ECGcorner (Online). ECGcorner. http://www.ecgcorner.org. Published 2017. Accessed February 15, 2017.
46. Waechter J. Teaching Medicine (Online). https://www.teachingmedicine.com/ Accessed Feb 15, 2017.
47. Akgun T, Karabay CY, Kocabay G, et al. Learning electrocardiogram on YouTube: How useful is it? J Electrocardiol. 2014;47(1):113-117. doi:10.1016/j.jelectrocard.2013.09.004. PubMed
48. Rubinstein J, Dhoble A, Ferenchick G. Puzzle based teaching versus traditional instruction in electrocardiogram interpretation for medical students – a pilot study. BMC Med Educ. 2009;9(1):4. doi:10.1186/1472-6920-9-4. PubMed
49. Black P, Wiliam D. Assessment and Classroom Learning. Assess Educ. 1998;5(1):7-73. doi:10.1080/0969595980050102.
50. Quinn KL, Baranchuk A. Feasibility of a novel digital tool in automatic scoring of an online ECG examination. Int J Cardiol. 2015;185:88-89. doi:10.1016/j.ijcard.2015.03.135. PubMed
51. Nilsson M, Bolinder G, Held C, et al. Evaluation of a web-based ECG-interpretation programme for undergraduate medical students. BMC Med Educ. 2008;8(1):25. doi:10.1186/1
52. Lessard Y, Sinteff J-P, Siregar P, et al. An ECG analysis interactive training system for understanding arrhythmias. Stud Health Technol Inform. 2009;150:931-935. Accessed January 31, 2017. PubMed
53. Zakowski, Dean Keller L. An effective ECG curriculum for third-year medical students in a community-based clerkship. Med Teach. 2000;22(4):354-358. doi:10.1080/014215900409447.
54. Mahler SA, Wolcott CJ, Swoboda TK, Wang H, Arnold TC. Techniques for teaching electrocardiogram interpretation: Self-directed learning is less effective than a workshop or lecture. Med Educ. 2011;45(4):347-353. doi:10.1111/j.1365-2923.2010.03891.x. PubMed
55. Biggs J. What the Student Does: Teaching for enhanced learning. High Educ Res Dev. 1999;18(1):57-75.
56. Ericsson KA. Deliberate practice and acquisition of expert performance: A general overview. Acad Emerg Med. 2008;15(11):988-994. doi:10.1111/j.1553-2712.2008.00227.x. PubMed
57. Raupach T, Hanneforth N, Anders S, Pukrop T, Th J Ten Cate O, Harendza S. Impact of teaching and assessment format on electrocardiogram interpretation skills. Med Educ. 2010;44(7):731-740. doi:10.1111/j.1365-2923.2010.03687.x. PubMed
58. Raupach T, Brown J, Anders S, Hasenfuss G, Harendza S. Summative assessments are more powerful drivers of student learning than resource intensive teaching formats. BMC Med. 2013;11:61. doi:10.1186/1741-7015-11-61. PubMed
59. Roediger HL, Karpicke JD. Test-enhanced learning: Taking memory tests imporves ong-term retention. Psychol Sci. 2006;17(3):249-255. doi:10.1111/j.1467-9280.2006.01693.x. PubMed
60. Ferris HA, O’ Flynn D. Assessment in Medical Education; What Are We Trying to Achieve? Int J High Educ. 2015;4(2):139-144. doi:10.5430/ijhe.v4n2p139.
61. Hartman ND, Wheaton NB, Williamson K, Quattromani EN, Branzetti JB, Aldeen AZ. A Novel Tool for Assessment of Emergency Medicine Resident Skill in Determining Diagnosis and Management for Emergent Electrocardiograms: A Multicenter Study. J Emerg Med. 2016;51(6):697-704. doi:10.1016/j.jemermed.2016.06.054. PubMed
62. Pines JM, Perina DG, Brady WJ. Electrocardiogram interpretation training and competency assessment in emergency medicine residency programs. Acad Emerg Med. 2004;11(9):982-984. doi:10.1197/j.aem.2004.03.023. PubMed
63. Demircan A, Bildik F, Ergin M. Electrocardiography interpretation training in emergency medicine : methods, resources, competency assessment, and national standardization. Signa Vitae. 2015;10(1):38-52.
64. Ferrell BG, Camp DL. Comparing a Four-Week Block Clerkship to a Twelve-Week Longitudinal Experience in Family Medicine. In: Scherpbier AJJA, van der Vleuten CPM, Rethans JJ, and van der Steeg AFW, editors. Advances in Medical Education. Dordrecht: Springer Netherlands; 1997:744-746. doi:10.1007/978-94-011-4886-3_226.
65. Marinović D, Hren D, Sambunjak D, et al. Transition from longitudinal to block structure of preclinical courses: outcomes and experiences. Croat Med J. 2009;50(5):492-506. doi:10.3325/cmj.2009.50.492. PubMed
66. Melo J, Kaneshiro B, Kellett L, Hiraoka M. The impact of a longitudinal curriculum on medical student obstetrics and gynecology clinical training. Hawaii J Med Public Health. 2014;73(5):144-147. Accessed January 31, 2017. PubMed
The 12-lead electrocardiogram (ECG) remains one of the most widely used and readily available diagnostic tests in modern medicine.1 Reflecting the electrical behavior of the heart, this point-of-care diagnostic test is used in almost every area of medicine for diagnosis, prognostication, and selection of appropriate treatment. The ECG is sometimes the only and most efficient way of detecting life-threatening conditions, thus allowing a timely delivery of emergency care.2 However, the practical power of the 12-lead ECG relies on the ability of the clinician to interpret this test correctly.
For decades, ECG interpretation has been a core component of undergraduate and postgraduate medical training.3-5 Unfortunately, numerous studies have demonstrated alarming rates of inaccuracy and variability in interpreting ECGs among trainees at all levels of education.4,6,7 Senior medical students have been repeatedly shown to miss 26% to 62% of acute myocardial infarctions (MI).6,8-10 Another recent study involving internal medicine residents demonstrated that only half of the straightforward common ECGs were interpreted correctly, while 26% of trainees missed an acute MI and 56% missed ventricular tachycardia (VT).11 Even cardiology subspecialty fellows demonstrated poor performance, missing up to 26% of ST-elevation MIs on ECGs that had multiple findings.12 Inaccurate interpretations of ECGs can lead to inappropriate management decisions, adverse patient outcomes, unnecessary additional testing, and even preventable deaths.4,13-15
Several guidelines have emphasized the importance of teaching trainees 12-lead ECG interpretation and have recognized the value of assessments in ensuring that learners acquire the necessary competencies.16-19 Similarly, there have been many calls for more rigorous and structured curricula for ECG interpretation throughout undergraduate and postgraduate medical education.11,16 However, we still lack a thoughtful guideline outlining the specific competencies that medical trainees should attain. This includes medical students, nurses working in hospital and in out-of-hospital settings, and residents of different specialties, including emergency medicine, cardiology, and electrophysiology (EP) fellows.
Setting goals and objectives for target learners is recognized to be the initial step and a core prerequisite for effective curriculum development.20 In this publication, we summarize the objectives from previously published trainee assessments and propose reasonably attainable ECG interpretation competencies for both graduating medical students and residents at the end of their postgraduate training. This document is being endorsed by researchers and educators of 2 international societies dedicated to the study of electrical heart diseases: the International Society of Electrocardiology (ISE) and the International Society of Holter and Noninvasive Electrocardiology (ISHNE).
METHODS
Current Competencies in Literature
We performed a systematic search to identify ECG competencies that are currently mentioned in the literature. Information was retrieved from MEDLINE (1946-2016) and EMBASE (1947-2016) by using the following MeSH terms: electrocardiogram, electrocardiography, electrocardiogram interpretation, electrocardiogram competency, medical school, medical student, undergraduate medicine, undergraduate medical education, residency education, internship, and residency. Our search was limited to English-language articles that studied physician trainees. The references of the full-length articles were examined for additional citations. The search revealed a total of 65 publications involving medical students and 120 publications involving residents. Abstracts of publications were then assessed for relevance, and the methods of the remaining articles were scrutinized for references to specific ECG interpretation objectives. This strategy narrowed the search to 9 and 14 articles involving medical students and residents, respectively. Studies were not graded for quality because the purpose of the search was to identify the specific ECG competencies that authors expected trainees to obtain. Almost all the articles proposed teaching tools and specific objectives that were defined by the investigators arbitrarily and assessed the trainee’s ability to interpret ECGs (summarized in supplementary Table).
Defining ECG Interpretation Competencies
The initial draft of proposed ECG interpretation competencies was developed at Queen’s University in Ontario, Canada. A list of ECG patterns and diagnoses previously mentioned in literature was used as a starting point. From there, each item was refined and organized into 4 main categories (see Figures 1 and 2).
Class A “Common electrocardiographic emergencies” represent patterns that are frequently seen in hospitals, in which accurate interpretation of the ECG within minutes is essential for delivering care that is potentially lifesaving to the patient (eg, ST-elevation MI).
Class B “Common nonemergency patterns” represent ECG findings that are encountered daily in patients who are not acutely ill, which may impact their care in the appropriate clinical context (eg, left ventricular hypertrophy).
Class C “Uncommon electrocardiographic emergencies” represent ECG findings that are not encountered on a daily basis but can be potentially lifesaving if recognized (eg ventricular preexcitation).
Class D “Uncommon nonemergency patterns” represent findings that are uncommon but may diagnostically contribute to patient care in a clinically appropriate setting (eg, right atrial abnormality).
ECG interpretation patterns were then assigned to medical students and residents based on the specific goals of training. At the time of graduation, medical students should develop the foundation for learning ECG interpretation in residency training, provide ECG interpretation and initial management for electrocardiographic emergencies, and obtain assistance from a more senior medical professional within a clinically appropriate time frame. The training goal for a resident is to develop ECG interpretation competencies for safe independent clinical practice (Figure 1).
The final segregated ECG interpretation competencies were distributed to members of ISE and ISHNE for input, modifications, and revisions. The proposed list of competencies went through several revisions until a consensus was reached.
RESULTS
The final distribution of ECG patterns is illustrated in Figure 2. (Figure 3 defines the learning objectives for each ECG pattern defined in Figure 2.) Here, we provide a rationale for
Class A: Common Electrocardiographic Emergencies
This group contains ECG findings that require recognition within minutes to deliver potentially lifesaving care. For this reason, undergraduate medical education programs should prioritize mastering class A conditions to minimize the risk of misdiagnosis and late recognition.
Class A patterns include ST elevation MI (STEMI) and localization of territory to ensure ST-segment elevations are seen in contiguous leads.29,30 Students should learn the criteria for STEMI as per the “Universal Definition of Myocardial Infarction” and be aware of early signs of STEMI that may be seen prior to ST-segment changes, such as hyper-acute T-waves (increased amplitude and symmetrical).30
Asystole, wide complex tachycardias, and ventricular fibrillation (VF) are all crucial ECG patterns that must be identified to deliver advanced cardiac life support (ACLS) care as per the 2010 AHA Guidelines for cardiopulmonary resuscitation and emergency cardio care.31 Of note, students should understand the differential diagnosis of wide complex tachycardias and should be able to suspect VF in clinically appropriate scenarios. We included the category “unstable/symptomatic supraventricular tachycardia” to represent rapid rhythms that are supraventricular in origin, which either produce symptoms or cause impairment of vital organ function.31 In emergency situations, it may not be crucial to correctly identify the specific supraventricular rhythm to deliver ACLS care; hence, the specific supraventricular tachycardia diagnoses were included in Class B.
Finally, we believe that medical students should be able to recognize long QT, hypo/hyperkalemia, and distinguish types of atrioventricular (AV) block. Distinguishing types of AV block is important because both third degree AV block and second degree AV block Mobitz II can be life threatening and require further investigation or emergency treatment in an inpatient setting.32 Prompt recognition of long QT is crucial because it can be associated with ventricular tachyarrhythmias. This includes a polymorphic pattern characterized by the twisting of QRS peaks around the baseline (torsades des pointes), which can eventually lead to VF.
Class B: Common Nonemergency Patterns
Class B patterns represent common findings that are seen on a daily basis that may impact patient care in a clinically appropriate context. Diagnoses in this section were divided into “tachycardia syndromes,” “bradycardia syndromes,” “conduction abnormalities,” “ischemia,” and “other.”
Undergraduate trainees should become proficient in identifying the cause of bradycardia and distinguishing types of AV blocks. Similarly, they should also have an approach to differentiate tachycardia syndromes.33,34 These skills are required to correctly manage patients in both inpatient and outpatient settings. They should be taught in undergraduate programs and reinforced in postgraduate training.
Common findings, such as bundle branch blocks, left anterior fascicular block, premature ventricular/atrial complexes, electronic pacemakers, and left ventricular hypertrophy, are essential to the daily interpretation of ECGs. Junior learners should be proficient in recognizing these patterns. Findings consistent with pericarditis are not uncommon and can be very helpful to guide the clinician to the diagnosis. Notable exceptions from the medical student competency list include detection of lead misplacement, common artifacts, nonspecific intraventricular conduction delay, interatrial block, and benign early repolarization. These findings require a deeper understanding of electrocardiography and would be more appropriate for senior learners.
Class C: Uncommon Electrocardiographic Emergencies
Class C findings represent uncommon conditions that, if recognized, can prevent serious adverse patient outcomes. These include preexcitation, STEMI with preexisting left bundle branch block sinus pauses, Brugada pattern, hypothermia, effects of toxic drugs, ventricular aneurysm, and right ventricular hypertrophy. The recognition of these patterns is crucial to avoid severe adverse patient outcomes, and independent practicing physicians should be aware of these findings. However, given that a high proportion of senior medical students miss common electrocardiographic emergencies, undergraduate medical education programs should instead focus resources on ensuring medical students are proficient in identifying class A and class B conditions.6,8-10 Postgraduate programs should ensure that postgraduate trainees can identify these potentially life-threatening conditions (see section “How to Teach Electrocardiology”).
Class D: Uncommon and Nonemergency Patterns
Class D findings represent less common findings that are not seen every day and do not require urgent medical attention. These include right atrial abnormality, left posterior fascicular block, low atrial rhythms, and electrolyte abnormalities that exclude potassium. Notably, electrolyte abnormalities are important to identify; however, typically, treatment is guided by the lab results.35 Overall, postgraduate trainees should certainly be aware of these findings, but medical student training should instead focus on learning the framework and correctly identifying class A and class B ECG patterns.
HOW TO TEACH ELECTROCARDIOLOGY
Teaching ECG Interpretation Strategies
No clear teaching approaches to ECG interpretation have been described in the literature, and no recommendations on knowledge translation have been formally explored. A possible educational approach to the teaching of electrocardiology could involve several methods for helping students with ECG interpretation:36
1. Pattern recognition: The ECG, at its most immediate level, is a graphic image, and recognition of images is essentially recognition of patterns. These patterns can only be learned through repeated visualization of examples with a written or verbal explanation. Repeated visualization over time will help avoid “erosion” of knowledge. Examples of learning tools include periodic in-person ECG rounds, well-illustrated books or atlases, and online tools with good quality ECGs and explanations. These learning opportunities are strongly reinforced by collecting cases from the clinical encounters of the trainee that illustrate the aforementioned patterns. Some of these patterns can be found in guidelines, such as the one published by the AHA and ACC.29
2. Application of published criteria: Guidelines, review papers, and books offer diagnostic criteria for many entities, such as chamber enlargement, bundle branch blocks, and abnormal Q waves. Learning these criteria and applying them to the analysis of ECGs is a commonly used learning strategy.
3. Inductive-deductive reasoning: This strategy requires a deeper understanding of the pathophysiology behind ECG patterns. It requires ECGs to be interpreted in a certain clinical context, and the goal of ECG interpretation is to answer a clinical question that is used to guide patient care. This strategy typically employs the use of algorithms to lead the interpreter to the correct diagnosis, and mastery of this skill grows from ongoing clinical experience. Examples of the “inductive-deductive reasoning” are localizing an accessory AV pathway, the differential diagnosis of narrow or wide complex tachycardias, and identifying the site of coronary artery occlusion in a patient with a STEMI.
4. Ladder diagrams: Ladder diagrams have been used for over 100 years to graphically illustrate the mechanism of arrhythmias. They can be incredibly useful to help learners visualize impulse conduction in reentry mechanisms as well as other abnormal rhythms. However, there are some rhythms that are difficult to illustrate on ladder diagrams.37
5. Peer and near-peer teaching: Peer teaching occurs when learners prepare and deliver teaching material to learners of a similar training level. The expectation to deliver a teaching session encourages students to learn and organize information in thoughtful ways. It builds strong teamwork skills and has been shown to positively affect all involved learners.38-40
Each ECG interpretation strategy has its advantages, and we recommend that students be exposed to all available approaches if teaching resources are available.
Teaching Delivery Format
Each of the above teaching strategies can be delivered to students in various ways. The following teaching formats have been previously documented in the literature:
1. Classroom-based teaching: This is a traditional learning format that takes place in a large- or small-group classroom. Typically, these sessions are led by a single instructor, and they are focused on the direct sharing of information and group discussion.41
2. Electronic practice tools: Numerous electronic tools have been developed with the purpose of providing deliberate practice to master ECG interpretation. Some of these tools employ active learner engagement, while others provide a bank of ECGs for self-directed passive learning.42-46
3. Video lectures: Short video lectures have been created to facilitate self-directed lecture based learning. These lectures are hosted on a variety of web-based platforms, including YouTube and Vimeo.47
4. Traditional and electronic books: Numerous traditional textbooks have been published on ECG interpretation and are designed to facilitate independent learning. Some textbooks directly deliver teaching material, while others contain sets of ECGs to allow for repetitive practice. More recently, iBooks incorporating self-assessment tools have been used to assist ECG teaching.34 The advantage of these tools is that they can also be used to supplement in-person classes.
5. Games: A unique ECG interpretation learning strategy consists of using puzzles and games to learn ECGs. This is meant to improve student engagement and interest in learning ECG interpretation.48
Given that there is currently a lack of evidence-based data to support 1 instructional format over another, we do not favor any particular one. This decision should be left to instructors and individual learners based on their preference and available resources. Further studies would be helpful to determine the effectiveness of various methods in teaching ECG interpretation and to identify any additional specific factors that facilitate learning.
Evaluation Strategies
1. Longitudinal ongoing feedback: This form of feedback universally takes place in all training programs and focuses on direct observation and point-of-care feedback by a senior healthcare professional during clinical practice. Typically, the feedback is informal and is centered around specific case presentations.
2. Formative testing: This assessment strategy is aimed at monitoring the learning of trainees and providing them with appropriate feedback. Tutors and teachers can use this data to individualize instruction and fill any training gaps that individuals and the class may have. Students themselves can use this information to encourage additional study to ensure they acquire required skills. Examples of formative testing are low-stakes in-training exams and asking audience questions during a workshop or lecture.49
3. Summative testing: Summative assessments are created to measure the level of proficiency developed by a learner and compare it against some standard or benchmark. This form of assessment establishes the extent to which educational objectives have been met. The most common example is an end-of-term examination.
Online ECG examination has been successfully used to provide methods of testing. They are easy to distribute, highly convenient for learners, and allow the display of high-quality graphics. They can also be graded electronically, thereby minimizing the resources required to administer and grade exams.36,50
We recommend using a combination of assessment formats to ensure the optimal evaluation of learner skill and to focus learning on areas of weakness. Summative assessments are highly valuable to ensure learners acquired the necessary ECG interpretation competencies. Remediation strategies should be available to provide additional practice to learners who do not meet competencies expected at their level of training.
DISCUSSION
The Need for ECG Interpretation Competencies and Milestones
Since the introduction of ECG in the late 1800s, there continues to be a significant variation in ECG interpretation skills among trainees and medical professionals.4,6-12 Concerns continue to exist about the rate of missed diagnoses involving critical ECGs, leading to inappropriate patient management decisions. Despite the obvious need, teaching ECG interpretation is given little emphasis in medical education, and the curriculum remains quite disorganized. In this position paper, we call for a more structured ECG interpretation curriculum in medical education and hope to assist this process by assigning ECG patterns to 2 milestones in training: graduating medical students and first year postgraduate medical residents.
Defining competencies would help medical education programs to focus resources on teaching clinically important conditions for the appropriate level of training. We divide ECG findings into 4 categories (classes A to D), and we place emphasis on learning electrocardiographic emergencies early in training and spending less time on ECG findings that are unlikely to change patient management.
The goal is to ensure 100% recognition of class A (electrocardiographic emergencies) by the end of medical school. To ensure each medical education program fulfils this goal, a structured curriculum including a summative assessment is required.
Methods of Teaching
Various instructional mediums have been successfully implemented to teach ECG interpretation competencies, including lectures, puzzles, web-based programs, iBooks, and YouTube.34-41-44,47,48.51-53 A survey of clerkship directors in internal medicine revealed that 75% of clerkship programs teach ECG interpretation in a classroom lecture-based setting, 44% use teaching rounds, and only 17% utilize online/web-based instruction.3 Canadian family medicine programs have a relatively equal distribution between classroom-based, computer-based, and bedside teaching.5
In comparing the efficacy of instructional styles, several small comparative studies favor an electronic teaching format because of the enhanced learner interaction and visual learning, but there does not appear to be a consistently proven large advantage of 1 teaching format over another.43,48,51,54 The overall theme emerging from this literature is the importance of repetition and active engagement in ECG interpretation, which appear to be more important than 1 particular strategy.22 Computer-based training appears to deliver these 2 qualities, unlike the traditional lecture-style passive learning model. The concept of repetition and engagement is also well supported in medical education literature outside ECG interpretation.55,56
Given these data, we recommend that each medical education program select teaching methods based on their available resources, as long as adequate teaching time is allotted to ensure that trainees acquire the competencies defined in this publication.
Assessment Methods
It appears that the larger factor in determining ECG interpretation performance is not the learning format, but the form of assessment. Two studies have demonstrated that summative assessment substantially improves ECG interpretation performance when compared with formative assessment; in fact, this effect was so large that it overshadowed any small difference in teaching formats.57,58 This concept aligns with medical education literature, which acknowledges that assessment drives learning by raising the stakes, thereby boosting student effort and encouraging learning to an effect much larger than can be generated by any particular learning style.57,59 Nevertheless, well-designed formative assessment can focus students on effective learning by identifying gaps and important information.60 Only 33% of Canadian family medicine residency programs and 71% of American clerkship programs have formal assessment of ECG interpretation skills.3,5 There is no doubt that assessment, both formative and summative, should be implemented in all undergraduate and postgraduate medical training programs. Online assessment methods have the advantage of delivering high-quality images and a variety of question formats; hence, their use should be encouraged.36,50,61-63
Teaching Personnel and Timing of Training
Who should teach ECG interpretation and when should this teaching take place? ECG interpretation in training programs is typically taught by attending physicians in each respective field. However, given that there is a large ECG interpretation error rate by noncardiologist physicians, we advise that ECG training content be created with input from own-specialty attending physicians and cardiologists.4 This teaching should take place early in medical school at the time medical students learn pathophysiology of the heart and should continue throughout training. Longitudinal training is preferred to block-based training because of improved resident satisfaction, but medical education literature did not reveal a difference in student performance with either strategy.64-66
CONCLUSIONS
Despite its immense clinical value, there continues to be a lack of a comprehensive ECG interpretation curriculum in medical education programs. The goal of this position paper is to encourage the development of organized curricula in undergraduate and postgraduate medical education programs, and to ensure the acquisition of level-appropriate ECG interpretation skills while maintaining patient safety. We assist this process by grouping ECG findings into 4 classes (A to D) based on the frequency of encounter and emergent nature and by assigning them to each level of training. Methods of teaching ECG interpretation are less important and can be selected based on the available resources of each education program and student preference; however, online learning is encouraged. We also recommend that summative trainee evaluation methods be implemented in all programs to ensure that appropriate competencies are acquired and to further encourage self-directed learning. Resources should be allocated to ensure that every trainee is reaching their training milestones and should ensure that no electrocardiographic emergency (class A condition) is ever missed by a trainee. We hope that these guidelines will inform medical education systems and help prevent adverse patient outcomes caused by the misinterpretation of this valuable clinical diagnostic tool.
Disclosure
On behalf of all authors, the corresponding author states that there is no conflict of interest. This manuscript did not utilize any sources of funding.
1. Baranchuk A, Chiale PA, Green M, Caldwell JC. Editorial: surface electrocardiogram remains alive in the XXI century. Curr Cardiol Rev. 2014;10(3):173-174. http://www.ncbi.nlm.nih.gov/pubmed/24856069. Accessed January 4, 2017. PubMed
2. Fisch C. Evolution of the clinical electrocardiogram. J Am Coll Cardiol. 1989;14(5):1127-1138. doi:10.1016/0735-1097(89)90407-5. PubMed
3. O’Brien KE, Cannarozzi ML, Torre DM, Mechaber AJ, Durning SJ. Training and assessment of ECG interpretation skills: results from the 2005 CDIM survey. Teach Learn Med. 2005;21(2):111-115. doi:10.1080/10401330902791255. PubMed
4. Salerno SM, Alguire PC, Waxman HS. Competency in Interpretation of 12-Lead Electrocardiograms: A Summary and Appraisal of Published Evidence. Ann Intern Med. 2003;138(9):751-760. doi:10.1016/S1062-1458(03)00283-6. PubMed
5. Paul B, Baranchuk A. Electrocardiography teaching in Canadian family medicine residency programs: A national survey. Fam Med. 2011;43(4):267-271. http://www.ncbi.nlm.nih.gov/pubmed/21500000. Accessed January 4, 2017. PubMed
6. Jablonover RS, Lundberg E, Zhang Y, Stagnaro-Green A. Competency in electrocardiogram interpretation among graduating medical students. Teach Learn Med. 2014;26(3):279-284. doi:10.1080/10401334.2014.918882. PubMed
7. Elnicki DM, van Londen J, Hemmer PA, Fagan M, Wong R. US and Canadian internal medicine clerkship directors’ opinions about teaching procedural and interpretive skills to medical students. Acad Med. 2004;79(11):1108-1113. http://www.ncbi.nlm.nih.gov/pubmed/15504782. Accessed January 31, 2017. PubMed
8. Shams M, Sullivan A, Abudureyimu S, et al. Optimizing Electrocardiogram Interpretation and Catheterization Laboratory Activation in St-Segment Elevation Myocardial Infarction: a Teaching Module for Medical Students. J Am Coll Cardiol. 2016;67(13):643. doi:10.1016/S0735-1097(16)30644-1.
9. Grum CM, Gruppen LD, Woolliscroft JO. The influence of vignettes on EKG interpretation by third-year students. Acad Med. 1993;68:S61-S63. PubMed
10. Little B, Ho KJ, Scott L. Electrocardiogram and rhythm strip interpretation by final year medical students. Ulster Med J. 2001;70(2):108-110. PubMed
11. Eslava D, Dhillon S, Berger J, Homel P, Bergmann S. Interpretation of electrocardiograms by first-year residents: the need for change. J Electrocardiol. 2009;42(6):693-697. doi:10.1016/j.jelectrocard.2009.07.020. PubMed
12. Sibbald M, Davies EG, Dorian P, Yu EHC. Electrocardiographic Interpretation Skills of Cardiology Residents: Are They Competent? Can J Cardiol. 2014;30(12):1721-1724. doi:10.1016/j.cjca.2014.08.026. PubMed
13. Lee TH, Rouan GW, Weisberg MC, et al. Clinical characteristics and natural history of patients with acute myocardial infarction sent home from the emergency room. Am J Cardiol. 1987;60(4):219-224. Accessed January 4, 2017. PubMed
14. Todd KH, Hoffman JR, Morgan MT. Effect of cardiologist ECG review on emergency department practice. Ann Emerg Med. 1996;27(1):16-21. Accessed January 4, 2017. PubMed
15. Denes P, Larson JC, Lloyd-Jones DM, Prineas RJ, Greenland P. Major and Minor ECG Abnormalities in Asymptomatic Women and Risk of Cardiovascular Events and Mortality. JAMA. 2007;297(9):978. doi:10.1001/jama.297.9.978. PubMed
16. Salerno SM, Alguire PC, Waxman HS. Training and Competency Evaluation for Interpretation of 12-Lead Electrocardiograms: Recommendations from the American College of Physicians. Ann Intern Med. 2003;138(9):747-750. doi:10.7326/0003-4819-138-9-200305060-00012. PubMed
17. Accreditation Council for Graduate Medical Education. ACGME Program Requirements for Graduate Medical Education in Cardiovascular Disease (Internal Medicine); 2016. https://www.acgme.org/Portals/0/PFAssets/ProgramRequirements/152_interventional_cardiology_2017-07-01.pdf. Accessed January 4, 2017.
18. American Board of Internal Medicine. Policies and Procedures For Certification; 2016. http://www.abim.org/~/media/ABIM Public/Files/pdf/publications/certification-guides/policies-and-procedures.pdf. Accessed January 4, 2017.
19. Kadish AH, Buxton AE, Kennedy HL, et al. ACC/AHA Clinical Competence Statement on Electrocardiography and Ambulatory Electrocardiography. J Am Coll Cardiol. 2001;38(7):3169-3178. PubMed
20. Kern D, Thomas PA, Hughes MT, editors. Curriculum Development for Medical Education: A Six-Step Approach. 2nd edition. Baltimore: The Johns Hopkins University Press; 2009.
21. De Fer T, Fazio S, Goroll A. Core Medicine Clerkship: Curriculum Guide V3.0. Alliance for Academic Internal Medicine; 2006. http://www.im.org/p/cm/ld/fid=385. Accessed January 12, 2017.
22. Hatala RM, Brooks LR, Norman GR. Practice makes perfect: The critical role of mixed practice in the acquisition of ECG interpretation skills. Adv Heal Sci Educ. 2003;8(1):17-26. doi:10.1023/A:1022687404380. PubMed
23. Bayes de Luna A. ECGs For Beginners. Barcelona: Wiley Blackwell; 2014.
24. O’Keefe J, Hammill S, Freed M, Pogwizd S. The Complete Guide to ECGs. Third edition. Kansas City: Physicians’ Press - Jones and Bartlett Publishers; 2008.
25. Khan G. Rapid ECG Interpretation. Third edition. Ottawa: Humana Press (Springer Science); 2008.
26. Garcia T. 12-Lead ECG: The Art of Interpretation. Second edition. Burlington: Jones & Bartlett Learning; 2015.
27. Olson CW, Warner RA, Wagner GS, Selvester RH. A dynamic three-dimensional display of ventricular excitation and the generation of the vector and electrocardiogram. J Electrocardiol. 2001;34 Suppl:7-15. doi:10.1054/jelc.2001.29793. PubMed
28. Olson CW, Lange D, Chan JK, et al. 3D Heart: A new visual training method for Electrocardiographic Analysis. J Electrocardiol. 2007;40(5):1-7. doi:10.1016/j.jelectrocard.2007.04.001. PubMed
29. Wagner GS, Macfarlane P, Wellens H, et al. AHA/ACCF/HRS Recommendations for the Standardization and Interpretation of the Electrocardiogram. Part VI: Acute Ischemia/Infarction A Scientific Statement From the American Heart Association Electrocardiography and Arrhythmias Committee, Council on Clinical Cardiology; the American College of Cardiology Foundation; and the Heart Rhythm Society. Endorsed by the International Society for Computerized Electrocardiology. J Am Coll Cardiol. 2009;53(11):1003-1011. doi:10.1016/j.jacc.2008.12.016. PubMed
30. Thygesen K, Alpert JS, White HD. Universal definition of myocardial infarction. Eur Heart J. 2007;28(20):2525-2538. doi:10.1093/eurheartj/ehm355. PubMed
31. Neumar RW, Otto CW, Link MS, et al. Part 8: Adult advanced cardiovascular life support: 2010 American Heart Association Guidelines for Cardiopulmonary Resuscitation and Emergency Cardiovascular Care. Circulation. 2010;122(Suppl 3). doi:10.1161/CIRCULATIONAHA.110.970988. PubMed
32. Barold SS, Hayes DL. Second-Degree Atrioventricular Block: A Reappraisal. Mayo Clin Proc. 2001;76(1):44-57. doi:10.4065/76.1.44. PubMed
33. Borloz MP, Mark DG, Pines JM, Brady WJ. Electrocardiographic differential diagnosis of narrow QRS complex tachycardia: an ED-oriented algorithmic approach. Am J Emerg Med. 2010;28(3):378-381. doi:10.1016/j.ajem.2008.12.019. PubMed
34. Nadeau-Routhier C, Baranchuk A. Electrocardiography in Practice: What to Do? 1st ed. Kingston: Apple Inc. iBook; 2015.
35. Diercks DB, Shumaik GM, Harrigan RA, Brady WJ, Chan TC. Electrocardiographic manifestations: electrolyte abnormalities. J Emerg Med. 2004;27(2):153-160. doi:10.1016/j.jemermed.2004.04.006. PubMed
36. Quinn KL, Crystal E, Lashevsky I, Arouny B, Baranchuk A. Validation of a Novel Digital Tool in Automatic Scoring of an Online ECG Examination at an International Cardiology Meeting. Ann Noninvasive Electrocardiol. 2016;21(4):376-381. doi:10.1111/anec.12311. PubMed
37. Johnson NP, Denes P. The Ladder Diagram (A 100+ Year History). Am J Cardiol. 2008;101(12):1801-1804. doi:10.1016/j.amjcard.2008.02.085. PubMed
38. Bulte C, Betts A, Garner K, Durning S. Student teaching: views of student near-peer teachers and learners. Med Teach. 2007;29(0):583-590. doi:10.1080/01421590701583824. PubMed
39. Nestojko JF, Bui DC, Kornell N, Ligon Bjork E. Expecting to teach enhances learning and organization of knowledge in free recall of text passages. Mem Cogn. 2014;42:1038-1048. doi:10.3758/s13421-014-0416-z. PubMed
40. Bené KL, Bergus G. When learners become teachers: A review of peer teaching in medical student education. Fam Med. 2014;46(10):783-787. doi:10.4300/JGME-D-13-00426. PubMed
41. Lucas J, McKay S, Baxley E. EKG arrhythmia recognition: a third-year clerkship teaching experience. Fam Med. 2003;35(3):163-164. Accessed January 31, 2017. PubMed
42. DeBonis K, Blair TR, Payne ST, Wigan K, Kim S. Viability of a Web-Based Module for Teaching Electrocardiogram Reading Skills to Psychiatry Residents: Learning Outcomes and Trainee Interest. Acad Psychiatry. 2015;39(6):645-648. doi:10.1007/s40596-014-0249-x. PubMed
43. Chudgar SM, Engle DL, Grochowski COC, Gagliardi JP. Teaching crucial skills: An electrocardiogram teaching module for medical students. J Electrocardiol. 2016;49(4):490-495. doi:10.1016/j.jelectrocard.2016.03.021. PubMed
44. Nathanson LA, Safran C, McClennen S, Goldberger AL. ECG Wave-Maven: a self-assessment program for students and clinicians. Proc AMIA Symp. 2001:488-492. Accessed January 31, 2017. PubMed
45. Farré J, Wellens H. ECGcorner (Online). ECGcorner. http://www.ecgcorner.org. Published 2017. Accessed February 15, 2017.
46. Waechter J. Teaching Medicine (Online). https://www.teachingmedicine.com/ Accessed Feb 15, 2017.
47. Akgun T, Karabay CY, Kocabay G, et al. Learning electrocardiogram on YouTube: How useful is it? J Electrocardiol. 2014;47(1):113-117. doi:10.1016/j.jelectrocard.2013.09.004. PubMed
48. Rubinstein J, Dhoble A, Ferenchick G. Puzzle based teaching versus traditional instruction in electrocardiogram interpretation for medical students – a pilot study. BMC Med Educ. 2009;9(1):4. doi:10.1186/1472-6920-9-4. PubMed
49. Black P, Wiliam D. Assessment and Classroom Learning. Assess Educ. 1998;5(1):7-73. doi:10.1080/0969595980050102.
50. Quinn KL, Baranchuk A. Feasibility of a novel digital tool in automatic scoring of an online ECG examination. Int J Cardiol. 2015;185:88-89. doi:10.1016/j.ijcard.2015.03.135. PubMed
51. Nilsson M, Bolinder G, Held C, et al. Evaluation of a web-based ECG-interpretation programme for undergraduate medical students. BMC Med Educ. 2008;8(1):25. doi:10.1186/1
52. Lessard Y, Sinteff J-P, Siregar P, et al. An ECG analysis interactive training system for understanding arrhythmias. Stud Health Technol Inform. 2009;150:931-935. Accessed January 31, 2017. PubMed
53. Zakowski, Dean Keller L. An effective ECG curriculum for third-year medical students in a community-based clerkship. Med Teach. 2000;22(4):354-358. doi:10.1080/014215900409447.
54. Mahler SA, Wolcott CJ, Swoboda TK, Wang H, Arnold TC. Techniques for teaching electrocardiogram interpretation: Self-directed learning is less effective than a workshop or lecture. Med Educ. 2011;45(4):347-353. doi:10.1111/j.1365-2923.2010.03891.x. PubMed
55. Biggs J. What the Student Does: Teaching for enhanced learning. High Educ Res Dev. 1999;18(1):57-75.
56. Ericsson KA. Deliberate practice and acquisition of expert performance: A general overview. Acad Emerg Med. 2008;15(11):988-994. doi:10.1111/j.1553-2712.2008.00227.x. PubMed
57. Raupach T, Hanneforth N, Anders S, Pukrop T, Th J Ten Cate O, Harendza S. Impact of teaching and assessment format on electrocardiogram interpretation skills. Med Educ. 2010;44(7):731-740. doi:10.1111/j.1365-2923.2010.03687.x. PubMed
58. Raupach T, Brown J, Anders S, Hasenfuss G, Harendza S. Summative assessments are more powerful drivers of student learning than resource intensive teaching formats. BMC Med. 2013;11:61. doi:10.1186/1741-7015-11-61. PubMed
59. Roediger HL, Karpicke JD. Test-enhanced learning: Taking memory tests imporves ong-term retention. Psychol Sci. 2006;17(3):249-255. doi:10.1111/j.1467-9280.2006.01693.x. PubMed
60. Ferris HA, O’ Flynn D. Assessment in Medical Education; What Are We Trying to Achieve? Int J High Educ. 2015;4(2):139-144. doi:10.5430/ijhe.v4n2p139.
61. Hartman ND, Wheaton NB, Williamson K, Quattromani EN, Branzetti JB, Aldeen AZ. A Novel Tool for Assessment of Emergency Medicine Resident Skill in Determining Diagnosis and Management for Emergent Electrocardiograms: A Multicenter Study. J Emerg Med. 2016;51(6):697-704. doi:10.1016/j.jemermed.2016.06.054. PubMed
62. Pines JM, Perina DG, Brady WJ. Electrocardiogram interpretation training and competency assessment in emergency medicine residency programs. Acad Emerg Med. 2004;11(9):982-984. doi:10.1197/j.aem.2004.03.023. PubMed
63. Demircan A, Bildik F, Ergin M. Electrocardiography interpretation training in emergency medicine : methods, resources, competency assessment, and national standardization. Signa Vitae. 2015;10(1):38-52.
64. Ferrell BG, Camp DL. Comparing a Four-Week Block Clerkship to a Twelve-Week Longitudinal Experience in Family Medicine. In: Scherpbier AJJA, van der Vleuten CPM, Rethans JJ, and van der Steeg AFW, editors. Advances in Medical Education. Dordrecht: Springer Netherlands; 1997:744-746. doi:10.1007/978-94-011-4886-3_226.
65. Marinović D, Hren D, Sambunjak D, et al. Transition from longitudinal to block structure of preclinical courses: outcomes and experiences. Croat Med J. 2009;50(5):492-506. doi:10.3325/cmj.2009.50.492. PubMed
66. Melo J, Kaneshiro B, Kellett L, Hiraoka M. The impact of a longitudinal curriculum on medical student obstetrics and gynecology clinical training. Hawaii J Med Public Health. 2014;73(5):144-147. Accessed January 31, 2017. PubMed
© 2018 Society of Hospital Medicine
Review of Strategies to Reduce Central Line-Associated Bloodstream Infection (CLABSI) and Catheter-Associated Urinary Tract Infection (CAUTI) in Adult ICUs
Central line–associated bloodstream infection (CLABSI) and catheter-associated urinary tract infection (CAUTI) are morbid and expensive healthcare-associated infections (HAIs).1-8 While these HAIs are prevalent in intensive care units (ICUs) and general wards, most of the research, prevention efforts, and financial penalties have been focused in the ICU.9,10 For hospitalists, who are taking a larger role in caring for the critically ill,11,12 it is optimal to understand best preventive practices.
There has been a national puTash to standardize procedures and products to prevent CLABSI and CAUTI.2,13-16 CLABSI has transitioned from a common ICU complication to a “never event.” Success has been reflected in the prevention of 25,000 CLABSIs over the last decade, translating to a 58% reduction in infections, with 6000 deaths prevented and $414 million saved.2 CLABSI prevention principles have been applied to CAUTI prevention (ie, aseptic insertion, maintenance care, prompting removal) but with slower adoption17 and fewer dramatic CAUTI reductions,18 due in part to weaker recognition19 of CAUTI as a serious clinical event, despite its morbidity20 and cost.21
Despite recent improvements in preventing HAIs, there is a marked variability in how hospitals perform in preventing these infections.22 To inform infection prevention strategies for a large-scale implementation project funded by the Agency for Healthcare Research and Quality and focused on ICUs with persistently elevated CLABSI and/or CAUTI rates,23 we performed a systematic search of interventions to prevent CLABSI and CAUTI in the ICU setting. This evidence was synthesized to help units select and prioritize interventions to prevent these HAIs.
METHODS
Literature Search Strategy
We performed a systematic search to identify CLABSI and CAUTI prevention studies and synthesized findings using a narrative review process. Using criteria developed and refined from seminal articles on the topic,10,14,24-34 we searched the PubMed and Cochrane databases from their inception to October of 2015 using Medical Subject Headings (MeSHs) for “central venous catheters,” “CLABSI,” “central line associated bloodstream infection,” “catheter related bloodstream infection,” “intravascular devices,” “urinary catheterization,” “urinary catheters,” “urinary tract infections,” “CAUTI,” and “catheter associated urinary tract infections” and filtered for articles containing the MeSHs “intensive care unit” and “ICU.” Supplemental Figure 1 details the search, yielding 102 studies for CLABSI and 28 studies for CAUTI, including 7 studies with CLABSI and CAUTI interventions.
Eligibility Criteria Review
Study Design
We included randomized and nonrandomized studies that implemented at least 1 intervention to prevent CLABSI or CAUTI in an adult ICU setting and reported the preintervention or control group data to compare with the postintervention data. We excluded general ward, outpatient/ambulatory, and neonatal/pediatric settings. Interventions to prevent CLABSI or CAUTI were included. We excluded interventions focused on diagnosis or treatment or those that lacked adequate description of the intervention for replication. Studies with interventions that are no longer standard of care in the United States (US) were excluded, as were studies not available in English.
Outcomes
Primary Outcomes for Central Vascular Catheter Infection
- CLABSI: A lab-confirmed bloodstream infection in a patient who has had a central line for at least 48 hours on the date of the development of the bloodstream infection and without another known source of infection. We included studies that reported CLABSIs per 1000 central line days or those that provided data to permit calculation of this ratio. This measure is similar to current National Healthcare Safety Network (NHSN) surveillance definitions.22
- Catheter-related bloodstream infection (CRBSI): A lab-confirmed bloodstream infection attributed to an intravascular catheter by a quantitative culture of the catheter tip or by differences in growth between catheter and peripheral venipuncture blood culture specimens.35 This microbiologic definition of a central line bloodstream infection was often used prior to NHSN reporting, with rates provided as the number of CRBSIs per 1000 central line days.
Primary Outcome for Urinary Catheter Infection
- CAUTI: Urinary tract infection occurring in patients during or after the recent use of an indwelling urinary catheter. We included studies that reported CAUTIs per 1000 urinary catheter days or those that provided data to permit calculation of this ratio (similar to the current NHSN surveillance definitions).22 We excluded studies where CAUTI was defined as bacteriuria alone, without symptoms.
Secondary Outcomes
- Central line utilization ratio: The device utilization ratio (DUR) measure of central line use is calculated as central line days divided by patient days.
- Urinary catheter utilization ratio: The DUR measure of urinary catheter use is calculated as indwelling urinary catheter days divided by patient days, as used in NHSN surveillance, excluding other catheter types.22 We excluded other measures of urinary catheter use because of a large variation in definitions, which limits the ability to compare measures across studies.
Data Synthesis and Analysis
Information on the ICU and intervention type, intervention components, outcomes, and whether interventions were in use prior to the study was abstracted by CAUTI and CLABSI experts (JM and PKP) and confirmed by a second author.
We compared interventions found in the literature to components of the previously published urinary catheter “life cycle,” a conceptual model used to organize and prioritize interventions for a reduction in CAUTI (Figure 1).36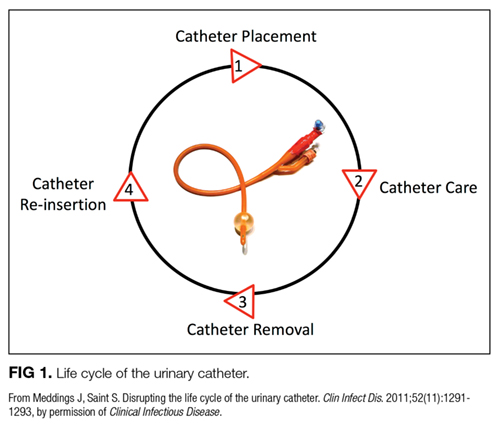
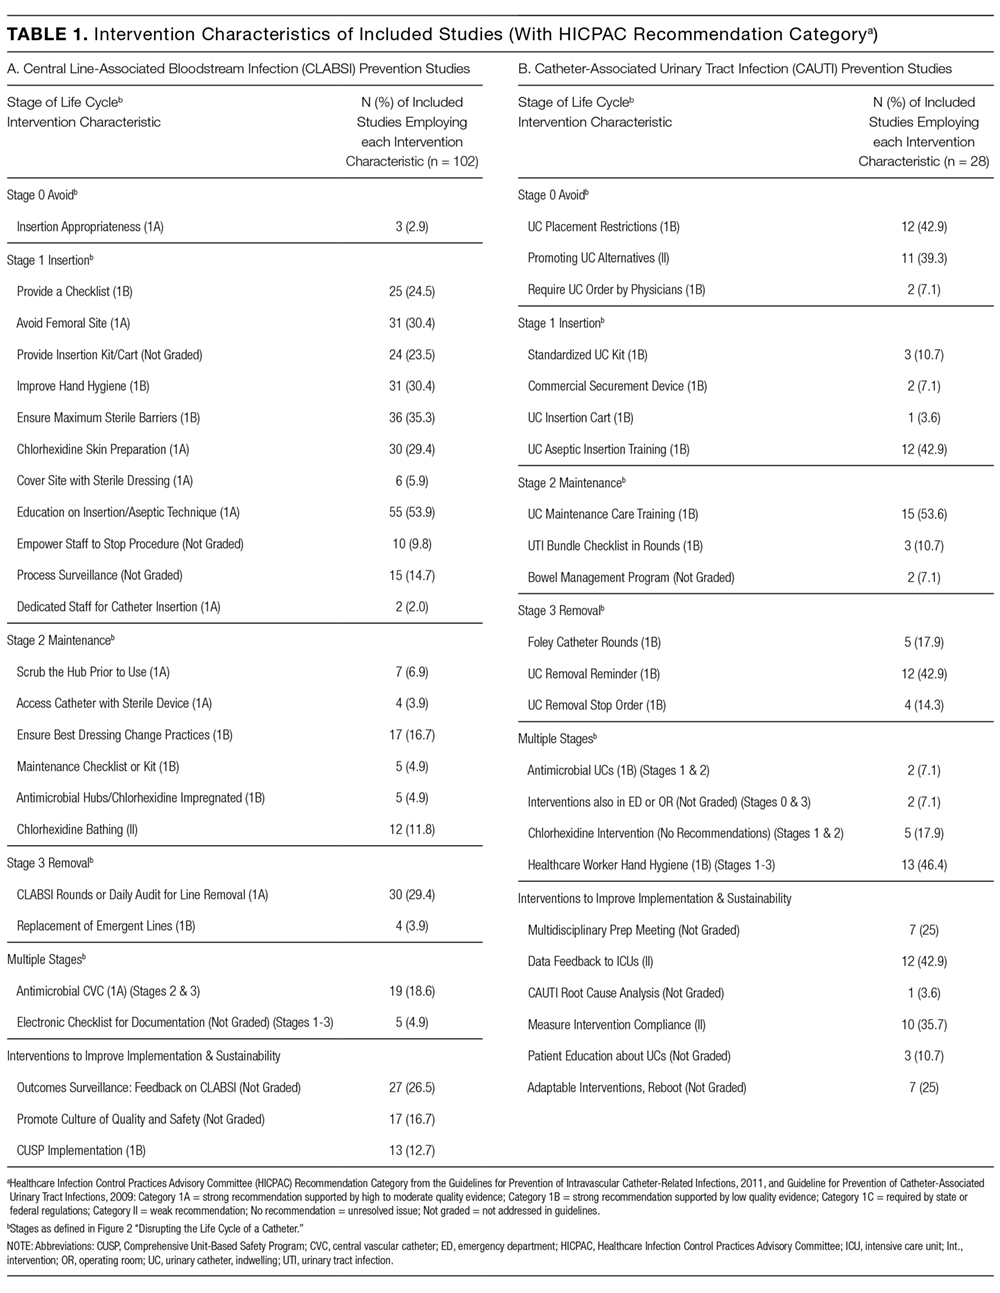
RESULTS
Conceptual Model for Disrupting the Life Cycle of a Catheter
Our data analysis demonstrated that components of the urinary catheter life cycle (Figure 1) were useful and could be applied to vascular catheters, but changes were needed to make the model more valuable to hospitalists implementing CLABSI and CAUTI prevention interventions. We found that the previously named stage 1 (catheter placement) is better described in 2 stages: stage 0, avoid catheter if possible, and stage 1, ensure aseptic placement. Additionally, we tailored the model to include actionable language, describing ways to disrupt the life cycle. Finally, we added a component to represent interventions to improve implementation and sustainability, such as auditing compliance and timely feedback to clinicians. Thus, we introduce a new conceptual model, “Disrupting the Life Cycle of a Catheter” (Figure 2)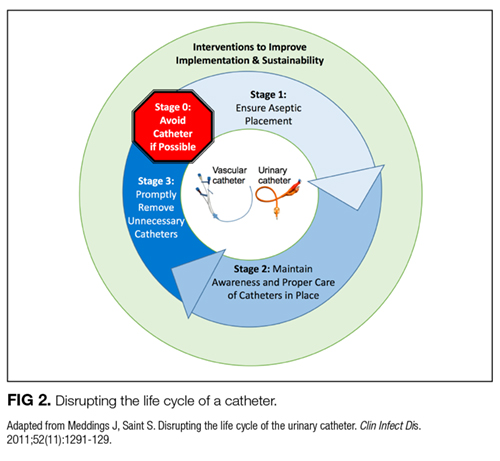
Central Vascular Catheter Interventional Study Results
Characteristics of Included Central Vascular Catheter Infection Studies
Of the 102 central vascular catheter (CVC) studies that met the inclusion criteria (reporting outcomes for 105 intervention cohorts), 59 studies10,14,16,24-27,38-89 reporting outcomes for 61 intervention cohorts were performed in the US. Study designs included 14 randomized controlled trials (RCTs)48,64,68,74,79,90-98 and 88 before–after studies (Appendix Table 1). 10,14,16,24-27,33,38-47,49-63,69-73,75-78,80-89,99-131 Many RCTs evaluated antimicrobial products (CVCs, hubs, bathing) as interventions,48,68,74,90-95,97,98 but a few RCTs studied interventions64,79,93 impacting catheter care or use (Appendix Table 1). Fifty-one studies took place in tertiary care hospitals and 55 in academic hospitals. Thirty-one studies were multicenter; the largest included 792 hospitals and 1071 ICUs.24 ICU bed size ranged from 5 to 59.
CVC Study Outcomes
Sixty-three studies reported CLABSI outcomes, and 39 reported CRBSI outcomes (Table 2). Many studies had preintervention or control rates above the 2013 NHSN 75th percentiles,22 which varied by ICU type. Preintervention or control infection rates per 1000 catheter days varied widely (means: CLABSI 7.5, CRBSI 6.3); US studies reported ranges of 1.1 to 12.1 CLABSI and 1.2 to 11.0 CRBSI per 1000 catheter days; non-US studies reported ranges of 1.4 to 45.9 CLABSI and 1.6 to 22.7 CRBSI per 1000 catheter days. Postintervention rates varied widely, with overall means of 2.8 CLABSI and 2.5 CRBSI per 1000 catheter days, including US study ranges of 0 to 8.9 CLABSI and 0 to 5.4 CRBSI, and non-US study ranges of 0 to 17.1 CLABSI and 0 to 15.9 CRBSI.
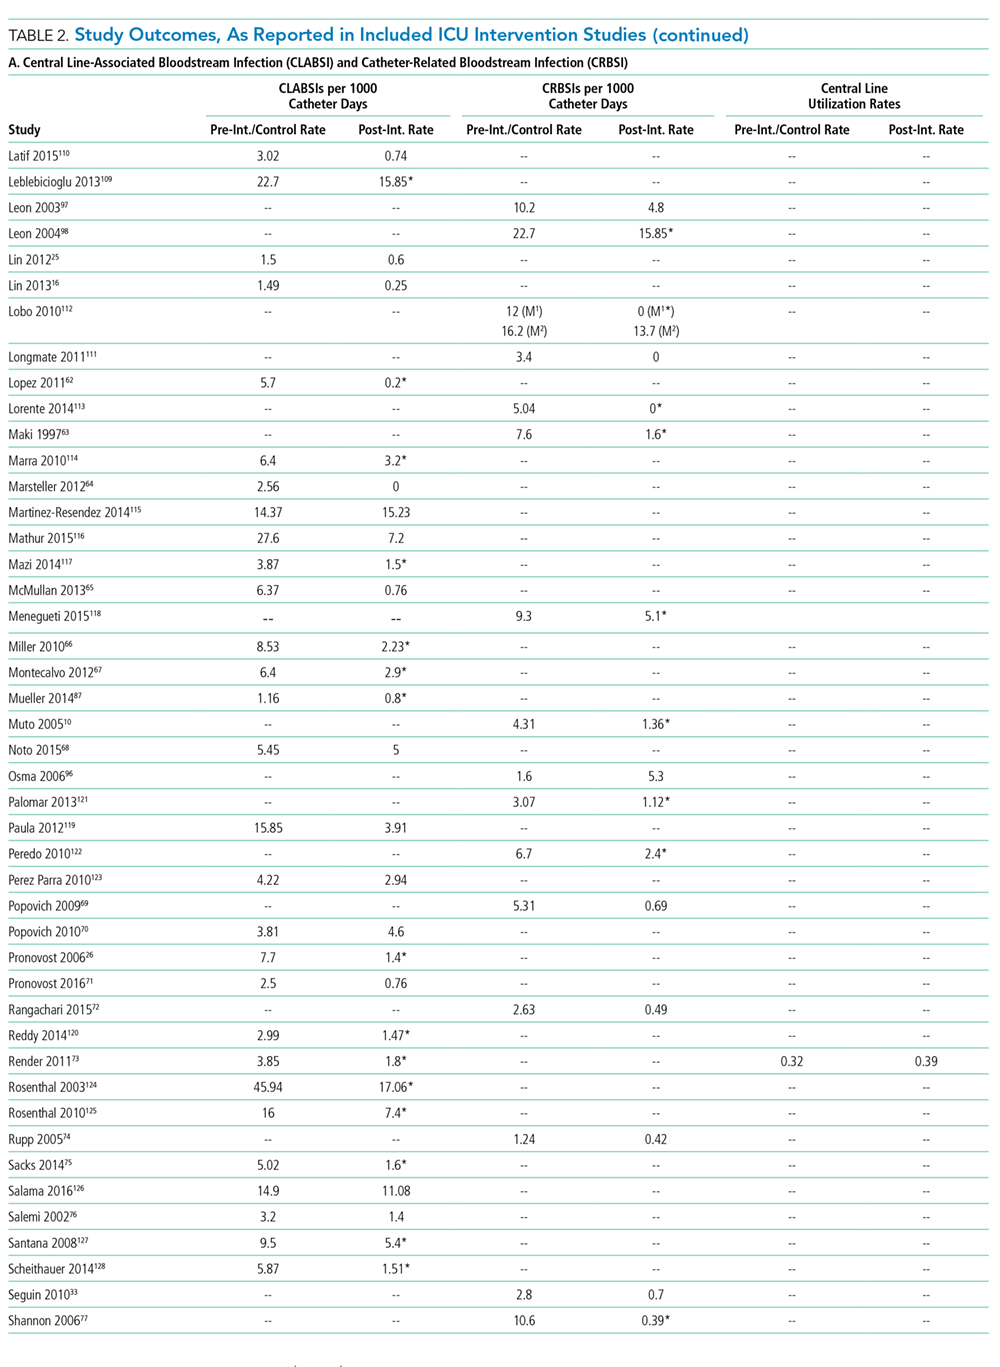
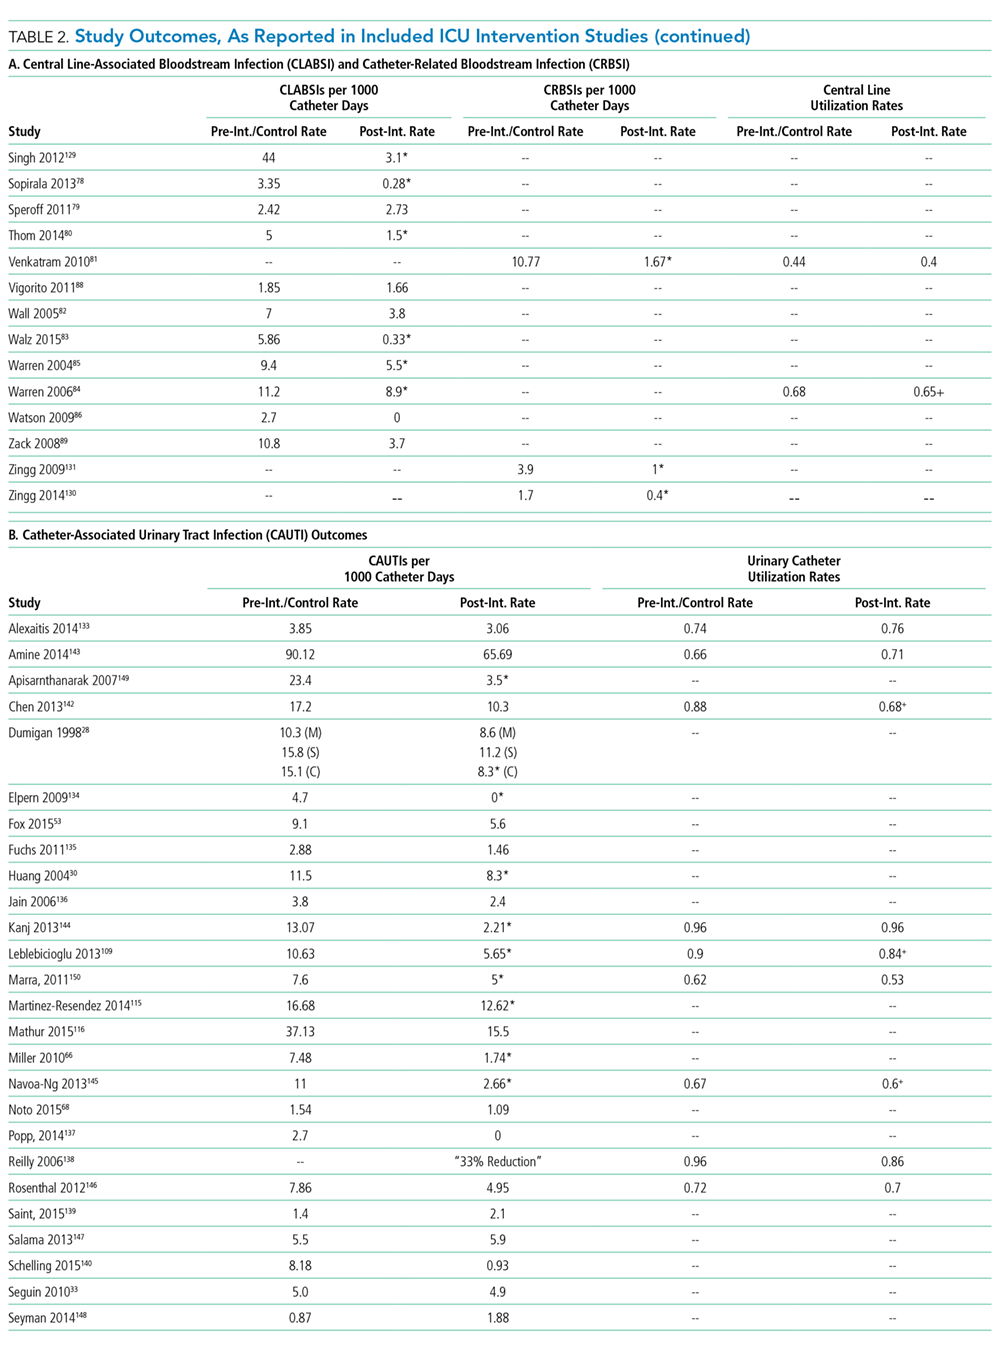
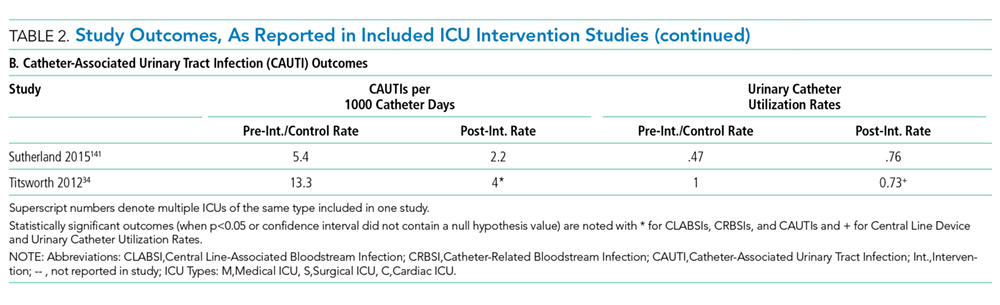
Central line DURs were reported in only 5 studies; 3 reported decreased postintervention DURs (2 with statistical significance), with a mean 11.7% reduction (Table 2).
CVC Interventions
CVC study interventions are summarized in Table 1, categorized by catheter life cycle component (Figure 2). Thirty-two included studies used a single intervention to prevent CVC infection. Interventions to avoid placement when possible were infrequent. Insertion-stage interventions were common and included avoiding the femoral site during placement, ensuring maximal sterile barriers, and chlorhexidine skin preparation. Standardizing basic products for central line insertion was often done by providing ICUs with a CLABSI insertion kit or stocked cart. In some studies, this was implemented prior to the intervention, and in others, the kit or cart itself was the intervention. Maintenance-stage interventions included scrubbing the hub prior to use, replacing wet or soiled dressings, accessing the catheter with sterile devices, and performing aseptic dressing changes. A recent systematic review and meta-analysis of CVC infection prevention studies indicated that implementing care bundles and/or checklists appears to yield stronger risk reductions than interventions without these components.132 The most common catheter removal interventions were daily audits of line removal and CLABSI rounds focused on ongoing catheter necessity.
Common implementation and sustainability interventions included outcome surveillance, such as feedback on CLABSI, and socio-adaptive interventions to prompt improvements in patient safety culture. Process and outcome surveillance as interventions were implemented in about one-quarter of the studies reviewed (AppendixTable 1).
CAUTI Interventional Study Results
Characteristics of Included CAUTI Studies
Of the 28 CAUTI studies that met the inclusion criteria (reporting outcomes for 30 intervention cohorts), 14 studies (reporting outcomes for 16 intervention cohorts) were performed in the US.28,34,53,66,68,133-141 Study designs included 2 RCTs (focused on urinary catheter avoidance or removal142 and chlorhexidine bathing68) and 26 nonrandomized, before–after studies28,30,33,34,53,66,109,114-116,133-141,143-149 (Appendix Table 1). The number of hospitals per study varied from 1 to 53, with the majority being single-hospital interventions.
CAUTI Study Outcomes
All 28 studies reported CAUTIs per 1000 catheter days for both intervention and comparison groups (Table 2). Preintervention or control CAUTI rates varied widely, with an overall mean of 12.5 CAUTIs per 1000 catheter days; US studies reported a range from 1.4 to 15.8 CAUTIs per 1000 catheter days; non-US studies reported a range from 0.8 to 90.1 CAUTIs per 1000 catheter days. Many studies had preintervention or control rates above the 2013 NHSN 75th percentiles.22 Postintervention CAUTI rates varied widely, with an overall mean of 7.0 CAUTIs per 1000 catheter days, including a US study range from 0 to 11.2 and a non-US study range from 1.9 to 65.7.
Overall (Table 2), 27 of the 30 intervention cohorts described in the 28 studies reported fewer CAUTIs, including all ICU types. Lower postintervention CAUTI rates were reported in 25 studies, with a mean 49.4% reduction, including 11 statistically significant reductions; many studies did not report the level of statistical significance or described inadequate power to detect a significant change (Table 2).
Urinary catheter utilization rates were reported for 11 studies (Table 2). A decreased urinary catheter utilization rate was reported in 7 studies (4 with statistically signficiant reductions), with a mean 16% reduction (Table 2). Other outcomes included cost savings, the potential for unintended negative outcomes, and clinician compliance with intervention components. Positive cost savings were reported in 5 studies.30,34,133,141,149
CAUTI Interventions
Of the 28 included CAUTI prevention studies, only 5 studied single interventions. Interventions were categorized in Table 1 by “life cycle” stages or as interventions to improve implementation and sustainability (Figure 2). Interventions to restrict indwelling urinary catheter use were common, including creating lists of approved indications selected by unit or hospital policy and requiring catheter orders with approved indications. Eight studies published approved indication lists.28,34,133-135,138,142,146 Although several studies describe the encouragement and use of bladder scanners and urinary catheter alternatives, none described purchasing these catheter alternatives.
Interventions to avoid indwelling urinary catheters included education about external catheters,28,34,109,133,140,144-146 urinary retention protocols,34,144,135,141 and bladder scanner simulation training.133 Interventions to improve aseptic insertion28,34,66,109,116,139-141-143-146,150 and maintenance care28,34,66,109,116,133,135,136,139-141,143-146,150 of urinary catheters were common. Four studies used a standardized urinary catheter kit or cart,28,34,139,142 and 2 studies used a commercial urinary catheter securement device.34,140 A CAUTI bundle checklist in daily patient care rounds was tested in 3 studies (Table 1).66,136,150 Reminder and stop order strategies, with the potential to reduce CAUTI rates by >50%,151 were included in 15 studies, with inteventions such as nurse-empowered stop orders. Several implementation and sustainability interventions were described, including socio-adaptive strategies such as holding multidisciplinary meetings to obtain unit or clinician feedback to inform design and improve buy-in and providing frequent feedback to ICU clinicians, including audits of catheter use appropriateness and catheter-associated infections.
DISCUSSION
This extensive literature review yielded a large body of literature demonstrating success in preventing CLABSI and CAUTI in all types of adult ICUs, including in general medical and surgical ICUs and in specialized units with historically higher rates, such as trauma, burn, and neurosurgical. Reported reductions in catheter infections were impressive (>65% for CLABSI or CRBSI and nearly 50% for CAUTI), though several studies had limited power to detect statistical significance. DURs were reported more rarely (particularly for vascular catheters) and often without power to detect statistical significance. Nevertheless, 7 studies reported reduced urinary catheter use (16% mean reduction), which would be anticipated to be clinically significant.
The conceptual model introduced for “Disrupting the Life Cycle of a Catheter” (Figure 2) can be a helpful tool for hospitalists and intensivists to assess and prioritize potential strategies for reducing catheter-associated infections. This study’s results indicate that CLABSI prevention studies often used interventions that optimize best practices during aseptic insertion and maintenance, but few studies emphasized reducing inappropriate central line use. Conversely, CAUTI prevention often targeted avoiding placement and prompting the removal of urinary catheters, with fewer studies evaluating innovative products or technical skill advancement for aseptic insertion or maintenance, though educational interventions to standardize aseptic catheter use were common. Recently, recommendations for reducing the inappropriate use of urinary catheters and intravenous catheters, including scenarios common in ICUs, were developed by using the rigorous RAND/UCLA Appropriateness Method152,153; these resources may be helpful to hospitalists designing and implementing interventions to reduce catheter use.
In reviewing the US studies of 5 units demonstrating the greatest success in preventing CLABSI56,62,65,78,83 and CAUTI,28,34,66,134 several shared features emerged. Interventions that addressed multiple steps within the life cycle of a catheter (avoidance, insertion, maintenance, and removal) were common. Previous work has shown that assuring compliance in infection prevention efforts is a key to success,154 and in both CLABSI and CAUTI studies, auditing was included in these successful interventions. Specifically for CLABSI, the checklist, a central quality improvement tool, was frequently associated with success. Unique to CAUTI, engaging a multidisciplinary team including nurse leadership seemed critical to optimize implementation and sustainability efforts. In addition, a focus on stage 3 (removal), including protocols to remove by default, was associated with success in CAUTI studies.
Our review was limited by a frequent lack of reporting of statistical significance or by inadequate power to detect a significant change and great variety. The ability to compare the impact of specific interventions is limited because studies varied greatly with respect to the type of intervention, duration of data collection, and outcomes assessed. We also anticipate that successful interventions are more likely to be published than are trials without success. Strengths include the use of a rigorous search process and the inclusion and review of several types of interventions implemented in ICUs.
In conclusion, despite high catheter use in ICUs, the literature includes many successful interventions for the prevention of vascular and urinary catheter infections in multiple ICU types. This review indicates that targeting multiple steps within the life cycle of a catheter, particularly when combined with interventions to optimize implementation and sustainability, can improve success in reducing CLABSI and CAUTI in the ICU.
Acknowledgments
The authors thank all members of the National Project Team for the AHRQ Safety Program for Intensive Care Units: Preventing CLABSI and CAUTI.
Disclosure
Agency for Healthcare Research and Quality (AHRQ) contract #HHSP233201500016I/HHSP23337002T provided funding for this study. J.M.’s other research is funded by AHRQ (2R01HS018334-04), the NIH-LRP program, the VA National Center for Patient Safety, VA Ann Arbor Patient Safety Center of Inquiry, the Health Research and Educational Trust, American Hospital Association and the Centers for Disease Control and Prevention. The findings and conclusions in this report are those of the authors and do not necessarily represent those of the sponsor, the Agency for Healthcare Research and Quality, or the US Department of Veterans Affairs. All authors report no conflicts of interest relevant to this article.
1. National and state healthcare-associated infections progress report. Centers for Disease Control and Prevention website. http://www.cdc.gov/hai/progress-report/. 2016. Accessed January 10, 2016.
2. Srinivasan A, Wise M, Bell M, et al. Vital signs: central line-associated blood stream infections-United States, 2001, 2008, and 2009. MMWR Morb Mortal Wkly Rep. 2011;60(8):243-248. PubMed
3. Abramczyk ML, Carvalho WB, Carvalho ES, Medeiros EA. Nosocomial infection in a pediatric intensive care unit in a developing country. Braz J Infect Dis. 2003;7(6):375-380. PubMed
4. Saint S. Clinical and economic consequences of nosocomial catheter-related bacteriuria. Am J Infect Control. 2000;28(1):68-75. PubMed
5. Ziegler MJ, Pellegrini DC, Safdar N. Attributable mortality of central line associated bloodstream infection: systematic review and meta-analysis. Infection. 2015;43(1):29-36. PubMed
6. Siempos, II, Kopterides P, Tsangaris I, Dimopoulou I, Armaganidis AE. Impact of catheter-related bloodstream infections on the mortality of critically ill patients: a meta-analysis. Crit Care Med. 2009;37(7):2283-2289. PubMed
7. Zingg W, Sax H, Inan C, et al. Hospital-wide surveillance of catheter-related bloodstream infection: from the expected to the unexpected. J Hosp Infect. 2009;73(1):41-46. PubMed
8. Chant C, Smith OM, Marshall JC, Friedrich JO. Relationship of catheter-associated urinary tract infection to mortality and length of stay in critically ill patients: a systematic review and meta-analysis of observational studies. Crit Care Med. 2011;39(5):1167-1173. PubMed
9. Lee GM, Kleinman K, Soumerai SB, et al. Effect of nonpayment for preventable infections in US hospitals. N Engl J Med. 2012;367(15):1428-1437.
10. Muto C, Herbert C, Harrison E, Edwards JR, et al. Reduction in central line-associated bloodstream infections among patients in intensive care units - Pennsylvania, April 2001-March 2005. MMWR Morb Mortal Wkly Rep. 2005;54(40):1013-1016. PubMed
11. Heisler M. Hospitalists and intensivists: partners in caring for the critically ill--the time has come. J Hosp Med. 2010;5(1):1-3. PubMed
12. Siegal EM, Dressler DD, Dichter JR, Gorman MJ, Lipsett PA. Training a hospitalist workforce to address the intensivist shortage in American hospitals: a position paper from the Society of Hospital Medicine and the Society of Critical Care Medicine. J Hosp Med. 2012;7(5):359-364. PubMed
13. Gould CV, Umscheid CA, Agarwal RK, Kuntz G, Pegues DA. Guideline for Prevention of Catheter-Associated Urinary Tract Infections 2009. Healthcare Infection Control Practices Advisory Committee (HICPAC). Centers for Disease Control and Prevention website. https://www.cdc.gov/infectioncontrol/guidelines/CAUTI/index.html. 2009. Accessed May 26, 2017.
14. Hong AL, Sawyer MD, Shore A, et al. Decreasing central‐line–associated bloodstream infections in Connecticut intensive care units. J Healthc Qual. 2013;35(5):78-87. PubMed
15. Weaver SJ, Weeks K, Pham JC, Pronovost PJ. On the CUSP: Stop BSI: evaluating the relationship between central line-associated bloodstream infection rate and patient safety climate profile. Am J Infect Control. 2014;42(10 Suppl):S203-S208. PubMed
16. Lin DM, Weeks K, Holzmueller CG, Pronovost PJ, Pham JC. Maintaining and sustaining the On the CUSP: stop BSI model in Hawaii. Jt Comm J Qual Patient Saf. 2013;39(2):51-60. PubMed
17. Krein SL, Fowler KE, Ratz D, Meddings J, Saint S. Preventing device-associated infections in US hospitals: national surveys from 2005 to 2013. BMJ Qual Saf. 2015;24(6):385-392. PubMed
18. Department of Health and Human Services Action Plan to Prevent Healthcare-Associated Infections. Current progress on meeting these targets reviewed in 2013. https://health.gov/hcq/prevent-hai.asp. Accessed October 28, 2016.
19. Krein SL, Kowalski CP, Harrod M, Forman J, Saint S. Barriers to reducing urinary catheter use: a qualitative assessment of a statewide initiative. JAMA Intern Med. 2013;173(10):881-886. PubMed
20. Nicolle LE. Catheter associated urinary tract infections. Antimicrob Resist Infect Control. 2014;3:23. PubMed
21. Kennedy EH, Greene MT, Saint S. Estimating hospital costs of catheter-associated urinary tract infection. J Hosp Med. 2013;8(9):519-522. PubMed
22. Dudeck MA, Edwards JR, Allen-Bridson K, et al. National Healthcare Safety Network Report, data summary for 2013, Device-associated Module. Am J Infect Control. 2015;43:206-221. PubMed
23. AHRQ Safety Program for Intensive Care Units: Preventing CLABSI and CAUTI. Agency for Healthcare Research and Quality website. http://www.ahrq.gov/professionals/quality-patient-safety/hais/tools/preventing/index.html. 2017. Accessed August 24, 2017.
24. Berenholtz SM, Lubomski LH, Weeks K, et al. Eliminating central line-associated bloodstream infections: a national patient safety imperative. Infect Control Hosp Epidemiol. 2014;35(1):56-62. PubMed
25. Lin DM, Weeks K, Bauer L, et al. Eradicating central line-associated bloodstream infections statewide: the Hawaii experience. Am J Med Qual. 2012;27(2):124-129. PubMed
26. Pronovost P, Needham D, Berenholtz S, et al. An intervention to decrease catheter-related bloodstream infections in the ICU. N Engl J Med. 2006;355(26):2725-2732. PubMed
27. DePalo VA, McNicoll L, Cornell M, Rocha JM, Adams L, Pronovost PJ. The Rhode Island ICU collaborative: a model for reducing central line-associated bloodstream infection and ventilator-associated pneumonia statewide. Qual Saf Health Care. 2010;19(6):555-561. PubMed
28. Dumigan DG, Kohan CA, Reed CR, Jekel JF, Fikrig MK. Utilizing national nosocomial infection surveillance system data to improve urinary tract infection rates in three intensive-care units. Clin Perform Qual Health Care. 1998;6(4):172-178. PubMed
29. Eggimann P, Harbarth S, Constantin MN, Touveneau S, Chevrolet JC, Pittet D. Impact of a prevention strategy targeted at vascular-access care on incidence of infections acquired in intensive care. Lancet. 2000;355(9218):1864-1868. PubMed
30. Huang WC, Wann SR, Lin SL, et al. Catheter-associated urinary tract infections in intensive care units can be reduced by prompting physicians to remove unnecessary catheters. Infect Control Hosp Epidemiol. 2004;25(11):974-978. PubMed
31. McLaws ML, Burrell AR. Zero risk for central line-associated bloodstream infection: are we there yet? Crit Care Med. 2012;40(2):388-393. PubMed
32. Miller SE, Maragakis LL. Central line-associated bloodstream infection prevention. Curr Opin Infect Dis. 2012;25(4):412-422. PubMed
33. Seguin P, Laviolle B, Isslame S, Coué A, Mallédant Y. Effectiveness of simple daily sensitization of physicians to the duration of central venous and urinary tract catheterization. Intensive Care Med. 2010;36(7):1202-1206. PubMed
34. Titsworth WL, Hester J, Correia T, et al. Reduction of catheter-associated urinary tract infections among patients in a neurological intensive care unit: a single institution’s success. J Neurosurg. 2012;116(4):911-920. PubMed
35. Bouza E, Muñoz P, López-Rodríguez J, et al. A needleless closed system device (CLAVE) protects from intravascular catheter tip and hub colonization: a prospective randomized study. J Hosp Infect. 2003;54(4):279-287. PubMed
36. Meddings J, Saint S. Disrupting the life cycle of the urinary catheter. Clin Infect Dis. 2011;52(11):1291-1293. PubMed
37. O’Grady NP, Alexander M, Burns L, et al. Guidelines for the Prevention of Intravascular Catheter-Related Infections 2011. Healthcare Infection Control Practices Advisory Committee (HICPAC). Centers for Disease Control and Prevention website. https://www.cdc.gov/infectioncontrol/guidelines/BSI/index.html. 2011. Accessed May 26, 2017.
38. Allen GB, Miller V, Nicholas C, et al. A multitiered strategy of simulation training, kit consolidation, and electronic documentation is associated with a reduction in central line-associated bloodstream infections. Am J Infect Control. 2014;42(6):643-648. PubMed
39. Arora N, Patel K, Engell CA, LaRosa JA. The effect of interdisciplinary team rounds on urinary catheter and central venous catheter days and rates of infection. Am J Med Qual. 2014;29(4):329-334. PubMed
40. Barsuk JH, Cohen ER, Feinglass J, McGaghie WC, Wayne DB. Use of simulation-based education to reduce catheter-related bloodstream infections. Arch Intern Med. 2009;169(15):1420-1423. PubMed
41. Barsuk JH, Cohen ER, Potts S, et al. Dissemination of a simulation-based mastery learning intervention reduces central line-associated bloodstream infections. BMJ Qual Saf. 2014;23(9):749-756. PubMed
42. Berenholtz SM, Pronovost PJ, Lipsett PA, et al. Eliminating catheter-related bloodstream infections in the intensive care unit. Crit Care Med. 2004;32(10):2014-2020. PubMed
43. Bonne S, Mazuski JE, Sona C, et al. Effectiveness of minocycline and rifampin vs chlorhexidine and silver sulfadiazine-impregnated central venous catheters in preventing central line-associated bloodstream infection in a high-volume academic intensive care unit: a before and after trial. J Am Coll Surg. 2015;221(3):739-747. PubMed
44. Borschel DM, Chenoweth CE, Kaufman SR, et al. Are antiseptic-coated central venous catheters effective in a real-world setting? Am J Infect Control. 2006;34(6):388-393. PubMed
45. Burden AR, Torjman MC, Dy GE, et al. Prevention of central venous catheter-related bloodstream infections: is it time to add simulation training to the prevention bundle? J Clin Anesth. 2012;24(7):555-560. PubMed
46. Cherry RA, West CE, Hamilton MC, Rafferty CM, Hollenbeak CS, Caputo GM. Reduction of central venous catheter associated blood stream infections following implementation of a resident oversight and credentialing policy. Patient Saf Surg. 2011;5(1):15. PubMed
47. Chua C, Wisniewski T, Ramos A, Schlepp M, Fildes JJ, Kuhls DA. Multidisciplinary trauma intensive care unit checklist: impact on infection rates. J Trauma Nurs. 2010;17(3):163-166. PubMed
48. Collin GR. Decreasing catheter colonization through the use of an antiseptic-impregnated catheter: a continuous quality improvement project. Chest. 1999;115(6):1632-1640. PubMed
49. Coopersmith CM, Rebmann TL, Zack JE, et al. Effect of an education program on decreasing catheter-related bloodstream infections in the surgical intensive care unit. Crit Care Med. 2002;30(1):59-64. PubMed
50. Coopersmith CM, Zack JE, Ward MR, et al. The impact of bedside behavior on catheter-related bacteremia in the intensive care unit. Arch Surg. 2004;139(2):131-136. PubMed
51. Dixon JM, Carver RL. Daily chlorohexidine gluconate bathing with impregnated cloths results in statistically significant reduction in central line-associated bloodstream infections. Am J Infect Control. 2010;38(10):817-821. PubMed
52. Exline MC, Ali NA, Zikri N, et al. Beyond the bundle--journey of a tertiary care medical intensive care unit to zero central line-associated bloodstream infections. Crit Care. 2013;17(2):R41. PubMed
53. Fox C, Wavra T, Drake DA, et al. Use of a patient hand hygiene protocol to reduce hospital-acquired infections and improve nurses’ hand washing. Am J Crit Care. 2015;24(3):216-224. PubMed
54. Frankel HL, Crede WB, Topal JE, Roumanis SA, Devlin MW, Foley AB. Use of corporate Six Sigma performance-improvement strategies to reduce incidence of catheter-related bloodstream infections in a surgical ICU. J Am Coll Surg. 2005;201(3):349-358. PubMed
55. Galpern D, Guerrero A, Tu A, Fahoum B, Wise L. Effectiveness of a central line bundle campaign on line-associated infections in the intensive care unit. Surgery. 2008;144(4):492-495. PubMed
56. Gozu A, Clay C, Younus F. Hospital-wide reduction in central line-associated bloodstream infections: a tale of two small community hospitals. Infect Control Hosp Epidemiol. 2011;32(6):619-622. PubMed
57. Hanna HA, Raad II, Hackett B, et al. Antibiotic-impregnated catheters associated with significant decrease in nosocomial and multidrug-resistant bacteremias in critically ill patients. Chest. 2003;124(3):1030-1038. PubMed
58. Hatler CW, Mast D, Corderella J, et al. Using evidence and process improvement strategies to enhance healthcare outcomes for the critically ill: a pilot project. Am J Crit Care. 2006;15(6):549-555. PubMed
59. Kamboj M, Blair R, Bell N, et al. Use of disinfection cap to reduce central-line-associated bloodstream infection and blood culture contamination among hematology-oncology patients. Infect Control Hosp Epidemiol. 2015;36:1401-1408. PubMed
60. Khouli H, Jahnes K, Shapiro J, et al. Performance of medical residents in sterile techniques during central vein catheterization: randomized trial of efficacy of simulation-based training. Chest. 2011;139(1):80-87. PubMed
61. Koll BS, Straub TA, Jalon HS, Block R, Heller KS, Ruiz RE. The CLABs collaborative: a regionwide effort to improve the quality of care in hospitals. Jt Comm J Qual Patient Saf. 2008;34(12):713-723. PubMed
62. Lopez AC. A quality improvement program combining maximal barrier precaution compliance monitoring and daily chlorhexidine gluconate baths resulting in decreased central line bloodstream infections. Dimens Crit Care Nurs. 2011;30(5):293-298. PubMed
63. Maki DG, Stolz SM, Wheeler S, Mermel LA. Prevention of central venous catheter-related bloodstream infection by use of an antiseptic-impregnated catheter. A randomized, controlled trial. Ann Intern Med. 1997;127(4):257-266. PubMed
64. Marsteller JA, Sexton JB, Hsu YJ, et al. A multicenter, phased, cluster-randomized controlled trial to reduce central line-associated bloodstream infections in intensive care units. Crit Care Med. 2012;40(11):2933-2939. PubMed
65. McMullan C, Propper G, Schuhmacher C, et al. A multidisciplinary approach to reduce central line-associated bloodstream infections. Jt Comm J Qual Patient Saf. 2013;39(2):61-69. PubMed
66. Miller RS, Norris PR, Jenkins JM, et al. Systems initiatives reduce healthcare-associated infections: a study of 22,928 device days in a single trauma unit. J Trauma. 2010;68(1):23-31. PubMed
67. Montecalvo MA, McKenna D, Yarrish R, et al. Chlorhexidine bathing to reduce central venous catheter-associated bloodstream infection: impact and sustainability. Am J Med. 2012;125(5):505-511. PubMed
68. Noto MJ, Domenico HJ, Byrne DW, et al. Chlorhexidine bathing and health care-associated infections: a randomized clinical trial. JAMA. 2015;313(4):369-378. PubMed
69. Popovich KJ, Hota B, Hayes R, Weinstein RA, Hayden MK. Effectiveness of routine patient cleansing with chlorhexidine gluconate for infection prevention in the medical intensive care unit. Infect Control Hosp Epidemiol. 2009;30(10):959-963. PubMed
70. Popovich KJ, Hota B, Hayes R, Weinstein RA, Hayden MK. Daily skin cleansing with chlorhexidine did not reduce the rate of central-line associated bloodstream infection in a surgical intensive care unit. Intensive Care Med. 2010;36(5):854-858. PubMed
71. Pronovost PJ, Watson SR, Goeschel CA, Hyzy RC, Berenholtz SM. Sustaining reductions in central line-associated bloodstream infections in Michigan intensive care units: A 10-year analysis. Am J Med Qual. 2016;31(3):197-202. PubMed
72. Rangachari P, Madaio M, Rethemeyer RK, et al. Cumulative impact of periodic top-down communications on infection prevention practices and outcomes in two units. Health Care Manage Rev. 2015;40(4):324-336. PubMed
73. Render ML, Hasselbeck R, Freyberg RW, et al. Reduction of central line infections in Veterans Administration intensive care units: an observational cohort using a central infrastructure to support learning and improvement. BMJ Qual Saf. 2011;20(8):725-732. PubMed
74. Rupp ME, Lisco SJ, Lipsett PA, et al. Effect of a second-generation venous catheter impregnated with chlorhexidine and silver sulfadiazine on central catheter-related infections: a randomized, controlled trial. Ann Intern Med. 2005;143(8):570-580. PubMed
75. Sacks GD, Diggs BS, Hadjizacharia P, Green D, Salim A, Malinoski DJ. Reducing the rate of catheter-associated bloodstream infections in a surgical intensive care unit using the Institute for Healthcare Improvement Central Line Bundle. Am J Surg. 2014;207(6):817-823. PubMed
76. Salemi C, Canola MT, Eck EK. Hand washing and physicians: how to get them together. Infect Control Hosp Epidemiol. 2002;23(1):32-35. PubMed
77. Shannon RP, Frndak D, Grunden N, et al. Using real-time problem solving to eliminate central line infections. Jt Comm J Qual Patient Saf. 2006;32(9):479-487. PubMed
78. Sopirala MM, Smyer J, Fawley L, et al. Sustained reduction of central line-associated bloodstream infections in an intensive care unit using a top-down and bottom-up approach. Am J Infect Control. 2013;41(2):183-184. PubMed
79. Speroff T, Ely EW, Greevy R, et al. Quality improvement projects targeting health care-associated infections: comparing Virtual Collaborative and Toolkit approaches. J Hosp Med. 2011;6(5):271-278. PubMed
80. Thom KA, Li S, Custer M, et al. Successful implementation of a unit-based quality nurse to reduce central line-associated bloodstream infections. Am J Infect Control. 2014;42(2):139-143. PubMed
81. Venkatram S, Rachmale S, Kanna B. Study of device use adjusted rates in health care-associated infections after implementation of “bundles” in a closed-model medical intensive care unit. J Crit Care. 2010;25(1):174.e11-174.e18. PubMed
82. Wall RJ, Ely EW, Elasy TA, et al. Using real time process measurements to reduce catheter related bloodstream infections in the intensive care unit. Qual Saf Health Care. 2005;14(4):295-302. PubMed
83. Walz JM, Ellison RT 3rd, Mack DA, et al. The bundle “plus”: the effect of a multidisciplinary team approach to eradicate central line-associated bloodstream infections. Anesth Analg. 2015;120(4):868-876. PubMed
84. Warren DK, Cosgrove SE, Diekema DJ, et al. A multicenter intervention to prevent catheter-associated bloodstream infections. Infect Control Hosp Epidemiol. 2006;27(7):662-669. PubMed
85. Warren DK, Zack JE, Mayfield JL, et al. The effect of an education program on the incidence of central venous catheter-associated bloodstream infection in a medical ICU. Chest. 2004;126(5):1612-1618. PubMed
86. Watson SR, George C, Martin M, Bogan B, Goeschel C, Pronovost PJ. Preventing central line-associated bloodstream infections and improving safety culture: a statewide experience. Jt Comm J Qual Patient Saf. 2009;35(12):593-597. PubMed
87. Mueller JT, Wright AJ, Fedraw LA, et al. Standardizing central line safety: lessons learned for physician leaders. Am J Med Qual. 2014;29(3):191-199. PubMed
88. Vigorito MC, McNicoll L, Adams L, Sexton B. Improving safety culture results in Rhode Island ICUs: lessons learned from the development of action-oriented plans. Jt Comm J Qual Patient Saf. 2011;37(11):509-514. PubMed
89. Zack J. Zeroing in on zero tolerance for central line-associated bacteremia. Am J Infect Control. 2008;36(10):S176.e1-S176.e2. PubMed
90. Brun-Buisson C, Doyon F, Sollet JP, Cochard JF, Cohen Y, Nitenberg G. Prevention of intravascular catheter-related infection with newer chlorhexidine-silver sulfadiazine-coated catheters: a randomized controlled trial. Intensive Care Med. 2004;30(5):837-843. PubMed
91. Carrasco MN, Bueno A, de las Cuevas C, et al. Evaluation of a triple-lumen central venous heparin-coated catheter versus a catheter coated with chlorhexidine and silver sulfadiazine in critically ill patients. Intensive Care Med. 2004;30(4):633-638 PubMed
92. Corral L, Nolla-Salas M, Ibañez-Nolla J, et al. A prospective, randomized study in critically ill patients using the Oligon Vantex catheter. J Hosp Infect. 2003;55(3):212-219. PubMed
93. Hagau N, Studnicska D, Gavrus RL, Csipak G, Hagau R, Slavcovici AV. Central venous catheter colonization and catheter-related bloodstream infections in critically ill patients: a comparison between standard and silver-integrated catheters. Eur J Anaesthesiol. 2009;26(9):752-758. PubMed
94. Kalfon P, de Vaumas C, Samba D, et al. Comparison of silver-impregnated with standard multi-lumen central venous catheters in critically ill patients. Crit Care Med. 2007;35(4):1032-1039. PubMed
95. Kurtz P, Rosa P, Penna G, et al. Antibiotic coated catheter to decrease infection: pilot study. Rev Bras Ter Intensiva. 2008;20(2):160-164. PubMed
96. Osma S, Kahveci SF, Kaya FN, et al. Efficacy of antiseptic-impregnated catheters on catheter colonization and catheter-related bloodstream infections in patients in an intensive care unit. J Hosp Infect. 2006;62(2):156-162. PubMed
97. León C, Alvarez-Lerma F, Ruiz-Santana S, et al. Antiseptic chamber-containing hub reduces central venous catheter-related infection: a prospective, randomized study. Crit Care Med. 2003;31(5):1318-1324. PubMed
98. León C, Ruiz-Santana S, Rello J, et al. Benefits of minocycline and rifampin-impregnated central venous catheters. A prospective, randomized, double-blind, controlled, multicenter trial. Intensive Care Med. 2004;30(10):1891-1899. PubMed
99. Bion J, Richardson A, Hibbert P, et al. ‘Matching Michigan’: a 2-year stepped interventional programme to minimise central venous catheter-blood stream infections in intensive care units in England. BMJ Qual Saf. 2013;22(2):110-123. PubMed
100. Cherifi S, Gerard M, Arias S, Byl B. A multicenter quasi-experimental study: impact of a central line infection control program using auditing and performance feedback in five Belgian intensive care units. Antimicrob Resist Infect Control. 2013;2(1):33. PubMed
101. Entesari-Tatafi D, Orford N, Bailey MJ, Chonghaile MN, Lamb-Jenkins J, Athan E. Effectiveness of a care bundle to reduce central line-associated bloodstream infections. Med J Aust. 2015;202(5):247-250. PubMed
102. Hakko E, Guvenc S, Karaman I, Cakmak A, Erdem T, Cakmakci M. Long-term sustainability of zero central-line associated bloodstream infections is possible with high compliance with care bundle elements. East Mediterr Health J. 2015;21(4):293-298. PubMed
103. Hansen S, Schwab F, Schneider S, Sohr D, Gastmeier P, Geffers C. Time-series analysis to observe the impact of a centrally organized educational intervention on the prevention of central-line-associated bloodstream infections in 32 German intensive care units. J Hosp Infect. 2014;87(4):220-226. PubMed
104. Hermon A, Pain T, Beckett P, et al. Improving compliance with central venous catheter care bundles using electronic records. Nurs Crit Care. 2015;20(4):196-203. PubMed
105. Jaggi N, Rodrigues C, Rosenthal VD, et al. Impact of an international nosocomial infection control consortium multidimensional approach on central line-associated bloodstream infection rates in adult intensive care units in eight cities in India. Int J Infect Dis. 2013;17(12):e1218-e1224. PubMed
106. Khalid I, Al Salmi H, Qushmaq I, Al Hroub M, Kadri M, Qabajah MR. Itemizing the bundle: achieving and maintaining “zero” central line-associated bloodstream infection for over a year in a tertiary care hospital in Saudi Arabia. Am J Infect Control. 2013;41(12):1209-1213. PubMed
107. Jeong IS, Park SM, Lee JM, Song JY, Lee SJ. Effect of central line bundle on central line-associated bloodstream infections in intensive care units. Am J Infect Control. 2013;41(8):710-716. PubMed
108. Klintworth G, Stafford J, O’Connor M, et al. Beyond the intensive care unit bundle: Implementation of a successful hospital-wide initiative to reduce central line-associated bloodstream infections. Am J Infect Control. 2014;42(6):685-687. PubMed
109. Leblebicioglu H, Ersoz G, Rosenthal VD, et al. Impact of a multidimensional infection control approach on catheter-associated urinary tract infection rates in adult intensive care units in 10 cities of Turkey: International Nosocomial Infection Control Consortium findings (INICC). Am J Infect Control. 2013;41(10):885-891. PubMed
110. Latif A, Kelly B, Edrees H, et al. Implementing a multifaceted intervention to decrease central line-associated bloodstream infections in SEHA (Abu Dhabi Health Services Company) intensive care units: the Abu Dhabi experience. Infect Control Hosp Epidemiol. 2015;36(7):816-822. PubMed
111. Longmate AG, Ellis KS, Boyle L, et al. Elimination of central-venous-catheter-related bloodstream infections from the intensive care unit. BMJ Qual Saf. 2011;20(2):174-180. PubMed
112. Lobo RD, Levin AS, Oliveira MS, et al. Evaluation of interventions to reduce catheter-associated bloodstream infection: continuous tailored education versus one basic lecture. Am J Infect Control. 2010;38(6):440-448. PubMed
113. Lorente L, Lecuona M, Jiménez A, et al. Chlorhexidine-silver sulfadiazine-impregnated venous catheters save costs. Am J Infect Control. 2014;42(3):321-324. PubMed
114. Marra AR, Cal RG, Durão MS, et al. Impact of a program to prevent central line-associated bloodstream infection in the zero tolerance era. Am J Infect Control. 2010;38(6):434-439. PubMed
115. Martínez-Reséndez MF, Garza-González E, Mendoza-Olazaran S, et al. Impact of daily chlorhexidine baths and hand hygiene compliance on nosocomial infection rates in critically ill patients. Am J Infect Control. 2014;42(7):713-717. PubMed
116. Mathur P, Tak V, Gunjiyal J, et al. Device-associated infections at a level-1 trauma centre of a developing nation: impact of automated surveillance, training and feedbacks. Indian J Med Microbiol. 2015;33(1):51-62. PubMed
117. Mazi W, Begum Z, Abdulla D, et al. Central line-associated bloodstream infection in a trauma intensive care unit: impact of implementation of Society for Healthcare Epidemiology of America/Infectious Diseases Society of America practice guidelines. Am J Infect Control. 2014;42(8):865-867. PubMed
118. Menegueti MG, Ardison KM, Bellissimo-Rodrigues F, et al. The impact of implementation of bundle to reduce catheter-related bloodstream infection rates. J Clin Med Res. 2015;7(11):857-861. PubMed
119. Paula AP, Oliveira PR, Miranda EP, et al. The long-term impact of a program to prevent central line-associated bloodstream infections in a surgical intensive care unit. Clinics (Sao Paulo). 2012;67(8):969-970. PubMed
120. Reddy KK, Samuel A, Smiley KA, Weber S, Hon H. Reducing central line-associated bloodstream infections in three ICUs at a tertiary care hospital in the United Arab Emirates. Jt Comm J Qual Patient Saf. 2014;40(12):559-561. PubMed
121. Palomar M, Álvarez-Lerma F, Riera A, et al. Impact of a national multimodal intervention to prevent catheter-related bloodstream infection in the ICU: the Spanish experience. Crit Care Med. 2013;41(10):2364-2372. PubMed
122. Peredo R, Sabatier C, Villagrá A, et al. Reduction in catheter-related bloodstream infections in critically ill patients through a multiple system intervention. Eur J Clin Microbiol Infect Dis. 2010;29(9):1173-1177. PubMed
123. Pérez Parra A, Cruz Menárguez M, Pérez Granda MJ, Tomey MJ, Padilla B, Bouza E. A simple educational intervention to decrease incidence of central line-associated bloodstream infection (CLABSI) in intensive care units with low baseline incidence of CLABSI. Infect Control Hosp Epidemiol. 2010;31(9):964-967. PubMed
124. Rosenthal VD, Guzman S, Pezzotto SM, Crnich CJ. Effect of an infection control program using education and performance feedback on rates of intravascular device-associated bloodstream infections in intensive care units in Argentina. Am J Infect Control. 2003;31(7):405-409. PubMed
125. Rosenthal VD, Maki DG, Rodrigues C, et al. Impact of International Nosocomial Infection Control Consortium (INICC) strategy on central line-associated bloodstream infection rates in the intensive care units of 15 developing countries. Infect Control Hosp Epidemiol. 2010;31(12):1264-1272. PubMed
126. Salama MF, Jamal W, Mousa HA, Rotimi V. Implementation of central venous catheter bundle in an intensive care unit in Kuwait: Effect on central line-associated bloodstream infections. J Infect Public Health. 2016;9(1):34-41. PubMed
127. Santana SL, Furtado GH, Wey SB, Medeiros EA. Impact of an education program on the incidence of central line-associated bloodstream infection in 2 medical-surgical intensive care units in Brazil. Infect Control Hosp Epidemiol. 2008;29(12):1171-1173. PubMed
128. Scheithauer S, Lewalter K, Schröder J, et al. Reduction of central venous line-associated bloodstream infection rates by using a chlorhexidine-containing dressing. Infection. 2014;42(1):155-159. PubMed
129. Singh S, Kumar RK, Sundaram KR, et al. Improving outcomes and reducing costs by modular training in infection control in a resource-limited setting. Int J Qual Health Care. 2012;24(6):641-648. PubMed
130. Zingg W, Cartier V, Inan C, et al. Hospital-wide multidisciplinary, multimodal intervention programme to reduce central venous catheter-associated bloodstream infection. PLoS One. 2014;9(4):e93898. PubMed
131. Zingg W, Imhof A, Maggiorini M, Stocker R, Keller E, Ruef C. Impact of a prevention strategy targeting hand hygiene and catheter care on the incidence of catheter-related bloodstream infections. Crit Care Med. 2009;37(7):2167-2173. PubMed
132. Blot K, Bergs J, Vogelaers D, Blot S, Vandijck D. Prevention of central line-associated bloodstream infections through quality improvement interventions: a systematic review and meta-analysis. Clin Infect Dis. 2014;59(1):96-105. PubMed
133. Alexaitis I, Broome B. Implementation of a nurse-driven protocol to prevent catheter-associated urinary tract infections. J Nurs Care Qual. 2014;29(3):245-252. PubMed
134. Elpern EH, Killeen K, Ketchem A, Wiley A, Patel G, Lateef O. Reducing use of indwelling urinary catheters and associated urinary tract infections. Am J Crit Care. 2009;18(6):535-541. PubMed
135. Fuchs MA, Sexton DJ, Thornlow DK, Champagne MT. Evaluation of an evidence-based, nurse-driven checklist to prevent hospital-acquired catheter-associated urinary tract infections in intensive care units. J Nurs Care Qual. 2011;26(2):101-109. PubMed
136. Jain M, Miller L, Belt D, King D, Berwick DM. Decline in ICU adverse events, nosocomial infections and cost through a quality improvement initiative focusing on teamwork and culture change. Qual Saf Health Care. 2006;15(4):235-239. PubMed
137. Popp JA, Layon AJ, Nappo R, Richards WT, Mozingo DW. Hospital-acquired infections and thermally injured patients: chlorhexidine gluconate baths work. Am J Infect Control. 2014;42(2):129-132. PubMed
138. Reilly L, Sullivan P, Ninni S, Fochesto D, Williams K, Fetherman B. Reducing foley catheter device days in an intensive care unit: using the evidence to change practice. AACN Adv Crit Care. 2006;17(3):272-283. PubMed
139. Saint S, Fowler KE, Sermak K, et al. Introducing the No Preventable Harms campaign: creating the safest health care system in the world, starting with catheter-associated urinary tract infection prevention. Am J Infect Control. 2015;43(3):254-259. PubMed
140. Schelling K, Palamone J, Thomas K, et al. Reducing catheter-associated urinary tract infections in a neuro-spine intensive care unit. Am J Infect Control. 2015;43(8):892-894. PubMed
141. Sutherland T, Beloff J, McGrath C, et al. A single-center multidisciplinary initiative to reduce catheter-associated urinary tract infection rates: Quality and financial implications. Health Care Manag (Frederick). 2015;34(3):218-224. PubMed
142. Chen YY, Chi MM, Chen YC, Chan YJ, Chou SS, Wang FD. Using a criteria-based reminder to reduce use of indwelling urinary catheters and decrease urinary tract infections. Am J Crit Care. 2013;22(2):105-114. PubMed
143. Amine AE, Helal MO, Bakr WM. Evaluation of an intervention program to prevent hospital-acquired catheter-associated urinary tract infections in an ICU in a rural Egypt hospital. GMS Hyg Infect Control. 2014;9(2):Doc15. PubMed
144. Kanj SS, Zahreddine N, Rosenthal VD, Alamuddin L, Kanafani Z, Molaeb B. Impact of a multidimensional infection control approach on catheter-associated urinary tract infection rates in an adult intensive care unit in Lebanon: International Nosocomial Infection Control Consortium (INICC) findings. Int J Infect Dis. 2013;17(9):e686-e690. PubMed
145. Navoa-Ng JA, Berba R, Rosenthal VD, et al. Impact of an International Nosocomial Infection Control Consortium multidimensional approach on catheter-associated urinary tract infections in adult intensive care units in the Philippines: International Nosocomial Infection Control Consortium (INICC) findings. J Infect Public Health. 2013;6(5):389-399. PubMed
146. Rosenthal VD, Todi SK, Álvarez-Moreno C, et al. Impact of a multidimensional infection control strategy on catheter-associated urinary tract infection rates in the adult intensive care units of 15 developing countries: findings of the International Nosocomial Infection Control Consortium (INICC). Infection. 2012;40(5):517-526. PubMed
147. Salama MF, Jamal WY, Mousa HA, Al-Abdulghani KA, Rotimi VO. The effect of hand hygiene compliance on hospital-acquired infections in an ICU setting in a Kuwaiti teaching hospital. J Infect Public Health. 2013;6(1):27-34. PubMed
148. Seyman D, Oztoprak N, Berk H, Kizilates F, Emek M. Weekly chlorhexidine douche: does it reduce healthcare-associated bloodstream infections? Scand J Infect Dis. 2014;46(10):697-703. PubMed
149. Apisarnthanarak A, Thongphubeth K, Sirinvaravong S, et al. Effectiveness of multifaceted hospitalwide quality improvement programs featuring an intervention to remove unnecessary urinary catheters at a tertiary care center in Thailand. Infect Control Hosp Epidemiol. 2007;28(7):791-798. PubMed
150. Marra AR, Sampaio Camargo TZ, Gonçalves P, et al. Preventing catheter-associated urinary tract infection in the zero-tolerance era. Am J Infect Control. 2011;39(10):817-822. PubMed
151. Meddings J, Rogers MA, Krein SL, Fakih MG, Olmsted RN, Saint S. Reducing unnecessary urinary catheter use and other strategies to prevent catheter-associated urinary tract infection: an integrative review. BMJ Qual Saf. 2014;23(4):277-289. PubMed
152. Chopra V, Flanders SA, Saint S, et al. The Michigan Appropriateness Guide for Intravenous Catheters (MAGIC): results from a multispecialty panel using the RAND/UCLA appropriateness method. Ann Intern Med. 2015;163(6 Suppl):S1-S40. PubMed
153. Meddings J, Saint S, Fowler KE, et al. The Ann Arbor Criteria for appropriate urinary catheter use in hospitalized medical patients: results obtained by using the RAND/UCLA appropriateness method. Ann Intern Med. 2015;162(9 Suppl):S1-S34. PubMed
154. Furuya EY, Dick AW, Herzig CT, Pogorzelska-Maziarz M, Larson EL, Stone PW. Central Line-Associated Bloodstream Infection Reduction and Bundle Compliance in Intensive Care Units: A National Study. Infect Control Hosp Epidemiol. 2016;37(7):805-810. PubMed
Central line–associated bloodstream infection (CLABSI) and catheter-associated urinary tract infection (CAUTI) are morbid and expensive healthcare-associated infections (HAIs).1-8 While these HAIs are prevalent in intensive care units (ICUs) and general wards, most of the research, prevention efforts, and financial penalties have been focused in the ICU.9,10 For hospitalists, who are taking a larger role in caring for the critically ill,11,12 it is optimal to understand best preventive practices.
There has been a national puTash to standardize procedures and products to prevent CLABSI and CAUTI.2,13-16 CLABSI has transitioned from a common ICU complication to a “never event.” Success has been reflected in the prevention of 25,000 CLABSIs over the last decade, translating to a 58% reduction in infections, with 6000 deaths prevented and $414 million saved.2 CLABSI prevention principles have been applied to CAUTI prevention (ie, aseptic insertion, maintenance care, prompting removal) but with slower adoption17 and fewer dramatic CAUTI reductions,18 due in part to weaker recognition19 of CAUTI as a serious clinical event, despite its morbidity20 and cost.21
Despite recent improvements in preventing HAIs, there is a marked variability in how hospitals perform in preventing these infections.22 To inform infection prevention strategies for a large-scale implementation project funded by the Agency for Healthcare Research and Quality and focused on ICUs with persistently elevated CLABSI and/or CAUTI rates,23 we performed a systematic search of interventions to prevent CLABSI and CAUTI in the ICU setting. This evidence was synthesized to help units select and prioritize interventions to prevent these HAIs.
METHODS
Literature Search Strategy
We performed a systematic search to identify CLABSI and CAUTI prevention studies and synthesized findings using a narrative review process. Using criteria developed and refined from seminal articles on the topic,10,14,24-34 we searched the PubMed and Cochrane databases from their inception to October of 2015 using Medical Subject Headings (MeSHs) for “central venous catheters,” “CLABSI,” “central line associated bloodstream infection,” “catheter related bloodstream infection,” “intravascular devices,” “urinary catheterization,” “urinary catheters,” “urinary tract infections,” “CAUTI,” and “catheter associated urinary tract infections” and filtered for articles containing the MeSHs “intensive care unit” and “ICU.” Supplemental Figure 1 details the search, yielding 102 studies for CLABSI and 28 studies for CAUTI, including 7 studies with CLABSI and CAUTI interventions.
Eligibility Criteria Review
Study Design
We included randomized and nonrandomized studies that implemented at least 1 intervention to prevent CLABSI or CAUTI in an adult ICU setting and reported the preintervention or control group data to compare with the postintervention data. We excluded general ward, outpatient/ambulatory, and neonatal/pediatric settings. Interventions to prevent CLABSI or CAUTI were included. We excluded interventions focused on diagnosis or treatment or those that lacked adequate description of the intervention for replication. Studies with interventions that are no longer standard of care in the United States (US) were excluded, as were studies not available in English.
Outcomes
Primary Outcomes for Central Vascular Catheter Infection
- CLABSI: A lab-confirmed bloodstream infection in a patient who has had a central line for at least 48 hours on the date of the development of the bloodstream infection and without another known source of infection. We included studies that reported CLABSIs per 1000 central line days or those that provided data to permit calculation of this ratio. This measure is similar to current National Healthcare Safety Network (NHSN) surveillance definitions.22
- Catheter-related bloodstream infection (CRBSI): A lab-confirmed bloodstream infection attributed to an intravascular catheter by a quantitative culture of the catheter tip or by differences in growth between catheter and peripheral venipuncture blood culture specimens.35 This microbiologic definition of a central line bloodstream infection was often used prior to NHSN reporting, with rates provided as the number of CRBSIs per 1000 central line days.
Primary Outcome for Urinary Catheter Infection
- CAUTI: Urinary tract infection occurring in patients during or after the recent use of an indwelling urinary catheter. We included studies that reported CAUTIs per 1000 urinary catheter days or those that provided data to permit calculation of this ratio (similar to the current NHSN surveillance definitions).22 We excluded studies where CAUTI was defined as bacteriuria alone, without symptoms.
Secondary Outcomes
- Central line utilization ratio: The device utilization ratio (DUR) measure of central line use is calculated as central line days divided by patient days.
- Urinary catheter utilization ratio: The DUR measure of urinary catheter use is calculated as indwelling urinary catheter days divided by patient days, as used in NHSN surveillance, excluding other catheter types.22 We excluded other measures of urinary catheter use because of a large variation in definitions, which limits the ability to compare measures across studies.
Data Synthesis and Analysis
Information on the ICU and intervention type, intervention components, outcomes, and whether interventions were in use prior to the study was abstracted by CAUTI and CLABSI experts (JM and PKP) and confirmed by a second author.
We compared interventions found in the literature to components of the previously published urinary catheter “life cycle,” a conceptual model used to organize and prioritize interventions for a reduction in CAUTI (Figure 1).36
RESULTS
Conceptual Model for Disrupting the Life Cycle of a Catheter
Our data analysis demonstrated that components of the urinary catheter life cycle (Figure 1) were useful and could be applied to vascular catheters, but changes were needed to make the model more valuable to hospitalists implementing CLABSI and CAUTI prevention interventions. We found that the previously named stage 1 (catheter placement) is better described in 2 stages: stage 0, avoid catheter if possible, and stage 1, ensure aseptic placement. Additionally, we tailored the model to include actionable language, describing ways to disrupt the life cycle. Finally, we added a component to represent interventions to improve implementation and sustainability, such as auditing compliance and timely feedback to clinicians. Thus, we introduce a new conceptual model, “Disrupting the Life Cycle of a Catheter” (Figure 2)
Central Vascular Catheter Interventional Study Results
Characteristics of Included Central Vascular Catheter Infection Studies
Of the 102 central vascular catheter (CVC) studies that met the inclusion criteria (reporting outcomes for 105 intervention cohorts), 59 studies10,14,16,24-27,38-89 reporting outcomes for 61 intervention cohorts were performed in the US. Study designs included 14 randomized controlled trials (RCTs)48,64,68,74,79,90-98 and 88 before–after studies (Appendix Table 1). 10,14,16,24-27,33,38-47,49-63,69-73,75-78,80-89,99-131 Many RCTs evaluated antimicrobial products (CVCs, hubs, bathing) as interventions,48,68,74,90-95,97,98 but a few RCTs studied interventions64,79,93 impacting catheter care or use (Appendix Table 1). Fifty-one studies took place in tertiary care hospitals and 55 in academic hospitals. Thirty-one studies were multicenter; the largest included 792 hospitals and 1071 ICUs.24 ICU bed size ranged from 5 to 59.
CVC Study Outcomes
Sixty-three studies reported CLABSI outcomes, and 39 reported CRBSI outcomes (Table 2). Many studies had preintervention or control rates above the 2013 NHSN 75th percentiles,22 which varied by ICU type. Preintervention or control infection rates per 1000 catheter days varied widely (means: CLABSI 7.5, CRBSI 6.3); US studies reported ranges of 1.1 to 12.1 CLABSI and 1.2 to 11.0 CRBSI per 1000 catheter days; non-US studies reported ranges of 1.4 to 45.9 CLABSI and 1.6 to 22.7 CRBSI per 1000 catheter days. Postintervention rates varied widely, with overall means of 2.8 CLABSI and 2.5 CRBSI per 1000 catheter days, including US study ranges of 0 to 8.9 CLABSI and 0 to 5.4 CRBSI, and non-US study ranges of 0 to 17.1 CLABSI and 0 to 15.9 CRBSI.
Central line DURs were reported in only 5 studies; 3 reported decreased postintervention DURs (2 with statistical significance), with a mean 11.7% reduction (Table 2).
CVC Interventions
CVC study interventions are summarized in Table 1, categorized by catheter life cycle component (Figure 2). Thirty-two included studies used a single intervention to prevent CVC infection. Interventions to avoid placement when possible were infrequent. Insertion-stage interventions were common and included avoiding the femoral site during placement, ensuring maximal sterile barriers, and chlorhexidine skin preparation. Standardizing basic products for central line insertion was often done by providing ICUs with a CLABSI insertion kit or stocked cart. In some studies, this was implemented prior to the intervention, and in others, the kit or cart itself was the intervention. Maintenance-stage interventions included scrubbing the hub prior to use, replacing wet or soiled dressings, accessing the catheter with sterile devices, and performing aseptic dressing changes. A recent systematic review and meta-analysis of CVC infection prevention studies indicated that implementing care bundles and/or checklists appears to yield stronger risk reductions than interventions without these components.132 The most common catheter removal interventions were daily audits of line removal and CLABSI rounds focused on ongoing catheter necessity.
Common implementation and sustainability interventions included outcome surveillance, such as feedback on CLABSI, and socio-adaptive interventions to prompt improvements in patient safety culture. Process and outcome surveillance as interventions were implemented in about one-quarter of the studies reviewed (AppendixTable 1).
CAUTI Interventional Study Results
Characteristics of Included CAUTI Studies
Of the 28 CAUTI studies that met the inclusion criteria (reporting outcomes for 30 intervention cohorts), 14 studies (reporting outcomes for 16 intervention cohorts) were performed in the US.28,34,53,66,68,133-141 Study designs included 2 RCTs (focused on urinary catheter avoidance or removal142 and chlorhexidine bathing68) and 26 nonrandomized, before–after studies28,30,33,34,53,66,109,114-116,133-141,143-149 (Appendix Table 1). The number of hospitals per study varied from 1 to 53, with the majority being single-hospital interventions.
CAUTI Study Outcomes
All 28 studies reported CAUTIs per 1000 catheter days for both intervention and comparison groups (Table 2). Preintervention or control CAUTI rates varied widely, with an overall mean of 12.5 CAUTIs per 1000 catheter days; US studies reported a range from 1.4 to 15.8 CAUTIs per 1000 catheter days; non-US studies reported a range from 0.8 to 90.1 CAUTIs per 1000 catheter days. Many studies had preintervention or control rates above the 2013 NHSN 75th percentiles.22 Postintervention CAUTI rates varied widely, with an overall mean of 7.0 CAUTIs per 1000 catheter days, including a US study range from 0 to 11.2 and a non-US study range from 1.9 to 65.7.
Overall (Table 2), 27 of the 30 intervention cohorts described in the 28 studies reported fewer CAUTIs, including all ICU types. Lower postintervention CAUTI rates were reported in 25 studies, with a mean 49.4% reduction, including 11 statistically significant reductions; many studies did not report the level of statistical significance or described inadequate power to detect a significant change (Table 2).
Urinary catheter utilization rates were reported for 11 studies (Table 2). A decreased urinary catheter utilization rate was reported in 7 studies (4 with statistically signficiant reductions), with a mean 16% reduction (Table 2). Other outcomes included cost savings, the potential for unintended negative outcomes, and clinician compliance with intervention components. Positive cost savings were reported in 5 studies.30,34,133,141,149
CAUTI Interventions
Of the 28 included CAUTI prevention studies, only 5 studied single interventions. Interventions were categorized in Table 1 by “life cycle” stages or as interventions to improve implementation and sustainability (Figure 2). Interventions to restrict indwelling urinary catheter use were common, including creating lists of approved indications selected by unit or hospital policy and requiring catheter orders with approved indications. Eight studies published approved indication lists.28,34,133-135,138,142,146 Although several studies describe the encouragement and use of bladder scanners and urinary catheter alternatives, none described purchasing these catheter alternatives.
Interventions to avoid indwelling urinary catheters included education about external catheters,28,34,109,133,140,144-146 urinary retention protocols,34,144,135,141 and bladder scanner simulation training.133 Interventions to improve aseptic insertion28,34,66,109,116,139-141-143-146,150 and maintenance care28,34,66,109,116,133,135,136,139-141,143-146,150 of urinary catheters were common. Four studies used a standardized urinary catheter kit or cart,28,34,139,142 and 2 studies used a commercial urinary catheter securement device.34,140 A CAUTI bundle checklist in daily patient care rounds was tested in 3 studies (Table 1).66,136,150 Reminder and stop order strategies, with the potential to reduce CAUTI rates by >50%,151 were included in 15 studies, with inteventions such as nurse-empowered stop orders. Several implementation and sustainability interventions were described, including socio-adaptive strategies such as holding multidisciplinary meetings to obtain unit or clinician feedback to inform design and improve buy-in and providing frequent feedback to ICU clinicians, including audits of catheter use appropriateness and catheter-associated infections.
DISCUSSION
This extensive literature review yielded a large body of literature demonstrating success in preventing CLABSI and CAUTI in all types of adult ICUs, including in general medical and surgical ICUs and in specialized units with historically higher rates, such as trauma, burn, and neurosurgical. Reported reductions in catheter infections were impressive (>65% for CLABSI or CRBSI and nearly 50% for CAUTI), though several studies had limited power to detect statistical significance. DURs were reported more rarely (particularly for vascular catheters) and often without power to detect statistical significance. Nevertheless, 7 studies reported reduced urinary catheter use (16% mean reduction), which would be anticipated to be clinically significant.
The conceptual model introduced for “Disrupting the Life Cycle of a Catheter” (Figure 2) can be a helpful tool for hospitalists and intensivists to assess and prioritize potential strategies for reducing catheter-associated infections. This study’s results indicate that CLABSI prevention studies often used interventions that optimize best practices during aseptic insertion and maintenance, but few studies emphasized reducing inappropriate central line use. Conversely, CAUTI prevention often targeted avoiding placement and prompting the removal of urinary catheters, with fewer studies evaluating innovative products or technical skill advancement for aseptic insertion or maintenance, though educational interventions to standardize aseptic catheter use were common. Recently, recommendations for reducing the inappropriate use of urinary catheters and intravenous catheters, including scenarios common in ICUs, were developed by using the rigorous RAND/UCLA Appropriateness Method152,153; these resources may be helpful to hospitalists designing and implementing interventions to reduce catheter use.
In reviewing the US studies of 5 units demonstrating the greatest success in preventing CLABSI56,62,65,78,83 and CAUTI,28,34,66,134 several shared features emerged. Interventions that addressed multiple steps within the life cycle of a catheter (avoidance, insertion, maintenance, and removal) were common. Previous work has shown that assuring compliance in infection prevention efforts is a key to success,154 and in both CLABSI and CAUTI studies, auditing was included in these successful interventions. Specifically for CLABSI, the checklist, a central quality improvement tool, was frequently associated with success. Unique to CAUTI, engaging a multidisciplinary team including nurse leadership seemed critical to optimize implementation and sustainability efforts. In addition, a focus on stage 3 (removal), including protocols to remove by default, was associated with success in CAUTI studies.
Our review was limited by a frequent lack of reporting of statistical significance or by inadequate power to detect a significant change and great variety. The ability to compare the impact of specific interventions is limited because studies varied greatly with respect to the type of intervention, duration of data collection, and outcomes assessed. We also anticipate that successful interventions are more likely to be published than are trials without success. Strengths include the use of a rigorous search process and the inclusion and review of several types of interventions implemented in ICUs.
In conclusion, despite high catheter use in ICUs, the literature includes many successful interventions for the prevention of vascular and urinary catheter infections in multiple ICU types. This review indicates that targeting multiple steps within the life cycle of a catheter, particularly when combined with interventions to optimize implementation and sustainability, can improve success in reducing CLABSI and CAUTI in the ICU.
Acknowledgments
The authors thank all members of the National Project Team for the AHRQ Safety Program for Intensive Care Units: Preventing CLABSI and CAUTI.
Disclosure
Agency for Healthcare Research and Quality (AHRQ) contract #HHSP233201500016I/HHSP23337002T provided funding for this study. J.M.’s other research is funded by AHRQ (2R01HS018334-04), the NIH-LRP program, the VA National Center for Patient Safety, VA Ann Arbor Patient Safety Center of Inquiry, the Health Research and Educational Trust, American Hospital Association and the Centers for Disease Control and Prevention. The findings and conclusions in this report are those of the authors and do not necessarily represent those of the sponsor, the Agency for Healthcare Research and Quality, or the US Department of Veterans Affairs. All authors report no conflicts of interest relevant to this article.
1. National and state healthcare-associated infections progress report. Centers for Disease Control and Prevention website. http://www.cdc.gov/hai/progress-report/. 2016. Accessed January 10, 2016.
2. Srinivasan A, Wise M, Bell M, et al. Vital signs: central line-associated blood stream infections-United States, 2001, 2008, and 2009. MMWR Morb Mortal Wkly Rep. 2011;60(8):243-248. PubMed
3. Abramczyk ML, Carvalho WB, Carvalho ES, Medeiros EA. Nosocomial infection in a pediatric intensive care unit in a developing country. Braz J Infect Dis. 2003;7(6):375-380. PubMed
4. Saint S. Clinical and economic consequences of nosocomial catheter-related bacteriuria. Am J Infect Control. 2000;28(1):68-75. PubMed
5. Ziegler MJ, Pellegrini DC, Safdar N. Attributable mortality of central line associated bloodstream infection: systematic review and meta-analysis. Infection. 2015;43(1):29-36. PubMed
6. Siempos, II, Kopterides P, Tsangaris I, Dimopoulou I, Armaganidis AE. Impact of catheter-related bloodstream infections on the mortality of critically ill patients: a meta-analysis. Crit Care Med. 2009;37(7):2283-2289. PubMed
7. Zingg W, Sax H, Inan C, et al. Hospital-wide surveillance of catheter-related bloodstream infection: from the expected to the unexpected. J Hosp Infect. 2009;73(1):41-46. PubMed
8. Chant C, Smith OM, Marshall JC, Friedrich JO. Relationship of catheter-associated urinary tract infection to mortality and length of stay in critically ill patients: a systematic review and meta-analysis of observational studies. Crit Care Med. 2011;39(5):1167-1173. PubMed
9. Lee GM, Kleinman K, Soumerai SB, et al. Effect of nonpayment for preventable infections in US hospitals. N Engl J Med. 2012;367(15):1428-1437.
10. Muto C, Herbert C, Harrison E, Edwards JR, et al. Reduction in central line-associated bloodstream infections among patients in intensive care units - Pennsylvania, April 2001-March 2005. MMWR Morb Mortal Wkly Rep. 2005;54(40):1013-1016. PubMed
11. Heisler M. Hospitalists and intensivists: partners in caring for the critically ill--the time has come. J Hosp Med. 2010;5(1):1-3. PubMed
12. Siegal EM, Dressler DD, Dichter JR, Gorman MJ, Lipsett PA. Training a hospitalist workforce to address the intensivist shortage in American hospitals: a position paper from the Society of Hospital Medicine and the Society of Critical Care Medicine. J Hosp Med. 2012;7(5):359-364. PubMed
13. Gould CV, Umscheid CA, Agarwal RK, Kuntz G, Pegues DA. Guideline for Prevention of Catheter-Associated Urinary Tract Infections 2009. Healthcare Infection Control Practices Advisory Committee (HICPAC). Centers for Disease Control and Prevention website. https://www.cdc.gov/infectioncontrol/guidelines/CAUTI/index.html. 2009. Accessed May 26, 2017.
14. Hong AL, Sawyer MD, Shore A, et al. Decreasing central‐line–associated bloodstream infections in Connecticut intensive care units. J Healthc Qual. 2013;35(5):78-87. PubMed
15. Weaver SJ, Weeks K, Pham JC, Pronovost PJ. On the CUSP: Stop BSI: evaluating the relationship between central line-associated bloodstream infection rate and patient safety climate profile. Am J Infect Control. 2014;42(10 Suppl):S203-S208. PubMed
16. Lin DM, Weeks K, Holzmueller CG, Pronovost PJ, Pham JC. Maintaining and sustaining the On the CUSP: stop BSI model in Hawaii. Jt Comm J Qual Patient Saf. 2013;39(2):51-60. PubMed
17. Krein SL, Fowler KE, Ratz D, Meddings J, Saint S. Preventing device-associated infections in US hospitals: national surveys from 2005 to 2013. BMJ Qual Saf. 2015;24(6):385-392. PubMed
18. Department of Health and Human Services Action Plan to Prevent Healthcare-Associated Infections. Current progress on meeting these targets reviewed in 2013. https://health.gov/hcq/prevent-hai.asp. Accessed October 28, 2016.
19. Krein SL, Kowalski CP, Harrod M, Forman J, Saint S. Barriers to reducing urinary catheter use: a qualitative assessment of a statewide initiative. JAMA Intern Med. 2013;173(10):881-886. PubMed
20. Nicolle LE. Catheter associated urinary tract infections. Antimicrob Resist Infect Control. 2014;3:23. PubMed
21. Kennedy EH, Greene MT, Saint S. Estimating hospital costs of catheter-associated urinary tract infection. J Hosp Med. 2013;8(9):519-522. PubMed
22. Dudeck MA, Edwards JR, Allen-Bridson K, et al. National Healthcare Safety Network Report, data summary for 2013, Device-associated Module. Am J Infect Control. 2015;43:206-221. PubMed
23. AHRQ Safety Program for Intensive Care Units: Preventing CLABSI and CAUTI. Agency for Healthcare Research and Quality website. http://www.ahrq.gov/professionals/quality-patient-safety/hais/tools/preventing/index.html. 2017. Accessed August 24, 2017.
24. Berenholtz SM, Lubomski LH, Weeks K, et al. Eliminating central line-associated bloodstream infections: a national patient safety imperative. Infect Control Hosp Epidemiol. 2014;35(1):56-62. PubMed
25. Lin DM, Weeks K, Bauer L, et al. Eradicating central line-associated bloodstream infections statewide: the Hawaii experience. Am J Med Qual. 2012;27(2):124-129. PubMed
26. Pronovost P, Needham D, Berenholtz S, et al. An intervention to decrease catheter-related bloodstream infections in the ICU. N Engl J Med. 2006;355(26):2725-2732. PubMed
27. DePalo VA, McNicoll L, Cornell M, Rocha JM, Adams L, Pronovost PJ. The Rhode Island ICU collaborative: a model for reducing central line-associated bloodstream infection and ventilator-associated pneumonia statewide. Qual Saf Health Care. 2010;19(6):555-561. PubMed
28. Dumigan DG, Kohan CA, Reed CR, Jekel JF, Fikrig MK. Utilizing national nosocomial infection surveillance system data to improve urinary tract infection rates in three intensive-care units. Clin Perform Qual Health Care. 1998;6(4):172-178. PubMed
29. Eggimann P, Harbarth S, Constantin MN, Touveneau S, Chevrolet JC, Pittet D. Impact of a prevention strategy targeted at vascular-access care on incidence of infections acquired in intensive care. Lancet. 2000;355(9218):1864-1868. PubMed
30. Huang WC, Wann SR, Lin SL, et al. Catheter-associated urinary tract infections in intensive care units can be reduced by prompting physicians to remove unnecessary catheters. Infect Control Hosp Epidemiol. 2004;25(11):974-978. PubMed
31. McLaws ML, Burrell AR. Zero risk for central line-associated bloodstream infection: are we there yet? Crit Care Med. 2012;40(2):388-393. PubMed
32. Miller SE, Maragakis LL. Central line-associated bloodstream infection prevention. Curr Opin Infect Dis. 2012;25(4):412-422. PubMed
33. Seguin P, Laviolle B, Isslame S, Coué A, Mallédant Y. Effectiveness of simple daily sensitization of physicians to the duration of central venous and urinary tract catheterization. Intensive Care Med. 2010;36(7):1202-1206. PubMed
34. Titsworth WL, Hester J, Correia T, et al. Reduction of catheter-associated urinary tract infections among patients in a neurological intensive care unit: a single institution’s success. J Neurosurg. 2012;116(4):911-920. PubMed
35. Bouza E, Muñoz P, López-Rodríguez J, et al. A needleless closed system device (CLAVE) protects from intravascular catheter tip and hub colonization: a prospective randomized study. J Hosp Infect. 2003;54(4):279-287. PubMed
36. Meddings J, Saint S. Disrupting the life cycle of the urinary catheter. Clin Infect Dis. 2011;52(11):1291-1293. PubMed
37. O’Grady NP, Alexander M, Burns L, et al. Guidelines for the Prevention of Intravascular Catheter-Related Infections 2011. Healthcare Infection Control Practices Advisory Committee (HICPAC). Centers for Disease Control and Prevention website. https://www.cdc.gov/infectioncontrol/guidelines/BSI/index.html. 2011. Accessed May 26, 2017.
38. Allen GB, Miller V, Nicholas C, et al. A multitiered strategy of simulation training, kit consolidation, and electronic documentation is associated with a reduction in central line-associated bloodstream infections. Am J Infect Control. 2014;42(6):643-648. PubMed
39. Arora N, Patel K, Engell CA, LaRosa JA. The effect of interdisciplinary team rounds on urinary catheter and central venous catheter days and rates of infection. Am J Med Qual. 2014;29(4):329-334. PubMed
40. Barsuk JH, Cohen ER, Feinglass J, McGaghie WC, Wayne DB. Use of simulation-based education to reduce catheter-related bloodstream infections. Arch Intern Med. 2009;169(15):1420-1423. PubMed
41. Barsuk JH, Cohen ER, Potts S, et al. Dissemination of a simulation-based mastery learning intervention reduces central line-associated bloodstream infections. BMJ Qual Saf. 2014;23(9):749-756. PubMed
42. Berenholtz SM, Pronovost PJ, Lipsett PA, et al. Eliminating catheter-related bloodstream infections in the intensive care unit. Crit Care Med. 2004;32(10):2014-2020. PubMed
43. Bonne S, Mazuski JE, Sona C, et al. Effectiveness of minocycline and rifampin vs chlorhexidine and silver sulfadiazine-impregnated central venous catheters in preventing central line-associated bloodstream infection in a high-volume academic intensive care unit: a before and after trial. J Am Coll Surg. 2015;221(3):739-747. PubMed
44. Borschel DM, Chenoweth CE, Kaufman SR, et al. Are antiseptic-coated central venous catheters effective in a real-world setting? Am J Infect Control. 2006;34(6):388-393. PubMed
45. Burden AR, Torjman MC, Dy GE, et al. Prevention of central venous catheter-related bloodstream infections: is it time to add simulation training to the prevention bundle? J Clin Anesth. 2012;24(7):555-560. PubMed
46. Cherry RA, West CE, Hamilton MC, Rafferty CM, Hollenbeak CS, Caputo GM. Reduction of central venous catheter associated blood stream infections following implementation of a resident oversight and credentialing policy. Patient Saf Surg. 2011;5(1):15. PubMed
47. Chua C, Wisniewski T, Ramos A, Schlepp M, Fildes JJ, Kuhls DA. Multidisciplinary trauma intensive care unit checklist: impact on infection rates. J Trauma Nurs. 2010;17(3):163-166. PubMed
48. Collin GR. Decreasing catheter colonization through the use of an antiseptic-impregnated catheter: a continuous quality improvement project. Chest. 1999;115(6):1632-1640. PubMed
49. Coopersmith CM, Rebmann TL, Zack JE, et al. Effect of an education program on decreasing catheter-related bloodstream infections in the surgical intensive care unit. Crit Care Med. 2002;30(1):59-64. PubMed
50. Coopersmith CM, Zack JE, Ward MR, et al. The impact of bedside behavior on catheter-related bacteremia in the intensive care unit. Arch Surg. 2004;139(2):131-136. PubMed
51. Dixon JM, Carver RL. Daily chlorohexidine gluconate bathing with impregnated cloths results in statistically significant reduction in central line-associated bloodstream infections. Am J Infect Control. 2010;38(10):817-821. PubMed
52. Exline MC, Ali NA, Zikri N, et al. Beyond the bundle--journey of a tertiary care medical intensive care unit to zero central line-associated bloodstream infections. Crit Care. 2013;17(2):R41. PubMed
53. Fox C, Wavra T, Drake DA, et al. Use of a patient hand hygiene protocol to reduce hospital-acquired infections and improve nurses’ hand washing. Am J Crit Care. 2015;24(3):216-224. PubMed
54. Frankel HL, Crede WB, Topal JE, Roumanis SA, Devlin MW, Foley AB. Use of corporate Six Sigma performance-improvement strategies to reduce incidence of catheter-related bloodstream infections in a surgical ICU. J Am Coll Surg. 2005;201(3):349-358. PubMed
55. Galpern D, Guerrero A, Tu A, Fahoum B, Wise L. Effectiveness of a central line bundle campaign on line-associated infections in the intensive care unit. Surgery. 2008;144(4):492-495. PubMed
56. Gozu A, Clay C, Younus F. Hospital-wide reduction in central line-associated bloodstream infections: a tale of two small community hospitals. Infect Control Hosp Epidemiol. 2011;32(6):619-622. PubMed
57. Hanna HA, Raad II, Hackett B, et al. Antibiotic-impregnated catheters associated with significant decrease in nosocomial and multidrug-resistant bacteremias in critically ill patients. Chest. 2003;124(3):1030-1038. PubMed
58. Hatler CW, Mast D, Corderella J, et al. Using evidence and process improvement strategies to enhance healthcare outcomes for the critically ill: a pilot project. Am J Crit Care. 2006;15(6):549-555. PubMed
59. Kamboj M, Blair R, Bell N, et al. Use of disinfection cap to reduce central-line-associated bloodstream infection and blood culture contamination among hematology-oncology patients. Infect Control Hosp Epidemiol. 2015;36:1401-1408. PubMed
60. Khouli H, Jahnes K, Shapiro J, et al. Performance of medical residents in sterile techniques during central vein catheterization: randomized trial of efficacy of simulation-based training. Chest. 2011;139(1):80-87. PubMed
61. Koll BS, Straub TA, Jalon HS, Block R, Heller KS, Ruiz RE. The CLABs collaborative: a regionwide effort to improve the quality of care in hospitals. Jt Comm J Qual Patient Saf. 2008;34(12):713-723. PubMed
62. Lopez AC. A quality improvement program combining maximal barrier precaution compliance monitoring and daily chlorhexidine gluconate baths resulting in decreased central line bloodstream infections. Dimens Crit Care Nurs. 2011;30(5):293-298. PubMed
63. Maki DG, Stolz SM, Wheeler S, Mermel LA. Prevention of central venous catheter-related bloodstream infection by use of an antiseptic-impregnated catheter. A randomized, controlled trial. Ann Intern Med. 1997;127(4):257-266. PubMed
64. Marsteller JA, Sexton JB, Hsu YJ, et al. A multicenter, phased, cluster-randomized controlled trial to reduce central line-associated bloodstream infections in intensive care units. Crit Care Med. 2012;40(11):2933-2939. PubMed
65. McMullan C, Propper G, Schuhmacher C, et al. A multidisciplinary approach to reduce central line-associated bloodstream infections. Jt Comm J Qual Patient Saf. 2013;39(2):61-69. PubMed
66. Miller RS, Norris PR, Jenkins JM, et al. Systems initiatives reduce healthcare-associated infections: a study of 22,928 device days in a single trauma unit. J Trauma. 2010;68(1):23-31. PubMed
67. Montecalvo MA, McKenna D, Yarrish R, et al. Chlorhexidine bathing to reduce central venous catheter-associated bloodstream infection: impact and sustainability. Am J Med. 2012;125(5):505-511. PubMed
68. Noto MJ, Domenico HJ, Byrne DW, et al. Chlorhexidine bathing and health care-associated infections: a randomized clinical trial. JAMA. 2015;313(4):369-378. PubMed
69. Popovich KJ, Hota B, Hayes R, Weinstein RA, Hayden MK. Effectiveness of routine patient cleansing with chlorhexidine gluconate for infection prevention in the medical intensive care unit. Infect Control Hosp Epidemiol. 2009;30(10):959-963. PubMed
70. Popovich KJ, Hota B, Hayes R, Weinstein RA, Hayden MK. Daily skin cleansing with chlorhexidine did not reduce the rate of central-line associated bloodstream infection in a surgical intensive care unit. Intensive Care Med. 2010;36(5):854-858. PubMed
71. Pronovost PJ, Watson SR, Goeschel CA, Hyzy RC, Berenholtz SM. Sustaining reductions in central line-associated bloodstream infections in Michigan intensive care units: A 10-year analysis. Am J Med Qual. 2016;31(3):197-202. PubMed
72. Rangachari P, Madaio M, Rethemeyer RK, et al. Cumulative impact of periodic top-down communications on infection prevention practices and outcomes in two units. Health Care Manage Rev. 2015;40(4):324-336. PubMed
73. Render ML, Hasselbeck R, Freyberg RW, et al. Reduction of central line infections in Veterans Administration intensive care units: an observational cohort using a central infrastructure to support learning and improvement. BMJ Qual Saf. 2011;20(8):725-732. PubMed
74. Rupp ME, Lisco SJ, Lipsett PA, et al. Effect of a second-generation venous catheter impregnated with chlorhexidine and silver sulfadiazine on central catheter-related infections: a randomized, controlled trial. Ann Intern Med. 2005;143(8):570-580. PubMed
75. Sacks GD, Diggs BS, Hadjizacharia P, Green D, Salim A, Malinoski DJ. Reducing the rate of catheter-associated bloodstream infections in a surgical intensive care unit using the Institute for Healthcare Improvement Central Line Bundle. Am J Surg. 2014;207(6):817-823. PubMed
76. Salemi C, Canola MT, Eck EK. Hand washing and physicians: how to get them together. Infect Control Hosp Epidemiol. 2002;23(1):32-35. PubMed
77. Shannon RP, Frndak D, Grunden N, et al. Using real-time problem solving to eliminate central line infections. Jt Comm J Qual Patient Saf. 2006;32(9):479-487. PubMed
78. Sopirala MM, Smyer J, Fawley L, et al. Sustained reduction of central line-associated bloodstream infections in an intensive care unit using a top-down and bottom-up approach. Am J Infect Control. 2013;41(2):183-184. PubMed
79. Speroff T, Ely EW, Greevy R, et al. Quality improvement projects targeting health care-associated infections: comparing Virtual Collaborative and Toolkit approaches. J Hosp Med. 2011;6(5):271-278. PubMed
80. Thom KA, Li S, Custer M, et al. Successful implementation of a unit-based quality nurse to reduce central line-associated bloodstream infections. Am J Infect Control. 2014;42(2):139-143. PubMed
81. Venkatram S, Rachmale S, Kanna B. Study of device use adjusted rates in health care-associated infections after implementation of “bundles” in a closed-model medical intensive care unit. J Crit Care. 2010;25(1):174.e11-174.e18. PubMed
82. Wall RJ, Ely EW, Elasy TA, et al. Using real time process measurements to reduce catheter related bloodstream infections in the intensive care unit. Qual Saf Health Care. 2005;14(4):295-302. PubMed
83. Walz JM, Ellison RT 3rd, Mack DA, et al. The bundle “plus”: the effect of a multidisciplinary team approach to eradicate central line-associated bloodstream infections. Anesth Analg. 2015;120(4):868-876. PubMed
84. Warren DK, Cosgrove SE, Diekema DJ, et al. A multicenter intervention to prevent catheter-associated bloodstream infections. Infect Control Hosp Epidemiol. 2006;27(7):662-669. PubMed
85. Warren DK, Zack JE, Mayfield JL, et al. The effect of an education program on the incidence of central venous catheter-associated bloodstream infection in a medical ICU. Chest. 2004;126(5):1612-1618. PubMed
86. Watson SR, George C, Martin M, Bogan B, Goeschel C, Pronovost PJ. Preventing central line-associated bloodstream infections and improving safety culture: a statewide experience. Jt Comm J Qual Patient Saf. 2009;35(12):593-597. PubMed
87. Mueller JT, Wright AJ, Fedraw LA, et al. Standardizing central line safety: lessons learned for physician leaders. Am J Med Qual. 2014;29(3):191-199. PubMed
88. Vigorito MC, McNicoll L, Adams L, Sexton B. Improving safety culture results in Rhode Island ICUs: lessons learned from the development of action-oriented plans. Jt Comm J Qual Patient Saf. 2011;37(11):509-514. PubMed
89. Zack J. Zeroing in on zero tolerance for central line-associated bacteremia. Am J Infect Control. 2008;36(10):S176.e1-S176.e2. PubMed
90. Brun-Buisson C, Doyon F, Sollet JP, Cochard JF, Cohen Y, Nitenberg G. Prevention of intravascular catheter-related infection with newer chlorhexidine-silver sulfadiazine-coated catheters: a randomized controlled trial. Intensive Care Med. 2004;30(5):837-843. PubMed
91. Carrasco MN, Bueno A, de las Cuevas C, et al. Evaluation of a triple-lumen central venous heparin-coated catheter versus a catheter coated with chlorhexidine and silver sulfadiazine in critically ill patients. Intensive Care Med. 2004;30(4):633-638 PubMed
92. Corral L, Nolla-Salas M, Ibañez-Nolla J, et al. A prospective, randomized study in critically ill patients using the Oligon Vantex catheter. J Hosp Infect. 2003;55(3):212-219. PubMed
93. Hagau N, Studnicska D, Gavrus RL, Csipak G, Hagau R, Slavcovici AV. Central venous catheter colonization and catheter-related bloodstream infections in critically ill patients: a comparison between standard and silver-integrated catheters. Eur J Anaesthesiol. 2009;26(9):752-758. PubMed
94. Kalfon P, de Vaumas C, Samba D, et al. Comparison of silver-impregnated with standard multi-lumen central venous catheters in critically ill patients. Crit Care Med. 2007;35(4):1032-1039. PubMed
95. Kurtz P, Rosa P, Penna G, et al. Antibiotic coated catheter to decrease infection: pilot study. Rev Bras Ter Intensiva. 2008;20(2):160-164. PubMed
96. Osma S, Kahveci SF, Kaya FN, et al. Efficacy of antiseptic-impregnated catheters on catheter colonization and catheter-related bloodstream infections in patients in an intensive care unit. J Hosp Infect. 2006;62(2):156-162. PubMed
97. León C, Alvarez-Lerma F, Ruiz-Santana S, et al. Antiseptic chamber-containing hub reduces central venous catheter-related infection: a prospective, randomized study. Crit Care Med. 2003;31(5):1318-1324. PubMed
98. León C, Ruiz-Santana S, Rello J, et al. Benefits of minocycline and rifampin-impregnated central venous catheters. A prospective, randomized, double-blind, controlled, multicenter trial. Intensive Care Med. 2004;30(10):1891-1899. PubMed
99. Bion J, Richardson A, Hibbert P, et al. ‘Matching Michigan’: a 2-year stepped interventional programme to minimise central venous catheter-blood stream infections in intensive care units in England. BMJ Qual Saf. 2013;22(2):110-123. PubMed
100. Cherifi S, Gerard M, Arias S, Byl B. A multicenter quasi-experimental study: impact of a central line infection control program using auditing and performance feedback in five Belgian intensive care units. Antimicrob Resist Infect Control. 2013;2(1):33. PubMed
101. Entesari-Tatafi D, Orford N, Bailey MJ, Chonghaile MN, Lamb-Jenkins J, Athan E. Effectiveness of a care bundle to reduce central line-associated bloodstream infections. Med J Aust. 2015;202(5):247-250. PubMed
102. Hakko E, Guvenc S, Karaman I, Cakmak A, Erdem T, Cakmakci M. Long-term sustainability of zero central-line associated bloodstream infections is possible with high compliance with care bundle elements. East Mediterr Health J. 2015;21(4):293-298. PubMed
103. Hansen S, Schwab F, Schneider S, Sohr D, Gastmeier P, Geffers C. Time-series analysis to observe the impact of a centrally organized educational intervention on the prevention of central-line-associated bloodstream infections in 32 German intensive care units. J Hosp Infect. 2014;87(4):220-226. PubMed
104. Hermon A, Pain T, Beckett P, et al. Improving compliance with central venous catheter care bundles using electronic records. Nurs Crit Care. 2015;20(4):196-203. PubMed
105. Jaggi N, Rodrigues C, Rosenthal VD, et al. Impact of an international nosocomial infection control consortium multidimensional approach on central line-associated bloodstream infection rates in adult intensive care units in eight cities in India. Int J Infect Dis. 2013;17(12):e1218-e1224. PubMed
106. Khalid I, Al Salmi H, Qushmaq I, Al Hroub M, Kadri M, Qabajah MR. Itemizing the bundle: achieving and maintaining “zero” central line-associated bloodstream infection for over a year in a tertiary care hospital in Saudi Arabia. Am J Infect Control. 2013;41(12):1209-1213. PubMed
107. Jeong IS, Park SM, Lee JM, Song JY, Lee SJ. Effect of central line bundle on central line-associated bloodstream infections in intensive care units. Am J Infect Control. 2013;41(8):710-716. PubMed
108. Klintworth G, Stafford J, O’Connor M, et al. Beyond the intensive care unit bundle: Implementation of a successful hospital-wide initiative to reduce central line-associated bloodstream infections. Am J Infect Control. 2014;42(6):685-687. PubMed
109. Leblebicioglu H, Ersoz G, Rosenthal VD, et al. Impact of a multidimensional infection control approach on catheter-associated urinary tract infection rates in adult intensive care units in 10 cities of Turkey: International Nosocomial Infection Control Consortium findings (INICC). Am J Infect Control. 2013;41(10):885-891. PubMed
110. Latif A, Kelly B, Edrees H, et al. Implementing a multifaceted intervention to decrease central line-associated bloodstream infections in SEHA (Abu Dhabi Health Services Company) intensive care units: the Abu Dhabi experience. Infect Control Hosp Epidemiol. 2015;36(7):816-822. PubMed
111. Longmate AG, Ellis KS, Boyle L, et al. Elimination of central-venous-catheter-related bloodstream infections from the intensive care unit. BMJ Qual Saf. 2011;20(2):174-180. PubMed
112. Lobo RD, Levin AS, Oliveira MS, et al. Evaluation of interventions to reduce catheter-associated bloodstream infection: continuous tailored education versus one basic lecture. Am J Infect Control. 2010;38(6):440-448. PubMed
113. Lorente L, Lecuona M, Jiménez A, et al. Chlorhexidine-silver sulfadiazine-impregnated venous catheters save costs. Am J Infect Control. 2014;42(3):321-324. PubMed
114. Marra AR, Cal RG, Durão MS, et al. Impact of a program to prevent central line-associated bloodstream infection in the zero tolerance era. Am J Infect Control. 2010;38(6):434-439. PubMed
115. Martínez-Reséndez MF, Garza-González E, Mendoza-Olazaran S, et al. Impact of daily chlorhexidine baths and hand hygiene compliance on nosocomial infection rates in critically ill patients. Am J Infect Control. 2014;42(7):713-717. PubMed
116. Mathur P, Tak V, Gunjiyal J, et al. Device-associated infections at a level-1 trauma centre of a developing nation: impact of automated surveillance, training and feedbacks. Indian J Med Microbiol. 2015;33(1):51-62. PubMed
117. Mazi W, Begum Z, Abdulla D, et al. Central line-associated bloodstream infection in a trauma intensive care unit: impact of implementation of Society for Healthcare Epidemiology of America/Infectious Diseases Society of America practice guidelines. Am J Infect Control. 2014;42(8):865-867. PubMed
118. Menegueti MG, Ardison KM, Bellissimo-Rodrigues F, et al. The impact of implementation of bundle to reduce catheter-related bloodstream infection rates. J Clin Med Res. 2015;7(11):857-861. PubMed
119. Paula AP, Oliveira PR, Miranda EP, et al. The long-term impact of a program to prevent central line-associated bloodstream infections in a surgical intensive care unit. Clinics (Sao Paulo). 2012;67(8):969-970. PubMed
120. Reddy KK, Samuel A, Smiley KA, Weber S, Hon H. Reducing central line-associated bloodstream infections in three ICUs at a tertiary care hospital in the United Arab Emirates. Jt Comm J Qual Patient Saf. 2014;40(12):559-561. PubMed
121. Palomar M, Álvarez-Lerma F, Riera A, et al. Impact of a national multimodal intervention to prevent catheter-related bloodstream infection in the ICU: the Spanish experience. Crit Care Med. 2013;41(10):2364-2372. PubMed
122. Peredo R, Sabatier C, Villagrá A, et al. Reduction in catheter-related bloodstream infections in critically ill patients through a multiple system intervention. Eur J Clin Microbiol Infect Dis. 2010;29(9):1173-1177. PubMed
123. Pérez Parra A, Cruz Menárguez M, Pérez Granda MJ, Tomey MJ, Padilla B, Bouza E. A simple educational intervention to decrease incidence of central line-associated bloodstream infection (CLABSI) in intensive care units with low baseline incidence of CLABSI. Infect Control Hosp Epidemiol. 2010;31(9):964-967. PubMed
124. Rosenthal VD, Guzman S, Pezzotto SM, Crnich CJ. Effect of an infection control program using education and performance feedback on rates of intravascular device-associated bloodstream infections in intensive care units in Argentina. Am J Infect Control. 2003;31(7):405-409. PubMed
125. Rosenthal VD, Maki DG, Rodrigues C, et al. Impact of International Nosocomial Infection Control Consortium (INICC) strategy on central line-associated bloodstream infection rates in the intensive care units of 15 developing countries. Infect Control Hosp Epidemiol. 2010;31(12):1264-1272. PubMed
126. Salama MF, Jamal W, Mousa HA, Rotimi V. Implementation of central venous catheter bundle in an intensive care unit in Kuwait: Effect on central line-associated bloodstream infections. J Infect Public Health. 2016;9(1):34-41. PubMed
127. Santana SL, Furtado GH, Wey SB, Medeiros EA. Impact of an education program on the incidence of central line-associated bloodstream infection in 2 medical-surgical intensive care units in Brazil. Infect Control Hosp Epidemiol. 2008;29(12):1171-1173. PubMed
128. Scheithauer S, Lewalter K, Schröder J, et al. Reduction of central venous line-associated bloodstream infection rates by using a chlorhexidine-containing dressing. Infection. 2014;42(1):155-159. PubMed
129. Singh S, Kumar RK, Sundaram KR, et al. Improving outcomes and reducing costs by modular training in infection control in a resource-limited setting. Int J Qual Health Care. 2012;24(6):641-648. PubMed
130. Zingg W, Cartier V, Inan C, et al. Hospital-wide multidisciplinary, multimodal intervention programme to reduce central venous catheter-associated bloodstream infection. PLoS One. 2014;9(4):e93898. PubMed
131. Zingg W, Imhof A, Maggiorini M, Stocker R, Keller E, Ruef C. Impact of a prevention strategy targeting hand hygiene and catheter care on the incidence of catheter-related bloodstream infections. Crit Care Med. 2009;37(7):2167-2173. PubMed
132. Blot K, Bergs J, Vogelaers D, Blot S, Vandijck D. Prevention of central line-associated bloodstream infections through quality improvement interventions: a systematic review and meta-analysis. Clin Infect Dis. 2014;59(1):96-105. PubMed
133. Alexaitis I, Broome B. Implementation of a nurse-driven protocol to prevent catheter-associated urinary tract infections. J Nurs Care Qual. 2014;29(3):245-252. PubMed
134. Elpern EH, Killeen K, Ketchem A, Wiley A, Patel G, Lateef O. Reducing use of indwelling urinary catheters and associated urinary tract infections. Am J Crit Care. 2009;18(6):535-541. PubMed
135. Fuchs MA, Sexton DJ, Thornlow DK, Champagne MT. Evaluation of an evidence-based, nurse-driven checklist to prevent hospital-acquired catheter-associated urinary tract infections in intensive care units. J Nurs Care Qual. 2011;26(2):101-109. PubMed
136. Jain M, Miller L, Belt D, King D, Berwick DM. Decline in ICU adverse events, nosocomial infections and cost through a quality improvement initiative focusing on teamwork and culture change. Qual Saf Health Care. 2006;15(4):235-239. PubMed
137. Popp JA, Layon AJ, Nappo R, Richards WT, Mozingo DW. Hospital-acquired infections and thermally injured patients: chlorhexidine gluconate baths work. Am J Infect Control. 2014;42(2):129-132. PubMed
138. Reilly L, Sullivan P, Ninni S, Fochesto D, Williams K, Fetherman B. Reducing foley catheter device days in an intensive care unit: using the evidence to change practice. AACN Adv Crit Care. 2006;17(3):272-283. PubMed
139. Saint S, Fowler KE, Sermak K, et al. Introducing the No Preventable Harms campaign: creating the safest health care system in the world, starting with catheter-associated urinary tract infection prevention. Am J Infect Control. 2015;43(3):254-259. PubMed
140. Schelling K, Palamone J, Thomas K, et al. Reducing catheter-associated urinary tract infections in a neuro-spine intensive care unit. Am J Infect Control. 2015;43(8):892-894. PubMed
141. Sutherland T, Beloff J, McGrath C, et al. A single-center multidisciplinary initiative to reduce catheter-associated urinary tract infection rates: Quality and financial implications. Health Care Manag (Frederick). 2015;34(3):218-224. PubMed
142. Chen YY, Chi MM, Chen YC, Chan YJ, Chou SS, Wang FD. Using a criteria-based reminder to reduce use of indwelling urinary catheters and decrease urinary tract infections. Am J Crit Care. 2013;22(2):105-114. PubMed
143. Amine AE, Helal MO, Bakr WM. Evaluation of an intervention program to prevent hospital-acquired catheter-associated urinary tract infections in an ICU in a rural Egypt hospital. GMS Hyg Infect Control. 2014;9(2):Doc15. PubMed
144. Kanj SS, Zahreddine N, Rosenthal VD, Alamuddin L, Kanafani Z, Molaeb B. Impact of a multidimensional infection control approach on catheter-associated urinary tract infection rates in an adult intensive care unit in Lebanon: International Nosocomial Infection Control Consortium (INICC) findings. Int J Infect Dis. 2013;17(9):e686-e690. PubMed
145. Navoa-Ng JA, Berba R, Rosenthal VD, et al. Impact of an International Nosocomial Infection Control Consortium multidimensional approach on catheter-associated urinary tract infections in adult intensive care units in the Philippines: International Nosocomial Infection Control Consortium (INICC) findings. J Infect Public Health. 2013;6(5):389-399. PubMed
146. Rosenthal VD, Todi SK, Álvarez-Moreno C, et al. Impact of a multidimensional infection control strategy on catheter-associated urinary tract infection rates in the adult intensive care units of 15 developing countries: findings of the International Nosocomial Infection Control Consortium (INICC). Infection. 2012;40(5):517-526. PubMed
147. Salama MF, Jamal WY, Mousa HA, Al-Abdulghani KA, Rotimi VO. The effect of hand hygiene compliance on hospital-acquired infections in an ICU setting in a Kuwaiti teaching hospital. J Infect Public Health. 2013;6(1):27-34. PubMed
148. Seyman D, Oztoprak N, Berk H, Kizilates F, Emek M. Weekly chlorhexidine douche: does it reduce healthcare-associated bloodstream infections? Scand J Infect Dis. 2014;46(10):697-703. PubMed
149. Apisarnthanarak A, Thongphubeth K, Sirinvaravong S, et al. Effectiveness of multifaceted hospitalwide quality improvement programs featuring an intervention to remove unnecessary urinary catheters at a tertiary care center in Thailand. Infect Control Hosp Epidemiol. 2007;28(7):791-798. PubMed
150. Marra AR, Sampaio Camargo TZ, Gonçalves P, et al. Preventing catheter-associated urinary tract infection in the zero-tolerance era. Am J Infect Control. 2011;39(10):817-822. PubMed
151. Meddings J, Rogers MA, Krein SL, Fakih MG, Olmsted RN, Saint S. Reducing unnecessary urinary catheter use and other strategies to prevent catheter-associated urinary tract infection: an integrative review. BMJ Qual Saf. 2014;23(4):277-289. PubMed
152. Chopra V, Flanders SA, Saint S, et al. The Michigan Appropriateness Guide for Intravenous Catheters (MAGIC): results from a multispecialty panel using the RAND/UCLA appropriateness method. Ann Intern Med. 2015;163(6 Suppl):S1-S40. PubMed
153. Meddings J, Saint S, Fowler KE, et al. The Ann Arbor Criteria for appropriate urinary catheter use in hospitalized medical patients: results obtained by using the RAND/UCLA appropriateness method. Ann Intern Med. 2015;162(9 Suppl):S1-S34. PubMed
154. Furuya EY, Dick AW, Herzig CT, Pogorzelska-Maziarz M, Larson EL, Stone PW. Central Line-Associated Bloodstream Infection Reduction and Bundle Compliance in Intensive Care Units: A National Study. Infect Control Hosp Epidemiol. 2016;37(7):805-810. PubMed
© 2018 Society of Hospital Medicine
Fuller Road, Ann Arbor, MI 48105; Telephone: 734-845-3460; Fax: 734-845-3290, E-mail: [email protected]
2017 Update in perioperative medicine: 6 questions answered
Perioperative care is increasingly complex, and the rapid evolution of literature in this field makes it a challenge for clinicians to stay up-to-date. To help meet this challenge, we used a systematic approach to identify appropriate articles in the medical literature and then, by consensus, to develop a list of 6 clinical questions based on their novelty and potential to change perioperative medical practice:
- How should we screen for cardiac risk in patients undergoing noncardiac surgery?
- What is the appropriate timing for surgery after coronary intervention?
- Can we use statin therapy to reduce perioperative cardiac risk?
- How should we manage sleep apnea risk perioperatively?
- Which patients with atrial fibrillation should receive perioperative bridging anticoagulation?
- Is frailty screening beneficial for elderly patients before noncardiac surgery?
The summaries in this article are a composite of perioperative medicine updates presented at the Perioperative Medicine Summit and the annual meetings of the Society for General Internal Medicine and the Society of Hospital Medicine. “Perioperative care is complex and changing”1–10 (page 864) offers a brief overview.
HOW TO SCREEN FOR CARDIAC RISK BEFORE NONCARDIAC SURGERY
Perioperative cardiac risk can be estimated by clinical risk indexes (based on history, physical examination, common blood tests, and electrocardiography), cardiac biomarkers (natriuretic peptide or troponin levels), and noninvasive cardiac tests.

American and European guidelines
In 2014, the American College of Cardiology/American Heart Association2 and the European Society of Cardiology11 published guidelines on perioperative cardiovascular evaluation and management. They recommended several tools to calculate the risk of postoperative cardiac complications but did not specify a preference. These tools include:
- The Revised Cardiac Risk Index (RCRI)12 (www.mdcalc.com/revised-cardiac-risk-index-pre-operative-risk), which has been externally validated in multiple studies and is the most widely used
- The American College of Surgeons surgical risk calculator13 (www.riskcalculator.facs.org), derived from the National Surgery Quality Improvement Program (NSQIP) database
- The myocardial infarction or cardiac arrest (MICA) calculator14 (www.surgicalriskcalculator.com/miorcardiacarrest), also derived from the NSQIP database.
2017 Canadian guidelines differ
In 2017, the Canadian Cardiovascular Society published its own guidelines on perioperative risk assessment and management.1 These differ from the American and European guidelines on several points.
RCRI recommended. The Canadian guidelines suggested using the RCRI over the other risk predictors, which despite superior discrimination lacked external validation (conditional recommendation; low-quality evidence). Additionally, the Canadians believed that the NSQIP risk indexes underestimated cardiac risk because patients did not undergo routine biomarker screening.

Biomarker measurement. The Canadian guidelines went a step further in their algorithm (Figure 1) and recommended measuring N-terminal-pro B-type natriuretic peptide (NT-proBNP) or BNP preoperatively to improve risk prediction in 3 groups (strong recommendation; moderate-quality evidence):
- Patients ages 65 and older
- Patients ages 45 to 64 with significant cardiovascular disease
- Patients with an RCRI score of 1 or more.
This differs from the American guidelines, which did not recommend measuring preoperative biomarkers but did acknowledge that they may provide incremental value. The American College of Cardiology/American Heart Association authors felt that there were no data to suggest that targeting these biomarkers for treatment and intervention would reduce postoperative risk. The European guidelines did not recommend routinely using biomarkers, but stated that they may be considered in high-risk patients (who have a functional capacity ≤ 4 metabolic equivalents or an RCRI score > 1 undergoing vascular surgery, or > 2 undergoing nonvascular surgery).
Stress testing deemphasized. The Canadian guidelines recommended biomarker testing rather than noninvasive tests to enhance risk assessment based on cost, potential delays in surgery, and absence of evidence of an overall absolute net improvement in risk reclassification. This contrasts with the American and European guidelines and algorithms, which recommended pharmacologic stress testing in patients at elevated risk with poor functional capacity undergoing intermediate- to high-risk surgery if the results would change how they are managed.
Postoperative monitoring. The Canadian guidelines recommended that if patients have an NT-proBNP level higher than 300 mg/L or a BNP level higher than 92 mg/L, they should receive postoperative monitoring with electrocardiography in the postanesthesia care unit and daily troponin measurements for 48 to 72 hours. The American guidelines recommended postoperative electrocardiography and troponin measurement only for patients suspected of having myocardial ischemia, and the European guidelines said postoperative biomarkers may be considered in patients at high risk.
Physician judgment needed
While guidelines and risk calculators are potentially helpful in risk assessment, the lack of consensus and the conflicting recommendations force the physician to weigh the evidence and make individual decisions based on his or her interpretation of the data.
Until there are studies directly comparing the various risk calculators, physicians will most likely use the RCRI, which is simple and has been externally validated, in conjunction with the American guidelines.
At this time, it is unclear how biomarkers should be used—preoperatively, postoperatively, or both—because there are no studies demonstrating that management strategies based on the results lead to better outcomes. We do not believe that biomarker testing will be accepted in lieu of stress testing by our surgery, anesthesiology, or cardiology colleagues, but going forward, it will probably be used more frequently postoperatively, particularly in patients at moderate to high risk.
WHAT IS THE APPROPRIATE TIMING FOR SURGERY AFTER PCI?
A 2014 American College of Cardiology/American Heart Association guideline recommended delaying noncardiac surgery for 1 month after percutaneous coronary intervention (PCI) with bare-metal stents and 1 year after PCI with drug-eluting stents.15 The guideline suggested that surgery may be performed 6 months after drug-eluting stent placement if the risks of delaying surgery outweigh the risk of thrombosis.15
The primary rationale behind these timeframes was to provide dual antiplatelet therapy for a minimally acceptable duration before temporary interruption for a procedure. These recommendations were influenced largely by observational studies of first-generation devices, which are no longer used. Studies of newer-generation stents have suggested that the risk of stent thrombosis reaches a plateau considerably earlier than 6 to 12 months after PCI.
2016 Revised guideline on dual antiplatelet therapy

Although not separately delineated in the recommendations, risk factors for stent thrombosis that should influence the decision include smoking, multivessel coronary artery disease, and suboptimally controlled diabetes mellitus or hyperlipidemia.17 The presence of such stent thrombosis risk factors should be factored into the decision about proceeding with surgery within 3 to 6 months after drug-eluting stent placement.
Holcomb et al: Higher postoperative risk after PCI for myocardial infarction
Another important consideration is the indication for which PCI was performed. In a recent study, Holcomb et al16 found an association between postoperative major adverse cardiac events and PCI for myocardial infarction (MI) that was independent of stent type.
Compared with patients who underwent PCI not associated with acute coronary syndrome, the odds ratios and 95% confidence intervals (CIs) for major adverse cardiac events in those who underwent PCI for MI were:
- 5.25 (4.08–6.75) in the first 3 months
- 2.45 (1.80–3.35) in months 3 to 6
- 2.50 (1.90–3.28) in months 6 to 12.
In absolute terms, patients with stenting performed for an MI had an incidence of major adverse cardiac events of:
- 22.2% in the first 3 months
- 9.4% in months 3 to 6
- 5.8% in months 6 to 12
- 4.4% in months 12 to 24.
The perioperative risks were reduced after 12 months but still remained greater in patients whose PCI was performed for MI rather than another indication.16
The authors of this study suggested delaying noncardiac surgery for up to 6 months after PCI for MI, regardless of stent type.16
A careful, individualized approach
Optimal timing of noncardiac surgery PCI requires a careful, individualized approach and should always be coordinated with the patient’s cardiologist, surgeon, and anesthesiologist.3,15 For most patients, surgery should be delayed for 30 days after bare-metal stent placement and 6 months after drug-eluting stent placement.3 However, for those with greater surgical need and less thrombotic risk, noncardiac surgery can be considered 3 to 6 months after drug-eluting stent placement.3
Additional discussion of the prolonged increased risk of postoperative major adverse cardiac events is warranted in patients whose PCI was performed for MI, in whom delaying noncardiac surgery for up to 6 months (irrespective of stent type) should be considered.16
CAN WE USE STATINS TO REDUCE PERIOPERATIVE RISK?
Current recommendations from the American College of Cardiology/American Heart Association support continuing statins in the perioperative period, but the evidence supporting starting statins in this period has yet to be fully determined. In 2013, a Cochrane review18 found insufficient evidence to conclude that statins reduced perioperative adverse cardiac events, though several large studies were excluded due to controversial methods and data.
In contrast, the Vascular Events in Noncardiac Surgery Patients Cohort Evaluation (VISION) study,4 a multicenter, prospective, cohort-matched study of approximately 7,200 patients, found a lower risk of a composite primary outcome of all-cause mortality, myocardial injury after noncardiac surgery, or stroke at 30 days for patients exposed to statin therapy (relative risk [RR] 0.83, 95% CI 0.73–0.95, P = .007).4
London et al retrospective study: 30-day mortality rate is lower with statins
In 2017, London et al5 published the results of a very large retrospective, observational cohort study of approximately 96,000 elective or emergency surgery patients in Department of Veterans Affairs hospitals. The patients were propensity-matched and evaluated for exposure to statins on the day of or the day after surgery, for a total of approximately 48,000 pairs.
The primary outcome was death at 30 days, and statin exposure was associated with a significant reduction (RR 0.82; 95% CI 0.75–0.89; P < .001). Significant risk reductions were demonstrated in nearly all secondary end points as well, except for stroke or coma and thrombosis (pulmonary embolism, deep vein thrombosis, or graft failure). Overall, the number needed to treat to prevent any complication was 67. Statin therapy did not show significant harm, though on subgroup analysis, those who received high-intensity statin therapy had a slightly higher risk of renal injury (odds ratio 1.18, 95% CI 1.02–1.37, P = .03). Also on subgroup analysis, after propensity matching, patients on long-term moderate- or high-intensity statin therapy for 6 to 12 months before surgery had a small risk reduction for many of the outcomes, including death.
The authors also noted that only 62% of the patients who were prescribed statins as outpatients received them in the hospital, which suggests that improvement is necessary in educating perioperative physicians about the benefits and widespread support for continuing statins perioperatively.5
LOAD trial: No benefit from starting statins
Both London et al5 and the VISION investigators4 called for a large randomized controlled trial of perioperative statin initiation. The Lowering the Risk of Operative Complications Using Atorvastatin Loading Dose (LOAD) trial attempted to answer this call.6
This trial randomized 648 statin-naïve Brazilian patients at high risk of perioperative cardiac events to receive either atorvastatin or placebo before surgery and then continuously for another 7 days. The primary outcomes were the rates of death, nonfatal myocardial injury after noncardiac surgery, and cerebrovascular accident at 30 days.6
The investigators found no significant difference in outcomes between the two groups and estimated that the sample size would need to be approximately 7,000 patients to demonstrate a significant benefit. Nonetheless, this trial established that a prospective perioperative statin trial is feasible.
When to continue or start statins
Although we cannot recommend starting statins for all perioperative patients, perioperative statins clearly can carry significant benefit and should be continued in all patients who have been taking them. It is also likely beneficial to initiate statins in those patients who would otherwise warrant therapy based on the American College of Cardiology/American Heart Association Pooled Cohort Equations Risk calculator.19
HOW SHOULD WE MANAGE SLEEP APNEA RISK PERIOPERATIVELY?
From 20% to 30% of US men and 10% to 15% of US women have obstructive sleep apnea, and many are undiagnosed. Obstructive sleep apnea increases the risk of perioperative respiratory failure, unplanned reintubation, unplanned transfer to the intensive care unit, and death.20 Sentinel events (unexpected respiratory arrest after surgery on general surgical wards) have prompted the development of guidelines that aim to identify patients with previously undiagnosed obstructive sleep apnea before surgery and to develop approaches to reduce perioperative morbidity and mortality.
Kaw et al: Beware obesity hypoventilation syndrome
A 2016 study suggested that patients with obstructive sleep apnea and obesity hypoventilation syndrome may be at particularly high risk of perioperative complications.21
Kaw et al21 queried a database of patients with obstructive sleep apnea undergoing elective noncardiac surgery at Cleveland Clinic. All patients (N = 519) had obstructive sleep apnea confirmed by polysomnography, and a body mass index greater than 30 kg/m2. The authors considered a patient to have obesity hypoventilation syndrome (n = 194) if he or she also had hypercapnia (Paco2 ≥ 45 mm Hg) on at least 2 occasions before or after surgery.
In an adjusted analysis, the odds ratios and 95% CIs for adverse outcomes in patients with obesity hypoventilation syndrome were:
- 10.9 (3.7–32.3) for respiratory failure
- 5.4 (1.9–15.7) for heart failure
- 10.9 (3.7–32.3) for intensive care unit transfer.
The absolute increases in risk in the presence of obesity hypoventilation syndrome were:
- 19% (21% vs 2%) for respiratory failure
- 8% (8% vs 0) for heart failure
- 15% (21% vs 6%) for intensive care unit transfer.
There was no difference in rates of perioperative mortality.21

The authors proposed an algorithm to identify patients with possible obesity hypoventilation syndrome before surgery that included prior sleep study results, STOP-BANG score (Table 2),22 and serum bicarbonate level.
Important limitations of the study were that most patients with obesity hypoventilation syndrome were undiagnosed at the time of surgery. Still, the study does offer a tool to potentially identify patients at high risk for perioperative morbidity due to obesity hypoventilation syndrome. Clinicians could then choose to cancel nonessential surgery, propose a lower-risk alternative procedure, or maximize the use of strategies known to reduce perioperative risk for patients with obstructive sleep apnea in general.
Two guidelines on obstructive sleep apnea
Two professional societies have issued guidelines aiming to improve detection of previously undiagnosed obstructive sleep apnea and perioperative outcomes in patients known to have it or suspected of having it:
- The American Society of Anesthesiologists in 201423
- The Society of Anesthesia and Sleep Medicine in 2016.7
Both guidelines recommend that each institution develop a local protocol to screen patients for possible obstructive sleep apnea before elective surgery. The American Society of Anesthesiologists does not recommend any particular tool, but does recommend taking a history and performing a focused examination that includes evaluation of the airway, nasopharyngeal characteristics, neck circumference, and tonsil and tongue size. The Society of Anesthesia and Sleep Medicine recommends using a validated tool such as the STOP-BANG score to estimate the risk of obstructive sleep apnea.
If this screening suggests that a patient has obstructive sleep apnea, should surgery be delayed until a formal sleep study can be done? Or should the patient be treated empirically as if he or she has obstructive sleep apnea? Both professional societies recommend shared decision-making with the patient in this situation, with the Society of Anesthesia and Sleep Medicine recommending additional cardiopulmonary evaluation for patients with hypoventilation, severe pulmonary hypertension, or resting hypoxemia.
Both recommend using continuous positive airway pressure (CPAP) after surgery in patients with known obstructive sleep apnea, although there is not enough evidence to determine if empiric CPAP for screening-positive patients (without polysomnography-diagnosed obstructive sleep apnea) is beneficial. The Society of Anesthesia and Sleep Medicine advises that it is safe to proceed to surgery if obstructive sleep apnea is suspected as long as monitoring and risk-reduction strategies are implemented after surgery to reduce complication rates.
During surgery, the American Society of Anesthesiologists advises peripheral nerve blocks when appropriate, general anesthesia with a secure airway rather than deep sedation, capnography when using moderate sedation, awake extubation, and full reversal of neuromuscular blockade before extubation. After surgery, they recommend reducing opioid use, minimizing postoperative sedatives, supplemental oxygen, and continuous pulse oximetry. The Society of Anesthesia and Sleep Medicine guideline addresses preoperative assessment and therefore makes no recommendations regarding postoperative care.
In conclusion, use of pertinent findings from the history and physical examination and a validated obstructive sleep apnea screening tool such as STOP-BANG before surgery are recommended, with joint decision-making as to proceeding with surgery with empiric CPAP vs a formal sleep study for patients who screen as high risk. The Society of Anesthesia and Sleep Medicine recommends further cardiopulmonary evaluation if there is evidence of hypoventilation, hypoxemia, or pulmonary hypertension in addition to likely obstructive sleep apnea.
WHICH ATRIAL FIBRILLATION PATIENTS NEED BRIDGING ANTICOAGULATION?
When patients receiving anticoagulation need surgery, we need to carefully assess the risks of thromboembolism without anticoagulation vs bleeding with anticoagulation.
Historically, we tended to worry more about thromboembolism24; however, recent studies have revealed a significant risk of bleeding when long-term anticoagulant therapy is bridged (ie, interrupted and replaced with a shorter-acting agent in the perioperative period), with minimal to no decrease in thromboembolic events.25–27
American College of Cardiology guideline
In 2017, the American College of Cardiology8 published a guideline on periprocedural management of anticoagulation in patients with nonvalvular atrial fibrillation. The guideline includes a series of decision algorithms on whether and when to interrupt anticoagulation, whether and how to provide bridging anticoagulation, and how to restart postprocedural anticoagulation.
When deciding whether to interrupt anticoagulation, we need to consider the risk of bleeding posed both by patient-specific factors and by the type of surgery. Bridging anticoagulation is not indicated when direct oral anticoagulants (eg, dabigatran, apixaban, edoxaban, rivaroxaban) are interrupted for procedures.
Unlike an earlier guideline statement by the American College of Chest Physicians,24 this consensus statement emphasizes using the CHA2DS2-VASc score as a predictor of thromboembolic events rather than the CHADS2 core.

Table 3 summarizes the key points in the guidance statement about which patients should receive periprocedural bridging anticoagulation.
As evidence continues to evolve in this complicated area of perioperative medicine, it will remain important to continue to create patient management plans that take individual patient and procedural risks into account.
IS FRAILTY SCREENING BENEFICIAL BEFORE NONCARDIAC SURGERY?
Frailty, defined as a composite score of a patient’s age and comorbidities, has great potential to become an obligatory factor in perioperative risk assessment. However, it remains difficult to incorporate frailty scoring into clinical practice due to variations among scoring systems,28 uncertain outcome data, and the imprecise role of socioeconomic factors. In particular, the effect of frailty on perioperative mortality over longer periods of time is uncertain.
McIsaac et al: Higher risk in frail patients
McIsaac and colleagues at the University of Ottawa used a frailty scoring system developed at Johns Hopkins University to evaluate the effect of frailty on all-cause postoperative mortality in approximately 202,000 patients over a 10-year period.9 Although this scoring system is proprietary, it is based on factors such as malnutrition, dementia, impaired vision, decubitus ulcers, urinary incontinence, weight loss, poverty, barriers to access of care, difficulty in walking, and falls.
After adjusting for the procedure risk, patient age, sex, and neighborhood income quintile, the 1-year mortality risk was significantly higher in the frail group (absolute risk 13.6% vs 4.8%; adjusted hazard ratio 2.23; 95% CI 2.08–2.40). The risk of death in the first 3 days was much higher in frail than in nonfrail patients (hazard ratio 35.58; 95% CI 29.78–40.1), but the hazard ratio decreased to approximately 2.4 by day 90.
The authors emphasize that the elevated risk for frail patients warrants particular perioperative planning, though it is not yet clear what frailty-specific interventions should be performed. Further study is needed into the benefit of “prehabilitation” (ie, exercise training to “build up” a patient before surgery) for perioperative risk reduction.
Hall et al: Better care for frail patients
Hall et al10 instituted a quality improvement initiative for perioperative care of patients at the Omaha Veterans Affairs Hospital. Frail patients were identified using the Risk Analysis Index, a 14-question screening tool previously developed and validated over several years using Veterans Administration databases.29 Questions in the Risk Analysis Index cover living situation, any diagnosis of cancer, ability to perform activities of daily living, and others.
To maximize compliance, a Risk Analysis Index score was required to schedule a surgery. Patients with high scores underwent further review by a designated team of physicians who initiated informal and formal consultations with anesthesiologists, critical care physicians, surgeons, and palliative care providers, with the goals of minimizing risk, clarifying patient goals or resuscitation wishes, and developing comprehensive perioperative planning.10
Approximately 9,100 patients were included in the cohort. The authors demonstrated a significant improvement in mortality for frail patients at 30, 180, and 365 days, but noted an improvement in postoperative mortality for the nonfrail patients as well, perhaps due to increased focus on geriatric patient care. In particular, the mortality rate at 365 days dropped from 34.5% to 11.7% for frail patients who underwent this intervention.
While this quality improvement initiative was unable to examine how surgical rates changed in frail patients, it is highly likely that very high-risk patients opted out of surgery or had their surgical plan change, though the authors point out that the overall surgical volume at the institution did not change significantly. As well, it remains unclear which particular interventions may have had the most effect in improving survival, as the perioperative plans were individualized and continually adjusted throughout the study period.
Nonetheless, this article highlights how higher vigilance, individualized planning and appreciation of the high risks of frail patients is associated with improved patient survival postoperatively. Although frailty screening is still in its early stages and further work is needed, it is likely that performing frailty screening in elderly patients and utilizing interdisciplinary collaboration for comprehensive management of frail patients can improve their postoperative course.
- Duceppe E, Parlow J, MacDonald P, et al. Canadian Cardiovascular Society guidelines on perioperative cardiac risk assessment and management for patients who undergo noncardiac surgery. Can J Cardiol 2017; 33:17–32.
- Fleisher LA, Fleischmann KE, Auerbach AD, et al. 2014 ACC/AHA guideline on perioperative cardiovascular evaluation and management of patients undergoing noncardiac surgery: a report of the American College of Cardiology/American Heart Association Task Force on practice guidelines. J Am Coll Cardiol 2014; 64:2373–2405.
- Levine GN, Bates ER, Bittl JA, et al. 2016 ACC/AHA guideline focused update on duration of dual antiplatelet therapy in patients with coronary artery disease. Circulation 2016; 134:e123–e155.
- Berwanger O, Le Manach Y, Suzumura EA, et al. Association between pre-operative statin use and major cardiovascular complications among patients undergoing non-cardiac surgery: the VISION study. Eur Heart J 2016; 37:177–185.
- London MJ, Schwartz GG, Hur K, Henderson WG. Association of perioperative statin use with mortality and morbidity after major noncardiac surgery. JAMA Intern Med 2017; 177:231–242.
- Berwanger O, de Barros E Silva PG, Barbosa RR, et al. Atorvastatin for high-risk statin-naïve patients undergoing noncardiac surgery: the Lowering the Risk of Operative Complications Using Atorvastatin Loading Dose (LOAD) randomized trial. Am Heart J 2017; 184:88–96.
- Chung F, Memtsoudis SG, Ramachandran SK, et al. Society of Anesthesia and Sleep Medicine guidelines on preoperative screening and assessment of adult patients with obstructive sleep apnea. Anesth Analg 2016; 123:452–473.
- Doherty JU, Gluckman TJ, Hucker W, et al. 2017 ACC expert consensus decision pathway for periprocedural management of anticoagulation in patients with nonvalvular atrial fibrillation: a report of the American College of Cardiology Clinical Expert Consensus Document Task Force. J Am Coll Cardiol 2017; 69:871–898.
- McIsaac DI, Bryson GL, van Walraven C. Association of frailty and 1-year postoperative mortality following major elective noncardiac surgery: a population-based cohort study. JAMA Surg 2016; 151:538–545.
- Hall DE, Arya S, Schmid KK, et al. Association of a frailty screening initiative with postoperative survival at 30, 180, and 365 days. JAMA Surg 2017; 152:233–240.
- Kristensen SD, Knuuti J, Saraste A, et al. 2014 ESC/ESA Guidelines on non-cardiac surgery: cardiovascular assessment and management: The Joint Task Force on non-cardiac surgery: cardiovascular assessment and management of the European Society of Cardiology (ESC) and the European Society of Anaesthesiology (ESA). Eur Heart J 2014; 35:2383–2431.
- Lee TH, Marcantonio ER, Mangione CM, et al. Derivation and prospective validation of a simple index for prediction of cardiac risk of major noncardiac surgery. Circulation 1999; 100:1043–1049.
- Bilimoria KY, Liu Y, Paruch JL, Zhou L, Kmiecik TE, Ko CY, Cohen ME. Development and evaluation of the universal ACS NSQIP surgical risk calculator: a decision aid and informed consent tool for patients and surgeons. J Am Coll Surg 2013; 217:833–842.
- Gupta PK, Gupta H, Sundaram A, et al. Development and validation of a risk calculator for prediction of cardiac risk after surgery. Circulation 2011; 124:381–387.
- Fleisher LA, Fleischmann KE, Auerbach AD, et al. 2014 ACC/AHA guideline on perioperative cardiovascular evaluation and management of patients undergoing noncardiac surgery: a report of the American College of Cardiology/American Heart Association Task Force on Practice Guidelines. J Am Coll Cardiol 2014; 64:e77–e137.
- Holcomb CN, Hollis RH, Graham LA, et al. Association of coronary stent indication with postoperative outcomes following noncardiac surgery. JAMA Surg 2016; 151:462–469.
- Lemesle G, Tricot O, Meurice T, et al. Incident myocardial infarction and very late stent thrombosis in outpatients with stable coronary artery disease. J Am Coll Cardiol 2017; 69:2149–2156.
- Sanders RD, Nicholson A, Lewis SR, Smith AF, Alderson P. Perioperative statin therapy for improving outcomes during and after noncardiac vascular surgery. Cochrane Database Syst Rev 2013; 7:CD009971.
- Goff DC, Lloyd-Jones DM, Bennett G, et al. 2013 ACC/AHA guideline on the assessment of cardiovascular risk: a report of the American College of Cardiology/American Heart Association Task Force on Practice Guidelines. J Am Coll Cardiol 2014; 63:2935–2959.
- Kaw R, Pasupuleti V, Walker E, et al. Postoperative complications in patients with obstructive sleep apnea. Chest 2012; 141:436–441.
- Kaw R, Bhateja P, Mar HP, et al. Postoperative complications in patients with unrecognized obesity hypoventilation syndrome undergoing elective noncardiac surgery. Chest 2016; 149:84–91.
- Chung F, Yegneswaran B, Liao P, et al. STOP questionnaire: a tool to screen patients for obstructive sleep apnea. Anesthesiology 2008; 108:812–821.
- Gross JB, Apfelbaum JL, Caplan RA, et al. Practice guidelines for the perioperative management of patients with obstructive sleep apnea: an updated report by the American Society of Anesthesiologists Task Force on Perioperative Management of Patients with Obstructive Sleep Apnea. Anesthesiology 2014; 120:268–286.
- Douketis JD, Spyropoulos AC, Spencer FA, et al. Perioperative management of antithrombotic therapy: Antithrombotic Therapy and Prevention of Thrombosis, 9th ed: American College of Chest Physicians Evidence-Based Clinical Practice Guidelines. Chest 2012; 141(2 suppl):e326S–e350S.
- Siegal D, Yudin J, Kaatz S, Douketis JD, Lim W, Spyropoulos AC. Periprocedural heparin bridging in patients receiving vitamin K antagonists: systematic review and meta-analysis of bleeding and thromboembolic rates. Circulation 2012; 126:1630–1639.
- Clark NP, Witt DM, Davies LE, et al. Bleeding, recurrent venous thromboembolism, and mortality risks during warfarin interruption for invasive procedures. JAMA Intern Med 2015; 175:1163–1168.
- Douketis JD, Spyropoulos AC, Kaatz S, et al. Perioperative bridging anticoagulation in patients with atrial fibrillation. N Engl J Med 2015; 373:823–833.
- Theou O, Brothers TD, Mitnitski A, Rockwood K. Operationalization of frailty using eight commonly used scales and comparison of their ability to predict all-cause mortality. J Am Geriatr Soc 2013; 61:1537–1551.
- Hall DE, Arya S, Schmid KK, et al. Development and initial validation of the risk analysis index for measuring frailty in surgical populations. JAMA Surg 2017; 152:175–182.
Perioperative care is increasingly complex, and the rapid evolution of literature in this field makes it a challenge for clinicians to stay up-to-date. To help meet this challenge, we used a systematic approach to identify appropriate articles in the medical literature and then, by consensus, to develop a list of 6 clinical questions based on their novelty and potential to change perioperative medical practice:
- How should we screen for cardiac risk in patients undergoing noncardiac surgery?
- What is the appropriate timing for surgery after coronary intervention?
- Can we use statin therapy to reduce perioperative cardiac risk?
- How should we manage sleep apnea risk perioperatively?
- Which patients with atrial fibrillation should receive perioperative bridging anticoagulation?
- Is frailty screening beneficial for elderly patients before noncardiac surgery?
The summaries in this article are a composite of perioperative medicine updates presented at the Perioperative Medicine Summit and the annual meetings of the Society for General Internal Medicine and the Society of Hospital Medicine. “Perioperative care is complex and changing”1–10 (page 864) offers a brief overview.
HOW TO SCREEN FOR CARDIAC RISK BEFORE NONCARDIAC SURGERY
Perioperative cardiac risk can be estimated by clinical risk indexes (based on history, physical examination, common blood tests, and electrocardiography), cardiac biomarkers (natriuretic peptide or troponin levels), and noninvasive cardiac tests.
American and European guidelines
In 2014, the American College of Cardiology/American Heart Association2 and the European Society of Cardiology11 published guidelines on perioperative cardiovascular evaluation and management. They recommended several tools to calculate the risk of postoperative cardiac complications but did not specify a preference. These tools include:
- The Revised Cardiac Risk Index (RCRI)12 (www.mdcalc.com/revised-cardiac-risk-index-pre-operative-risk), which has been externally validated in multiple studies and is the most widely used
- The American College of Surgeons surgical risk calculator13 (www.riskcalculator.facs.org), derived from the National Surgery Quality Improvement Program (NSQIP) database
- The myocardial infarction or cardiac arrest (MICA) calculator14 (www.surgicalriskcalculator.com/miorcardiacarrest), also derived from the NSQIP database.
2017 Canadian guidelines differ
In 2017, the Canadian Cardiovascular Society published its own guidelines on perioperative risk assessment and management.1 These differ from the American and European guidelines on several points.
RCRI recommended. The Canadian guidelines suggested using the RCRI over the other risk predictors, which despite superior discrimination lacked external validation (conditional recommendation; low-quality evidence). Additionally, the Canadians believed that the NSQIP risk indexes underestimated cardiac risk because patients did not undergo routine biomarker screening.
Biomarker measurement. The Canadian guidelines went a step further in their algorithm (Figure 1) and recommended measuring N-terminal-pro B-type natriuretic peptide (NT-proBNP) or BNP preoperatively to improve risk prediction in 3 groups (strong recommendation; moderate-quality evidence):
- Patients ages 65 and older
- Patients ages 45 to 64 with significant cardiovascular disease
- Patients with an RCRI score of 1 or more.
This differs from the American guidelines, which did not recommend measuring preoperative biomarkers but did acknowledge that they may provide incremental value. The American College of Cardiology/American Heart Association authors felt that there were no data to suggest that targeting these biomarkers for treatment and intervention would reduce postoperative risk. The European guidelines did not recommend routinely using biomarkers, but stated that they may be considered in high-risk patients (who have a functional capacity ≤ 4 metabolic equivalents or an RCRI score > 1 undergoing vascular surgery, or > 2 undergoing nonvascular surgery).
Stress testing deemphasized. The Canadian guidelines recommended biomarker testing rather than noninvasive tests to enhance risk assessment based on cost, potential delays in surgery, and absence of evidence of an overall absolute net improvement in risk reclassification. This contrasts with the American and European guidelines and algorithms, which recommended pharmacologic stress testing in patients at elevated risk with poor functional capacity undergoing intermediate- to high-risk surgery if the results would change how they are managed.
Postoperative monitoring. The Canadian guidelines recommended that if patients have an NT-proBNP level higher than 300 mg/L or a BNP level higher than 92 mg/L, they should receive postoperative monitoring with electrocardiography in the postanesthesia care unit and daily troponin measurements for 48 to 72 hours. The American guidelines recommended postoperative electrocardiography and troponin measurement only for patients suspected of having myocardial ischemia, and the European guidelines said postoperative biomarkers may be considered in patients at high risk.
Physician judgment needed
While guidelines and risk calculators are potentially helpful in risk assessment, the lack of consensus and the conflicting recommendations force the physician to weigh the evidence and make individual decisions based on his or her interpretation of the data.
Until there are studies directly comparing the various risk calculators, physicians will most likely use the RCRI, which is simple and has been externally validated, in conjunction with the American guidelines.
At this time, it is unclear how biomarkers should be used—preoperatively, postoperatively, or both—because there are no studies demonstrating that management strategies based on the results lead to better outcomes. We do not believe that biomarker testing will be accepted in lieu of stress testing by our surgery, anesthesiology, or cardiology colleagues, but going forward, it will probably be used more frequently postoperatively, particularly in patients at moderate to high risk.
WHAT IS THE APPROPRIATE TIMING FOR SURGERY AFTER PCI?
A 2014 American College of Cardiology/American Heart Association guideline recommended delaying noncardiac surgery for 1 month after percutaneous coronary intervention (PCI) with bare-metal stents and 1 year after PCI with drug-eluting stents.15 The guideline suggested that surgery may be performed 6 months after drug-eluting stent placement if the risks of delaying surgery outweigh the risk of thrombosis.15
The primary rationale behind these timeframes was to provide dual antiplatelet therapy for a minimally acceptable duration before temporary interruption for a procedure. These recommendations were influenced largely by observational studies of first-generation devices, which are no longer used. Studies of newer-generation stents have suggested that the risk of stent thrombosis reaches a plateau considerably earlier than 6 to 12 months after PCI.
2016 Revised guideline on dual antiplatelet therapy
Although not separately delineated in the recommendations, risk factors for stent thrombosis that should influence the decision include smoking, multivessel coronary artery disease, and suboptimally controlled diabetes mellitus or hyperlipidemia.17 The presence of such stent thrombosis risk factors should be factored into the decision about proceeding with surgery within 3 to 6 months after drug-eluting stent placement.
Holcomb et al: Higher postoperative risk after PCI for myocardial infarction
Another important consideration is the indication for which PCI was performed. In a recent study, Holcomb et al16 found an association between postoperative major adverse cardiac events and PCI for myocardial infarction (MI) that was independent of stent type.
Compared with patients who underwent PCI not associated with acute coronary syndrome, the odds ratios and 95% confidence intervals (CIs) for major adverse cardiac events in those who underwent PCI for MI were:
- 5.25 (4.08–6.75) in the first 3 months
- 2.45 (1.80–3.35) in months 3 to 6
- 2.50 (1.90–3.28) in months 6 to 12.
In absolute terms, patients with stenting performed for an MI had an incidence of major adverse cardiac events of:
- 22.2% in the first 3 months
- 9.4% in months 3 to 6
- 5.8% in months 6 to 12
- 4.4% in months 12 to 24.
The perioperative risks were reduced after 12 months but still remained greater in patients whose PCI was performed for MI rather than another indication.16
The authors of this study suggested delaying noncardiac surgery for up to 6 months after PCI for MI, regardless of stent type.16
A careful, individualized approach
Optimal timing of noncardiac surgery PCI requires a careful, individualized approach and should always be coordinated with the patient’s cardiologist, surgeon, and anesthesiologist.3,15 For most patients, surgery should be delayed for 30 days after bare-metal stent placement and 6 months after drug-eluting stent placement.3 However, for those with greater surgical need and less thrombotic risk, noncardiac surgery can be considered 3 to 6 months after drug-eluting stent placement.3
Additional discussion of the prolonged increased risk of postoperative major adverse cardiac events is warranted in patients whose PCI was performed for MI, in whom delaying noncardiac surgery for up to 6 months (irrespective of stent type) should be considered.16
CAN WE USE STATINS TO REDUCE PERIOPERATIVE RISK?
Current recommendations from the American College of Cardiology/American Heart Association support continuing statins in the perioperative period, but the evidence supporting starting statins in this period has yet to be fully determined. In 2013, a Cochrane review18 found insufficient evidence to conclude that statins reduced perioperative adverse cardiac events, though several large studies were excluded due to controversial methods and data.
In contrast, the Vascular Events in Noncardiac Surgery Patients Cohort Evaluation (VISION) study,4 a multicenter, prospective, cohort-matched study of approximately 7,200 patients, found a lower risk of a composite primary outcome of all-cause mortality, myocardial injury after noncardiac surgery, or stroke at 30 days for patients exposed to statin therapy (relative risk [RR] 0.83, 95% CI 0.73–0.95, P = .007).4
London et al retrospective study: 30-day mortality rate is lower with statins
In 2017, London et al5 published the results of a very large retrospective, observational cohort study of approximately 96,000 elective or emergency surgery patients in Department of Veterans Affairs hospitals. The patients were propensity-matched and evaluated for exposure to statins on the day of or the day after surgery, for a total of approximately 48,000 pairs.
The primary outcome was death at 30 days, and statin exposure was associated with a significant reduction (RR 0.82; 95% CI 0.75–0.89; P < .001). Significant risk reductions were demonstrated in nearly all secondary end points as well, except for stroke or coma and thrombosis (pulmonary embolism, deep vein thrombosis, or graft failure). Overall, the number needed to treat to prevent any complication was 67. Statin therapy did not show significant harm, though on subgroup analysis, those who received high-intensity statin therapy had a slightly higher risk of renal injury (odds ratio 1.18, 95% CI 1.02–1.37, P = .03). Also on subgroup analysis, after propensity matching, patients on long-term moderate- or high-intensity statin therapy for 6 to 12 months before surgery had a small risk reduction for many of the outcomes, including death.
The authors also noted that only 62% of the patients who were prescribed statins as outpatients received them in the hospital, which suggests that improvement is necessary in educating perioperative physicians about the benefits and widespread support for continuing statins perioperatively.5
LOAD trial: No benefit from starting statins
Both London et al5 and the VISION investigators4 called for a large randomized controlled trial of perioperative statin initiation. The Lowering the Risk of Operative Complications Using Atorvastatin Loading Dose (LOAD) trial attempted to answer this call.6
This trial randomized 648 statin-naïve Brazilian patients at high risk of perioperative cardiac events to receive either atorvastatin or placebo before surgery and then continuously for another 7 days. The primary outcomes were the rates of death, nonfatal myocardial injury after noncardiac surgery, and cerebrovascular accident at 30 days.6
The investigators found no significant difference in outcomes between the two groups and estimated that the sample size would need to be approximately 7,000 patients to demonstrate a significant benefit. Nonetheless, this trial established that a prospective perioperative statin trial is feasible.
When to continue or start statins
Although we cannot recommend starting statins for all perioperative patients, perioperative statins clearly can carry significant benefit and should be continued in all patients who have been taking them. It is also likely beneficial to initiate statins in those patients who would otherwise warrant therapy based on the American College of Cardiology/American Heart Association Pooled Cohort Equations Risk calculator.19
HOW SHOULD WE MANAGE SLEEP APNEA RISK PERIOPERATIVELY?
From 20% to 30% of US men and 10% to 15% of US women have obstructive sleep apnea, and many are undiagnosed. Obstructive sleep apnea increases the risk of perioperative respiratory failure, unplanned reintubation, unplanned transfer to the intensive care unit, and death.20 Sentinel events (unexpected respiratory arrest after surgery on general surgical wards) have prompted the development of guidelines that aim to identify patients with previously undiagnosed obstructive sleep apnea before surgery and to develop approaches to reduce perioperative morbidity and mortality.
Kaw et al: Beware obesity hypoventilation syndrome
A 2016 study suggested that patients with obstructive sleep apnea and obesity hypoventilation syndrome may be at particularly high risk of perioperative complications.21
Kaw et al21 queried a database of patients with obstructive sleep apnea undergoing elective noncardiac surgery at Cleveland Clinic. All patients (N = 519) had obstructive sleep apnea confirmed by polysomnography, and a body mass index greater than 30 kg/m2. The authors considered a patient to have obesity hypoventilation syndrome (n = 194) if he or she also had hypercapnia (Paco2 ≥ 45 mm Hg) on at least 2 occasions before or after surgery.
In an adjusted analysis, the odds ratios and 95% CIs for adverse outcomes in patients with obesity hypoventilation syndrome were:
- 10.9 (3.7–32.3) for respiratory failure
- 5.4 (1.9–15.7) for heart failure
- 10.9 (3.7–32.3) for intensive care unit transfer.
The absolute increases in risk in the presence of obesity hypoventilation syndrome were:
- 19% (21% vs 2%) for respiratory failure
- 8% (8% vs 0) for heart failure
- 15% (21% vs 6%) for intensive care unit transfer.
There was no difference in rates of perioperative mortality.21
The authors proposed an algorithm to identify patients with possible obesity hypoventilation syndrome before surgery that included prior sleep study results, STOP-BANG score (Table 2),22 and serum bicarbonate level.
Important limitations of the study were that most patients with obesity hypoventilation syndrome were undiagnosed at the time of surgery. Still, the study does offer a tool to potentially identify patients at high risk for perioperative morbidity due to obesity hypoventilation syndrome. Clinicians could then choose to cancel nonessential surgery, propose a lower-risk alternative procedure, or maximize the use of strategies known to reduce perioperative risk for patients with obstructive sleep apnea in general.
Two guidelines on obstructive sleep apnea
Two professional societies have issued guidelines aiming to improve detection of previously undiagnosed obstructive sleep apnea and perioperative outcomes in patients known to have it or suspected of having it:
- The American Society of Anesthesiologists in 201423
- The Society of Anesthesia and Sleep Medicine in 2016.7
Both guidelines recommend that each institution develop a local protocol to screen patients for possible obstructive sleep apnea before elective surgery. The American Society of Anesthesiologists does not recommend any particular tool, but does recommend taking a history and performing a focused examination that includes evaluation of the airway, nasopharyngeal characteristics, neck circumference, and tonsil and tongue size. The Society of Anesthesia and Sleep Medicine recommends using a validated tool such as the STOP-BANG score to estimate the risk of obstructive sleep apnea.
If this screening suggests that a patient has obstructive sleep apnea, should surgery be delayed until a formal sleep study can be done? Or should the patient be treated empirically as if he or she has obstructive sleep apnea? Both professional societies recommend shared decision-making with the patient in this situation, with the Society of Anesthesia and Sleep Medicine recommending additional cardiopulmonary evaluation for patients with hypoventilation, severe pulmonary hypertension, or resting hypoxemia.
Both recommend using continuous positive airway pressure (CPAP) after surgery in patients with known obstructive sleep apnea, although there is not enough evidence to determine if empiric CPAP for screening-positive patients (without polysomnography-diagnosed obstructive sleep apnea) is beneficial. The Society of Anesthesia and Sleep Medicine advises that it is safe to proceed to surgery if obstructive sleep apnea is suspected as long as monitoring and risk-reduction strategies are implemented after surgery to reduce complication rates.
During surgery, the American Society of Anesthesiologists advises peripheral nerve blocks when appropriate, general anesthesia with a secure airway rather than deep sedation, capnography when using moderate sedation, awake extubation, and full reversal of neuromuscular blockade before extubation. After surgery, they recommend reducing opioid use, minimizing postoperative sedatives, supplemental oxygen, and continuous pulse oximetry. The Society of Anesthesia and Sleep Medicine guideline addresses preoperative assessment and therefore makes no recommendations regarding postoperative care.
In conclusion, use of pertinent findings from the history and physical examination and a validated obstructive sleep apnea screening tool such as STOP-BANG before surgery are recommended, with joint decision-making as to proceeding with surgery with empiric CPAP vs a formal sleep study for patients who screen as high risk. The Society of Anesthesia and Sleep Medicine recommends further cardiopulmonary evaluation if there is evidence of hypoventilation, hypoxemia, or pulmonary hypertension in addition to likely obstructive sleep apnea.
WHICH ATRIAL FIBRILLATION PATIENTS NEED BRIDGING ANTICOAGULATION?
When patients receiving anticoagulation need surgery, we need to carefully assess the risks of thromboembolism without anticoagulation vs bleeding with anticoagulation.
Historically, we tended to worry more about thromboembolism24; however, recent studies have revealed a significant risk of bleeding when long-term anticoagulant therapy is bridged (ie, interrupted and replaced with a shorter-acting agent in the perioperative period), with minimal to no decrease in thromboembolic events.25–27
American College of Cardiology guideline
In 2017, the American College of Cardiology8 published a guideline on periprocedural management of anticoagulation in patients with nonvalvular atrial fibrillation. The guideline includes a series of decision algorithms on whether and when to interrupt anticoagulation, whether and how to provide bridging anticoagulation, and how to restart postprocedural anticoagulation.
When deciding whether to interrupt anticoagulation, we need to consider the risk of bleeding posed both by patient-specific factors and by the type of surgery. Bridging anticoagulation is not indicated when direct oral anticoagulants (eg, dabigatran, apixaban, edoxaban, rivaroxaban) are interrupted for procedures.
Unlike an earlier guideline statement by the American College of Chest Physicians,24 this consensus statement emphasizes using the CHA2DS2-VASc score as a predictor of thromboembolic events rather than the CHADS2 core.
Table 3 summarizes the key points in the guidance statement about which patients should receive periprocedural bridging anticoagulation.
As evidence continues to evolve in this complicated area of perioperative medicine, it will remain important to continue to create patient management plans that take individual patient and procedural risks into account.
IS FRAILTY SCREENING BENEFICIAL BEFORE NONCARDIAC SURGERY?
Frailty, defined as a composite score of a patient’s age and comorbidities, has great potential to become an obligatory factor in perioperative risk assessment. However, it remains difficult to incorporate frailty scoring into clinical practice due to variations among scoring systems,28 uncertain outcome data, and the imprecise role of socioeconomic factors. In particular, the effect of frailty on perioperative mortality over longer periods of time is uncertain.
McIsaac et al: Higher risk in frail patients
McIsaac and colleagues at the University of Ottawa used a frailty scoring system developed at Johns Hopkins University to evaluate the effect of frailty on all-cause postoperative mortality in approximately 202,000 patients over a 10-year period.9 Although this scoring system is proprietary, it is based on factors such as malnutrition, dementia, impaired vision, decubitus ulcers, urinary incontinence, weight loss, poverty, barriers to access of care, difficulty in walking, and falls.
After adjusting for the procedure risk, patient age, sex, and neighborhood income quintile, the 1-year mortality risk was significantly higher in the frail group (absolute risk 13.6% vs 4.8%; adjusted hazard ratio 2.23; 95% CI 2.08–2.40). The risk of death in the first 3 days was much higher in frail than in nonfrail patients (hazard ratio 35.58; 95% CI 29.78–40.1), but the hazard ratio decreased to approximately 2.4 by day 90.
The authors emphasize that the elevated risk for frail patients warrants particular perioperative planning, though it is not yet clear what frailty-specific interventions should be performed. Further study is needed into the benefit of “prehabilitation” (ie, exercise training to “build up” a patient before surgery) for perioperative risk reduction.
Hall et al: Better care for frail patients
Hall et al10 instituted a quality improvement initiative for perioperative care of patients at the Omaha Veterans Affairs Hospital. Frail patients were identified using the Risk Analysis Index, a 14-question screening tool previously developed and validated over several years using Veterans Administration databases.29 Questions in the Risk Analysis Index cover living situation, any diagnosis of cancer, ability to perform activities of daily living, and others.
To maximize compliance, a Risk Analysis Index score was required to schedule a surgery. Patients with high scores underwent further review by a designated team of physicians who initiated informal and formal consultations with anesthesiologists, critical care physicians, surgeons, and palliative care providers, with the goals of minimizing risk, clarifying patient goals or resuscitation wishes, and developing comprehensive perioperative planning.10
Approximately 9,100 patients were included in the cohort. The authors demonstrated a significant improvement in mortality for frail patients at 30, 180, and 365 days, but noted an improvement in postoperative mortality for the nonfrail patients as well, perhaps due to increased focus on geriatric patient care. In particular, the mortality rate at 365 days dropped from 34.5% to 11.7% for frail patients who underwent this intervention.
While this quality improvement initiative was unable to examine how surgical rates changed in frail patients, it is highly likely that very high-risk patients opted out of surgery or had their surgical plan change, though the authors point out that the overall surgical volume at the institution did not change significantly. As well, it remains unclear which particular interventions may have had the most effect in improving survival, as the perioperative plans were individualized and continually adjusted throughout the study period.
Nonetheless, this article highlights how higher vigilance, individualized planning and appreciation of the high risks of frail patients is associated with improved patient survival postoperatively. Although frailty screening is still in its early stages and further work is needed, it is likely that performing frailty screening in elderly patients and utilizing interdisciplinary collaboration for comprehensive management of frail patients can improve their postoperative course.
- Duceppe E, Parlow J, MacDonald P, et al. Canadian Cardiovascular Society guidelines on perioperative cardiac risk assessment and management for patients who undergo noncardiac surgery. Can J Cardiol 2017; 33:17–32.
- Fleisher LA, Fleischmann KE, Auerbach AD, et al. 2014 ACC/AHA guideline on perioperative cardiovascular evaluation and management of patients undergoing noncardiac surgery: a report of the American College of Cardiology/American Heart Association Task Force on practice guidelines. J Am Coll Cardiol 2014; 64:2373–2405.
- Levine GN, Bates ER, Bittl JA, et al. 2016 ACC/AHA guideline focused update on duration of dual antiplatelet therapy in patients with coronary artery disease. Circulation 2016; 134:e123–e155.
- Berwanger O, Le Manach Y, Suzumura EA, et al. Association between pre-operative statin use and major cardiovascular complications among patients undergoing non-cardiac surgery: the VISION study. Eur Heart J 2016; 37:177–185.
- London MJ, Schwartz GG, Hur K, Henderson WG. Association of perioperative statin use with mortality and morbidity after major noncardiac surgery. JAMA Intern Med 2017; 177:231–242.
- Berwanger O, de Barros E Silva PG, Barbosa RR, et al. Atorvastatin for high-risk statin-naïve patients undergoing noncardiac surgery: the Lowering the Risk of Operative Complications Using Atorvastatin Loading Dose (LOAD) randomized trial. Am Heart J 2017; 184:88–96.
- Chung F, Memtsoudis SG, Ramachandran SK, et al. Society of Anesthesia and Sleep Medicine guidelines on preoperative screening and assessment of adult patients with obstructive sleep apnea. Anesth Analg 2016; 123:452–473.
- Doherty JU, Gluckman TJ, Hucker W, et al. 2017 ACC expert consensus decision pathway for periprocedural management of anticoagulation in patients with nonvalvular atrial fibrillation: a report of the American College of Cardiology Clinical Expert Consensus Document Task Force. J Am Coll Cardiol 2017; 69:871–898.
- McIsaac DI, Bryson GL, van Walraven C. Association of frailty and 1-year postoperative mortality following major elective noncardiac surgery: a population-based cohort study. JAMA Surg 2016; 151:538–545.
- Hall DE, Arya S, Schmid KK, et al. Association of a frailty screening initiative with postoperative survival at 30, 180, and 365 days. JAMA Surg 2017; 152:233–240.
- Kristensen SD, Knuuti J, Saraste A, et al. 2014 ESC/ESA Guidelines on non-cardiac surgery: cardiovascular assessment and management: The Joint Task Force on non-cardiac surgery: cardiovascular assessment and management of the European Society of Cardiology (ESC) and the European Society of Anaesthesiology (ESA). Eur Heart J 2014; 35:2383–2431.
- Lee TH, Marcantonio ER, Mangione CM, et al. Derivation and prospective validation of a simple index for prediction of cardiac risk of major noncardiac surgery. Circulation 1999; 100:1043–1049.
- Bilimoria KY, Liu Y, Paruch JL, Zhou L, Kmiecik TE, Ko CY, Cohen ME. Development and evaluation of the universal ACS NSQIP surgical risk calculator: a decision aid and informed consent tool for patients and surgeons. J Am Coll Surg 2013; 217:833–842.
- Gupta PK, Gupta H, Sundaram A, et al. Development and validation of a risk calculator for prediction of cardiac risk after surgery. Circulation 2011; 124:381–387.
- Fleisher LA, Fleischmann KE, Auerbach AD, et al. 2014 ACC/AHA guideline on perioperative cardiovascular evaluation and management of patients undergoing noncardiac surgery: a report of the American College of Cardiology/American Heart Association Task Force on Practice Guidelines. J Am Coll Cardiol 2014; 64:e77–e137.
- Holcomb CN, Hollis RH, Graham LA, et al. Association of coronary stent indication with postoperative outcomes following noncardiac surgery. JAMA Surg 2016; 151:462–469.
- Lemesle G, Tricot O, Meurice T, et al. Incident myocardial infarction and very late stent thrombosis in outpatients with stable coronary artery disease. J Am Coll Cardiol 2017; 69:2149–2156.
- Sanders RD, Nicholson A, Lewis SR, Smith AF, Alderson P. Perioperative statin therapy for improving outcomes during and after noncardiac vascular surgery. Cochrane Database Syst Rev 2013; 7:CD009971.
- Goff DC, Lloyd-Jones DM, Bennett G, et al. 2013 ACC/AHA guideline on the assessment of cardiovascular risk: a report of the American College of Cardiology/American Heart Association Task Force on Practice Guidelines. J Am Coll Cardiol 2014; 63:2935–2959.
- Kaw R, Pasupuleti V, Walker E, et al. Postoperative complications in patients with obstructive sleep apnea. Chest 2012; 141:436–441.
- Kaw R, Bhateja P, Mar HP, et al. Postoperative complications in patients with unrecognized obesity hypoventilation syndrome undergoing elective noncardiac surgery. Chest 2016; 149:84–91.
- Chung F, Yegneswaran B, Liao P, et al. STOP questionnaire: a tool to screen patients for obstructive sleep apnea. Anesthesiology 2008; 108:812–821.
- Gross JB, Apfelbaum JL, Caplan RA, et al. Practice guidelines for the perioperative management of patients with obstructive sleep apnea: an updated report by the American Society of Anesthesiologists Task Force on Perioperative Management of Patients with Obstructive Sleep Apnea. Anesthesiology 2014; 120:268–286.
- Douketis JD, Spyropoulos AC, Spencer FA, et al. Perioperative management of antithrombotic therapy: Antithrombotic Therapy and Prevention of Thrombosis, 9th ed: American College of Chest Physicians Evidence-Based Clinical Practice Guidelines. Chest 2012; 141(2 suppl):e326S–e350S.
- Siegal D, Yudin J, Kaatz S, Douketis JD, Lim W, Spyropoulos AC. Periprocedural heparin bridging in patients receiving vitamin K antagonists: systematic review and meta-analysis of bleeding and thromboembolic rates. Circulation 2012; 126:1630–1639.
- Clark NP, Witt DM, Davies LE, et al. Bleeding, recurrent venous thromboembolism, and mortality risks during warfarin interruption for invasive procedures. JAMA Intern Med 2015; 175:1163–1168.
- Douketis JD, Spyropoulos AC, Kaatz S, et al. Perioperative bridging anticoagulation in patients with atrial fibrillation. N Engl J Med 2015; 373:823–833.
- Theou O, Brothers TD, Mitnitski A, Rockwood K. Operationalization of frailty using eight commonly used scales and comparison of their ability to predict all-cause mortality. J Am Geriatr Soc 2013; 61:1537–1551.
- Hall DE, Arya S, Schmid KK, et al. Development and initial validation of the risk analysis index for measuring frailty in surgical populations. JAMA Surg 2017; 152:175–182.
KEY POINTS
- Noncardiac surgery after drug-eluting stent placement can be considered after 3 to 6 months for those with greater surgical need and lower risk of stent thrombosis.
- Perioperative statin use continues to show benefits with minimal risk in large cohort studies, but significant randomized controlled trial data are lacking.
- Patients should be screened for obstructive sleep apnea before surgery, and further cardiopulmonary testing should be performed if the patient has evidence of significant sequelae from obstructive sleep apnea.
- For patients with atrial fibrillation on vitamin K antagonists, bridging can be considered for those with a CHA2DS2-VASc score of 5 or 6 and a history of stroke, transient ischemic attack, or systemic thromboembolism. Direct oral anticoagulation should not be bridged.
- Frailty carries significant perioperative mortality risk; systems-based changes to minimize these patients’ risks can be beneficial and warrant further study.

Getting Creative About Reducing Kidney Stones
A “smart” water bottle—or money—or a coach? What’s the best way to encourage people at risk for kidney stones to drink more water? The prevalence of urinary stones has nearly doubled in the past 15 years, affecting 1 in 11 people, according to the National Institute of Health (NIH). The NIH says little high-quality research exists related to how to prevent stones, and most therapies treat people with the condition only after they are in excruciating pain.
To test new solutions, researchers from the Urinary Stone Disease Research Network and Duke Clinical Research are recruiting 1,642 participants for Prevention of Urinary Stones with Hydration (PUSH), a 2-year multisite clinical trial funded by the National Institute of Diabetes and Digestive and Kidney Diseases (NIDDK).
People with kidney stones, when counseled to drink more water, usually only increase intake by small amounts. So participants in the intervention group will receive water bottles (Hidrate Spark) that connect to an app and monitor how much they drink, with a goal of 2.5 liters of water per day. They will also receive financial incentives if they achieve their fluid targets, and meet with a health coach who will help them identify barriers to drinking more liquids and help devise solutions.
“Urinary stones are painful and debilitating, and their treatment is expensive,” said Ziya Kirkali, MD, program director of urology clinical research and epidemiology in NIDDK’s Division of Kidney, Urologic, and Hematologic Diseases. “If successful, the study could change management of kidney stones.”
Cannabinoid Hyperemesis Syndrome
Given the recent rise in marijuana legalization efforts and an overall increase in the prevalence of marijuana use, it is becoming increasingly important to recognize conditions that are associated with its use. Data obtained from the National Survey on Drug Use and Health show the prevalence of marijuana use within the past month among those surveyed was 8.4% in 2014. This represents a 35% increase from the same study in 2002. Based on this survey, 2.5 million people (or ~7,000 per day) used marijuana for the first time.1
Following the liberalization of marijuana in Colorado, the prevalence of presentation to the emergency department (ED) for cyclic vomiting nearly doubled.2 During the 2016 election season, several states included legislation that increased access to marijuana on the ballot, most of which passed. There are now 28 states plus the District of Columbia that permit medical marijuana usage, and 8 of those states and the District of Columbia have laws allowing for recreational use of marijuana.3
First described in a case series by Allen and colleagues in 2004, cannabinoid hyperemesis syndrome (CHS) is indicated by recurrent episodes of nausea and vomiting with vague abdominal pain and compulsive hot bathing in the setting of chronic, often daily, cannabis use.4 A case of a middle-aged veteran with chronic marijuana use and recurrent, self-limited nausea and vomiting is presented here.
Case Presentation
A 45-year-old man presented to the ED with a 5-day history of persistent nausea and vomiting that began abruptly. The symptoms had been constant since onset, resulting in very little oral intake. The patient reported no hematemesis or coffee ground emesis. He noted a drop in his urine output over the previous 2 days. He also reported abdominal pain associated with the nausea. The patient characterized his pain as “dull and achy” diffuse pain that was partially relieved with emesis. His bowel movements had been regular, and he reported no diarrhea, fever, chills, or other constitutional symptoms. Additional 10-point review of systems was otherwise negative. The patient reported smoking marijuana multiple times daily for many years. The patient reported he had not used alcohol for several months.
A physical exam showed a pale and diaphoretic patient. Vital signs were significant for mild hypertension (150/75), but the patient was afebrile with a normal heart rate. An abdominal exam revealed a nontender, nondistended abdomen with no signs of rebound or guarding. The remainder of the examination was unremarkable. An initial workup showed a mild elevation of serum creatinine to 1.36 mg/dL (baseline is 1.10 mg/dL). Other workups, including complete blood count (CBC) with differential, complete metabolic panel, lipase, amylase, and urine analysis, were all unremarkable.
The patient’s urine drug screen (UDS) was positive for tetrahydrocannabinol (THC). A computed tomography (CT) scan of his abdomen and pelvis with contrast was unremarkable. The patient was admitted for his inability to tolerate oral intake and dehydration and treated supportively with IV fluids and antiemetics.
Overnight, the nursing staff reported that the patient took multiple, prolonged hot showers. Upon further questioning, he reported the hot showers significantly helped the nausea and abdominal pain. He had learned this behavior after experiencing previous episodes of self-limited nausea, vomiting, and abdominal pain.
Extensive review of his medical record revealed that the patient had, in fact, presented to the ED with similar symptoms 11 times in the prior 8 years. He was admitted on 8 occasions over that time frame. The typical hospital course included supportive care with antiemetics and IV fluids. The patient’s symptoms typically resolved within 24 to 72 hours of hospitalization. Previous evaluations included additional unremarkable CT imaging of the abdomen and pelvis. The patient also had received 2 esophagogastroduodenoscopies (EGDs), one 2 years prior and the other 5 years prior. Both EGDs showed only mild gastritis. On every check during the previous 8 years, the patient’s UDS was positive for THC.
Most of his previous admissions were attributed to viral gastroenteritis due to the self-limited nature of the symptoms. Other admissions were attributed to alcohol-induced gastritis. However, after abstaining from alcohol for long periods, the patient had continued recurrence of the symptoms and increased frequency of presentations to the ED.
The characteristics, signs, and symptoms of CHS were discussed with the patient. The patient strongly felt as though these symptoms aligned with his clinical course over the prior 8 years. At time of writing, the patient had gone 20 months without requiring hospitalization; however, he had a recent relapse of marijuana use and subsequently required hospitalization.
Discussion
As in this case, CHS often presents with refractory, self-limited nausea and vomiting with vague abdominal pain that is temporarily relieved by hot baths or showers. In the largest case series, it was noted the average age was 32 years, and the majority of subjects used marijuana at least weekly for > 2 years.5 Many studies categorize CHS into 3 phases: prodromal, hyperemetic, and recovery.
The prodromal, or preemetic phase, is characterized by early morning nausea without emesis and abdominal discomfort. The hyperemetic phase begins when the patient accesses the health care system via either the ED or primary care physician. This phase is characterized by intractable nausea and vomiting and may be associated with mild diffuse abdominal pain. The nausea and vomiting typically do not respond to antiemetic medications. Patients in this stage also develop a compulsive behavior of hot showers that temporarily relieve the symptoms. These behaviors are thought to be learned through their cyclical periods of emesis and may not be present during the first few hyperemetic phases. During the recovery phase, the patient returns to a baseline state of health and often ceases utilizing the hot shower. The recovery phase can last weeks to months despite continued cannabis use prior to returning to the hyperemetic phase (Figure).6,7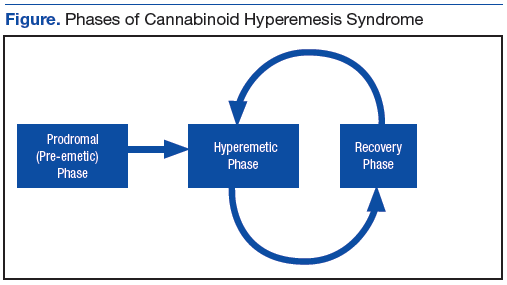
Simonetto and colleagues proposed clinical criteria for the diagnosis of CHS based on their case series as well as on previously proposed criteria presented by Sontineni and colleagues.5,8 Long-term cannabis use is required for the diagnosis. In the Simonetto and colleagues case series, the majority of patients developed symptoms within the first 5 years of cannabis use; however, Soriano and colleagues conducted a smaller case series that showed that the majority of subjects used marijuana for roughly 16 years prior to the onset of vomiting.5,7
The major CHS features that suggest the diagnosis are severe cyclic nausea and vomiting, relief of symptoms with abstinence from cannabis, temporary symptom relief with hot bathing, abdominal pain, and at least weekly use of marijuana. Other supportive features include aged < 50 years, weight loss > 5 kg, symptoms that are worse in the morning, normal bowel habits, and negative evaluation, including laboratory, radiography, and endoscopy (Table).5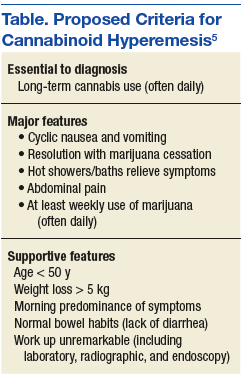
Treatment often is supportive with emphasis placed on marijuana cessation. Intravenous fluids often are used due to dehydration from the emesis. The use of antiemetics, such as 5-HT3 (eg, ondansetron), D2 (eg, prochlorperazine), H1 (eg, promethazine), or neurokinin-1 receptor antagonists (eg, aprepitant) can be tried, but these therapies often are ineffective. Diet can be advanced as the patient tolerates. Given that many patients are found to have a mild gastritis, H2 blockers or proton pump inhibitors may be used. Extensive counseling on marijuana cessation is needed as it is the only therapy shown to have prolonged relief of the hyperemetic phase.6 The length of cessation from marijuana for resolution of the cyclical hyperemesis varies from 1 to 3 months. Returning to marijuana use often results in the returning of CHS.5
The pathophysiology of CHS is largely unknown; however, there are several hypothesized mechanisms. Many theorize that due to the lipophilicity and long half-life of THC, a primary compound in marijuana, it accumulates in the body over time.4,6 It is thought that this accumulation may cause toxicity in both the gastrointestinal tract as well as in the brain. Central effects on the hypothalamic-pituitary axis may play a major role, and the reason for the symptom relief of hot baths is due to a change in thermoregulation in the hypothalamus.5 One interesting mechanism relates to CB1 receptor activation and vasodilation within the gastrointestinal tract due to chronic THC accumulation. The relief of the abdominal pain, nausea, and vomiting with hot showers can be secondary to the vasodilation of the skin, causing a redistribution from the gut. This theorized mechanism has been referred to as “cutaneous steal.”9
Conclusion
With the increased prevalence of marijuana use in the U.S. over the past decade and reform in legislation taking place over the next couple of years, it is increasingly important to be able to recognize CHS to avoid frequent hospital utilization and repeated costly evaluations. Cannabinoid hyperemesis syndrome is recognized by the triad of chronic cannabis use, cyclical hyperemesis, and compulsive hot bathing.4
The syndrome has 3 phases. In the prodromal phase the patient has morning predominance of nausea, usually without emesis. This is followed by the hyperemesis phase, which is characterized by hyperemesis, vague abdominal pain, and learned compulsive hot bathing.
The third phase is the recovery phase, which is a return to normal behavior. During the recovery phase, if patients cease marijuana use, they remain asymptomatic; however, if patients continue to use marijuana, they often have recurrence of the hyperemesis phase.5 The diagnosis of cannabinoid hyperemesis syndrome is difficult as it is a diagnosis of exclusion. Patients may present to the ED many times prior to diagnosis. With the changing climate of marijuana laws, it is an important condition to consider when establishing a differential. More studies will be required to evaluate the overall prevalence of this condition as well as if there are any changes following the liberalization of marijuana laws in many states.
1. Azofeifa A, Mattson ME, Schauer G, McAfee T, Grant A, Lyerla R. National estimates of marijuana use and related indicators - National Survey on Drug Use and Health, United States, 2002-2014. MMWR Surveill Summ. 2016;65(11):1-28.
2. Kim HS, Anderson JD, Saghafi O, Heard KJ, Monte AA. Cyclic vomiting presentations following marijuana liberalization in Colorado. Acad Emerg Med. 2015;22(6):694-699.
3. National Conference of State Legislatures. State medical marijuana laws. http://www.ncsl.org/research/health/state-medical-marijuana-laws.aspx. Updated July 7, 2017. Accessed August 3, 2017.
4. Allen JH, de Moore GM, Heddle R, Twartz JC. Cannabinoid hyperemesis: cyclical hyperemesis in association with chronic cannabis abuse. Gut. 2004;53(11):1566-1570.
5. Simonetto DA, Oxentenko AS, Herman ML, Szostek JH. Cannabinoid hyperemesis: a case series of 98 patients. Mayo Clin Proc. 2012;87(2):114-119.
6. Galli JA, Sawaya RA, Friedenberg FK. Cannabinoid hyperemesis syndrome. Curr Drug Abuse Rev. 2011;4(4):241-249.
7. Soriano-Co M, Batke M, Cappell MS. The cannabis hyperemesis syndrome characterized by persistent nausea and vomiting, abdominal pain, and compulsive bathing associated with chronic marijuana use: a report of eight cases in the United States. Dig Dis Sci. 2010;55(11):3113-3119.
8. Sontineni SP, Chaudhary S, Sontineni V, Lanspa SJ. Cannabinoid hyperemesis syndrome: clinical diagnosis of an underrecognised manifestation of chronic cannabis abuse. World J Gastroenterol. 2009;15(10):1264-1266.
9. Patterson DA, Smith E, Monahan M, et al. Cannabinoid hyperemesis and compulsive bathing: a case series and paradoxical pathophysiological explanation. J Am Board Fam Med. 2010;23(6):790-793
Given the recent rise in marijuana legalization efforts and an overall increase in the prevalence of marijuana use, it is becoming increasingly important to recognize conditions that are associated with its use. Data obtained from the National Survey on Drug Use and Health show the prevalence of marijuana use within the past month among those surveyed was 8.4% in 2014. This represents a 35% increase from the same study in 2002. Based on this survey, 2.5 million people (or ~7,000 per day) used marijuana for the first time.1
Following the liberalization of marijuana in Colorado, the prevalence of presentation to the emergency department (ED) for cyclic vomiting nearly doubled.2 During the 2016 election season, several states included legislation that increased access to marijuana on the ballot, most of which passed. There are now 28 states plus the District of Columbia that permit medical marijuana usage, and 8 of those states and the District of Columbia have laws allowing for recreational use of marijuana.3
First described in a case series by Allen and colleagues in 2004, cannabinoid hyperemesis syndrome (CHS) is indicated by recurrent episodes of nausea and vomiting with vague abdominal pain and compulsive hot bathing in the setting of chronic, often daily, cannabis use.4 A case of a middle-aged veteran with chronic marijuana use and recurrent, self-limited nausea and vomiting is presented here.
Case Presentation
A 45-year-old man presented to the ED with a 5-day history of persistent nausea and vomiting that began abruptly. The symptoms had been constant since onset, resulting in very little oral intake. The patient reported no hematemesis or coffee ground emesis. He noted a drop in his urine output over the previous 2 days. He also reported abdominal pain associated with the nausea. The patient characterized his pain as “dull and achy” diffuse pain that was partially relieved with emesis. His bowel movements had been regular, and he reported no diarrhea, fever, chills, or other constitutional symptoms. Additional 10-point review of systems was otherwise negative. The patient reported smoking marijuana multiple times daily for many years. The patient reported he had not used alcohol for several months.
A physical exam showed a pale and diaphoretic patient. Vital signs were significant for mild hypertension (150/75), but the patient was afebrile with a normal heart rate. An abdominal exam revealed a nontender, nondistended abdomen with no signs of rebound or guarding. The remainder of the examination was unremarkable. An initial workup showed a mild elevation of serum creatinine to 1.36 mg/dL (baseline is 1.10 mg/dL). Other workups, including complete blood count (CBC) with differential, complete metabolic panel, lipase, amylase, and urine analysis, were all unremarkable.
The patient’s urine drug screen (UDS) was positive for tetrahydrocannabinol (THC). A computed tomography (CT) scan of his abdomen and pelvis with contrast was unremarkable. The patient was admitted for his inability to tolerate oral intake and dehydration and treated supportively with IV fluids and antiemetics.
Overnight, the nursing staff reported that the patient took multiple, prolonged hot showers. Upon further questioning, he reported the hot showers significantly helped the nausea and abdominal pain. He had learned this behavior after experiencing previous episodes of self-limited nausea, vomiting, and abdominal pain.
Extensive review of his medical record revealed that the patient had, in fact, presented to the ED with similar symptoms 11 times in the prior 8 years. He was admitted on 8 occasions over that time frame. The typical hospital course included supportive care with antiemetics and IV fluids. The patient’s symptoms typically resolved within 24 to 72 hours of hospitalization. Previous evaluations included additional unremarkable CT imaging of the abdomen and pelvis. The patient also had received 2 esophagogastroduodenoscopies (EGDs), one 2 years prior and the other 5 years prior. Both EGDs showed only mild gastritis. On every check during the previous 8 years, the patient’s UDS was positive for THC.
Most of his previous admissions were attributed to viral gastroenteritis due to the self-limited nature of the symptoms. Other admissions were attributed to alcohol-induced gastritis. However, after abstaining from alcohol for long periods, the patient had continued recurrence of the symptoms and increased frequency of presentations to the ED.
The characteristics, signs, and symptoms of CHS were discussed with the patient. The patient strongly felt as though these symptoms aligned with his clinical course over the prior 8 years. At time of writing, the patient had gone 20 months without requiring hospitalization; however, he had a recent relapse of marijuana use and subsequently required hospitalization.
Discussion
As in this case, CHS often presents with refractory, self-limited nausea and vomiting with vague abdominal pain that is temporarily relieved by hot baths or showers. In the largest case series, it was noted the average age was 32 years, and the majority of subjects used marijuana at least weekly for > 2 years.5 Many studies categorize CHS into 3 phases: prodromal, hyperemetic, and recovery.
The prodromal, or preemetic phase, is characterized by early morning nausea without emesis and abdominal discomfort. The hyperemetic phase begins when the patient accesses the health care system via either the ED or primary care physician. This phase is characterized by intractable nausea and vomiting and may be associated with mild diffuse abdominal pain. The nausea and vomiting typically do not respond to antiemetic medications. Patients in this stage also develop a compulsive behavior of hot showers that temporarily relieve the symptoms. These behaviors are thought to be learned through their cyclical periods of emesis and may not be present during the first few hyperemetic phases. During the recovery phase, the patient returns to a baseline state of health and often ceases utilizing the hot shower. The recovery phase can last weeks to months despite continued cannabis use prior to returning to the hyperemetic phase (Figure).6,7
Simonetto and colleagues proposed clinical criteria for the diagnosis of CHS based on their case series as well as on previously proposed criteria presented by Sontineni and colleagues.5,8 Long-term cannabis use is required for the diagnosis. In the Simonetto and colleagues case series, the majority of patients developed symptoms within the first 5 years of cannabis use; however, Soriano and colleagues conducted a smaller case series that showed that the majority of subjects used marijuana for roughly 16 years prior to the onset of vomiting.5,7
The major CHS features that suggest the diagnosis are severe cyclic nausea and vomiting, relief of symptoms with abstinence from cannabis, temporary symptom relief with hot bathing, abdominal pain, and at least weekly use of marijuana. Other supportive features include aged < 50 years, weight loss > 5 kg, symptoms that are worse in the morning, normal bowel habits, and negative evaluation, including laboratory, radiography, and endoscopy (Table).5
Treatment often is supportive with emphasis placed on marijuana cessation. Intravenous fluids often are used due to dehydration from the emesis. The use of antiemetics, such as 5-HT3 (eg, ondansetron), D2 (eg, prochlorperazine), H1 (eg, promethazine), or neurokinin-1 receptor antagonists (eg, aprepitant) can be tried, but these therapies often are ineffective. Diet can be advanced as the patient tolerates. Given that many patients are found to have a mild gastritis, H2 blockers or proton pump inhibitors may be used. Extensive counseling on marijuana cessation is needed as it is the only therapy shown to have prolonged relief of the hyperemetic phase.6 The length of cessation from marijuana for resolution of the cyclical hyperemesis varies from 1 to 3 months. Returning to marijuana use often results in the returning of CHS.5
The pathophysiology of CHS is largely unknown; however, there are several hypothesized mechanisms. Many theorize that due to the lipophilicity and long half-life of THC, a primary compound in marijuana, it accumulates in the body over time.4,6 It is thought that this accumulation may cause toxicity in both the gastrointestinal tract as well as in the brain. Central effects on the hypothalamic-pituitary axis may play a major role, and the reason for the symptom relief of hot baths is due to a change in thermoregulation in the hypothalamus.5 One interesting mechanism relates to CB1 receptor activation and vasodilation within the gastrointestinal tract due to chronic THC accumulation. The relief of the abdominal pain, nausea, and vomiting with hot showers can be secondary to the vasodilation of the skin, causing a redistribution from the gut. This theorized mechanism has been referred to as “cutaneous steal.”9
Conclusion
With the increased prevalence of marijuana use in the U.S. over the past decade and reform in legislation taking place over the next couple of years, it is increasingly important to be able to recognize CHS to avoid frequent hospital utilization and repeated costly evaluations. Cannabinoid hyperemesis syndrome is recognized by the triad of chronic cannabis use, cyclical hyperemesis, and compulsive hot bathing.4
The syndrome has 3 phases. In the prodromal phase the patient has morning predominance of nausea, usually without emesis. This is followed by the hyperemesis phase, which is characterized by hyperemesis, vague abdominal pain, and learned compulsive hot bathing.
The third phase is the recovery phase, which is a return to normal behavior. During the recovery phase, if patients cease marijuana use, they remain asymptomatic; however, if patients continue to use marijuana, they often have recurrence of the hyperemesis phase.5 The diagnosis of cannabinoid hyperemesis syndrome is difficult as it is a diagnosis of exclusion. Patients may present to the ED many times prior to diagnosis. With the changing climate of marijuana laws, it is an important condition to consider when establishing a differential. More studies will be required to evaluate the overall prevalence of this condition as well as if there are any changes following the liberalization of marijuana laws in many states.
1. Azofeifa A, Mattson ME, Schauer G, McAfee T, Grant A, Lyerla R. National estimates of marijuana use and related indicators - National Survey on Drug Use and Health, United States, 2002-2014. MMWR Surveill Summ. 2016;65(11):1-28.
2. Kim HS, Anderson JD, Saghafi O, Heard KJ, Monte AA. Cyclic vomiting presentations following marijuana liberalization in Colorado. Acad Emerg Med. 2015;22(6):694-699.
3. National Conference of State Legislatures. State medical marijuana laws. http://www.ncsl.org/research/health/state-medical-marijuana-laws.aspx. Updated July 7, 2017. Accessed August 3, 2017.
4. Allen JH, de Moore GM, Heddle R, Twartz JC. Cannabinoid hyperemesis: cyclical hyperemesis in association with chronic cannabis abuse. Gut. 2004;53(11):1566-1570.
5. Simonetto DA, Oxentenko AS, Herman ML, Szostek JH. Cannabinoid hyperemesis: a case series of 98 patients. Mayo Clin Proc. 2012;87(2):114-119.
6. Galli JA, Sawaya RA, Friedenberg FK. Cannabinoid hyperemesis syndrome. Curr Drug Abuse Rev. 2011;4(4):241-249.
7. Soriano-Co M, Batke M, Cappell MS. The cannabis hyperemesis syndrome characterized by persistent nausea and vomiting, abdominal pain, and compulsive bathing associated with chronic marijuana use: a report of eight cases in the United States. Dig Dis Sci. 2010;55(11):3113-3119.
8. Sontineni SP, Chaudhary S, Sontineni V, Lanspa SJ. Cannabinoid hyperemesis syndrome: clinical diagnosis of an underrecognised manifestation of chronic cannabis abuse. World J Gastroenterol. 2009;15(10):1264-1266.
9. Patterson DA, Smith E, Monahan M, et al. Cannabinoid hyperemesis and compulsive bathing: a case series and paradoxical pathophysiological explanation. J Am Board Fam Med. 2010;23(6):790-793
Multiple Comorbidities: Does Age Matter?
The stereotype of someone with multiple comorbid conditions (MCCs) is an older, often overweight person. But according to an analysis of data from > 200,000 respondents in the 2015 Behavioral Risk Factor Surveillance System (BRFSS), people aged < 65 years are more likely to report MCCs, such as asthma, cognitive impairment, depression, smoking, obesity, disability, and lower quality of life (QOL). In fact, research indicates that most people with MCCs are of working age.
The study compared 2 groups of adults with MCCs: those aged > 65 years with those aged < 65 years. The researchers found significant differences by age group in 18 measures, suggesting that adults aged < 65 years were “worse off” compared with those aged > 65 years. Results were similar regardless of whether diabetes, depression, hypertension, and high cholesterol were included.
Other results from BRFSS data have shown that people with ≥ 3 chronic conditions are more likely to report poor QOL than those with fewer conditions. But that analysis did not compare age groups, the researchers say. In this study, most uninsured adults were aged < 65 years, and the younger adults with MCCs were more likely to report a cost barrier to health care. They also were less likely to report a recent routine check-up. According to the study. these are important findings because managing and treating existing chronic conditions and diagnosing incident ones are key to preventing worse health in the future. The younger cohort had lower levels of well-recognized risk factors—diabetes, hypertension, high cholesterol—than the older, but their levels were still high enough to be concerning.
A “somewhat unexpected” finding was that the younger group had a high rate of cognitive impairment. That could be the result of lack of sleep, side effects of medication, or use of illicit drugs, the researcher notes, and may not be associated with future risk of dementia. Whatever the cause, though, the researcher adds that being cognitively impaired can affect someone’s ability to manage other chronic conditions.
Do Bedside Visual Tools Improve Patient and Caregiver Satisfaction? A Systematic Review of the Literature
Patient satisfaction with medical care during hospitalization is a common quality metric.1,2 Studies showing higher patient satisfaction have reported lower 30-day hospital readmissions3 and improved overall health.4,5 Conversely, communication failures are associated with dissatisfaction among hospitalized patients and adverse outcomes.6,7 A lack of familiarity with hospital providers weakens collaborative decision making and prevents high-quality patient care.8,9
Bedside visual tools, such as whiteboards and pictures of medical staff, have been widely used to enhance communication between patients, families, and providers.10,11 Results of studies evaluating these tools are varied. For example, 1 study found that 98% of patients were better able to identify physicians when their names were written on whiteboards.12 Yet in another, only 21.1% of patients were more likely to correctly identify ≥1 physicians using pictures.13 Thus, despite widespread use,11 whether visual tools improve patient satisfaction and patient care more broadly remains unclear.14,15
We performed a systematic review to answer the following 3 questions: first, what is the effect of visual tools on outcomes (ie, provider identification, understanding of providers’ roles, patient–provider communication, and satisfaction); second, does impact vary by type of visual tool (eg, whiteboards vs pictures of providers); and third, what factors (eg, study design, patient population) are associated with provider identification, communication, and patient satisfaction?
METHODS
Search Strategy
We used the Preferred Reporting Items for Systematic Reviews and Meta-Analysis when performing this review.16 A research librarian (WT) conducted serial searches for studies reporting the use of bedside visual tools for hospitalized patients in Medline (via OVID), Embase, SCOPUS, Web of Science, CINAHL, and Cochrane DSR and CENTRAL. Controlled vocabularies (ie, Medical Subject Headings terms) were used to identify synonyms for visual tools of interest. Additional studies were identified manually through bibliographies and meeting abstracts. No study design, publication date, or language restrictions were placed on the search, which was conducted between April 2016 and February 2017 (see supplementary Appendix A).
Study Selection
Two reviewers (AG and KT) independently assessed study eligibility; discrepancies were resolved by a third reviewer (VC). We included all adult or pediatric English language studies in which the effect of visual tool(s) on patient outcomes was reported. Visual tools were defined as the bedside display of information or an instrument given to patients to convey information regarding providers or medical care. Patient-reported outcomes included the following: (a) physician identification, (b) understanding of provider roles, (c) patient–provider communication, and (d) patient satisfaction with care. Providers were defined as physicians, residents, interns, medical students, nurse practitioners, or nurses. We excluded studies that were not original research (eg, conference abstracts, not peer reviewed), reported qualitative data without quantitative outcomes, or did not include a bedside visual tool. Given our interest in hospitalized general medicine patients, studies conducted in emergency departments, surgical units, obstetrics and gynecology wards, and intensive care units were excluded.
Data Extraction and Analysis
Data were extracted independently and in duplicate from all studies by using a template adapted from the Cochrane Collaboration.17 For all studies, we abstracted study design, type of visual tool (eg, whiteboards), unit setting (eg, medical), population studied (eg, adult vs pediatric), and outcomes reported (ie, physician identification, understanding of provider roles, communication, and satisfaction with care). Reviewers independently assessed and categorized the impact of tools on reported outcomes.
To standardize and compare outcomes across studies, the following were used to denote a positive association between visual tools and relevant outcomes: a greater number of physicians correctly identified by name/picture or title/role; the use of terms such as “high,” “agreed,” or “significant” on surveys; or ≥4 Likert scores for domains of identification, understanding of roles, communication, and satisfaction with care. Conversely, the inability to identify providers compared to the control/baseline; poor recall of titles/roles; lower Likert-scale scores (ie, ≤2); or survey terms such as “poor,” “disagreed,” or “insignificant” were considered to connote negative impact. Studies in which Likert scores were rated neither high nor low (ie, 3), or in which patients neither agreed nor disagreed on value were considered neutral.
Owing to clinical heterogeneity within studies, meta-analyses were not performed. Descriptive statistics were used to describe study outcomes. A priori18 studies were evaluated according to the following categories: design (eg, randomized vs observational), outcomes (eg, patient satisfaction), intervention (type of visual tool), and patient population (adult or pediatric). Because pediatric patients have underdeveloped communication skills and include parents and/or guardians, data from pediatric studies were tabulated and reported separately to those from adult studies.
Quality Assessment
As recommended by the Cochrane Collaboration, 2 reviewers (AG, KT) assessed the risk of study bias by using the Downs and Black Scale.17,19 Discrepancies in assessment were resolved by a third reviewer (VC). This instrument uses a point-based system to estimate the quality of a study by rating domains such as internal and external validity, bias, and confounding. In keeping with prior systematic reviews,18,20,21 studies with a score of ≥18 were considered high quality. Interrater agreement for the adjudication of study quality was calculated using the Cohen κ statistic.
RESULTS
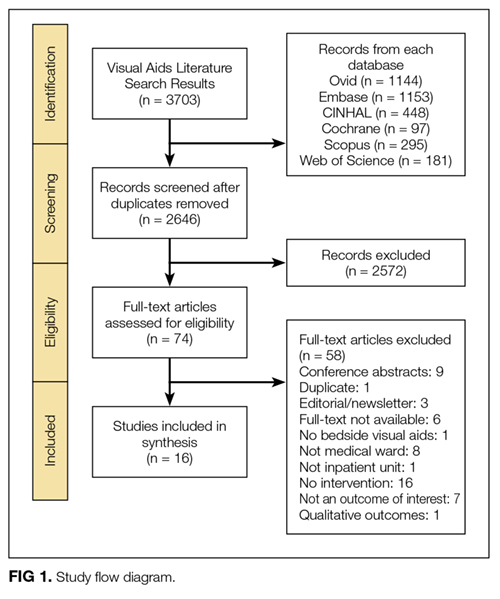


STUDIES OF ADULT HOSPITALIZED PATIENTS
Eleven studies were conducted on adult hospitalized patients 12-14,22-24,26,27,29,30,33 and included 3 randomized controlled studies.14,27,33
Results by Outcomes Provider Identification Nine studies measured patients’ ability to identify providers with the use of visual aids, and all 9 reported improvements in this outcome. Visual tools used to measure provider identification included pictures (n = 5),13,14,23,27,33 whiteboards (n = 3),12,22,30 and patient portals (n = 1).26 Within studies that used pictures, individual pictures (n = 2)13,23 and handouts with pictures of multiple providers (n = 3) were used.14,27,33 In 2 studies, care team members such as a dietitian, physiotherapist or pharmacist, were included when measuring identification.14,33
Understanding Providers’ RolesSix studies assessed the effect of visual tools on patients’ understanding of provider roles.13,14,22,26,27,33 Four studies reported a positive effect with the use of pictures,27,33 whiteboards,22 and patient portals.26 However, 2 studies reported either no difference or negative impressions. Appel et al.14 reported no difference in the understanding of physician roles using a handout of providers’ pictures and titles. Arora et al.13 used individual pictures of physicians with descriptions of roles and found a negative association, as demonstrated by fewer patients rating their understanding of physicians’ roles as excellent or very good in the intervention period (45.6%) compared with the baseline (55.3%).
Patient–Provider Communication
Three studies evaluated the influence of visual tools on communication.14,24,29 Using pictures, Appel et al.14 found no difference in the perceived quality of communication. Singh et al.29 used whiteboards and reported improved communication scores for physicians and nurses. With notepads, patients surveyed by Farberg et al.24 stated that the tool improved provider communication.
Patient Satisfaction
Five studies assessed patient satisfaction related to the use of visual tools. 22,23,27,30,33 One study reported satisfaction as positive with the use of individual pictures.23 Two studies that used handouts with pictures of all team members reported either a positive33 or neutral27 impact on satisfaction. Studies that used whiteboards reported a positive association with satisfaction22,30 despite differences in content, such as the inclusion of prewritten prompts for writing goals of care and scheduled tests30 versus the name of the nurse and their education level.22
Results by Type of Visual Tool Pictures
Five studies that used pictures reported a positive effect on provider identification.13,14,23,27,33 Two27,33 of 4 studies13,14,27,33 that assessed patients’ understanding of team member roles reported a positive influence, while 1 reported no difference.14 A fourth study demonstrated a negative association, perhaps due to differences in the description of providers’ roles listed on the tool.13 Only 1 study examined the influence of pictures on patient–provider communication, and this study found no difference.14 Satisfaction with care via the use of pictures varied between positive (2 studies)23,33 and neutral (1 study).27
Whiteboards
Four studies tested the use of whiteboards; of these, 3 reported a positive influence on provider identification.12,22,30 One study reported a positive impact on patient–provider communication.29 Two studies noted a positive effect on patient satisfaction.22,30 Notably, the responsibility for updating whiteboards differed between the studies (ie, nurses only22 vs residents, medical students, and nurses).30
Patient Portal
In 1 study, an electronic portal that included names with pictures of providers, descriptions of their roles, lists of medications, and scheduled tests and/or procedures was used as a visual tool. The portal improved patients’ identification of physicians and patients’ understanding of roles. However, improvements in the knowledge of medication changes and planned tests and/or procedures during hospitalization were not observed.26 This finding would suggest limitations in the hospitalized patient’s knowledge of the plan of care, which could potentially weaken patient–provider communication.
Notepads
Only 1 study assessed the use of formatted notepads on patient–provider communication and noted a positive association. Notepads used prompts for different categories (eg, diagnosis/treatment, medications, etc) to encourage patient questions for providers.24
STUDIES OF PEDIATRIC HOSPITALIZED PATIENTS
Five studies were conducted on hospitalized pediatric units.15,25,28,31,32 All studies surveyed the parents, guardians, or caregivers of pediatric patients. One study excluded patients ≥12 years of age because of legal differences in access to adolescent health information,32 while another interviewed parents and/or guardians of teenagers.15
Results by Outcomes Provider Identification and Understanding of Physicians’ Roles
Four studies that assessed the influence of visual tools on provider identification and understanding of roles reported a positive association.15,25,28,31 Visual tools varied between pictures (n = 2),15,31 patient portal (n = 1),28 and whiteboards and pictures combined (n = 1).25 The measurement of outcomes varied between surveys with free text responses,28 multiple choice questions,25 and 1-5 Likert scales.15,31
Patient–Provider Communication
Two studies assessed the impact of patient portal use on communication and reported a positive association.28,32 The 2 portals autopopulated names, pictures, and roles of providers from electronic medical records. Singh et al.28 used a portal that was also available in Spanish and accommodated for non-English speakers. Kelly et al.32 reported that 90% of parents perceived that portal use was associated with reduced errors in care, with 8% finding errors in their child’s medication list.
Patient Satisfaction
Three studies assessed patient satisfaction via the use of visual tools.15,28,31 Singh et al.28 noted a positive influence on satisfaction via a patient portal. Dudas et al.15 used a single-page handout with names and pictures of each provider, along with information regarding the training and roles of each provider. Distribution of these handouts to patients by investigators led to a positive influence on satisfaction. While Unaka et al.31 used a similar handout, they asked residents to distribute them and found no significant difference in satisfaction scores between the intervention (66%) and control group (62%).
Results by Type of Visual Tool Pictures
Two studies reported a positive impact on provider identification and understanding of roles with the use of pictures.15,31 Dudas et al.15 demonstrated a 4.8-fold increase in the odds of parents identifying a medical student, as compared with the control. Similarly, after adjusting for length of stay and prior hospitalization, Unaka et al.31 reported that a higher percentage of patients correctly identified providers using this approach.
Whiteboard and Picture
One study evaluated the simultaneous use of whiteboards and pictures to improve the identification of providers. The study noted improved identification of supervising doctors and increased recognition of roles for supervising doctors, residents, and medical students.25
Patient Portal
Two studies used patient portals as visual tools. Singh et al.28 assessed the use of a patient portal with names, roles, and pictures of treatment team members. Use of this tool was positively associated with provider identification, understanding of roles, communication, and satisfaction. Kelly et al.32 noted that 60% of parents felt that portal use improved healthcare team communication.
RISK OF STUDY BIAS
The risk of bias was assessed for both adult and pediatric studies in aggregate. The average risk of bias using the Downs and Black Scale was 17.81 (range 14-22, standard deviation [SD] 2.20). Of the 16 included studies, 9 were rated at a low risk of bias (score
- >
18).13-15,26-31 Risk of bias was greatest for measures of external validity (mean 2.88, range 2-3, SD 0.34), internal validity (mean 4.06, range 3-6, SD 1.00), and confounding (mean 2.69, range 1-6, SD 1.35). Two of 3 randomized controlled trials had a low risk of bias.14,27 Interrater reliability for study quality adjudication was 0.90, suggesting excellent agreement (see supplementary Appendix B).
DISCUSSION
In this systematic review, the effects of visual tools on outcomes, such as provider identification, understanding of roles, patient–provider communication, and satisfaction with care, were variable. The majority of included studies were conducted on adult patients (n = 11).12-14,22-24,26,27,29,30,33 Pictures were the most frequently used tool (n = 7)13-15,23,27,31,33 and consequently had the greatest sample size across the review (n = 1297). While pictures had a positive influence on provider identification in all studies, comprehension of provider roles and satisfaction were variable. Although the content of whiteboards varied between studies, they showed favorable effects on provider identification (3 of 4 studies)12,22,30 and satisfaction (2 of 2 studies).22,30 While electronic medical record-based tools had a positive influence on outcomes,26,28 only 1 accounted for language preferences.28 Formatted notepads positively influenced patient–provider communication, but their use was limited by literacy.24 Collectively, these data suggest that visual tools have varying effects on patient-reported outcomes, likely owing to differences in study design, interventions, and evaluation methods.
Theoretically, visual tools should facilitate easier identification of providers and engender collaborative relationships. However, such tools do not replace face-to-face patient–provider and family discussions. Rather, these enhancements best serve as a medium to asynchronously display information to patients and family members. Indeed, within the included studies, we found that the use of visual tools was effective in improving satisfaction (6/8 studies), identification (13/13 studies), and understanding of provider roles (8/10 studies). Thus, it is reasonable to say that, in conjunction with excellent clinical care, these tools have an important role in improving care delivery in the hospital.
Despite this promise, we noted that the effectiveness of individual tools varied, a fact that may relate to differences across studies. First, inconsistencies in the format and/or content of the tools were noted. For example, within studies using pictures, tools varied from individual photographs of each team member13,23 to 1-page handouts with pictures of all team members.14,15,31 Such differences in presentation could affect spatial recognition in identifying providers, as single photos are known to be easier to process than multiple images at the same time.34 Second, no study evaluated patient preference of a visual tool. Thus, personal preferences for pictures versus whiteboards versus electronic modalities or a combination of tools might affect outcomes. Additionally, the utility of visual tools in visually impaired, confused, or non-English-speaking patients may limit effectiveness. Future studies that address these aspects and account for patient preferences may better elucidate the role of visual tools in hospitals.
Our results should be considered in the context of several limitations. First, only 3 studies used randomized trial designs; thus, confounding from unmeasured variables inherent to observational designs is possible. Second, none of the interventions tested were blinded to providers, raising the possibility of a Hawthorne effect (ie, alteration of provider behavior in response to awareness of being observed).35 Third, all studies were conducted at single centers, and only 9 of 16 studies were rated at a low risk of bias; thus, caution in broad extrapolations of this literature is necessary.
However, our study has several strengths, including a thorough search of heterogeneous literature, inclusion of both adult and pediatric populations, and a focus on myriad patient-reported outcomes. Second, by contrasting outcomes and measurement strategies across studies, our review helps explicate differences in results related to variation in outcome measurement or presentation of visual data. Third, because we frame results by outcome and type of visual tool used, we are able to identify strengths and weaknesses of individual tools in novel ways. Finally, our data suggest that the use of picture-based techniques and whiteboards are among the most promising visual interventions. Future studies that pair graphic designers with patients to improve the layout of these tools might prove valuable. Additionally, because the measurement of outcomes is confounded by aspects such as lack of controls, severity of illness, and language barriers, a randomized design would help provide greater clarity regarding effectiveness.
In conclusion, we found that visual tools appear to foster recognition of providers and understanding of their roles. However, variability of format, content, and measurement of outcomes hinders the identification of a single optimal approach. Future work using randomized controlled trial designs and standardized tools and measurements would be welcomed.
Acknowledgments
The authors thank Laura Appel, Kevin O’Leary, and Siddharth Singh for providing unpublished data and clarifications to help these analyses.
Disclosure
Anupama Goyal is the guarantor. Anupama Goyal and Komalpreet Tur performed primary data abstraction and analysis. Anupama Goyal, Scott Flanders, Jason Mann, and Vineet Chopra drafted the manuscript. All authors contributed to the development of the selection criteria, the risk of bias assessment strategy, and the data extraction criteria. Anupama Goyal, Jason Mann, Whitney Townsend, and Vineet Chopra developed the search strategy. Vineet Chopra provided systematic review expertise. All authors read, provided feedback, and approved the final manuscript. The authors declare that they have no conflicts of interest.
1. Berwick DM. A user’s manual for the IOM’s ‘Quality Chasm’ report. Health Aff (Millwood). 2002;21(3):80-90. PubMed
2. Jha AK, Orav EJ, Zheng J, Epstein AM. Patients’ perception of hospital care in the United States. N Engl J Med. 2008;359(18):1921-1931. PubMed
3. Boulding W, Glickman SW, Manary MP, Schulman KA, Staelin R. Relationship between patient satisfaction with inpatient care and hospital readmission within 30 days. Am J Manag Care. 2011;17(1):41-48. PubMed
4. Little P, Everitt H, Williamson I, et al. Observational study of effect of patient centredness and positive approach on outcomes of general practice consultations. BMJ. 2001;323(7318):908-911. PubMed
5. Stewart MA. Effective physician-patient communication and health outcomes: a review. CMAJ. 1995;152(9):1422-1433. PubMed
6. Arora V, Johnson J, Lovinger D, Humphrey HJ, Meltzer DO. Communication failures in patient sign-out and suggestions for improvement: a critical incident analysis. Qual Saf Health Care. 2005;14(6):401-407. PubMed
7. Leonard M, Graham S, Bonacum D. The human factor: the critical importance of effective teamwork and communication in providing safe care. Qual Saf Health Care. 2004;13 Suppl 1:i85-i90. PubMed
8. Alam M, Lee A, Ibrahimi OA, et al. A multistep approach to improving biopsy site identification in dermatology: physician, staff, and patient roles based on a Delphi consensus. JAMA Dermatol. 2014;150(5):550-558. PubMed
9. Arora V, Gangireddy S, Mehrotra A, Ginde R, Tormey M, Meltzer D. Ability of hospitalized patients to identify their in-hospital physicians. Arch Intern Med. 2009;169(2):199-201. PubMed
10. Makaryus AN, Friedman EA. Does your patient know your name? An approach to enhancing patients’ awareness of their caretaker’s name. J Healthc Qual. 2005;27(4):53-56. PubMed
11. Sehgal NL, Green A, Vidyarthi AR, Blegen MA, Wachter RM. Patient whiteboards as a communication tool in the hospital setting: a survey of practices and recommendations. J Hosp Med. 2010;5(4):234-239. PubMed
12. Maniaci MJ, Heckman MG, Dawson NL. Increasing a patient’s ability to identify his or her attending physician using a patient room display. Arch Intern Med. 2010;170:1084-1085. PubMed
13. Arora VM, Schaninger C, D’Arcy M, et al. Improving inpatients’ identification of their doctors: Use of FACE™ cards. Jt Comm J Qual Patient Saf. 2009;35(12):613-619. PubMed
14. Appel L, Abrams H, Morra D, Wu RC. Put a face to a name: a randomized controlled trial evaluating the impact of providing clinician photographs on inpatients’ recall. Am J Med. 2015;128(1):82-89. PubMed
15. Dudas RA, Lemerman H, Barone M, Serwint JR. PHACES (Photographs of Academic Clinicians and Their Educational Status): a tool to improve delivery of family-centered care. Acad Pediatr. 2010;10(2):138-145. PubMed
16. Moher D, Liberati A, Tetzlaff J, Altman DG, PRISMA Group. Preferred reporting items for systematic reviews and meta-analyses: the PRISMA statement. Ann Intern Med. 2009;151(4):264-269. PubMed
17. Higgins JP, Green S, editors. Cochrane handbook for systematic reviews of interventions. West Sussex, UK: The Cochrane Collaboration and Wiley Online Library; 2008.
18. Petrilli CM, Mack M, Petrilli JJ, Hickner A, Saint S, Chopra V. Understanding the role of physician attire on patient perceptions: a systematic review of the literature—targeting attire to improve likelihood of rapport (TAILOR) investigators. BMJ Open. 2015;5(1):e006578. PubMed
19. Downs SH, Black N. The feasibility of creating a checklist for the assessment of the methodological quality both of randomised and non-randomised studies of health care interventions. J Epidemiol Community Health. 1998;52(6):377-384. PubMed
20. Seyffert M, Lagisetty P, Landgraf J, et al. Internet-delivered cognitive behavioral therapy to treat insomnia: a systematic review and meta-analysis. PLoS One. 2016;11(2):e0149139. PubMed
21. Patel R, Chang T, Greysen SR, Chopra V. Social media use in chronic disease: a systematic review and novel taxonomy. Am J Med. 2015;128(12):1335-1350. PubMed
22. Carlin BJ. Using whiteboards: fixed identities. Am J Nurs. 2008;108(11):72A-72B, 72D-72E. PubMed
23. Francis JJ, Pankratz VS, Huddleston JM. Patient satisfaction associated with correct identification of physician’s photographs. Mayo Clin Proc. 2001;76(6):604-608. PubMed
24. Farberg AS, Lin AM, Kuhn L, Flanders SA, Kim CS. Dear Doctor: a tool to facilitate patient-centered communication. J Hosp Med. 2013;8(10):553-558. PubMed
25. Hayes RM, Wickline A, Hensley C, et al. A quality improvement project to improve family recognition of medical team member roles. Hosp Pediatr. 2015;5(9):480-486. PubMed
26. O’Leary KJ, Lohman ME, Culver E, Killarney A, Randy Smith G Jr, Liebovitz DM. The effect of tablet computers with a mobile patient portal application on hospitalized patients’ knowledge and activation. J Am Med Inform Assoc. 2016;23(1):159-165. PubMed
27. Simons Y, Caprio T, Furiasse N, Kriss M, Williams MV, O’Leary KJ. The impact of facecards on patients’ knowledge, satisfaction, trust, and agreement with hospital physicians: a pilot study. J Hosp Med. 2014;9(3):137-141. PubMed
28. Singh A, Rhee KE, Brennan JJ, Kuelbs C, El-Kareh R, Fisher ES. Who’s my doctor? Using an electronic tool to improve team member identification on an inpatient pediatrics team. Hosp Pediatr. 2016;6(3):157-165. PubMed
29. Singh S, Fletcher KE, Pandl GJ, et al. It’s the writing on the wall: whiteboards improve inpatient satisfaction with provider communication. Am J Med Qual. 2011;26(2):127-131. PubMed
30. Tan M, Hooper Evans K, Braddock CH 3rd, Shieh L. Patient whiteboards to improve patient-centred care in the hospital. Postgrad Med J. 2013;89(1056):604-609. PubMed
31. Unaka NI, White CM, Sucharew HJ, Yau C, Clark SL, Brady PW. Effect of a face sheet tool on medical team provider identification and family satisfaction. J Hosp Med. 2014;9(3):186-188. PubMed
32. Kelly MM, Hoonakker PL, Dean SM. Using an inpatient portal to engage families in pediatric hospital care. J Am Med Inform Assoc. 2017;24(1):153-161. PubMed
33. Brener MI, Epstein JA, Cho J, Yeh HC, Dudas RA, Feldman L. Faces of all clinically engaged staff: a quality improvement project that enhances the hospitalised patient experience. Int J Clin Pract. 2016;70(11):923-929. PubMed
34. De Valois RL, De Valois KK. Spatial vision. Annu Rev Psychol. 1980;31:309-341. PubMed
Patient satisfaction with medical care during hospitalization is a common quality metric.1,2 Studies showing higher patient satisfaction have reported lower 30-day hospital readmissions3 and improved overall health.4,5 Conversely, communication failures are associated with dissatisfaction among hospitalized patients and adverse outcomes.6,7 A lack of familiarity with hospital providers weakens collaborative decision making and prevents high-quality patient care.8,9
Bedside visual tools, such as whiteboards and pictures of medical staff, have been widely used to enhance communication between patients, families, and providers.10,11 Results of studies evaluating these tools are varied. For example, 1 study found that 98% of patients were better able to identify physicians when their names were written on whiteboards.12 Yet in another, only 21.1% of patients were more likely to correctly identify ≥1 physicians using pictures.13 Thus, despite widespread use,11 whether visual tools improve patient satisfaction and patient care more broadly remains unclear.14,15
We performed a systematic review to answer the following 3 questions: first, what is the effect of visual tools on outcomes (ie, provider identification, understanding of providers’ roles, patient–provider communication, and satisfaction); second, does impact vary by type of visual tool (eg, whiteboards vs pictures of providers); and third, what factors (eg, study design, patient population) are associated with provider identification, communication, and patient satisfaction?
METHODS
Search Strategy
We used the Preferred Reporting Items for Systematic Reviews and Meta-Analysis when performing this review.16 A research librarian (WT) conducted serial searches for studies reporting the use of bedside visual tools for hospitalized patients in Medline (via OVID), Embase, SCOPUS, Web of Science, CINAHL, and Cochrane DSR and CENTRAL. Controlled vocabularies (ie, Medical Subject Headings terms) were used to identify synonyms for visual tools of interest. Additional studies were identified manually through bibliographies and meeting abstracts. No study design, publication date, or language restrictions were placed on the search, which was conducted between April 2016 and February 2017 (see supplementary Appendix A).
Study Selection
Two reviewers (AG and KT) independently assessed study eligibility; discrepancies were resolved by a third reviewer (VC). We included all adult or pediatric English language studies in which the effect of visual tool(s) on patient outcomes was reported. Visual tools were defined as the bedside display of information or an instrument given to patients to convey information regarding providers or medical care. Patient-reported outcomes included the following: (a) physician identification, (b) understanding of provider roles, (c) patient–provider communication, and (d) patient satisfaction with care. Providers were defined as physicians, residents, interns, medical students, nurse practitioners, or nurses. We excluded studies that were not original research (eg, conference abstracts, not peer reviewed), reported qualitative data without quantitative outcomes, or did not include a bedside visual tool. Given our interest in hospitalized general medicine patients, studies conducted in emergency departments, surgical units, obstetrics and gynecology wards, and intensive care units were excluded.
Data Extraction and Analysis
Data were extracted independently and in duplicate from all studies by using a template adapted from the Cochrane Collaboration.17 For all studies, we abstracted study design, type of visual tool (eg, whiteboards), unit setting (eg, medical), population studied (eg, adult vs pediatric), and outcomes reported (ie, physician identification, understanding of provider roles, communication, and satisfaction with care). Reviewers independently assessed and categorized the impact of tools on reported outcomes.
To standardize and compare outcomes across studies, the following were used to denote a positive association between visual tools and relevant outcomes: a greater number of physicians correctly identified by name/picture or title/role; the use of terms such as “high,” “agreed,” or “significant” on surveys; or ≥4 Likert scores for domains of identification, understanding of roles, communication, and satisfaction with care. Conversely, the inability to identify providers compared to the control/baseline; poor recall of titles/roles; lower Likert-scale scores (ie, ≤2); or survey terms such as “poor,” “disagreed,” or “insignificant” were considered to connote negative impact. Studies in which Likert scores were rated neither high nor low (ie, 3), or in which patients neither agreed nor disagreed on value were considered neutral.
Owing to clinical heterogeneity within studies, meta-analyses were not performed. Descriptive statistics were used to describe study outcomes. A priori18 studies were evaluated according to the following categories: design (eg, randomized vs observational), outcomes (eg, patient satisfaction), intervention (type of visual tool), and patient population (adult or pediatric). Because pediatric patients have underdeveloped communication skills and include parents and/or guardians, data from pediatric studies were tabulated and reported separately to those from adult studies.
Quality Assessment
As recommended by the Cochrane Collaboration, 2 reviewers (AG, KT) assessed the risk of study bias by using the Downs and Black Scale.17,19 Discrepancies in assessment were resolved by a third reviewer (VC). This instrument uses a point-based system to estimate the quality of a study by rating domains such as internal and external validity, bias, and confounding. In keeping with prior systematic reviews,18,20,21 studies with a score of ≥18 were considered high quality. Interrater agreement for the adjudication of study quality was calculated using the Cohen κ statistic.
RESULTS
STUDIES OF ADULT HOSPITALIZED PATIENTS
Eleven studies were conducted on adult hospitalized patients 12-14,22-24,26,27,29,30,33 and included 3 randomized controlled studies.14,27,33
Results by Outcomes Provider Identification Nine studies measured patients’ ability to identify providers with the use of visual aids, and all 9 reported improvements in this outcome. Visual tools used to measure provider identification included pictures (n = 5),13,14,23,27,33 whiteboards (n = 3),12,22,30 and patient portals (n = 1).26 Within studies that used pictures, individual pictures (n = 2)13,23 and handouts with pictures of multiple providers (n = 3) were used.14,27,33 In 2 studies, care team members such as a dietitian, physiotherapist or pharmacist, were included when measuring identification.14,33
Understanding Providers’ RolesSix studies assessed the effect of visual tools on patients’ understanding of provider roles.13,14,22,26,27,33 Four studies reported a positive effect with the use of pictures,27,33 whiteboards,22 and patient portals.26 However, 2 studies reported either no difference or negative impressions. Appel et al.14 reported no difference in the understanding of physician roles using a handout of providers’ pictures and titles. Arora et al.13 used individual pictures of physicians with descriptions of roles and found a negative association, as demonstrated by fewer patients rating their understanding of physicians’ roles as excellent or very good in the intervention period (45.6%) compared with the baseline (55.3%).
Patient–Provider Communication
Three studies evaluated the influence of visual tools on communication.14,24,29 Using pictures, Appel et al.14 found no difference in the perceived quality of communication. Singh et al.29 used whiteboards and reported improved communication scores for physicians and nurses. With notepads, patients surveyed by Farberg et al.24 stated that the tool improved provider communication.
Patient Satisfaction
Five studies assessed patient satisfaction related to the use of visual tools. 22,23,27,30,33 One study reported satisfaction as positive with the use of individual pictures.23 Two studies that used handouts with pictures of all team members reported either a positive33 or neutral27 impact on satisfaction. Studies that used whiteboards reported a positive association with satisfaction22,30 despite differences in content, such as the inclusion of prewritten prompts for writing goals of care and scheduled tests30 versus the name of the nurse and their education level.22
Results by Type of Visual Tool Pictures
Five studies that used pictures reported a positive effect on provider identification.13,14,23,27,33 Two27,33 of 4 studies13,14,27,33 that assessed patients’ understanding of team member roles reported a positive influence, while 1 reported no difference.14 A fourth study demonstrated a negative association, perhaps due to differences in the description of providers’ roles listed on the tool.13 Only 1 study examined the influence of pictures on patient–provider communication, and this study found no difference.14 Satisfaction with care via the use of pictures varied between positive (2 studies)23,33 and neutral (1 study).27
Whiteboards
Four studies tested the use of whiteboards; of these, 3 reported a positive influence on provider identification.12,22,30 One study reported a positive impact on patient–provider communication.29 Two studies noted a positive effect on patient satisfaction.22,30 Notably, the responsibility for updating whiteboards differed between the studies (ie, nurses only22 vs residents, medical students, and nurses).30
Patient Portal
In 1 study, an electronic portal that included names with pictures of providers, descriptions of their roles, lists of medications, and scheduled tests and/or procedures was used as a visual tool. The portal improved patients’ identification of physicians and patients’ understanding of roles. However, improvements in the knowledge of medication changes and planned tests and/or procedures during hospitalization were not observed.26 This finding would suggest limitations in the hospitalized patient’s knowledge of the plan of care, which could potentially weaken patient–provider communication.
Notepads
Only 1 study assessed the use of formatted notepads on patient–provider communication and noted a positive association. Notepads used prompts for different categories (eg, diagnosis/treatment, medications, etc) to encourage patient questions for providers.24
STUDIES OF PEDIATRIC HOSPITALIZED PATIENTS
Five studies were conducted on hospitalized pediatric units.15,25,28,31,32 All studies surveyed the parents, guardians, or caregivers of pediatric patients. One study excluded patients ≥12 years of age because of legal differences in access to adolescent health information,32 while another interviewed parents and/or guardians of teenagers.15
Results by Outcomes Provider Identification and Understanding of Physicians’ Roles
Four studies that assessed the influence of visual tools on provider identification and understanding of roles reported a positive association.15,25,28,31 Visual tools varied between pictures (n = 2),15,31 patient portal (n = 1),28 and whiteboards and pictures combined (n = 1).25 The measurement of outcomes varied between surveys with free text responses,28 multiple choice questions,25 and 1-5 Likert scales.15,31
Patient–Provider Communication
Two studies assessed the impact of patient portal use on communication and reported a positive association.28,32 The 2 portals autopopulated names, pictures, and roles of providers from electronic medical records. Singh et al.28 used a portal that was also available in Spanish and accommodated for non-English speakers. Kelly et al.32 reported that 90% of parents perceived that portal use was associated with reduced errors in care, with 8% finding errors in their child’s medication list.
Patient Satisfaction
Three studies assessed patient satisfaction via the use of visual tools.15,28,31 Singh et al.28 noted a positive influence on satisfaction via a patient portal. Dudas et al.15 used a single-page handout with names and pictures of each provider, along with information regarding the training and roles of each provider. Distribution of these handouts to patients by investigators led to a positive influence on satisfaction. While Unaka et al.31 used a similar handout, they asked residents to distribute them and found no significant difference in satisfaction scores between the intervention (66%) and control group (62%).
Results by Type of Visual Tool Pictures
Two studies reported a positive impact on provider identification and understanding of roles with the use of pictures.15,31 Dudas et al.15 demonstrated a 4.8-fold increase in the odds of parents identifying a medical student, as compared with the control. Similarly, after adjusting for length of stay and prior hospitalization, Unaka et al.31 reported that a higher percentage of patients correctly identified providers using this approach.
Whiteboard and Picture
One study evaluated the simultaneous use of whiteboards and pictures to improve the identification of providers. The study noted improved identification of supervising doctors and increased recognition of roles for supervising doctors, residents, and medical students.25
Patient Portal
Two studies used patient portals as visual tools. Singh et al.28 assessed the use of a patient portal with names, roles, and pictures of treatment team members. Use of this tool was positively associated with provider identification, understanding of roles, communication, and satisfaction. Kelly et al.32 noted that 60% of parents felt that portal use improved healthcare team communication.
RISK OF STUDY BIAS
The risk of bias was assessed for both adult and pediatric studies in aggregate. The average risk of bias using the Downs and Black Scale was 17.81 (range 14-22, standard deviation [SD] 2.20). Of the 16 included studies, 9 were rated at a low risk of bias (score
- >
18).13-15,26-31 Risk of bias was greatest for measures of external validity (mean 2.88, range 2-3, SD 0.34), internal validity (mean 4.06, range 3-6, SD 1.00), and confounding (mean 2.69, range 1-6, SD 1.35). Two of 3 randomized controlled trials had a low risk of bias.14,27 Interrater reliability for study quality adjudication was 0.90, suggesting excellent agreement (see supplementary Appendix B).
DISCUSSION
In this systematic review, the effects of visual tools on outcomes, such as provider identification, understanding of roles, patient–provider communication, and satisfaction with care, were variable. The majority of included studies were conducted on adult patients (n = 11).12-14,22-24,26,27,29,30,33 Pictures were the most frequently used tool (n = 7)13-15,23,27,31,33 and consequently had the greatest sample size across the review (n = 1297). While pictures had a positive influence on provider identification in all studies, comprehension of provider roles and satisfaction were variable. Although the content of whiteboards varied between studies, they showed favorable effects on provider identification (3 of 4 studies)12,22,30 and satisfaction (2 of 2 studies).22,30 While electronic medical record-based tools had a positive influence on outcomes,26,28 only 1 accounted for language preferences.28 Formatted notepads positively influenced patient–provider communication, but their use was limited by literacy.24 Collectively, these data suggest that visual tools have varying effects on patient-reported outcomes, likely owing to differences in study design, interventions, and evaluation methods.
Theoretically, visual tools should facilitate easier identification of providers and engender collaborative relationships. However, such tools do not replace face-to-face patient–provider and family discussions. Rather, these enhancements best serve as a medium to asynchronously display information to patients and family members. Indeed, within the included studies, we found that the use of visual tools was effective in improving satisfaction (6/8 studies), identification (13/13 studies), and understanding of provider roles (8/10 studies). Thus, it is reasonable to say that, in conjunction with excellent clinical care, these tools have an important role in improving care delivery in the hospital.
Despite this promise, we noted that the effectiveness of individual tools varied, a fact that may relate to differences across studies. First, inconsistencies in the format and/or content of the tools were noted. For example, within studies using pictures, tools varied from individual photographs of each team member13,23 to 1-page handouts with pictures of all team members.14,15,31 Such differences in presentation could affect spatial recognition in identifying providers, as single photos are known to be easier to process than multiple images at the same time.34 Second, no study evaluated patient preference of a visual tool. Thus, personal preferences for pictures versus whiteboards versus electronic modalities or a combination of tools might affect outcomes. Additionally, the utility of visual tools in visually impaired, confused, or non-English-speaking patients may limit effectiveness. Future studies that address these aspects and account for patient preferences may better elucidate the role of visual tools in hospitals.
Our results should be considered in the context of several limitations. First, only 3 studies used randomized trial designs; thus, confounding from unmeasured variables inherent to observational designs is possible. Second, none of the interventions tested were blinded to providers, raising the possibility of a Hawthorne effect (ie, alteration of provider behavior in response to awareness of being observed).35 Third, all studies were conducted at single centers, and only 9 of 16 studies were rated at a low risk of bias; thus, caution in broad extrapolations of this literature is necessary.
However, our study has several strengths, including a thorough search of heterogeneous literature, inclusion of both adult and pediatric populations, and a focus on myriad patient-reported outcomes. Second, by contrasting outcomes and measurement strategies across studies, our review helps explicate differences in results related to variation in outcome measurement or presentation of visual data. Third, because we frame results by outcome and type of visual tool used, we are able to identify strengths and weaknesses of individual tools in novel ways. Finally, our data suggest that the use of picture-based techniques and whiteboards are among the most promising visual interventions. Future studies that pair graphic designers with patients to improve the layout of these tools might prove valuable. Additionally, because the measurement of outcomes is confounded by aspects such as lack of controls, severity of illness, and language barriers, a randomized design would help provide greater clarity regarding effectiveness.
In conclusion, we found that visual tools appear to foster recognition of providers and understanding of their roles. However, variability of format, content, and measurement of outcomes hinders the identification of a single optimal approach. Future work using randomized controlled trial designs and standardized tools and measurements would be welcomed.
Acknowledgments
The authors thank Laura Appel, Kevin O’Leary, and Siddharth Singh for providing unpublished data and clarifications to help these analyses.
Disclosure
Anupama Goyal is the guarantor. Anupama Goyal and Komalpreet Tur performed primary data abstraction and analysis. Anupama Goyal, Scott Flanders, Jason Mann, and Vineet Chopra drafted the manuscript. All authors contributed to the development of the selection criteria, the risk of bias assessment strategy, and the data extraction criteria. Anupama Goyal, Jason Mann, Whitney Townsend, and Vineet Chopra developed the search strategy. Vineet Chopra provided systematic review expertise. All authors read, provided feedback, and approved the final manuscript. The authors declare that they have no conflicts of interest.
1. Berwick DM. A user’s manual for the IOM’s ‘Quality Chasm’ report. Health Aff (Millwood). 2002;21(3):80-90. PubMed
2. Jha AK, Orav EJ, Zheng J, Epstein AM. Patients’ perception of hospital care in the United States. N Engl J Med. 2008;359(18):1921-1931. PubMed
3. Boulding W, Glickman SW, Manary MP, Schulman KA, Staelin R. Relationship between patient satisfaction with inpatient care and hospital readmission within 30 days. Am J Manag Care. 2011;17(1):41-48. PubMed
4. Little P, Everitt H, Williamson I, et al. Observational study of effect of patient centredness and positive approach on outcomes of general practice consultations. BMJ. 2001;323(7318):908-911. PubMed
5. Stewart MA. Effective physician-patient communication and health outcomes: a review. CMAJ. 1995;152(9):1422-1433. PubMed
6. Arora V, Johnson J, Lovinger D, Humphrey HJ, Meltzer DO. Communication failures in patient sign-out and suggestions for improvement: a critical incident analysis. Qual Saf Health Care. 2005;14(6):401-407. PubMed
7. Leonard M, Graham S, Bonacum D. The human factor: the critical importance of effective teamwork and communication in providing safe care. Qual Saf Health Care. 2004;13 Suppl 1:i85-i90. PubMed
8. Alam M, Lee A, Ibrahimi OA, et al. A multistep approach to improving biopsy site identification in dermatology: physician, staff, and patient roles based on a Delphi consensus. JAMA Dermatol. 2014;150(5):550-558. PubMed
9. Arora V, Gangireddy S, Mehrotra A, Ginde R, Tormey M, Meltzer D. Ability of hospitalized patients to identify their in-hospital physicians. Arch Intern Med. 2009;169(2):199-201. PubMed
10. Makaryus AN, Friedman EA. Does your patient know your name? An approach to enhancing patients’ awareness of their caretaker’s name. J Healthc Qual. 2005;27(4):53-56. PubMed
11. Sehgal NL, Green A, Vidyarthi AR, Blegen MA, Wachter RM. Patient whiteboards as a communication tool in the hospital setting: a survey of practices and recommendations. J Hosp Med. 2010;5(4):234-239. PubMed
12. Maniaci MJ, Heckman MG, Dawson NL. Increasing a patient’s ability to identify his or her attending physician using a patient room display. Arch Intern Med. 2010;170:1084-1085. PubMed
13. Arora VM, Schaninger C, D’Arcy M, et al. Improving inpatients’ identification of their doctors: Use of FACE™ cards. Jt Comm J Qual Patient Saf. 2009;35(12):613-619. PubMed
14. Appel L, Abrams H, Morra D, Wu RC. Put a face to a name: a randomized controlled trial evaluating the impact of providing clinician photographs on inpatients’ recall. Am J Med. 2015;128(1):82-89. PubMed
15. Dudas RA, Lemerman H, Barone M, Serwint JR. PHACES (Photographs of Academic Clinicians and Their Educational Status): a tool to improve delivery of family-centered care. Acad Pediatr. 2010;10(2):138-145. PubMed
16. Moher D, Liberati A, Tetzlaff J, Altman DG, PRISMA Group. Preferred reporting items for systematic reviews and meta-analyses: the PRISMA statement. Ann Intern Med. 2009;151(4):264-269. PubMed
17. Higgins JP, Green S, editors. Cochrane handbook for systematic reviews of interventions. West Sussex, UK: The Cochrane Collaboration and Wiley Online Library; 2008.
18. Petrilli CM, Mack M, Petrilli JJ, Hickner A, Saint S, Chopra V. Understanding the role of physician attire on patient perceptions: a systematic review of the literature—targeting attire to improve likelihood of rapport (TAILOR) investigators. BMJ Open. 2015;5(1):e006578. PubMed
19. Downs SH, Black N. The feasibility of creating a checklist for the assessment of the methodological quality both of randomised and non-randomised studies of health care interventions. J Epidemiol Community Health. 1998;52(6):377-384. PubMed
20. Seyffert M, Lagisetty P, Landgraf J, et al. Internet-delivered cognitive behavioral therapy to treat insomnia: a systematic review and meta-analysis. PLoS One. 2016;11(2):e0149139. PubMed
21. Patel R, Chang T, Greysen SR, Chopra V. Social media use in chronic disease: a systematic review and novel taxonomy. Am J Med. 2015;128(12):1335-1350. PubMed
22. Carlin BJ. Using whiteboards: fixed identities. Am J Nurs. 2008;108(11):72A-72B, 72D-72E. PubMed
23. Francis JJ, Pankratz VS, Huddleston JM. Patient satisfaction associated with correct identification of physician’s photographs. Mayo Clin Proc. 2001;76(6):604-608. PubMed
24. Farberg AS, Lin AM, Kuhn L, Flanders SA, Kim CS. Dear Doctor: a tool to facilitate patient-centered communication. J Hosp Med. 2013;8(10):553-558. PubMed
25. Hayes RM, Wickline A, Hensley C, et al. A quality improvement project to improve family recognition of medical team member roles. Hosp Pediatr. 2015;5(9):480-486. PubMed
26. O’Leary KJ, Lohman ME, Culver E, Killarney A, Randy Smith G Jr, Liebovitz DM. The effect of tablet computers with a mobile patient portal application on hospitalized patients’ knowledge and activation. J Am Med Inform Assoc. 2016;23(1):159-165. PubMed
27. Simons Y, Caprio T, Furiasse N, Kriss M, Williams MV, O’Leary KJ. The impact of facecards on patients’ knowledge, satisfaction, trust, and agreement with hospital physicians: a pilot study. J Hosp Med. 2014;9(3):137-141. PubMed
28. Singh A, Rhee KE, Brennan JJ, Kuelbs C, El-Kareh R, Fisher ES. Who’s my doctor? Using an electronic tool to improve team member identification on an inpatient pediatrics team. Hosp Pediatr. 2016;6(3):157-165. PubMed
29. Singh S, Fletcher KE, Pandl GJ, et al. It’s the writing on the wall: whiteboards improve inpatient satisfaction with provider communication. Am J Med Qual. 2011;26(2):127-131. PubMed
30. Tan M, Hooper Evans K, Braddock CH 3rd, Shieh L. Patient whiteboards to improve patient-centred care in the hospital. Postgrad Med J. 2013;89(1056):604-609. PubMed
31. Unaka NI, White CM, Sucharew HJ, Yau C, Clark SL, Brady PW. Effect of a face sheet tool on medical team provider identification and family satisfaction. J Hosp Med. 2014;9(3):186-188. PubMed
32. Kelly MM, Hoonakker PL, Dean SM. Using an inpatient portal to engage families in pediatric hospital care. J Am Med Inform Assoc. 2017;24(1):153-161. PubMed
33. Brener MI, Epstein JA, Cho J, Yeh HC, Dudas RA, Feldman L. Faces of all clinically engaged staff: a quality improvement project that enhances the hospitalised patient experience. Int J Clin Pract. 2016;70(11):923-929. PubMed
34. De Valois RL, De Valois KK. Spatial vision. Annu Rev Psychol. 1980;31:309-341. PubMed
© 2017 Society of Hospital Medicine
What’s the Purpose of Rounds? A Qualitative Study Examining the Perceptions of Faculty and Students
For more than a century, medical rounds have been a cornerstone of patient care and medical education in teaching hospitals. They remain critical activities for exposing generations of trainees to clinical decision making, coordination of care, and patient communication.1
Despite this established importance within medical education and patient care, there is a relative paucity of research addressing the purpose of medical rounds in the 21st century. Medicine has evolved significantly since Osler’s day, and it is unclear whether the purpose of rounds has evolved along with it. Rounds, to Osler, were an important opportunity for future physicians to learn at the bedside from an attending physician. Increased duty hour restrictions, mandatory adoption of electronic medical records, and increasingly complex care have changed how rounds are performed, making it more difficult to achieve Osler’s ideals.2,3 While several studies have aimed to quantify the changes to rounds and have demonstrated a significant decline in bedside teaching,4-6 few studies have explored the purpose of rounds from the perspective of pertinent stakeholders, students, residents, and faculty. The authors have published the results of focus groups of resident stakeholders recently.7 We made the decision to combine the student/faculty data and describe it separately from the resident data to allow the most accurate and relevant discussion as it pertained to each group.
The aim of this study was to explore the perceptions of faculty and students of general inpatient rounds on internal medicine and pediatric rotations, and to identify any notable differences between these key stakeholders.
METHODS
Between April 2014 and June 2014, we conducted 10 semistructured focus groups at 4 teaching hospitals: The University of Chicago Medical Center, Children’s National Health System, Georgetown University Medical Center, and the University of California, San Francisco Medical Center. A sample of eligible 3rd-year medical students and residents on pediatrics and internal medicine hospitalist services as well as hospitalist attendings in pediatrics and internal medicine were invited by e-mail to participate voluntarily without compensation. Identical semistructured focus groups were also conducted with pediatric and internal medicine interns (postgraduate year [PGY1]) and senior residents (PGY2 and PGY3), and those data have been published previously.7
Data Collection
Most focus groups had 6 to 8 participants, with 2 groups of 3 and 4. The groups were interviewed separately by training and specialty: 3rd-year medical students who had completed internal medicine and/or pediatrics rotations, hospitalist attendings in pediatrics, and hospitalist attendings in internal medicine. Attendings with training in medicine-pediatrics were included in the department in which they worked most frequently. The focus group script was informed by a literature review and expert input, and we used open-ended questions to explore perspectives on current and ideal purposes of rounds. Interviews were digitally recorded, transcribed, and names of speakers or references to specific patients were removed to preserve confidentiality and anonymity. The focus groups lasted between 30 and 60 minutes. The author (OH) conducted focus groups at 1 site, and trained facilitators conducted focus groups at the remaining 3 sites. The protocol was determined to be exempt by the institutional review boards at all participating sites. Prior to the focus groups, the definition of family-centered rounds was read aloud; after which, participants were asked to fill out a demographic survey.
Data Analysis
The authors employed a grounded theory approach to data collection and analysis,8 and data were analyzed by using the constant-comparative method.9 There was no a priori hypothesis. Four transcripts were independently reviewed by 2 authors (OH and RR) by using sentences and phrases as the units of data, which were coded with an identifier. The authors discussed initial codes and resolved discrepancies through deliberation and consensus to create codebooks. Themes, made up of multiple codes, were identified inductively and iteratively and were refined to reflect the evolving dataset. One author (OH) independently coded the remaining transcripts by using a revised codebook as a guide. A faculty author (JF) assessed the interrater reliability of the final codebook by reviewing 2 previously coded, randomly selected transcripts with no new codes emerging in the process, with a kappa coefficient of >0.8 indicating significant agreement.
RESULTS
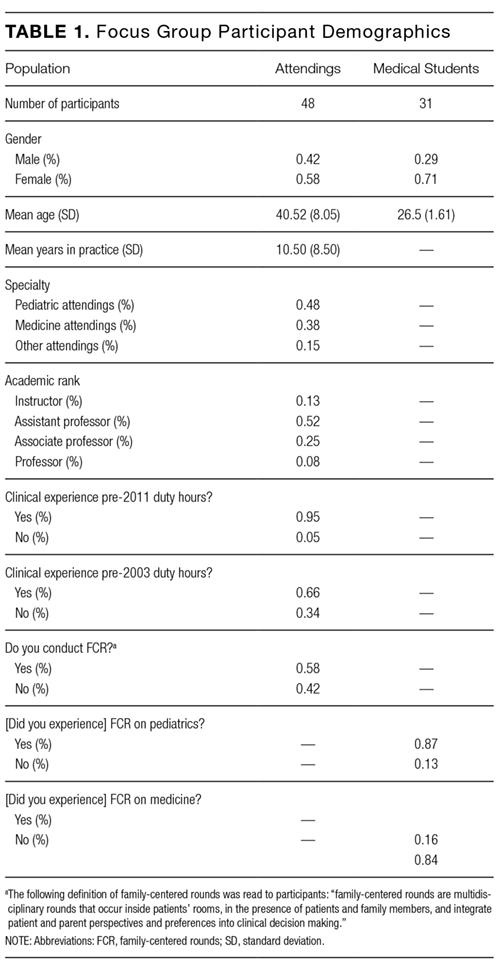
What Do You Perceive the Purpose of Rounds to Be?
With respect to this prompt, we identified 4 themes, which represent 16 codes describing what attendings and medical students believed to be the purpose of rounds (Table 2). These themes are communication, medical education, patient care, and assessment.
Communication
Communication includes all comments addressing the role of rounds as it relates to communication between team members, patients, family members, and all those involved in patient care. There were 4 main codes, including coordination of patient care team, patient/family communication, establishing rapport with patients and/or family, and establishment of roles.
Coordination of patient care team identified rounds as a time “to make sure everyone is on the same page” and “to come together whenever possible,” so that everyone “had the same information of what was going on.” It also included comments related to interdisciplinary communication, with 1 participant describing rounds as “a time when your consulting team, or people with outside expertise, can weigh in on some medical issues.”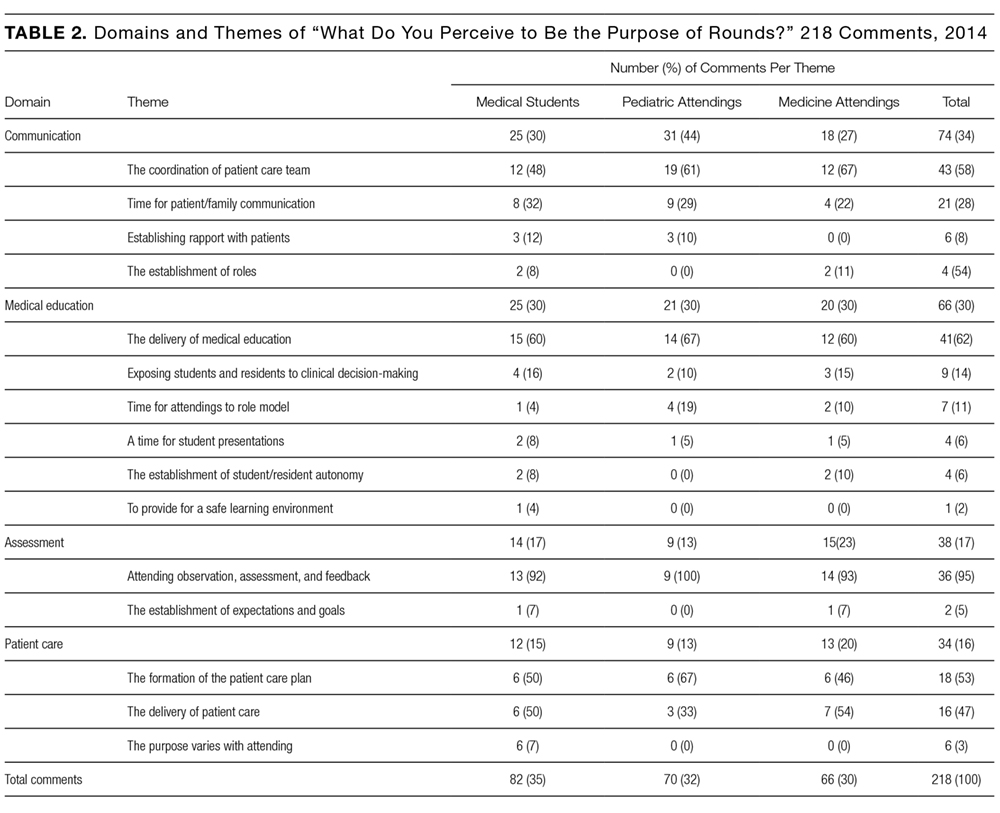
Medical Education
The theme of medical education is made up of 6 codes that encompass comments related to teaching and learning during rounds. These 6 codes include delivery of clinical education, exposure to clinical decision making, role modeling, student presentations, establishment of trainee autonomy, and providing a safe learning environment.
Delivery of clinical education included comments identifying rounds as a time for didactic teaching, teachable moments, “clinical pearls,” and bedside teaching of physical exam skills. Exposure to clinical decision making included comments by both medical students and attendings who described the purpose of rounds as a time for learning and teaching, specifically about how best to approach problems and decision making in a systematic manner, with 1 medical student explaining it as a time to “expose [trainees] to the way that people think about problems and how they decided to go about addressing them.”
Role modeling includes comments addressing rounds as a time for attendings to demonstrate appropriate behaviors and skills to trainees. One attending explained that “everybody learns from watching other people present and interact…so everybody has a chance to pick up things that they think, ‘Oh, this works well.’” Student presentations include comments, predominantly from students, that described rounds as an opportunity to practice presentations and receive feedback, with 1 student explaining it was a time “to learn how to present but also to be questioned and challenged.”
Establishing trainee autonomy is a code that identifies rounds as a time to encourage resident and student autonomy in order to achieve rounds that function with minimal input from the attending, with 1 attending describing how they “put resident leadership first as far as priorities… [and] fostering that because I usually let them decide what we’re going to do.”
Providing a safe learning environment identifies the purpose of rounds as being a space in which trainees can feel comfortable learning from their mistakes. One student described rounds as, “…a setting where it’s okay to be wrong and feel comfortable enough to know that it’s about a learning process.”
Assessment
Assessment is a theme composed of comments identifying the purpose of rounds as being related to observation, assessment, and feedback, and it includes 2 codes: attending observation, assessment, and feedback and establishment of expectations. Attending observation, assessment, and feedback includes comments from attendings and students alike who described rounds as a place for observation, evaluation, and provision of feedback regarding the skills and abilities of trainees. One attending explained that rounds gave him an “opportunity to observe trainees interacting with each other, with the patient, the patient’s family, and ancillary staff,” with another commenting it was time used “to assess how med students are gathering information, presenting information, and eventually their assessment and plan.” Establishment of expectations captures comments that describe rounds as a time for the establishment of expectations and goals of the team.
Patient Care
Patient care is a theme comprised of comments identifying the purpose of rounds as being directly related to the formation and delivery of the patient care plan, and it includes 2 codes: formation of the patient care plan and delivery of patient care. Formation of the patient care plan includes comments, which identified rounds as a time for discussing and forming the plan for the day, with an attending stating, “The purpose [of rounds] was to make a plan, a treatment plan, and to include the parents in making the treatment plan.” Delivery of patient care included comments identifying rounds as a means of ensuring timely, safe, and appropriate delivery of patient care occurred. One attending explained, “It can’t be undersold that the priority of rounds is patient care and the more eyes that look over information the less likely there are to be mistakes.”
What Do You Believe the Ideal Purpose of RoundsShould Be?
This study originally sought to compare responses to 2 different questions: “What do you perceive the purpose of rounds to be?” and “What do you believe the ideal purpose of rounds should be?” What became clear during the focus groups was that these were often interpreted to be the same question, and as such, responses to the latter question were truncated or were reiterations of what was previously said: “I think we’ve already discussed that, I think it’s no different than what we already kind of said, patient care, education, and communication,” explained 1 attending. Fifty-four responses to the question regarding the ideal purpose of rounds were coded and did not differ significantly from the previously noted results in terms of the domains represented and the frequency of representation.
Variation Among Respondents
Overall, there is a high level of concordance between the comments from medical students and attendings regarding the purpose of rounds, particularly in the medical education theme. However, medicine and pediatric attendings differ in their comments relating to the theme of communication, with 2 codes primarily accounting for this difference: pediatric attendings place more emphasis on time for patient/family communication and establishing rapport with patients than their internal medicine colleagues. Of note, all of the pediatric attendings involved in the study answered that they conducted family-centered rounds (FCR), compared with 22% of internal medicine attendings.10
Another notable discrepancy came up during focus groups involving comments from medical students who reiterated that the purpose of rounds was not fixed, but rather dependent on the attending that was running rounds. This theme was only identified in focus groups involving medical students. One student explained, “I think that it depends on the attending and if they actually want to teach,” and another commented that “it’s incredibly dependent on what the attending… is willing to invest.” No attendings identified student or attending variability as an important factor influencing the purpose of rounds.
DISCUSSION
This qualitative study is one of the first to explore the purpose of rounds from the perspective of both medical students and attendings. Reassuringly, our results indicate that medical student and attending perceptions are largely concordant. The 4 themes of communication, medical education, assessment, and patient care are in line with the findings of previous observational studies of internal medicine and pediatrics rounds.1,11 The themes are similar to the findings of resident focus groups done at these same sites.7
Our results support that both medical students and attendings identify the importance of medical education during rounds. This is in contrast with findings in previous observational time-motion research by Stickrath that describes the focus on patient care related activities and the relative scarcity of education during rounds.1 This stresses a divide between how medical students and attendings define the purpose of rounds and what other research suggests actually occurs on rounds. This distinction is an important one. It is possible that the way we, and others, define “medical education” and “patient care” may be at least partially responsible for these findings. This is supported by the ambiguous distinction between formal and informal educational activities on rounds and the challenges in characterizing the hidden curriculum and its role in medical student and resident education.11 Attendings role modeling effective patient communication strategies, for example, highlights that patient care, medical education, and communication are frequently indistinguishable.12 This hybridization of activities and dedication to diverse types of learning is an essential quality of rounds and is suggestive of why they have survived as a preeminent tool within the arsenal of medical education for the past century.
Yet, this finding does not excuse or adequately explain a well-documented disappearance of more formal educational activities during rounds. Recent observational studies have shown that the percentage of rounds dedicated to educational activities fell from 25% to 10% after the implementation of duty hour restrictions,1,13,14 and a recent ethnographic study of pediatric attending rounds confirmed teaching during rounds, though seen as a pedagogical ideal, occurred infrequently and inconsistently in large part because of time pressures.15 In our attending focus groups, duty hours and time pressures were frequently cited as actively working against the purpose of rounds, specifically opportunities for teaching, with 1 attending explaining, “I just don’t think we achieve our [teaching] goals like we used to.” Another attending mentioned that, because of time pressures, “I often find myself apologizing. ‘I’m so sorry. I can’t resist. Can I just tell you this one thing? I’m so sorry to do teaching.’” This tension between time pressures and education on rounds is well documented in the literature.4,16,17
Our results highlight that attendings and medical students still believe that medical education is a primary and important purpose of rounds even in the face of increasing time pressures. As such, efforts should be made to better align the many purposes of rounds with the realities of the modern day rounding environment. Increasing the presence of medical education on rounds need not be at the expense of time given that techniques like the 1-minute preceptor have been rated as both efficient and effective methods of teaching and delivering feedback.18 This is echoed in research that has found that faculty development with a focus on teaching significantly increased the rate of clinical education and interdisciplinary communication during rounds.1 Opportunities for faculty development are increasingly accessible,19 including programs like the Advancing Pediatric Excellence Teaching Program, sponsored by the American Academy of Pediatrics Section on Hospital Medicine and the Academic Pediatric Association, and the Teaching Educators Across the Continuum of Healthcare program, sponsored by the Society for General Internal Medicine.20,21
A testament to the adaptability of rounds can be seen in our findings that expose the increased emphasis with which pediatric attendings identify communication as a purpose of rounds, particularly within the themes of patient/family communication and establishing rapport with patients. This is likely due to the practice of FCR by 100% of the pediatric attendings in our focus groups, and is supported elsewhere in the literature.22 A key to family-centered rounds is communication, with active participation in the care discussion by patients and families as described and endorsed by a 2012 American Academy of Pediatrics (AAP) policy.10,23
This emphasis could explain the increased frequency of comments made by pediatric attendings within the themes of patient/family communication and establishing rapport with patients. Furthermore, the AAP policy statement stresses the need to share information in a way that patients and families “effectively participate in care and decision making,” which could explain why pediatric attendings placed greater emphasis on the formation of the patient care plan in the theme of patient care.
As noted, the authors published a related study focusing on resident perceptions regarding the purpose of rounds. We initially undertook a separate analysis of the 3 groups: faculty, residents, and medical students. From that analysis, it became apparent that residents (PGY1-PGY3) viewed rounds differently than faculty and medical students. Where faculty and medical students were more focused on communication and medical education, the residents were more focused on the practical aspects of rounds (eg, “getting work done”). It was also noted that the residents’ focus aligned with the graduate medical education
Our study has a number of limitations. Only 4 university-based hospitals were included in the focus groups. This has the potential to limit the generalizability to the community hospital setting. Within the focus groups, the number of participants varied, and this may have had an impact on the flow and content of conversation. Facilitators were chosen to minimize potential bias and prior relationships with participants; however, this was not always possible, and as such, may have influenced responses. There may be a discrepancy between how people perceive rounds and how rounds actually function. Rounds were not standardized between institutions, departments, or attendings.
CONCLUSION
Rounds are an appropriate metaphor for medical education at large: they are time consuming, complex, and vary in quality, but are nevertheless essential to the goals of patients and learners alike because of their adaptability and hybridization of purpose. Our results highlight that rounds serve 4 critical purposes, including communication, medical education, patient care, and assessment. Importantly, both attendings and students agree on what they perceive to be the many purposes of rounds. Despite this agreement, a disconnect appears to exist between what people believe are the purposes of rounds and what is perceived to be happening during rounds. The causes of this gap are not well defined, and further efforts should be made to better understand the obstacles facing effective rounding. To improve rounds and adapt them to the needs of 21st century learners, it is critical that we better define the scope of medical education, both formal and informal, that occurs during rounds. In doing so, it will be possible to identify areas of development and training for faculty, residents, and medical students, which will ensure that rounds remain useful and critical tools for the development and education of future physicians.
Acknowledgments
The authors would like to acknowledge the following people who assisted on this project: Meghan Daly from The University of Chicago Pritzker School of Medicine, Shannon Martin, MD, MS, Assistant Professor of Medicine from the Department of Medicine at The University of Chicago, Joyce Campbell, BSN, MS, Senior Quality Manager at the Children’s National Medical Center, Benjamin Colburn from the University of California, San Francisco School of Medicine, Kelly Sanders from the University of California, San Francisco School of Medicine, and Alekist Quach from the University of California, San Francisco School of Medicine.
Disclosure
The authors report no external funding source for this study. The authors declare no conflict of interest. The protocol was approved by the institutional review board at all participating institutions.
1. Stickrath C, Noble M, Prochazka A, et al. Attending rounds in the current era: what is and is not happening. JAMA Intern Med. 2013;173(12):1084-1089. doi:10.1001/jamainternmed.2013.6041 PubMed
2. Osler SW. Osler’s “A Way of Life” and Other Addresses, with Commentary and Annotations. Durham: Duke University Press; 2001.
3. Peters M, Ten Cate O. Bedside teaching in medical education: a literature review. Perspect Med Educ. 2014;3(2):76-88. doi:10.1007/s40037-013-0083-y PubMed
4. Gonzalo JD, Heist BS, Duffy BL, et al. Identifying and Overcoming the Barriers to Bedside Rounds: A Multicenter Qualitative Study. Acad Med. 2014;89(2):326-334. doi:10.1097/ACM.0000000000000100 PubMed
5. Gonzalo JD, Masters PA, Simons RJ, Chuang CH. Attending Rounds and Bedside Case Presentations: Medical Student and Medicine Resident Experiences and Attitudes. Teach Learn Med. 2009;21(2):105-110. doi:10.1080/10401330902791156 PubMed
6. Payson HE, Barchas JD. A Time Study of Medical Teaching Rounds. N Engl J Med. 1965;273(27):1468-1471. doi:10.1056/NEJM196512302732706 PubMed
7. Rabinowitz R, Farnan J, Hulland O, et al. Rounds Today: A Qualitative Study of Internal Medicine and Pediatrics Resident Perceptions. J Grad Med Educ. 2016;8(4):523-531. doi:10.4300/JGME-D-15-00106.1 PubMed
8. Charmaz K. Constructing Grounded Theory: A Practical Guide through Qualitative Analysis. London: Sage Publications; 2006. PubMed
9. Starks H, Trinidad SB. Choose Your Method: A Comparison of Phenomenology, Discourse Analysis, and Grounded Theory. Qual Health Res. 2007;17(10):1372-1380. doi:10.1177/1049732307307031 PubMed
10. Sisterhen LL, Blaszak RT, Woods MB, Smith CE. Defining Family-Centered Rounds. Teach Learn Med. 2007;19(3):319-322. doi:10.1080/10401330701366812 PubMed
11. Witman Y. What do we transfer in case discussions? The hidden curriculum in medicine…. Perspect Med Educ. 2014;3(2):113-123. doi:10.1007/s40037-013-0101-0 PubMed
12. Benbassat J. Role Modeling in Medical Education: The Importance of a Reflective Imitation. Acad Med. 2014;89(4):550-554. doi:10.1097/ACM.0000000000000189 PubMed
13. Miller M, Johnson B, Greene DHL, Baier M, Nowlin S. An observational study of attending rounds. J Gen Intern Med. 1992;7(6):646-648. doi:10.1007/BF02599208 PubMed
14. Priest JR, Bereknyei S, Hooper K, Braddock CH III. Relationships of the Location and Content of Rounds to Specialty, Institution, Patient-Census, and Team Size. PLoS One. 2010;5(6):e11246. doi:10.1371/journal.pone.0011246 PubMed
15. Balmer DF, Master CL, Richards BF, Serwint JR, Giardino AP. An ethnographic study of attending rounds in general paediatrics: understanding the ritual. Med Educ. 2010;44(11):1105-1116. doi:10.1111/j.1365-2923.2010.03767.x PubMed
16. Bhansali P, Birch S, Campbell JK, et al. A Time-Motion Study of Inpatient Rounds Using a Family-Centered Rounds Model. Hosp Pediatr. 2013;3(1):31-38. doi:10.1542/hpeds.2012-0021 PubMed
17. Reed DA, Levine RB, Miller RG, et al. Impact of Duty Hour Regulations on Medical Students’ Education: Views of Key Clinical Faculty. J Gen Intern Med. 2008;23(7):1084-1089. doi:10.1007/s11606-008-0532-1 PubMed
18. Aagaard E, Teherani A, Irby DM. Effectiveness of the One-Minute Preceptor Model for Diagnosing the Patient and the Learner: Proof of Concept. Acad Med Spec Theme Teach Clin Ski. 2004;79(1):42-49. PubMed
19. Swanwick T. See one, do one, then what? Faculty development in postgraduate medical education. Postgrad Med J. 2008;84(993):339-343. doi:10.1136/pgmj.2008.068288 PubMed
20. Advancing Pediatric Educator Excellence (APEX) Teaching Program. The American Academy of Pediatrics. https://www.aap.org/en-us/about-the-aap/Committees-Councils-Sections/Section-on-Hospital-Medicine/Pages/Advancing-Pediatric-Educator-Excellence.aspx?nfstatus=401&nftoken=00000000-0000-0000-0000-000000000000&nfstatusdescription=ERROR:+No+local+token. Accessed August 22, 2016.
21. TEACH: Teaching Educators Across the Continuum of Healthcare. Society of General Internal Medicine. http://www.sgim.org/communities/education/sgim-teach-program. Accessed August 22, 2016.
22. Mittal V, Krieger E, Lee BC, et al. Pediatrics Residents’ Perspectives on Family-Centered Rounds: A Qualitative Study at 2 Children’s Hospitals. J Grad Med Educ. 2013;5(1):81-87. doi:10.4300/JGME-D-11-00314.1 PubMed
23. Committee on Hospital Care and Institute for Patient- and Family-Centered Care. Patient- and Family-Centered Care and the Pediatrician’s Role. Pediatrics. 2012;129(2):394-404. doi:10.1542/peds.2011-3084 PubMed
For more than a century, medical rounds have been a cornerstone of patient care and medical education in teaching hospitals. They remain critical activities for exposing generations of trainees to clinical decision making, coordination of care, and patient communication.1
Despite this established importance within medical education and patient care, there is a relative paucity of research addressing the purpose of medical rounds in the 21st century. Medicine has evolved significantly since Osler’s day, and it is unclear whether the purpose of rounds has evolved along with it. Rounds, to Osler, were an important opportunity for future physicians to learn at the bedside from an attending physician. Increased duty hour restrictions, mandatory adoption of electronic medical records, and increasingly complex care have changed how rounds are performed, making it more difficult to achieve Osler’s ideals.2,3 While several studies have aimed to quantify the changes to rounds and have demonstrated a significant decline in bedside teaching,4-6 few studies have explored the purpose of rounds from the perspective of pertinent stakeholders, students, residents, and faculty. The authors have published the results of focus groups of resident stakeholders recently.7 We made the decision to combine the student/faculty data and describe it separately from the resident data to allow the most accurate and relevant discussion as it pertained to each group.
The aim of this study was to explore the perceptions of faculty and students of general inpatient rounds on internal medicine and pediatric rotations, and to identify any notable differences between these key stakeholders.
METHODS
Between April 2014 and June 2014, we conducted 10 semistructured focus groups at 4 teaching hospitals: The University of Chicago Medical Center, Children’s National Health System, Georgetown University Medical Center, and the University of California, San Francisco Medical Center. A sample of eligible 3rd-year medical students and residents on pediatrics and internal medicine hospitalist services as well as hospitalist attendings in pediatrics and internal medicine were invited by e-mail to participate voluntarily without compensation. Identical semistructured focus groups were also conducted with pediatric and internal medicine interns (postgraduate year [PGY1]) and senior residents (PGY2 and PGY3), and those data have been published previously.7
Data Collection
Most focus groups had 6 to 8 participants, with 2 groups of 3 and 4. The groups were interviewed separately by training and specialty: 3rd-year medical students who had completed internal medicine and/or pediatrics rotations, hospitalist attendings in pediatrics, and hospitalist attendings in internal medicine. Attendings with training in medicine-pediatrics were included in the department in which they worked most frequently. The focus group script was informed by a literature review and expert input, and we used open-ended questions to explore perspectives on current and ideal purposes of rounds. Interviews were digitally recorded, transcribed, and names of speakers or references to specific patients were removed to preserve confidentiality and anonymity. The focus groups lasted between 30 and 60 minutes. The author (OH) conducted focus groups at 1 site, and trained facilitators conducted focus groups at the remaining 3 sites. The protocol was determined to be exempt by the institutional review boards at all participating sites. Prior to the focus groups, the definition of family-centered rounds was read aloud; after which, participants were asked to fill out a demographic survey.
Data Analysis
The authors employed a grounded theory approach to data collection and analysis,8 and data were analyzed by using the constant-comparative method.9 There was no a priori hypothesis. Four transcripts were independently reviewed by 2 authors (OH and RR) by using sentences and phrases as the units of data, which were coded with an identifier. The authors discussed initial codes and resolved discrepancies through deliberation and consensus to create codebooks. Themes, made up of multiple codes, were identified inductively and iteratively and were refined to reflect the evolving dataset. One author (OH) independently coded the remaining transcripts by using a revised codebook as a guide. A faculty author (JF) assessed the interrater reliability of the final codebook by reviewing 2 previously coded, randomly selected transcripts with no new codes emerging in the process, with a kappa coefficient of >0.8 indicating significant agreement.
RESULTS
What Do You Perceive the Purpose of Rounds to Be?
With respect to this prompt, we identified 4 themes, which represent 16 codes describing what attendings and medical students believed to be the purpose of rounds (Table 2). These themes are communication, medical education, patient care, and assessment.
Communication
Communication includes all comments addressing the role of rounds as it relates to communication between team members, patients, family members, and all those involved in patient care. There were 4 main codes, including coordination of patient care team, patient/family communication, establishing rapport with patients and/or family, and establishment of roles.
Coordination of patient care team identified rounds as a time “to make sure everyone is on the same page” and “to come together whenever possible,” so that everyone “had the same information of what was going on.” It also included comments related to interdisciplinary communication, with 1 participant describing rounds as “a time when your consulting team, or people with outside expertise, can weigh in on some medical issues.”
Medical Education
The theme of medical education is made up of 6 codes that encompass comments related to teaching and learning during rounds. These 6 codes include delivery of clinical education, exposure to clinical decision making, role modeling, student presentations, establishment of trainee autonomy, and providing a safe learning environment.
Delivery of clinical education included comments identifying rounds as a time for didactic teaching, teachable moments, “clinical pearls,” and bedside teaching of physical exam skills. Exposure to clinical decision making included comments by both medical students and attendings who described the purpose of rounds as a time for learning and teaching, specifically about how best to approach problems and decision making in a systematic manner, with 1 medical student explaining it as a time to “expose [trainees] to the way that people think about problems and how they decided to go about addressing them.”
Role modeling includes comments addressing rounds as a time for attendings to demonstrate appropriate behaviors and skills to trainees. One attending explained that “everybody learns from watching other people present and interact…so everybody has a chance to pick up things that they think, ‘Oh, this works well.’” Student presentations include comments, predominantly from students, that described rounds as an opportunity to practice presentations and receive feedback, with 1 student explaining it was a time “to learn how to present but also to be questioned and challenged.”
Establishing trainee autonomy is a code that identifies rounds as a time to encourage resident and student autonomy in order to achieve rounds that function with minimal input from the attending, with 1 attending describing how they “put resident leadership first as far as priorities… [and] fostering that because I usually let them decide what we’re going to do.”
Providing a safe learning environment identifies the purpose of rounds as being a space in which trainees can feel comfortable learning from their mistakes. One student described rounds as, “…a setting where it’s okay to be wrong and feel comfortable enough to know that it’s about a learning process.”
Assessment
Assessment is a theme composed of comments identifying the purpose of rounds as being related to observation, assessment, and feedback, and it includes 2 codes: attending observation, assessment, and feedback and establishment of expectations. Attending observation, assessment, and feedback includes comments from attendings and students alike who described rounds as a place for observation, evaluation, and provision of feedback regarding the skills and abilities of trainees. One attending explained that rounds gave him an “opportunity to observe trainees interacting with each other, with the patient, the patient’s family, and ancillary staff,” with another commenting it was time used “to assess how med students are gathering information, presenting information, and eventually their assessment and plan.” Establishment of expectations captures comments that describe rounds as a time for the establishment of expectations and goals of the team.
Patient Care
Patient care is a theme comprised of comments identifying the purpose of rounds as being directly related to the formation and delivery of the patient care plan, and it includes 2 codes: formation of the patient care plan and delivery of patient care. Formation of the patient care plan includes comments, which identified rounds as a time for discussing and forming the plan for the day, with an attending stating, “The purpose [of rounds] was to make a plan, a treatment plan, and to include the parents in making the treatment plan.” Delivery of patient care included comments identifying rounds as a means of ensuring timely, safe, and appropriate delivery of patient care occurred. One attending explained, “It can’t be undersold that the priority of rounds is patient care and the more eyes that look over information the less likely there are to be mistakes.”
What Do You Believe the Ideal Purpose of RoundsShould Be?
This study originally sought to compare responses to 2 different questions: “What do you perceive the purpose of rounds to be?” and “What do you believe the ideal purpose of rounds should be?” What became clear during the focus groups was that these were often interpreted to be the same question, and as such, responses to the latter question were truncated or were reiterations of what was previously said: “I think we’ve already discussed that, I think it’s no different than what we already kind of said, patient care, education, and communication,” explained 1 attending. Fifty-four responses to the question regarding the ideal purpose of rounds were coded and did not differ significantly from the previously noted results in terms of the domains represented and the frequency of representation.
Variation Among Respondents
Overall, there is a high level of concordance between the comments from medical students and attendings regarding the purpose of rounds, particularly in the medical education theme. However, medicine and pediatric attendings differ in their comments relating to the theme of communication, with 2 codes primarily accounting for this difference: pediatric attendings place more emphasis on time for patient/family communication and establishing rapport with patients than their internal medicine colleagues. Of note, all of the pediatric attendings involved in the study answered that they conducted family-centered rounds (FCR), compared with 22% of internal medicine attendings.10
Another notable discrepancy came up during focus groups involving comments from medical students who reiterated that the purpose of rounds was not fixed, but rather dependent on the attending that was running rounds. This theme was only identified in focus groups involving medical students. One student explained, “I think that it depends on the attending and if they actually want to teach,” and another commented that “it’s incredibly dependent on what the attending… is willing to invest.” No attendings identified student or attending variability as an important factor influencing the purpose of rounds.
DISCUSSION
This qualitative study is one of the first to explore the purpose of rounds from the perspective of both medical students and attendings. Reassuringly, our results indicate that medical student and attending perceptions are largely concordant. The 4 themes of communication, medical education, assessment, and patient care are in line with the findings of previous observational studies of internal medicine and pediatrics rounds.1,11 The themes are similar to the findings of resident focus groups done at these same sites.7
Our results support that both medical students and attendings identify the importance of medical education during rounds. This is in contrast with findings in previous observational time-motion research by Stickrath that describes the focus on patient care related activities and the relative scarcity of education during rounds.1 This stresses a divide between how medical students and attendings define the purpose of rounds and what other research suggests actually occurs on rounds. This distinction is an important one. It is possible that the way we, and others, define “medical education” and “patient care” may be at least partially responsible for these findings. This is supported by the ambiguous distinction between formal and informal educational activities on rounds and the challenges in characterizing the hidden curriculum and its role in medical student and resident education.11 Attendings role modeling effective patient communication strategies, for example, highlights that patient care, medical education, and communication are frequently indistinguishable.12 This hybridization of activities and dedication to diverse types of learning is an essential quality of rounds and is suggestive of why they have survived as a preeminent tool within the arsenal of medical education for the past century.
Yet, this finding does not excuse or adequately explain a well-documented disappearance of more formal educational activities during rounds. Recent observational studies have shown that the percentage of rounds dedicated to educational activities fell from 25% to 10% after the implementation of duty hour restrictions,1,13,14 and a recent ethnographic study of pediatric attending rounds confirmed teaching during rounds, though seen as a pedagogical ideal, occurred infrequently and inconsistently in large part because of time pressures.15 In our attending focus groups, duty hours and time pressures were frequently cited as actively working against the purpose of rounds, specifically opportunities for teaching, with 1 attending explaining, “I just don’t think we achieve our [teaching] goals like we used to.” Another attending mentioned that, because of time pressures, “I often find myself apologizing. ‘I’m so sorry. I can’t resist. Can I just tell you this one thing? I’m so sorry to do teaching.’” This tension between time pressures and education on rounds is well documented in the literature.4,16,17
Our results highlight that attendings and medical students still believe that medical education is a primary and important purpose of rounds even in the face of increasing time pressures. As such, efforts should be made to better align the many purposes of rounds with the realities of the modern day rounding environment. Increasing the presence of medical education on rounds need not be at the expense of time given that techniques like the 1-minute preceptor have been rated as both efficient and effective methods of teaching and delivering feedback.18 This is echoed in research that has found that faculty development with a focus on teaching significantly increased the rate of clinical education and interdisciplinary communication during rounds.1 Opportunities for faculty development are increasingly accessible,19 including programs like the Advancing Pediatric Excellence Teaching Program, sponsored by the American Academy of Pediatrics Section on Hospital Medicine and the Academic Pediatric Association, and the Teaching Educators Across the Continuum of Healthcare program, sponsored by the Society for General Internal Medicine.20,21
A testament to the adaptability of rounds can be seen in our findings that expose the increased emphasis with which pediatric attendings identify communication as a purpose of rounds, particularly within the themes of patient/family communication and establishing rapport with patients. This is likely due to the practice of FCR by 100% of the pediatric attendings in our focus groups, and is supported elsewhere in the literature.22 A key to family-centered rounds is communication, with active participation in the care discussion by patients and families as described and endorsed by a 2012 American Academy of Pediatrics (AAP) policy.10,23
This emphasis could explain the increased frequency of comments made by pediatric attendings within the themes of patient/family communication and establishing rapport with patients. Furthermore, the AAP policy statement stresses the need to share information in a way that patients and families “effectively participate in care and decision making,” which could explain why pediatric attendings placed greater emphasis on the formation of the patient care plan in the theme of patient care.
As noted, the authors published a related study focusing on resident perceptions regarding the purpose of rounds. We initially undertook a separate analysis of the 3 groups: faculty, residents, and medical students. From that analysis, it became apparent that residents (PGY1-PGY3) viewed rounds differently than faculty and medical students. Where faculty and medical students were more focused on communication and medical education, the residents were more focused on the practical aspects of rounds (eg, “getting work done”). It was also noted that the residents’ focus aligned with the graduate medical education
Our study has a number of limitations. Only 4 university-based hospitals were included in the focus groups. This has the potential to limit the generalizability to the community hospital setting. Within the focus groups, the number of participants varied, and this may have had an impact on the flow and content of conversation. Facilitators were chosen to minimize potential bias and prior relationships with participants; however, this was not always possible, and as such, may have influenced responses. There may be a discrepancy between how people perceive rounds and how rounds actually function. Rounds were not standardized between institutions, departments, or attendings.
CONCLUSION
Rounds are an appropriate metaphor for medical education at large: they are time consuming, complex, and vary in quality, but are nevertheless essential to the goals of patients and learners alike because of their adaptability and hybridization of purpose. Our results highlight that rounds serve 4 critical purposes, including communication, medical education, patient care, and assessment. Importantly, both attendings and students agree on what they perceive to be the many purposes of rounds. Despite this agreement, a disconnect appears to exist between what people believe are the purposes of rounds and what is perceived to be happening during rounds. The causes of this gap are not well defined, and further efforts should be made to better understand the obstacles facing effective rounding. To improve rounds and adapt them to the needs of 21st century learners, it is critical that we better define the scope of medical education, both formal and informal, that occurs during rounds. In doing so, it will be possible to identify areas of development and training for faculty, residents, and medical students, which will ensure that rounds remain useful and critical tools for the development and education of future physicians.
Acknowledgments
The authors would like to acknowledge the following people who assisted on this project: Meghan Daly from The University of Chicago Pritzker School of Medicine, Shannon Martin, MD, MS, Assistant Professor of Medicine from the Department of Medicine at The University of Chicago, Joyce Campbell, BSN, MS, Senior Quality Manager at the Children’s National Medical Center, Benjamin Colburn from the University of California, San Francisco School of Medicine, Kelly Sanders from the University of California, San Francisco School of Medicine, and Alekist Quach from the University of California, San Francisco School of Medicine.
Disclosure
The authors report no external funding source for this study. The authors declare no conflict of interest. The protocol was approved by the institutional review board at all participating institutions.
1. Stickrath C, Noble M, Prochazka A, et al. Attending rounds in the current era: what is and is not happening. JAMA Intern Med. 2013;173(12):1084-1089. doi:10.1001/jamainternmed.2013.6041 PubMed
2. Osler SW. Osler’s “A Way of Life” and Other Addresses, with Commentary and Annotations. Durham: Duke University Press; 2001.
3. Peters M, Ten Cate O. Bedside teaching in medical education: a literature review. Perspect Med Educ. 2014;3(2):76-88. doi:10.1007/s40037-013-0083-y PubMed
4. Gonzalo JD, Heist BS, Duffy BL, et al. Identifying and Overcoming the Barriers to Bedside Rounds: A Multicenter Qualitative Study. Acad Med. 2014;89(2):326-334. doi:10.1097/ACM.0000000000000100 PubMed
5. Gonzalo JD, Masters PA, Simons RJ, Chuang CH. Attending Rounds and Bedside Case Presentations: Medical Student and Medicine Resident Experiences and Attitudes. Teach Learn Med. 2009;21(2):105-110. doi:10.1080/10401330902791156 PubMed
6. Payson HE, Barchas JD. A Time Study of Medical Teaching Rounds. N Engl J Med. 1965;273(27):1468-1471. doi:10.1056/NEJM196512302732706 PubMed
7. Rabinowitz R, Farnan J, Hulland O, et al. Rounds Today: A Qualitative Study of Internal Medicine and Pediatrics Resident Perceptions. J Grad Med Educ. 2016;8(4):523-531. doi:10.4300/JGME-D-15-00106.1 PubMed
8. Charmaz K. Constructing Grounded Theory: A Practical Guide through Qualitative Analysis. London: Sage Publications; 2006. PubMed
9. Starks H, Trinidad SB. Choose Your Method: A Comparison of Phenomenology, Discourse Analysis, and Grounded Theory. Qual Health Res. 2007;17(10):1372-1380. doi:10.1177/1049732307307031 PubMed
10. Sisterhen LL, Blaszak RT, Woods MB, Smith CE. Defining Family-Centered Rounds. Teach Learn Med. 2007;19(3):319-322. doi:10.1080/10401330701366812 PubMed
11. Witman Y. What do we transfer in case discussions? The hidden curriculum in medicine…. Perspect Med Educ. 2014;3(2):113-123. doi:10.1007/s40037-013-0101-0 PubMed
12. Benbassat J. Role Modeling in Medical Education: The Importance of a Reflective Imitation. Acad Med. 2014;89(4):550-554. doi:10.1097/ACM.0000000000000189 PubMed
13. Miller M, Johnson B, Greene DHL, Baier M, Nowlin S. An observational study of attending rounds. J Gen Intern Med. 1992;7(6):646-648. doi:10.1007/BF02599208 PubMed
14. Priest JR, Bereknyei S, Hooper K, Braddock CH III. Relationships of the Location and Content of Rounds to Specialty, Institution, Patient-Census, and Team Size. PLoS One. 2010;5(6):e11246. doi:10.1371/journal.pone.0011246 PubMed
15. Balmer DF, Master CL, Richards BF, Serwint JR, Giardino AP. An ethnographic study of attending rounds in general paediatrics: understanding the ritual. Med Educ. 2010;44(11):1105-1116. doi:10.1111/j.1365-2923.2010.03767.x PubMed
16. Bhansali P, Birch S, Campbell JK, et al. A Time-Motion Study of Inpatient Rounds Using a Family-Centered Rounds Model. Hosp Pediatr. 2013;3(1):31-38. doi:10.1542/hpeds.2012-0021 PubMed
17. Reed DA, Levine RB, Miller RG, et al. Impact of Duty Hour Regulations on Medical Students’ Education: Views of Key Clinical Faculty. J Gen Intern Med. 2008;23(7):1084-1089. doi:10.1007/s11606-008-0532-1 PubMed
18. Aagaard E, Teherani A, Irby DM. Effectiveness of the One-Minute Preceptor Model for Diagnosing the Patient and the Learner: Proof of Concept. Acad Med Spec Theme Teach Clin Ski. 2004;79(1):42-49. PubMed
19. Swanwick T. See one, do one, then what? Faculty development in postgraduate medical education. Postgrad Med J. 2008;84(993):339-343. doi:10.1136/pgmj.2008.068288 PubMed
20. Advancing Pediatric Educator Excellence (APEX) Teaching Program. The American Academy of Pediatrics. https://www.aap.org/en-us/about-the-aap/Committees-Councils-Sections/Section-on-Hospital-Medicine/Pages/Advancing-Pediatric-Educator-Excellence.aspx?nfstatus=401&nftoken=00000000-0000-0000-0000-000000000000&nfstatusdescription=ERROR:+No+local+token. Accessed August 22, 2016.
21. TEACH: Teaching Educators Across the Continuum of Healthcare. Society of General Internal Medicine. http://www.sgim.org/communities/education/sgim-teach-program. Accessed August 22, 2016.
22. Mittal V, Krieger E, Lee BC, et al. Pediatrics Residents’ Perspectives on Family-Centered Rounds: A Qualitative Study at 2 Children’s Hospitals. J Grad Med Educ. 2013;5(1):81-87. doi:10.4300/JGME-D-11-00314.1 PubMed
23. Committee on Hospital Care and Institute for Patient- and Family-Centered Care. Patient- and Family-Centered Care and the Pediatrician’s Role. Pediatrics. 2012;129(2):394-404. doi:10.1542/peds.2011-3084 PubMed
© 2017 Society of Hospital Medicine
Association Between Anemia and Fatigue in Hospitalized Patients: Does the Measure of Anemia Matter?
Fatigue is the most common clinical symptom of anemia and is a significant concern to patients.1,2 In ambulatory patients, lower hemoglobin (Hb) concentration is associated with increased fatigue.2,3 Accordingly, therapies that treat anemia by increasing Hb concentration, such as erythropoiesis stimulating agents,4-7 often use fatigue as an outcome measure.
In hospitalized patients, transfusion of red blood cell increases Hb concentration and is the primary treatment for anemia. However, the extent to which transfusion and changes in Hb concentration affect hospitalized patients’ fatigue levels is not well established. Guidelines support transfusing patients with symptoms of anemia, such as fatigue, on the assumption that the increased oxygen delivery will improve the symptoms of anemia. While transfusion studies in hospitalized patients have consistently reported that transfusion at lower or “restrictive” Hb concentrations is safe compared with transfusion at higher Hb concentrations,8-10 these studies have mainly used cardiac events and mortality as outcomes rather than patient symptoms, such as fatigue. Nevertheless, they have resulted in hospitals increasingly adopting restrictive transfusion policies that discourage transfusion at higher Hb levels.11,12 Consequently, the rate of transfusion in hospitalized patients has decreased,13 raising questions of whether some patients with lower Hb concentrations may experience increased fatigue as a result of restrictive transfusion policies. Fatigue among hospitalized patients is important not only because it is an adverse symptom but because it may result in decreased activity levels, deconditioning, and losses in functional status.14,15While the effect of alternative transfusion policies on fatigue in hospitalized patients could be answered by a randomized clinical trial using fatigue and functional status as outcomes, an important first step is to assess whether the Hb concentration of hospitalized patients is associated with their fatigue level during hospitalization. Because hospitalized patients often have acute illnesses that can cause fatigue in and of themselves, it is possible that anemia is not associated with fatigue in hospitalized patients despite anemia’s association with fatigue in ambulatory patients. Additionally, Hb concentration varies during hospitalization,16 raising the question of what measures of Hb during hospitalization might be most associated with anemia-related fatigue.
The objective of this study is to explore multiple Hb measures in hospitalized medical patients with anemia and test whether any of these Hb measures are associated with patients’ fatigue level.
METHODS
Study Design
We performed a prospective, observational study of hospitalized patients with anemia on the general medicine services at The University of Chicago Medical Center (UCMC). The institutional review board approved the study procedures, and all study subjects provided informed consent.
Study Eligibility
Between April 2014 and June 2015, all general medicine inpatients were approached for written consent for The University of Chicago Hospitalist Project,17 a research infrastructure at UCMC. Among patients consenting to participate in the Hospitalist Project, patients were eligible if they had Hb <9 g/dL at any point during their hospitalization and were age ≥50 years. Hb concentration of <9 g/dL was chosen to include the range of Hb values covered by most restrictive transfusion policies.8-10,18 Age ≥50 years was an inclusion criteria because anemia is more strongly associated with poor outcomes, including functional impairment, among older patients compared with younger patients.14,19-21 If patients were not eligible for inclusion at the time of consent for the Hospitalist Project, their Hb values were reviewed twice daily until hospital discharge to assess if their Hb was <9 g/dL. Proxies were sought to answer questions for patients who failed the Short Portable Mental Status Questionnaire.22
Patient Demographic Data Collection
Research assistants abstracted patient age and sex from the electronic health record (EHR), and asked patients to self-identify their race. The individual comorbidities included as part of the Charlson Comorbidity Index were identified using International Classification of Diseases, 9th Revision codes from hospital administrative data for each encounter and specifically included the following: myocardial infarction, congestive heart failure, peripheral vascular disease, cerebrovascular disease, dementia, chronic pulmonary disease, rheumatic disease, peptic ulcer disease, liver disease, diabetes, hemiplegia and/or paraplegia, renal disease, cancer, and human immunodeficiency virus/acquired immunodeficiency syndrome.23 We also used Healthcare Cost and Utilization Project (www.hcup-us.ahrq.gov/toolssoftware/ccs/ccs.jsp) diagnosis categories to identify whether patients had sickle cell (SC) anemia, gastrointestinal bleeding (GIB), or a depressive disorder (DD) because these conditions are associated with anemia (SC and GIB) and fatigue (DD).24
Measuring Anemia
Hb measures were available only when hospital providers ordered them as part of routine practice. The first Hb concentration <9 g/dL during a patient’s hospitalization, which made them eligible for study participation, was obtained through manual review of the EHR. All additional Hb values during the patient’s hospitalization were obtained from the hospital’s administrative data mart. All Hb values collected for each patient during the hospitalization were used to calculate summary measures of Hb during the hospitalization, including the mean Hb, median Hb, minimum Hb, maximum Hb, admission (first recorded) Hb, and discharge (last recorded) Hb. Hb measures were analyzed both as a continuous variable and as a categorical variable created by dividing the continuous Hb measures into integer ranges of 3 groups of approximately the same size.
Measuring Fatigue
Our primary outcome was patients’ level of fatigue reported during hospitalization, measured using the Functional Assessment of Chronic Illness Therapy (FACIT)-Anemia questionnaire. Fatigue was measured using a 13-question fatigue subscale,1,2,25 which measures fatigue within the past 7 days. Scores on the fatigue subscale range from 0 to 52, with lower scores reflecting greater levels of fatigue. As soon as patients met the eligibility criteria for study participation during their hospitalization (age ≥50 years and Hb <9 g/dL), they were approached to answer the FACIT questions. Values for missing data in the fatigue subscale for individual subjects were filled in using a prorated score from their answered questions as long as >50% of the items in the fatigue subscale were answered, in accordance with recommendations for addressing missing data in the FACIT.26 Fatigue was analyzed as a continuous variable and as a dichotomous variable created by dividing the sample into high (FACIT <27) and low (FACIT ≥27) levels of fatigue based on the median FACIT score of the population. Previous literature has shown a FACIT fatigue subscale score between 23 and 26 to be associated with an Eastern Cooperative Oncology Group (ECOG)27 C Performance Status rating of 2 to 33 compared to scores ≥27.
Statistical Analysis
Statistical analysis was performed using Stata statistical software (StataCorp, College Station, Texas). Descriptive statistics were used to characterize patient demographics. Analysis of variance was used to test for differences in the mean fatigue levels across Hb measures. χ2 tests were performed to test for associations between high fatigue levels and the Hb measures. Multivariable analysis, including both linear and logistic regression models, were used to test the association of Hb concentration and fatigue. P values <0.05 using a 2-tailed test were deemed statistically significant.
RESULTS

Patient Characteristics
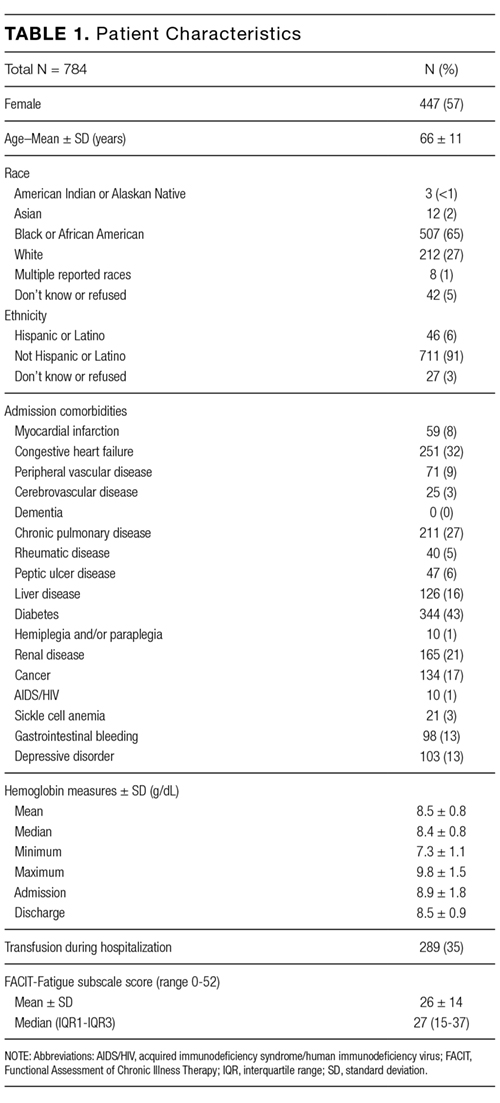
During the study period, 8559 patients were admitted to the general medicine service. Of those, 5073 (59%) consented for participation in the Hospitalist Project, and 3670 (72%) completed the Hospitalist Project inpatient interview. Of these patients, 1292 (35%) had Hb <9 g/dL, and 784 (61%) were 50 years or older and completed the FACIT questionnaire.
Table 1 reports the demographic characteristics and comorbidities for the sample, the mean (standard deviation [SD]) for the 6 Hb measures, and mean (SD) and median FACIT scores.
Bivariate Association of Fatigue and Hb
Categorizing patients into low, middle, or high Hb for each of the 6 Hb measures, minimum Hb was strongly associated with fatigue, with a weaker association for mean Hb and no statistically significant association for the other measures.
Minimum Hb
Patients with a minimum Hb <7 g/dL and patients with Hb 7-8 g/dL had higher fatigue levels (FACIT = 25 for each) than patients with a minimum Hb ≥8 g/dL (FACIT = 29; P < 0.001; Table 2). When excluding patients with SC and/or GIB because their average minimum Hb differed from the average minimum Hb of the full population (P < 0.001), patients with a minimum Hb <7 g/dL or 7-8 g/dL had even higher fatigue levels (FACIT = 23 and FACIT = 24, respectively), with no change in the fatigue level of patients with a minimum Hb ≥8 g/dL (FACIT = 29; P < 0.001; Table 2). Lower minimum Hb continued to be associated with higher fatigue levels when analyzed in 0.5 g/dL increments (Figure).
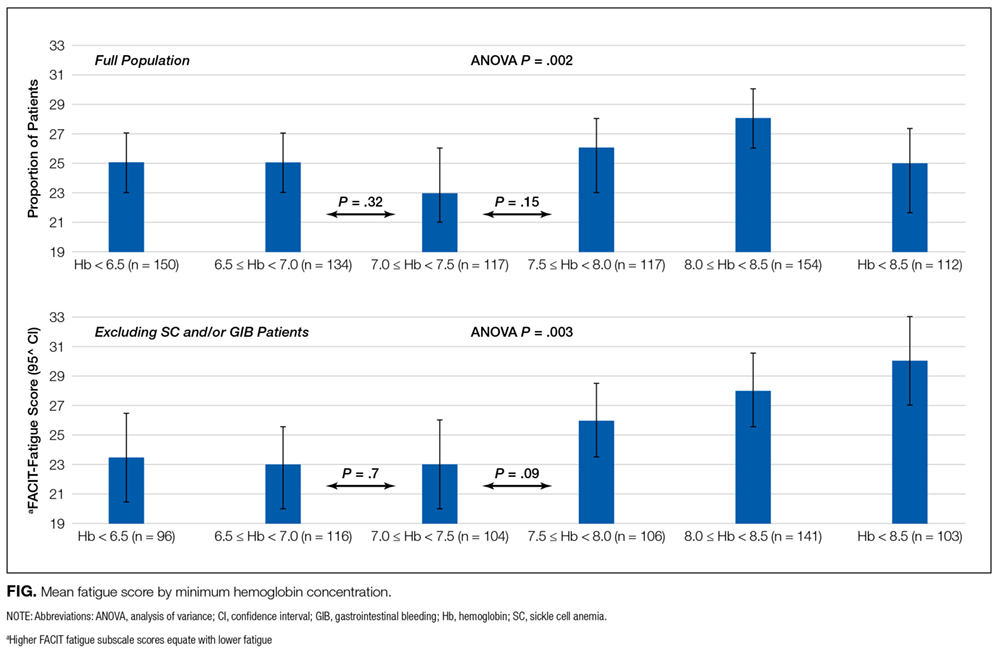
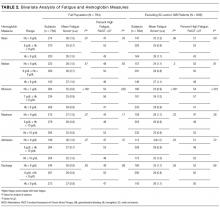
Mean Hb and Other Measures
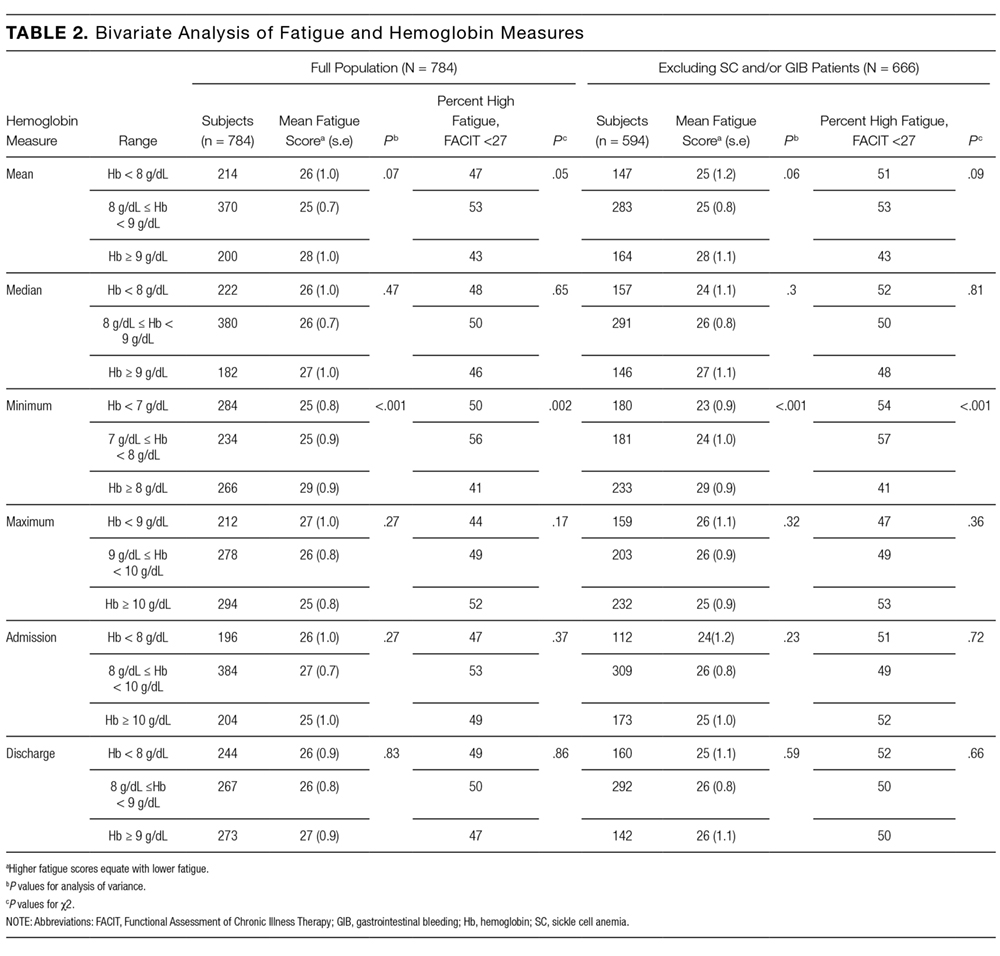
Fatigue levels were high for 47% of patients with a mean Hb <8g /dL and 53% of patients with a mean Hb 8-9 g/dL compared with 43% of patients with a mean Hb ≥9 g/dL (P = 0.05). However, the association between high fatigue and mean Hb was not statistically significant when patients with SC and/or GIB were excluded (Table 2). None of the other 4 Hb measures was significantly associated with fatigue.
Linear Regression of Fatigue on Hb
In linear regression models, minimum Hb consistently predicted patient fatigue, mean Hb had a less robust association with fatigue, and the other Hb measures were not associated with patient fatigue. Increases in minimum Hb (analyzed as a continuous variable) were associated with reduced fatigue (higher FACIT score; β = 1.4; P = 0.005). In models in which minimum Hb was a categorical variable, patients with a minimum Hb of <7 g/dL or 7-8 g/dL had greater fatigue (lower FACIT score) than patients whose minimum Hb was ≥8 g/dL (Hb <7 g/dL: β = −4.2; P ≤ 0.001; Hb 7-8 g/dL: β = −4.1; P < 0.001). These results control for patients’ age, sex, individual comorbidities, and whether their minimum Hb occurred before or after the measurement of fatigue during hospitalization (Model 1), and the results are unchanged when also controlling for the number of Hb laboratory draws patients had during their hospitalization (Model 2; Table 3). In a stratified analysis excluding patients with either SC and/or GIB, changes in minimum Hb were associated with larger changes in patient fatigue levels (Supplemental Table 1). We also stratified our analysis to include only patients whose minimum Hb occurred before the measurement of their fatigue level during hospitalization to avoid a spurious association of fatigue with minimum Hb occurring after fatigue was measured. In both Models 1 and 2, minimum Hb remained a predictor of patients’ fatigue levels with similar effect sizes, although in Model 2, the results did not quite reach a statistically significant level, in part due to larger confidence intervals from the smaller sample size of this stratified analysis (Supplemental Table 2a). We further stratified this analysis to include only patients whose transfusion, if they received one, occurred after their minimum Hb and the measurement of their fatigue level to account for the possibility that a transfusion could affect the fatigue level patients report. In this analysis, most of the estimates of the effect of minimum Hb on fatigue were larger than those seen when only analyzing patients whose minimum Hb occurred before the measurement of their fatigue level, although again, the smaller sample size of this additional stratified analysis does produce larger confidence intervals for these estimates (Supplemental Table 2b).
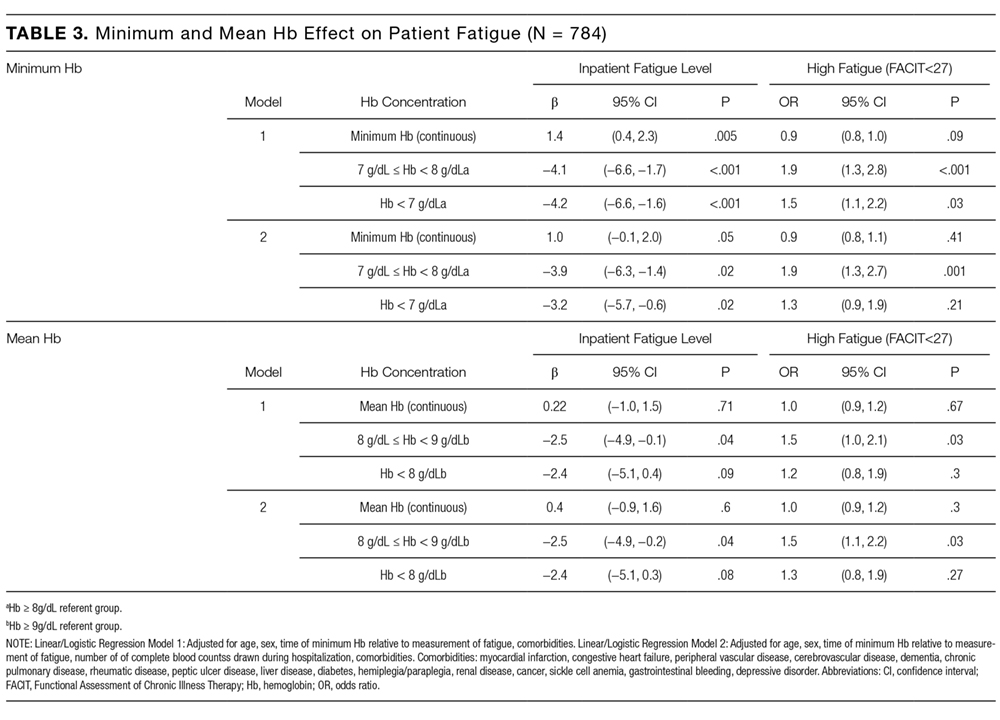
No Hb measure other than minimum or mean had significant association with patient fatigue levels in linear regression models.
Logistic Regression of High Fatigue Level on Hb
Using logistic regression, minimum Hb analyzed as a categorical variable predicted increased odds of a high fatigue level. Patients with a minimum Hb <7 g/dL were 50% (odds ratio [OR] = 1.5; P = 0.03) more likely to have high fatigue and patients with a minimum Hb 7-8 g/dL were 90% (OR = 1.9; P < 0.001) more likely to have high fatigue compared with patients with a minimum Hb ≥8 g/dL in Model 1. These results were similar in Model 2, although the effect was only statistically significant in the 7-8 g/dL Hb group (Table 3). When excluding SC and/or GIB patients, the odds of having high fatigue as minimum Hb decreased were the same or higher for both models compared to the full population of patients. However, again, in Model 2, the effect was only statistically significant in the 7-8 g/dL Hb group (Supplemental Table 1).
Patients with a mean Hb <8 g/dL were 20% to 30% more likely to have high fatigue and patients with mean Hb 8-9 g/dL were 50% more likely to have high fatigue compared with patients with a mean Hb ≥9 g/dL, but the effects were only statistically significant for patients with a mean Hb 8-9 g/dL in both Models 1 and 2 (Table 3). These results were similar when excluding patients with SC and/or GIB, but they were only significant for patients with a mean Hb 8-9 g/dL in Model 1 and patients with a mean Hb <8 g/dL in the Model 2 (Supplemental Table 3).
DISCUSSION
These results demonstrate that minimum Hb during hospitalization is associated with fatigue in hospitalized patients age ≥50 years, and the association is stronger among patients without SC and/or GIB as comorbidities. The analysis of Hb as a continuous and categorical variable and the use of both linear and logistic regression models support the robustness of these associations and illuminate their clinical significance. For example, in linear regression with minimum Hb a continuous variable, the coefficient of 1.4 suggests that an increase of 2 g/dL in Hb, as might be expected from transfusion of 2 units of red blood cells, would be associated with about a 3-point improvement in fatigue. Additionally, as a categorical variable, a minimum Hb ≥8 g/dL compared with a minimum Hb <7 g/dL or 7-8 g/dL is associated with a 3- to 4-point improvement in fatigue. Previous literature suggests that a difference of 3 in the FACIT score is the minimum clinically important difference in fatigue,3 and changes in minimum Hb in either model predict changes in fatigue that are in the range of potential clinical significance.
The clinical significance of the findings is also reflected in the results of the logistic regressions, which may be mapped to potential effects on functional status. Specifically, the odds of having a high fatigue level (FACIT <27) increase 90% for persons with a minimum Hb 7–8 g/dL compared with persons with a minimum Hb ≥8 g/dL. For persons with a minimum Hb <7 g/dL, point estimates suggest a smaller (50%) increase in the odds of high fatigue, but the 95% confidence interval overlaps heavily with the estimate of patients whose minimum Hb is 7-8 g/dL. While it might be expected that patients with a minimum Hb <7 g/dL have greater levels of fatigue compared with patients with a minimum Hb 7-8 g/dL, we did not observe such a pattern. One reason may be that the confidence intervals of our estimated effects are wide enough that we cannot exclude such a pattern. Another possible explanation is that in both groups, the fatigue levels are sufficiently severe, such that the difference in their fatigue levels may not be clinically meaningful. For example, a FACIT score of 23 to 26 has been shown to be associated with an ECOG performance status of 2 to 3, requiring bed rest for at least part of the day.3 Therefore, patients with a minimum Hb 7-8 g/dL (mean FACIT score = 24; Table 2) or a minimum Hb of <7 g/dL (mean FACIT score = 23; Table 2) are already functionally limited to the point of being partially bed bound, such that further decreases in their Hb may not produce additional fatigue in part because they reduce their activity sufficiently to prevent an increase in fatigue. In such cases, the potential benefits of increased Hb may be better assessed by measuring fatigue in response to a specific and provoked activity level, a concept known as fatigability.20
That minimum Hb is more strongly associated with fatigue than any other measure of Hb during hospitalization may not be surprising. Mean, median, maximum, and discharge Hb may all be affected by transfusion during hospitalization that could affect fatigue. Admission Hb may not reflect true oxygen-carrying capacity because of hemoconcentration.
The association between Hb and fatigue in hospitalized patients is important because increased fatigue could contribute to slower clinical recovery in hospitalized patients. Additionally, increased fatigue during hospitalization and at hospital discharge could exacerbate the known deleterious consequences of fatigue on patients and their health outcomes14,15 after hospital discharge. Although one previous study, the Functional Outcomes in Cardiovascular Patients Undergoing Surgical Hip Fracture Repair (FOCUS)8 trial, did not report differences in patients’ fatigue levels at 30 and 60 days postdischarge when transfused at restrictive (8 g/dL) compared with liberal (10 g/dL) Hb thresholds, confidence in the validity of this finding is reduced by the fact that more than half of the patients were lost to follow-up at the 30- and 60-day time points. Further, patients in the restrictive transfusion arm of FOCUS were transfused to maintain Hb levels at or above 8 g/dL. This transfusion threshold of 8 g/dL may have mitigated the high levels of fatigue that are seen in our study when patients’ Hb drops below 8 g/dL, and maintaining a Hb level of 7 g/dL is now the standard of care in stable hospitalized patients. Lastly, FOCUS was limited to postoperative hip fracture patients, and the generalizability of FOCUS to hospitalized medicine patients with anemia is limited.
Therefore, our results support guideline suggestions that practitioners incorporate the presence of patient symptoms such as fatigue into transfusion decisions, particularly if patients’ Hb is <8 g/dL.18 Though reasonable, the suggestion to incorporate symptoms such as fatigue into transfusion decisions has not been strongly supported by evidence so far, and it may often be neglected in practice. Definitive evidence to support such recommendations would benefit from study through an optimal trial18 that incorporates symptoms into decision making. Our findings add support for a study of transfusion strategies that incorporates patients’ fatigue level in addition to Hb concentration.
This study has several limitations. Although our sample size is large and includes patients with a range of comorbidities that we believe are representative of hospitalized general medicine patients, as a single-center, observational study, our results may not be generalizable to other centers. Additionally, although these data support a reliable association between hospitalized patients’ minimum Hb and fatigue level, the observational design of this study cannot prove that this relationship is causal. Also, patients’ Hb values were measured at the discretion of their clinician, and therefore, the measures of Hb were not uniformly measured for participating patients. In addition, fatigue was only measured at one time point during a patient’s hospitalization, and it is possible that patients’ fatigue levels change during hospitalization in relation to variables we did not consider. Finally, our study was not designed to assess the association of Hb with longer-term functional outcomes, which may be of greater concern than fatigue.
CONCLUSION
In hospitalized patients ≥50 years old, minimum Hb is reliably associated with patients’ fatigue level. Patients whose minimum Hb is <8 g/dL experience higher fatigue levels compared to patients whose minimum Hb is ≥8 g/dL. Additional studies are warranted to understand if patients may benefit from improved fatigue levels by correcting their anemia through transfusion.
Disclosure
Dr. Prochaska is supported by an Agency for Healthcare Research and Quality Patient-Centered Outcomes Research Institutional K12 Award (1K12HS023007-01, principal investigator Meltzer). Dr. Meltzer is supported by a National Institutes of Health Clinical and Translational Science Award (2UL1TR000430-06, principal investigator Solway) and a grant from the Patient-Centered Outcomes Research Network in support of the Chicago Patient-Centered Outcomes Research Network. The authors report no conflicts of interest.
1. Yellen SB, Cella DF, Webster K, Blendowski C, Kaplan E. Measuring fatigue and other anemia-related symptoms with the Functional Assessment of Cancer Therapy (FACT) measurement system. J Pain Symptom Manage. 1997;13(2):63-74. PubMed
2. Cella D, Lai JS, Chang CH, Peterman A, Slavin M. Fatigue in cancer patients compared with fatigue in the general United States population. Cancer. 2002;94(2):528-538. doi:10.1002/cncr.10245. PubMed
3. Cella D, Eton DT, Lai J-S, Peterman AH, Merkel DE. Combining anchor and distribution-based methods to derive minimal clinically important differences on the Functional Assessment of Cancer Therapy (FACT) anemia and fatigue scales. J Pain Symptom Manage. 2002;24(6):547-561. PubMed
4. Tonelli M, Hemmelgarn B, Reiman T, et al. Benefits and harms of erythropoiesis-stimulating agents for anemia related to cancer: a meta-analysis. CMAJ Can Med Assoc J J Assoc Medicale Can. 2009;180(11):E62-E71. doi:10.1503/cmaj.090470. PubMed
5. Foley RN, Curtis BM, Parfrey PS. Erythropoietin Therapy, Hemoglobin Targets, and Quality of Life in Healthy Hemodialysis Patients: A Randomized Trial. Clin J Am Soc Nephrol. 2009;4(4):726-733. doi:10.2215/CJN.04950908. PubMed
6. Keown PA, Churchill DN, Poulin-Costello M, et al. Dialysis patients treated with Epoetin alfa show improved anemia symptoms: A new analysis of the Canadian Erythropoietin Study Group trial. Hemodial Int Int Symp Home Hemodial. 2010;14(2):168-173. doi:10.1111/j.1542-4758.2009.00422.x. PubMed
7. Palmer SC, Saglimbene V, Mavridis D, et al. Erythropoiesis-stimulating agents for anaemia in adults with chronic kidney disease: a network meta-analysis. Cochrane Database Syst Rev. 2014:CD010590. PubMed
8. Carson JL, Terrin ML, Noveck H, et al. Liberal or Restrictive Transfusion in high-risk patients after hip surgery. N Engl J Med. 2011;365(26):2453-2462. doi:10.1056/NEJMoa1012452. PubMed
9. Holst LB, Haase N, Wetterslev J, et al. Transfusion requirements in septic shock (TRISS) trial – comparing the effects and safety of liberal versus restrictive red blood cell transfusion in septic shock patients in the ICU: protocol for a randomised controlled trial. Trials. 2013;14:150. doi:10.1186/1745-6215-14-150. PubMed
10. Hébert PC, Wells G, Blajchman MA, et al. A multicenter, randomized, controlled clinical trial of transfusion requirements in critical care. N Engl J Med. 1999;340(6):409-417. doi:10.1056/NEJM199902113400601. PubMed
11. Corwin HL, Theus JW, Cargile CS, Lang NP. Red blood cell transfusion: Impact of an education program and a clinical guideline on transfusion practice. J Hosp Med. 2014;9(12):745-749. doi:10.1002/jhm.2237. PubMed
12. Saxena, S, editor. The Transfusion Committee: Putting Patient Safety First, 2nd Edition. Bethesda (MD): American Association of Blood Banks; 2013.
13. The 2011 National Blood Collection and Utilization Report. http://www.hhs.gov/ash/bloodsafety/2011-nbcus.pdf. Accessed August 16, 2017.
14. Vestergaard S, Nayfield SG, Patel KV, et al. Fatigue in a Representative Population of Older Persons and Its Association With Functional Impairment, Functional Limitation, and Disability. J Gerontol A Biol Sci Med Sci. 2009;64A(1):76-82. doi:10.1093/gerona/gln017. PubMed
15. Gill TM, Desai MM, Gahbauer EA, Holford TR, Williams CS. Restricted activity among community-living older persons: incidence, precipitants, and health care utilization. Ann Intern Med. 2001;135(5):313-321. PubMed
16. Koch CG, Li L, Sun Z, et al. Hospital-acquired anemia: Prevalence, outcomes, and healthcare implications. J Hosp Med. 2013;8(9):506-512. doi:10.1002/jhm.2061. PubMed
17. Meltzer D, Manning WG, Morrison J, et al. Effects of Physician Experience on Costs and Outcomes on an Academic General Medicine Service: Results of a Trial of Hospitalists. Ann Intern Med. 2002;137(11):866-874. doi:10.7326/0003-4819-137-11-200212030-00007. PubMed
18. Carson JL, Grossman BJ, Kleinman S, et al. Red Blood Cell Transfusion: A Clinical Practice Guideline From the AABB*. Ann Intern Med. 2012;157(1):49-58. doi:10.7326/0003-4819-157-1-201206190-00429. PubMed
19. Moreh E, Jacobs JM, Stessman J. Fatigue, function, and mortality in older adults. J Gerontol A Biol Sci Med Sci. 2010;65(8):887-895. doi:10.1093/gerona/glq064. PubMed
20. Eldadah BA. Fatigue and Fatigability in Older Adults. PM&R. 2010;2(5):406-413. doi:10.1016/j.pmrj.2010.03.022. PubMed
21. Hardy SE, Studenski SA. Fatigue Predicts Mortality among Older Adults. J Am Geriatr Soc. 2008;56(10):1910-1914. doi:10.1111/j.1532-5415.2008.01957.x. PubMed
22. Pfeiffer E. A short portable mental status questionnaire for the assessment of organic brain deficit in elderly patients. J Am Geriatr Soc. 1975;23(10):433-441. PubMed
23. Quan H, Sundararajan V, Halfon P, et al. Coding algorithms for defining comorbidities in ICD-9-CM and ICD-10 administrative data. Med Care. 2005;43(11):1130-1139. PubMed
24. HCUP Clinical Classifications Software (CCS) for ICD-9-CM. Healthcare Cost and Utilization Project (HCUP). 2006-2009. Agency for Healthcare Research and Quality, Rockville, MD. https://www.hcup-us.ahrq.gov/toolssoftware/ccs/ccs.jsp. Accessed November 22, 2016.
25. Cella DF, Tulsky DS, Gray G, et al. The Functional Assessment of Cancer Therapy scale: development and validation of the general measure. J Clin Oncol Off J Am Soc Clin Oncol. 1993;11(3):570-579. PubMed
26. Webster K, Cella D, Yost K. The Functional Assessment of Chronic Illness Therapy (FACIT) Measurement System: properties, applications, and interpretation. Health Qual Life Outcomes. 2003;1:79. doi:10.1186/1477-7525-1-79. PubMed
27. Oken MMMD a, Creech RHMD b, Tormey DCMD, et al. Toxicity and response criteria of the Eastern Cooperative Oncology Group. J Clin Oncol. 1982;5(6):649-656. PubMed
Fatigue is the most common clinical symptom of anemia and is a significant concern to patients.1,2 In ambulatory patients, lower hemoglobin (Hb) concentration is associated with increased fatigue.2,3 Accordingly, therapies that treat anemia by increasing Hb concentration, such as erythropoiesis stimulating agents,4-7 often use fatigue as an outcome measure.
In hospitalized patients, transfusion of red blood cell increases Hb concentration and is the primary treatment for anemia. However, the extent to which transfusion and changes in Hb concentration affect hospitalized patients’ fatigue levels is not well established. Guidelines support transfusing patients with symptoms of anemia, such as fatigue, on the assumption that the increased oxygen delivery will improve the symptoms of anemia. While transfusion studies in hospitalized patients have consistently reported that transfusion at lower or “restrictive” Hb concentrations is safe compared with transfusion at higher Hb concentrations,8-10 these studies have mainly used cardiac events and mortality as outcomes rather than patient symptoms, such as fatigue. Nevertheless, they have resulted in hospitals increasingly adopting restrictive transfusion policies that discourage transfusion at higher Hb levels.11,12 Consequently, the rate of transfusion in hospitalized patients has decreased,13 raising questions of whether some patients with lower Hb concentrations may experience increased fatigue as a result of restrictive transfusion policies. Fatigue among hospitalized patients is important not only because it is an adverse symptom but because it may result in decreased activity levels, deconditioning, and losses in functional status.14,15While the effect of alternative transfusion policies on fatigue in hospitalized patients could be answered by a randomized clinical trial using fatigue and functional status as outcomes, an important first step is to assess whether the Hb concentration of hospitalized patients is associated with their fatigue level during hospitalization. Because hospitalized patients often have acute illnesses that can cause fatigue in and of themselves, it is possible that anemia is not associated with fatigue in hospitalized patients despite anemia’s association with fatigue in ambulatory patients. Additionally, Hb concentration varies during hospitalization,16 raising the question of what measures of Hb during hospitalization might be most associated with anemia-related fatigue.
The objective of this study is to explore multiple Hb measures in hospitalized medical patients with anemia and test whether any of these Hb measures are associated with patients’ fatigue level.
METHODS
Study Design
We performed a prospective, observational study of hospitalized patients with anemia on the general medicine services at The University of Chicago Medical Center (UCMC). The institutional review board approved the study procedures, and all study subjects provided informed consent.
Study Eligibility
Between April 2014 and June 2015, all general medicine inpatients were approached for written consent for The University of Chicago Hospitalist Project,17 a research infrastructure at UCMC. Among patients consenting to participate in the Hospitalist Project, patients were eligible if they had Hb <9 g/dL at any point during their hospitalization and were age ≥50 years. Hb concentration of <9 g/dL was chosen to include the range of Hb values covered by most restrictive transfusion policies.8-10,18 Age ≥50 years was an inclusion criteria because anemia is more strongly associated with poor outcomes, including functional impairment, among older patients compared with younger patients.14,19-21 If patients were not eligible for inclusion at the time of consent for the Hospitalist Project, their Hb values were reviewed twice daily until hospital discharge to assess if their Hb was <9 g/dL. Proxies were sought to answer questions for patients who failed the Short Portable Mental Status Questionnaire.22
Patient Demographic Data Collection
Research assistants abstracted patient age and sex from the electronic health record (EHR), and asked patients to self-identify their race. The individual comorbidities included as part of the Charlson Comorbidity Index were identified using International Classification of Diseases, 9th Revision codes from hospital administrative data for each encounter and specifically included the following: myocardial infarction, congestive heart failure, peripheral vascular disease, cerebrovascular disease, dementia, chronic pulmonary disease, rheumatic disease, peptic ulcer disease, liver disease, diabetes, hemiplegia and/or paraplegia, renal disease, cancer, and human immunodeficiency virus/acquired immunodeficiency syndrome.23 We also used Healthcare Cost and Utilization Project (www.hcup-us.ahrq.gov/toolssoftware/ccs/ccs.jsp) diagnosis categories to identify whether patients had sickle cell (SC) anemia, gastrointestinal bleeding (GIB), or a depressive disorder (DD) because these conditions are associated with anemia (SC and GIB) and fatigue (DD).24
Measuring Anemia
Hb measures were available only when hospital providers ordered them as part of routine practice. The first Hb concentration <9 g/dL during a patient’s hospitalization, which made them eligible for study participation, was obtained through manual review of the EHR. All additional Hb values during the patient’s hospitalization were obtained from the hospital’s administrative data mart. All Hb values collected for each patient during the hospitalization were used to calculate summary measures of Hb during the hospitalization, including the mean Hb, median Hb, minimum Hb, maximum Hb, admission (first recorded) Hb, and discharge (last recorded) Hb. Hb measures were analyzed both as a continuous variable and as a categorical variable created by dividing the continuous Hb measures into integer ranges of 3 groups of approximately the same size.
Measuring Fatigue
Our primary outcome was patients’ level of fatigue reported during hospitalization, measured using the Functional Assessment of Chronic Illness Therapy (FACIT)-Anemia questionnaire. Fatigue was measured using a 13-question fatigue subscale,1,2,25 which measures fatigue within the past 7 days. Scores on the fatigue subscale range from 0 to 52, with lower scores reflecting greater levels of fatigue. As soon as patients met the eligibility criteria for study participation during their hospitalization (age ≥50 years and Hb <9 g/dL), they were approached to answer the FACIT questions. Values for missing data in the fatigue subscale for individual subjects were filled in using a prorated score from their answered questions as long as >50% of the items in the fatigue subscale were answered, in accordance with recommendations for addressing missing data in the FACIT.26 Fatigue was analyzed as a continuous variable and as a dichotomous variable created by dividing the sample into high (FACIT <27) and low (FACIT ≥27) levels of fatigue based on the median FACIT score of the population. Previous literature has shown a FACIT fatigue subscale score between 23 and 26 to be associated with an Eastern Cooperative Oncology Group (ECOG)27 C Performance Status rating of 2 to 33 compared to scores ≥27.
Statistical Analysis
Statistical analysis was performed using Stata statistical software (StataCorp, College Station, Texas). Descriptive statistics were used to characterize patient demographics. Analysis of variance was used to test for differences in the mean fatigue levels across Hb measures. χ2 tests were performed to test for associations between high fatigue levels and the Hb measures. Multivariable analysis, including both linear and logistic regression models, were used to test the association of Hb concentration and fatigue. P values <0.05 using a 2-tailed test were deemed statistically significant.
RESULTS
Patient Characteristics
During the study period, 8559 patients were admitted to the general medicine service. Of those, 5073 (59%) consented for participation in the Hospitalist Project, and 3670 (72%) completed the Hospitalist Project inpatient interview. Of these patients, 1292 (35%) had Hb <9 g/dL, and 784 (61%) were 50 years or older and completed the FACIT questionnaire.
Table 1 reports the demographic characteristics and comorbidities for the sample, the mean (standard deviation [SD]) for the 6 Hb measures, and mean (SD) and median FACIT scores.
Bivariate Association of Fatigue and Hb
Categorizing patients into low, middle, or high Hb for each of the 6 Hb measures, minimum Hb was strongly associated with fatigue, with a weaker association for mean Hb and no statistically significant association for the other measures.
Minimum Hb
Patients with a minimum Hb <7 g/dL and patients with Hb 7-8 g/dL had higher fatigue levels (FACIT = 25 for each) than patients with a minimum Hb ≥8 g/dL (FACIT = 29; P < 0.001; Table 2). When excluding patients with SC and/or GIB because their average minimum Hb differed from the average minimum Hb of the full population (P < 0.001), patients with a minimum Hb <7 g/dL or 7-8 g/dL had even higher fatigue levels (FACIT = 23 and FACIT = 24, respectively), with no change in the fatigue level of patients with a minimum Hb ≥8 g/dL (FACIT = 29; P < 0.001; Table 2). Lower minimum Hb continued to be associated with higher fatigue levels when analyzed in 0.5 g/dL increments (Figure).
Mean Hb and Other Measures
Fatigue levels were high for 47% of patients with a mean Hb <8g /dL and 53% of patients with a mean Hb 8-9 g/dL compared with 43% of patients with a mean Hb ≥9 g/dL (P = 0.05). However, the association between high fatigue and mean Hb was not statistically significant when patients with SC and/or GIB were excluded (Table 2). None of the other 4 Hb measures was significantly associated with fatigue.
Linear Regression of Fatigue on Hb
In linear regression models, minimum Hb consistently predicted patient fatigue, mean Hb had a less robust association with fatigue, and the other Hb measures were not associated with patient fatigue. Increases in minimum Hb (analyzed as a continuous variable) were associated with reduced fatigue (higher FACIT score; β = 1.4; P = 0.005). In models in which minimum Hb was a categorical variable, patients with a minimum Hb of <7 g/dL or 7-8 g/dL had greater fatigue (lower FACIT score) than patients whose minimum Hb was ≥8 g/dL (Hb <7 g/dL: β = −4.2; P ≤ 0.001; Hb 7-8 g/dL: β = −4.1; P < 0.001). These results control for patients’ age, sex, individual comorbidities, and whether their minimum Hb occurred before or after the measurement of fatigue during hospitalization (Model 1), and the results are unchanged when also controlling for the number of Hb laboratory draws patients had during their hospitalization (Model 2; Table 3). In a stratified analysis excluding patients with either SC and/or GIB, changes in minimum Hb were associated with larger changes in patient fatigue levels (Supplemental Table 1). We also stratified our analysis to include only patients whose minimum Hb occurred before the measurement of their fatigue level during hospitalization to avoid a spurious association of fatigue with minimum Hb occurring after fatigue was measured. In both Models 1 and 2, minimum Hb remained a predictor of patients’ fatigue levels with similar effect sizes, although in Model 2, the results did not quite reach a statistically significant level, in part due to larger confidence intervals from the smaller sample size of this stratified analysis (Supplemental Table 2a). We further stratified this analysis to include only patients whose transfusion, if they received one, occurred after their minimum Hb and the measurement of their fatigue level to account for the possibility that a transfusion could affect the fatigue level patients report. In this analysis, most of the estimates of the effect of minimum Hb on fatigue were larger than those seen when only analyzing patients whose minimum Hb occurred before the measurement of their fatigue level, although again, the smaller sample size of this additional stratified analysis does produce larger confidence intervals for these estimates (Supplemental Table 2b).
No Hb measure other than minimum or mean had significant association with patient fatigue levels in linear regression models.
Logistic Regression of High Fatigue Level on Hb
Using logistic regression, minimum Hb analyzed as a categorical variable predicted increased odds of a high fatigue level. Patients with a minimum Hb <7 g/dL were 50% (odds ratio [OR] = 1.5; P = 0.03) more likely to have high fatigue and patients with a minimum Hb 7-8 g/dL were 90% (OR = 1.9; P < 0.001) more likely to have high fatigue compared with patients with a minimum Hb ≥8 g/dL in Model 1. These results were similar in Model 2, although the effect was only statistically significant in the 7-8 g/dL Hb group (Table 3). When excluding SC and/or GIB patients, the odds of having high fatigue as minimum Hb decreased were the same or higher for both models compared to the full population of patients. However, again, in Model 2, the effect was only statistically significant in the 7-8 g/dL Hb group (Supplemental Table 1).
Patients with a mean Hb <8 g/dL were 20% to 30% more likely to have high fatigue and patients with mean Hb 8-9 g/dL were 50% more likely to have high fatigue compared with patients with a mean Hb ≥9 g/dL, but the effects were only statistically significant for patients with a mean Hb 8-9 g/dL in both Models 1 and 2 (Table 3). These results were similar when excluding patients with SC and/or GIB, but they were only significant for patients with a mean Hb 8-9 g/dL in Model 1 and patients with a mean Hb <8 g/dL in the Model 2 (Supplemental Table 3).
DISCUSSION
These results demonstrate that minimum Hb during hospitalization is associated with fatigue in hospitalized patients age ≥50 years, and the association is stronger among patients without SC and/or GIB as comorbidities. The analysis of Hb as a continuous and categorical variable and the use of both linear and logistic regression models support the robustness of these associations and illuminate their clinical significance. For example, in linear regression with minimum Hb a continuous variable, the coefficient of 1.4 suggests that an increase of 2 g/dL in Hb, as might be expected from transfusion of 2 units of red blood cells, would be associated with about a 3-point improvement in fatigue. Additionally, as a categorical variable, a minimum Hb ≥8 g/dL compared with a minimum Hb <7 g/dL or 7-8 g/dL is associated with a 3- to 4-point improvement in fatigue. Previous literature suggests that a difference of 3 in the FACIT score is the minimum clinically important difference in fatigue,3 and changes in minimum Hb in either model predict changes in fatigue that are in the range of potential clinical significance.
The clinical significance of the findings is also reflected in the results of the logistic regressions, which may be mapped to potential effects on functional status. Specifically, the odds of having a high fatigue level (FACIT <27) increase 90% for persons with a minimum Hb 7–8 g/dL compared with persons with a minimum Hb ≥8 g/dL. For persons with a minimum Hb <7 g/dL, point estimates suggest a smaller (50%) increase in the odds of high fatigue, but the 95% confidence interval overlaps heavily with the estimate of patients whose minimum Hb is 7-8 g/dL. While it might be expected that patients with a minimum Hb <7 g/dL have greater levels of fatigue compared with patients with a minimum Hb 7-8 g/dL, we did not observe such a pattern. One reason may be that the confidence intervals of our estimated effects are wide enough that we cannot exclude such a pattern. Another possible explanation is that in both groups, the fatigue levels are sufficiently severe, such that the difference in their fatigue levels may not be clinically meaningful. For example, a FACIT score of 23 to 26 has been shown to be associated with an ECOG performance status of 2 to 3, requiring bed rest for at least part of the day.3 Therefore, patients with a minimum Hb 7-8 g/dL (mean FACIT score = 24; Table 2) or a minimum Hb of <7 g/dL (mean FACIT score = 23; Table 2) are already functionally limited to the point of being partially bed bound, such that further decreases in their Hb may not produce additional fatigue in part because they reduce their activity sufficiently to prevent an increase in fatigue. In such cases, the potential benefits of increased Hb may be better assessed by measuring fatigue in response to a specific and provoked activity level, a concept known as fatigability.20
That minimum Hb is more strongly associated with fatigue than any other measure of Hb during hospitalization may not be surprising. Mean, median, maximum, and discharge Hb may all be affected by transfusion during hospitalization that could affect fatigue. Admission Hb may not reflect true oxygen-carrying capacity because of hemoconcentration.
The association between Hb and fatigue in hospitalized patients is important because increased fatigue could contribute to slower clinical recovery in hospitalized patients. Additionally, increased fatigue during hospitalization and at hospital discharge could exacerbate the known deleterious consequences of fatigue on patients and their health outcomes14,15 after hospital discharge. Although one previous study, the Functional Outcomes in Cardiovascular Patients Undergoing Surgical Hip Fracture Repair (FOCUS)8 trial, did not report differences in patients’ fatigue levels at 30 and 60 days postdischarge when transfused at restrictive (8 g/dL) compared with liberal (10 g/dL) Hb thresholds, confidence in the validity of this finding is reduced by the fact that more than half of the patients were lost to follow-up at the 30- and 60-day time points. Further, patients in the restrictive transfusion arm of FOCUS were transfused to maintain Hb levels at or above 8 g/dL. This transfusion threshold of 8 g/dL may have mitigated the high levels of fatigue that are seen in our study when patients’ Hb drops below 8 g/dL, and maintaining a Hb level of 7 g/dL is now the standard of care in stable hospitalized patients. Lastly, FOCUS was limited to postoperative hip fracture patients, and the generalizability of FOCUS to hospitalized medicine patients with anemia is limited.
Therefore, our results support guideline suggestions that practitioners incorporate the presence of patient symptoms such as fatigue into transfusion decisions, particularly if patients’ Hb is <8 g/dL.18 Though reasonable, the suggestion to incorporate symptoms such as fatigue into transfusion decisions has not been strongly supported by evidence so far, and it may often be neglected in practice. Definitive evidence to support such recommendations would benefit from study through an optimal trial18 that incorporates symptoms into decision making. Our findings add support for a study of transfusion strategies that incorporates patients’ fatigue level in addition to Hb concentration.
This study has several limitations. Although our sample size is large and includes patients with a range of comorbidities that we believe are representative of hospitalized general medicine patients, as a single-center, observational study, our results may not be generalizable to other centers. Additionally, although these data support a reliable association between hospitalized patients’ minimum Hb and fatigue level, the observational design of this study cannot prove that this relationship is causal. Also, patients’ Hb values were measured at the discretion of their clinician, and therefore, the measures of Hb were not uniformly measured for participating patients. In addition, fatigue was only measured at one time point during a patient’s hospitalization, and it is possible that patients’ fatigue levels change during hospitalization in relation to variables we did not consider. Finally, our study was not designed to assess the association of Hb with longer-term functional outcomes, which may be of greater concern than fatigue.
CONCLUSION
In hospitalized patients ≥50 years old, minimum Hb is reliably associated with patients’ fatigue level. Patients whose minimum Hb is <8 g/dL experience higher fatigue levels compared to patients whose minimum Hb is ≥8 g/dL. Additional studies are warranted to understand if patients may benefit from improved fatigue levels by correcting their anemia through transfusion.
Disclosure
Dr. Prochaska is supported by an Agency for Healthcare Research and Quality Patient-Centered Outcomes Research Institutional K12 Award (1K12HS023007-01, principal investigator Meltzer). Dr. Meltzer is supported by a National Institutes of Health Clinical and Translational Science Award (2UL1TR000430-06, principal investigator Solway) and a grant from the Patient-Centered Outcomes Research Network in support of the Chicago Patient-Centered Outcomes Research Network. The authors report no conflicts of interest.
1. Yellen SB, Cella DF, Webster K, Blendowski C, Kaplan E. Measuring fatigue and other anemia-related symptoms with the Functional Assessment of Cancer Therapy (FACT) measurement system. J Pain Symptom Manage. 1997;13(2):63-74. PubMed
2. Cella D, Lai JS, Chang CH, Peterman A, Slavin M. Fatigue in cancer patients compared with fatigue in the general United States population. Cancer. 2002;94(2):528-538. doi:10.1002/cncr.10245. PubMed
3. Cella D, Eton DT, Lai J-S, Peterman AH, Merkel DE. Combining anchor and distribution-based methods to derive minimal clinically important differences on the Functional Assessment of Cancer Therapy (FACT) anemia and fatigue scales. J Pain Symptom Manage. 2002;24(6):547-561. PubMed
4. Tonelli M, Hemmelgarn B, Reiman T, et al. Benefits and harms of erythropoiesis-stimulating agents for anemia related to cancer: a meta-analysis. CMAJ Can Med Assoc J J Assoc Medicale Can. 2009;180(11):E62-E71. doi:10.1503/cmaj.090470. PubMed
5. Foley RN, Curtis BM, Parfrey PS. Erythropoietin Therapy, Hemoglobin Targets, and Quality of Life in Healthy Hemodialysis Patients: A Randomized Trial. Clin J Am Soc Nephrol. 2009;4(4):726-733. doi:10.2215/CJN.04950908. PubMed
6. Keown PA, Churchill DN, Poulin-Costello M, et al. Dialysis patients treated with Epoetin alfa show improved anemia symptoms: A new analysis of the Canadian Erythropoietin Study Group trial. Hemodial Int Int Symp Home Hemodial. 2010;14(2):168-173. doi:10.1111/j.1542-4758.2009.00422.x. PubMed
7. Palmer SC, Saglimbene V, Mavridis D, et al. Erythropoiesis-stimulating agents for anaemia in adults with chronic kidney disease: a network meta-analysis. Cochrane Database Syst Rev. 2014:CD010590. PubMed
8. Carson JL, Terrin ML, Noveck H, et al. Liberal or Restrictive Transfusion in high-risk patients after hip surgery. N Engl J Med. 2011;365(26):2453-2462. doi:10.1056/NEJMoa1012452. PubMed
9. Holst LB, Haase N, Wetterslev J, et al. Transfusion requirements in septic shock (TRISS) trial – comparing the effects and safety of liberal versus restrictive red blood cell transfusion in septic shock patients in the ICU: protocol for a randomised controlled trial. Trials. 2013;14:150. doi:10.1186/1745-6215-14-150. PubMed
10. Hébert PC, Wells G, Blajchman MA, et al. A multicenter, randomized, controlled clinical trial of transfusion requirements in critical care. N Engl J Med. 1999;340(6):409-417. doi:10.1056/NEJM199902113400601. PubMed
11. Corwin HL, Theus JW, Cargile CS, Lang NP. Red blood cell transfusion: Impact of an education program and a clinical guideline on transfusion practice. J Hosp Med. 2014;9(12):745-749. doi:10.1002/jhm.2237. PubMed
12. Saxena, S, editor. The Transfusion Committee: Putting Patient Safety First, 2nd Edition. Bethesda (MD): American Association of Blood Banks; 2013.
13. The 2011 National Blood Collection and Utilization Report. http://www.hhs.gov/ash/bloodsafety/2011-nbcus.pdf. Accessed August 16, 2017.
14. Vestergaard S, Nayfield SG, Patel KV, et al. Fatigue in a Representative Population of Older Persons and Its Association With Functional Impairment, Functional Limitation, and Disability. J Gerontol A Biol Sci Med Sci. 2009;64A(1):76-82. doi:10.1093/gerona/gln017. PubMed
15. Gill TM, Desai MM, Gahbauer EA, Holford TR, Williams CS. Restricted activity among community-living older persons: incidence, precipitants, and health care utilization. Ann Intern Med. 2001;135(5):313-321. PubMed
16. Koch CG, Li L, Sun Z, et al. Hospital-acquired anemia: Prevalence, outcomes, and healthcare implications. J Hosp Med. 2013;8(9):506-512. doi:10.1002/jhm.2061. PubMed
17. Meltzer D, Manning WG, Morrison J, et al. Effects of Physician Experience on Costs and Outcomes on an Academic General Medicine Service: Results of a Trial of Hospitalists. Ann Intern Med. 2002;137(11):866-874. doi:10.7326/0003-4819-137-11-200212030-00007. PubMed
18. Carson JL, Grossman BJ, Kleinman S, et al. Red Blood Cell Transfusion: A Clinical Practice Guideline From the AABB*. Ann Intern Med. 2012;157(1):49-58. doi:10.7326/0003-4819-157-1-201206190-00429. PubMed
19. Moreh E, Jacobs JM, Stessman J. Fatigue, function, and mortality in older adults. J Gerontol A Biol Sci Med Sci. 2010;65(8):887-895. doi:10.1093/gerona/glq064. PubMed
20. Eldadah BA. Fatigue and Fatigability in Older Adults. PM&R. 2010;2(5):406-413. doi:10.1016/j.pmrj.2010.03.022. PubMed
21. Hardy SE, Studenski SA. Fatigue Predicts Mortality among Older Adults. J Am Geriatr Soc. 2008;56(10):1910-1914. doi:10.1111/j.1532-5415.2008.01957.x. PubMed
22. Pfeiffer E. A short portable mental status questionnaire for the assessment of organic brain deficit in elderly patients. J Am Geriatr Soc. 1975;23(10):433-441. PubMed
23. Quan H, Sundararajan V, Halfon P, et al. Coding algorithms for defining comorbidities in ICD-9-CM and ICD-10 administrative data. Med Care. 2005;43(11):1130-1139. PubMed
24. HCUP Clinical Classifications Software (CCS) for ICD-9-CM. Healthcare Cost and Utilization Project (HCUP). 2006-2009. Agency for Healthcare Research and Quality, Rockville, MD. https://www.hcup-us.ahrq.gov/toolssoftware/ccs/ccs.jsp. Accessed November 22, 2016.
25. Cella DF, Tulsky DS, Gray G, et al. The Functional Assessment of Cancer Therapy scale: development and validation of the general measure. J Clin Oncol Off J Am Soc Clin Oncol. 1993;11(3):570-579. PubMed
26. Webster K, Cella D, Yost K. The Functional Assessment of Chronic Illness Therapy (FACIT) Measurement System: properties, applications, and interpretation. Health Qual Life Outcomes. 2003;1:79. doi:10.1186/1477-7525-1-79. PubMed
27. Oken MMMD a, Creech RHMD b, Tormey DCMD, et al. Toxicity and response criteria of the Eastern Cooperative Oncology Group. J Clin Oncol. 1982;5(6):649-656. PubMed
© 2017 Society of Hospital Medicine
Trends in Hospitalization for Opioid Overdose among Rural Compared to Urban Residents of the United States, 2007-2014
Background
Hospitalizations and deaths due to opioid overdose have increased over the last decades, straining the healthcare system and generating substantial costs.1-4Hospitalizations for overdose also represent opportunities to intervene in the opioid epidemic by linking patients to resources for nonpharmacologic chronic pain treatment resources or substance use treatment services during and following hospitalization.5,6Studies of trends in the frequency of hospitalizations for opioid overdose in rural and urban areas are necessary to inform planning and resource allocation for inpatient and postdischarge transitional care.
Nonmedical opioid use and opioid-related deaths and injuries appear to be higher in rural areas.7,8 As well, rural areas tend to be more under-resourced in terms of substance abuse treatment and chronic pain specialty services.9,10 Contemporaneous with rising opioid use has been an increasing trend of rural hospital closures.11 This may compound the impact of opioid-related hospitalizations on remaining rural hospitals and lead to increasing reliance on more distant, urban hospitals to treat and discharge patients with overdoses. Rural residents who are admitted or transferred to urban hospitals may face distinct challenges. Similarly, urban hospitals may struggle during discharge planning to link patients to substance use treatment services in less familiar rural communities.
To better define the differential impact of the opioid epidemic based on patient rurality, we described trends in rates of hospitalization for opioid overdose among rural residents compared with urban residents of the United States. We separated hospitalizations into those due to overdose of prescription opioids, and those related to heroin. Among rural residents who overdosed on opioids, we examined trends in admission to rural versus urban hospitals.
METHODS
Data Source
We analyzed data from the National Inpatient Sample (NIS) from 2007 to 2014, developed by the Healthcare Cost and Utilization Project (HCUP). NIS yields nationally representative estimates of inpatient stays in community hospitals in the United States, regardless of payer. Rehabilitation and long-term care hospital stays are excluded. Prior to 2012, NIS included data on all discharges from a 20% sample of hospitals. Beginning in 2012, NIS included a 20% sample of discharges from all HCUP hospitals. We used weights to estimate trends in the total number of hospital admissions for heroin and prescription opioid overdose (POD) in the US by year, accounting for the change in sampling design in 2012 as recommended by HCUP. Standard errors for estimates accounted for the complex sample design.12 We used data from the US Census American Community Survey on the US population in rural versus urban areas for each year to calculate overdose admission rates per 100,000 residents.
Target Population
Following methods applied in previous analyses of NIS data,1,4,13 we identified hospitalizations for heroin or POD based on International Classification of Diseases 9th Clinical Modification (ICD-9-CM) codes. We use the lay term “overdose” to refer to admissions defined by the medical term “poisoning.” In each year between 2007 and 2013, we determined the total number of admissions due to heroin or prescription opioid by considering ICD-9CM codes 965.00 (poisoning by opium), 965.01 (poisoning by heroin), or 965.09 (poisoning by other opiates and related narcotics); or E code E850.0 (accidental poisoning by heroin); or 850.2 (accidental poisoning by opiates and related narcotics) in any position. We defined admissions for heroin overdose (HOD) as 965.01 or E code of E850.0 in any position, and admissions for POD not related to heroin as 965.00, or 965.09, or E code 850.2 in any position excluding admissions with any heroin-related code 965.01 or E code E850.0 or E935.0 (adverse effects of heroin). We excluded hospitalizations in which a patient was transferred out to another acute care facility to avoid duplicate counting.
Analysis
We classified these admissions based on patient residence in a rural versus urban area. NIS contained a variable representing rural versus urban patient residence based on the county-level framework maintained by the Office of Management and Budget, supplemented with information from Urban Influence Codes developed by the Economic Research Service of the US Department of Agriculture.14 We used this information to create a 3-level variable for patient residence: rural (ie, nonmetropolitan areas with a population less than 50,000), small metropolitan (ie, metropolitan areas with a population of 50,000–999,999), and large metropolitan (ie, metropolitan areas with a population of 1,000,000 or greater). We explored further separating categories (eg, breaking rural into micropolitan population centers and other), but this did not further discriminate admission rates.
For each study year, we combined results on overdose admissions with data on the total populations for each of these 3 areas in the US based on American Community Survey data in order to calculate rates of each type of admission per 100,000 persons. To compare pharmaceutical opioids to heroin, we examined pharmaceutical-only overdoses and heroin-only overdoses. We also examined patient age, sex, race and/or ethnicity, and whether they were admitted to a rural or urban hospital based on the hospital location code contained in NIS, and compared these characteristics across residence categories; we presented characteristics for years 2012 to 2014 combined as recent characteristics are most relevant.
The authors had full access to and take full responsibility for the integrity of the data. All analyses were conducted using SAS statistical software version 9.2 (SAS Institute, Cary, North Carolina). The study was reviewed by the University of Iowa Institutional Review Board and the Iowa City Veterans Affairs Healthcare System Research and Development Committee and was judged human subject research exempt.
RESULTS
Characteristics of Patients with Opioids Overdose Admissions
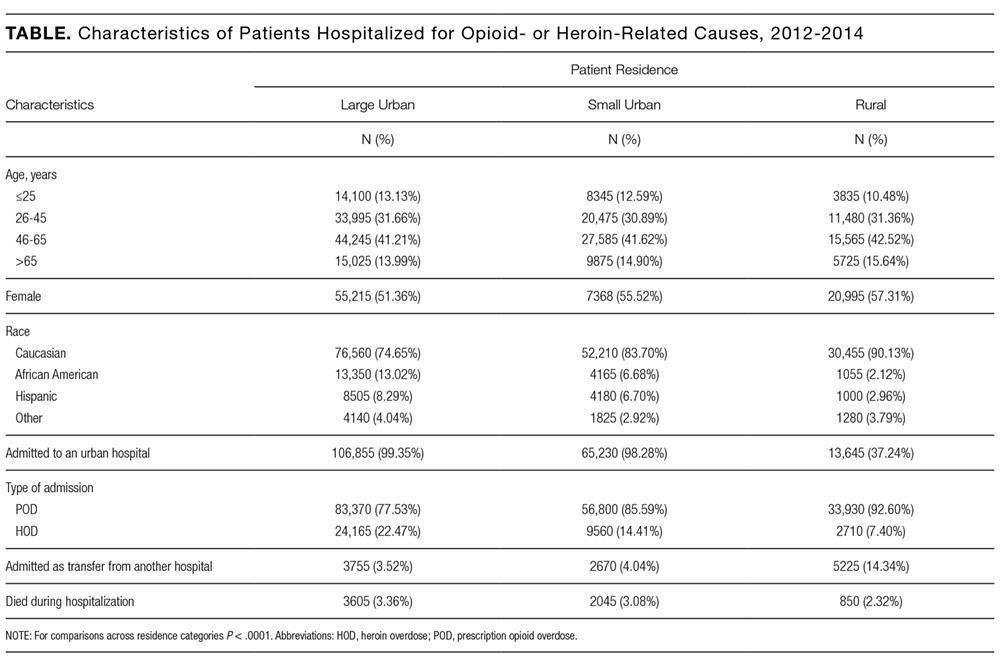
Opioid Overdose Admission Trends by Patient Residence
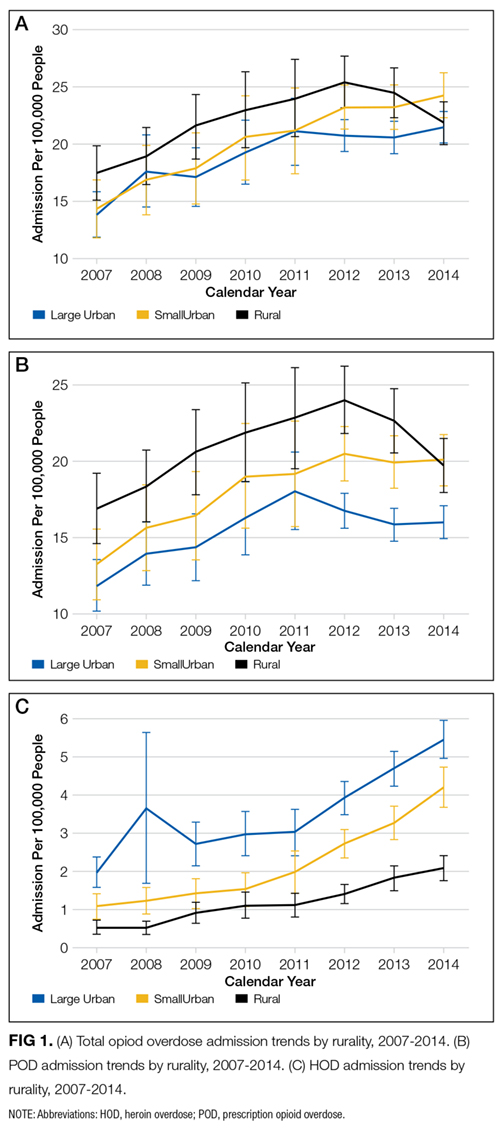
Opioid Overdose Admissions among Rural Residents to Urban and Rural Hospitals
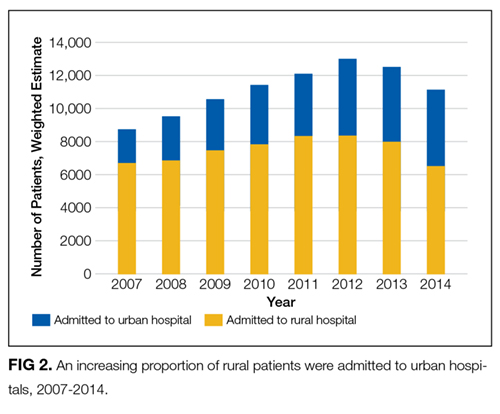
DISCUSSION
Up until 2013, hospital admissions for POD occurred at a higher rate among rural US residents than their urban counterparts. Rates of admission of rural residents for POD have decreased since 2012; a similar trend was not observed among urban residents. Over this same interval, rates of hospitalization for HOD among rural residents continued to increase.
Hospital admission is one sequela of harm related to opioid use: patients experiencing opioid overdose or poisoning may be treated by emergency responders, in emergency departments or on observation status, or may die prior to receiving medical attention or presenting for hospital admission. Factors potentially driving the trends described include patient behaviors, opioid availability, prehospital and hospital treatment practices, and hospital closures. Recent work describing increased opioid overdose deaths15 and high opioid-related mortality in rural areas16 suggests that overdose admission and death rates may be divergent. Changing policies governing naloxone availability and administration17 and ongoing trends in rural hospital closures11 may differentially affect the rates at which rural and urban residents who experience overdose are hospitalized.
Hospital admission also represents a potential point-of-entry into subsequent treatment to reduce risk of further opioid-related harms. Decreasing rates of admission could conceivably result in decreasing opportunities to engage in care. Rural and urban patient populations are distinct; an understanding of these distinctions may help to inform how hospitals structure inpatient treatment and discharge planning for overdose patients. Overdose is likely to suggest either an underlying substance use disorder or a chronic pain condition requiring risky levels of prescribed opioids, and therefore is indicative of a persistent condition requiring follow-up care. Thus, there is a need for treatment models and transition care systems aimed at providing adequate care for these populations both in the acute setting and following hospital discharge. The increasing proportion of rural residents admitted to urban hospitals with opioid overdoses highlights the need for urban hospitals to develop relationships with substance use treatment and chronic pain services in rural areas to facilitate linkage to treatment at discharge.
Limitations of this study include the use of ICD-9-CM codes from administrative data to identify hospitalizations for prescription opioid and heroin overdose. While we have used the common term “overdose,” opioid adverse events may occasion hospitalization in the absence of overdose or as a result of patients taking opioid doses in the quantity prescribed. As such, the term overdose does not necessarily imply the behavior of intentional or unintentional excess use. Additionally, coding depends on providers diagnosing and documenting conditions and may be subject to secular trends independent of overdose prevalence. We included data through 2014, the most recent year of data available at time of analyses.
CONCLUSION
Hospitals can expect to continue to treat patients presenting with opioid overdose. As overdose is likely to suggest either an underlying substance use disorder or a chronic pain condition requiring risky levels of prescribed opioids, there will be a need for treatment models and transition care systems to provide adequate care for these populations both in the acute setting and following hospital discharge. Rates of admission among rural residents declined during the last 2 years of the study period, and rural residents who were hospitalized for opioid overdose were increasingly receiving care in urban hospitals. While factors driving these trends remain to be elucidated, the trends themselves highlight a need to consider the differential challenges facing rural and urban residents who overdose. Access to resources and transportation and other challenges are distinct in urban and rural areas, with rural areas being less likely to have providers in addiction medicine, psychiatry, and pain specialties. Efforts to address these challenges will need to explore models and solutions applicable to differentially resourced hospital and postdischarge settings.
Disclosure
The work reported here was supported by the Department of Veterans Affairs, Veterans Health Administration, Office of Rural Health, Veterans Rural Health Resource Center-Central Region, and the Health Services Research and Development Service through the Comprehensive Access and Delivery Research and Evaluation Center (HFP 04-149). This manuscript is not under review elsewhere and there is no prior publication or presentation of manuscript contents. The views expressed in this article are those of the authors and do not necessarily represent the views of the Department of Veterans Affairs. The authors report no conflict of interest in regards to this study. Data: Available to researchers with VA accreditation. Statistical Code: Available to interested readers by contacting Dr. Ohl. Protocol: Available to interested readers by contacting Dr. Ohl.
1. Ronan MV, Herzig SJ. Hospitalizations Related To Opioid Abuse/Dependence And Associated Serious Infections Increased Sharply, 2002-12. Health Aff (Millwood). 2016;35:832-837. PubMed
2. Florence CS, Zhou C, Luo F, Xu L. The Economic Burden of Prescription Opioid Overdose, Abuse, and Dependence in the United States, 2013. Med Care. 2016;54:901-906. PubMed
3. Jennifer PS, Michael JW, Douglas H, John M, Michael DH. The Critical Care Crisis of Opioid Overdoses in the U.S. In: C95 OUTSTANDING EPIDEMIOLOGY AND HEALTH SERVICES RESEARCH IN CRITICAL CARE: American Thoracic Society 2016 International Conference; 2016 May 13-18; San Francisco, CA:A6146-A.
4. Owens PL, Barrett ML, Weiss AJ, Washington RE, Kronick R. Hospital Inpatient Utilization Related to Opioid Overuse Among Adults, 1993-2012: Statistical Brief #177. Healthcare Cost and Utilization Project (HCUP) Statistical Briefs; 2006. https://www.hcup-us.ahrq.gov/reports/statbriefs/sb177-Hospitalizations-for-Opioid-Overuse.jsp. Accessed January 4, 2017
5. Fanucchi L, Lofwall MR. Putting Parity into Practice - Integrating Opioid-Use Disorder Treatment into the Hospital Setting. N Engl J Med. 2016;375:811-813. PubMed
6. Liebschutz JM, Crooks D, Herman D, et al. Buprenorphine treatment for hospitalized, opioid-dependent patients: a randomized clinical trial. JAMA Intern Med. 2014;174:1369-1376. PubMed
7. Keyes KM, Cerda M, Brady JE, Havens JR, Galea S. Understanding the rural-urban differences in nonmedical prescription opioid use and abuse in the United States. Am J Public Health. 2014;104:e52-e59. PubMed
8. Rigg KK, Monnat SM. Urban vs. rural differences in prescription opioid misuse among adults in the United States: informing region specific drug policies and interventions. Int J Drug Policy. 2015;26:484-491. PubMed
9. Ellis AR, Konrad TR, Thomas KC, Morrissey JP. County-level estimates of mental health professional supply in the United States. Psychiatr Serv. 2009;60:1315-1322. PubMed
10. Rosenblatt RA, Andrilla CH, Catlin M, Larson EH. Geographic and specialty distribution of US physicians trained to treat opioid use disorder. Ann Fam Med. 2015;13:23-26. PubMed
11. Kaufman BG, Thomas SR, Randolph RK, et al. The Rising Rate of Rural Hospital Closures. J Rural Health. 2016;32:35-43. PubMed
12. Houchens RL DR, A Elixhauser. Using the HCUP National Inpatient Sample to Estimate Trends: U.S. Agency for Healthcare Research and Quality; 2015. Report No.: 2006-05
13. Unick GJ, Rosenblum D, Mars S, Ciccarone D. Intertwined epidemics: national demographic trends in hospitalizations for heroin- and opioid-related overdoses, 1993-2009. PLoS One. 2013;8:e54496.
14. Urban Influence Codes. USDA, 2016. https://www.ers.usda.gov/data-products/urban-influence-codes.aspx. Accessed January 4, 2017
15. Rudd RA, Seth P, David F, Scholl L. Increases in Drug and Opioid-Involved Overdose Deaths - United States, 2010-2015. MMWR Morb Mortal Wkly Rep. 2016;65:1445-1452. PubMed
16. Case A, Deaton A. Rising morbidity and mortality in midlife among white non-Hispanic Americans in the 21st century. Proc Natl Acad Sci U S A. 2015;112:15078-15083. PubMed
17. Davis CS, Southwell JK, Niehaus VR, Walley AY, Dailey MW. Emergency medical services naloxone access: a national systematic legal review. Acad Emerg Med. 2014;21:1173-1177. PubMed
Background
Hospitalizations and deaths due to opioid overdose have increased over the last decades, straining the healthcare system and generating substantial costs.1-4Hospitalizations for overdose also represent opportunities to intervene in the opioid epidemic by linking patients to resources for nonpharmacologic chronic pain treatment resources or substance use treatment services during and following hospitalization.5,6Studies of trends in the frequency of hospitalizations for opioid overdose in rural and urban areas are necessary to inform planning and resource allocation for inpatient and postdischarge transitional care.
Nonmedical opioid use and opioid-related deaths and injuries appear to be higher in rural areas.7,8 As well, rural areas tend to be more under-resourced in terms of substance abuse treatment and chronic pain specialty services.9,10 Contemporaneous with rising opioid use has been an increasing trend of rural hospital closures.11 This may compound the impact of opioid-related hospitalizations on remaining rural hospitals and lead to increasing reliance on more distant, urban hospitals to treat and discharge patients with overdoses. Rural residents who are admitted or transferred to urban hospitals may face distinct challenges. Similarly, urban hospitals may struggle during discharge planning to link patients to substance use treatment services in less familiar rural communities.
To better define the differential impact of the opioid epidemic based on patient rurality, we described trends in rates of hospitalization for opioid overdose among rural residents compared with urban residents of the United States. We separated hospitalizations into those due to overdose of prescription opioids, and those related to heroin. Among rural residents who overdosed on opioids, we examined trends in admission to rural versus urban hospitals.
METHODS
Data Source
We analyzed data from the National Inpatient Sample (NIS) from 2007 to 2014, developed by the Healthcare Cost and Utilization Project (HCUP). NIS yields nationally representative estimates of inpatient stays in community hospitals in the United States, regardless of payer. Rehabilitation and long-term care hospital stays are excluded. Prior to 2012, NIS included data on all discharges from a 20% sample of hospitals. Beginning in 2012, NIS included a 20% sample of discharges from all HCUP hospitals. We used weights to estimate trends in the total number of hospital admissions for heroin and prescription opioid overdose (POD) in the US by year, accounting for the change in sampling design in 2012 as recommended by HCUP. Standard errors for estimates accounted for the complex sample design.12 We used data from the US Census American Community Survey on the US population in rural versus urban areas for each year to calculate overdose admission rates per 100,000 residents.
Target Population
Following methods applied in previous analyses of NIS data,1,4,13 we identified hospitalizations for heroin or POD based on International Classification of Diseases 9th Clinical Modification (ICD-9-CM) codes. We use the lay term “overdose” to refer to admissions defined by the medical term “poisoning.” In each year between 2007 and 2013, we determined the total number of admissions due to heroin or prescription opioid by considering ICD-9CM codes 965.00 (poisoning by opium), 965.01 (poisoning by heroin), or 965.09 (poisoning by other opiates and related narcotics); or E code E850.0 (accidental poisoning by heroin); or 850.2 (accidental poisoning by opiates and related narcotics) in any position. We defined admissions for heroin overdose (HOD) as 965.01 or E code of E850.0 in any position, and admissions for POD not related to heroin as 965.00, or 965.09, or E code 850.2 in any position excluding admissions with any heroin-related code 965.01 or E code E850.0 or E935.0 (adverse effects of heroin). We excluded hospitalizations in which a patient was transferred out to another acute care facility to avoid duplicate counting.
Analysis
We classified these admissions based on patient residence in a rural versus urban area. NIS contained a variable representing rural versus urban patient residence based on the county-level framework maintained by the Office of Management and Budget, supplemented with information from Urban Influence Codes developed by the Economic Research Service of the US Department of Agriculture.14 We used this information to create a 3-level variable for patient residence: rural (ie, nonmetropolitan areas with a population less than 50,000), small metropolitan (ie, metropolitan areas with a population of 50,000–999,999), and large metropolitan (ie, metropolitan areas with a population of 1,000,000 or greater). We explored further separating categories (eg, breaking rural into micropolitan population centers and other), but this did not further discriminate admission rates.
For each study year, we combined results on overdose admissions with data on the total populations for each of these 3 areas in the US based on American Community Survey data in order to calculate rates of each type of admission per 100,000 persons. To compare pharmaceutical opioids to heroin, we examined pharmaceutical-only overdoses and heroin-only overdoses. We also examined patient age, sex, race and/or ethnicity, and whether they were admitted to a rural or urban hospital based on the hospital location code contained in NIS, and compared these characteristics across residence categories; we presented characteristics for years 2012 to 2014 combined as recent characteristics are most relevant.
The authors had full access to and take full responsibility for the integrity of the data. All analyses were conducted using SAS statistical software version 9.2 (SAS Institute, Cary, North Carolina). The study was reviewed by the University of Iowa Institutional Review Board and the Iowa City Veterans Affairs Healthcare System Research and Development Committee and was judged human subject research exempt.
RESULTS
Characteristics of Patients with Opioids Overdose Admissions
Opioid Overdose Admission Trends by Patient Residence
Opioid Overdose Admissions among Rural Residents to Urban and Rural Hospitals
DISCUSSION
Up until 2013, hospital admissions for POD occurred at a higher rate among rural US residents than their urban counterparts. Rates of admission of rural residents for POD have decreased since 2012; a similar trend was not observed among urban residents. Over this same interval, rates of hospitalization for HOD among rural residents continued to increase.
Hospital admission is one sequela of harm related to opioid use: patients experiencing opioid overdose or poisoning may be treated by emergency responders, in emergency departments or on observation status, or may die prior to receiving medical attention or presenting for hospital admission. Factors potentially driving the trends described include patient behaviors, opioid availability, prehospital and hospital treatment practices, and hospital closures. Recent work describing increased opioid overdose deaths15 and high opioid-related mortality in rural areas16 suggests that overdose admission and death rates may be divergent. Changing policies governing naloxone availability and administration17 and ongoing trends in rural hospital closures11 may differentially affect the rates at which rural and urban residents who experience overdose are hospitalized.
Hospital admission also represents a potential point-of-entry into subsequent treatment to reduce risk of further opioid-related harms. Decreasing rates of admission could conceivably result in decreasing opportunities to engage in care. Rural and urban patient populations are distinct; an understanding of these distinctions may help to inform how hospitals structure inpatient treatment and discharge planning for overdose patients. Overdose is likely to suggest either an underlying substance use disorder or a chronic pain condition requiring risky levels of prescribed opioids, and therefore is indicative of a persistent condition requiring follow-up care. Thus, there is a need for treatment models and transition care systems aimed at providing adequate care for these populations both in the acute setting and following hospital discharge. The increasing proportion of rural residents admitted to urban hospitals with opioid overdoses highlights the need for urban hospitals to develop relationships with substance use treatment and chronic pain services in rural areas to facilitate linkage to treatment at discharge.
Limitations of this study include the use of ICD-9-CM codes from administrative data to identify hospitalizations for prescription opioid and heroin overdose. While we have used the common term “overdose,” opioid adverse events may occasion hospitalization in the absence of overdose or as a result of patients taking opioid doses in the quantity prescribed. As such, the term overdose does not necessarily imply the behavior of intentional or unintentional excess use. Additionally, coding depends on providers diagnosing and documenting conditions and may be subject to secular trends independent of overdose prevalence. We included data through 2014, the most recent year of data available at time of analyses.
CONCLUSION
Hospitals can expect to continue to treat patients presenting with opioid overdose. As overdose is likely to suggest either an underlying substance use disorder or a chronic pain condition requiring risky levels of prescribed opioids, there will be a need for treatment models and transition care systems to provide adequate care for these populations both in the acute setting and following hospital discharge. Rates of admission among rural residents declined during the last 2 years of the study period, and rural residents who were hospitalized for opioid overdose were increasingly receiving care in urban hospitals. While factors driving these trends remain to be elucidated, the trends themselves highlight a need to consider the differential challenges facing rural and urban residents who overdose. Access to resources and transportation and other challenges are distinct in urban and rural areas, with rural areas being less likely to have providers in addiction medicine, psychiatry, and pain specialties. Efforts to address these challenges will need to explore models and solutions applicable to differentially resourced hospital and postdischarge settings.
Disclosure
The work reported here was supported by the Department of Veterans Affairs, Veterans Health Administration, Office of Rural Health, Veterans Rural Health Resource Center-Central Region, and the Health Services Research and Development Service through the Comprehensive Access and Delivery Research and Evaluation Center (HFP 04-149). This manuscript is not under review elsewhere and there is no prior publication or presentation of manuscript contents. The views expressed in this article are those of the authors and do not necessarily represent the views of the Department of Veterans Affairs. The authors report no conflict of interest in regards to this study. Data: Available to researchers with VA accreditation. Statistical Code: Available to interested readers by contacting Dr. Ohl. Protocol: Available to interested readers by contacting Dr. Ohl.
1. Ronan MV, Herzig SJ. Hospitalizations Related To Opioid Abuse/Dependence And Associated Serious Infections Increased Sharply, 2002-12. Health Aff (Millwood). 2016;35:832-837. PubMed
2. Florence CS, Zhou C, Luo F, Xu L. The Economic Burden of Prescription Opioid Overdose, Abuse, and Dependence in the United States, 2013. Med Care. 2016;54:901-906. PubMed
3. Jennifer PS, Michael JW, Douglas H, John M, Michael DH. The Critical Care Crisis of Opioid Overdoses in the U.S. In: C95 OUTSTANDING EPIDEMIOLOGY AND HEALTH SERVICES RESEARCH IN CRITICAL CARE: American Thoracic Society 2016 International Conference; 2016 May 13-18; San Francisco, CA:A6146-A.
4. Owens PL, Barrett ML, Weiss AJ, Washington RE, Kronick R. Hospital Inpatient Utilization Related to Opioid Overuse Among Adults, 1993-2012: Statistical Brief #177. Healthcare Cost and Utilization Project (HCUP) Statistical Briefs; 2006. https://www.hcup-us.ahrq.gov/reports/statbriefs/sb177-Hospitalizations-for-Opioid-Overuse.jsp. Accessed January 4, 2017
5. Fanucchi L, Lofwall MR. Putting Parity into Practice - Integrating Opioid-Use Disorder Treatment into the Hospital Setting. N Engl J Med. 2016;375:811-813. PubMed
6. Liebschutz JM, Crooks D, Herman D, et al. Buprenorphine treatment for hospitalized, opioid-dependent patients: a randomized clinical trial. JAMA Intern Med. 2014;174:1369-1376. PubMed
7. Keyes KM, Cerda M, Brady JE, Havens JR, Galea S. Understanding the rural-urban differences in nonmedical prescription opioid use and abuse in the United States. Am J Public Health. 2014;104:e52-e59. PubMed
8. Rigg KK, Monnat SM. Urban vs. rural differences in prescription opioid misuse among adults in the United States: informing region specific drug policies and interventions. Int J Drug Policy. 2015;26:484-491. PubMed
9. Ellis AR, Konrad TR, Thomas KC, Morrissey JP. County-level estimates of mental health professional supply in the United States. Psychiatr Serv. 2009;60:1315-1322. PubMed
10. Rosenblatt RA, Andrilla CH, Catlin M, Larson EH. Geographic and specialty distribution of US physicians trained to treat opioid use disorder. Ann Fam Med. 2015;13:23-26. PubMed
11. Kaufman BG, Thomas SR, Randolph RK, et al. The Rising Rate of Rural Hospital Closures. J Rural Health. 2016;32:35-43. PubMed
12. Houchens RL DR, A Elixhauser. Using the HCUP National Inpatient Sample to Estimate Trends: U.S. Agency for Healthcare Research and Quality; 2015. Report No.: 2006-05
13. Unick GJ, Rosenblum D, Mars S, Ciccarone D. Intertwined epidemics: national demographic trends in hospitalizations for heroin- and opioid-related overdoses, 1993-2009. PLoS One. 2013;8:e54496.
14. Urban Influence Codes. USDA, 2016. https://www.ers.usda.gov/data-products/urban-influence-codes.aspx. Accessed January 4, 2017
15. Rudd RA, Seth P, David F, Scholl L. Increases in Drug and Opioid-Involved Overdose Deaths - United States, 2010-2015. MMWR Morb Mortal Wkly Rep. 2016;65:1445-1452. PubMed
16. Case A, Deaton A. Rising morbidity and mortality in midlife among white non-Hispanic Americans in the 21st century. Proc Natl Acad Sci U S A. 2015;112:15078-15083. PubMed
17. Davis CS, Southwell JK, Niehaus VR, Walley AY, Dailey MW. Emergency medical services naloxone access: a national systematic legal review. Acad Emerg Med. 2014;21:1173-1177. PubMed
© 2017 Society of Hospital Medicine