User login
Things We Do For No Reason: Electrolyte Testing in Pediatric Acute Gastroenteritis
The “Things We Do for No Reason” (TWDFNR) series reviews practices that have become common parts of hospital care but that may provide little value to our patients. Practices reviewed in the TWDFNR series do not represent “black and white” conclusions or clinical practice standards, but are meant as a starting place for research and active discussions among hospitalists and patients. We invite you to be part of that discussion. https://www.choosingwisely.org/
Acute gastroenteritis (AGE) remains a substantial cause of childhood illness and is 1 of the top 10 reasons for pediatric hospitalization nationwide. In the United States, AGE is responsible for 10% of hospital admissions and approximately 300 deaths annually.1 The American Academy of Pediatrics (AAP) and other organizations have emphasized supportive care in the management of AGE. Routine diagnostic testing has been discouraged in national guidelines except in cases of severe dehydration or an otherwise complicated course. Despite AGE guidelines, diagnostic laboratory tests are still widely used even though they have been shown to be poor predictors of dehydration. Studies have shown that high test utilization in various pediatric disease processes often influences the decision for hospitalization without improvement in patient outcome. In children with AGE, the initial and follow-up laboratory tests may not only be something that we do for no reason, but something that is associated with more risk than benefit.
An 18-month-old healthy male is brought to the emergency department (ED) with a chief complaint of 2 days of nonbloody, nonbilious emesis and watery diarrhea. He has decreased energy but smiles and plays for a few minutes. He has had decreased wet diapers. His exam is notable for mild tachycardia, mildly dry lips, and capillary refill of 3 seconds. A serum electrolyte panel is normal except for a sodium of 134 mEq/L, a bicarbonate of 16 mEq/L, and an anion gap of 18, which are flagged as abnormal by the electronic medical record. These results prompt intravenous (IV) access, a normal saline bolus, and admission on maintenance fluids overnight. The next morning, his electrolyte panel is repeated, and his sodium is 140 mEq/L and bicarbonate is 15 mEq/L. He is now drinking well with no further episodes of emesis, so he is discharged home.
WHY PHYSICIANS MIGHT THINK ELECTROLYTE TESTING IS HELPFUL
Many physicians across the United States continue to order electrolytes in AGE as a way to avoid missing severe dehydration, severe electrolyte abnormalities, or rare diagnoses, such as adrenal insufficiency or new-onset diabetes, in a child. Previous studies have revealed that bicarbonate and blood urea nitrogen (BUN) may be helpful predictors of severe dehydration. A retrospective study of 168 patients by Yilmaz et al.2 showed that BUN and bicarbonate strongly correlated with dehydration severity (P < 0.00001 and P = 0.01, respectively). A 97-patient prospective study by Vega and Avner3 showed that bicarbonate <17 can help in predicting percent body weight loss (PBWL) (sensitivity of 77% for PBWL 6-10 and 94% for PBWL >10).
In AGE, obtaining laboratory data is often considered to be the more conservative approach. Some attribute this to the medical education and legal system rewarding the uncovering of rare diagnoses,4 while others believe physicians obtain laboratory data to avoid missing severe electrolyte disorders. One author notes, “physicians who are anxious about a patient’s problem may be tempted to do something—anything—decisive in order to diminish their own anxiety.”5 Severe electrolyte derangements are common in developing countries6 but less so in the United States. A prospective pediatric dehydration study over 1 year in the United States demonstrated rates of 6% and 3% of hypo- and hypernatremia, respectively (n = 182). Only 1 patient had a sodium level >160, and this patient had an underlying genetic syndrome, and none had hyponatremia <130. Hypoglycemia was the most common electrolyte abnormality, which was present in 9.8% of patients. Electrolyte results changed management in 10.4% of patients.7
WHY ELECTROLYTE TESTING IS GENERALLY NOT HELPFUL
In AGE with or without dehydration, guidelines from the AAP and other international organizations emphasize supportive care in the management of AGE and discourage routine diagnostic testing.8-10 Yet, there continues to be wide variation in AGE management.11-13 Most AGE cases presenting to an outpatient setting or ED are uncomplicated: age >6 months, nontoxic appearance, no comorbidities, no hematochezia, diarrhea <7 days, and mild-to-moderate dehydration.
Steiner et al.14 performed a systematic meta-analysis of the precision and accuracy of symptoms, signs, and laboratory tests for evaluating dehydration in children. They concluded that a standardized clinical assessment based on physical exam (PE) findings more accurately classifies the degree of dehydration than laboratory testing. Steiner et al14 specifically analyzed the works by Yilmaz et al.2 and Vega and Avner,3 and determined that the positive likelihood ratios for >5% dehydration resulting from a BUN >45 or bicarbonate <17 were too small or had confidence intervals that were too wide to be clinically helpful alone. Therefore, Steiner et al.14 recommended that laboratory testing should not be considered definitive for dehydration.
Vega and Avner3 found that electrolyte testing is less helpful in distinguishing between <5% (mild) and 5% to 10% (moderate) dehydration compared to PBWL. Because both mild and moderate dehydration respond equally well to oral rehydration therapy (ORT),8 electrolyte testing is not helpful in managing these categories. Many studies have excluded children with hypernatremia, but generally, severe hypernatremia is uncommon in healthy patients with AGE. In most cases of mild hypernatremia, ORT is the preferred resuscitation method and is possibly safer than IV rehydration because ORT may induce less rapid shifts in intracellular water.15
Tieder et al.16 demonstrated that better hospital adherence to national recommendations to avoid diagnostic testing in children with AGE resulted in lower charges and equivalent outcomes. In this large, multicenter study among 27 children’s hospitals in the Pediatric Hospital Information System (PHIS) database, only 70% of the 188,000 patients received guideline-adherent care. Nonrecommended laboratory testing was common, especially in the admitted population. Electrolytes were measured in 22.1% of the ED and observation patients compared with 85% of admitted patients. Hospitals that were most guideline adherent in the ED demonstrated 50% lower charges. The authors estimate that standardizing AGE care and eliminating nonrecommended laboratory testing would decrease admissions by 45% and save more than $1 billion per year in direct medical costs.16 In a similar PHIS study, laboratory testing was strongly correlated with the percentage of children hospitalized for AGE at each hospital (r = 0.73, P < 0.001). Results were unchanged when excluding children <1 year of age (r = 0.75, P < 0.001). In contrast, the mean testing count was not correlated with return visits within 3 days for children discharged from the ED (r = 0.21, P = 0.235), nor was it correlated with hospital length of stay (r = −0.04, P = 0.804) or return visits within 7 days (r = 0.03, P = 0.862) for hospitalized children.12 In addition, Freedman et al.17 revealed that the clinical dehydration score is independently associated with successful ED discharge without revisits, and laboratory testing does not prevent missed cases of severe dehydration.
Nonrecommended and often unnecessary laboratory testing in AGE results in IV procedures that are sometimes repeated because of abnormal values. “Shotgun testing,” or ordering a panel of labs, can result in abnormal laboratory values in healthy patients. Deyo et al.
WHY ELECTROLYTE TESTING MIGHT BE HELPFUL
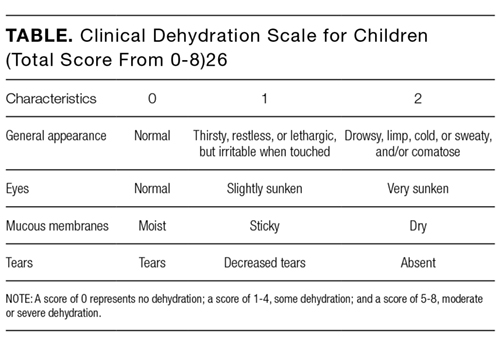
Electrolyte panels may be useful in assessing children with severe dehydration (scores of 5-8 on the Clinical Dehydration Scale (CDS) or more than 10% weight loss) or in complicated cases of AGE (those that do not meet the criteria of age >6 months, nontoxic appearance, no comorbidities, no hematochezia, and diarrhea <7 days) to guide IV fluid management and correct markedly abnormal electrolytes.14
Electrolyte panels may also rarely uncover disease processes, such as new-onset diabetes, hemolytic uremic syndrome, adrenal insufficiency, or inborn errors of metabolism, allowing for early diagnosis and preventing adverse outcomes. Suspicion to investigate such entities should arise during a thorough history and PE instead of routinely screening all children with symptoms of AGE. One should also have a higher level of concern for other disease processes when clinical recovery does not occur within the expected amount of time; symptoms usually resolve within 2 to 3 days but sometimes will last up to a week.
WHAT WE SHOULD DO INSTEAD
RECOMMENDATIONS
- Perform a thorough history and PE to diagnose AGE.8
- Clinical assessment of dehydration should be performed upon initial presentation and repeatedly with vital signs throughout the stay using a validated CDS to classify the patient’s initial dehydration severity and monitor improvement. Obtain a current patient weight and compare with previously recorded weights, if available.25,26
- Laboratory testing in patients with AGE should not be performed unless a patient is classified as severely dehydrated, is toxic appearing, has a comorbidity that increases the likelihood of complications, or is not improving as expected.
- Rehydration via ORT is preferred to an IV in mild and moderate dehydration.15
- If initial testing is performed and indicates an expected value indicative of dehydration, do not repeat testing to demonstrate normalization as long as the child is clinically improving as expected.
CONCLUSION
Children presenting with mild-to-moderate dehydration should be treated with supportive measures in accordance with current guidelines. Electrolyte panels very rarely provide clinical information that cannot be garnered through a thorough history and PE. As in our clinical scenario, the laboratory values obtained may have led to potential harm, including overdiagnosis, painful procedures, and psychological distress. Without testing, the patient likely could have been appropriately treated with ORT and discharged from the ED.
Do you think this is a low-value practice? Is this truly a “Thing We Do for No Reason?” Share what you do in your practice and join in the conversation online by retweeting it on Twitter (#TWDFNR) and liking it on Facebook. We invite you to propose ideas for other “Things We Do for No Reason” topics by emailing [email protected].
Disclosure
The authors have nothing to disclose.
1. Elliott EJ. Acute gastroenteritis in children. BMJ. 2007;334(7583):35-40. PubMed
2. Yilmaz K, Karabocuoglu M, Citak A, Uzel N. Evaluation of laboratory tests in dehydrated children with acute gastroenteritis. J Paediatr Child Health. 2002;38(3):226-228. PubMed
3. Vega RM, Avner JR. A prospective study of the usefulness of clinical and laboratory parameters for predicting percentage of dehydration in children. Pediatr Emerg Care. 1997;13(3):179-182. PubMed
4. Jha S. Stop hunting for zebras in Texas: end the diagnostic culture of “rule-out”. BMJ. 2014;348:g2625. PubMed
5. Mold JW, Stein HF. The cascade effect in the clinical care of patients. N Engl J Med. 1986;314(8):512-514. PubMed
6. Shahrin L, Chisti MJ, Huq S, et al. Clinical Manifestations of Hyponatremia and Hypernatremia in Under-Five Diarrheal Children in a Diarrhea Hospital. J Trop Pediatr. 2016;62(3):206-212. PubMed
7. Wathen JE, MacKenzie T, Bothner JP. Usefulness of the serum electrolyte panel in the management of pediatric dehydration treated with intravenously administered fluids. Pediatrics. 2004;114(5):1227-1234. PubMed
8. Practice parameter: the management of acute gastroenteritis in young children. American Academy of Pediatrics, Provisional Committee on Quality Improvement, Subcommittee on Acute Gastroenteritis. Pediatrics. 1996;97(3):424-435. PubMed
9. National Collaborating Centre for Women’s and Children’s Health. Diarrhoea and Vomiting Caused by Gastroenteritis: Diagnosis, Assessment and Management in Children Younger than 5 Years. London: RCOG Press; 2009. PubMed
10. Guarino A, Ashkenazi S, Gendrel D, et al. European Society for Pediatric Gastroenterology, Hepatology, and Nutrition/European Society for Pediatric Infectious Diseases evidence-based guidelines for the management of acute gastroenteritis in children in Europe: Update 2014. J Pediatr Gastroenterol Nutr. 2014;59(1):132-152. PubMed
11. Freedman SB, Gouin S, Bhatt M, et al. Prospective assessment of practice pattern variations in the treatment of pediatric gastroenteritis. Pediatrics. 2011;127(2):e287-e295. PubMed
12. Lind CH, Hall M, Arnold DH, et al. Variation in Diagnostic Testing and Hospitalization Rates in Children With Acute Gastroenteritis. Hosp Pediatr. 2016;6(12):714-721. PubMed
13. Powell EC, Hampers LC. Physician variation in test ordering in the management of gastroenteritis in children. Arch Pediatr Adolesc Med. 2003;157(10):978-983. PubMed
14. Steiner MJ, DeWalt DA, Byerley JS. Is this child dehydrated? JAMA. 2004;291(22):2746-2754. PubMed
15. Sandhu BK, European Society of Pediatric Gastroenterology H, Nutrition Working Group on Acute D. Practical guidelines for the management of gastroenteritis in children. J Pediatr Gastroenterol Nutr. 2001;33(suppl 2):S36-S39.
16. Tieder JS, Robertson A, Garrison MM. Pediatric hospital adherence to the standard of care for acute gastroenteritis. Pediatrics. 2009;124(6):e1081-e1087. PubMed
17. Freedman SB, DeGroot JM, Parkin PC. Successful discharge of children with gastroenteritis requiring intravenous rehydration. J Emerg Med. 2014;46(1):9-20. PubMed
18. Deyo RA. Cascade effects of medical technology. Annu Rev Public Health. 2002;23:23-44. PubMed
19. Coon ER, Quinonez RA, Moyer VA, Schroeder AR. Overdiagnosis: how our compulsion for diagnosis may be harming children. Pediatrics. 2014;134(5):1013-1023. PubMed
20. Florin TA, French B, Zorc JJ, Alpern ER, Shah SS. Variation in emergency department diagnostic testing and disposition outcomes in pneumonia. Pediatrics. 2013;132(2):237-244. PubMed
21. Newman TB, Bernzweig JA, Takayama JI, Finch SA, Wasserman RC, Pantell RH. Urine testing and urinary tract infections in febrile infants seen in office settings: the Pediatric Research in Office Settings’ Febrile Infant Study. Arch Pediatr Adolesc Med. 2002;156(1):44-54. PubMed
22. McMurtry CM, Noel M, Chambers CT, McGrath PJ. Children’s fear during procedural pain: preliminary investigation of the Children’s Fear Scale. Health Psychol. 2011;30(6):780-788. PubMed
23. von Baeyer CL, Marche TA, Rocha EM, Salmon K. Children’s memory for pain: overview and implications for practice. J Pain. 2004;5(5):241-249. PubMed
24. American Academy of Pediatrics. Section on Hospital Medicine. Rauch DA, Gershel JC. Caring for the hospitalized child: a handbook of inpatient pediatrics. Elk Grove Village, IL: American Academy of Pediatrics; 2013.
25. Bailey B, Gravel J, Goldman RD, Friedman JN, Parkin PC. External validation of the clinical dehydration scale for children with acute gastroenteritis. Acad Emerg Med. 2010;17(6):583-588. PubMed
26. Friedman JN, Goldman RD, Srivastava R, Parkin PC. Development of a clinical dehydration scale for use in children between 1 and 36 months of age. J Pediatr. 2004;145(2):201-207. PubMed
The “Things We Do for No Reason” (TWDFNR) series reviews practices that have become common parts of hospital care but that may provide little value to our patients. Practices reviewed in the TWDFNR series do not represent “black and white” conclusions or clinical practice standards, but are meant as a starting place for research and active discussions among hospitalists and patients. We invite you to be part of that discussion. https://www.choosingwisely.org/
Acute gastroenteritis (AGE) remains a substantial cause of childhood illness and is 1 of the top 10 reasons for pediatric hospitalization nationwide. In the United States, AGE is responsible for 10% of hospital admissions and approximately 300 deaths annually.1 The American Academy of Pediatrics (AAP) and other organizations have emphasized supportive care in the management of AGE. Routine diagnostic testing has been discouraged in national guidelines except in cases of severe dehydration or an otherwise complicated course. Despite AGE guidelines, diagnostic laboratory tests are still widely used even though they have been shown to be poor predictors of dehydration. Studies have shown that high test utilization in various pediatric disease processes often influences the decision for hospitalization without improvement in patient outcome. In children with AGE, the initial and follow-up laboratory tests may not only be something that we do for no reason, but something that is associated with more risk than benefit.
An 18-month-old healthy male is brought to the emergency department (ED) with a chief complaint of 2 days of nonbloody, nonbilious emesis and watery diarrhea. He has decreased energy but smiles and plays for a few minutes. He has had decreased wet diapers. His exam is notable for mild tachycardia, mildly dry lips, and capillary refill of 3 seconds. A serum electrolyte panel is normal except for a sodium of 134 mEq/L, a bicarbonate of 16 mEq/L, and an anion gap of 18, which are flagged as abnormal by the electronic medical record. These results prompt intravenous (IV) access, a normal saline bolus, and admission on maintenance fluids overnight. The next morning, his electrolyte panel is repeated, and his sodium is 140 mEq/L and bicarbonate is 15 mEq/L. He is now drinking well with no further episodes of emesis, so he is discharged home.
WHY PHYSICIANS MIGHT THINK ELECTROLYTE TESTING IS HELPFUL
Many physicians across the United States continue to order electrolytes in AGE as a way to avoid missing severe dehydration, severe electrolyte abnormalities, or rare diagnoses, such as adrenal insufficiency or new-onset diabetes, in a child. Previous studies have revealed that bicarbonate and blood urea nitrogen (BUN) may be helpful predictors of severe dehydration. A retrospective study of 168 patients by Yilmaz et al.2 showed that BUN and bicarbonate strongly correlated with dehydration severity (P < 0.00001 and P = 0.01, respectively). A 97-patient prospective study by Vega and Avner3 showed that bicarbonate <17 can help in predicting percent body weight loss (PBWL) (sensitivity of 77% for PBWL 6-10 and 94% for PBWL >10).
In AGE, obtaining laboratory data is often considered to be the more conservative approach. Some attribute this to the medical education and legal system rewarding the uncovering of rare diagnoses,4 while others believe physicians obtain laboratory data to avoid missing severe electrolyte disorders. One author notes, “physicians who are anxious about a patient’s problem may be tempted to do something—anything—decisive in order to diminish their own anxiety.”5 Severe electrolyte derangements are common in developing countries6 but less so in the United States. A prospective pediatric dehydration study over 1 year in the United States demonstrated rates of 6% and 3% of hypo- and hypernatremia, respectively (n = 182). Only 1 patient had a sodium level >160, and this patient had an underlying genetic syndrome, and none had hyponatremia <130. Hypoglycemia was the most common electrolyte abnormality, which was present in 9.8% of patients. Electrolyte results changed management in 10.4% of patients.7
WHY ELECTROLYTE TESTING IS GENERALLY NOT HELPFUL
In AGE with or without dehydration, guidelines from the AAP and other international organizations emphasize supportive care in the management of AGE and discourage routine diagnostic testing.8-10 Yet, there continues to be wide variation in AGE management.11-13 Most AGE cases presenting to an outpatient setting or ED are uncomplicated: age >6 months, nontoxic appearance, no comorbidities, no hematochezia, diarrhea <7 days, and mild-to-moderate dehydration.
Steiner et al.14 performed a systematic meta-analysis of the precision and accuracy of symptoms, signs, and laboratory tests for evaluating dehydration in children. They concluded that a standardized clinical assessment based on physical exam (PE) findings more accurately classifies the degree of dehydration than laboratory testing. Steiner et al14 specifically analyzed the works by Yilmaz et al.2 and Vega and Avner,3 and determined that the positive likelihood ratios for >5% dehydration resulting from a BUN >45 or bicarbonate <17 were too small or had confidence intervals that were too wide to be clinically helpful alone. Therefore, Steiner et al.14 recommended that laboratory testing should not be considered definitive for dehydration.
Vega and Avner3 found that electrolyte testing is less helpful in distinguishing between <5% (mild) and 5% to 10% (moderate) dehydration compared to PBWL. Because both mild and moderate dehydration respond equally well to oral rehydration therapy (ORT),8 electrolyte testing is not helpful in managing these categories. Many studies have excluded children with hypernatremia, but generally, severe hypernatremia is uncommon in healthy patients with AGE. In most cases of mild hypernatremia, ORT is the preferred resuscitation method and is possibly safer than IV rehydration because ORT may induce less rapid shifts in intracellular water.15
Tieder et al.16 demonstrated that better hospital adherence to national recommendations to avoid diagnostic testing in children with AGE resulted in lower charges and equivalent outcomes. In this large, multicenter study among 27 children’s hospitals in the Pediatric Hospital Information System (PHIS) database, only 70% of the 188,000 patients received guideline-adherent care. Nonrecommended laboratory testing was common, especially in the admitted population. Electrolytes were measured in 22.1% of the ED and observation patients compared with 85% of admitted patients. Hospitals that were most guideline adherent in the ED demonstrated 50% lower charges. The authors estimate that standardizing AGE care and eliminating nonrecommended laboratory testing would decrease admissions by 45% and save more than $1 billion per year in direct medical costs.16 In a similar PHIS study, laboratory testing was strongly correlated with the percentage of children hospitalized for AGE at each hospital (r = 0.73, P < 0.001). Results were unchanged when excluding children <1 year of age (r = 0.75, P < 0.001). In contrast, the mean testing count was not correlated with return visits within 3 days for children discharged from the ED (r = 0.21, P = 0.235), nor was it correlated with hospital length of stay (r = −0.04, P = 0.804) or return visits within 7 days (r = 0.03, P = 0.862) for hospitalized children.12 In addition, Freedman et al.17 revealed that the clinical dehydration score is independently associated with successful ED discharge without revisits, and laboratory testing does not prevent missed cases of severe dehydration.
Nonrecommended and often unnecessary laboratory testing in AGE results in IV procedures that are sometimes repeated because of abnormal values. “Shotgun testing,” or ordering a panel of labs, can result in abnormal laboratory values in healthy patients. Deyo et al.
WHY ELECTROLYTE TESTING MIGHT BE HELPFUL
Electrolyte panels may be useful in assessing children with severe dehydration (scores of 5-8 on the Clinical Dehydration Scale (CDS) or more than 10% weight loss) or in complicated cases of AGE (those that do not meet the criteria of age >6 months, nontoxic appearance, no comorbidities, no hematochezia, and diarrhea <7 days) to guide IV fluid management and correct markedly abnormal electrolytes.14
Electrolyte panels may also rarely uncover disease processes, such as new-onset diabetes, hemolytic uremic syndrome, adrenal insufficiency, or inborn errors of metabolism, allowing for early diagnosis and preventing adverse outcomes. Suspicion to investigate such entities should arise during a thorough history and PE instead of routinely screening all children with symptoms of AGE. One should also have a higher level of concern for other disease processes when clinical recovery does not occur within the expected amount of time; symptoms usually resolve within 2 to 3 days but sometimes will last up to a week.
WHAT WE SHOULD DO INSTEAD
RECOMMENDATIONS
- Perform a thorough history and PE to diagnose AGE.8
- Clinical assessment of dehydration should be performed upon initial presentation and repeatedly with vital signs throughout the stay using a validated CDS to classify the patient’s initial dehydration severity and monitor improvement. Obtain a current patient weight and compare with previously recorded weights, if available.25,26
- Laboratory testing in patients with AGE should not be performed unless a patient is classified as severely dehydrated, is toxic appearing, has a comorbidity that increases the likelihood of complications, or is not improving as expected.
- Rehydration via ORT is preferred to an IV in mild and moderate dehydration.15
- If initial testing is performed and indicates an expected value indicative of dehydration, do not repeat testing to demonstrate normalization as long as the child is clinically improving as expected.
CONCLUSION
Children presenting with mild-to-moderate dehydration should be treated with supportive measures in accordance with current guidelines. Electrolyte panels very rarely provide clinical information that cannot be garnered through a thorough history and PE. As in our clinical scenario, the laboratory values obtained may have led to potential harm, including overdiagnosis, painful procedures, and psychological distress. Without testing, the patient likely could have been appropriately treated with ORT and discharged from the ED.
Do you think this is a low-value practice? Is this truly a “Thing We Do for No Reason?” Share what you do in your practice and join in the conversation online by retweeting it on Twitter (#TWDFNR) and liking it on Facebook. We invite you to propose ideas for other “Things We Do for No Reason” topics by emailing [email protected].
Disclosure
The authors have nothing to disclose.
1. Elliott EJ. Acute gastroenteritis in children. BMJ. 2007;334(7583):35-40. PubMed
2. Yilmaz K, Karabocuoglu M, Citak A, Uzel N. Evaluation of laboratory tests in dehydrated children with acute gastroenteritis. J Paediatr Child Health. 2002;38(3):226-228. PubMed
3. Vega RM, Avner JR. A prospective study of the usefulness of clinical and laboratory parameters for predicting percentage of dehydration in children. Pediatr Emerg Care. 1997;13(3):179-182. PubMed
4. Jha S. Stop hunting for zebras in Texas: end the diagnostic culture of “rule-out”. BMJ. 2014;348:g2625. PubMed
5. Mold JW, Stein HF. The cascade effect in the clinical care of patients. N Engl J Med. 1986;314(8):512-514. PubMed
6. Shahrin L, Chisti MJ, Huq S, et al. Clinical Manifestations of Hyponatremia and Hypernatremia in Under-Five Diarrheal Children in a Diarrhea Hospital. J Trop Pediatr. 2016;62(3):206-212. PubMed
7. Wathen JE, MacKenzie T, Bothner JP. Usefulness of the serum electrolyte panel in the management of pediatric dehydration treated with intravenously administered fluids. Pediatrics. 2004;114(5):1227-1234. PubMed
8. Practice parameter: the management of acute gastroenteritis in young children. American Academy of Pediatrics, Provisional Committee on Quality Improvement, Subcommittee on Acute Gastroenteritis. Pediatrics. 1996;97(3):424-435. PubMed
9. National Collaborating Centre for Women’s and Children’s Health. Diarrhoea and Vomiting Caused by Gastroenteritis: Diagnosis, Assessment and Management in Children Younger than 5 Years. London: RCOG Press; 2009. PubMed
10. Guarino A, Ashkenazi S, Gendrel D, et al. European Society for Pediatric Gastroenterology, Hepatology, and Nutrition/European Society for Pediatric Infectious Diseases evidence-based guidelines for the management of acute gastroenteritis in children in Europe: Update 2014. J Pediatr Gastroenterol Nutr. 2014;59(1):132-152. PubMed
11. Freedman SB, Gouin S, Bhatt M, et al. Prospective assessment of practice pattern variations in the treatment of pediatric gastroenteritis. Pediatrics. 2011;127(2):e287-e295. PubMed
12. Lind CH, Hall M, Arnold DH, et al. Variation in Diagnostic Testing and Hospitalization Rates in Children With Acute Gastroenteritis. Hosp Pediatr. 2016;6(12):714-721. PubMed
13. Powell EC, Hampers LC. Physician variation in test ordering in the management of gastroenteritis in children. Arch Pediatr Adolesc Med. 2003;157(10):978-983. PubMed
14. Steiner MJ, DeWalt DA, Byerley JS. Is this child dehydrated? JAMA. 2004;291(22):2746-2754. PubMed
15. Sandhu BK, European Society of Pediatric Gastroenterology H, Nutrition Working Group on Acute D. Practical guidelines for the management of gastroenteritis in children. J Pediatr Gastroenterol Nutr. 2001;33(suppl 2):S36-S39.
16. Tieder JS, Robertson A, Garrison MM. Pediatric hospital adherence to the standard of care for acute gastroenteritis. Pediatrics. 2009;124(6):e1081-e1087. PubMed
17. Freedman SB, DeGroot JM, Parkin PC. Successful discharge of children with gastroenteritis requiring intravenous rehydration. J Emerg Med. 2014;46(1):9-20. PubMed
18. Deyo RA. Cascade effects of medical technology. Annu Rev Public Health. 2002;23:23-44. PubMed
19. Coon ER, Quinonez RA, Moyer VA, Schroeder AR. Overdiagnosis: how our compulsion for diagnosis may be harming children. Pediatrics. 2014;134(5):1013-1023. PubMed
20. Florin TA, French B, Zorc JJ, Alpern ER, Shah SS. Variation in emergency department diagnostic testing and disposition outcomes in pneumonia. Pediatrics. 2013;132(2):237-244. PubMed
21. Newman TB, Bernzweig JA, Takayama JI, Finch SA, Wasserman RC, Pantell RH. Urine testing and urinary tract infections in febrile infants seen in office settings: the Pediatric Research in Office Settings’ Febrile Infant Study. Arch Pediatr Adolesc Med. 2002;156(1):44-54. PubMed
22. McMurtry CM, Noel M, Chambers CT, McGrath PJ. Children’s fear during procedural pain: preliminary investigation of the Children’s Fear Scale. Health Psychol. 2011;30(6):780-788. PubMed
23. von Baeyer CL, Marche TA, Rocha EM, Salmon K. Children’s memory for pain: overview and implications for practice. J Pain. 2004;5(5):241-249. PubMed
24. American Academy of Pediatrics. Section on Hospital Medicine. Rauch DA, Gershel JC. Caring for the hospitalized child: a handbook of inpatient pediatrics. Elk Grove Village, IL: American Academy of Pediatrics; 2013.
25. Bailey B, Gravel J, Goldman RD, Friedman JN, Parkin PC. External validation of the clinical dehydration scale for children with acute gastroenteritis. Acad Emerg Med. 2010;17(6):583-588. PubMed
26. Friedman JN, Goldman RD, Srivastava R, Parkin PC. Development of a clinical dehydration scale for use in children between 1 and 36 months of age. J Pediatr. 2004;145(2):201-207. PubMed
©2018 Society of Hospital Medicine
When Reducing Low-Value Care in Hospital Medicine Saves Money, Who Benefits?
Physicians face growing pressure to reduce their use of “low value” care—services that provide either little to no benefit, little benefit relative to cost, or outsized potential harm compared to benefit. One emerging policy solution for deterring such services is to financially penalize physicians who prescribe them.1,2
Physicians’ willingness to support such policies may depend on who they believe benefits from reductions in low-value care. In previous studies of cancer screening, the more that primary care physicians felt that the money saved from cost-containment efforts went to insurance company profits rather than to patients, the less willing they were to use less expensive cancer screening approaches.3
Similarly, physicians may be more likely to support financial penalty policies if they perceive that the benefits from reducing low-value care accrue to patients (eg, lower out-of-pocket costs) rather than insurers or hospitals (eg, profits and salaries of their leaders). If present, such perceptions could inform incentive design. We explored the hypothesis that support of financial penalties
METHODS
Study Sample
By using a panel of internists maintained by the American College of Physicians, we conducted a randomized, web-based survey among 484 physicians who were either internal medicine residents or internal medicine physicians practicing hospital medicine.
Survey Instrument
Respondents used a 5-point scale (“strongly disagree” to “strongly agree”) to indicate their agreement with a policy that financially penalizes physicians for prescribing services that provide few benefits to patients. Respondents were asked to simultaneously consider the following hospital medicine services, deemed to be low value based on medical evidence and consensus guidelines4: (1) placing, and leaving in, urinary catheters for urine output monitoring in noncritically ill patients, (2) ordering continuous telemetry monitoring for nonintensive care unit patients without a protocol governing continuation, and (3) prescribing stress ulcer prophylaxis for medical patients not at a high risk for gastrointestinal complications. Policy support was defined as “somewhat” or “strongly” agreeing with the policy. As part of another study of this physician cohort, this question varied in how the harm of low-value services was framed: either as harm to patients, to society, or to hospitals and insurers as institutions. Respondent characteristics were balanced across survey versions, and for the current analysis, we pooled responses across all versions.
All other questions in the survey, described in detail elsewhere,5 were identical for all respondents. For this analysis, we focused on a question that asked physicians to assume that reducing these services saves money without harming the quality of care and to rate on a 4-point scale (“none” to “a lot”) how much of the money saved would ultimately go to the following 6 nonmutually exclusive areas: (a) other healthcare services for patients, (b) reduced charges to patients’ employers or insurers, (c) reduced out-of-pocket costs for patients, (d) salaries and bonuses for physicians, (e) salaries and profits for insurance companies and their leaders, and (f) salaries and profits for hospitals and/or health systems and their leaders.
Based on the positive correlation identified between the first 4 items (a to d) and negative correlation with the other 2 items (e and f), we reverse-coded the latter 2 and summed all 6 into a single-outcome scale, effectively representing the degree to which the money saved from reducing low-value services accrues generally to patients or physicians instead of to hospitals, insurance companies, and their leaders. The Cronbach alpha for the scale was 0.74, indicating acceptable reliability. Based on scale responses, we dichotomized respondents at the median into those who believe that the money saved from reducing low-value services would accrue as benefits to patients or physicians and those who believe benefits accrue to insurance companies or hospitals and/or health systems and their leaders. The protocol was exempted by the University of Pennsylvania Institutional Review Board.
Statistical Analysis
We used a χ2 test and multivariable logistic regression analysis to evaluate the association between policy support and physician beliefs about who benefits from reductions in low-value care. A χ2 test and a Kruskal-Wallis test were also used to evaluate the association between other respondent characteristics and beliefs about who benefits from reductions in low-value care. Analyses were performed by using Stata version 14.1 (StataCorp, College Station, TX). Tests of significance were 2-tailed at an alpha of .05.
RESULTS
Compared with nonrespondents, the 187 physicians who responded (39% response rate) were more likely to be female (30% vs 26%, P = 0.001), older (mean age 41 vs 36 years old, P < 0.001), and practicing clinicians rather than internal medicine residents (87% vs 69%, P < 0.001). Twenty-one percent reported that their personal compensation was tied to cost incentives.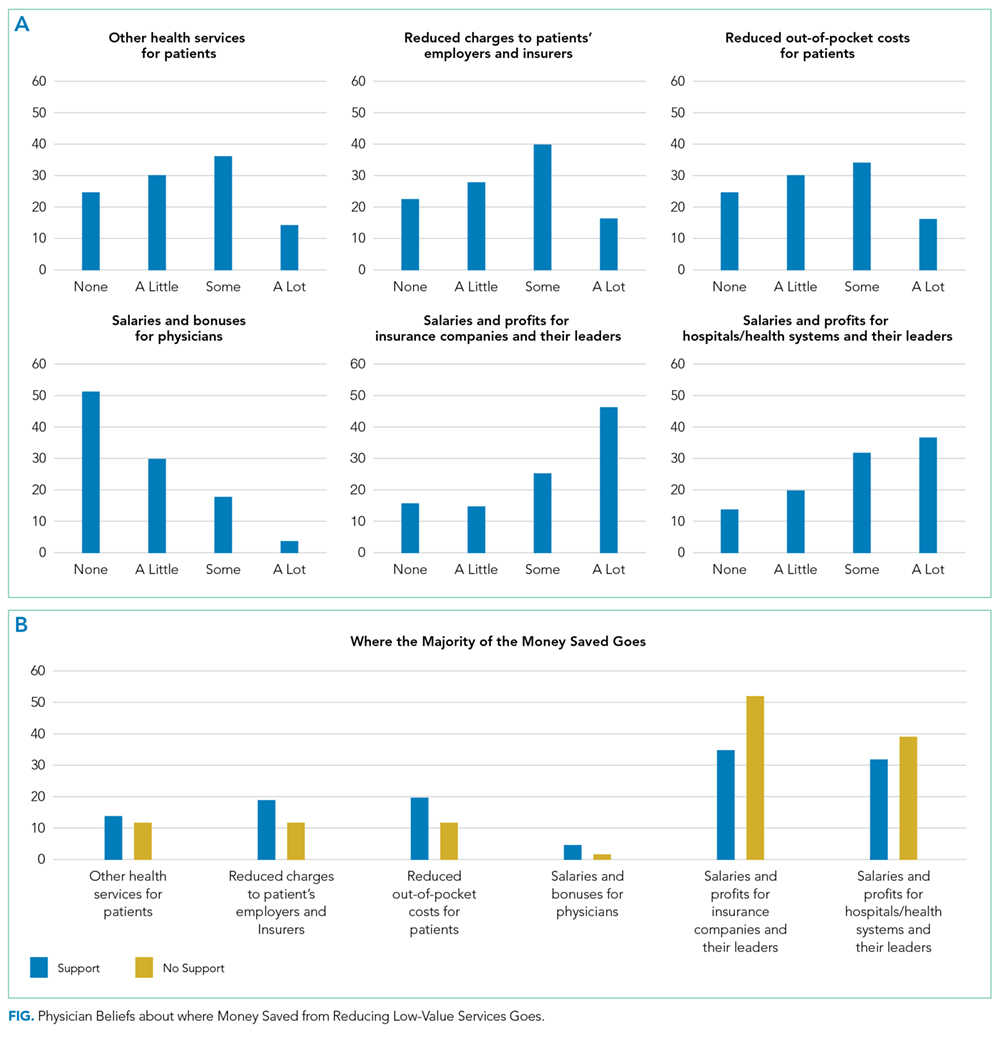
Overall, respondents believed that more of any money saved from reducing low-value services would go to profits and leadership salaries for insurance companies and hospitals and/or health systems rather than to patients (panel A of Figure). Few respondents felt that the money saved would ultimately go toward physician compensation.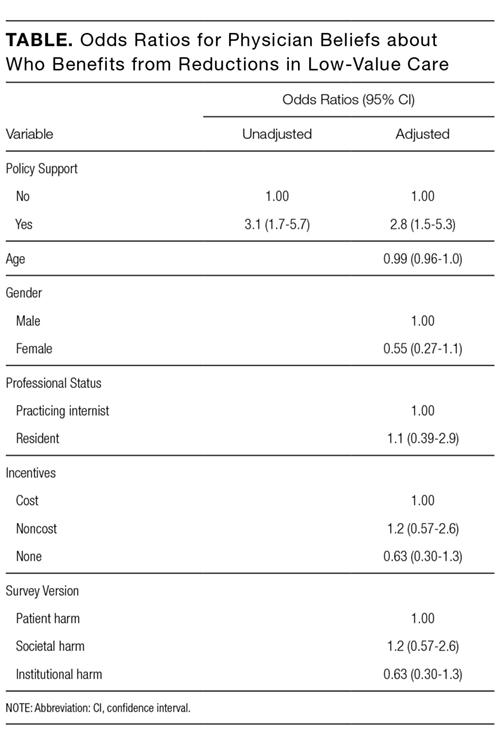
Sixty-six percent of physicians who supported penalties believed that benefits from reducing low-value care accrue to patients or physicians, compared to 39% among those not supporting penalties (P < 0.001). In multivariable analyses, policy support was associated with the belief that the money saved from reducing low-value services would accrue as benefits to patients or physicians rather than as salaries and profits for insurance companies or hospitals and/or health systems and their leaders (Table). There were no statistically significant associations between respondent age, gender, or professional status and beliefs about who benefits from reductions in low-value care.
DISCUSSION
Despite ongoing efforts to highlight how reducing low-value care benefits patients, physicians in our sample did not believe that much of the money saved would benefit patients.
This result may reflect that while some care patterns are considered low value because they provide little benefit at a high cost, others yield potential harm, regardless of cost. For example, limiting stress ulcer prophylaxis largely aims to avoid clinical harm (eg, adverse drug effects and nosocomial infections). Limiting telemetric monitoring largely aims to reduce costly care that provides only limited benefit. Therefore, the nature of potential benefit to patients is very different—improved clinical outcomes in the former and potential cost savings in the latter. Future studies could separately assess physician attitudes about these 2 different definitions of low-value services.
Our study also demonstrates that the more physicians believe that much of any money saved goes to the profits and salaries of insurance companies, hospitals and/or health systems, and their leaders rather than to patients, the less likely they are to support policies financially penalizing physicians for prescribing low-value services.
Our study does not address why physicians have the beliefs that they have, but a likely explanation, at least in part, is that financial flows in healthcare are complex and tangled. Indeed, a clear understanding of who actually benefits is so hard to determine that these stated beliefs may really derive from views of power or justice rather than from some understanding of funds flow. Whether or not ideological attitudes underlie these expressed beliefs, policymakers and healthcare institutions might be advised to increase transparency about how cost savings are realized and whom they benefit.
Our analysis has limitations. Although it provides insight into where physicians believe relative amounts of money saved go with respect to 6 common options, the study did not include an exhaustive list of possibilities. The response rate also limits the representativeness of our results. Additionally, the study design prevents conclusions about causality; we cannot determine whether the belief that savings go to insurance companies and their executives is what reduces physicians’ enthusiasm for penalties, whether the causal association is in the opposite direction, or whether the 2 factors are linked in another way.
Nonetheless, our findings are consistent with a sense of healthcare justice in which physicians support penalties imposed on themselves only if the resulting benefits accrue to patients rather than to corporate or organizational interests. Effective physician penalties will likely need to address the belief that insurers and provider organizations stand to gain more than patients when low-value care services are reduced.
Disclosure
Drs. Liao, Schapira, Mitra, and Weissman have no conflicts to disclose. Dr. Navathe serves as advisor to Navvis and Company, Navigant Inc., Lynx Medical, Indegene Inc., and Sutherland Global Services and receives an honorarium from Elsevier Press, none of which have relationship to this manuscript. Dr. Asch is a partner and partial owner of VAL Health, which has no relationship to this manuscript.
Funding
This work was supported by The Leonard Davis Institute of Health Economics at the University of Pennsylvania, which had no role in the study design, data collection, analysis, or interpretation of results.
1. Berwick DM. Avoiding overuse – the next quality frontier. Lancet. 2017;390(10090):102-104. PubMed
2. Centers for Medicare and Medicaid Services. CMS response to Public Comments on Non-Recommended PSA-Based Screening Measure. https://www.cms.gov/Medicare/Quality-Initiatives-Patient-Assessment-Instruments/MMS/Downloads/eCQM-Development-and-Maintenance-for-Eligible-Professionals_CMS_PSA_Response_Public-Comment.pdf. Accessed September 18, 2017.
3. Asch DA, Jepson C, Hershey JC, Baron J, Ubel PA. When Money is Saved by Reducing Healthcare Costs, Where Do US Primary Care Physicians Think the Money Goes? Am J Manag Care. 2003;9(6):438-442. PubMed
4. Society of Hospital Medicine. Choosing Wisely. https://www.hospitalmedicine.org/choosingwisely. Accessed September 18, 2017.
5. Liao JM, Navathe AS, Schapira MS, Weissman A, Mitra N, Asch DAA. Penalizing Physicians for Low Value Care in Hospital Medicine: A Randomized Survey. J Hosp Med. 2017. (In press). PubMed
Physicians face growing pressure to reduce their use of “low value” care—services that provide either little to no benefit, little benefit relative to cost, or outsized potential harm compared to benefit. One emerging policy solution for deterring such services is to financially penalize physicians who prescribe them.1,2
Physicians’ willingness to support such policies may depend on who they believe benefits from reductions in low-value care. In previous studies of cancer screening, the more that primary care physicians felt that the money saved from cost-containment efforts went to insurance company profits rather than to patients, the less willing they were to use less expensive cancer screening approaches.3
Similarly, physicians may be more likely to support financial penalty policies if they perceive that the benefits from reducing low-value care accrue to patients (eg, lower out-of-pocket costs) rather than insurers or hospitals (eg, profits and salaries of their leaders). If present, such perceptions could inform incentive design. We explored the hypothesis that support of financial penalties
METHODS
Study Sample
By using a panel of internists maintained by the American College of Physicians, we conducted a randomized, web-based survey among 484 physicians who were either internal medicine residents or internal medicine physicians practicing hospital medicine.
Survey Instrument
Respondents used a 5-point scale (“strongly disagree” to “strongly agree”) to indicate their agreement with a policy that financially penalizes physicians for prescribing services that provide few benefits to patients. Respondents were asked to simultaneously consider the following hospital medicine services, deemed to be low value based on medical evidence and consensus guidelines4: (1) placing, and leaving in, urinary catheters for urine output monitoring in noncritically ill patients, (2) ordering continuous telemetry monitoring for nonintensive care unit patients without a protocol governing continuation, and (3) prescribing stress ulcer prophylaxis for medical patients not at a high risk for gastrointestinal complications. Policy support was defined as “somewhat” or “strongly” agreeing with the policy. As part of another study of this physician cohort, this question varied in how the harm of low-value services was framed: either as harm to patients, to society, or to hospitals and insurers as institutions. Respondent characteristics were balanced across survey versions, and for the current analysis, we pooled responses across all versions.
All other questions in the survey, described in detail elsewhere,5 were identical for all respondents. For this analysis, we focused on a question that asked physicians to assume that reducing these services saves money without harming the quality of care and to rate on a 4-point scale (“none” to “a lot”) how much of the money saved would ultimately go to the following 6 nonmutually exclusive areas: (a) other healthcare services for patients, (b) reduced charges to patients’ employers or insurers, (c) reduced out-of-pocket costs for patients, (d) salaries and bonuses for physicians, (e) salaries and profits for insurance companies and their leaders, and (f) salaries and profits for hospitals and/or health systems and their leaders.
Based on the positive correlation identified between the first 4 items (a to d) and negative correlation with the other 2 items (e and f), we reverse-coded the latter 2 and summed all 6 into a single-outcome scale, effectively representing the degree to which the money saved from reducing low-value services accrues generally to patients or physicians instead of to hospitals, insurance companies, and their leaders. The Cronbach alpha for the scale was 0.74, indicating acceptable reliability. Based on scale responses, we dichotomized respondents at the median into those who believe that the money saved from reducing low-value services would accrue as benefits to patients or physicians and those who believe benefits accrue to insurance companies or hospitals and/or health systems and their leaders. The protocol was exempted by the University of Pennsylvania Institutional Review Board.
Statistical Analysis
We used a χ2 test and multivariable logistic regression analysis to evaluate the association between policy support and physician beliefs about who benefits from reductions in low-value care. A χ2 test and a Kruskal-Wallis test were also used to evaluate the association between other respondent characteristics and beliefs about who benefits from reductions in low-value care. Analyses were performed by using Stata version 14.1 (StataCorp, College Station, TX). Tests of significance were 2-tailed at an alpha of .05.
RESULTS
Compared with nonrespondents, the 187 physicians who responded (39% response rate) were more likely to be female (30% vs 26%, P = 0.001), older (mean age 41 vs 36 years old, P < 0.001), and practicing clinicians rather than internal medicine residents (87% vs 69%, P < 0.001). Twenty-one percent reported that their personal compensation was tied to cost incentives.
Overall, respondents believed that more of any money saved from reducing low-value services would go to profits and leadership salaries for insurance companies and hospitals and/or health systems rather than to patients (panel A of Figure). Few respondents felt that the money saved would ultimately go toward physician compensation.
Sixty-six percent of physicians who supported penalties believed that benefits from reducing low-value care accrue to patients or physicians, compared to 39% among those not supporting penalties (P < 0.001). In multivariable analyses, policy support was associated with the belief that the money saved from reducing low-value services would accrue as benefits to patients or physicians rather than as salaries and profits for insurance companies or hospitals and/or health systems and their leaders (Table). There were no statistically significant associations between respondent age, gender, or professional status and beliefs about who benefits from reductions in low-value care.
DISCUSSION
Despite ongoing efforts to highlight how reducing low-value care benefits patients, physicians in our sample did not believe that much of the money saved would benefit patients.
This result may reflect that while some care patterns are considered low value because they provide little benefit at a high cost, others yield potential harm, regardless of cost. For example, limiting stress ulcer prophylaxis largely aims to avoid clinical harm (eg, adverse drug effects and nosocomial infections). Limiting telemetric monitoring largely aims to reduce costly care that provides only limited benefit. Therefore, the nature of potential benefit to patients is very different—improved clinical outcomes in the former and potential cost savings in the latter. Future studies could separately assess physician attitudes about these 2 different definitions of low-value services.
Our study also demonstrates that the more physicians believe that much of any money saved goes to the profits and salaries of insurance companies, hospitals and/or health systems, and their leaders rather than to patients, the less likely they are to support policies financially penalizing physicians for prescribing low-value services.
Our study does not address why physicians have the beliefs that they have, but a likely explanation, at least in part, is that financial flows in healthcare are complex and tangled. Indeed, a clear understanding of who actually benefits is so hard to determine that these stated beliefs may really derive from views of power or justice rather than from some understanding of funds flow. Whether or not ideological attitudes underlie these expressed beliefs, policymakers and healthcare institutions might be advised to increase transparency about how cost savings are realized and whom they benefit.
Our analysis has limitations. Although it provides insight into where physicians believe relative amounts of money saved go with respect to 6 common options, the study did not include an exhaustive list of possibilities. The response rate also limits the representativeness of our results. Additionally, the study design prevents conclusions about causality; we cannot determine whether the belief that savings go to insurance companies and their executives is what reduces physicians’ enthusiasm for penalties, whether the causal association is in the opposite direction, or whether the 2 factors are linked in another way.
Nonetheless, our findings are consistent with a sense of healthcare justice in which physicians support penalties imposed on themselves only if the resulting benefits accrue to patients rather than to corporate or organizational interests. Effective physician penalties will likely need to address the belief that insurers and provider organizations stand to gain more than patients when low-value care services are reduced.
Disclosure
Drs. Liao, Schapira, Mitra, and Weissman have no conflicts to disclose. Dr. Navathe serves as advisor to Navvis and Company, Navigant Inc., Lynx Medical, Indegene Inc., and Sutherland Global Services and receives an honorarium from Elsevier Press, none of which have relationship to this manuscript. Dr. Asch is a partner and partial owner of VAL Health, which has no relationship to this manuscript.
Funding
This work was supported by The Leonard Davis Institute of Health Economics at the University of Pennsylvania, which had no role in the study design, data collection, analysis, or interpretation of results.
1. Berwick DM. Avoiding overuse – the next quality frontier. Lancet. 2017;390(10090):102-104. PubMed
2. Centers for Medicare and Medicaid Services. CMS response to Public Comments on Non-Recommended PSA-Based Screening Measure. https://www.cms.gov/Medicare/Quality-Initiatives-Patient-Assessment-Instruments/MMS/Downloads/eCQM-Development-and-Maintenance-for-Eligible-Professionals_CMS_PSA_Response_Public-Comment.pdf. Accessed September 18, 2017.
3. Asch DA, Jepson C, Hershey JC, Baron J, Ubel PA. When Money is Saved by Reducing Healthcare Costs, Where Do US Primary Care Physicians Think the Money Goes? Am J Manag Care. 2003;9(6):438-442. PubMed
4. Society of Hospital Medicine. Choosing Wisely. https://www.hospitalmedicine.org/choosingwisely. Accessed September 18, 2017.
5. Liao JM, Navathe AS, Schapira MS, Weissman A, Mitra N, Asch DAA. Penalizing Physicians for Low Value Care in Hospital Medicine: A Randomized Survey. J Hosp Med. 2017. (In press). PubMed
© 2018 Society of Hospital Medicine
Penalizing Physicians for Low-Value Care in Hospital Medicine: A Randomized Survey
Reducing low-value care—services for which there is little to no benefit, little benefit relative to cost, or outsized potential harm compared with benefit—is an essential step toward maintaining or improving quality while lowering cost. Unfortunately, low-value services persist widelydespite professional consensus, guidelines, and national campaigns aimed to reduce them.1-3 In turn, policy makers are beginning to consider financially penalizing physicians in order to deter low-value services.4,5 Physician support for such penalties remains unknown. In this study, we used a randomized survey experiment to evaluate how the framing of harms from low-value care—in terms of those to patients, healthcare institutions, or society—influenced physician support of financial penalties for low-value care services.
METHODS
Study Sample
By using a stratified random sample maintained by the American College of Physicians, we conducted a web-based survey among 484 physicians who were either internal medicine residents or internists practicing hospital medicine.
Instrument Design and Administration
Our study focused on 3 low-value services relevant to inpatient medicine: (1) placing, and leaving in, urinary catheters for urine output monitoring in noncritically ill patients; (2) ordering continuous telemetry monitoring for nonintensive care unit (non-ICU) patients without a protocol governing continuation; and (3) prescribing stress ulcer prophylaxis for medical patients not at a high risk for gastrointestinal (GI) complications. Although the nature and trade-offs between costs, harms, and benefits vary by individual service, all 3 are promulgated through the Choosing Wisely® guidelines as low value based on existing data and professional consensus from the Society of Hospital Medicine.6
To evaluate intended behavior related to these 3 low-value services, respondents were first presented with 3 clinical vignettes focused on the care of patients hospitalized for pneumonia, congestive heart failure, and alcohol withdrawal, which were selected to reflect common inpatient medicine scenarios. Respondents were asked to use a 4-point scale (very likely to very unlikely) to estimate how likely they were to recommend various tests or treatments, including the low-value services noted above. Respondents who were “somewhat unlikely” and “very unlikely” to recommend low-value services were considered concordant with low-value care guidelines.
Following the vignettes, respondents then used a 5-point scale (strongly agree to strongly disagree) to indicate their agreement with a policy that financially penalizes physicians for prescribing each service. Support was defined as “somewhat or strongly” agreeing with the policy. Respondents were randomized to receive 1 of 3 versions of this question (supplementary Appendix).
All versions stated that, “According to research and expert opinion, certain aspects of inpatient care provide little benefit to patients” and listed the 3 low-value services noted above. The “patient harm” version also described the harm of low-value care as costs to patients and risk for clinical harms and complications. The “societal harm” version described the harms as costs to society and utilization of limited healthcare resources. The “institutional harm” version described harms as costs to hospitals and insurers.
Other survey items were adapted from existing literature7-9 and evaluated respondent beliefs about the effectiveness of physician incentives in improving the value of care, as well as the appropriateness of including cost considerations in clinical decision-making.
The instrument was pilot tested among study team members and several independent internists affiliated with the University of Pennsylvania. After incorporating feedback into the final instrument, the web-based survey was distributed to eligible physicians via e-mail. Responses were anonymous and respondents received a $15 gift card for participation. The protocol was reviewed and deemed exempt by the University of Pennsylvania Institutional Review Board.
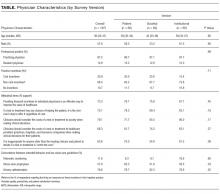
Statistical Analysis
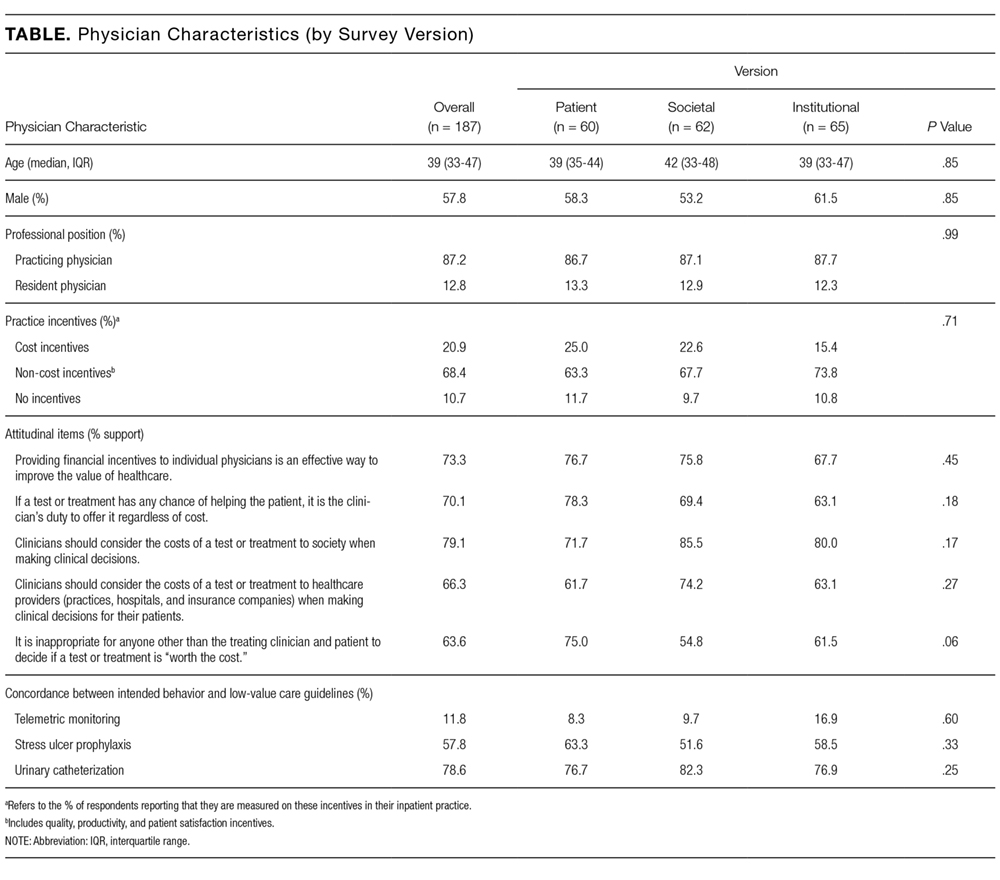
Respondent characteristics (sociodemographic, intended clinical behavior, and cost control attitudes) were described by using percentages for categorical variables and medians and interquartile ranges for continuous variables. Balance in respondent characteristics across survey versions was evaluated using χ2 and Kruskal-Wallis tests. Multivariable logistic regression, adjusted for characteristics in the Table, was used to evaluate the association between survey version and policy support. All tests of significance were 2-tailed with significance level alpha = 0.05. Analyses were performed using STATA version 14.1 (StataCorp LLC, College Station, TX, http://www.stata.com).
RESULTS
Of 484 eligible respondents, 187 (39%) completed the survey. Compared with nonrespondents, respondents were more likely to be female (30% vs 26%, P = 0.001), older (mean age 41 vs 36 years, P < 0.001), and practicing clinicians rather than internal medicine residents (87% vs 69%, P < 0.001). Physician characteristics were similar across the 3 survey versions (Table). Most respondents agreed that financial incentives for individual physicians is an effective way to improve the value of healthcare (73.3%) and that physicians should consider the costs of a test or treatment to society when making clinical decisions for patients (79.1%). The majority also felt that clinicians have a duty to offer a test or treatment to a patient if it has any chance of helping them (70.1%) and that it is inappropriate for anyone beyond the clinician and patient to decide if a test or treatment is “worth the cost” (63.6%).
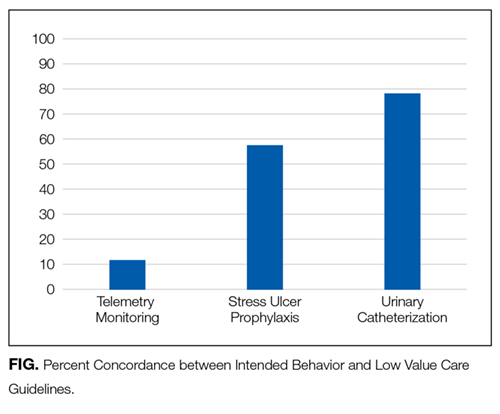
Overall, policy support rate was 39.6% and was the highest for the “societal harm” version (48.4%), followed by the “institutional harm” (36.9%) and “patient harm” (33.3%) versions. Compared with respondents receiving the “patient harm” version, those receiving the “societal harm” version (adjusted odds ratio [OR] 2.83; 95% confidence interval [CI], 1.20-6.69), but not the “institutional harm” framing (adjusted OR 1.53; 95% CI, 0.66-3.53), were more likely to report policy support. Policy support was also higher among those who agreed that providing financial incentives to individual physicians is an effective way to improve the value of healthcare (adjusted OR 4.61; 95% CI, 1.80-11.80).
DISCUSSION
To our knowledge, this study is the first to prospectively evaluate physician support of financial penalties for low-value services relevant to hospital medicine. It has 2 main findings.
First, although overall policy support was relatively low (39.6%), it varied significantly on the basis of how the harms of low-value care were framed. Support was highest in the “societal harm” version, suggesting that emphasizing these harms may increase acceptability of financial penalties among physicians and contribute to the larger effort to decrease low-value care in hospital settings. The comparatively low support for the “patient harm” version is somewhat surprising but may reflect variation in the nature of harm, benefit, and cost trade-offs for individual low-value services, as noted above, and physician belief that some low-value services do not in fact produce significant clinical harms.
For example, whereas evidence demonstrates that stress ulcer prophylaxis in non-ICU patients can harm patients through nosocomial infections and adverse drug effects,10,11 the clinical harms of telemetry are less obvious. Telemetry’s low value derives more from its high cost relative to benefit, rather than its potential for clinical harm.6 The many paths to “low value” underscore the need to examine attitudes and uptake toward these services separately and may explain the wide range in concordance between intended clinical behavior and low-value care guidelines (11.8% to 78.6%).
Reinforcing policies could more effectively deter low-value care. For example, multiple forces, including Medicare payment reform and national accreditation policies,12,13 have converged to discourage low-value use of urinary catheters in hospitalized patients. In contrast, there has been little reinforcement beyond consensus guidelines to reduce low-value use of telemetric monitoring. Given questions about whether consensus methods alone can deter low-value care beyond obvious “low hanging fruit,”14 policy makers could coordinate policies to accelerate progress within other priority areas.
Broad policies should also be paired with local initiatives to influence physician behavior. For example, health systems have begun successfully leveraging the electronic medical record and utilizing behavioral economics principles to design interventions to reduce inappropriate overuse of antibiotics for upper respiratory infections in primary care clinics.15 Organizations are also redesigning care processes in response to resource utilization imperatives under ongoing value-based care payment reform. Care redesign and behavioral interventions embedded at the point of care can both help deter low-value services in inpatient settings.
Study limitations include a relatively low response rate, which limits generalizability. However, all 3 randomized groups were similar on measured characteristics, and experimental randomization reduces the nonresponse bias concerns accompanying descriptive surveys. Additionally, although we evaluated intended clinical behavior in a national sample, our results may not reflect actual behavior among all physicians practicing hospital medicine. Future work could include assessments of actual or self-reported practices or examine additional factors, including site, years of practice, knowledge about guidelines, and other possible determinants of guideline-concordant behaviors.
Despite these limitations, our study provides important early evidence about physician support of financial penalties for low-value care relevant to hospital medicine. As policy makers design and organizational leaders implement financial incentive policies, this information can help increase their acceptability among physicians and more effectively reduce low-value care within hospitals.
Disclosure
Drs. Liao, Schapira, Mitra, and Weissman have no conflicts to disclose. Dr. Navathe serves as advisor to Navvis and Company, Navigant Inc, Lynx Medical, Indegene Inc, and Sutherland Global Services and receives an honorarium from Elsevier Press, none of which have relationship to this manuscript. Dr. Asch is a partner and part owner of VAL Health, which has no relationship to this manuscript.
Funding
This work was supported by The Leonard Davis Institute of Health Economics at the University of Pennsylvania, which had no role in the study design, data collection, analysis, or interpretation of results.
1. The MedPAC blog. Use of low-value care in Medicare is substantial. http://www.medpac.gov/-blog-/medpacblog/2015/05/21/use-of-low-value-care-in-medicare-is-substantial. Accessed on September 18, 2017.
2. American Board of Internal Medicine Foundation. Choosing Wisely. http://www.choosingwisely.org/. Accessed on September 18, 2017.
3. Rosenberg A, Agiro A, Gottlieb M, et al. Early Trends Among Seven Recommendations From the Choosing Wisely Campaign. JAMA Intern Med. 2015;175(12):1913-1920. PubMed
4. Centers for Medicare & Medicaid Services. CMS Response to Public Comments on Non-Recommended PSA-Based Screening Measure. https://www.cms.gov/Medicare/Quality-Initiatives-Patient-Assessment-Instruments/MMS/Downloads/eCQM-Development-and-Maintenance-for-Eligible-Professionals_CMS_PSA_Response_Public-Comment.pdf. Accessed September 18, 2017.
5. Berwick DM. Avoiding overuse-the next quality frontier. Lancet. 2017;390(10090):102-104. doi: 10.1016/S0140-6736(16)32570-3. PubMed
6. Society of Hospital Medicine. Choosing Wisely. https://www.hospitalmedicine.org/choosingwisely. Accessed on September 18, 2017.
7. Tilburt JC, Wynia MK, Sheeler RD, et al. Views of US Physicians About Controlling Health Care Costs. JAMA. 2013;310(4):380-388. PubMed
8. Ginsburg ME, Kravitz RL, Sandberg WA. A survey of physician attitudes and practices concerning cost-effectiveness in patient care. West J Med. 2000;173(6):309-394. PubMed
9. Colla CH, Kinsella EA, Morden NE, Meyers DJ, Rosenthal MB, Sequist TD. Physician perceptions of Choosing Wisely and drivers of overuse. Am J Manag Care. 2016;22(5):337-343. PubMed
10. Herzig SJ, Vaughn BP, Howell MD, Ngo LH, Marcantonio ER. Acid-suppressive medication use and the risk for nosocomial gastrointestinal tract bleeding. Arch Intern Med. 2011;171(11):991-997. PubMed
11. Pappas M, Jolly S, Vijan S. Defining Appropriate Use of Proton-Pump Inhibitors Among Medical Inpatients. J Gen Intern Med. 2016;31(4):364-371. PubMed
12. Centers for Medicare & Medicaid Services. CMS’ Value-Based Programs. https://www.cms.gov/Medicare/Quality-Initiatives-Patient-Assessment-Instruments/Value-Based-Programs/Value-Based-Programs.html. Accessed September 18, 2017.
13. The Joint Commission. Requirements for the Catheter-Associated Urinary Tract Infections (CAUTI) National Patient Safety Goal for Hospitals. https://www.jointcommission.org/assets/1/6/R3_Cauti_HAP.pdf. Accessed September 18, 2017 .
14. Beaudin-Seiler B, Ciarametaro M, Dubois R, Lee J, Fendrick AM. Reducing Low-Value Care. Health Affairs Blog. http://healthaffairs.org/blog/2016/09/20/reducing-low-value-care/. Accessed on September 18, 2017.
15. Meeker D, Linder JA, Fox CR, et al. Effect of Behavioral Interventions on Inappropriate Antibiotic Prescribing Among Primary Care Practices: A Randomized Clinical Trial. JAMA. 2016;315(6):562-570. PubMed
Reducing low-value care—services for which there is little to no benefit, little benefit relative to cost, or outsized potential harm compared with benefit—is an essential step toward maintaining or improving quality while lowering cost. Unfortunately, low-value services persist widelydespite professional consensus, guidelines, and national campaigns aimed to reduce them.1-3 In turn, policy makers are beginning to consider financially penalizing physicians in order to deter low-value services.4,5 Physician support for such penalties remains unknown. In this study, we used a randomized survey experiment to evaluate how the framing of harms from low-value care—in terms of those to patients, healthcare institutions, or society—influenced physician support of financial penalties for low-value care services.
METHODS
Study Sample
By using a stratified random sample maintained by the American College of Physicians, we conducted a web-based survey among 484 physicians who were either internal medicine residents or internists practicing hospital medicine.
Instrument Design and Administration
Our study focused on 3 low-value services relevant to inpatient medicine: (1) placing, and leaving in, urinary catheters for urine output monitoring in noncritically ill patients; (2) ordering continuous telemetry monitoring for nonintensive care unit (non-ICU) patients without a protocol governing continuation; and (3) prescribing stress ulcer prophylaxis for medical patients not at a high risk for gastrointestinal (GI) complications. Although the nature and trade-offs between costs, harms, and benefits vary by individual service, all 3 are promulgated through the Choosing Wisely® guidelines as low value based on existing data and professional consensus from the Society of Hospital Medicine.6
To evaluate intended behavior related to these 3 low-value services, respondents were first presented with 3 clinical vignettes focused on the care of patients hospitalized for pneumonia, congestive heart failure, and alcohol withdrawal, which were selected to reflect common inpatient medicine scenarios. Respondents were asked to use a 4-point scale (very likely to very unlikely) to estimate how likely they were to recommend various tests or treatments, including the low-value services noted above. Respondents who were “somewhat unlikely” and “very unlikely” to recommend low-value services were considered concordant with low-value care guidelines.
Following the vignettes, respondents then used a 5-point scale (strongly agree to strongly disagree) to indicate their agreement with a policy that financially penalizes physicians for prescribing each service. Support was defined as “somewhat or strongly” agreeing with the policy. Respondents were randomized to receive 1 of 3 versions of this question (supplementary Appendix).
All versions stated that, “According to research and expert opinion, certain aspects of inpatient care provide little benefit to patients” and listed the 3 low-value services noted above. The “patient harm” version also described the harm of low-value care as costs to patients and risk for clinical harms and complications. The “societal harm” version described the harms as costs to society and utilization of limited healthcare resources. The “institutional harm” version described harms as costs to hospitals and insurers.
Other survey items were adapted from existing literature7-9 and evaluated respondent beliefs about the effectiveness of physician incentives in improving the value of care, as well as the appropriateness of including cost considerations in clinical decision-making.
The instrument was pilot tested among study team members and several independent internists affiliated with the University of Pennsylvania. After incorporating feedback into the final instrument, the web-based survey was distributed to eligible physicians via e-mail. Responses were anonymous and respondents received a $15 gift card for participation. The protocol was reviewed and deemed exempt by the University of Pennsylvania Institutional Review Board.
Statistical Analysis
Respondent characteristics (sociodemographic, intended clinical behavior, and cost control attitudes) were described by using percentages for categorical variables and medians and interquartile ranges for continuous variables. Balance in respondent characteristics across survey versions was evaluated using χ2 and Kruskal-Wallis tests. Multivariable logistic regression, adjusted for characteristics in the Table, was used to evaluate the association between survey version and policy support. All tests of significance were 2-tailed with significance level alpha = 0.05. Analyses were performed using STATA version 14.1 (StataCorp LLC, College Station, TX, http://www.stata.com).
RESULTS
Of 484 eligible respondents, 187 (39%) completed the survey. Compared with nonrespondents, respondents were more likely to be female (30% vs 26%, P = 0.001), older (mean age 41 vs 36 years, P < 0.001), and practicing clinicians rather than internal medicine residents (87% vs 69%, P < 0.001). Physician characteristics were similar across the 3 survey versions (Table). Most respondents agreed that financial incentives for individual physicians is an effective way to improve the value of healthcare (73.3%) and that physicians should consider the costs of a test or treatment to society when making clinical decisions for patients (79.1%). The majority also felt that clinicians have a duty to offer a test or treatment to a patient if it has any chance of helping them (70.1%) and that it is inappropriate for anyone beyond the clinician and patient to decide if a test or treatment is “worth the cost” (63.6%).
Overall, policy support rate was 39.6% and was the highest for the “societal harm” version (48.4%), followed by the “institutional harm” (36.9%) and “patient harm” (33.3%) versions. Compared with respondents receiving the “patient harm” version, those receiving the “societal harm” version (adjusted odds ratio [OR] 2.83; 95% confidence interval [CI], 1.20-6.69), but not the “institutional harm” framing (adjusted OR 1.53; 95% CI, 0.66-3.53), were more likely to report policy support. Policy support was also higher among those who agreed that providing financial incentives to individual physicians is an effective way to improve the value of healthcare (adjusted OR 4.61; 95% CI, 1.80-11.80).
DISCUSSION
To our knowledge, this study is the first to prospectively evaluate physician support of financial penalties for low-value services relevant to hospital medicine. It has 2 main findings.
First, although overall policy support was relatively low (39.6%), it varied significantly on the basis of how the harms of low-value care were framed. Support was highest in the “societal harm” version, suggesting that emphasizing these harms may increase acceptability of financial penalties among physicians and contribute to the larger effort to decrease low-value care in hospital settings. The comparatively low support for the “patient harm” version is somewhat surprising but may reflect variation in the nature of harm, benefit, and cost trade-offs for individual low-value services, as noted above, and physician belief that some low-value services do not in fact produce significant clinical harms.
For example, whereas evidence demonstrates that stress ulcer prophylaxis in non-ICU patients can harm patients through nosocomial infections and adverse drug effects,10,11 the clinical harms of telemetry are less obvious. Telemetry’s low value derives more from its high cost relative to benefit, rather than its potential for clinical harm.6 The many paths to “low value” underscore the need to examine attitudes and uptake toward these services separately and may explain the wide range in concordance between intended clinical behavior and low-value care guidelines (11.8% to 78.6%).
Reinforcing policies could more effectively deter low-value care. For example, multiple forces, including Medicare payment reform and national accreditation policies,12,13 have converged to discourage low-value use of urinary catheters in hospitalized patients. In contrast, there has been little reinforcement beyond consensus guidelines to reduce low-value use of telemetric monitoring. Given questions about whether consensus methods alone can deter low-value care beyond obvious “low hanging fruit,”14 policy makers could coordinate policies to accelerate progress within other priority areas.
Broad policies should also be paired with local initiatives to influence physician behavior. For example, health systems have begun successfully leveraging the electronic medical record and utilizing behavioral economics principles to design interventions to reduce inappropriate overuse of antibiotics for upper respiratory infections in primary care clinics.15 Organizations are also redesigning care processes in response to resource utilization imperatives under ongoing value-based care payment reform. Care redesign and behavioral interventions embedded at the point of care can both help deter low-value services in inpatient settings.
Study limitations include a relatively low response rate, which limits generalizability. However, all 3 randomized groups were similar on measured characteristics, and experimental randomization reduces the nonresponse bias concerns accompanying descriptive surveys. Additionally, although we evaluated intended clinical behavior in a national sample, our results may not reflect actual behavior among all physicians practicing hospital medicine. Future work could include assessments of actual or self-reported practices or examine additional factors, including site, years of practice, knowledge about guidelines, and other possible determinants of guideline-concordant behaviors.
Despite these limitations, our study provides important early evidence about physician support of financial penalties for low-value care relevant to hospital medicine. As policy makers design and organizational leaders implement financial incentive policies, this information can help increase their acceptability among physicians and more effectively reduce low-value care within hospitals.
Disclosure
Drs. Liao, Schapira, Mitra, and Weissman have no conflicts to disclose. Dr. Navathe serves as advisor to Navvis and Company, Navigant Inc, Lynx Medical, Indegene Inc, and Sutherland Global Services and receives an honorarium from Elsevier Press, none of which have relationship to this manuscript. Dr. Asch is a partner and part owner of VAL Health, which has no relationship to this manuscript.
Funding
This work was supported by The Leonard Davis Institute of Health Economics at the University of Pennsylvania, which had no role in the study design, data collection, analysis, or interpretation of results.
1. The MedPAC blog. Use of low-value care in Medicare is substantial. http://www.medpac.gov/-blog-/medpacblog/2015/05/21/use-of-low-value-care-in-medicare-is-substantial. Accessed on September 18, 2017.
2. American Board of Internal Medicine Foundation. Choosing Wisely. http://www.choosingwisely.org/. Accessed on September 18, 2017.
3. Rosenberg A, Agiro A, Gottlieb M, et al. Early Trends Among Seven Recommendations From the Choosing Wisely Campaign. JAMA Intern Med. 2015;175(12):1913-1920. PubMed
4. Centers for Medicare & Medicaid Services. CMS Response to Public Comments on Non-Recommended PSA-Based Screening Measure. https://www.cms.gov/Medicare/Quality-Initiatives-Patient-Assessment-Instruments/MMS/Downloads/eCQM-Development-and-Maintenance-for-Eligible-Professionals_CMS_PSA_Response_Public-Comment.pdf. Accessed September 18, 2017.
5. Berwick DM. Avoiding overuse-the next quality frontier. Lancet. 2017;390(10090):102-104. doi: 10.1016/S0140-6736(16)32570-3. PubMed
6. Society of Hospital Medicine. Choosing Wisely. https://www.hospitalmedicine.org/choosingwisely. Accessed on September 18, 2017.
7. Tilburt JC, Wynia MK, Sheeler RD, et al. Views of US Physicians About Controlling Health Care Costs. JAMA. 2013;310(4):380-388. PubMed
8. Ginsburg ME, Kravitz RL, Sandberg WA. A survey of physician attitudes and practices concerning cost-effectiveness in patient care. West J Med. 2000;173(6):309-394. PubMed
9. Colla CH, Kinsella EA, Morden NE, Meyers DJ, Rosenthal MB, Sequist TD. Physician perceptions of Choosing Wisely and drivers of overuse. Am J Manag Care. 2016;22(5):337-343. PubMed
10. Herzig SJ, Vaughn BP, Howell MD, Ngo LH, Marcantonio ER. Acid-suppressive medication use and the risk for nosocomial gastrointestinal tract bleeding. Arch Intern Med. 2011;171(11):991-997. PubMed
11. Pappas M, Jolly S, Vijan S. Defining Appropriate Use of Proton-Pump Inhibitors Among Medical Inpatients. J Gen Intern Med. 2016;31(4):364-371. PubMed
12. Centers for Medicare & Medicaid Services. CMS’ Value-Based Programs. https://www.cms.gov/Medicare/Quality-Initiatives-Patient-Assessment-Instruments/Value-Based-Programs/Value-Based-Programs.html. Accessed September 18, 2017.
13. The Joint Commission. Requirements for the Catheter-Associated Urinary Tract Infections (CAUTI) National Patient Safety Goal for Hospitals. https://www.jointcommission.org/assets/1/6/R3_Cauti_HAP.pdf. Accessed September 18, 2017 .
14. Beaudin-Seiler B, Ciarametaro M, Dubois R, Lee J, Fendrick AM. Reducing Low-Value Care. Health Affairs Blog. http://healthaffairs.org/blog/2016/09/20/reducing-low-value-care/. Accessed on September 18, 2017.
15. Meeker D, Linder JA, Fox CR, et al. Effect of Behavioral Interventions on Inappropriate Antibiotic Prescribing Among Primary Care Practices: A Randomized Clinical Trial. JAMA. 2016;315(6):562-570. PubMed
© 2018 Society of Hospital Medicine
Bedside Assessment of the Necessity of Daily Lab Testing for Patients Nearing Discharge
As part of the Choosing Wisely® campaign, the Society of Hospital Medicine recommends against performing “repetitive complete blood count [CBC] and chemistry testing in the face of clinical and lab stability.”1 This recommendation stems from a body of research that shows that frequent or excessive phlebotomy can have negative consequences, including iatrogenic anemia (termed hospital-acquired anemia), which may necessitate blood transfusion.2 The downstream effects of potentially unnecessary testing, including the evaluation of false-positive results, must also be considered. Additional important effects include patient discomfort and disruption of sleep and unproductive work by hospital staff, including nurses, phlebotomists, and laboratory technicians.
Though interventions to reduce unnecessary daily labs have been previously evaluated, there are no studies that focus on decreasing lab testing on patients deemed clinically stable and close to discharge. This is in part due to the absence of clear criteria or guidelines to define clinical stability in the context of lab utilization.
We therefore aimed to implement a multifaceted, patient-centered initiative—the Necessity of Labs Assessed Bedside (NO LABS)—that focused on reducing lab testing in patients at 24 to 48 hours before discharge. We targeted the 24 to 48-hour period before the anticipated date of discharge, as this may be a period of greater stability and provide an opportunity to identify and decrease unnecessary testing.
METHODS
The study took place at Mount Sinai Hospital, which is an 1174-bed tertiary care teaching hospital in New York City. We targeted 2 inpatient medicine units where virtually all patients are assigned to a hospitalist rotating for a 2- to 4-week period, for the period of July 1, 2015, to July 31, 2016. These units employed bedside interdisciplinary rounds (IDR) attended by the hospitalist, social worker, case manager, nurse, nurse manager, and medical director. Bedside IDR focuses on the daily plan and patient safety by
As described by Dunn et al.,3 the IDR script included the following: a review of the plan of care by the hospitalist, identifying a patient’s personal goals for the day, a brief update of discharge planning (as appropriate), and a safety assessment performed by the nurse (identifying Foley catheters, falls risk, etc). We incorporated an inquiry into the daily IDR script identifying clinically stable patients for discharge in the next 24 to 48 hours (based on physician judgment), followed by a prompt to the hospitalist to discontinue labs when appropriate. The unit medical director and nurse manager were both tasked with prompting the hospitalist at the bedside. Our hospital utilizes computerized physician order entry. Lab orders were then discontinued by the clinician during rounds using a computer on wheels (or after rounds when one was not available). The hospitalist, unit medical director, and nurse manager were reminded about the project through weekly e-mails and in-person communication.
To assess whether the prompt was being incorporated consistently, an observer was added to rounds beginning in the second month of the project. The observer was present at least 3 times a week for the subsequent 3 months of the project. Our intervention also included education geared towards hospitalists, including a brief presentation on reducing unnecessary lab testing during a monthly hospitalist faculty meeting (the first and sixth month of the intervention). The group’s data on laboratory testing within the 24 to 48 hours prior to discharge were also presented at these monthly meetings (beginning 2 months into the intervention and monthly thereafter). Lastly, we provided the unit staff with unit-level metrics, biweekly for the first 3 months and every 2 to 3 months thereafter.
We extracted electronic medical record (EMR) data on lab utilization for patients on the 2 hospitalist units for the intervention period. Baseline data were obtained from July 1, 2014, to June 30, 2015. Patients with a length of stay (LOS) ≤7 days (75th percentile) were included; on these units, longer stays were considered more likely to have complex social issues delaying discharge and thus less likely to require laboratory testing. We tracked ordering for 4 common lab tests: basic metabolic panel, CBC, CBC with differential, and the comprehensive metabolic panel. The primary outcome was the monthly percentage of patients for whom testing was ordered in the 24 and 48 hours preceding discharge. A secondary outcome was testing at 72 hours preceding discharge to identify any potential compensatory (increased) testing the evening prior. We applied a quasi-experimental interrupted time series design with a segmented regression analysis to estimate changes before and after our intervention, expressed in acute changes (change in intercept) and over time (changes in trend) while adjusting for preintervention trends. All analyses were performed with SAS v9.4 statistical software (SAS Institute, Cary, NC). Our project was deemed a quality improvement project and thus an IRB submission was not required.
RESULTS
There were 1579 discharges in the preintervention period and 1308 discharges in the postintervention period. The average age of the patient population was similar in the baseline and postintervention groups (61.5 vs 59.3 years; P = 0.400), and there was no difference in the mean LOS before and after implementation (3.67 vs 3.68 days; P = 0.817).
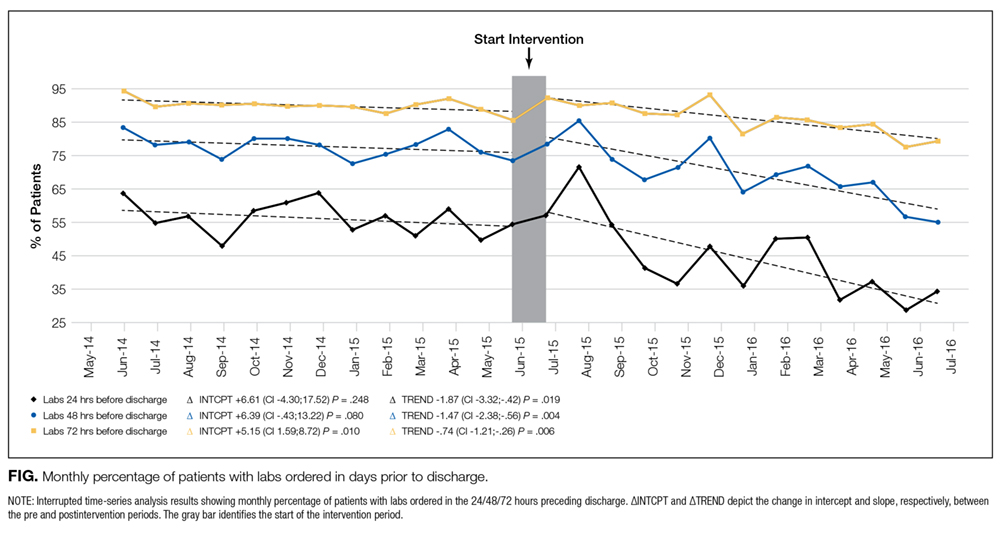
DISCUSSION
Our structured, multifaceted approach effectively reduced daily lab testing in the 24 to 48 hours prior to discharge. Bedside IDR provided a unique opportunity to effectively communicate to the patient about necessary (or unnecessary) testing. Moreover, given the complexity of identifying clinical stability, our strategy focused on the onset of discharge planning, a more easily discernible and less obtrusive focal point to promote the discontinuation of lab testing.
Though the nature of bundled interventions can make it difficult to identify which intervention is most effective, we believe that all interventions were effective in different capacities during various phases in the intervention period. We believe that the decrease in lab testing in the 24 to 48 hours preceding discharge was primarily driven by the new rounding structure. This is evident in the significant decrease seen in the first few months of the intervention period. Six months into the intervention, we begin to see a decrease at 72 hours prior to discharge. Additionally, we see a decrease in the mean number of labs per patient day over the entire hospitalization period. We attribute these results to a gradual shift in the culture in our division as a direct consequence of educational sessions and individual feedback provided during this time.
To our knowledge, this is the first study to use anticipated discharge as a correlate for clinical stability and therefore as an opportunity to prompt discontinuation of laboratory testing. Other studies evaluated interventions targeting the EMR and the ease with which providers can order recurring labs. These include restricting recurring orders in the EMR,4 a robust education and awareness campaign targeting house staff,5 and other multifaceted approaches to decreasing lab utilization,6 all of which have shown promising results. While these approaches show varying degrees of success, ours is unique in its focus on the period prior to discharge. In addition, the intervention can be readily implemented in settings that utilize scripted IDR. It also brings high-value decision-making to the bedside by informing the patient that in the setting of presumed clinical stability, no additional tests are warranted.
Our study has several limitations. First, while interdisciplinary discharge rounds are widely implemented,7,8 our rounds occur at the bedside and employ a script, potentially limiting generalizability. The structured prompting may be feasible during structured IDR in a standard conference room setting, though we did not assess this model. Second, bedside rounds only included patients who were able to participate. Rounding on patients unable to participate, such as patients with delirium with agitation, was done outside the patient room rather than at the bedside. A modified script was used in these instances (absent questions addressed to the patient), allowing for the prompt to be incorporated. These patients were included in the analysis. Lastly, as previously stated, we cannot clearly identify which intervention (the prompt, education, or feedback) most effectively led to a sustained decrease in lab ordering.
Our structured, multifaceted intervention reduced laboratory testing during the last 48 hours of admission. Hospitals that aim to decrease potentially unnecessary lab testing should consider implementing a bundle, including a prompt at a uniform and structured point during the hospitalization of patients who are expected to be discharged within 24 to 48 hours, clinician education, an audit, and feedback.
Disclosure
All authors report no conflicts of interest to disclose.
1. Bulger J, Nickel W, Messler J, et al. Choosing wisely in adult hospital medicine: Five opportunities for improved healthcare value. J Hosp Med. 2013;8(9):486-492. PubMed
2. Thavendiranathan P, Bagai A, Ebidia A, Detsky AS, Choudhry NK. Do blood tests cause anemia in hospitalized patients? The effect of diagnostic phlebotomy on hemoglobin and hematocrit levels. J Gen Intern Med. 2005;20(6):520-524. PubMed
3. Dunn AS, Reyna, M, Radbill B, et al. The impact of bedside interdisciplinary rounds on length of stay and complications. J Hosp Med. 2017;3:137-142. PubMed
4. Iturrate E, Jubelt L, Volpicelli F, Hochman K. Optimize Your Electronic Medical Record to Increase Value: Reducing Laboratory Overutilization. Am J Med. 2016;129(2):215-220. PubMed
5. Wheeler D, Marcus P, Nguyen J, et al. Evaluation of a Resident-Led Project to Decrease Phlebotomy Rates in the Hospital: Think Twice, Stick Once. JAMA Intern Med. 2016;176(5):708-710. PubMed
6. Corson AH, Fan VS, White T, et al. A Multifaceted Hospitalist Quality Improvement Intervention: Decreased Frequency of Common Labs. J Hosp Med. 2015;10(6):390-395. PubMed
7. Bhamidipati VS, Elliott DJ, Justice EM, Belleh E, Sonnad SS, Robinson EJ. Structure and outcomes of interdisciplinary rounds in hospitalized medicine patients: A systematic review and suggested taxonomy. J Hosp Med. 2016;11(7):513-523. PubMed
8. O’Leary, KJ, Sehgal NL, Terrell G, Williams MV, High Performance Teams and the Hospital of the Future Project Team. Interdisciplinary teamwork in hospitals: a review and practical recommendations for improvement. J Hosp Med. 2012;7(1):48-54. PubMed
As part of the Choosing Wisely® campaign, the Society of Hospital Medicine recommends against performing “repetitive complete blood count [CBC] and chemistry testing in the face of clinical and lab stability.”1 This recommendation stems from a body of research that shows that frequent or excessive phlebotomy can have negative consequences, including iatrogenic anemia (termed hospital-acquired anemia), which may necessitate blood transfusion.2 The downstream effects of potentially unnecessary testing, including the evaluation of false-positive results, must also be considered. Additional important effects include patient discomfort and disruption of sleep and unproductive work by hospital staff, including nurses, phlebotomists, and laboratory technicians.
Though interventions to reduce unnecessary daily labs have been previously evaluated, there are no studies that focus on decreasing lab testing on patients deemed clinically stable and close to discharge. This is in part due to the absence of clear criteria or guidelines to define clinical stability in the context of lab utilization.
We therefore aimed to implement a multifaceted, patient-centered initiative—the Necessity of Labs Assessed Bedside (NO LABS)—that focused on reducing lab testing in patients at 24 to 48 hours before discharge. We targeted the 24 to 48-hour period before the anticipated date of discharge, as this may be a period of greater stability and provide an opportunity to identify and decrease unnecessary testing.
METHODS
The study took place at Mount Sinai Hospital, which is an 1174-bed tertiary care teaching hospital in New York City. We targeted 2 inpatient medicine units where virtually all patients are assigned to a hospitalist rotating for a 2- to 4-week period, for the period of July 1, 2015, to July 31, 2016. These units employed bedside interdisciplinary rounds (IDR) attended by the hospitalist, social worker, case manager, nurse, nurse manager, and medical director. Bedside IDR focuses on the daily plan and patient safety by
As described by Dunn et al.,3 the IDR script included the following: a review of the plan of care by the hospitalist, identifying a patient’s personal goals for the day, a brief update of discharge planning (as appropriate), and a safety assessment performed by the nurse (identifying Foley catheters, falls risk, etc). We incorporated an inquiry into the daily IDR script identifying clinically stable patients for discharge in the next 24 to 48 hours (based on physician judgment), followed by a prompt to the hospitalist to discontinue labs when appropriate. The unit medical director and nurse manager were both tasked with prompting the hospitalist at the bedside. Our hospital utilizes computerized physician order entry. Lab orders were then discontinued by the clinician during rounds using a computer on wheels (or after rounds when one was not available). The hospitalist, unit medical director, and nurse manager were reminded about the project through weekly e-mails and in-person communication.
To assess whether the prompt was being incorporated consistently, an observer was added to rounds beginning in the second month of the project. The observer was present at least 3 times a week for the subsequent 3 months of the project. Our intervention also included education geared towards hospitalists, including a brief presentation on reducing unnecessary lab testing during a monthly hospitalist faculty meeting (the first and sixth month of the intervention). The group’s data on laboratory testing within the 24 to 48 hours prior to discharge were also presented at these monthly meetings (beginning 2 months into the intervention and monthly thereafter). Lastly, we provided the unit staff with unit-level metrics, biweekly for the first 3 months and every 2 to 3 months thereafter.
We extracted electronic medical record (EMR) data on lab utilization for patients on the 2 hospitalist units for the intervention period. Baseline data were obtained from July 1, 2014, to June 30, 2015. Patients with a length of stay (LOS) ≤7 days (75th percentile) were included; on these units, longer stays were considered more likely to have complex social issues delaying discharge and thus less likely to require laboratory testing. We tracked ordering for 4 common lab tests: basic metabolic panel, CBC, CBC with differential, and the comprehensive metabolic panel. The primary outcome was the monthly percentage of patients for whom testing was ordered in the 24 and 48 hours preceding discharge. A secondary outcome was testing at 72 hours preceding discharge to identify any potential compensatory (increased) testing the evening prior. We applied a quasi-experimental interrupted time series design with a segmented regression analysis to estimate changes before and after our intervention, expressed in acute changes (change in intercept) and over time (changes in trend) while adjusting for preintervention trends. All analyses were performed with SAS v9.4 statistical software (SAS Institute, Cary, NC). Our project was deemed a quality improvement project and thus an IRB submission was not required.
RESULTS
There were 1579 discharges in the preintervention period and 1308 discharges in the postintervention period. The average age of the patient population was similar in the baseline and postintervention groups (61.5 vs 59.3 years; P = 0.400), and there was no difference in the mean LOS before and after implementation (3.67 vs 3.68 days; P = 0.817).
DISCUSSION
Our structured, multifaceted approach effectively reduced daily lab testing in the 24 to 48 hours prior to discharge. Bedside IDR provided a unique opportunity to effectively communicate to the patient about necessary (or unnecessary) testing. Moreover, given the complexity of identifying clinical stability, our strategy focused on the onset of discharge planning, a more easily discernible and less obtrusive focal point to promote the discontinuation of lab testing.
Though the nature of bundled interventions can make it difficult to identify which intervention is most effective, we believe that all interventions were effective in different capacities during various phases in the intervention period. We believe that the decrease in lab testing in the 24 to 48 hours preceding discharge was primarily driven by the new rounding structure. This is evident in the significant decrease seen in the first few months of the intervention period. Six months into the intervention, we begin to see a decrease at 72 hours prior to discharge. Additionally, we see a decrease in the mean number of labs per patient day over the entire hospitalization period. We attribute these results to a gradual shift in the culture in our division as a direct consequence of educational sessions and individual feedback provided during this time.
To our knowledge, this is the first study to use anticipated discharge as a correlate for clinical stability and therefore as an opportunity to prompt discontinuation of laboratory testing. Other studies evaluated interventions targeting the EMR and the ease with which providers can order recurring labs. These include restricting recurring orders in the EMR,4 a robust education and awareness campaign targeting house staff,5 and other multifaceted approaches to decreasing lab utilization,6 all of which have shown promising results. While these approaches show varying degrees of success, ours is unique in its focus on the period prior to discharge. In addition, the intervention can be readily implemented in settings that utilize scripted IDR. It also brings high-value decision-making to the bedside by informing the patient that in the setting of presumed clinical stability, no additional tests are warranted.
Our study has several limitations. First, while interdisciplinary discharge rounds are widely implemented,7,8 our rounds occur at the bedside and employ a script, potentially limiting generalizability. The structured prompting may be feasible during structured IDR in a standard conference room setting, though we did not assess this model. Second, bedside rounds only included patients who were able to participate. Rounding on patients unable to participate, such as patients with delirium with agitation, was done outside the patient room rather than at the bedside. A modified script was used in these instances (absent questions addressed to the patient), allowing for the prompt to be incorporated. These patients were included in the analysis. Lastly, as previously stated, we cannot clearly identify which intervention (the prompt, education, or feedback) most effectively led to a sustained decrease in lab ordering.
Our structured, multifaceted intervention reduced laboratory testing during the last 48 hours of admission. Hospitals that aim to decrease potentially unnecessary lab testing should consider implementing a bundle, including a prompt at a uniform and structured point during the hospitalization of patients who are expected to be discharged within 24 to 48 hours, clinician education, an audit, and feedback.
Disclosure
All authors report no conflicts of interest to disclose.
1. Bulger J, Nickel W, Messler J, et al. Choosing wisely in adult hospital medicine: Five opportunities for improved healthcare value. J Hosp Med. 2013;8(9):486-492. PubMed
2. Thavendiranathan P, Bagai A, Ebidia A, Detsky AS, Choudhry NK. Do blood tests cause anemia in hospitalized patients? The effect of diagnostic phlebotomy on hemoglobin and hematocrit levels. J Gen Intern Med. 2005;20(6):520-524. PubMed
3. Dunn AS, Reyna, M, Radbill B, et al. The impact of bedside interdisciplinary rounds on length of stay and complications. J Hosp Med. 2017;3:137-142. PubMed
4. Iturrate E, Jubelt L, Volpicelli F, Hochman K. Optimize Your Electronic Medical Record to Increase Value: Reducing Laboratory Overutilization. Am J Med. 2016;129(2):215-220. PubMed
5. Wheeler D, Marcus P, Nguyen J, et al. Evaluation of a Resident-Led Project to Decrease Phlebotomy Rates in the Hospital: Think Twice, Stick Once. JAMA Intern Med. 2016;176(5):708-710. PubMed
6. Corson AH, Fan VS, White T, et al. A Multifaceted Hospitalist Quality Improvement Intervention: Decreased Frequency of Common Labs. J Hosp Med. 2015;10(6):390-395. PubMed
7. Bhamidipati VS, Elliott DJ, Justice EM, Belleh E, Sonnad SS, Robinson EJ. Structure and outcomes of interdisciplinary rounds in hospitalized medicine patients: A systematic review and suggested taxonomy. J Hosp Med. 2016;11(7):513-523. PubMed
8. O’Leary, KJ, Sehgal NL, Terrell G, Williams MV, High Performance Teams and the Hospital of the Future Project Team. Interdisciplinary teamwork in hospitals: a review and practical recommendations for improvement. J Hosp Med. 2012;7(1):48-54. PubMed
© 2018 Society of Hospital Medicine
The Diagnostic Yield of Noninvasive Microbiologic Sputum Sampling in a Cohort of Patients with Clinically Diagnosed Hospital-Acquired Pneumonia
Pneumonia is a major cause of hospitalization, mortality, and healthcare cost. 1,2 The diagnosis involves clinical features plus radiographic evidence of infection. Hospital-acquired pneumonia (HAP) is defined by the Infectious Disease Society of America (IDSA) as a pneumonia that occurs ≥48 hours after admission and is not associated with mechanical ventilation. 3
IDSA recommendations suggest that patients with suspected HAP be treated based on results of noninvasively obtained sputum cultures rather than being treated empirically. 3 This recommendation is graded as weak with low-quality evidence based on a lack of both evidence showing that respiratory cultures improve clinical outcomes and studies examining the yield of noninvasive collection methods. 4,5 However, resistant pathogens lead to a risk of inadequate empiric therapy, which is associated with increased mortality. 6 Culture data may provide an opportunity for escalation or de-escalation of antibiotic coverage. IDSA recommendations for microbiologic sampling are thus aimed at increasing appropriate coverage and minimizing unnecessary antibiotic exposure.
While the yield and clinical utility of sputum culture in community-acquired pneumonia has been studied extensively, data examining the yield of sputum culture in HAP (non–ventilator-associated pneumonia [non-VAP]) are sparse. In 1 small single-center study, researchers demonstrated positive sputum cultures in 17/35 (48.6%) patients with radiographically confirmed cases of HAP, 7 while in another study, researchers demonstrated positive sputum cultures in 57/63 (90.5%). 8 We aimed to identify the frequency with which sputum cultures positively identify an organism, identify predictors of positive sputum cultures, and characterize the microbiology of sputum cultures in a large cohort of HAP cases.
METHODS
We conducted a retrospective cohort study of patients admitted to a large academic medical center in Boston, Massachusetts, from January 2007 to July 2013. All patients ≥18 years of age were eligible for inclusion. We excluded outside hospital transfers, those with a length of hospitalization <48 hours, and psychiatric admissions.
The study was approved by the institutional review board at the Beth Israel Deaconess Medical Center and granted a waiver of informed consent. Data were collected from electronic databases and supplemented by chart review.
Hospital-Acquired Pneumonia
We defined HAP as pneumonia occurring at least 48 hours after admission, consistent with American Thoracic Society and IDSA criteria.3 To identify cases, we reviewed the charts of all admissions identified as having a discharge International Classification of Diseases, Ninth Revision, Clinical Modification (ICD-9-CM) code for bacterial pneumonia (481, 482, 483, 485, 486, 507), indicated as not “present-on-admission.” We validated that the treating clinician had clinically diagnosed pneumonia and initiated antibiotics for this purpose by performing chart review. We reviewed the radiologist interpretation of radiographs surrounding the date of the clinical diagnosis of pneumonia to confirm the presence of a new opacity. Uncertain cases (with respect to either the presence of pneumonia or the timing of the diagnosis) were reviewed by a second member of the study team and, in the case of disagreement, adjudicated by a third member of the study team. Only the first clinically validated HAP per hospitalization was included in the analysis. To focus on HAP rather than VAP, we excluded hospitalizations in which the date of a procedure code for mechanical ventilation preceded the date of pneumonia diagnosis.
Microbiology
In our analysis, we used sputum samples obtained from expectorated or induced samples to evaluate the yield of noninvasive sputum sampling, as recommended by the IDSA. We included sputum samples collected ≥48 hours after admission and within 7 days of the clinical diagnosis of HAP. Sputum samples with >10 epithelial cells per high-power field (hpf) were considered to be contaminated. Among noncontaminated samples, positive sputum cultures were defined as those with a microbiologic diagnosis other than “oral flora,” while those with no growth or growth of oral flora or only yeast were considered to be negative. The hospital’s microbiology laboratory does not routinely provide species identification for Gram-negative rods (GNRs) growing on culture in the presence of growth of ≥3 other colony types. We considered such GNRs (not further speciated) to represent a positive culture result in our analysis given that colonization versus pathogenicity is a clinical distinction and, as such, these results may impact antibiotic choice.
Statistical Analysis
Data were analyzed by using SAS software, version 9.3. We used a 2-sided P value of <0.05 to indicate statistical significance for all comparisons. We used the χ2 test and the nonparametric median test for unadjusted comparisons.
To identify predictors of a positive (versus negative or contaminated) sputum culture among patients with HAP, we used a generalized estimating equation model with a Poisson distribution error term, log link, and first-order autoregressive correlation structure to account for multiple sputum specimens per patient. We combined culture negative and contaminated samples to highlight the clinical utility of sputum culture in a real-world setting. Potential predictors chosen based on clinical grounds included all variables listed in Table 1. We defined comorbidities specified in Table 1 via ICD-9-CM secondary diagnosis codes and diagnosis related groups (DRGs) using Healthcare Cost and Utilization Project Comorbidity Software, version 3.7, based on the work of Elixhauser et al.9,10; dialysis use was defined by an ICD-9-CM procedure code of 39.95; inpatient steroid use was defined by a hospital pharmacy charge for a systemic steroid in the 7 days preceding the sputum sample.
RESULTS
There were 230,635 hospitalizations of patients ≥18 years of age from January 2007 to July 2013. After excluding outside hospital transfers (n = 14,422), hospitalizations <48 hours in duration (n = 59,774), and psychiatric hospitalizations (n = 9887), there were 146,552 hospitalizations in the cohort.
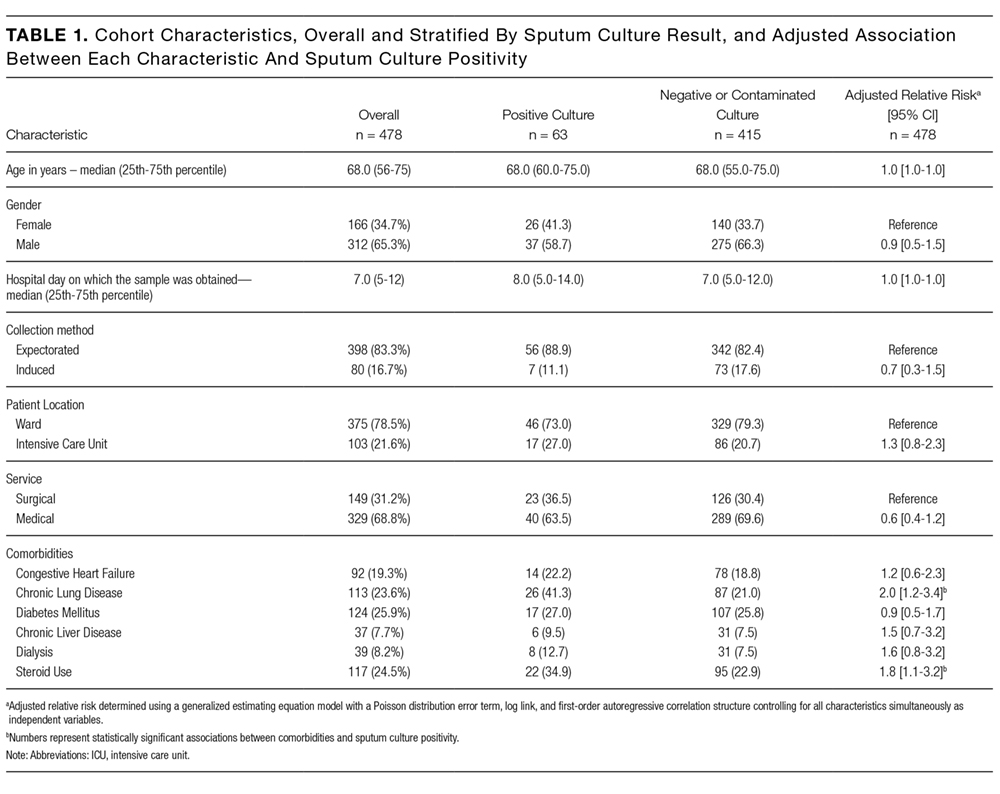
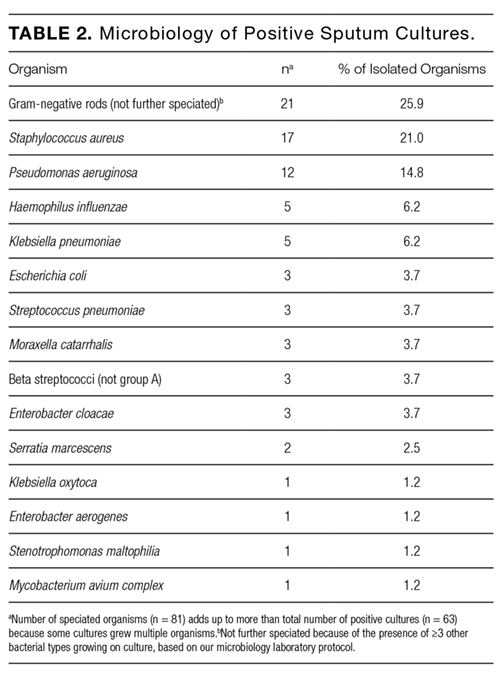
The top 3 bacterial organisms cultured from sputum samples were GNRs not further speciated (25.9%), Staphylococcus aureus (21.0%), and Pseudomonas aeruginosa (14.8%). The frequencies of isolated microorganisms are presented in Table 2.
In an adjusted analysis (Table 1), the significant predictors of a positive sputum culture were chronic lung disease (relative risk [RR] = 2.0; 95% confidence interval [CI], 1.2-3.4) and steroid use (RR = 1.8; 95% CI, 1.1-3.2).
DISCUSSION
To our knowledge, our study is the first to assess the predictors of positive sputum culture among patients with HAP (non-VAP) who had sputum samples obtained noninvasively, and this study is larger than prior studies in which researchers reported on sputum culture yield in HAP. Sputum samples were obtained in 29.4% cases of clinically diagnosed HAP. Although 87% of specimens obtained were culture-negative or contaminated, 13% yielded a bacterial organism. Although we do not report the antibiotic sensitivity patterns of the isolated organisms, the organisms identified frequently demonstrate antibiotic resistance, highlighting the potential for both antibiotic escalation and de-escalation based on sputum culture. In a multivariable model, presence of chronic lung disease and steroid use in the preceding week were both significantly associated with culture positivity.
The retrospective nature of the study raises the possibility of selection bias from systematic differences between the 29.4% of patients with HAP who had sputum collected and those who did not. Patients with sputum cultures were similar to patients without cultures in most measured characteristics, but we are unable to know what the yield of noninvasive sputum culture would have been had all patients with HAP been sampled. As such, our findings reflect the yield of sputum culture among patients with HAP for whom cultures were successfully obtained. It is not clear why only 29.4% of HAP patients received IDSA guideline-concordant care, but similar rates of culture use are reported elsewhere.7 While physician decision-making could have contributed to this finding, it is also possible that many sick, hospitalized patients are simply unable to produce sputum for analysis. In future studies, researchers should examine barriers to guideline-concordant care.
We considered a culture result of GNRs (not further speciated) as positive in our analysis because this result indicates growth of mixed bacterial types, the pathogenicity of which is a clinical determination. Physicians may request speciation and antibiotic sensitivities and, as such, these results have the potential to impact antibiotic choice. Had we considered such cultures to be negative or contaminated, the rate of culture positivity would have been only slightly reduced from 63/478 (13.2%) to 50/478 (10.5%).
The strengths of our study include the chart-based validation of administratively identified cases of pneumonia and a large cohort. There are also limitations. The single-center nature of the study has implications for pretest probability and generalizability. Additionally, in our study, we did not examine outcomes among patients treated empirically versus those treated based on sputum culture results. Finally, our reliance on administrative codes to identify cases of HAP for subsequent validation could have resulted in incomplete capture of HAP cases.
In conclusion, in our study, we provide an estimate of the diagnostic yield of sputum culture in a large cohort with chart-validated HAP, a description of HAP microbiology, and predictors of positive sputum culture. Thirteen percent of patients who had sputum culture testing received a microbiologic diagnosis. Because of the relative ease of obtaining a sputum sample and the microbiologic distribution in our study (representing a mix of commonly drug-resistant pathogens and more typical community-acquired pathogens), we suggest that sputum culture in HAP is a useful diagnostic tool with the potential to inform antibiotic escalation or de-escalation.
Acknowledgments
Dr. Herzig was funded by grant number K23AG042459 from the National Institute on Aging. Dr. Marcantonio was funded by grant number K24AG035075 from the National Institute on Aging. The funding organizations had no involvement in any aspect of the study, including design and conduct of the study; collection, management, analysis, and interpretation of the data; and preparation, review, or approval of the manuscript.
Disclosure
No conflicts of interest apply for any of the authors.
1. Kochanek KD, Xu J, Murphy SL, Miniño AM, Kung HC. Deaths: Final Data for 2009. Natl Vital Stat Rep. 2011;60(3):1-116. PubMed
2. Bonafede MM, Suaya JA, Wilson KL, Mannino DM, Polsky D. Incidence and cost of CAP in a large working-age population. Am J Manag Care. 2012;18(7):380-387. PubMed
3. Kalil AC, Metersky ML, Klompas M, et al. Management of Adults With Hospital-acquired and Ventilator-associated Pneumonia: 2016 Clinical Practice Guidelines by the Infectious Diseases Society of America and the American Thoracic Society. Clin Infect Dis. 2016;63(5):e61-e111. PubMed
4. Wahl WL, Franklin GA, Brandt MM, et al. Does bronchoalveolar lavage enhance our ability to treat ventilator-associated pneumonia in a trauma-burn intensive care unit? J Trauma. 2003;54(4):633-638. PubMed
5. Herer B, Fuhrman C, Demontrond D, Gazevic Z, Housset B, Chouaïd C. Diagnosis of nosocomial pneumonia in medical ward: Repeatability of the protected specimen brush. Eur Respir J. 2001;18(1):157-163. PubMed
6. Chung DR, Song JH, Kim SH, et al. High prevalence of multidrug-resistant nonfermenters in hospital-acquired pneumonia in Asia. Am J Respir Crit Care Med. 2011;184(12):1409-1417. PubMed
7. Russell CD, Koch O, Laurenson IF, O’Shea DT, Sutherland R, Mackintosh CL. Diagnosis and features of hospital-acquired pneumonia: a retrospective cohort study. J Hosp Infect. 2016;92(3):273-279. PubMed
8. Messika J, Stoclin A, Bouvard E, et al. The Challenging Diagnosis of Non-Community-Acquired Pneumonia in Non-Mechanically Ventilated Subjects: Value of Microbiological Investigation. Respir Care. 2016;61(2):225-234. PubMed
9. Elixhauser A, Steiner C, Harris DR, Coffey RM. Comorbidity measures for use with administrative data. Med Care. 1998;36(1):8-27. PubMed
10. HCUP Comorbidity Software. Healthcare Cost and Utilization Project (HCUP). January 2013. Agency for Healthcare Research and Quality, Rockville, MD. Available at: www.hcup-us.ahrq.gov/toolssoftware/comorbidity/comorbidity.jsp. Accessed on March 15, 2016.
Pneumonia is a major cause of hospitalization, mortality, and healthcare cost. 1,2 The diagnosis involves clinical features plus radiographic evidence of infection. Hospital-acquired pneumonia (HAP) is defined by the Infectious Disease Society of America (IDSA) as a pneumonia that occurs ≥48 hours after admission and is not associated with mechanical ventilation. 3
IDSA recommendations suggest that patients with suspected HAP be treated based on results of noninvasively obtained sputum cultures rather than being treated empirically. 3 This recommendation is graded as weak with low-quality evidence based on a lack of both evidence showing that respiratory cultures improve clinical outcomes and studies examining the yield of noninvasive collection methods. 4,5 However, resistant pathogens lead to a risk of inadequate empiric therapy, which is associated with increased mortality. 6 Culture data may provide an opportunity for escalation or de-escalation of antibiotic coverage. IDSA recommendations for microbiologic sampling are thus aimed at increasing appropriate coverage and minimizing unnecessary antibiotic exposure.
While the yield and clinical utility of sputum culture in community-acquired pneumonia has been studied extensively, data examining the yield of sputum culture in HAP (non–ventilator-associated pneumonia [non-VAP]) are sparse. In 1 small single-center study, researchers demonstrated positive sputum cultures in 17/35 (48.6%) patients with radiographically confirmed cases of HAP, 7 while in another study, researchers demonstrated positive sputum cultures in 57/63 (90.5%). 8 We aimed to identify the frequency with which sputum cultures positively identify an organism, identify predictors of positive sputum cultures, and characterize the microbiology of sputum cultures in a large cohort of HAP cases.
METHODS
We conducted a retrospective cohort study of patients admitted to a large academic medical center in Boston, Massachusetts, from January 2007 to July 2013. All patients ≥18 years of age were eligible for inclusion. We excluded outside hospital transfers, those with a length of hospitalization <48 hours, and psychiatric admissions.
The study was approved by the institutional review board at the Beth Israel Deaconess Medical Center and granted a waiver of informed consent. Data were collected from electronic databases and supplemented by chart review.
Hospital-Acquired Pneumonia
We defined HAP as pneumonia occurring at least 48 hours after admission, consistent with American Thoracic Society and IDSA criteria.3 To identify cases, we reviewed the charts of all admissions identified as having a discharge International Classification of Diseases, Ninth Revision, Clinical Modification (ICD-9-CM) code for bacterial pneumonia (481, 482, 483, 485, 486, 507), indicated as not “present-on-admission.” We validated that the treating clinician had clinically diagnosed pneumonia and initiated antibiotics for this purpose by performing chart review. We reviewed the radiologist interpretation of radiographs surrounding the date of the clinical diagnosis of pneumonia to confirm the presence of a new opacity. Uncertain cases (with respect to either the presence of pneumonia or the timing of the diagnosis) were reviewed by a second member of the study team and, in the case of disagreement, adjudicated by a third member of the study team. Only the first clinically validated HAP per hospitalization was included in the analysis. To focus on HAP rather than VAP, we excluded hospitalizations in which the date of a procedure code for mechanical ventilation preceded the date of pneumonia diagnosis.
Microbiology
In our analysis, we used sputum samples obtained from expectorated or induced samples to evaluate the yield of noninvasive sputum sampling, as recommended by the IDSA. We included sputum samples collected ≥48 hours after admission and within 7 days of the clinical diagnosis of HAP. Sputum samples with >10 epithelial cells per high-power field (hpf) were considered to be contaminated. Among noncontaminated samples, positive sputum cultures were defined as those with a microbiologic diagnosis other than “oral flora,” while those with no growth or growth of oral flora or only yeast were considered to be negative. The hospital’s microbiology laboratory does not routinely provide species identification for Gram-negative rods (GNRs) growing on culture in the presence of growth of ≥3 other colony types. We considered such GNRs (not further speciated) to represent a positive culture result in our analysis given that colonization versus pathogenicity is a clinical distinction and, as such, these results may impact antibiotic choice.
Statistical Analysis
Data were analyzed by using SAS software, version 9.3. We used a 2-sided P value of <0.05 to indicate statistical significance for all comparisons. We used the χ2 test and the nonparametric median test for unadjusted comparisons.
To identify predictors of a positive (versus negative or contaminated) sputum culture among patients with HAP, we used a generalized estimating equation model with a Poisson distribution error term, log link, and first-order autoregressive correlation structure to account for multiple sputum specimens per patient. We combined culture negative and contaminated samples to highlight the clinical utility of sputum culture in a real-world setting. Potential predictors chosen based on clinical grounds included all variables listed in Table 1. We defined comorbidities specified in Table 1 via ICD-9-CM secondary diagnosis codes and diagnosis related groups (DRGs) using Healthcare Cost and Utilization Project Comorbidity Software, version 3.7, based on the work of Elixhauser et al.9,10; dialysis use was defined by an ICD-9-CM procedure code of 39.95; inpatient steroid use was defined by a hospital pharmacy charge for a systemic steroid in the 7 days preceding the sputum sample.
RESULTS
There were 230,635 hospitalizations of patients ≥18 years of age from January 2007 to July 2013. After excluding outside hospital transfers (n = 14,422), hospitalizations <48 hours in duration (n = 59,774), and psychiatric hospitalizations (n = 9887), there were 146,552 hospitalizations in the cohort.
The top 3 bacterial organisms cultured from sputum samples were GNRs not further speciated (25.9%), Staphylococcus aureus (21.0%), and Pseudomonas aeruginosa (14.8%). The frequencies of isolated microorganisms are presented in Table 2.
In an adjusted analysis (Table 1), the significant predictors of a positive sputum culture were chronic lung disease (relative risk [RR] = 2.0; 95% confidence interval [CI], 1.2-3.4) and steroid use (RR = 1.8; 95% CI, 1.1-3.2).
DISCUSSION
To our knowledge, our study is the first to assess the predictors of positive sputum culture among patients with HAP (non-VAP) who had sputum samples obtained noninvasively, and this study is larger than prior studies in which researchers reported on sputum culture yield in HAP. Sputum samples were obtained in 29.4% cases of clinically diagnosed HAP. Although 87% of specimens obtained were culture-negative or contaminated, 13% yielded a bacterial organism. Although we do not report the antibiotic sensitivity patterns of the isolated organisms, the organisms identified frequently demonstrate antibiotic resistance, highlighting the potential for both antibiotic escalation and de-escalation based on sputum culture. In a multivariable model, presence of chronic lung disease and steroid use in the preceding week were both significantly associated with culture positivity.
The retrospective nature of the study raises the possibility of selection bias from systematic differences between the 29.4% of patients with HAP who had sputum collected and those who did not. Patients with sputum cultures were similar to patients without cultures in most measured characteristics, but we are unable to know what the yield of noninvasive sputum culture would have been had all patients with HAP been sampled. As such, our findings reflect the yield of sputum culture among patients with HAP for whom cultures were successfully obtained. It is not clear why only 29.4% of HAP patients received IDSA guideline-concordant care, but similar rates of culture use are reported elsewhere.7 While physician decision-making could have contributed to this finding, it is also possible that many sick, hospitalized patients are simply unable to produce sputum for analysis. In future studies, researchers should examine barriers to guideline-concordant care.
We considered a culture result of GNRs (not further speciated) as positive in our analysis because this result indicates growth of mixed bacterial types, the pathogenicity of which is a clinical determination. Physicians may request speciation and antibiotic sensitivities and, as such, these results have the potential to impact antibiotic choice. Had we considered such cultures to be negative or contaminated, the rate of culture positivity would have been only slightly reduced from 63/478 (13.2%) to 50/478 (10.5%).
The strengths of our study include the chart-based validation of administratively identified cases of pneumonia and a large cohort. There are also limitations. The single-center nature of the study has implications for pretest probability and generalizability. Additionally, in our study, we did not examine outcomes among patients treated empirically versus those treated based on sputum culture results. Finally, our reliance on administrative codes to identify cases of HAP for subsequent validation could have resulted in incomplete capture of HAP cases.
In conclusion, in our study, we provide an estimate of the diagnostic yield of sputum culture in a large cohort with chart-validated HAP, a description of HAP microbiology, and predictors of positive sputum culture. Thirteen percent of patients who had sputum culture testing received a microbiologic diagnosis. Because of the relative ease of obtaining a sputum sample and the microbiologic distribution in our study (representing a mix of commonly drug-resistant pathogens and more typical community-acquired pathogens), we suggest that sputum culture in HAP is a useful diagnostic tool with the potential to inform antibiotic escalation or de-escalation.
Acknowledgments
Dr. Herzig was funded by grant number K23AG042459 from the National Institute on Aging. Dr. Marcantonio was funded by grant number K24AG035075 from the National Institute on Aging. The funding organizations had no involvement in any aspect of the study, including design and conduct of the study; collection, management, analysis, and interpretation of the data; and preparation, review, or approval of the manuscript.
Disclosure
No conflicts of interest apply for any of the authors.
1. Kochanek KD, Xu J, Murphy SL, Miniño AM, Kung HC. Deaths: Final Data for 2009. Natl Vital Stat Rep. 2011;60(3):1-116. PubMed
2. Bonafede MM, Suaya JA, Wilson KL, Mannino DM, Polsky D. Incidence and cost of CAP in a large working-age population. Am J Manag Care. 2012;18(7):380-387. PubMed
3. Kalil AC, Metersky ML, Klompas M, et al. Management of Adults With Hospital-acquired and Ventilator-associated Pneumonia: 2016 Clinical Practice Guidelines by the Infectious Diseases Society of America and the American Thoracic Society. Clin Infect Dis. 2016;63(5):e61-e111. PubMed
4. Wahl WL, Franklin GA, Brandt MM, et al. Does bronchoalveolar lavage enhance our ability to treat ventilator-associated pneumonia in a trauma-burn intensive care unit? J Trauma. 2003;54(4):633-638. PubMed
5. Herer B, Fuhrman C, Demontrond D, Gazevic Z, Housset B, Chouaïd C. Diagnosis of nosocomial pneumonia in medical ward: Repeatability of the protected specimen brush. Eur Respir J. 2001;18(1):157-163. PubMed
6. Chung DR, Song JH, Kim SH, et al. High prevalence of multidrug-resistant nonfermenters in hospital-acquired pneumonia in Asia. Am J Respir Crit Care Med. 2011;184(12):1409-1417. PubMed
7. Russell CD, Koch O, Laurenson IF, O’Shea DT, Sutherland R, Mackintosh CL. Diagnosis and features of hospital-acquired pneumonia: a retrospective cohort study. J Hosp Infect. 2016;92(3):273-279. PubMed
8. Messika J, Stoclin A, Bouvard E, et al. The Challenging Diagnosis of Non-Community-Acquired Pneumonia in Non-Mechanically Ventilated Subjects: Value of Microbiological Investigation. Respir Care. 2016;61(2):225-234. PubMed
9. Elixhauser A, Steiner C, Harris DR, Coffey RM. Comorbidity measures for use with administrative data. Med Care. 1998;36(1):8-27. PubMed
10. HCUP Comorbidity Software. Healthcare Cost and Utilization Project (HCUP). January 2013. Agency for Healthcare Research and Quality, Rockville, MD. Available at: www.hcup-us.ahrq.gov/toolssoftware/comorbidity/comorbidity.jsp. Accessed on March 15, 2016.
© 2018 Society of Hospital Medicine
Vascular Ultrasonography: A Novel Method to Reduce Paracentesis Related Major Bleeding
Ascites is the most common complication of cirrhosis and often leads to hospitalization. 1 Paracentesis is recommended for all patients admitted with ascites and cirrhosis. 1 Additionally, the Society of Hospital Medicine considers the ability to perform paracenteses a core competency for hospitalists. 2 Although considered a safe procedure, major bleeding complications occur in 0.2% to 1.7% of paracenteses. 3-7 Patients with cirrhosis form new abdominal wall vessels because of portal hypertension, and hemoperitoneum from the laceration of these vessels during paracentesis carries a high morbidity and mortality. 6,8 Ultrasound guidance using a low-frequency ultrasound probe is currently standard practice for paracentesis and has been shown to reduce bleeding complications. 9-11 However, the use of vascular ultrasound (high-frequency probe) is also recommended to identify blood vessels within the intended needle pathway to reduce bleeding, but no studies have been performed to demonstrate a benefit. 3,11 This study aimed to evaluate whether this “2-probe technique” reduces paracentesis-related bleeding complications.
METHODS
The procedure service at Cedars Sinai Medical Center (CSMC) in Los Angeles performs paracentesis regularly with ultrasound guidance. CSMC is a tertiary care, academic medical center with 861 licensed beds. We performed a pre- to postintervention study of consecutive patients (admitted and ambulatory) who underwent paracentesis done by 1 proceduralist (MJA) from the procedure service at CSMC from February 2010 through February 2016. From February 1, 2010, through August 2011, paracenteses were performed using only low-frequency, phased array ultrasound probes (preintervention group). From September 1, 2011, through February 2016, a 2-probe technique was used, whereby ultrasound interrogation of the abdomen using a low-frequency, phased array probe (to identify ascites) was supplemented with a second scan using a high-frequency, linear probe to identify vasculature within the planned needle path (postintervention group). As a standard part of quality assurance, CSMC documented all paracentesis-related complications from procedures performed by their center. Northwestern University investigators (JHB, EC, JF) independently evaluated these data to look at bleeding complications before and after the implementation of the 2-probe technique.
Procedure Protocol
Each patient’s primary team or outpatient physician requested a consultation for paracentesis from the CSMC procedure service. All patient evaluations began with an abdominal ultrasound using the low-frequency probe to determine the presence of ascites and a potential window of access to the fluid. After September 1, 2011, the CSMC procedure service implemented the 2-probe technique to also evaluate the abdominal wall for the presence of vessels. Color flow Doppler ultrasound further helped to differentiate blood vessels as necessary. The optimal window was then marked on the abdominal wall, and the paracentesis was performed. Per the routine of the CSMC procedure service, antiplatelet or anticoagulant medications were not held for paracenteses.
Measurement
All data were collected prospectively at the time of the procedure, including the volume of fluid removed, the number of needle passes required, and whether the patient was on antiplatelet or anticoagulant medications (including warfarin, direct oral anticoagulants, thrombin inhibitors, heparin, or low molecular weight heparins). Patients were followed for complications for up to 24 hours after the procedure or until a clinical question of a complication was reconciled. Minor bleeding was defined as new serosanguinous fluid on repeat paracentesis not associated with hemodynamic changes, local bruising or bleeding at the site, or abdominal wall hematoma.
A query of the electronic medical record was performed to obtain patient demographics and relevant clinical information, including age, sex, body mass index, International Normalized Ratio (INR), partial thromboplastin time (PTT), platelet counts (103/uL, hematocrit (%) and creatinine (mg/dl)
Statistical Analysis
We used a χ2 test, Student t test, or Kruskal-Wallis test to compare demographic and clinical characteristics of procedure patients between the 2 study groups (pre- and postintervention). Major and minor bleeding were compared between the 2 groups using the χ2 test.12 We used the χ2 test instead of the Fisher’s exact test for several reasons. The usual rule is that the Fisher’s exact test is necessary when 1 or more expected outcome values are less than 5. However, McDonald argues that the χ2 test should be used with large sample sizes (more than 1000) in lieu of the outcome-value-of-5 rule.12 The Fisher’s exact test also assumes that the row and column totals are fixed. However, the outcomes in our study were not fixed because any patient could have a bleeding complication during each procedure. When row and column totals are not fixed, only 5% of the time will a P value be less than 0.05, and the Fisher’s exact test is too conservative.12 We performed all statistical analyses using IBM SPSS Statistics Version 22 (IBM Corp, Armonk, NY).
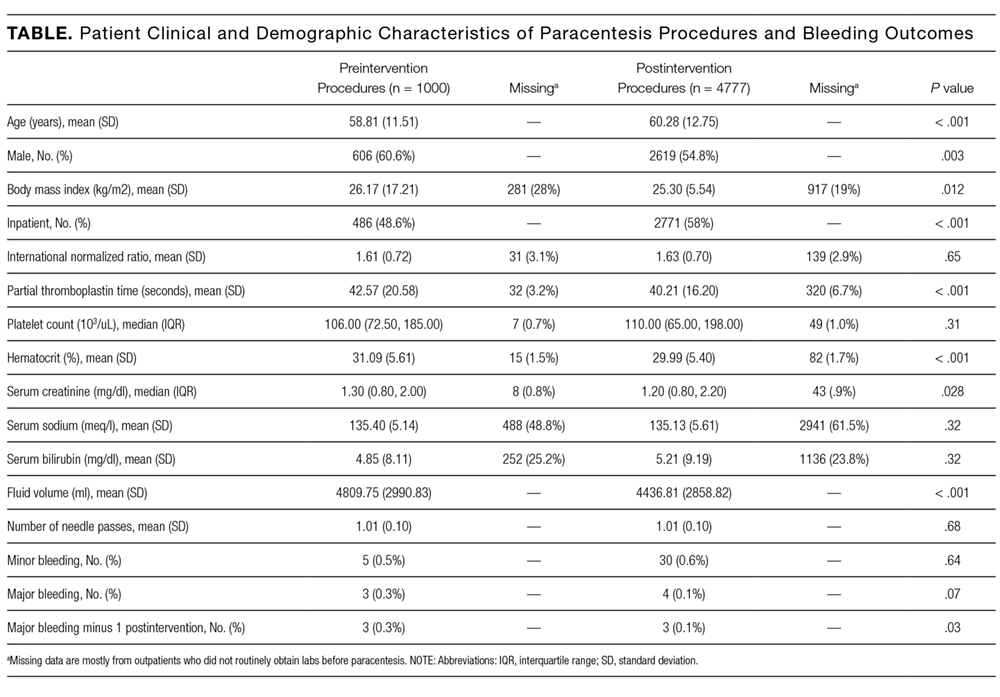
RESULTS
Patient demographic and clinical information can be found in the Table. The proceduralist (MJA) performed a total of 5777 paracenteses (1000 preintervention, 4777 postintervention) on 1639 patients. Four hundred eighty-nine (10.2%) vascular anomalies were identified within the intended needle path in the postintervention group (Figure). More patients in the preintervention group were on aspirin (93 [9.3%] vs 230 [4.8%]; P < 0.001) and therapeutic intravenous anticoagulants (33 [3.3%] vs 89 [1.9%]; P = 0.004), while more patients in the postintervention group were on both an antiplatelet and oral anticoagulant (1 [0.1%] vs 38 [0.8%]; P = 0.015) and subcutaneous prophylactic anticoagulants (184 [18.4%] vs 1120 [23.4%]; P = 0.001) at the time of the procedure. There were no other differences between groups with antiplatelet or anticoagulant drugs. We found no difference in minor bleeding between pre- and postintervention groups. Major bleeding was lower after the 2-probe technique was implemented (3 [0.3%] vs 4 [0.08%]; P = 0.07). There were no between-group differences in INR, PTT, or platelet counts among major bleeders. One patient in the postintervention group had hemodynamic instability and dropped his hemoglobin by 3.8 g/dl at 7 hours after the procedure. This was unexplained, as the patient had no abdominal symptoms or findings on examination. The patient received several liters of fluid before ultimately dying, and the primary team considered sepsis as a possible cause, but no postmortem examination was performed. This was the only death attributed to a major bleeding complication. We included this patient in our analysis because the cause of his demise was not completely clear. However, excluding this patient would change the results from a trend to a statistically significant difference between groups (3 [0.3%] vs 3 [0.06%]; P = 0.03).
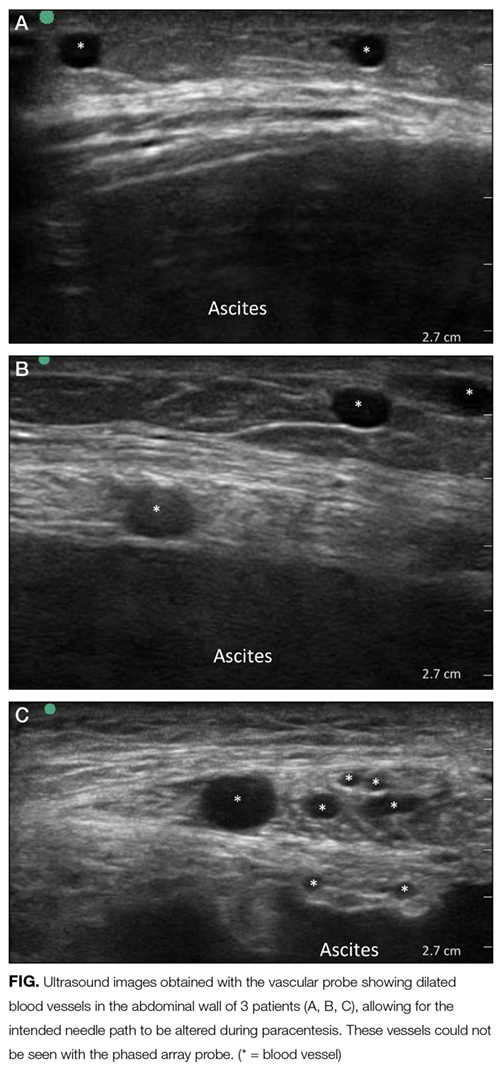
DISCUSSION
To our knowledge, we report the largest series of paracentesis prospectively evaluated for bleeding complications, and this is the first study to evaluate whether adding a vascular ultrasound (high-frequency probe) avoids major bleeding. In our series, up to 10% of patients had abnormal vessels seen with a vascular ultrasound that were within the original intended trajectory path of the needle. These vessels were also likely present yet invisible when ultrasound-guided paracentesis using only the standard, low-frequency probe was being performed. It is unknown whether these vessels are routinely traversed with the needle, nicked, or narrowly avoided during paracenteses performed using only a low-frequency probe.
Procedure-related bleeding may not be completely avoidable, despite using the vascular probe. Some authors have suggested that the mechanism of bleeding is more related to the rapid reduction in intraperitoneal pressure, which increases the gradient across vessel walls, resulting in rupture and bleeding.6 However, in our series, using vascular ultrasound also reduced major bleeding to numbers lower than those historically reported in the literature (0.2%).3-4 Our preintervention number needed to harm was 333 procedures to cause 1 major bleed, compared to 1250 (or 1666 using the 3-patient bleeding analysis) in the postintervention group. In 2008, 150,000 Medicare beneficiaries underwent paracentesis.13 Using our study analysis, if vascular ultrasound was used on these patients, up to 360 major bleeds may have been prevented, along with a corresponding reduction in unnecessary morbidity and mortality.
Our study has several limitations. First, it was limited to 1 center with 1 very experienced proceduralist. Although it is possible that the reduction in major bleeding may have been due to the increasing experience of the proceduralist over time, we do not think that this is likely because he had already performed thousands of paracenteses over 9 years before the start of our study.
CONCLUSION
Our results suggest that using the 2-probe technique to predetermine the needle path before performing paracentesis might prevent major bleeding. Based on our findings, we believe that the addition of a vascular ultrasound during paracentesis should be considered by all hospitalists.
Acknowledgments
The authors acknowledge Drs. Douglas Vaughan and Kevin O’Leary for their support and encouragement of this work. They would also like to thank the Cedars-Sinai Enterprise Information Systems Department for assistance with their data query.
Disclosure
The authors have no relevant financial disclosures or conflicts of interest to report.
1. European Association for the Study of the Liver. EASL clinical practice guidelines on the management of ascites, spontaneous bacterial peritonitis, and hepatorenal syndrome in cirrhosis. J Hepatol. 2010;53:397-417. PubMed
2. Dressler DD, Pistoria MJ, Budnitz TL, McKean SC, Amin AN. Core competencies in hospital medicine: development and methodology. J Hosp Med. 2006;1 Suppl 1:48-56. PubMed
3. Seidler M, Sayegh K, Roy A, Mesurolle B. A fatal complication of ultrasound-guided abdominal paracentesis. J Clin Ultrasound. 2013;41:457-460. PubMed
4. McGibbon A, Chen GI, Peltekian KM, van Zanten SV. An evidence-based manual for abdominal paracentesis. Dig Dis Sci. 2007;52:3307-3315. PubMed
5. Lin CH, Shih FY, Ma MH, Chiang WC, Yang CW, Ko PC. Should bleeding tendency deter abdominal paracentesis? Dig Liver Dis. 2005;37:946-951. PubMed
6. Kurup AN, Lekah A, Reardon ST, et al. Bleeding Rate for Ultrasound-Guided Paracentesis in Thrombocytopenic Patients. J Ultrasound Med. 2015;34:1833-1838. PubMed
7. Sharzehi K, Jain V, Naveed A, Schreibman I. Hemorrhagic complications of paracentesis: a systematic review of the literature. Gastroenterol Res Pract. 2014;2014:985141. PubMed
8. Runyon BA, AASLD Practice Guidelines Committee. Management of adult patients with ascites due to cirrhosis: an update. Hepatology. 2009;49:2087-2107. PubMed
9. Keil-Rios D, Terrazas-Solis H, González-Garay A, Sánchez-Ávila JF, García-Juárez I. Pocket ultrasound device as a complement to physical examination for ascites evaluation and guided paracentesis. Intern Emerg Med. 2016;11:461-466. PubMed
10. Nazeer SR, Dewbre H, Miller AH. Ultrasound-assisted paracentesis performed by emergency physicians vs the traditional technique: a prospective, randomized study. Am J Emerg Med. 2005;23:363-367. PubMed
11. Marcaldi CJ, Lanes SF. Ultrasound guidance decreases complications and improves the cost of care among patients undergoing thoracentesis and paracenteis. Chest. 2013;143:532-538. PubMed
12. McDonald JH. Handbook of Biological Statistics. 3rd ed. Baltimore, MD: Sparky House Publishing; 2014.
13. Duszak R Jr, Chatterjee AR, Schneider DA. National fluid shifts: fifteen-year trends in paracentesis and thoracentesis procedures. J Am Coll Radiol. 2010;7:859-864. PubMed
Ascites is the most common complication of cirrhosis and often leads to hospitalization. 1 Paracentesis is recommended for all patients admitted with ascites and cirrhosis. 1 Additionally, the Society of Hospital Medicine considers the ability to perform paracenteses a core competency for hospitalists. 2 Although considered a safe procedure, major bleeding complications occur in 0.2% to 1.7% of paracenteses. 3-7 Patients with cirrhosis form new abdominal wall vessels because of portal hypertension, and hemoperitoneum from the laceration of these vessels during paracentesis carries a high morbidity and mortality. 6,8 Ultrasound guidance using a low-frequency ultrasound probe is currently standard practice for paracentesis and has been shown to reduce bleeding complications. 9-11 However, the use of vascular ultrasound (high-frequency probe) is also recommended to identify blood vessels within the intended needle pathway to reduce bleeding, but no studies have been performed to demonstrate a benefit. 3,11 This study aimed to evaluate whether this “2-probe technique” reduces paracentesis-related bleeding complications.
METHODS
The procedure service at Cedars Sinai Medical Center (CSMC) in Los Angeles performs paracentesis regularly with ultrasound guidance. CSMC is a tertiary care, academic medical center with 861 licensed beds. We performed a pre- to postintervention study of consecutive patients (admitted and ambulatory) who underwent paracentesis done by 1 proceduralist (MJA) from the procedure service at CSMC from February 2010 through February 2016. From February 1, 2010, through August 2011, paracenteses were performed using only low-frequency, phased array ultrasound probes (preintervention group). From September 1, 2011, through February 2016, a 2-probe technique was used, whereby ultrasound interrogation of the abdomen using a low-frequency, phased array probe (to identify ascites) was supplemented with a second scan using a high-frequency, linear probe to identify vasculature within the planned needle path (postintervention group). As a standard part of quality assurance, CSMC documented all paracentesis-related complications from procedures performed by their center. Northwestern University investigators (JHB, EC, JF) independently evaluated these data to look at bleeding complications before and after the implementation of the 2-probe technique.
Procedure Protocol
Each patient’s primary team or outpatient physician requested a consultation for paracentesis from the CSMC procedure service. All patient evaluations began with an abdominal ultrasound using the low-frequency probe to determine the presence of ascites and a potential window of access to the fluid. After September 1, 2011, the CSMC procedure service implemented the 2-probe technique to also evaluate the abdominal wall for the presence of vessels. Color flow Doppler ultrasound further helped to differentiate blood vessels as necessary. The optimal window was then marked on the abdominal wall, and the paracentesis was performed. Per the routine of the CSMC procedure service, antiplatelet or anticoagulant medications were not held for paracenteses.
Measurement
All data were collected prospectively at the time of the procedure, including the volume of fluid removed, the number of needle passes required, and whether the patient was on antiplatelet or anticoagulant medications (including warfarin, direct oral anticoagulants, thrombin inhibitors, heparin, or low molecular weight heparins). Patients were followed for complications for up to 24 hours after the procedure or until a clinical question of a complication was reconciled. Minor bleeding was defined as new serosanguinous fluid on repeat paracentesis not associated with hemodynamic changes, local bruising or bleeding at the site, or abdominal wall hematoma.
A query of the electronic medical record was performed to obtain patient demographics and relevant clinical information, including age, sex, body mass index, International Normalized Ratio (INR), partial thromboplastin time (PTT), platelet counts (103/uL, hematocrit (%) and creatinine (mg/dl)
Statistical Analysis
We used a χ2 test, Student t test, or Kruskal-Wallis test to compare demographic and clinical characteristics of procedure patients between the 2 study groups (pre- and postintervention). Major and minor bleeding were compared between the 2 groups using the χ2 test.12 We used the χ2 test instead of the Fisher’s exact test for several reasons. The usual rule is that the Fisher’s exact test is necessary when 1 or more expected outcome values are less than 5. However, McDonald argues that the χ2 test should be used with large sample sizes (more than 1000) in lieu of the outcome-value-of-5 rule.12 The Fisher’s exact test also assumes that the row and column totals are fixed. However, the outcomes in our study were not fixed because any patient could have a bleeding complication during each procedure. When row and column totals are not fixed, only 5% of the time will a P value be less than 0.05, and the Fisher’s exact test is too conservative.12 We performed all statistical analyses using IBM SPSS Statistics Version 22 (IBM Corp, Armonk, NY).
RESULTS
Patient demographic and clinical information can be found in the Table. The proceduralist (MJA) performed a total of 5777 paracenteses (1000 preintervention, 4777 postintervention) on 1639 patients. Four hundred eighty-nine (10.2%) vascular anomalies were identified within the intended needle path in the postintervention group (Figure). More patients in the preintervention group were on aspirin (93 [9.3%] vs 230 [4.8%]; P < 0.001) and therapeutic intravenous anticoagulants (33 [3.3%] vs 89 [1.9%]; P = 0.004), while more patients in the postintervention group were on both an antiplatelet and oral anticoagulant (1 [0.1%] vs 38 [0.8%]; P = 0.015) and subcutaneous prophylactic anticoagulants (184 [18.4%] vs 1120 [23.4%]; P = 0.001) at the time of the procedure. There were no other differences between groups with antiplatelet or anticoagulant drugs. We found no difference in minor bleeding between pre- and postintervention groups. Major bleeding was lower after the 2-probe technique was implemented (3 [0.3%] vs 4 [0.08%]; P = 0.07). There were no between-group differences in INR, PTT, or platelet counts among major bleeders. One patient in the postintervention group had hemodynamic instability and dropped his hemoglobin by 3.8 g/dl at 7 hours after the procedure. This was unexplained, as the patient had no abdominal symptoms or findings on examination. The patient received several liters of fluid before ultimately dying, and the primary team considered sepsis as a possible cause, but no postmortem examination was performed. This was the only death attributed to a major bleeding complication. We included this patient in our analysis because the cause of his demise was not completely clear. However, excluding this patient would change the results from a trend to a statistically significant difference between groups (3 [0.3%] vs 3 [0.06%]; P = 0.03).
DISCUSSION
To our knowledge, we report the largest series of paracentesis prospectively evaluated for bleeding complications, and this is the first study to evaluate whether adding a vascular ultrasound (high-frequency probe) avoids major bleeding. In our series, up to 10% of patients had abnormal vessels seen with a vascular ultrasound that were within the original intended trajectory path of the needle. These vessels were also likely present yet invisible when ultrasound-guided paracentesis using only the standard, low-frequency probe was being performed. It is unknown whether these vessels are routinely traversed with the needle, nicked, or narrowly avoided during paracenteses performed using only a low-frequency probe.
Procedure-related bleeding may not be completely avoidable, despite using the vascular probe. Some authors have suggested that the mechanism of bleeding is more related to the rapid reduction in intraperitoneal pressure, which increases the gradient across vessel walls, resulting in rupture and bleeding.6 However, in our series, using vascular ultrasound also reduced major bleeding to numbers lower than those historically reported in the literature (0.2%).3-4 Our preintervention number needed to harm was 333 procedures to cause 1 major bleed, compared to 1250 (or 1666 using the 3-patient bleeding analysis) in the postintervention group. In 2008, 150,000 Medicare beneficiaries underwent paracentesis.13 Using our study analysis, if vascular ultrasound was used on these patients, up to 360 major bleeds may have been prevented, along with a corresponding reduction in unnecessary morbidity and mortality.
Our study has several limitations. First, it was limited to 1 center with 1 very experienced proceduralist. Although it is possible that the reduction in major bleeding may have been due to the increasing experience of the proceduralist over time, we do not think that this is likely because he had already performed thousands of paracenteses over 9 years before the start of our study.
CONCLUSION
Our results suggest that using the 2-probe technique to predetermine the needle path before performing paracentesis might prevent major bleeding. Based on our findings, we believe that the addition of a vascular ultrasound during paracentesis should be considered by all hospitalists.
Acknowledgments
The authors acknowledge Drs. Douglas Vaughan and Kevin O’Leary for their support and encouragement of this work. They would also like to thank the Cedars-Sinai Enterprise Information Systems Department for assistance with their data query.
Disclosure
The authors have no relevant financial disclosures or conflicts of interest to report.
1. European Association for the Study of the Liver. EASL clinical practice guidelines on the management of ascites, spontaneous bacterial peritonitis, and hepatorenal syndrome in cirrhosis. J Hepatol. 2010;53:397-417. PubMed
2. Dressler DD, Pistoria MJ, Budnitz TL, McKean SC, Amin AN. Core competencies in hospital medicine: development and methodology. J Hosp Med. 2006;1 Suppl 1:48-56. PubMed
3. Seidler M, Sayegh K, Roy A, Mesurolle B. A fatal complication of ultrasound-guided abdominal paracentesis. J Clin Ultrasound. 2013;41:457-460. PubMed
4. McGibbon A, Chen GI, Peltekian KM, van Zanten SV. An evidence-based manual for abdominal paracentesis. Dig Dis Sci. 2007;52:3307-3315. PubMed
5. Lin CH, Shih FY, Ma MH, Chiang WC, Yang CW, Ko PC. Should bleeding tendency deter abdominal paracentesis? Dig Liver Dis. 2005;37:946-951. PubMed
6. Kurup AN, Lekah A, Reardon ST, et al. Bleeding Rate for Ultrasound-Guided Paracentesis in Thrombocytopenic Patients. J Ultrasound Med. 2015;34:1833-1838. PubMed
7. Sharzehi K, Jain V, Naveed A, Schreibman I. Hemorrhagic complications of paracentesis: a systematic review of the literature. Gastroenterol Res Pract. 2014;2014:985141. PubMed
8. Runyon BA, AASLD Practice Guidelines Committee. Management of adult patients with ascites due to cirrhosis: an update. Hepatology. 2009;49:2087-2107. PubMed
9. Keil-Rios D, Terrazas-Solis H, González-Garay A, Sánchez-Ávila JF, García-Juárez I. Pocket ultrasound device as a complement to physical examination for ascites evaluation and guided paracentesis. Intern Emerg Med. 2016;11:461-466. PubMed
10. Nazeer SR, Dewbre H, Miller AH. Ultrasound-assisted paracentesis performed by emergency physicians vs the traditional technique: a prospective, randomized study. Am J Emerg Med. 2005;23:363-367. PubMed
11. Marcaldi CJ, Lanes SF. Ultrasound guidance decreases complications and improves the cost of care among patients undergoing thoracentesis and paracenteis. Chest. 2013;143:532-538. PubMed
12. McDonald JH. Handbook of Biological Statistics. 3rd ed. Baltimore, MD: Sparky House Publishing; 2014.
13. Duszak R Jr, Chatterjee AR, Schneider DA. National fluid shifts: fifteen-year trends in paracentesis and thoracentesis procedures. J Am Coll Radiol. 2010;7:859-864. PubMed
© 2018 Society of Hospital Medicine
Clinical Decision-Making: Observing the Smartphone UserAn Observational Study in Predicting Acute Surgical Patients’ Suitability for Discharge
The value placed on bedside clinical observation in the decision-making process of a patient’s illness has been diminished by today’s armamentarium of sophisticated technology. Increasing reliance is now placed on the result of nonspecific tests in preference to bedside clinical judgement in the diagnostic and management process. While diagnostic investigations have undoubtedly provided great advancements in medical care, they come at time and financial costs. Physicians should therefore continue to be encouraged to make clinical decisions based on their bedside assessment.
With hospital overcrowding a significant problem within the healthcare system and the expectation that it will worsen with an ageing population, identifying factors that predict patient suitability for discharge has become an important focus for clinicians.1,2 There exists a paucity of literature predicting discharge suitability of general surgical patients admitted through the emergency department (ED). Furthermore, despite the extensive research into the effectiveness of discharge planning,3 little research has been conducted to describe positive predictive indicators for discharge. Observations made during surgical rounds have led the authors to consider that individuals who are using a smartphone during their bedside assessment may be clinically well enough for discharge.
The aim of this study was to assess whether the clinical assessment of an acute surgical patient could be usefully augmented by the observation of the active use of smartphones (the smartphone sign) and whether this could be used as a surrogate marker to indicate a patient’s well-being and suitability for same-day discharge from the hospital in acute surgical patients.
METHODS
Design and Setting
This was a prospective observational study performed over 2 periods at a tertiary hospital in South Australia, Australia. At our institution, acute surgical patients are admitted to the acute surgical unit (ASU) from the ED by junior surgical doctors. Patients are then reviewed by the on-call surgical consultant, who implements management plans or advises discharge on 2 occasions per day.
Participants
All patients admitted under the ASU were considered eligible for the study. Exclusion criteria included patients that (i) required immediate surgical intervention (defined as time of review to theatre of less than 4 hours) and (ii) had immediate admission to the intensive care unit.
Consultant surgeons are employed within a general surgical subspecialty, including upper gastrointestinal, hepatobiliary, breast and endocrine, and colorectal. All surgeons from each team partake in the general surgery on-call roster. Each surgeon was included at least once within the observation periods. Experience of consultant surgeons ranged from 5 years of postfellowship experience to surgeons with more than 30 years of experience, with the majority having more than 10 years of postfellowship experience.
Patients were stratified into 2 distinct cohorts upon consultant review: smartphone positive (spP) was defined as a patient who was using a smartphone or who had their phone on their bed; a patient was classified as smartphone negative (spN) if they did not fulfil these criteria. The presence or absence of a smartphone was recorded by the authors, who were present on consultant ward rounds but not involved in the decision-making process of patient care. In order to minimize bias, only 1 surgeon (PGD) was aware that the study was being conducted and all patients were blinded to the study. Additional information that was collected included patient demographics, requirement for surgery, and length of stay (LOS). A patient who was discharged on the same day as the consultant review was considered to be discharged on day 1, all other patients were considered to have LOS greater than 1 day. Requirement for surgery was defined as a patient who underwent a surgical procedure in an operating suite. Thirty-day unplanned readmission rates for all patients were examined. Readmission to another public hospital within the state was also included within the readmission data.
Observation Periods
An initial 4-week pilot study was conducted to assess for a possible association between spP and same-day discharge. A second 8-week study period was undertaken 1 year later accounting for the employment of the authors at the study’s institution. Unless stated, the results described are the accumulation of both study periods.
Statistical Analysis
As this is the first study of its kind, no prior estimates of numbers were known. After 2 weeks of data collection, data were analyzed in order to provide an estimate of the total number of patients required to provide a statistically valid result (α = 0.05; power = 0.80). Sample size was calculated to be 40 subjects. It was agreed that in order to make the study as robust as possible, data should be collected for the 2 observation periods.
Demographic data are presented as means with standard deviations (SDs) or frequencies with percentages. A 2-sample Student t test was used to compare the age of spP and spN patients. A χ2 test and logistic regressions were used to assess the association between smartphone status and patient demographics, LOS, and requirement for surgery. Results are presented as odds ratios (ORs) with 95% confidence intervals (CIs). A P value of <0.05 was considered significant. All data were analyzed by using R 3.2.3 (R Foundation for Statistical Computing, Vienna, Austria).
RESULTS

During the 2 observation periods, a total of 227 eligible surgical admissions were observed with complete data for 221 patients. Six patients were excluded as their smartphone status was not recorded. The study sample represents our population of interest within an ASU, and we had complete data for 97.4% of participants with a 100% follow-up. There was no significant effect of study between the 2 observation periods (χ2 = 140.19; P = 0.10). The mean age of patients was 50.24 years. Further demographic data are presented in Table 1. Twenty-five (11.3%) patients were spP and 196 (88.7%) were spN. Fifty-two (23.5%) patients were discharged home on day 1, and 169 (76.5%) had admissions longer than 1 day (see Figure). Sixty (27%) patients underwent surgery during their admission. Twenty-two patients had unplanned readmissions; only 1 of these patients had been observed to be spP.
There was a statistically significant difference in ages between the spP and spN groups (t = 8.40; P < 0.0005), with the average age of spP patients being 31.84 years compared with 52.58 years for spN patients. There was no statistical difference between gender and smartphone status (χ2 = 1.78; P = 0.18; Table 2).
For those patients discharged home on day 1, there was a statistically significant association with being spP (χ2 = 14.55, P = 0.0001). Patients who were spP were 5.29 times more likely to be discharged on day 1 (95% CI, 2.24-12.84). Of the variables analyzed, only gender failed to demonstrate an effect on discharge home on day 1 (Table 3). Overall, the presence of a smartphone was found to have a sensitivity of 56.0% (95% CI, 34.93-75.60) and a specificity of 80.6% (95% CI, 74.37-85.90) in regard to same-day discharge. However, it was found to have a negative predictive value of 93.49% (95% CI, 88.65-96.71).
When examining readmission rates, only 4% of spP patients were readmitted versus 10.7% of spN patients. Accounting for variables, spP patients were 4 times less likely to be readmitted, though this was not statistically significant (OR 4.02; 95% CI, 0.43-37.2; P = 0.22). Furthermore, when examining only those patients discharged on day 1, smartphone status was not a predictor of readmission (OR 0.94; 95% CI, 0.06-15.2; P = 0 .97).
To mitigate the effect of age, analysis was conducted excluding those aged over 55 years (the previous retirement age in Australia), leaving 131 patients for analysis. The average age of spP patients was 31.8 years (SD 10.0) compared with 36.7 years (SD 10.9) for spN patients, representing a significant difference (t = 2.14; P = 0.04); 51.1% of patients were male, 19.1% of patients were spP, 26.0% of patients proceeded to an operation, the oldest spP was 51 years, and 29.0% of patients were discharged home on day 1. There was no difference in gender and smartphone status (χ2 = 0.33; P = 0.6). When analyzing those discharged on day 1, again spP patients were more likely to be discharged home (χ2 = 9.4; P = 0.002), and spP patients were 3.6 times more likely to be discharged home on day 1.
There were 4 spP patients who underwent an operation. Two patients had an incision and drainage of a perianal abscess, 1 patient underwent a laparotomy for an internal hernia after recently undergoing a Roux-en-Y gastric bypass at another hospital, and the final patient underwent a laparoscopic appendicectomy. One of these patients was still discharged home on day 1.
DISCUSSION
As J. A. Lindsay4 said, “For one mistake made for not knowing, ten mistakes are made for not looking.” At medical school, we are taught the finer techniques of the physical examination in order to support our diagnosis made from the history. It is not until we are experienced clinicians do we develop the clinical acumen and ability to tell an unwell patient from a well patient at a glance—colloquially known as the “end of the bed” assessment. In the pretechnology era, a well patient could frequently be seen reading their book, eg, the “novel-sign.” With the advent of the smartphone and electronic devices upon which novels can be read, statuses updated, and locations “checked into” (ie, the modern “vital signs”), the book sign may be a thing of the past. However, the ability for the clinician to assess a patient’s wellness is still crucial, and the value of any additional “physical signs” need to be estimated.
We observed a cohort of patients through a busy ASU in a tertiary hospital in South Australia, Australia. Acute surgical patients admitted to the hospital who were observed to be on their phones upon consultant review were more than 5 times likely to be discharged that same day. To the best of our knowledge, this is the first study to prospectively collect data to assess a frequently used but unevaluated clinical observation.
The use of a smartphone can tell us a lot about an individual’s physiology. We can assume the individual’s airway and breathing are adequate, allowing enough oxygen to reach the lungs and subsequently circulate. The individual is usually sitting up in bed and thus has an adequate blood pressure and blood oxygenation that can maintain cerebral perfusion. They have the cognitive and cerebral processing in place to function the device, and we can examine their cerebellar function by looking for fine-motor movements.
Mobile phone ownership is pervasive within Australia,5 with a conservative estimated 85.7% of the population (20.57 million people of a total population of approximately 24 million) owning a mobile phone and an estimated 50% to 79% of mobile phone ownership being of a smartphone.6,7 This ownership is not just limited to the young, with 74% of Australians over 65 owning or using a mobile phone.8 Despite this high phone ownership among those over 65, it is still significantly less than their younger counterparts and may be one reason for the absence of spP in those older than 51 years. A key point in the study is that overall phone ownership was not known, and, thus, it is not possible to determine the proportion of spN patients who were negative because they did not own a phone. However, based on general population data, the incidence of spP patients was well below that seen in the community (11.3%)5 and even when excluding those over 55, the percentage of spP patients only rose to 19.1%. Unsurprisingly, increasing age was associated with a decreased likelihood of being spP (P < 0.0005), as younger people are more likely to own a phone.8 There was no association with gender (P = 0.18). There are a number of explanations that may explain the lower than expected percentage of spP patients, including the inability for the patient to gather their possessions during a medical emergency, patients storing their phones prior to doctor review (72%-85% of Australians report talking on phones in public places to be rude or intrusive5), but more importantly, that our hypothesis that patients were too unwell to use their device appears to hold true.
There are potential alternate reasons other than smartphone status that may account for patients being discharged home on day 1. While there was no association seen with gender, the need for an operation prolonged a patient’s stay (OR 1.64; 95% CI, 0.046-0.46), and there was a trend seen with increasing age (OR 0.98; 95% CI, 0.96-1.00). Neither of these 2 demographics are unsurprising: increasing age is associated with increasing medical comorbidities and thus complexity; even the simplest of operations require a postprocedure observation period, automatically increasing their LOS. Additionally, measured demographics are limited and there may be further unmeasured reasons that account for earlier discharge.
The other key component to this study is the value of the physical examination, albeit only assessing 1 component: the general inspection. In their review of the value of the physical examination of the cardiovascular system, Elder et al. highlight an important point: in traditional teaching, the value of a physical sign is compared with a diagnostic reference, typically imaging or an invasive test.9 They argue that this definition undervalues the physical examination and list other values aside from accuracy including accessibility, contribution to clinical care beyond diagnoses, cost effectiveness, patients’ safety, patients’ perceptions, and pedagogic value; and they argue that the physical examination should always be considered in regard to the clinical context—in this case, the newly admitted general surgical patient.
The assessment of the presence or absence of a smartphone is readily performed upon general inspection and is easily visible; general inspection of the patient and failure to observe the clinical sign when present are 2 of the greatest errors associated with physical examination.10 Furthermore, given its unique status as a physical sign, the authors’ opinion and experience is that it is readily teachable. McGee states, “…a fundamental lesson [in regards to teaching] is that the diagnosis of many clinical problems, despite modern testing, still depends primarily on what the clinician sees, hears, and feels.”11 In their article, Paley et al. found that more than 80% of patients admitted from the ED under internal medicine could be accurately diagnosed based largely on history and examination alone and concluded that basic clinical skills are sufficient for achieving an accurate diagnosis in most cases.12 Although Paley et al. were assisted with basic tests (such as electrocardiogram and basic haematological and biochemistry results), the point of clinical skills is not lost. Furthermore, this assessment was made in a group of patients generally considered to be complex in contrast to the “standard” appendicitis or cholecystitis patient that makes up a significant proportion of general surgical patients.
There are a number of limitations to this study, however, including smartphones that may have been missed during the observational period. Potential confounding variables such as socioeconomic status and the overall smartphone ownership of our subjects were not known. We did not ask all admitted patients whether they owned a phone or whether they had a phone in their possession. Knowledge of those who owned phones but were not in possession of them could strengthen our argument that spN patients were not using their phone because they were unwell, rather than just not having access to it.
However, this study has a number of strengths, including a large sample size and data that were prospectively collected by a method and in a setting that was the same for all participants. Clear and appropriate definitions were used, which minimizes misclassification bias. Participants and decision makers were blinded to the study, and potentially confounding variables such as age and sex were accounted for.
Assessing the suitability for discharge from the hospital is a decision encountered by hospital-based clinicians every day. These skills are not taught, but are rather learned as a junior doctor acquires experience. It is unlikely that protocols will be developed to aid identification of potential discharges from an acute surgical ward; acute surgical conditions are too varied and dynamic to be able to pool all data. We continue to rely on our own and fellow colleagues’ (doctors, nurses, and other staff
CONCLUSION
While these observations might appear to be rather a simplistic way of trying to quantify whether or not a patient is fit for discharge, any clues that hint towards a patient’s well-being should be taken into account when making an overall assessment. The active use of a smartphone is one such measure.
Acknowledgments
The authors thank Emma Knight and Nancy Briggs from the Data Management & Analysis Centre, Discipline of Public Health, University of Adelaide.
Disclosure
No author nor the institution received any payment or services from a third party for any aspect of the submitted work and report no conflict of interest. There are no reported financial relationships with any entities by any of the authors. There are no patents pending based upon this publication. There are no relationships or activities that readers could perceive to have influenced, or give the appearance of influencing, the submitted work. The corresponding author is not in receipt of a research scholarship. The paper is not based on a previous communication.
1. Sprivulis PC, Da Silva JA, Jacobs IG, Frazer AR, Jelinek GA. The association between hospital overcrowding and mortality among patients admitted via Western Australian emergency departments. Med J Aust. 2006;184(5):208-212. PubMed
2. Shepherd T. Hospital Overcrowding kills as many as our road toll. The Advertiser. November 23, 2010. Available from: http://www.adelaidenow.com.au/news/south-australia/hospital-overcrowding-kills-as-many-as-our-road-toll/news-story/3389668c23b8b141f1d335b096ced416. Accessed February 2, 2017.
3. Shepperd S, Lannin NA, Clemson LM, McCluskey A, Cameron ID, Barras SL. Discharge planning from hospital to home. Cochrane Database Syst Rev. 2013;Jan 31(1):CD000313. PubMed
4. Breathnach CS, Moynihan JB. James Alexander Lindsay (1856–1931), and his clinical axioms and aphorisms. Ulster Med J. 2012;81(3):149-153. PubMed
5. Enhanced Media Metrics Australia. Product Insights Report. Digital Australia: A snapshot of attitudes and usage. August 2013. Ipsos Australia. North Sydney, Australia. Report available from: https://emma.com.au/wp-content/uploads/2013/10/digital.pdf
6. Australian Communications and Media Authority. Communications report 2013-24. Melbounre: Commonwealth of Australia; 2014. http://www.acma.gov.au/~/media/Research%20and%20Analysis/Publication/Comms%20Report%202013%2014/PDF/Communications%20report%20201314_LOW-RES%20FOR%20WEB%20pdf.pdf
7. Drumm J, Johnston S. Mobile Consumer Survery 2015—The Australian Cut. Deloitte. Australia; 2015. Deloitte Touche Tohmatsu. Sydney, Australia. file:///C:/Users/user/Desktop/deloitte-au-tmt-mobile-consumer-survey-2015-291015.pdf
8. Older Australians Resist Cutting the Cord: Australian Communications and Media Authority. 2014. http://www.acma.gov.au/theACMA/engage-blogs/engage-blogs/Research-snapshots/Older-Australians-resist-cutting-the-cord. Accessed February 23, 2017.
9. Elder A, Japp A, Verghese A. How valuable is physical examination of the cardiovascular system? BMJ. 2016;354:i3309. PubMed
10. Verghese A, Charlton B, Kassirer JP, Ramsey M, Ioannidis JP. Inadequacies of physical examination as a cause of medical errors and adverse events: a collection of vignettes. Am J Med. 2015;128(12):1322-1324.e3. PubMed
11. McGee S. A piece of my mind. Bedside teaching rounds reconsidered. JAMA. 2014;311(19):1971-1972. PubMed
12. Paley L, Zornitzki T, Cohen J, Friedman J, Kozak N, Schattner A. Utility of clinical examination in the diagnosis of emergency department patients admitted to the department of medicine of an academic hospital. Arch Intern Med. 2011;171(15):1394-1396. PubMed
The value placed on bedside clinical observation in the decision-making process of a patient’s illness has been diminished by today’s armamentarium of sophisticated technology. Increasing reliance is now placed on the result of nonspecific tests in preference to bedside clinical judgement in the diagnostic and management process. While diagnostic investigations have undoubtedly provided great advancements in medical care, they come at time and financial costs. Physicians should therefore continue to be encouraged to make clinical decisions based on their bedside assessment.
With hospital overcrowding a significant problem within the healthcare system and the expectation that it will worsen with an ageing population, identifying factors that predict patient suitability for discharge has become an important focus for clinicians.1,2 There exists a paucity of literature predicting discharge suitability of general surgical patients admitted through the emergency department (ED). Furthermore, despite the extensive research into the effectiveness of discharge planning,3 little research has been conducted to describe positive predictive indicators for discharge. Observations made during surgical rounds have led the authors to consider that individuals who are using a smartphone during their bedside assessment may be clinically well enough for discharge.
The aim of this study was to assess whether the clinical assessment of an acute surgical patient could be usefully augmented by the observation of the active use of smartphones (the smartphone sign) and whether this could be used as a surrogate marker to indicate a patient’s well-being and suitability for same-day discharge from the hospital in acute surgical patients.
METHODS
Design and Setting
This was a prospective observational study performed over 2 periods at a tertiary hospital in South Australia, Australia. At our institution, acute surgical patients are admitted to the acute surgical unit (ASU) from the ED by junior surgical doctors. Patients are then reviewed by the on-call surgical consultant, who implements management plans or advises discharge on 2 occasions per day.
Participants
All patients admitted under the ASU were considered eligible for the study. Exclusion criteria included patients that (i) required immediate surgical intervention (defined as time of review to theatre of less than 4 hours) and (ii) had immediate admission to the intensive care unit.
Consultant surgeons are employed within a general surgical subspecialty, including upper gastrointestinal, hepatobiliary, breast and endocrine, and colorectal. All surgeons from each team partake in the general surgery on-call roster. Each surgeon was included at least once within the observation periods. Experience of consultant surgeons ranged from 5 years of postfellowship experience to surgeons with more than 30 years of experience, with the majority having more than 10 years of postfellowship experience.
Patients were stratified into 2 distinct cohorts upon consultant review: smartphone positive (spP) was defined as a patient who was using a smartphone or who had their phone on their bed; a patient was classified as smartphone negative (spN) if they did not fulfil these criteria. The presence or absence of a smartphone was recorded by the authors, who were present on consultant ward rounds but not involved in the decision-making process of patient care. In order to minimize bias, only 1 surgeon (PGD) was aware that the study was being conducted and all patients were blinded to the study. Additional information that was collected included patient demographics, requirement for surgery, and length of stay (LOS). A patient who was discharged on the same day as the consultant review was considered to be discharged on day 1, all other patients were considered to have LOS greater than 1 day. Requirement for surgery was defined as a patient who underwent a surgical procedure in an operating suite. Thirty-day unplanned readmission rates for all patients were examined. Readmission to another public hospital within the state was also included within the readmission data.
Observation Periods
An initial 4-week pilot study was conducted to assess for a possible association between spP and same-day discharge. A second 8-week study period was undertaken 1 year later accounting for the employment of the authors at the study’s institution. Unless stated, the results described are the accumulation of both study periods.
Statistical Analysis
As this is the first study of its kind, no prior estimates of numbers were known. After 2 weeks of data collection, data were analyzed in order to provide an estimate of the total number of patients required to provide a statistically valid result (α = 0.05; power = 0.80). Sample size was calculated to be 40 subjects. It was agreed that in order to make the study as robust as possible, data should be collected for the 2 observation periods.
Demographic data are presented as means with standard deviations (SDs) or frequencies with percentages. A 2-sample Student t test was used to compare the age of spP and spN patients. A χ2 test and logistic regressions were used to assess the association between smartphone status and patient demographics, LOS, and requirement for surgery. Results are presented as odds ratios (ORs) with 95% confidence intervals (CIs). A P value of <0.05 was considered significant. All data were analyzed by using R 3.2.3 (R Foundation for Statistical Computing, Vienna, Austria).
RESULTS
During the 2 observation periods, a total of 227 eligible surgical admissions were observed with complete data for 221 patients. Six patients were excluded as their smartphone status was not recorded. The study sample represents our population of interest within an ASU, and we had complete data for 97.4% of participants with a 100% follow-up. There was no significant effect of study between the 2 observation periods (χ2 = 140.19; P = 0.10). The mean age of patients was 50.24 years. Further demographic data are presented in Table 1. Twenty-five (11.3%) patients were spP and 196 (88.7%) were spN. Fifty-two (23.5%) patients were discharged home on day 1, and 169 (76.5%) had admissions longer than 1 day (see Figure). Sixty (27%) patients underwent surgery during their admission. Twenty-two patients had unplanned readmissions; only 1 of these patients had been observed to be spP.
There was a statistically significant difference in ages between the spP and spN groups (t = 8.40; P < 0.0005), with the average age of spP patients being 31.84 years compared with 52.58 years for spN patients. There was no statistical difference between gender and smartphone status (χ2 = 1.78; P = 0.18; Table 2).
For those patients discharged home on day 1, there was a statistically significant association with being spP (χ2 = 14.55, P = 0.0001). Patients who were spP were 5.29 times more likely to be discharged on day 1 (95% CI, 2.24-12.84). Of the variables analyzed, only gender failed to demonstrate an effect on discharge home on day 1 (Table 3). Overall, the presence of a smartphone was found to have a sensitivity of 56.0% (95% CI, 34.93-75.60) and a specificity of 80.6% (95% CI, 74.37-85.90) in regard to same-day discharge. However, it was found to have a negative predictive value of 93.49% (95% CI, 88.65-96.71).
When examining readmission rates, only 4% of spP patients were readmitted versus 10.7% of spN patients. Accounting for variables, spP patients were 4 times less likely to be readmitted, though this was not statistically significant (OR 4.02; 95% CI, 0.43-37.2; P = 0.22). Furthermore, when examining only those patients discharged on day 1, smartphone status was not a predictor of readmission (OR 0.94; 95% CI, 0.06-15.2; P = 0 .97).
To mitigate the effect of age, analysis was conducted excluding those aged over 55 years (the previous retirement age in Australia), leaving 131 patients for analysis. The average age of spP patients was 31.8 years (SD 10.0) compared with 36.7 years (SD 10.9) for spN patients, representing a significant difference (t = 2.14; P = 0.04); 51.1% of patients were male, 19.1% of patients were spP, 26.0% of patients proceeded to an operation, the oldest spP was 51 years, and 29.0% of patients were discharged home on day 1. There was no difference in gender and smartphone status (χ2 = 0.33; P = 0.6). When analyzing those discharged on day 1, again spP patients were more likely to be discharged home (χ2 = 9.4; P = 0.002), and spP patients were 3.6 times more likely to be discharged home on day 1.
There were 4 spP patients who underwent an operation. Two patients had an incision and drainage of a perianal abscess, 1 patient underwent a laparotomy for an internal hernia after recently undergoing a Roux-en-Y gastric bypass at another hospital, and the final patient underwent a laparoscopic appendicectomy. One of these patients was still discharged home on day 1.
DISCUSSION
As J. A. Lindsay4 said, “For one mistake made for not knowing, ten mistakes are made for not looking.” At medical school, we are taught the finer techniques of the physical examination in order to support our diagnosis made from the history. It is not until we are experienced clinicians do we develop the clinical acumen and ability to tell an unwell patient from a well patient at a glance—colloquially known as the “end of the bed” assessment. In the pretechnology era, a well patient could frequently be seen reading their book, eg, the “novel-sign.” With the advent of the smartphone and electronic devices upon which novels can be read, statuses updated, and locations “checked into” (ie, the modern “vital signs”), the book sign may be a thing of the past. However, the ability for the clinician to assess a patient’s wellness is still crucial, and the value of any additional “physical signs” need to be estimated.
We observed a cohort of patients through a busy ASU in a tertiary hospital in South Australia, Australia. Acute surgical patients admitted to the hospital who were observed to be on their phones upon consultant review were more than 5 times likely to be discharged that same day. To the best of our knowledge, this is the first study to prospectively collect data to assess a frequently used but unevaluated clinical observation.
The use of a smartphone can tell us a lot about an individual’s physiology. We can assume the individual’s airway and breathing are adequate, allowing enough oxygen to reach the lungs and subsequently circulate. The individual is usually sitting up in bed and thus has an adequate blood pressure and blood oxygenation that can maintain cerebral perfusion. They have the cognitive and cerebral processing in place to function the device, and we can examine their cerebellar function by looking for fine-motor movements.
Mobile phone ownership is pervasive within Australia,5 with a conservative estimated 85.7% of the population (20.57 million people of a total population of approximately 24 million) owning a mobile phone and an estimated 50% to 79% of mobile phone ownership being of a smartphone.6,7 This ownership is not just limited to the young, with 74% of Australians over 65 owning or using a mobile phone.8 Despite this high phone ownership among those over 65, it is still significantly less than their younger counterparts and may be one reason for the absence of spP in those older than 51 years. A key point in the study is that overall phone ownership was not known, and, thus, it is not possible to determine the proportion of spN patients who were negative because they did not own a phone. However, based on general population data, the incidence of spP patients was well below that seen in the community (11.3%)5 and even when excluding those over 55, the percentage of spP patients only rose to 19.1%. Unsurprisingly, increasing age was associated with a decreased likelihood of being spP (P < 0.0005), as younger people are more likely to own a phone.8 There was no association with gender (P = 0.18). There are a number of explanations that may explain the lower than expected percentage of spP patients, including the inability for the patient to gather their possessions during a medical emergency, patients storing their phones prior to doctor review (72%-85% of Australians report talking on phones in public places to be rude or intrusive5), but more importantly, that our hypothesis that patients were too unwell to use their device appears to hold true.
There are potential alternate reasons other than smartphone status that may account for patients being discharged home on day 1. While there was no association seen with gender, the need for an operation prolonged a patient’s stay (OR 1.64; 95% CI, 0.046-0.46), and there was a trend seen with increasing age (OR 0.98; 95% CI, 0.96-1.00). Neither of these 2 demographics are unsurprising: increasing age is associated with increasing medical comorbidities and thus complexity; even the simplest of operations require a postprocedure observation period, automatically increasing their LOS. Additionally, measured demographics are limited and there may be further unmeasured reasons that account for earlier discharge.
The other key component to this study is the value of the physical examination, albeit only assessing 1 component: the general inspection. In their review of the value of the physical examination of the cardiovascular system, Elder et al. highlight an important point: in traditional teaching, the value of a physical sign is compared with a diagnostic reference, typically imaging or an invasive test.9 They argue that this definition undervalues the physical examination and list other values aside from accuracy including accessibility, contribution to clinical care beyond diagnoses, cost effectiveness, patients’ safety, patients’ perceptions, and pedagogic value; and they argue that the physical examination should always be considered in regard to the clinical context—in this case, the newly admitted general surgical patient.
The assessment of the presence or absence of a smartphone is readily performed upon general inspection and is easily visible; general inspection of the patient and failure to observe the clinical sign when present are 2 of the greatest errors associated with physical examination.10 Furthermore, given its unique status as a physical sign, the authors’ opinion and experience is that it is readily teachable. McGee states, “…a fundamental lesson [in regards to teaching] is that the diagnosis of many clinical problems, despite modern testing, still depends primarily on what the clinician sees, hears, and feels.”11 In their article, Paley et al. found that more than 80% of patients admitted from the ED under internal medicine could be accurately diagnosed based largely on history and examination alone and concluded that basic clinical skills are sufficient for achieving an accurate diagnosis in most cases.12 Although Paley et al. were assisted with basic tests (such as electrocardiogram and basic haematological and biochemistry results), the point of clinical skills is not lost. Furthermore, this assessment was made in a group of patients generally considered to be complex in contrast to the “standard” appendicitis or cholecystitis patient that makes up a significant proportion of general surgical patients.
There are a number of limitations to this study, however, including smartphones that may have been missed during the observational period. Potential confounding variables such as socioeconomic status and the overall smartphone ownership of our subjects were not known. We did not ask all admitted patients whether they owned a phone or whether they had a phone in their possession. Knowledge of those who owned phones but were not in possession of them could strengthen our argument that spN patients were not using their phone because they were unwell, rather than just not having access to it.
However, this study has a number of strengths, including a large sample size and data that were prospectively collected by a method and in a setting that was the same for all participants. Clear and appropriate definitions were used, which minimizes misclassification bias. Participants and decision makers were blinded to the study, and potentially confounding variables such as age and sex were accounted for.
Assessing the suitability for discharge from the hospital is a decision encountered by hospital-based clinicians every day. These skills are not taught, but are rather learned as a junior doctor acquires experience. It is unlikely that protocols will be developed to aid identification of potential discharges from an acute surgical ward; acute surgical conditions are too varied and dynamic to be able to pool all data. We continue to rely on our own and fellow colleagues’ (doctors, nurses, and other staff
CONCLUSION
While these observations might appear to be rather a simplistic way of trying to quantify whether or not a patient is fit for discharge, any clues that hint towards a patient’s well-being should be taken into account when making an overall assessment. The active use of a smartphone is one such measure.
Acknowledgments
The authors thank Emma Knight and Nancy Briggs from the Data Management & Analysis Centre, Discipline of Public Health, University of Adelaide.
Disclosure
No author nor the institution received any payment or services from a third party for any aspect of the submitted work and report no conflict of interest. There are no reported financial relationships with any entities by any of the authors. There are no patents pending based upon this publication. There are no relationships or activities that readers could perceive to have influenced, or give the appearance of influencing, the submitted work. The corresponding author is not in receipt of a research scholarship. The paper is not based on a previous communication.
1. Sprivulis PC, Da Silva JA, Jacobs IG, Frazer AR, Jelinek GA. The association between hospital overcrowding and mortality among patients admitted via Western Australian emergency departments. Med J Aust. 2006;184(5):208-212. PubMed
2. Shepherd T. Hospital Overcrowding kills as many as our road toll. The Advertiser. November 23, 2010. Available from: http://www.adelaidenow.com.au/news/south-australia/hospital-overcrowding-kills-as-many-as-our-road-toll/news-story/3389668c23b8b141f1d335b096ced416. Accessed February 2, 2017.
3. Shepperd S, Lannin NA, Clemson LM, McCluskey A, Cameron ID, Barras SL. Discharge planning from hospital to home. Cochrane Database Syst Rev. 2013;Jan 31(1):CD000313. PubMed
4. Breathnach CS, Moynihan JB. James Alexander Lindsay (1856–1931), and his clinical axioms and aphorisms. Ulster Med J. 2012;81(3):149-153. PubMed
5. Enhanced Media Metrics Australia. Product Insights Report. Digital Australia: A snapshot of attitudes and usage. August 2013. Ipsos Australia. North Sydney, Australia. Report available from: https://emma.com.au/wp-content/uploads/2013/10/digital.pdf
6. Australian Communications and Media Authority. Communications report 2013-24. Melbounre: Commonwealth of Australia; 2014. http://www.acma.gov.au/~/media/Research%20and%20Analysis/Publication/Comms%20Report%202013%2014/PDF/Communications%20report%20201314_LOW-RES%20FOR%20WEB%20pdf.pdf
7. Drumm J, Johnston S. Mobile Consumer Survery 2015—The Australian Cut. Deloitte. Australia; 2015. Deloitte Touche Tohmatsu. Sydney, Australia. file:///C:/Users/user/Desktop/deloitte-au-tmt-mobile-consumer-survey-2015-291015.pdf
8. Older Australians Resist Cutting the Cord: Australian Communications and Media Authority. 2014. http://www.acma.gov.au/theACMA/engage-blogs/engage-blogs/Research-snapshots/Older-Australians-resist-cutting-the-cord. Accessed February 23, 2017.
9. Elder A, Japp A, Verghese A. How valuable is physical examination of the cardiovascular system? BMJ. 2016;354:i3309. PubMed
10. Verghese A, Charlton B, Kassirer JP, Ramsey M, Ioannidis JP. Inadequacies of physical examination as a cause of medical errors and adverse events: a collection of vignettes. Am J Med. 2015;128(12):1322-1324.e3. PubMed
11. McGee S. A piece of my mind. Bedside teaching rounds reconsidered. JAMA. 2014;311(19):1971-1972. PubMed
12. Paley L, Zornitzki T, Cohen J, Friedman J, Kozak N, Schattner A. Utility of clinical examination in the diagnosis of emergency department patients admitted to the department of medicine of an academic hospital. Arch Intern Med. 2011;171(15):1394-1396. PubMed
© 2018 Society of Hospital Medicine
Perception of Resources Spent on Defensive Medicine and History of Being Sued Among Hospitalists: Results from a National Survey
Annual healthcare costs in the United States are over $3 trillion and are garnering significant national attention.1 The United States spends approximately 2.5 times more per capita on healthcare when compared to other developed nations.2 One source of unnecessary cost in healthcare is defensive medicine. Defensive medicine has been defined by Congress as occurring “when doctors order tests, procedures, or visits, or avoid certain high-risk patients or procedures, primarily (but not necessarily) because of concern about malpractice liability.”3
Though difficult to assess, in 1 study, defensive medicine was estimated to cost $45 billion annually.4 While general agreement exists that physicians practice defensive medicine, the extent of defensive practices and the subsequent impact on healthcare costs remain unclear. This is especially true for a group of clinicians that is rapidly increasing in number: hospitalists. Currently, there are more than 50,000 hospitalists in the United States,5 yet the prevalence of defensive medicine in this relatively new specialty is unknown. Inpatient care is complex and time constraints can impede establishing an optimal therapeutic relationship with the patient, potentially raising liability fears. We therefore sought to quantify hospitalist physician estimates of the cost of defensive medicine and assess correlates of their estimates. As being sued might spur defensive behaviors, we also assessed how many hospitalists reported being sued and whether this was associated with their estimates of defensive medicine.
METHODS
Survey Questionnaire
In a previously published survey-based analysis, we reported on physician practice and overuse for 2 common scenarios in hospital medicine: preoperative evaluation and management of uncomplicated syncope.6 After responding to the vignettes, each physician was asked to provide demographic and employment information and malpractice history. In addition, they were asked the following: In your best estimation, what percentage of healthcare-related resources (eg, hospital admissions, diagnostic testing, treatment) are spent purely because of defensive medicine concerns? __________% resources
Survey Sample & Administration
The survey was sent to a sample of 1753 hospitalists, randomly identified through the Society of Hospital Medicine’s (SHM) database of members and annual meeting attendees. It is estimated that almost 30% of practicing hospitalists in the United States are members of the SHM.5 A full description of the sampling methodology was previously published.6 Selected hospitalists were mailed surveys, a $20 financial incentive, and subsequent reminders between June and October 2011.
The study was exempted from institutional review board review by the University of Michigan and the VA Ann Arbor Healthcare System.
Variables
The primary outcome of interest was the response to the “% resources” estimated to be spent on defensive medicine. This was analyzed as a continuous variable. Independent variables included the following: VA employment, malpractice insurance payer, employer, history of malpractice lawsuit, sex, race, and years practicing as a physician.
Statistical Analysis
Analyses were conducted using SAS, version 9.4 (SAS Institute). Descriptive statistics were first calculated for all variables. Next, bivariable comparisons between the outcome variables and other variables of interest were performed. Multivariable comparisons were made using linear regression for the outcome of estimated resources spent on defensive medicine. A P value of < 0.05 was considered statistically significant.
RESULTS
Of the 1753 surveys mailed, 253 were excluded due to incorrect addresses or because the recipients were not practicing hospitalists. A total of 1020 were completed and returned, yielding a 68% response rate (1020 out of 1500 eligible). The hospitalist respondents were in practice for an average of 11 years (range 1-40 years). Respondents represented all 50 states and had a diverse background of experience and demographic characteristics, which has been previously described.6
Resources Estimated Spent on Defensive Medicine
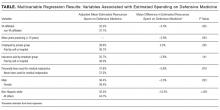

Hospitalists reported, on average, that they believed defensive medicine accounted for 37.5% (standard deviation, 20.2%) of all healthcare spending. Results from the multivariable regression are presented in the Table. Hospitalists affiliated with a VA hospital reported 5.5% less in resources spent on defensive medicine than those not affiliated with a VA hospital (32.2% VA vs 37.7% non-VA, P = 0.025). For every 10 years in practice, the estimate of resources spent on defensive medicine decreased by 3% (P = 0.003). Those who were male (36.4% male vs 39.4% female, P = 0.023) and non-Hispanic white (32.5% non-Hispanic white vs 44.7% other, P ≤ 0.001) also estimated less resources spent on defensive medicine. We did not find an association between a hospitalist reporting being sued and their perception of resources spent on defensive medicine.
Risk of Being Sued

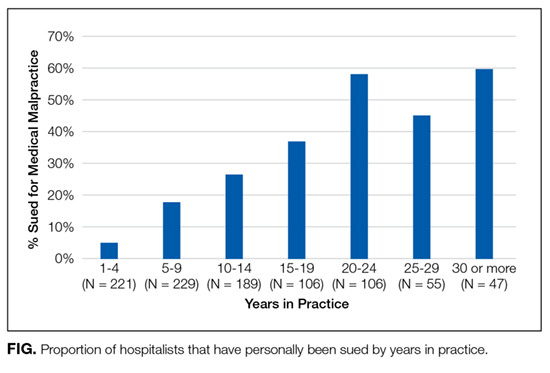
Over a quarter of our sample (25.6%) reported having been sued at least once for medical malpractice. The proportion of hospitalists that reported a history of being sued generally increased with more years of practice (Figure). For those who had been in practice for at least 20 years, more than half (55%) had been sued at least once during their career.
DISCUSSION
In a national survey, hospitalists estimated that almost 40% of all healthcare-related resources are spent purely because of defensive medicine concerns. This estimate was affected by personal demographic and employment factors. Our second major finding is that over one-quarter of a large random sample of hospitalist physicians reported being sued for malpractice.
Hospitalist perceptions of defensive medicine varied significantly based on employment at a VA hospital, with VA-affiliated hospitalists reporting less estimated spending on defensive medicine. This effect may reflect a less litigious environment within the VA, even though physicians practicing within the VA can be reported to the National Practitioner Data Bank.7 The different environment may be due to the VA’s patient mix (VA patients tend to be poorer, older, sicker, and have more mental illness)8; however, it could also be due to its de facto practice of a form of enterprise liability, in which, by law, the VA assumes responsibility for negligence, sheltering its physicians from direct liability.
We also found that the higher the number of years a hospitalist reported practicing, the lower the perception of resources being spent on defensive medicine. The reason for this finding is unclear. There has been a recent focus on high-value care and overspending, and perhaps younger hospitalists are more aware of these initiatives and thus have higher estimates. Additionally, non-Hispanic white male respondents estimated a lower amount spent on defensive medicine compared with other respondents. This is consistent with previous studies of risk perception which have noted a “white male effect” in which white males generally perceive a wide range of risks to be lower than female and non-white individuals, likely due to sociopolitical factors.9 Here, the white male effect is particularly interesting, considering that male physicians are almost 2.5 times as likely as female physicians to report being sued.10
Similar to prior studies,11 there was no association with personal liability claim experience and perceived resources spent on defensive medicine. It is unclear why personal experience of being sued does not appear to be associated with perceptions of defensive medicine practice. It is possible that the fear of being sued is worse than the actual experience or that physicians believe that lawsuits are either random events or inevitable and, as a result, do not change their practice patterns.
The lifetime risk of being named in a malpractice suit is substantial for hospitalists: in our study, over half of hospitalists in practice for 20 years or more reported they had been sued. This corresponds with the projection made by Jena and colleagues,12 which estimated that 55% of internal medicine physicians will be sued by the age of 45, a number just slightly higher than the average for all physicians.
Our study has important limitations. Our sample was of hospitalists and therefore may not be reflective of other medical specialties. Second, due to the nature of the study design, the responses to spending on defensive medicine may not represent actual practice. Third, we did not confirm details such as place of employment or history of lawsuit, and this may be subject to recall bias. However, physicians are unlikely to forget having been sued. Finally, this survey is observational and cross-sectional. Our data imply association rather than causation. Without longitudinal data, it is impossible to know if years of practice correlate with perceived defensive medicine spending due to a generational effect or a longitudinal effect (such as more confidence in diagnostic skills with more years of practice).
Despite these limitations, our survey has important policy implications. First, we found that defensive medicine is perceived by hospitalists to be costly. Although physicians likely overestimated the cost (37.5%, or an estimated $1 trillion is far higher than previous estimates of approximately 2% of all healthcare spending),4 it also demonstrates the extent to which physicians feel as though the medical care that is provided may be unnecessary. Second, at least a quarter of hospitalist physicians have been sued, and the risk of being named as a defendant in a lawsuit increases the longer they have been in clinical practice.
Given these findings, policies aimed to reduce the practice of defensive medicine may help the rising costs of healthcare. Reducing defensive medicine requires decreasing physician fears of liability and related reporting. Traditional tort reforms (with the exception of damage caps) have not been proven to do this. And damage caps can be inequitable, hard to pass, and even found to be unconstitutional in some states.13 However, other reform options hold promise in reducing liability fears, including enterprise liability, safe harbor legislation, and health courts.13 Finally, shared decision-making models may also provide a method to reduce defensive fears as well.6
Acknowledgments
The authors thank the Society of Hospital Medicine, Dr. Scott Flanders, Andrew Hickner, and David Ratz for their assistance with this project.
Disclosure
The authors received financial support from the Blue Cross Blue Shield of Michigan Foundation, the Department of Veterans Affairs Health Services Research and Development Center for Clinical Management Research, the University of Michigan Specialist-Hospitalist Allied Research Program, and the Ann Arbor University of Michigan VA Patient Safety Enhancement Program.
Disclaimer
The views expressed in this article are those of the authors and do not necessarily reflect the position or policy of Blue Cross Blue Shield of Michigan Foundation, the Department of Veterans Affairs, or the Society of Hospital Medicine.
1. Centers for Medicare & Medicaid Services. National Health Expenditures 2014 Highlights. 2015; https://www.cms.gov/Research-Statistics-Data-and-Systems/Statistics-Trends-and-Reports/NationalHealthExpendData/NationalHealthAccountsHistorical.html. Accessed on July 28, 2016.
2. OECD. Health expenditure per capita. Health at a Glance 2015. Paris: OECD Publishing; 2015.
3. U.S. Congress, Office of Technology Assessment. Defensive Medicine and Medical Malpractice. Washington, DC: U.S. Government Printing Office; July 1994. OTA-H-602.
4. Mello MM, Chandra A, Gawande AA, Studdert DM. National costs of the medical liability system. Health Aff (Millwood). 2010;29(9):1569-1577. PubMed
5. Society of Hospital Medicine. Society of Hospital Medicine: Membership. 2017; http://www.hospitalmedicine.org/Web/Membership/Web/Membership/Membership_Landing_Page.aspx?hkey=97f40c85-fdcd-411f-b3f6-e617bc38a2c5. Accessed on January 5, 2017.
6. Kachalia A, Berg A, Fagerlin A, et al. Overuse of testing in preoperative evaluation and syncope: a survey of hospitalists. Ann Intern Med. 2015;162(2):100-108. PubMed
7. Pugatch MB. Federal tort claims and military medical malpractice. J Legal Nurse Consulting. 2008;19(2):3-6.
8. Eibner C, Krull H, Brown K, et al. Current and projected characteristics and unique health care needs of the patient population served by the Department of Veterans Affairs. Santa Monica, CA: RAND Corporation; 2015. PubMed
9. Finucane ML, Slovic P, Mertz CK, Flynn J, Satterfield TA. Gender, race, and perceived risk: the ‘white male’ effect. Health, Risk & Society. 2000;2(2):159-172.
10. Unwin E, Woolf K, Wadlow C, Potts HW, Dacre J. Sex differences in medico-legal action against doctors: a systematic review and meta-analysis. BMC Med. 2015;13:172. PubMed
11. Glassman PA, Rolph JE, Petersen LP, Bradley MA, Kravitz RL. Physicians’ personal malpractice experiences are not related to defensive clinical practices. J Health Polit Policy Law. 1996;21(2):219-241. PubMed
12. Jena AB, Seabury S, Lakdawalla D, Chandra A. Malpractice risk according to physician specialty. N Engl J Med. 2011;365(7):629-636. PubMed
13. Mello MM, Studdert DM, Kachalia A. The medical liability climate and prospects for reform. JAMA. 2014;312(20):2146-2155. PubMed
Annual healthcare costs in the United States are over $3 trillion and are garnering significant national attention.1 The United States spends approximately 2.5 times more per capita on healthcare when compared to other developed nations.2 One source of unnecessary cost in healthcare is defensive medicine. Defensive medicine has been defined by Congress as occurring “when doctors order tests, procedures, or visits, or avoid certain high-risk patients or procedures, primarily (but not necessarily) because of concern about malpractice liability.”3
Though difficult to assess, in 1 study, defensive medicine was estimated to cost $45 billion annually.4 While general agreement exists that physicians practice defensive medicine, the extent of defensive practices and the subsequent impact on healthcare costs remain unclear. This is especially true for a group of clinicians that is rapidly increasing in number: hospitalists. Currently, there are more than 50,000 hospitalists in the United States,5 yet the prevalence of defensive medicine in this relatively new specialty is unknown. Inpatient care is complex and time constraints can impede establishing an optimal therapeutic relationship with the patient, potentially raising liability fears. We therefore sought to quantify hospitalist physician estimates of the cost of defensive medicine and assess correlates of their estimates. As being sued might spur defensive behaviors, we also assessed how many hospitalists reported being sued and whether this was associated with their estimates of defensive medicine.
METHODS
Survey Questionnaire
In a previously published survey-based analysis, we reported on physician practice and overuse for 2 common scenarios in hospital medicine: preoperative evaluation and management of uncomplicated syncope.6 After responding to the vignettes, each physician was asked to provide demographic and employment information and malpractice history. In addition, they were asked the following: In your best estimation, what percentage of healthcare-related resources (eg, hospital admissions, diagnostic testing, treatment) are spent purely because of defensive medicine concerns? __________% resources
Survey Sample & Administration
The survey was sent to a sample of 1753 hospitalists, randomly identified through the Society of Hospital Medicine’s (SHM) database of members and annual meeting attendees. It is estimated that almost 30% of practicing hospitalists in the United States are members of the SHM.5 A full description of the sampling methodology was previously published.6 Selected hospitalists were mailed surveys, a $20 financial incentive, and subsequent reminders between June and October 2011.
The study was exempted from institutional review board review by the University of Michigan and the VA Ann Arbor Healthcare System.
Variables
The primary outcome of interest was the response to the “% resources” estimated to be spent on defensive medicine. This was analyzed as a continuous variable. Independent variables included the following: VA employment, malpractice insurance payer, employer, history of malpractice lawsuit, sex, race, and years practicing as a physician.
Statistical Analysis
Analyses were conducted using SAS, version 9.4 (SAS Institute). Descriptive statistics were first calculated for all variables. Next, bivariable comparisons between the outcome variables and other variables of interest were performed. Multivariable comparisons were made using linear regression for the outcome of estimated resources spent on defensive medicine. A P value of < 0.05 was considered statistically significant.
RESULTS
Of the 1753 surveys mailed, 253 were excluded due to incorrect addresses or because the recipients were not practicing hospitalists. A total of 1020 were completed and returned, yielding a 68% response rate (1020 out of 1500 eligible). The hospitalist respondents were in practice for an average of 11 years (range 1-40 years). Respondents represented all 50 states and had a diverse background of experience and demographic characteristics, which has been previously described.6
Resources Estimated Spent on Defensive Medicine
Hospitalists reported, on average, that they believed defensive medicine accounted for 37.5% (standard deviation, 20.2%) of all healthcare spending. Results from the multivariable regression are presented in the Table. Hospitalists affiliated with a VA hospital reported 5.5% less in resources spent on defensive medicine than those not affiliated with a VA hospital (32.2% VA vs 37.7% non-VA, P = 0.025). For every 10 years in practice, the estimate of resources spent on defensive medicine decreased by 3% (P = 0.003). Those who were male (36.4% male vs 39.4% female, P = 0.023) and non-Hispanic white (32.5% non-Hispanic white vs 44.7% other, P ≤ 0.001) also estimated less resources spent on defensive medicine. We did not find an association between a hospitalist reporting being sued and their perception of resources spent on defensive medicine.
Risk of Being Sued
Over a quarter of our sample (25.6%) reported having been sued at least once for medical malpractice. The proportion of hospitalists that reported a history of being sued generally increased with more years of practice (Figure). For those who had been in practice for at least 20 years, more than half (55%) had been sued at least once during their career.
DISCUSSION
In a national survey, hospitalists estimated that almost 40% of all healthcare-related resources are spent purely because of defensive medicine concerns. This estimate was affected by personal demographic and employment factors. Our second major finding is that over one-quarter of a large random sample of hospitalist physicians reported being sued for malpractice.
Hospitalist perceptions of defensive medicine varied significantly based on employment at a VA hospital, with VA-affiliated hospitalists reporting less estimated spending on defensive medicine. This effect may reflect a less litigious environment within the VA, even though physicians practicing within the VA can be reported to the National Practitioner Data Bank.7 The different environment may be due to the VA’s patient mix (VA patients tend to be poorer, older, sicker, and have more mental illness)8; however, it could also be due to its de facto practice of a form of enterprise liability, in which, by law, the VA assumes responsibility for negligence, sheltering its physicians from direct liability.
We also found that the higher the number of years a hospitalist reported practicing, the lower the perception of resources being spent on defensive medicine. The reason for this finding is unclear. There has been a recent focus on high-value care and overspending, and perhaps younger hospitalists are more aware of these initiatives and thus have higher estimates. Additionally, non-Hispanic white male respondents estimated a lower amount spent on defensive medicine compared with other respondents. This is consistent with previous studies of risk perception which have noted a “white male effect” in which white males generally perceive a wide range of risks to be lower than female and non-white individuals, likely due to sociopolitical factors.9 Here, the white male effect is particularly interesting, considering that male physicians are almost 2.5 times as likely as female physicians to report being sued.10
Similar to prior studies,11 there was no association with personal liability claim experience and perceived resources spent on defensive medicine. It is unclear why personal experience of being sued does not appear to be associated with perceptions of defensive medicine practice. It is possible that the fear of being sued is worse than the actual experience or that physicians believe that lawsuits are either random events or inevitable and, as a result, do not change their practice patterns.
The lifetime risk of being named in a malpractice suit is substantial for hospitalists: in our study, over half of hospitalists in practice for 20 years or more reported they had been sued. This corresponds with the projection made by Jena and colleagues,12 which estimated that 55% of internal medicine physicians will be sued by the age of 45, a number just slightly higher than the average for all physicians.
Our study has important limitations. Our sample was of hospitalists and therefore may not be reflective of other medical specialties. Second, due to the nature of the study design, the responses to spending on defensive medicine may not represent actual practice. Third, we did not confirm details such as place of employment or history of lawsuit, and this may be subject to recall bias. However, physicians are unlikely to forget having been sued. Finally, this survey is observational and cross-sectional. Our data imply association rather than causation. Without longitudinal data, it is impossible to know if years of practice correlate with perceived defensive medicine spending due to a generational effect or a longitudinal effect (such as more confidence in diagnostic skills with more years of practice).
Despite these limitations, our survey has important policy implications. First, we found that defensive medicine is perceived by hospitalists to be costly. Although physicians likely overestimated the cost (37.5%, or an estimated $1 trillion is far higher than previous estimates of approximately 2% of all healthcare spending),4 it also demonstrates the extent to which physicians feel as though the medical care that is provided may be unnecessary. Second, at least a quarter of hospitalist physicians have been sued, and the risk of being named as a defendant in a lawsuit increases the longer they have been in clinical practice.
Given these findings, policies aimed to reduce the practice of defensive medicine may help the rising costs of healthcare. Reducing defensive medicine requires decreasing physician fears of liability and related reporting. Traditional tort reforms (with the exception of damage caps) have not been proven to do this. And damage caps can be inequitable, hard to pass, and even found to be unconstitutional in some states.13 However, other reform options hold promise in reducing liability fears, including enterprise liability, safe harbor legislation, and health courts.13 Finally, shared decision-making models may also provide a method to reduce defensive fears as well.6
Acknowledgments
The authors thank the Society of Hospital Medicine, Dr. Scott Flanders, Andrew Hickner, and David Ratz for their assistance with this project.
Disclosure
The authors received financial support from the Blue Cross Blue Shield of Michigan Foundation, the Department of Veterans Affairs Health Services Research and Development Center for Clinical Management Research, the University of Michigan Specialist-Hospitalist Allied Research Program, and the Ann Arbor University of Michigan VA Patient Safety Enhancement Program.
Disclaimer
The views expressed in this article are those of the authors and do not necessarily reflect the position or policy of Blue Cross Blue Shield of Michigan Foundation, the Department of Veterans Affairs, or the Society of Hospital Medicine.
1. Centers for Medicare & Medicaid Services. National Health Expenditures 2014 Highlights. 2015; https://www.cms.gov/Research-Statistics-Data-and-Systems/Statistics-Trends-and-Reports/NationalHealthExpendData/NationalHealthAccountsHistorical.html. Accessed on July 28, 2016.
2. OECD. Health expenditure per capita. Health at a Glance 2015. Paris: OECD Publishing; 2015.
3. U.S. Congress, Office of Technology Assessment. Defensive Medicine and Medical Malpractice. Washington, DC: U.S. Government Printing Office; July 1994. OTA-H-602.
4. Mello MM, Chandra A, Gawande AA, Studdert DM. National costs of the medical liability system. Health Aff (Millwood). 2010;29(9):1569-1577. PubMed
5. Society of Hospital Medicine. Society of Hospital Medicine: Membership. 2017; http://www.hospitalmedicine.org/Web/Membership/Web/Membership/Membership_Landing_Page.aspx?hkey=97f40c85-fdcd-411f-b3f6-e617bc38a2c5. Accessed on January 5, 2017.
6. Kachalia A, Berg A, Fagerlin A, et al. Overuse of testing in preoperative evaluation and syncope: a survey of hospitalists. Ann Intern Med. 2015;162(2):100-108. PubMed
7. Pugatch MB. Federal tort claims and military medical malpractice. J Legal Nurse Consulting. 2008;19(2):3-6.
8. Eibner C, Krull H, Brown K, et al. Current and projected characteristics and unique health care needs of the patient population served by the Department of Veterans Affairs. Santa Monica, CA: RAND Corporation; 2015. PubMed
9. Finucane ML, Slovic P, Mertz CK, Flynn J, Satterfield TA. Gender, race, and perceived risk: the ‘white male’ effect. Health, Risk & Society. 2000;2(2):159-172.
10. Unwin E, Woolf K, Wadlow C, Potts HW, Dacre J. Sex differences in medico-legal action against doctors: a systematic review and meta-analysis. BMC Med. 2015;13:172. PubMed
11. Glassman PA, Rolph JE, Petersen LP, Bradley MA, Kravitz RL. Physicians’ personal malpractice experiences are not related to defensive clinical practices. J Health Polit Policy Law. 1996;21(2):219-241. PubMed
12. Jena AB, Seabury S, Lakdawalla D, Chandra A. Malpractice risk according to physician specialty. N Engl J Med. 2011;365(7):629-636. PubMed
13. Mello MM, Studdert DM, Kachalia A. The medical liability climate and prospects for reform. JAMA. 2014;312(20):2146-2155. PubMed
© 2018 Society of Hospital Medicine
How Long Can Corneas Be Saved Before Transplantation?
The belief that corneas that have been preserved for > 7 days are not viable for transplantation is not based on evidence, says Jonathan Lass, MD. In fact, he led a study that found corneas can be preserved safely for 11 days without negative impact on the success of transplantation. In the Cornea Preservation Time Study, funded by the National Eye Institute, Lass and other researchers looked at 3-year graft success rates among 1,090 participants (1,330 eyes) who underwent transplantation via Descemet’s stripping automated endothelial keratoplasty by 70 surgeons at 40 surgical sites. Most of the patients had Fuchs’ endothelial corneal dystrophy, a progressive disease.
The researchers were “unable to conclude” that the success rates were the same for corneas preserved for 8 to 14 days, versus up to 7 days (92% vs 95%). However, they found that much of the difference between the groups was accounted for by patients receiving corneas preserved for 12 to 14 days.
In a separate analysis, the researchers looked to see if differences in corneal preservation time affected endothelial cell loss after 3 years. They found that corneas preserved for up to 7 days had a 37% loss of cells versus 40% in those preserved for 8 to 14 days. A closer look at the data showed that the effect of corneal preservation time on the loss of endothelial cells was comparable from 4 to 13 days.
Dr. Lass emphasizes that while patients who received the older corneas had lower success rates, even those success rates were “impressively high” at 89%.
Donor corneas are not in short supply in the U.S. Outside the U.S., however, corneal disease is the third leading cause of blindness and corneal donor tissue is scarce.
Update in Hospital Palliative Care: Symptom Management, Communication, Caregiver Outcomes, and Moral Distress
The aim of palliative care (PC) is to improve quality of life for patients facing serious, life-threatening illness and their families.1 Due to insufficient numbers of PC specialists to meet the PC needs for every hospitalized patient,2 all hospitalists should maintain basic PC skills as recognized by PC being a core competency for hospitalists.3,4
We summarize and critique PC research articles published between January 1, 2016, and December 31, 2016, that have a high likelihood of impacting the practice of hospital medicine. We hand searched 15 journals and conducted a MEDLINE keyword search of PC terms (see Table). All titles and/or abstracts were reviewed and selected for full review based on the following factors: palliative medicine content, scientific rigor, impact on practice, and relevance to hospital medicine. Fifty-five articles were individually reviewed and scored by all authors according to rigor, impact, and relevance. Articles were ranked according to their mean scores, and 9 articles were chosen for inclusion through consensus discussion.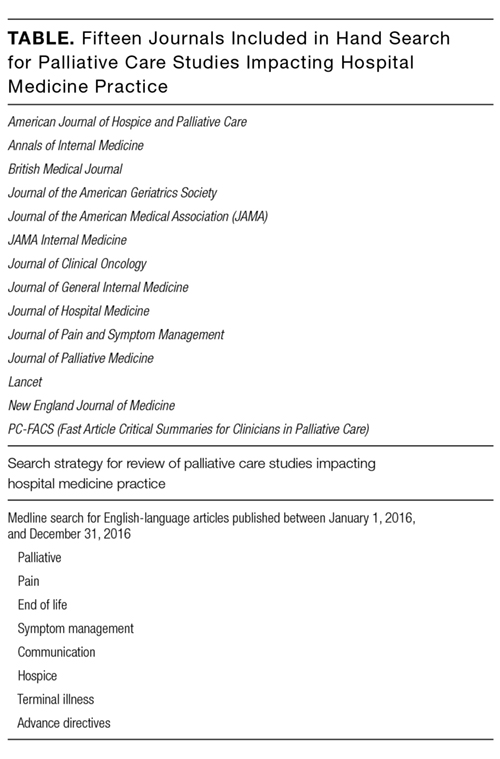
SYMPTOM MANAGEMENT
Antipsychotics Were Inferior to a Placebo in Treating Nonterminal Delirium
Agar MR, Lawlor PG, Quinn S, et al. Efficacy of oral risperidone, haloperidol, or placebo for symptoms of delirium among patients in palliative care: a randomized clinical trial. JAMA Intern Med. 2017;177(1):34-42.
Background
Delirium is highly prevalent in PC and is associated with significant distress.5 Antipsychotics are widely used for symptoms of delirium, although current evidence does not support this practice in hospitalized adults.6,7
Findings
This was a double-blind, parallel-arm, placebo randomized controlled trial (RCT) of 247 patients with delirium with an estimated life expectancy of ≥7 days in 11 PC or hospice units across Australia. Patients were randomized to receive risperidone, haloperidol, or a placebo in addition to nonpharmacological management of delirium. Delirium symptom scores after 3 days of treatment, the use of midazolam as a rescue medication, and the presence of extrapyramidal symptoms (EPS) were measured. The risperidone and haloperidol arms had significantly higher delirium symptom scores (P = .02 and P = .009, respectively), mean EPS symptoms (P < .001), and more use of rescue midazolam than the placebo arm. Mortality was higher for antipsychotics, with a hazard ratio of 1.73 for haloperidol (P = .003), 1.29 for risperidone (P = .14), and 1.47 for any antipsychotic (P = .01).
Cautions
The study population was elderly (mean age >70 years) with mild delirium scores. The use of antipsychotics was associated with more benzodiazepine use, which could itself worsen delirium. As patients with clinician-predicted life expectancy of <7 days were excluded, findings cannot be extrapolated to the treatment of terminal delirium, which can often be more symptomatic and difficult to treat.
Implications
Avoid scheduled antipsychotics in patients with nonterminal delirium, as they can increase risk of harm without advantages, over nonpharmacologic interventions.
Low-Dose Morphine Was Superior to Weak Opioids in the Treatment of Moderate Cancer Pain
Bandieri E, Romero M, Ripamonti CI, et al. Randomized trial of low-dose morphine versus weak opioids in moderate cancer pain. J Clin Oncol. 2016;34(5):436-442.
Background
The World Health Organization guidelines recommend the use of weak opioids (WOs), such as codeine or tramadol, as a sequential step in the management of cancer pain.8 This strategy has not been tested against low doses of stronger opioids.
Findings
In this multicenter, open-label RCT, 240 patients in Italy were randomized and stratified by age (<75 years or ≥75 years) to either the WO group or low-dose morphine (M) group. The primary outcome measure was a reduction in pain intensity by 20% or more. Secondary outcomes included an improvement in symptom scores, a ≥30% and ≥50% reduction in pain, increased opioid dosage, and adverse side effects. Compared with the WO group, the M group had more patients with a 20% reduction in pain (88.2% vs 54.7%; P < .001), more evidence of pain control in the first week (80.9% vs 43.6%; P < .001), more patients with a ≥30% and ≥50% reduction in pain, and less need to switch to a stronger opioid (15.5% vs 35.0%; P = .001) or require dose increases. Adverse effects were similar in both groups.
Cautions
Patients with chronic kidney disease (CKD) were excluded due to concerns about the accumulation of morphine metabolites. Additionally, this study was open label, increasing the risk of bias.
Implications
Low-dose morphine should be considered over the use of WOs to achieve better and more rapid pain control in patients without CKD.
The Use of Methadone as a Coanalgesic May Improve Moderate Cancer Pain
Courtemanche F, Dao D, Gagné F, et al. Methadone as a coanalgesic for palliative care cancer patients. J Palliat Med. 2016;19(9):972-978.
Background
Methadone is effective at treating cancer pain and is often utilized when patients have neuropathic pain, fail to respond to traditional opioids, or have renal failure.9,10 However, its long half-life and many drug interactions make methadone challenging to use.
Findings
This cohort study looked at 153 inpatient or outpatient PC patients in Montreal who received methadone as a coanalgesic for cancer pain. The patients’ median morphine equivalent dose was 120 mg when initiating methadone. The median starting dose of methadone was 3 mg per day. Of patients, 49.3% had a significant response (≥30% pain reduction), with a median response time of 7 days, and 30.1% achieved a substantial response (≥50% pain reduction), with a median response time of 3 days. Patients with higher initial pain scores were more likely to respond to adjuvant methadone. Those who had not responded after a week of methadone were unlikely to respond despite dose escalations. Adverse effects included drowsiness (51.4%), confusion (27.4%), constipation (24.7%), nausea (19.9%), and myoclonia (16.4%).
Cautions
This was an observational study with retrospective data, leading to higher levels of missing data. A high rate of adverse side effects was reported (90.4%). Further study is needed to validate and reproduce the findings.
Implications
The use of adjuvant low-dose methadone may be considered in patients with moderate pain despite high-dose opioids. If a response is not seen within 7 days, then methadone use should be reconsidered.
ANTIBIOTIC STEWARDSHIP
Many Hospitalized Patients on Comfort Care Still Receive Antimicrobials
Merel SE, Meier CA, McKinney CM, Pottinger PS. Antimicrobial use in patients on a comfort care protocol: a retrospective cohort study. J Palliat Med. 2016;19(11):1210-1214.
Background
It is unknown how often patients who are hospitalized at the end of life continue to receive antimicrobials and what factors are associated with antimicrobial use.
Findings
This retrospective cohort study of 1881 hospitalized adults transitioned to a comfort care order (CCO) set at 2 academic medical centers found that 77% of these patients received antimicrobials during their hospital stay (62.4% at 24 hours prior to CCO). Of the 711 still alive at ≥24 hours after CCO, 111 (15.6%) were still on antimicrobials, with that proportion remaining stable for the remainder of hospitalization. In comparing those who did and did not receive antimicrobials after 24 hours of CCO, the presence of a documented infection was not significantly different after adjusting for age. Those with a cancer diagnosis (adjusted risk ratio [ARR] = 1.44: P = .04), a longer length of stay (≥7 days vs <7 days; ARR = 1.49; P = .05), and those discharged home (ARR 2.93; P < .001) or to a facility (ARR 3.63; P < .001) versus dying in the hospital were more likely to be on antimicrobials 24 hours after CCO. Compared with those on a medicine service, patients in the medical and surgical intensive care units (ICUs) were less likely to receive antimicrobials (medical ICU ARR = 0.32; P = .01; surgical ICU and/or neuro-ICU ARR = 0.32; P = .02). The most commonly administered antimicrobials were fluoroquinolones and vancomycin.
Cautions
Only 111 patients were still on antimicrobials at 24 hours, which limited analysis. Investigators relied on retrospective data for medication administration and diagnoses.
Implications
Further work is needed to understand and address the expectations of clinicians, patients, and families regarding the role of antimicrobials at the end of life.
COMMUNICATION AND DECISION MAKING
Video Decision Aids Improved Rates of Advance Care Planning and Hospice Use and Decreased Costs
Volandes, AE, Paasche-Orlow MK, Davis AD et al. Use of video decision aids to promote advance care planning in Hilo, Hawai‘i. J Gen Intern Med. 2016;31(9):1035-1040.
Background
Advance care planning (ACP) can be enhanced with the use of video decision aids, which may help address scalability and cost.11 The Hawaii Medical Service Association began an initiative to improve ACP rates, which included a financial incentive. Clinician training and patient access to ACP videos were implemented 1 year into this campaign, which was intended for patients with late-stage disease.
Findings
This study tested the impact of the video intervention on the rates of ACP documentation in Hilo, Hawaii, along with secondary outcomes of hospice use, hospital deaths, and costs. The intervention was sequentially rolled out to Hilo Medical Center (HMC), followed by hospice and primary care practices. Following the video introduction, the proportion of patients discharged from HMC with ACP documentation markedly increased (3.2% to 39.9%; P < .001). The percentage of hospital patients discharged to hospice increased from 5.7% to 13.8% (P < .001). Overall admissions to the Hospice of Hilo increased at a greater rate than in other parts of Hawaii. After the intervention in Hilo, the in-hospital death rate among patients >65 years old declined slightly (P = .14), while in the rest of the state, the rate remained essentially unchanged. ACP planning did not reduce healthcare costs at the end of life, but costs seemed to increase more slowly in Hilo after the intervention than they did in the rest of Hawaii (P < .05).
Cautions
This report relies on before-and-after comparisons, with potential confounding by a background pay-for-quality initiative; however, the timing of the changes in outcomes correlates well with the introduction of the videos. ACP videos have been studied in other settings, so the intervention is likely generalizable to other states.
Implications
A widespread distribution of ACP videos and training for physicians in their use may lead to significant increases in ACP documentation and other beneficial clinical outcomes for patients and health systems.
A Standardized Palliative Care-Led Intervention Did Not Improve Psychological Outcomes in Families of Patients with Chronic Critical Illness
Carson SS, Cox CE, Wallenstein S, et al. Effect of palliative care-led meetings for families of patients with chronic critical illness: a randomized clinical trial. JAMA. 2016;316(1):51-62.
Background
Chronic critical illness (CCI) occurs when a patient neither recovers nor dies for days to weeks after an acute illness requiring aggressive intensive care. CCI is associated with poor patient and family outcomes.12 Does a protocol-driven support and information meeting led by PC providers improve these outcomes?
Findings
This multicenter RCT compared 130 CCI patients (184 surrogates) who received a structured intervention to 126 patients (181 surrogates) with usual care. The structured intervention was led by PC clinicians in order to provide supportive conversations and information about CCI and prognosis compared with the usual intensivist communication. The support and information team met with the families of patients in the intervention group after day 7 of mechanical ventilation (MV) and again 10 days later. Both the intervention and control groups received validated information about CCI, and all were eligible for specialty PC consultation, as indicated. The primary outcome of the study was the Hospital Anxiety and Depression Scale (HADS) at 90-day follow-up with the surrogates. Secondary endpoints included posttraumatic stress disorder (PTSD) assessment and other communication measures as well as patient outcomes (hospital mortality, 90-day survival, length of stay, and days of MV). At least 1 meeting took place for 89% of patients (82% of surrogates) in the intervention arm. Fewer patients in the intervention arm had nonstudy PC consultations (13% vs 22%). Ninety-day HADS results were similar in the 2 groups. PTSD symptoms, however, were higher in the intervention group (Impact of Event Scale-Revised score: 25.9 for intervention and 21.3 for control; intergroup difference 4.6 [95% confidence interval, 0.01-9.10]). There were no statistically significant differences among the patient-focused measures, including survival.
Cautions
Although the teams contained skilled clinicians led by PC practitioners, this was not an ordinary PC intervention. The intervention included information and emotional support meetings alone rather than support from a PC team driven by clinical considerations. This study included surrogates of patients with CCI but not other conditions.
Implications
Protocol-driven support and information meetings may not improve, and may slightly worsen, outcomes in families of patients with CCI. This study did not evaluate and should not be applied to clinically indicated, specialty PC consultation in the ICU.
CAREGIVER OUTCOMES
Caregivers of Patients Surviving Prolonged Critical Illness Experience High and Persistent Rates of Depression
Cameron JI, Chu LM, Matte A, et al. One-year outcomes in caregivers of critically ill patients. N Engl J Med. 2016;374(19):1831-1841.
Background
More than half of patients with a CCI require caregiver support 1 year after hospitalization.13 Caregivers provide tremendous physical and psychosocial support to their loved ones, but that care is often associated with significant burden.14
Findings
This prospective parallel cohort study followed caregivers of surviving patients ventilated for at least 7 days from 10 academic hospitals in Canada. The prevalence of depression (Center for Epidemiologic Studies–Depression scale ≥16) in this cohort of 280 caregivers (70% were women) was 67%, 49%, 43%, and 43% at the survey intervals of 7 days, 3 months, 6 months, and 12 months after ICU discharge, respectively. Using latent-class linear mixed models, the investigators identified 2 groups of caregivers: those whose depressive symptoms decreased over time (84%) and those whose depressive symptoms persisted at a high level for the year (16%). Patient characteristics (such as age, comorbidity, sex, and functional status) were not associated with caregiver outcomes. Younger caregiver age, greater effect of patient care on other activities, less social support, less mastery (sense of control), and less personal growth were associated with worse caregiver mental health outcomes.
Cautions
Although this is a high-quality prospective study, causality of caregiving on the high rates of depressive symptoms cannot be confirmed without a control group or knowledge of the caregivers’ mental health status prior to the episode of prolonged critical illness.
Implications
Patient critical illness may have serious impacts on caregiver health and well-being. Hospitalists should be attentive to factors associated with caregiver vulnerability and offer support. Improving caregivers’ sense of control and social support may be targets for interventions.
People with Non-normative Sexuality or Gender Face Additional Barriers and Stressors with Partner Loss
Bristowe K, Marshall S, Harding R. The bereavement experiences of lesbian, gay, bisexual and/or trans* people who have lost a partner: A systematic review, thematic synthesis and modelling of the literature. Palliat Med. 2016;30(8):730-744.
Background
Grief and bereavement impact individuals differently as they adjust to a death. Increasingly, it is recognized that lesbian, gay, bisexual, and/or transgender (LGBT) communities may face additional barriers when interacting with the healthcare system. This review sought to identify and appraise the evidence of the bereavement experiences among LGBT communities.
Findings
This systematic review summarized quantitative and qualitative data from 23 articles (13 studies). The synthesis noted that the pain associated with the loss of a partner was a universal experience regardless of sexual identity or gender history. Additional barriers and stressors of bereavement were reported for LGBT people, including homophobia, failure to acknowledge the relationship, additional legal and financial issues, and the shadow of human immunodeficiency virus (HIV) or acquired immunodeficiency syndrome (AIDS). LGBT people turned to additional resources for bereavement help: professional support, social and familial support, and societal and community support. Caregiver bereavement support experiences were shaped by whether the relationships were disclosed and accepted (acceptance-disclosure model).
Cautions
The quantitative data was mostly from the 1990s and described the context of HIV/AIDS. The qualitative studies, however, were done in the last decade. Very little research was available for transgender or bisexual caregivers.
Implications
People who identify as LGBT face additional barriers and stressors with the loss of a partner. The described acceptance-disclosure model may help providers be mindful of the additional barriers to LGBT bereavement support.
MORAL DISTRESS AND RESILIENCY
Physician Trainees Experience Significant Moral Distress with Futile Treatments
Dzeng E, Colaianni A, Roland M, et al. Moral distress amongst American physician trainees regarding futile treatments at the end of life: a qualitative study. J Gen Intern Med. 2016;31(1):93-99.
Background
Physician trainees are often faced with ethical challenges in providing end-of-life care. These ethical challenges can create confusion and conflict about the balance between the benefits and burdens experienced by patients.
Findings
The authors used semistructured, in-depth, qualitative interviews of 22 internal medicine trainees from 3 academic medical centers. An analysis of these interviews revealed several themes. Trainees reported moral distress when (1) many of the treatments provided in end-of-life care (ie, feeding tubes in advanced dementia) were perceived to be futile; (2) they felt obligated to provide end-of-life care that was not in the patient’s best interest, leading to “torture” or “suffering” for the patient; (3) they provided care they felt not to be in the patient’s best interest; (4) they perceived themselves to be powerless to affect change in these dilemmas; (5) they attributed some of their powerlessness to the hierarchy of their academic institutions; and (6) they feared that dehumanization and cynicism would be required to endure this distress.
Cautions
Resident recruitment occurred by solicitation, which may invite bias. Generalizability of qualitative studies to other settings can be limited.
Implications
Trainees may experience several dimensions of moral distress in end-of-life care. These findings challenge training programs to find ways to reduce the dehumanization, sense of powerlessness, and cynicism that this distress may cause.
Disclosure
The authors declare that they have no relevant financial conflicts of interest.
1. Morrison RS, Meier DE. Palliative care. N Engl J Med. 2004;350:2582-2590. PubMed
2. Quill TE, Abernethy AP. Generalist plus specialist palliative care—creating a more sustainable model. N Engl J Med. 2013;368(13):1173-1175. PubMed
3. Meier DE. Palliative care in hospitals. J Hosp Med. 2006;1:21-28. PubMed
4. Society of Hospital Medicine. Palliative care. J Hosp Med. 2006;1,S1:80-81.
5. Hosie A, Davidson PM, Agar M, Sanderson CR, Phillips J. Delirium prevalence, incidence, and implications for screening in specialist palliative care inpatient settings: a systematic review. Palliat Med. 2013;27(6):486-493. PubMed
6. Carnes M, Howell T, Rosenberg M, Francis J, Hildebrand C, Knuppel J. Physicians vary in approaches to the clinical management of delirium. J Am Geriatr Soc. 2003;51(2):234-239. PubMed
7. Neufeld KJ, Yue J, Robinson TN, Inouye SK, Needham DM. Antipsychotic medication for prevention and treatment of delirium in hospitalized adults: a systematic review and meta-analysis. J Am Geriatr Soc. 2016;64(4):705-14. PubMed
8. WHO. Cancer Pain Relief. 2nd ed. Geneva, Switzerland: WHO; 1996.
9. Leppert W. The role of methadone in cancer pain treatment—a review. Int J Clin Pract. 2009;63(7):1095-1109. PubMed
10. Morley JS, Bridson J, Nash TP, et al. Low-dose methadone has an analgesic effect in neuropathic pain: a double-blind randomized controlled crossover trial. Palliat Med. 2003;17(7):576-587. PubMed
11. Institute of Medicine. Dying in America: Improving Quality and Honoring Individual Preferences Near the End of Life. Washington, DC: The National Academies Press; 2014.
12. Nelson JE, Cox CE, Hope AA, Carson SS. Chronic Critical Illness. Am J Respir Crit Care Med. 2010;182(4):446-454. PubMed
13. Chelluri L, Im KA, Belle SH, et al. Long-term mortality and quality of life after prolonged mechanical ventilation. Crit Care Med. 2004;32(1):61-9. PubMed
14. Van Beusekom I, Bakhshi-Raiez F, deKeizer NF, Dongelmans DA, van der Schaaf M. Reported burden on informal caregivers of ICU survivors: a literature review. Crit Care. 2015;20:16. PubMed
The aim of palliative care (PC) is to improve quality of life for patients facing serious, life-threatening illness and their families.1 Due to insufficient numbers of PC specialists to meet the PC needs for every hospitalized patient,2 all hospitalists should maintain basic PC skills as recognized by PC being a core competency for hospitalists.3,4
We summarize and critique PC research articles published between January 1, 2016, and December 31, 2016, that have a high likelihood of impacting the practice of hospital medicine. We hand searched 15 journals and conducted a MEDLINE keyword search of PC terms (see Table). All titles and/or abstracts were reviewed and selected for full review based on the following factors: palliative medicine content, scientific rigor, impact on practice, and relevance to hospital medicine. Fifty-five articles were individually reviewed and scored by all authors according to rigor, impact, and relevance. Articles were ranked according to their mean scores, and 9 articles were chosen for inclusion through consensus discussion.
SYMPTOM MANAGEMENT
Antipsychotics Were Inferior to a Placebo in Treating Nonterminal Delirium
Agar MR, Lawlor PG, Quinn S, et al. Efficacy of oral risperidone, haloperidol, or placebo for symptoms of delirium among patients in palliative care: a randomized clinical trial. JAMA Intern Med. 2017;177(1):34-42.
Background
Delirium is highly prevalent in PC and is associated with significant distress.5 Antipsychotics are widely used for symptoms of delirium, although current evidence does not support this practice in hospitalized adults.6,7
Findings
This was a double-blind, parallel-arm, placebo randomized controlled trial (RCT) of 247 patients with delirium with an estimated life expectancy of ≥7 days in 11 PC or hospice units across Australia. Patients were randomized to receive risperidone, haloperidol, or a placebo in addition to nonpharmacological management of delirium. Delirium symptom scores after 3 days of treatment, the use of midazolam as a rescue medication, and the presence of extrapyramidal symptoms (EPS) were measured. The risperidone and haloperidol arms had significantly higher delirium symptom scores (P = .02 and P = .009, respectively), mean EPS symptoms (P < .001), and more use of rescue midazolam than the placebo arm. Mortality was higher for antipsychotics, with a hazard ratio of 1.73 for haloperidol (P = .003), 1.29 for risperidone (P = .14), and 1.47 for any antipsychotic (P = .01).
Cautions
The study population was elderly (mean age >70 years) with mild delirium scores. The use of antipsychotics was associated with more benzodiazepine use, which could itself worsen delirium. As patients with clinician-predicted life expectancy of <7 days were excluded, findings cannot be extrapolated to the treatment of terminal delirium, which can often be more symptomatic and difficult to treat.
Implications
Avoid scheduled antipsychotics in patients with nonterminal delirium, as they can increase risk of harm without advantages, over nonpharmacologic interventions.
Low-Dose Morphine Was Superior to Weak Opioids in the Treatment of Moderate Cancer Pain
Bandieri E, Romero M, Ripamonti CI, et al. Randomized trial of low-dose morphine versus weak opioids in moderate cancer pain. J Clin Oncol. 2016;34(5):436-442.
Background
The World Health Organization guidelines recommend the use of weak opioids (WOs), such as codeine or tramadol, as a sequential step in the management of cancer pain.8 This strategy has not been tested against low doses of stronger opioids.
Findings
In this multicenter, open-label RCT, 240 patients in Italy were randomized and stratified by age (<75 years or ≥75 years) to either the WO group or low-dose morphine (M) group. The primary outcome measure was a reduction in pain intensity by 20% or more. Secondary outcomes included an improvement in symptom scores, a ≥30% and ≥50% reduction in pain, increased opioid dosage, and adverse side effects. Compared with the WO group, the M group had more patients with a 20% reduction in pain (88.2% vs 54.7%; P < .001), more evidence of pain control in the first week (80.9% vs 43.6%; P < .001), more patients with a ≥30% and ≥50% reduction in pain, and less need to switch to a stronger opioid (15.5% vs 35.0%; P = .001) or require dose increases. Adverse effects were similar in both groups.
Cautions
Patients with chronic kidney disease (CKD) were excluded due to concerns about the accumulation of morphine metabolites. Additionally, this study was open label, increasing the risk of bias.
Implications
Low-dose morphine should be considered over the use of WOs to achieve better and more rapid pain control in patients without CKD.
The Use of Methadone as a Coanalgesic May Improve Moderate Cancer Pain
Courtemanche F, Dao D, Gagné F, et al. Methadone as a coanalgesic for palliative care cancer patients. J Palliat Med. 2016;19(9):972-978.
Background
Methadone is effective at treating cancer pain and is often utilized when patients have neuropathic pain, fail to respond to traditional opioids, or have renal failure.9,10 However, its long half-life and many drug interactions make methadone challenging to use.
Findings
This cohort study looked at 153 inpatient or outpatient PC patients in Montreal who received methadone as a coanalgesic for cancer pain. The patients’ median morphine equivalent dose was 120 mg when initiating methadone. The median starting dose of methadone was 3 mg per day. Of patients, 49.3% had a significant response (≥30% pain reduction), with a median response time of 7 days, and 30.1% achieved a substantial response (≥50% pain reduction), with a median response time of 3 days. Patients with higher initial pain scores were more likely to respond to adjuvant methadone. Those who had not responded after a week of methadone were unlikely to respond despite dose escalations. Adverse effects included drowsiness (51.4%), confusion (27.4%), constipation (24.7%), nausea (19.9%), and myoclonia (16.4%).
Cautions
This was an observational study with retrospective data, leading to higher levels of missing data. A high rate of adverse side effects was reported (90.4%). Further study is needed to validate and reproduce the findings.
Implications
The use of adjuvant low-dose methadone may be considered in patients with moderate pain despite high-dose opioids. If a response is not seen within 7 days, then methadone use should be reconsidered.
ANTIBIOTIC STEWARDSHIP
Many Hospitalized Patients on Comfort Care Still Receive Antimicrobials
Merel SE, Meier CA, McKinney CM, Pottinger PS. Antimicrobial use in patients on a comfort care protocol: a retrospective cohort study. J Palliat Med. 2016;19(11):1210-1214.
Background
It is unknown how often patients who are hospitalized at the end of life continue to receive antimicrobials and what factors are associated with antimicrobial use.
Findings
This retrospective cohort study of 1881 hospitalized adults transitioned to a comfort care order (CCO) set at 2 academic medical centers found that 77% of these patients received antimicrobials during their hospital stay (62.4% at 24 hours prior to CCO). Of the 711 still alive at ≥24 hours after CCO, 111 (15.6%) were still on antimicrobials, with that proportion remaining stable for the remainder of hospitalization. In comparing those who did and did not receive antimicrobials after 24 hours of CCO, the presence of a documented infection was not significantly different after adjusting for age. Those with a cancer diagnosis (adjusted risk ratio [ARR] = 1.44: P = .04), a longer length of stay (≥7 days vs <7 days; ARR = 1.49; P = .05), and those discharged home (ARR 2.93; P < .001) or to a facility (ARR 3.63; P < .001) versus dying in the hospital were more likely to be on antimicrobials 24 hours after CCO. Compared with those on a medicine service, patients in the medical and surgical intensive care units (ICUs) were less likely to receive antimicrobials (medical ICU ARR = 0.32; P = .01; surgical ICU and/or neuro-ICU ARR = 0.32; P = .02). The most commonly administered antimicrobials were fluoroquinolones and vancomycin.
Cautions
Only 111 patients were still on antimicrobials at 24 hours, which limited analysis. Investigators relied on retrospective data for medication administration and diagnoses.
Implications
Further work is needed to understand and address the expectations of clinicians, patients, and families regarding the role of antimicrobials at the end of life.
COMMUNICATION AND DECISION MAKING
Video Decision Aids Improved Rates of Advance Care Planning and Hospice Use and Decreased Costs
Volandes, AE, Paasche-Orlow MK, Davis AD et al. Use of video decision aids to promote advance care planning in Hilo, Hawai‘i. J Gen Intern Med. 2016;31(9):1035-1040.
Background
Advance care planning (ACP) can be enhanced with the use of video decision aids, which may help address scalability and cost.11 The Hawaii Medical Service Association began an initiative to improve ACP rates, which included a financial incentive. Clinician training and patient access to ACP videos were implemented 1 year into this campaign, which was intended for patients with late-stage disease.
Findings
This study tested the impact of the video intervention on the rates of ACP documentation in Hilo, Hawaii, along with secondary outcomes of hospice use, hospital deaths, and costs. The intervention was sequentially rolled out to Hilo Medical Center (HMC), followed by hospice and primary care practices. Following the video introduction, the proportion of patients discharged from HMC with ACP documentation markedly increased (3.2% to 39.9%; P < .001). The percentage of hospital patients discharged to hospice increased from 5.7% to 13.8% (P < .001). Overall admissions to the Hospice of Hilo increased at a greater rate than in other parts of Hawaii. After the intervention in Hilo, the in-hospital death rate among patients >65 years old declined slightly (P = .14), while in the rest of the state, the rate remained essentially unchanged. ACP planning did not reduce healthcare costs at the end of life, but costs seemed to increase more slowly in Hilo after the intervention than they did in the rest of Hawaii (P < .05).
Cautions
This report relies on before-and-after comparisons, with potential confounding by a background pay-for-quality initiative; however, the timing of the changes in outcomes correlates well with the introduction of the videos. ACP videos have been studied in other settings, so the intervention is likely generalizable to other states.
Implications
A widespread distribution of ACP videos and training for physicians in their use may lead to significant increases in ACP documentation and other beneficial clinical outcomes for patients and health systems.
A Standardized Palliative Care-Led Intervention Did Not Improve Psychological Outcomes in Families of Patients with Chronic Critical Illness
Carson SS, Cox CE, Wallenstein S, et al. Effect of palliative care-led meetings for families of patients with chronic critical illness: a randomized clinical trial. JAMA. 2016;316(1):51-62.
Background
Chronic critical illness (CCI) occurs when a patient neither recovers nor dies for days to weeks after an acute illness requiring aggressive intensive care. CCI is associated with poor patient and family outcomes.12 Does a protocol-driven support and information meeting led by PC providers improve these outcomes?
Findings
This multicenter RCT compared 130 CCI patients (184 surrogates) who received a structured intervention to 126 patients (181 surrogates) with usual care. The structured intervention was led by PC clinicians in order to provide supportive conversations and information about CCI and prognosis compared with the usual intensivist communication. The support and information team met with the families of patients in the intervention group after day 7 of mechanical ventilation (MV) and again 10 days later. Both the intervention and control groups received validated information about CCI, and all were eligible for specialty PC consultation, as indicated. The primary outcome of the study was the Hospital Anxiety and Depression Scale (HADS) at 90-day follow-up with the surrogates. Secondary endpoints included posttraumatic stress disorder (PTSD) assessment and other communication measures as well as patient outcomes (hospital mortality, 90-day survival, length of stay, and days of MV). At least 1 meeting took place for 89% of patients (82% of surrogates) in the intervention arm. Fewer patients in the intervention arm had nonstudy PC consultations (13% vs 22%). Ninety-day HADS results were similar in the 2 groups. PTSD symptoms, however, were higher in the intervention group (Impact of Event Scale-Revised score: 25.9 for intervention and 21.3 for control; intergroup difference 4.6 [95% confidence interval, 0.01-9.10]). There were no statistically significant differences among the patient-focused measures, including survival.
Cautions
Although the teams contained skilled clinicians led by PC practitioners, this was not an ordinary PC intervention. The intervention included information and emotional support meetings alone rather than support from a PC team driven by clinical considerations. This study included surrogates of patients with CCI but not other conditions.
Implications
Protocol-driven support and information meetings may not improve, and may slightly worsen, outcomes in families of patients with CCI. This study did not evaluate and should not be applied to clinically indicated, specialty PC consultation in the ICU.
CAREGIVER OUTCOMES
Caregivers of Patients Surviving Prolonged Critical Illness Experience High and Persistent Rates of Depression
Cameron JI, Chu LM, Matte A, et al. One-year outcomes in caregivers of critically ill patients. N Engl J Med. 2016;374(19):1831-1841.
Background
More than half of patients with a CCI require caregiver support 1 year after hospitalization.13 Caregivers provide tremendous physical and psychosocial support to their loved ones, but that care is often associated with significant burden.14
Findings
This prospective parallel cohort study followed caregivers of surviving patients ventilated for at least 7 days from 10 academic hospitals in Canada. The prevalence of depression (Center for Epidemiologic Studies–Depression scale ≥16) in this cohort of 280 caregivers (70% were women) was 67%, 49%, 43%, and 43% at the survey intervals of 7 days, 3 months, 6 months, and 12 months after ICU discharge, respectively. Using latent-class linear mixed models, the investigators identified 2 groups of caregivers: those whose depressive symptoms decreased over time (84%) and those whose depressive symptoms persisted at a high level for the year (16%). Patient characteristics (such as age, comorbidity, sex, and functional status) were not associated with caregiver outcomes. Younger caregiver age, greater effect of patient care on other activities, less social support, less mastery (sense of control), and less personal growth were associated with worse caregiver mental health outcomes.
Cautions
Although this is a high-quality prospective study, causality of caregiving on the high rates of depressive symptoms cannot be confirmed without a control group or knowledge of the caregivers’ mental health status prior to the episode of prolonged critical illness.
Implications
Patient critical illness may have serious impacts on caregiver health and well-being. Hospitalists should be attentive to factors associated with caregiver vulnerability and offer support. Improving caregivers’ sense of control and social support may be targets for interventions.
People with Non-normative Sexuality or Gender Face Additional Barriers and Stressors with Partner Loss
Bristowe K, Marshall S, Harding R. The bereavement experiences of lesbian, gay, bisexual and/or trans* people who have lost a partner: A systematic review, thematic synthesis and modelling of the literature. Palliat Med. 2016;30(8):730-744.
Background
Grief and bereavement impact individuals differently as they adjust to a death. Increasingly, it is recognized that lesbian, gay, bisexual, and/or transgender (LGBT) communities may face additional barriers when interacting with the healthcare system. This review sought to identify and appraise the evidence of the bereavement experiences among LGBT communities.
Findings
This systematic review summarized quantitative and qualitative data from 23 articles (13 studies). The synthesis noted that the pain associated with the loss of a partner was a universal experience regardless of sexual identity or gender history. Additional barriers and stressors of bereavement were reported for LGBT people, including homophobia, failure to acknowledge the relationship, additional legal and financial issues, and the shadow of human immunodeficiency virus (HIV) or acquired immunodeficiency syndrome (AIDS). LGBT people turned to additional resources for bereavement help: professional support, social and familial support, and societal and community support. Caregiver bereavement support experiences were shaped by whether the relationships were disclosed and accepted (acceptance-disclosure model).
Cautions
The quantitative data was mostly from the 1990s and described the context of HIV/AIDS. The qualitative studies, however, were done in the last decade. Very little research was available for transgender or bisexual caregivers.
Implications
People who identify as LGBT face additional barriers and stressors with the loss of a partner. The described acceptance-disclosure model may help providers be mindful of the additional barriers to LGBT bereavement support.
MORAL DISTRESS AND RESILIENCY
Physician Trainees Experience Significant Moral Distress with Futile Treatments
Dzeng E, Colaianni A, Roland M, et al. Moral distress amongst American physician trainees regarding futile treatments at the end of life: a qualitative study. J Gen Intern Med. 2016;31(1):93-99.
Background
Physician trainees are often faced with ethical challenges in providing end-of-life care. These ethical challenges can create confusion and conflict about the balance between the benefits and burdens experienced by patients.
Findings
The authors used semistructured, in-depth, qualitative interviews of 22 internal medicine trainees from 3 academic medical centers. An analysis of these interviews revealed several themes. Trainees reported moral distress when (1) many of the treatments provided in end-of-life care (ie, feeding tubes in advanced dementia) were perceived to be futile; (2) they felt obligated to provide end-of-life care that was not in the patient’s best interest, leading to “torture” or “suffering” for the patient; (3) they provided care they felt not to be in the patient’s best interest; (4) they perceived themselves to be powerless to affect change in these dilemmas; (5) they attributed some of their powerlessness to the hierarchy of their academic institutions; and (6) they feared that dehumanization and cynicism would be required to endure this distress.
Cautions
Resident recruitment occurred by solicitation, which may invite bias. Generalizability of qualitative studies to other settings can be limited.
Implications
Trainees may experience several dimensions of moral distress in end-of-life care. These findings challenge training programs to find ways to reduce the dehumanization, sense of powerlessness, and cynicism that this distress may cause.
Disclosure
The authors declare that they have no relevant financial conflicts of interest.
1. Morrison RS, Meier DE. Palliative care. N Engl J Med. 2004;350:2582-2590. PubMed
2. Quill TE, Abernethy AP. Generalist plus specialist palliative care—creating a more sustainable model. N Engl J Med. 2013;368(13):1173-1175. PubMed
3. Meier DE. Palliative care in hospitals. J Hosp Med. 2006;1:21-28. PubMed
4. Society of Hospital Medicine. Palliative care. J Hosp Med. 2006;1,S1:80-81.
5. Hosie A, Davidson PM, Agar M, Sanderson CR, Phillips J. Delirium prevalence, incidence, and implications for screening in specialist palliative care inpatient settings: a systematic review. Palliat Med. 2013;27(6):486-493. PubMed
6. Carnes M, Howell T, Rosenberg M, Francis J, Hildebrand C, Knuppel J. Physicians vary in approaches to the clinical management of delirium. J Am Geriatr Soc. 2003;51(2):234-239. PubMed
7. Neufeld KJ, Yue J, Robinson TN, Inouye SK, Needham DM. Antipsychotic medication for prevention and treatment of delirium in hospitalized adults: a systematic review and meta-analysis. J Am Geriatr Soc. 2016;64(4):705-14. PubMed
8. WHO. Cancer Pain Relief. 2nd ed. Geneva, Switzerland: WHO; 1996.
9. Leppert W. The role of methadone in cancer pain treatment—a review. Int J Clin Pract. 2009;63(7):1095-1109. PubMed
10. Morley JS, Bridson J, Nash TP, et al. Low-dose methadone has an analgesic effect in neuropathic pain: a double-blind randomized controlled crossover trial. Palliat Med. 2003;17(7):576-587. PubMed
11. Institute of Medicine. Dying in America: Improving Quality and Honoring Individual Preferences Near the End of Life. Washington, DC: The National Academies Press; 2014.
12. Nelson JE, Cox CE, Hope AA, Carson SS. Chronic Critical Illness. Am J Respir Crit Care Med. 2010;182(4):446-454. PubMed
13. Chelluri L, Im KA, Belle SH, et al. Long-term mortality and quality of life after prolonged mechanical ventilation. Crit Care Med. 2004;32(1):61-9. PubMed
14. Van Beusekom I, Bakhshi-Raiez F, deKeizer NF, Dongelmans DA, van der Schaaf M. Reported burden on informal caregivers of ICU survivors: a literature review. Crit Care. 2015;20:16. PubMed
© 2017 Society of Hospital Medicine