User login
Impact of Drug Shortages on Patient Safety and Pharmacy Operation Costs
Drug product shortages threaten health care quality and public health by creating barriers to optimal care. The frequency of drug shortages has risen dramatically since 2005 and now influences broad areas of health care practice. More than 400 generic drug products have been affected, forcing institutions to purchase costly brand-name products, substitute alternative therapies, or procure from gray market vendors at increased institutional costs.1 Scarcity and cost have potential to negatively impact patient outcomes and the ability of health care organizations to respond to the needs of their patients.
Background
Although constantly fluctuating, the number of active shortages reached a height of 320 products at the end the third quarter of 2014.2 A 2011 analysis from Premier Healthcare Alliance estimated the added cost of purchasing brand, generic, or alternative drugs due to shortage may have inflated hospital costs by $200 million annually.1 In 2016, the number of active shortages dropped to 176, suggesting a downward trend. However, the drug supply chain remains a concern for pharmacies in the U.S.
Despite creative approaches to shortage management, the variable characteristics of shortages make planning difficult. For example, the drug product in short supply may or may not have an alternative for use in similar clinical scenarios. The impact of shortages of medications lacking an equivalent alternative product has been documented, such as the past shortage of succinylcholine for anesthesia, resulting in surgery cancellations when an alternative paralytic agent was not appropriate.3 In 2016, the Cleveland Clinic reported undertaking “military-style triage” in determining patients who required use of aminocaproic acid during open heart surgery due to its limited supply.4 Decisions to reserve drug supply for emergency use and prefilling syringes under pharmacy supervision to extend stability and shelf life are short-term solutions to larger, systemic issues. Unfortunately, these scenarios have the potential to disrupt patient care and diminish health outcomes.
Shortages of products that have an available therapeutic substitution may seem easily manageable, but additional considerations may be present. Bacillus Calmette-Guérin (BCG) is considered the drug of choice for bladder cancer. In 2011, there was a shortage of the BCG vaccine after mold was discovered in the formulation.5 Providers were forced to choose between reducing or reallocating the dose of BCG, turning away patient, or substituting mitomycin C, which is less effective and costlier. When tamsulosin capsules became difficult to obtain in 2014, some institutions began switching patients to alfuzosin.6 Although alfuzosin is similar in mechanism to tamsulosin, it may prolong the QTc interval. Not only did this substitution present a contraindication for patients with elevated QTc intervals or who were already receiving concomitant medications that prolonged the QTc interval, but also it required additional cost and resources needed to update electrocardiograms.
VA Consolidated Mail Outpatient Pharmacies
The VHA serves nearly 9 million patients at more than 1,200 facilities across the U.S.7 This large patient population results in an estimated 149 million outpatient prescriptions annually.8 About 80% of these are distributed by mail through 7 VA consolidated mail outpatient pharmacies (CMOPs). When drug scarcity impedes the ability of the CMOP to respond to medication demand, the local facility must fill these prescriptions. These rejections sent back to the facility impact workload, patient wait times, and access to medication therapy. Barriers to medication procurement in the VA also stem from regulations based on legislation, including the Trade Agreements Act, Drug Supply Chain Security Act, and the Federal Acquisition Regulation (FAR) (Table). 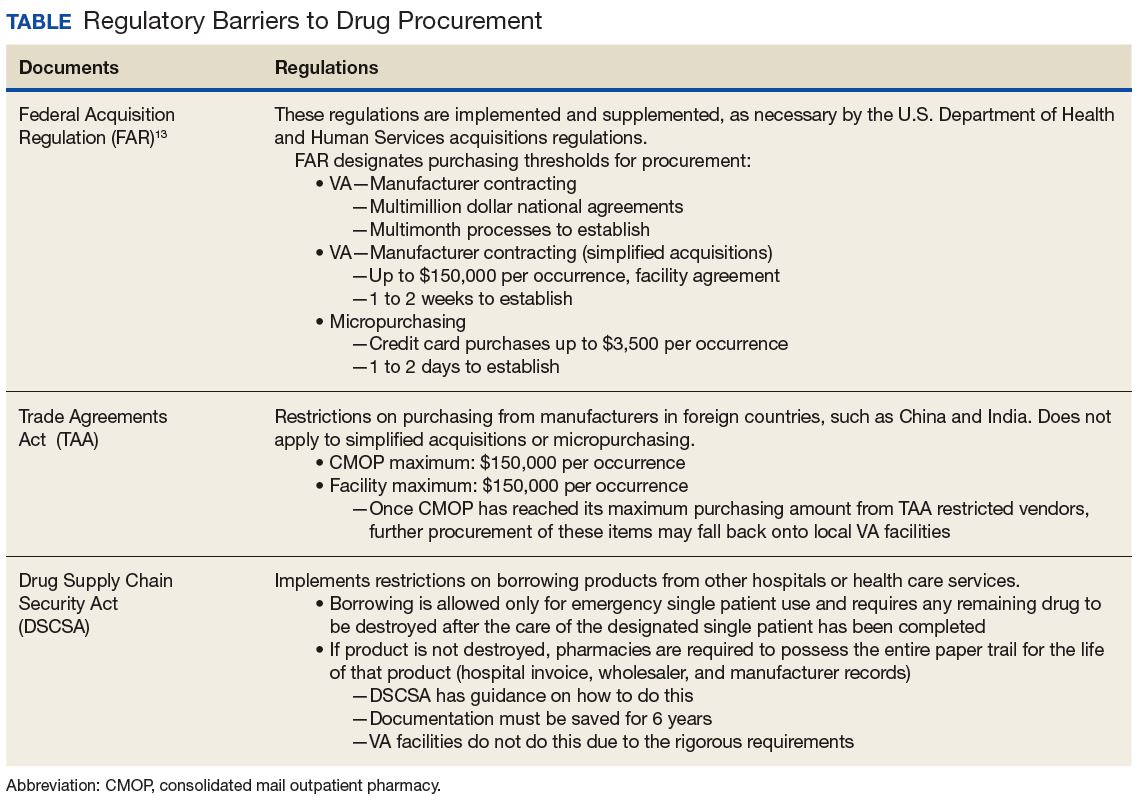
The impact of drug shortages has been described previously in the private sector, particularly for emergency medicine and chemotherapy.9,10 However, the impact of drug shortages on health care provision to veteran populations within the VA has not previously been analyzed. Due to the unique procurement regulations that influence the VA and the importance of continuing to provide optimal health care services to veterans, assessing the impact of drug shortages on patient safety and health care costs is necessary in informing policy decisions and guiding recommendations for mitigation strategies. The purpose of this study was to assess the influence of drug shortages on institutional costs and patient care within VA facilities and formulate recommendations for enhanced mitigation of this issue.
Methods
The primary outcome of this study was to characterize the impact of drug shortages on institutional cost and patient safety events among VHA facilities. Secondary outcomes included subgroup evaluation in reported drug shortage impact among 1a, 1b, and 1c complexity VA facility survey respondents and assessment of drug shortage impact on CMOP prescription order fulfillment and operation cost.
Definitions
The complexity ranking system is a facility grouping method used within the VA to characterize the level of service provision, teaching and research opportunities, patient volume, intensive care unit level, and other factors offered by a VA site. Rankings start from 1 (highest level of services offered) to 3 (lowest level of services offered), with level 1 facilities further divided into a, b, and c subdivisions. A level 1a facility will be larger with more services offered than a 1b, which is larger and offers more services than a 1c facility. The VA facilities are further characterized by regional distribution. Sites are grouped under VISNs of which there are currently 21.
The CMOP program was responsible for dispensing about 119 million outpatient prescriptions in 2016 and includes designated sites for the dispensing of controlled substances and supply items. The VA Pharmacy Benefits Management Service (PBM) oversees formulary management, plans national drug policy, promotes safe and appropriate drug therapy, and delivers high-quality and sustainable pharmacy benefits for veterans.
Study Design
A descriptive study was initiated to characterize the impact of drug shortages among VA facilities. An analysis of administrative medication safety event reporting and institutional costs data at the Denver VAMC in Colorado was done, focusing on predetermined drug products involved in a recent shortage. The analysis was accomplished through a review of the VA adverse drug events reporting system (VA ADERS) reports and a local medication errors quality improvement database and paper procurement records, respectively. Concurrently, a survey was disseminated among qualifying VA facilities across the country that sought to characterize the impact of drug shortages nationally.
Sample Selection
Denver VAMC. The Denver VAMC, where the authors were located, was selected as the local sample site. The intention was to compare the strategies used locally with strategies used among similar (level 1a, 1b, and 1c) facilities. Preselected “cost-impacting” drug products were identified through a review of historic shortages with a significant local impact. These drugs were defined as low cost/high utilization (eg, tamsulosin 0.4-mg capsules and ketorolac solution), medium cost/utilization (eg, piperacillin/tazobactam IV solutions and aminocaproic acid solution), and high cost/low utilization (eg, nitroprusside IV solution and BCG vaccine solution). Additionally, patient safety event data reported internally for quality improvement and locally via VA ADERS were reviewed for preselected “safety impact” drug products and included BCG vaccine, tamsulosin capsules, IV fluid products, calcium gluconate and chloride injections, and aminocaproic acid injection.
National Survey. The authors identified 84 level 1 complexity facilities and used the PBM pharmacy directory to contact the administrative personnel representing each facility. These representatives identified a point of contact to aid in survey completion. A separate survey also was sent to the CMOP facilities (survey outlines available at www.fedprac.com).
Data Collection
Denver VAMC. Financial data were sampled through a manual review of paper procurement records stored by date in the inpatient pharmacy of the Denver VAMC. Variables included units of product used over the period of drug shortage, cost per unit during shortage, and cost per unit before shortage. This information also was supplemented with data from the prescription processing software’s drug file. Patient safety data were gathered through query of the identified event reporting databases for the prespecified drug on shortage. These variables included the type of error and the effect the error had on the patient.
National Survey. Data collection focused on notable drug shortages and patient safety reporting between January 1, 2013 and December 31, 2016. The survey was maintained in a facility-specific spreadsheet. Editing capabilities were disabled for all actions other than responding to questions. Recipients were followed up with a courtesy e-mail after 2 weeks and another 2 times unless a survey was received. Data were de-identified and aggregated for analyses.
Statistical Analyses
Excel 2010 (Microsoft, Redmond, WA) descriptive statistics were used to relay information from this assessment. Extrapolations from procurement cost data and drug product utilization were used to estimate the enhanced direct cost associated with identified drug shortages. Similar extrapolations were used to estimate the cost associated with shortages leading to CMOP rejection and local fill.
Results
Survey completion totaled 20% of invited facilities (n = 17). Good geographic and VISN distribution was noted with representatives from VISNs 2, 4, 8, 9, 10, 12, 15, 16, 21, and 22. VISNs 10 and 12 provided the most representation with 3 participants, each. Level 1a facilities participated most (n = 9), followed by 1b (n = 6) and 1c (n = 2). Participating facilities reported a mean (SD) of 54 (21.5) pharmacists and 34 (15.3) pharmacy technician staff members employed. The most common reason for not participating was lack of personnel resources and competing demands. The CMOP participation was 100% (n = 7) and completed through a coordinated response.
Results of the budgetary increase and staff member time allocation survey assessments are provided (Figures 1 and 2). Five facilities provided an annual estimate of increased cost due to acquisition of drugs on shortage through open market purchases that ranged from about $150,000 to $750,000. Nearly half of the surveyed facilities endorsed having a drug shortage task force (n = 8) to respond to drug shortages and mitigate their impact. 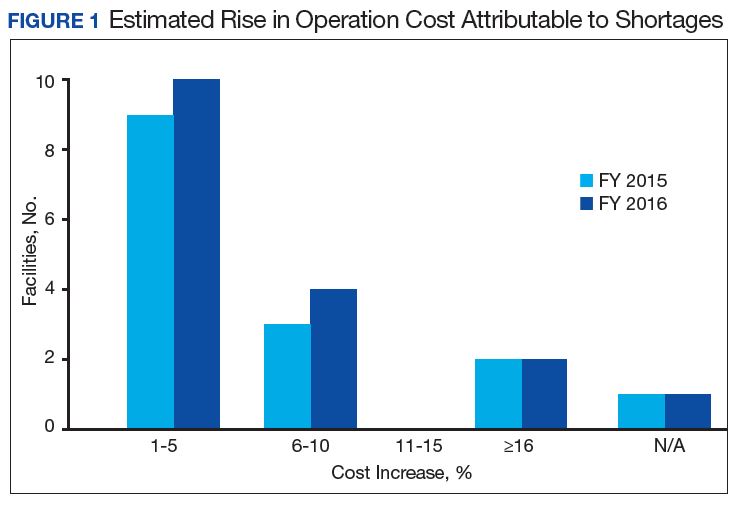
Regarding drug product allocation, only 2 facilities did not have current restrictions for use due to a shortage. Many had between 1 and 10 of these restrictions implemented to conserve supply (n = 11, 64%), 2 facilities reported 11 to 20 restrictions, and 2 facilities noted more than 30 restrictions. Similarly, 3 facilities had not needed to revise any current treatment protocols due to drug shortages. The majority of facilities had revised 1 to 5 current protocols (n = 12, 70%), 1 revised 6 to 10 protocols, and 1 facility revised more than 10 protocols.
In assessing patient safety concerns, 1 facility identified a history of transferring patients to alternative medical sites for the patients to obtain necessary medication impacted by a local shortage. Additionally, during the BCG vaccine shortage, 6 facilities (35.3%) substituted mitomycin C for the treatment of urinary bladder cancer.
Most participants either agreed (n = 8, 47.0%) or strongly agreed (n = 4, 23.5%) that modifications to FAR to increase purchasing opportunities from foreign distributors during drug shortage would help mitigate the impact of such shortages. Similarly, most participants agreed (n = 10, 58.8%) or strongly agreed (n = 3, 17.6%) that PBM guidance on drug shortage management would help efficiently and effectively respond to issues that might arise. The consensus of participants also agreed (n = 13, 76.5%) that organized collaborations or working groups within each VISN might help assist in drug shortage management.
The CMOP facility data revealed that 2 sites did not require dedicated staffing to respond to shortages, and 3 sites had not experienced cost increases because of shortages. Pharmacist use varied between sites, with 2 facilities using 1 to 10 pharmacist h/wk, and 1 facility using 11 to 20 pharmacist h/wk, and 1 facility using 21 to 30 pharmacist h/wk. Technician utilization was more pronounced, with 2 facilities using more than 30 technician h/wk, and 2 facilities using 1 to 10 technician h/wk. Workload and costs may have been influenced in other ways as 3 sites endorsed using overtime pay, shifting product responsibility between CMOPs, prolonging patient wait times, and close monitoring for each. In fiscal year 2015, some sites experienced a 1% to 5% (n = 2) and 6% to 10% (n = 1) increase in operation cost attributable to shortage. Results from fiscal year 2016 showed that some sites continued to see a 1% to 5% (n = 1) and 6% to 10% (n = 2) increase in operation cost attributable to shortage.
Through aggregation of CMOP responses on the number of prescriptions sent back to local facility for fill due to back order, a downward trend in the total number of rejections was seen over the 2.5 fiscal years assessed. This amounted to more than 1 million rejections in fiscal year 2015, about 788,000 rejections in 2016, and about 318,000 rejections through the first 2 quarters of 2017.
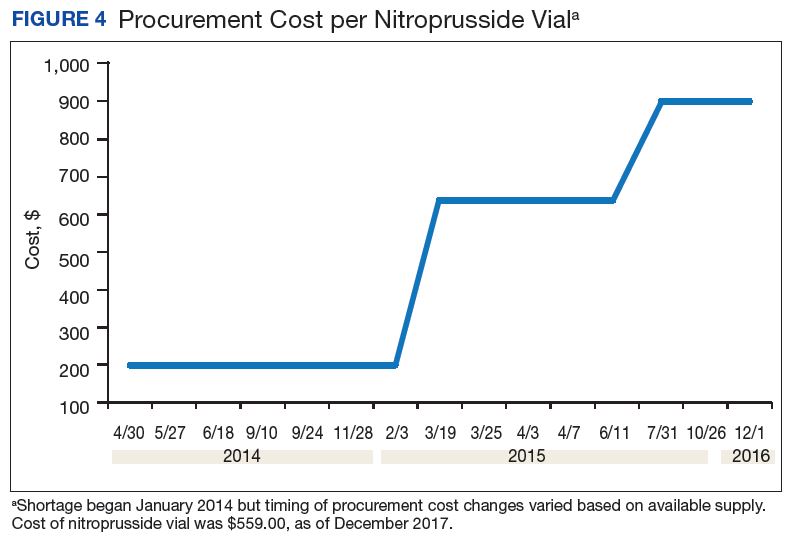
A consistent rise in the medication procurement budget requirement was characterized within the single VA facility review. The quarterly median increase was 2.7% over 2.5 years (min: -1.4%; max: 6.6%) for total outpatient medication costs, excluding hepatitis C antiviral therapies. Procurement cost records were insufficient to characterize historic expenditures for 4 of the prespecified drug products. The data collected on tamsulosin capsule and nitroprusside vial procurement during shortage is provided (Figures 3 and 4). Over the time frame of procurement records found on review, the added costs of nitroprusside vials and tamsulosin capsules were $22,766.09 (+167.9% of base cost) and $17,433.70 (+657.3% of base cost), respectively. No patient safety data were found on review. 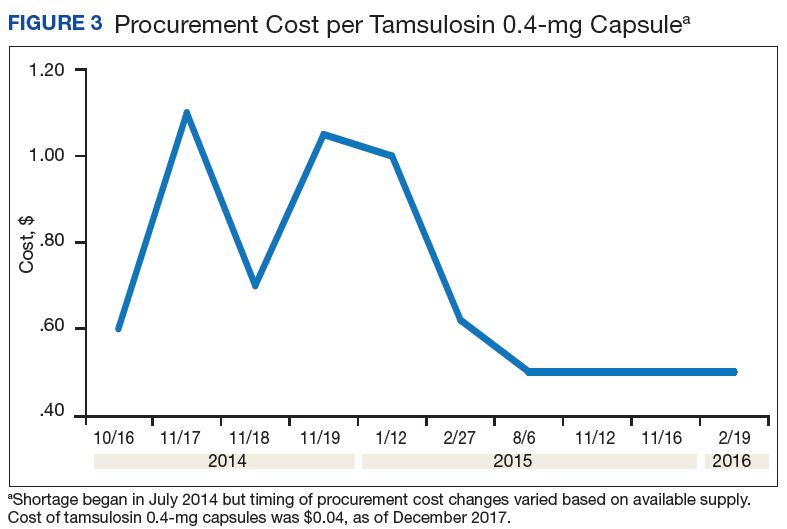
Discussion
Drug product shortages represent a barrier to quality and efficiency across health care institutions. A survey of health system pharmacies in the southeastern U.S. found that the majority of respondents tracking shortage data reported a 300% to 500% markup by alternative or gray market suppliers for hard-to-find medications.11 These reports are similar to the authors’ analyses of the trends in increased procurement expenditures documented during the tamsulosin capsule and nitroprusside vial shortages and indirectly correlate with the survey results indicating that most facilities endorsed a trend in operation cost increase attributable to drugs product shortage. The estimated annual costs for open market purchases further informs the financial burden aggregated by this issue.
Indirect costs from drug shortage further complicated quantifying the impact of shortages. Many facilities acknowledged the indirect influence drug shortages have on staffing and workload due to the implementation of mitigation strategies. Most participants found it necessary to establish restrictions for use in addition to altering protocols. These required the time investment of essential personnel from development through execution and education. Situations also can arise for mass therapeutic substitution. In this example, pharmacy staff may be required to oversee medication transition from the product on shortage to an appropriate alternative. When substitution involves hundreds or thousands of outpatient prescriptions, such as the tamsulosin shortage, the process may be tedious and time consuming, depending on the level of clinical decision making needed to determine patient candidacy for transitioning products.
Improving institutional cost efficiency becomes a significant challenge with persistent drug shortages. Professional advocacy groups, such as the American Society of Health-System Pharmacists (ASHP), help provide guidance to organizations constrained by specific drug shortages.12 Staff knowledgeable in allocation, supply considerations, and product repackaging and stability data also are essential. Other mitigation strategies include automatic substitutions, restrictions for use or inventory control strategies, and open market procurement, or borrowing from other institutions.
Data gathered from the survey of CMOP facilities also helped elucidate strategies used to mitigate drug shortage impacts for those respondents impacted by shortage. Likely, the 2 CMOP facilities without dedicated staff focused on shortages are those whose outpatient prescription fulfillment responsibility were focused on supply items or controlled substances. The impacted CMOP respondents cited overtime pay, shifting product responsibility, and prolonging patient wait times as the most frequently employed mitigation strategies. When these and other strategies fail to manage a shortage, prescriptions are often sent back to the local facility to be filled. Unfortunately for these facilities, the same mitigation strategies used by CMOP are not always feasible. Overtime pay may not be possible given staffing and budgetary resources, sending prescriptions back to facilities in itself prolongs patient wait times, and local medical centers do not have the option of shifting product responsibility between sites or sending the prescription to another facility. Herein lies 1 rationale for the CMOP effort to reduce the volume of prescriptions sent back to local medical centers.
Multiple offices within the FDA have roles in the mitigation of national drug shortages within their regulatory purview. Much of the recent focus stems from provisions enacted under Title X of the FDA Safety and Innovation Act of 2012, which addresses problems in the drug-supply chain.12 Rectifying a shortage involves short- and long-term strategic planning to address supply, distribution, and market reaction to need. Collaboration between the FDA and manufacturers is one method by which demand can be satisfied through the coordination of resources, expedition of inspections, and root cause analysis of the shortage.
Similar collaborations within the VA were viewed favorably by respondents and might yield productive relationships if regional or VISN working groups were to be established. Alternative long-term strategies are executed through regulation, particularly concerning the importation of foreign manufactured drugs and regulatory discretion on supplier vetting. Despite a strong respondent consensus that regulatory modifications of foreign product importation in the setting of a drug shortage may be beneficial, such a change would require a congressional action and is not likely to be timely. Unfortunately, gray market pharmaceutical distribution, driven by wholesaler stockpiling to raise prices, is separate from manufacturer driven shortages and falls outside the FDA’s regulatory purview and institutional mitigation strategies.
Although based on this limited survey, general agreement existed on the importance of greater national collaboration and communication regarding drug shortage management strategies. This could include PBM guidance on specific shortage management opportunities or establishing collaborations by region or VISN. These possibilities may be more realistically attainable in comparison to modifying federal regulations on drug product procurement during active shortages, which requires an act of Congress. Many of the survey participants endorsed a drug shortage task force within their facility. Coordinating interaction between preexisting or newly established task forces or working groups on a monthly or quarterly basis may provide fruitful interactions and the exchange of strategies to reduce shortage impact on institutional cost, efficiency, and patient care.
Limitations
Quantifying the extent of drug shortage impact on patient safety and institutional costs is a difficult task. The procurement records data used for the analysis of a single VAMC were gathered through manual review of stored paper invoices, opening the possibility for missing data. It is also difficult to extrapolate the sum of indirect costs such as process changes, alternative product utilization, and pharmacy staffing resources as additional financial burdens to the affected institution. Any quantifiable cost assessment also is biased by contract terms between the VA and wholesalers in which unavailable products that must be purchased off-contract are subsequently reimbursed through credit or alternative means.
Patient safety events are frequently underreported, leading to underestimation of true safety event incidence. Given that these events are documented by multiple disciplines and that many of these documenters may not be aware consistently of the drug products and volume impacted by shortage, elucidating safety events unfolding in relation to shortage also is difficult to quantify.
The response rate for the survey was low but near the expected rate for this methodology. Feedback from several facilities was received, citing competing demands and workforce shortage as barriers to participation. The survey also was limited by reporting bias and recall bias. As assessment of prespecified past drug shortages may require intimate knowledge of pharmacy department processes and mitigation strategies, the accuracy of question answering may have been limited to the length of time the points of contact had been in their current position.
Conclusion
Drug shortages are a pervasive barrier to patient care within larger facilities of the VA health care system, similar to what has been characterized in the private sector. As a result of these shortages and the mitigation strategies to reduce their burden, many facilities endorsed trends in increasing workload for staff, institutional operation costs, and risk for patient safety and care quality concerns. Due to the demands of shortages, some facilities have implemented drug shortage task forces or equivalent groups to specifically manage these issues. Moving forward, the VA health care system may benefit from similar task forces or working groups at the VISN level, to aid in collaborative efforts to respond to shortage. Support for revising federal regulations on procurement in times of shortage and enhanced PBM drug shortage management guidance also was endorsed.
1. Cherici C, Frazier J, Feldman M, et al. Navigating drug shortages in American healthcare: a premier healthcare alliance analysis. https://www.heartland.org/_template-assets/documents/publications/30103.pdf. Published March 2011. Accessed December 5, 2017.
2. American Society of Health-System Pharmacists. ASHP drug shortage statistics. https://www.ashp.org/Drug-Shortages/Shortage-Resources/Drug-Shortages-Statistics. Updated 2017. Accessed December 5, 2017.
3. Dooren JC. Most hospitals face drug shortages. The Wall Street Journal. http://www.wsj.com/articles/SB10001424052702304584404576442211187884744. Published July 13, 2011. Accessed December 5, 2017.
4. Fink S. Drug shortages forcing hard decisions on rationing treatment. The New York Times. http://www.nytimes.com/2016/01/29/us/drug-shortages-forcing-hard-decisions-on-rationing-treatments.html. Published January 29, 2016. Accessed December 5, 2017.
5. Loftus P. Drug shortages frustrate doctors, patients. The Wall Street Journal. http://www.wsj.com/articles/u-s-drug-shortages-frustrate-doctors-patients-1433125793. Published May, 31, 2015. Accessed December 5, 2017.
6. U.S. Food and Drug Administration. Strategic plan for preventing and mitigating drug shortages. http://www.fda.gov/downloads/Drugs/DrugSafety/DrugShortages/UCM372566.pdf. Published October 2013. Accessed August 22, 2016.
7. U.S. Department of Veteran Affairs, National Center for Veterans Analysis and Statistics. Quick facts. https://www.va.gov/vetdata/Quick_Facts.asp. Updated November 20, 2017. Accessed December 5, 2017.
8. U.S. Department of Veterans Affairs, Office of the Inspector General. Audit of Consolidated Mail Outpatient Pharmacy Program. https://www.va.gov/oig/pubs/VAOIG-15-05255-422.pdf. Accessed December 11, 2017.
9. Mazer-Amirshahi M, Pourmand A, Singer S, Pines JM, van den Anker J. Critical drug shortages: implications for emergency medicine. Acad Emerg Med. 2014;21(6):704-711.
10. McBride A, Holle LM, Westendorf C, et al. National survey on the effect of oncology drug shortages on cancer care. Am J Health Syst Pharm. 2013;70(7):609-617.
11. Caulder CR, Mehta B, Bookstaver PB, Sims LD, Stevenson B; South Carolina Society of Health-System Pharmacists. Impact of drug shortages on health system pharmacies in the southeastern United States. Hosp Pharm. 2015;50(4):279-286.
12. Florida Society of Health-System Pharmacists. Conservation strategies for IV fluids. http://www.fshp.org/news/165998/Conservation-Strategies-for-IV-Fluid.htm. Accessed December 11, 2017.
13. Federal Acquisition Regulation Site. FAR—Part 13 Simplified Acquisition Procedures, 13 CFR §§ 201-302. http://farsite.hill.af.mil/reghtml/regs/far2afmcfars/fardfars/far/13.htm. Updated January 13, 2017. Accessed December 5, 2017.
Drug product shortages threaten health care quality and public health by creating barriers to optimal care. The frequency of drug shortages has risen dramatically since 2005 and now influences broad areas of health care practice. More than 400 generic drug products have been affected, forcing institutions to purchase costly brand-name products, substitute alternative therapies, or procure from gray market vendors at increased institutional costs.1 Scarcity and cost have potential to negatively impact patient outcomes and the ability of health care organizations to respond to the needs of their patients.
Background
Although constantly fluctuating, the number of active shortages reached a height of 320 products at the end the third quarter of 2014.2 A 2011 analysis from Premier Healthcare Alliance estimated the added cost of purchasing brand, generic, or alternative drugs due to shortage may have inflated hospital costs by $200 million annually.1 In 2016, the number of active shortages dropped to 176, suggesting a downward trend. However, the drug supply chain remains a concern for pharmacies in the U.S.
Despite creative approaches to shortage management, the variable characteristics of shortages make planning difficult. For example, the drug product in short supply may or may not have an alternative for use in similar clinical scenarios. The impact of shortages of medications lacking an equivalent alternative product has been documented, such as the past shortage of succinylcholine for anesthesia, resulting in surgery cancellations when an alternative paralytic agent was not appropriate.3 In 2016, the Cleveland Clinic reported undertaking “military-style triage” in determining patients who required use of aminocaproic acid during open heart surgery due to its limited supply.4 Decisions to reserve drug supply for emergency use and prefilling syringes under pharmacy supervision to extend stability and shelf life are short-term solutions to larger, systemic issues. Unfortunately, these scenarios have the potential to disrupt patient care and diminish health outcomes.
Shortages of products that have an available therapeutic substitution may seem easily manageable, but additional considerations may be present. Bacillus Calmette-Guérin (BCG) is considered the drug of choice for bladder cancer. In 2011, there was a shortage of the BCG vaccine after mold was discovered in the formulation.5 Providers were forced to choose between reducing or reallocating the dose of BCG, turning away patient, or substituting mitomycin C, which is less effective and costlier. When tamsulosin capsules became difficult to obtain in 2014, some institutions began switching patients to alfuzosin.6 Although alfuzosin is similar in mechanism to tamsulosin, it may prolong the QTc interval. Not only did this substitution present a contraindication for patients with elevated QTc intervals or who were already receiving concomitant medications that prolonged the QTc interval, but also it required additional cost and resources needed to update electrocardiograms.
VA Consolidated Mail Outpatient Pharmacies
The VHA serves nearly 9 million patients at more than 1,200 facilities across the U.S.7 This large patient population results in an estimated 149 million outpatient prescriptions annually.8 About 80% of these are distributed by mail through 7 VA consolidated mail outpatient pharmacies (CMOPs). When drug scarcity impedes the ability of the CMOP to respond to medication demand, the local facility must fill these prescriptions. These rejections sent back to the facility impact workload, patient wait times, and access to medication therapy. Barriers to medication procurement in the VA also stem from regulations based on legislation, including the Trade Agreements Act, Drug Supply Chain Security Act, and the Federal Acquisition Regulation (FAR) (Table).
The impact of drug shortages has been described previously in the private sector, particularly for emergency medicine and chemotherapy.9,10 However, the impact of drug shortages on health care provision to veteran populations within the VA has not previously been analyzed. Due to the unique procurement regulations that influence the VA and the importance of continuing to provide optimal health care services to veterans, assessing the impact of drug shortages on patient safety and health care costs is necessary in informing policy decisions and guiding recommendations for mitigation strategies. The purpose of this study was to assess the influence of drug shortages on institutional costs and patient care within VA facilities and formulate recommendations for enhanced mitigation of this issue.
Methods
The primary outcome of this study was to characterize the impact of drug shortages on institutional cost and patient safety events among VHA facilities. Secondary outcomes included subgroup evaluation in reported drug shortage impact among 1a, 1b, and 1c complexity VA facility survey respondents and assessment of drug shortage impact on CMOP prescription order fulfillment and operation cost.
Definitions
The complexity ranking system is a facility grouping method used within the VA to characterize the level of service provision, teaching and research opportunities, patient volume, intensive care unit level, and other factors offered by a VA site. Rankings start from 1 (highest level of services offered) to 3 (lowest level of services offered), with level 1 facilities further divided into a, b, and c subdivisions. A level 1a facility will be larger with more services offered than a 1b, which is larger and offers more services than a 1c facility. The VA facilities are further characterized by regional distribution. Sites are grouped under VISNs of which there are currently 21.
The CMOP program was responsible for dispensing about 119 million outpatient prescriptions in 2016 and includes designated sites for the dispensing of controlled substances and supply items. The VA Pharmacy Benefits Management Service (PBM) oversees formulary management, plans national drug policy, promotes safe and appropriate drug therapy, and delivers high-quality and sustainable pharmacy benefits for veterans.
Study Design
A descriptive study was initiated to characterize the impact of drug shortages among VA facilities. An analysis of administrative medication safety event reporting and institutional costs data at the Denver VAMC in Colorado was done, focusing on predetermined drug products involved in a recent shortage. The analysis was accomplished through a review of the VA adverse drug events reporting system (VA ADERS) reports and a local medication errors quality improvement database and paper procurement records, respectively. Concurrently, a survey was disseminated among qualifying VA facilities across the country that sought to characterize the impact of drug shortages nationally.
Sample Selection
Denver VAMC. The Denver VAMC, where the authors were located, was selected as the local sample site. The intention was to compare the strategies used locally with strategies used among similar (level 1a, 1b, and 1c) facilities. Preselected “cost-impacting” drug products were identified through a review of historic shortages with a significant local impact. These drugs were defined as low cost/high utilization (eg, tamsulosin 0.4-mg capsules and ketorolac solution), medium cost/utilization (eg, piperacillin/tazobactam IV solutions and aminocaproic acid solution), and high cost/low utilization (eg, nitroprusside IV solution and BCG vaccine solution). Additionally, patient safety event data reported internally for quality improvement and locally via VA ADERS were reviewed for preselected “safety impact” drug products and included BCG vaccine, tamsulosin capsules, IV fluid products, calcium gluconate and chloride injections, and aminocaproic acid injection.
National Survey. The authors identified 84 level 1 complexity facilities and used the PBM pharmacy directory to contact the administrative personnel representing each facility. These representatives identified a point of contact to aid in survey completion. A separate survey also was sent to the CMOP facilities (survey outlines available at www.fedprac.com).
Data Collection
Denver VAMC. Financial data were sampled through a manual review of paper procurement records stored by date in the inpatient pharmacy of the Denver VAMC. Variables included units of product used over the period of drug shortage, cost per unit during shortage, and cost per unit before shortage. This information also was supplemented with data from the prescription processing software’s drug file. Patient safety data were gathered through query of the identified event reporting databases for the prespecified drug on shortage. These variables included the type of error and the effect the error had on the patient.
National Survey. Data collection focused on notable drug shortages and patient safety reporting between January 1, 2013 and December 31, 2016. The survey was maintained in a facility-specific spreadsheet. Editing capabilities were disabled for all actions other than responding to questions. Recipients were followed up with a courtesy e-mail after 2 weeks and another 2 times unless a survey was received. Data were de-identified and aggregated for analyses.
Statistical Analyses
Excel 2010 (Microsoft, Redmond, WA) descriptive statistics were used to relay information from this assessment. Extrapolations from procurement cost data and drug product utilization were used to estimate the enhanced direct cost associated with identified drug shortages. Similar extrapolations were used to estimate the cost associated with shortages leading to CMOP rejection and local fill.
Results
Survey completion totaled 20% of invited facilities (n = 17). Good geographic and VISN distribution was noted with representatives from VISNs 2, 4, 8, 9, 10, 12, 15, 16, 21, and 22. VISNs 10 and 12 provided the most representation with 3 participants, each. Level 1a facilities participated most (n = 9), followed by 1b (n = 6) and 1c (n = 2). Participating facilities reported a mean (SD) of 54 (21.5) pharmacists and 34 (15.3) pharmacy technician staff members employed. The most common reason for not participating was lack of personnel resources and competing demands. The CMOP participation was 100% (n = 7) and completed through a coordinated response.
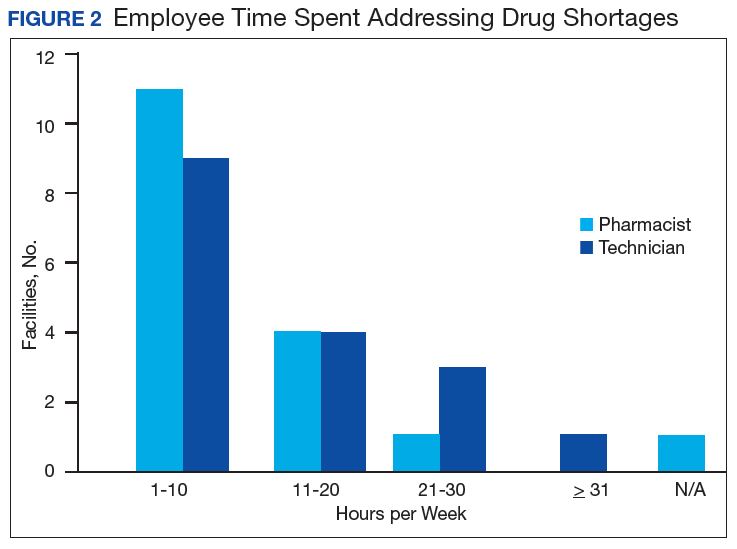
Results of the budgetary increase and staff member time allocation survey assessments are provided (Figures 1 and 2). Five facilities provided an annual estimate of increased cost due to acquisition of drugs on shortage through open market purchases that ranged from about $150,000 to $750,000. Nearly half of the surveyed facilities endorsed having a drug shortage task force (n = 8) to respond to drug shortages and mitigate their impact.
Regarding drug product allocation, only 2 facilities did not have current restrictions for use due to a shortage. Many had between 1 and 10 of these restrictions implemented to conserve supply (n = 11, 64%), 2 facilities reported 11 to 20 restrictions, and 2 facilities noted more than 30 restrictions. Similarly, 3 facilities had not needed to revise any current treatment protocols due to drug shortages. The majority of facilities had revised 1 to 5 current protocols (n = 12, 70%), 1 revised 6 to 10 protocols, and 1 facility revised more than 10 protocols.
In assessing patient safety concerns, 1 facility identified a history of transferring patients to alternative medical sites for the patients to obtain necessary medication impacted by a local shortage. Additionally, during the BCG vaccine shortage, 6 facilities (35.3%) substituted mitomycin C for the treatment of urinary bladder cancer.
Most participants either agreed (n = 8, 47.0%) or strongly agreed (n = 4, 23.5%) that modifications to FAR to increase purchasing opportunities from foreign distributors during drug shortage would help mitigate the impact of such shortages. Similarly, most participants agreed (n = 10, 58.8%) or strongly agreed (n = 3, 17.6%) that PBM guidance on drug shortage management would help efficiently and effectively respond to issues that might arise. The consensus of participants also agreed (n = 13, 76.5%) that organized collaborations or working groups within each VISN might help assist in drug shortage management.
The CMOP facility data revealed that 2 sites did not require dedicated staffing to respond to shortages, and 3 sites had not experienced cost increases because of shortages. Pharmacist use varied between sites, with 2 facilities using 1 to 10 pharmacist h/wk, and 1 facility using 11 to 20 pharmacist h/wk, and 1 facility using 21 to 30 pharmacist h/wk. Technician utilization was more pronounced, with 2 facilities using more than 30 technician h/wk, and 2 facilities using 1 to 10 technician h/wk. Workload and costs may have been influenced in other ways as 3 sites endorsed using overtime pay, shifting product responsibility between CMOPs, prolonging patient wait times, and close monitoring for each. In fiscal year 2015, some sites experienced a 1% to 5% (n = 2) and 6% to 10% (n = 1) increase in operation cost attributable to shortage. Results from fiscal year 2016 showed that some sites continued to see a 1% to 5% (n = 1) and 6% to 10% (n = 2) increase in operation cost attributable to shortage.
Through aggregation of CMOP responses on the number of prescriptions sent back to local facility for fill due to back order, a downward trend in the total number of rejections was seen over the 2.5 fiscal years assessed. This amounted to more than 1 million rejections in fiscal year 2015, about 788,000 rejections in 2016, and about 318,000 rejections through the first 2 quarters of 2017.
A consistent rise in the medication procurement budget requirement was characterized within the single VA facility review. The quarterly median increase was 2.7% over 2.5 years (min: -1.4%; max: 6.6%) for total outpatient medication costs, excluding hepatitis C antiviral therapies. Procurement cost records were insufficient to characterize historic expenditures for 4 of the prespecified drug products. The data collected on tamsulosin capsule and nitroprusside vial procurement during shortage is provided (Figures 3 and 4). Over the time frame of procurement records found on review, the added costs of nitroprusside vials and tamsulosin capsules were $22,766.09 (+167.9% of base cost) and $17,433.70 (+657.3% of base cost), respectively. No patient safety data were found on review.
Discussion
Drug product shortages represent a barrier to quality and efficiency across health care institutions. A survey of health system pharmacies in the southeastern U.S. found that the majority of respondents tracking shortage data reported a 300% to 500% markup by alternative or gray market suppliers for hard-to-find medications.11 These reports are similar to the authors’ analyses of the trends in increased procurement expenditures documented during the tamsulosin capsule and nitroprusside vial shortages and indirectly correlate with the survey results indicating that most facilities endorsed a trend in operation cost increase attributable to drugs product shortage. The estimated annual costs for open market purchases further informs the financial burden aggregated by this issue.
Indirect costs from drug shortage further complicated quantifying the impact of shortages. Many facilities acknowledged the indirect influence drug shortages have on staffing and workload due to the implementation of mitigation strategies. Most participants found it necessary to establish restrictions for use in addition to altering protocols. These required the time investment of essential personnel from development through execution and education. Situations also can arise for mass therapeutic substitution. In this example, pharmacy staff may be required to oversee medication transition from the product on shortage to an appropriate alternative. When substitution involves hundreds or thousands of outpatient prescriptions, such as the tamsulosin shortage, the process may be tedious and time consuming, depending on the level of clinical decision making needed to determine patient candidacy for transitioning products.
Improving institutional cost efficiency becomes a significant challenge with persistent drug shortages. Professional advocacy groups, such as the American Society of Health-System Pharmacists (ASHP), help provide guidance to organizations constrained by specific drug shortages.12 Staff knowledgeable in allocation, supply considerations, and product repackaging and stability data also are essential. Other mitigation strategies include automatic substitutions, restrictions for use or inventory control strategies, and open market procurement, or borrowing from other institutions.
Data gathered from the survey of CMOP facilities also helped elucidate strategies used to mitigate drug shortage impacts for those respondents impacted by shortage. Likely, the 2 CMOP facilities without dedicated staff focused on shortages are those whose outpatient prescription fulfillment responsibility were focused on supply items or controlled substances. The impacted CMOP respondents cited overtime pay, shifting product responsibility, and prolonging patient wait times as the most frequently employed mitigation strategies. When these and other strategies fail to manage a shortage, prescriptions are often sent back to the local facility to be filled. Unfortunately for these facilities, the same mitigation strategies used by CMOP are not always feasible. Overtime pay may not be possible given staffing and budgetary resources, sending prescriptions back to facilities in itself prolongs patient wait times, and local medical centers do not have the option of shifting product responsibility between sites or sending the prescription to another facility. Herein lies 1 rationale for the CMOP effort to reduce the volume of prescriptions sent back to local medical centers.
Multiple offices within the FDA have roles in the mitigation of national drug shortages within their regulatory purview. Much of the recent focus stems from provisions enacted under Title X of the FDA Safety and Innovation Act of 2012, which addresses problems in the drug-supply chain.12 Rectifying a shortage involves short- and long-term strategic planning to address supply, distribution, and market reaction to need. Collaboration between the FDA and manufacturers is one method by which demand can be satisfied through the coordination of resources, expedition of inspections, and root cause analysis of the shortage.
Similar collaborations within the VA were viewed favorably by respondents and might yield productive relationships if regional or VISN working groups were to be established. Alternative long-term strategies are executed through regulation, particularly concerning the importation of foreign manufactured drugs and regulatory discretion on supplier vetting. Despite a strong respondent consensus that regulatory modifications of foreign product importation in the setting of a drug shortage may be beneficial, such a change would require a congressional action and is not likely to be timely. Unfortunately, gray market pharmaceutical distribution, driven by wholesaler stockpiling to raise prices, is separate from manufacturer driven shortages and falls outside the FDA’s regulatory purview and institutional mitigation strategies.
Although based on this limited survey, general agreement existed on the importance of greater national collaboration and communication regarding drug shortage management strategies. This could include PBM guidance on specific shortage management opportunities or establishing collaborations by region or VISN. These possibilities may be more realistically attainable in comparison to modifying federal regulations on drug product procurement during active shortages, which requires an act of Congress. Many of the survey participants endorsed a drug shortage task force within their facility. Coordinating interaction between preexisting or newly established task forces or working groups on a monthly or quarterly basis may provide fruitful interactions and the exchange of strategies to reduce shortage impact on institutional cost, efficiency, and patient care.
Limitations
Quantifying the extent of drug shortage impact on patient safety and institutional costs is a difficult task. The procurement records data used for the analysis of a single VAMC were gathered through manual review of stored paper invoices, opening the possibility for missing data. It is also difficult to extrapolate the sum of indirect costs such as process changes, alternative product utilization, and pharmacy staffing resources as additional financial burdens to the affected institution. Any quantifiable cost assessment also is biased by contract terms between the VA and wholesalers in which unavailable products that must be purchased off-contract are subsequently reimbursed through credit or alternative means.
Patient safety events are frequently underreported, leading to underestimation of true safety event incidence. Given that these events are documented by multiple disciplines and that many of these documenters may not be aware consistently of the drug products and volume impacted by shortage, elucidating safety events unfolding in relation to shortage also is difficult to quantify.
The response rate for the survey was low but near the expected rate for this methodology. Feedback from several facilities was received, citing competing demands and workforce shortage as barriers to participation. The survey also was limited by reporting bias and recall bias. As assessment of prespecified past drug shortages may require intimate knowledge of pharmacy department processes and mitigation strategies, the accuracy of question answering may have been limited to the length of time the points of contact had been in their current position.
Conclusion
Drug shortages are a pervasive barrier to patient care within larger facilities of the VA health care system, similar to what has been characterized in the private sector. As a result of these shortages and the mitigation strategies to reduce their burden, many facilities endorsed trends in increasing workload for staff, institutional operation costs, and risk for patient safety and care quality concerns. Due to the demands of shortages, some facilities have implemented drug shortage task forces or equivalent groups to specifically manage these issues. Moving forward, the VA health care system may benefit from similar task forces or working groups at the VISN level, to aid in collaborative efforts to respond to shortage. Support for revising federal regulations on procurement in times of shortage and enhanced PBM drug shortage management guidance also was endorsed.
Drug product shortages threaten health care quality and public health by creating barriers to optimal care. The frequency of drug shortages has risen dramatically since 2005 and now influences broad areas of health care practice. More than 400 generic drug products have been affected, forcing institutions to purchase costly brand-name products, substitute alternative therapies, or procure from gray market vendors at increased institutional costs.1 Scarcity and cost have potential to negatively impact patient outcomes and the ability of health care organizations to respond to the needs of their patients.
Background
Although constantly fluctuating, the number of active shortages reached a height of 320 products at the end the third quarter of 2014.2 A 2011 analysis from Premier Healthcare Alliance estimated the added cost of purchasing brand, generic, or alternative drugs due to shortage may have inflated hospital costs by $200 million annually.1 In 2016, the number of active shortages dropped to 176, suggesting a downward trend. However, the drug supply chain remains a concern for pharmacies in the U.S.
Despite creative approaches to shortage management, the variable characteristics of shortages make planning difficult. For example, the drug product in short supply may or may not have an alternative for use in similar clinical scenarios. The impact of shortages of medications lacking an equivalent alternative product has been documented, such as the past shortage of succinylcholine for anesthesia, resulting in surgery cancellations when an alternative paralytic agent was not appropriate.3 In 2016, the Cleveland Clinic reported undertaking “military-style triage” in determining patients who required use of aminocaproic acid during open heart surgery due to its limited supply.4 Decisions to reserve drug supply for emergency use and prefilling syringes under pharmacy supervision to extend stability and shelf life are short-term solutions to larger, systemic issues. Unfortunately, these scenarios have the potential to disrupt patient care and diminish health outcomes.
Shortages of products that have an available therapeutic substitution may seem easily manageable, but additional considerations may be present. Bacillus Calmette-Guérin (BCG) is considered the drug of choice for bladder cancer. In 2011, there was a shortage of the BCG vaccine after mold was discovered in the formulation.5 Providers were forced to choose between reducing or reallocating the dose of BCG, turning away patient, or substituting mitomycin C, which is less effective and costlier. When tamsulosin capsules became difficult to obtain in 2014, some institutions began switching patients to alfuzosin.6 Although alfuzosin is similar in mechanism to tamsulosin, it may prolong the QTc interval. Not only did this substitution present a contraindication for patients with elevated QTc intervals or who were already receiving concomitant medications that prolonged the QTc interval, but also it required additional cost and resources needed to update electrocardiograms.
VA Consolidated Mail Outpatient Pharmacies
The VHA serves nearly 9 million patients at more than 1,200 facilities across the U.S.7 This large patient population results in an estimated 149 million outpatient prescriptions annually.8 About 80% of these are distributed by mail through 7 VA consolidated mail outpatient pharmacies (CMOPs). When drug scarcity impedes the ability of the CMOP to respond to medication demand, the local facility must fill these prescriptions. These rejections sent back to the facility impact workload, patient wait times, and access to medication therapy. Barriers to medication procurement in the VA also stem from regulations based on legislation, including the Trade Agreements Act, Drug Supply Chain Security Act, and the Federal Acquisition Regulation (FAR) (Table).
The impact of drug shortages has been described previously in the private sector, particularly for emergency medicine and chemotherapy.9,10 However, the impact of drug shortages on health care provision to veteran populations within the VA has not previously been analyzed. Due to the unique procurement regulations that influence the VA and the importance of continuing to provide optimal health care services to veterans, assessing the impact of drug shortages on patient safety and health care costs is necessary in informing policy decisions and guiding recommendations for mitigation strategies. The purpose of this study was to assess the influence of drug shortages on institutional costs and patient care within VA facilities and formulate recommendations for enhanced mitigation of this issue.
Methods
The primary outcome of this study was to characterize the impact of drug shortages on institutional cost and patient safety events among VHA facilities. Secondary outcomes included subgroup evaluation in reported drug shortage impact among 1a, 1b, and 1c complexity VA facility survey respondents and assessment of drug shortage impact on CMOP prescription order fulfillment and operation cost.
Definitions
The complexity ranking system is a facility grouping method used within the VA to characterize the level of service provision, teaching and research opportunities, patient volume, intensive care unit level, and other factors offered by a VA site. Rankings start from 1 (highest level of services offered) to 3 (lowest level of services offered), with level 1 facilities further divided into a, b, and c subdivisions. A level 1a facility will be larger with more services offered than a 1b, which is larger and offers more services than a 1c facility. The VA facilities are further characterized by regional distribution. Sites are grouped under VISNs of which there are currently 21.
The CMOP program was responsible for dispensing about 119 million outpatient prescriptions in 2016 and includes designated sites for the dispensing of controlled substances and supply items. The VA Pharmacy Benefits Management Service (PBM) oversees formulary management, plans national drug policy, promotes safe and appropriate drug therapy, and delivers high-quality and sustainable pharmacy benefits for veterans.
Study Design
A descriptive study was initiated to characterize the impact of drug shortages among VA facilities. An analysis of administrative medication safety event reporting and institutional costs data at the Denver VAMC in Colorado was done, focusing on predetermined drug products involved in a recent shortage. The analysis was accomplished through a review of the VA adverse drug events reporting system (VA ADERS) reports and a local medication errors quality improvement database and paper procurement records, respectively. Concurrently, a survey was disseminated among qualifying VA facilities across the country that sought to characterize the impact of drug shortages nationally.
Sample Selection
Denver VAMC. The Denver VAMC, where the authors were located, was selected as the local sample site. The intention was to compare the strategies used locally with strategies used among similar (level 1a, 1b, and 1c) facilities. Preselected “cost-impacting” drug products were identified through a review of historic shortages with a significant local impact. These drugs were defined as low cost/high utilization (eg, tamsulosin 0.4-mg capsules and ketorolac solution), medium cost/utilization (eg, piperacillin/tazobactam IV solutions and aminocaproic acid solution), and high cost/low utilization (eg, nitroprusside IV solution and BCG vaccine solution). Additionally, patient safety event data reported internally for quality improvement and locally via VA ADERS were reviewed for preselected “safety impact” drug products and included BCG vaccine, tamsulosin capsules, IV fluid products, calcium gluconate and chloride injections, and aminocaproic acid injection.
National Survey. The authors identified 84 level 1 complexity facilities and used the PBM pharmacy directory to contact the administrative personnel representing each facility. These representatives identified a point of contact to aid in survey completion. A separate survey also was sent to the CMOP facilities (survey outlines available at www.fedprac.com).
Data Collection
Denver VAMC. Financial data were sampled through a manual review of paper procurement records stored by date in the inpatient pharmacy of the Denver VAMC. Variables included units of product used over the period of drug shortage, cost per unit during shortage, and cost per unit before shortage. This information also was supplemented with data from the prescription processing software’s drug file. Patient safety data were gathered through query of the identified event reporting databases for the prespecified drug on shortage. These variables included the type of error and the effect the error had on the patient.
National Survey. Data collection focused on notable drug shortages and patient safety reporting between January 1, 2013 and December 31, 2016. The survey was maintained in a facility-specific spreadsheet. Editing capabilities were disabled for all actions other than responding to questions. Recipients were followed up with a courtesy e-mail after 2 weeks and another 2 times unless a survey was received. Data were de-identified and aggregated for analyses.
Statistical Analyses
Excel 2010 (Microsoft, Redmond, WA) descriptive statistics were used to relay information from this assessment. Extrapolations from procurement cost data and drug product utilization were used to estimate the enhanced direct cost associated with identified drug shortages. Similar extrapolations were used to estimate the cost associated with shortages leading to CMOP rejection and local fill.
Results
Survey completion totaled 20% of invited facilities (n = 17). Good geographic and VISN distribution was noted with representatives from VISNs 2, 4, 8, 9, 10, 12, 15, 16, 21, and 22. VISNs 10 and 12 provided the most representation with 3 participants, each. Level 1a facilities participated most (n = 9), followed by 1b (n = 6) and 1c (n = 2). Participating facilities reported a mean (SD) of 54 (21.5) pharmacists and 34 (15.3) pharmacy technician staff members employed. The most common reason for not participating was lack of personnel resources and competing demands. The CMOP participation was 100% (n = 7) and completed through a coordinated response.
Results of the budgetary increase and staff member time allocation survey assessments are provided (Figures 1 and 2). Five facilities provided an annual estimate of increased cost due to acquisition of drugs on shortage through open market purchases that ranged from about $150,000 to $750,000. Nearly half of the surveyed facilities endorsed having a drug shortage task force (n = 8) to respond to drug shortages and mitigate their impact.
Regarding drug product allocation, only 2 facilities did not have current restrictions for use due to a shortage. Many had between 1 and 10 of these restrictions implemented to conserve supply (n = 11, 64%), 2 facilities reported 11 to 20 restrictions, and 2 facilities noted more than 30 restrictions. Similarly, 3 facilities had not needed to revise any current treatment protocols due to drug shortages. The majority of facilities had revised 1 to 5 current protocols (n = 12, 70%), 1 revised 6 to 10 protocols, and 1 facility revised more than 10 protocols.
In assessing patient safety concerns, 1 facility identified a history of transferring patients to alternative medical sites for the patients to obtain necessary medication impacted by a local shortage. Additionally, during the BCG vaccine shortage, 6 facilities (35.3%) substituted mitomycin C for the treatment of urinary bladder cancer.
Most participants either agreed (n = 8, 47.0%) or strongly agreed (n = 4, 23.5%) that modifications to FAR to increase purchasing opportunities from foreign distributors during drug shortage would help mitigate the impact of such shortages. Similarly, most participants agreed (n = 10, 58.8%) or strongly agreed (n = 3, 17.6%) that PBM guidance on drug shortage management would help efficiently and effectively respond to issues that might arise. The consensus of participants also agreed (n = 13, 76.5%) that organized collaborations or working groups within each VISN might help assist in drug shortage management.
The CMOP facility data revealed that 2 sites did not require dedicated staffing to respond to shortages, and 3 sites had not experienced cost increases because of shortages. Pharmacist use varied between sites, with 2 facilities using 1 to 10 pharmacist h/wk, and 1 facility using 11 to 20 pharmacist h/wk, and 1 facility using 21 to 30 pharmacist h/wk. Technician utilization was more pronounced, with 2 facilities using more than 30 technician h/wk, and 2 facilities using 1 to 10 technician h/wk. Workload and costs may have been influenced in other ways as 3 sites endorsed using overtime pay, shifting product responsibility between CMOPs, prolonging patient wait times, and close monitoring for each. In fiscal year 2015, some sites experienced a 1% to 5% (n = 2) and 6% to 10% (n = 1) increase in operation cost attributable to shortage. Results from fiscal year 2016 showed that some sites continued to see a 1% to 5% (n = 1) and 6% to 10% (n = 2) increase in operation cost attributable to shortage.
Through aggregation of CMOP responses on the number of prescriptions sent back to local facility for fill due to back order, a downward trend in the total number of rejections was seen over the 2.5 fiscal years assessed. This amounted to more than 1 million rejections in fiscal year 2015, about 788,000 rejections in 2016, and about 318,000 rejections through the first 2 quarters of 2017.
A consistent rise in the medication procurement budget requirement was characterized within the single VA facility review. The quarterly median increase was 2.7% over 2.5 years (min: -1.4%; max: 6.6%) for total outpatient medication costs, excluding hepatitis C antiviral therapies. Procurement cost records were insufficient to characterize historic expenditures for 4 of the prespecified drug products. The data collected on tamsulosin capsule and nitroprusside vial procurement during shortage is provided (Figures 3 and 4). Over the time frame of procurement records found on review, the added costs of nitroprusside vials and tamsulosin capsules were $22,766.09 (+167.9% of base cost) and $17,433.70 (+657.3% of base cost), respectively. No patient safety data were found on review.
Discussion
Drug product shortages represent a barrier to quality and efficiency across health care institutions. A survey of health system pharmacies in the southeastern U.S. found that the majority of respondents tracking shortage data reported a 300% to 500% markup by alternative or gray market suppliers for hard-to-find medications.11 These reports are similar to the authors’ analyses of the trends in increased procurement expenditures documented during the tamsulosin capsule and nitroprusside vial shortages and indirectly correlate with the survey results indicating that most facilities endorsed a trend in operation cost increase attributable to drugs product shortage. The estimated annual costs for open market purchases further informs the financial burden aggregated by this issue.
Indirect costs from drug shortage further complicated quantifying the impact of shortages. Many facilities acknowledged the indirect influence drug shortages have on staffing and workload due to the implementation of mitigation strategies. Most participants found it necessary to establish restrictions for use in addition to altering protocols. These required the time investment of essential personnel from development through execution and education. Situations also can arise for mass therapeutic substitution. In this example, pharmacy staff may be required to oversee medication transition from the product on shortage to an appropriate alternative. When substitution involves hundreds or thousands of outpatient prescriptions, such as the tamsulosin shortage, the process may be tedious and time consuming, depending on the level of clinical decision making needed to determine patient candidacy for transitioning products.
Improving institutional cost efficiency becomes a significant challenge with persistent drug shortages. Professional advocacy groups, such as the American Society of Health-System Pharmacists (ASHP), help provide guidance to organizations constrained by specific drug shortages.12 Staff knowledgeable in allocation, supply considerations, and product repackaging and stability data also are essential. Other mitigation strategies include automatic substitutions, restrictions for use or inventory control strategies, and open market procurement, or borrowing from other institutions.
Data gathered from the survey of CMOP facilities also helped elucidate strategies used to mitigate drug shortage impacts for those respondents impacted by shortage. Likely, the 2 CMOP facilities without dedicated staff focused on shortages are those whose outpatient prescription fulfillment responsibility were focused on supply items or controlled substances. The impacted CMOP respondents cited overtime pay, shifting product responsibility, and prolonging patient wait times as the most frequently employed mitigation strategies. When these and other strategies fail to manage a shortage, prescriptions are often sent back to the local facility to be filled. Unfortunately for these facilities, the same mitigation strategies used by CMOP are not always feasible. Overtime pay may not be possible given staffing and budgetary resources, sending prescriptions back to facilities in itself prolongs patient wait times, and local medical centers do not have the option of shifting product responsibility between sites or sending the prescription to another facility. Herein lies 1 rationale for the CMOP effort to reduce the volume of prescriptions sent back to local medical centers.
Multiple offices within the FDA have roles in the mitigation of national drug shortages within their regulatory purview. Much of the recent focus stems from provisions enacted under Title X of the FDA Safety and Innovation Act of 2012, which addresses problems in the drug-supply chain.12 Rectifying a shortage involves short- and long-term strategic planning to address supply, distribution, and market reaction to need. Collaboration between the FDA and manufacturers is one method by which demand can be satisfied through the coordination of resources, expedition of inspections, and root cause analysis of the shortage.
Similar collaborations within the VA were viewed favorably by respondents and might yield productive relationships if regional or VISN working groups were to be established. Alternative long-term strategies are executed through regulation, particularly concerning the importation of foreign manufactured drugs and regulatory discretion on supplier vetting. Despite a strong respondent consensus that regulatory modifications of foreign product importation in the setting of a drug shortage may be beneficial, such a change would require a congressional action and is not likely to be timely. Unfortunately, gray market pharmaceutical distribution, driven by wholesaler stockpiling to raise prices, is separate from manufacturer driven shortages and falls outside the FDA’s regulatory purview and institutional mitigation strategies.
Although based on this limited survey, general agreement existed on the importance of greater national collaboration and communication regarding drug shortage management strategies. This could include PBM guidance on specific shortage management opportunities or establishing collaborations by region or VISN. These possibilities may be more realistically attainable in comparison to modifying federal regulations on drug product procurement during active shortages, which requires an act of Congress. Many of the survey participants endorsed a drug shortage task force within their facility. Coordinating interaction between preexisting or newly established task forces or working groups on a monthly or quarterly basis may provide fruitful interactions and the exchange of strategies to reduce shortage impact on institutional cost, efficiency, and patient care.
Limitations
Quantifying the extent of drug shortage impact on patient safety and institutional costs is a difficult task. The procurement records data used for the analysis of a single VAMC were gathered through manual review of stored paper invoices, opening the possibility for missing data. It is also difficult to extrapolate the sum of indirect costs such as process changes, alternative product utilization, and pharmacy staffing resources as additional financial burdens to the affected institution. Any quantifiable cost assessment also is biased by contract terms between the VA and wholesalers in which unavailable products that must be purchased off-contract are subsequently reimbursed through credit or alternative means.
Patient safety events are frequently underreported, leading to underestimation of true safety event incidence. Given that these events are documented by multiple disciplines and that many of these documenters may not be aware consistently of the drug products and volume impacted by shortage, elucidating safety events unfolding in relation to shortage also is difficult to quantify.
The response rate for the survey was low but near the expected rate for this methodology. Feedback from several facilities was received, citing competing demands and workforce shortage as barriers to participation. The survey also was limited by reporting bias and recall bias. As assessment of prespecified past drug shortages may require intimate knowledge of pharmacy department processes and mitigation strategies, the accuracy of question answering may have been limited to the length of time the points of contact had been in their current position.
Conclusion
Drug shortages are a pervasive barrier to patient care within larger facilities of the VA health care system, similar to what has been characterized in the private sector. As a result of these shortages and the mitigation strategies to reduce their burden, many facilities endorsed trends in increasing workload for staff, institutional operation costs, and risk for patient safety and care quality concerns. Due to the demands of shortages, some facilities have implemented drug shortage task forces or equivalent groups to specifically manage these issues. Moving forward, the VA health care system may benefit from similar task forces or working groups at the VISN level, to aid in collaborative efforts to respond to shortage. Support for revising federal regulations on procurement in times of shortage and enhanced PBM drug shortage management guidance also was endorsed.
1. Cherici C, Frazier J, Feldman M, et al. Navigating drug shortages in American healthcare: a premier healthcare alliance analysis. https://www.heartland.org/_template-assets/documents/publications/30103.pdf. Published March 2011. Accessed December 5, 2017.
2. American Society of Health-System Pharmacists. ASHP drug shortage statistics. https://www.ashp.org/Drug-Shortages/Shortage-Resources/Drug-Shortages-Statistics. Updated 2017. Accessed December 5, 2017.
3. Dooren JC. Most hospitals face drug shortages. The Wall Street Journal. http://www.wsj.com/articles/SB10001424052702304584404576442211187884744. Published July 13, 2011. Accessed December 5, 2017.
4. Fink S. Drug shortages forcing hard decisions on rationing treatment. The New York Times. http://www.nytimes.com/2016/01/29/us/drug-shortages-forcing-hard-decisions-on-rationing-treatments.html. Published January 29, 2016. Accessed December 5, 2017.
5. Loftus P. Drug shortages frustrate doctors, patients. The Wall Street Journal. http://www.wsj.com/articles/u-s-drug-shortages-frustrate-doctors-patients-1433125793. Published May, 31, 2015. Accessed December 5, 2017.
6. U.S. Food and Drug Administration. Strategic plan for preventing and mitigating drug shortages. http://www.fda.gov/downloads/Drugs/DrugSafety/DrugShortages/UCM372566.pdf. Published October 2013. Accessed August 22, 2016.
7. U.S. Department of Veteran Affairs, National Center for Veterans Analysis and Statistics. Quick facts. https://www.va.gov/vetdata/Quick_Facts.asp. Updated November 20, 2017. Accessed December 5, 2017.
8. U.S. Department of Veterans Affairs, Office of the Inspector General. Audit of Consolidated Mail Outpatient Pharmacy Program. https://www.va.gov/oig/pubs/VAOIG-15-05255-422.pdf. Accessed December 11, 2017.
9. Mazer-Amirshahi M, Pourmand A, Singer S, Pines JM, van den Anker J. Critical drug shortages: implications for emergency medicine. Acad Emerg Med. 2014;21(6):704-711.
10. McBride A, Holle LM, Westendorf C, et al. National survey on the effect of oncology drug shortages on cancer care. Am J Health Syst Pharm. 2013;70(7):609-617.
11. Caulder CR, Mehta B, Bookstaver PB, Sims LD, Stevenson B; South Carolina Society of Health-System Pharmacists. Impact of drug shortages on health system pharmacies in the southeastern United States. Hosp Pharm. 2015;50(4):279-286.
12. Florida Society of Health-System Pharmacists. Conservation strategies for IV fluids. http://www.fshp.org/news/165998/Conservation-Strategies-for-IV-Fluid.htm. Accessed December 11, 2017.
13. Federal Acquisition Regulation Site. FAR—Part 13 Simplified Acquisition Procedures, 13 CFR §§ 201-302. http://farsite.hill.af.mil/reghtml/regs/far2afmcfars/fardfars/far/13.htm. Updated January 13, 2017. Accessed December 5, 2017.

Trying to Keep Pace With 3-D Technology
Three-dimensional printing has revolutionized the drug and device market and already has changed the lives of millions of patients. The FDA has reviewed more than 100 devices now on the market that were manufactured on 3-D printers, including knee replacements and implants “designed to fit like a missing puzzle piece into a patient’s skull for facial reconstruction,” says FDA Commissioner Scott Gottlieb, MD. The FDA also has approved the first drug produced on a 3-D printer. It has a more porous matrix than that of the drug manufactured in the traditional way, which allows it to dissolve more rapidly. But the technology advances have been moving so fast that they have threatened to outpace safeguards.
Now the FDA is preparing for a “significant wave” of new technologies, Gottlieb says, such as 3-D-printer skin cells for burn victims and is working to provide a regulatory pathway that keeps pace with those advances, helping to keep them safe and effective. To that end, the FDA has issued new guidance to help advise manufacturers on technical aspects of 3-D printing. And as more hospitals and academic centers use their 3-D printers for innovations to use in clinical studies, the FDA also is establishing a regulatory framework for applying existing laws to nontraditional manufacturers.
The Center for Drug Evaluation and Research state-of-the-art 3-D printing facility allows FDA scientists to conduct research to determine how 3-D printing of drugs, for instance, affects drug components. The Center for Devices and Radiological Health also has a 3-D printing facility to investigate the effect of design changes on safety and performance.
Gottlieb calls the technical guidance leapfrog guidance because it helps bridge current policy with innovation. It is only intended, he says, to provide “initial thoughts on an emerging technology with the understanding that our recommendations are likely to evolve as the technology develops in unexpected ways.”
Do cardiac risk stratification indexes accurately estimate perioperative risk in noncardiac surgery patients?
Neither of the two cardiac risk assessment indexes most commonly used (Table 1)1,2 is completely accurate, nor is one superior to the other. To provide the most accurate assessment of cardiac risk, practitioners need to select the index most applicable to the circumstances of the individual patient.
CARDIAC COMPLICATIONS ARE INCREASING

CARDIAC RISK ASSESSMENT INDEXES
The 2 risk assessment indexes most often used are:
- The Revised Cardiac Risk Index (RCRI)1
- The National Surgical Quality Improvement Program (NSQIP) risk index, also known as the Gupta index.2
Both are endorsed by the American College of Cardiology (ACC) and the American Heart Association (AHA).5 The RCRI, introduced in 1999, is more commonly used, but the NSQIP, introduced in 2011, is based on a larger sample size.
Both indexes consider various factors in estimating the risk, with some overlap. The main outcome assessed in both indexes is the risk of a major cardiac event, ie, myocardial infarction or cardiac arrest. The RCRI outcome also includes ventricular fibrillation, complete heart block, and pulmonary edema, which may be sequelae to cardiac arrest and myocardial infarction. This difference in defined outcomes between the indexes is not likely to account for a significant variation in the prediction of risk; however, this is difficult to prove.
Each index defines myocardial infarction differently. The current clinical definition6 includes detection of a rise or fall of cardiac biomarker values (preferably cardiac troponins) with at least 1 value above the 99th percentile upper reference limit and at least 1 of the following:
- Symptoms of ischemia
- New ST-T wave changes or new left bundle branch block
- New pathologic Q waves
- Imaging evidence of new loss of viable myocardium tissue or new regional wall- motion abnormality
- Finding of an intracoronary thrombus.
As seen in Table 1, the definition of myocardial infarction in NSQIP was one of the following: ST-segment elevation, new left bundle branch block, Q waves, or a troponin level greater than 3 times normal. Patients may have mild troponin leak of unknown significance without chest pain after surgery. This suggests that NSQIP may have overdiagnosed myocardial infarction.
USE IN CLINICAL PRACTICE
In clinical practice, which risk index is more accurate? Should clinicians become familiar with one index and keep using it? The 2014 ACC/AHA guidelines5 do not recommend one over the other, nor do they define the clinical situations that could lead to significant underestimation of risk.
The following are cases in which the indexes provide contradictory risk assessments.
Case 1. A 60-year-old man scheduled for surgery has diabetes mellitus, for which he takes insulin, and stable heart failure (left ventricular ejection fraction 40%). His RCRI score is 2, indicating an elevated 7% risk of cardiac complications; however, his NSQIP index is 0.31%. In this case, the NSQIP index probably underestimates the risk, as insulin-dependent diabetes and heart failure are not variables in the NSQIP index.
Case 2. A 60-year-old man who is partially functionally dependent and is on oxygen for severe chronic obstructive pulmonary disease is scheduled for craniotomy. His RCRI score is 0 (low risk), but his NSQIP index score (4.87%) indicates an elevated risk of cardiac complications based on his functional status, symptomatic chronic obstructive pulmonary disease, and high-risk surgery. In this case, the RCRI probably underestimates the risk.
These cases show that practitioners should not rely on just one index, but should rather decide which index to apply case by case. This avoids underestimating the risk. In patients with poor functional status and higher American Society of Anesthesiology class, the NSQIP index may provide a more accurate risk estimation than the RCRI. Patients with cardiomyopathy as well as those with insulin-dependent diabetes may be well assessed by the RCRI.
The following situations require additional caution when using these indexes, to avoid over- and underestimating cardiac risk.
PATIENTS WITH SEVERE AORTIC STENOSIS
Neither index lists severe aortic stenosis as a risk factor. The RCRI derivation and validation studies had only 5 patients with severe aortic stenosis, and the NSQIP validation study did not include any patients with aortic stenosis. Nevertheless, severe aortic stenosis increases the risk of cardiac complications in the perioperative period,7 making it important to consider in these patients.
Although patients with severe symptomatic aortic stenosis need valvular intervention before the surgery, patients who have asymptomatic severe aortic stenosis without associated cardiac dysfunction do not. Close hemodynamic monitoring during surgery is reasonable in the latter group.5,7
PATIENTS WITH RECENT STROKE
What would be the cardiac risk for a patient scheduled for elective hip surgery who has had a stroke within the last 3 months? If one applies both indexes, the cardiac risk comes to less than 1% (low risk) in both cases. However, this could be deceiving. A large study8 published in 2014 showed an elevated risk of cardiac complications in patients undergoing noncardiac surgery who had had an ischemic stroke within the previous 6 months; in the first 3 months, the odds ratio of developing a major adverse cardiovascular event was 14.23.This clearly overrides the traditional expert opinion-based evidence, which is that a time lapse of only 1 month after an ischemic stroke is safe for surgery.
PATIENTS WITH DIASTOLIC DYSFUNCTION
A 2016 meta-analysis and systematic review found that preoperative diastolic dysfunction was associated with higher rates of postoperative mortality and major adverse cardiac events, regardless of the left ventricular ejection fraction.9 However, the studies investigated included mostly patients undergoing cardiovascular surgeries. This raises the question of whether asymptomatic patients need echocardiography before surgery.
In a patient who has diastolic dysfunction, one should maintain adequate blood pressure control and euvolemia before the surgery and avoid hypertensive spikes in the immediate perioperative period, as hypertension is the worst enemy of those with diastolic dysfunction. Patients with atrial fibrillation may need more stringent heart rate control.
In a prospective study involving 1,005 consecutive vascular surgery patients, the 30-day cardiovascular event rate was highest in patients with symptomatic heart failure (49%), followed by those with asymptomatic systolic left ventricular dysfunction (23%), asymptomatic diastolic left ventricular dysfunction (18%), and normal left ventricular function (10%).10
Further studies are needed to determine whether the data obtained from the assessment of ventricular function in patients without signs or symptoms are significant enough to require updates to the criteria.
WHAT ABOUT THE ROLE OF BNP?
In a meta-analysis of 15 noncardiac surgery studies in 850 patients, preoperative B-type natriuretic peptide (BNP) levels independently predicted major adverse cardiac events, with levels greater than 372 pg/mL having a 36.7% incidence of major adverse cardiac events.11
A recent publication by the Canadian Cardiovascular Society12 strongly recommended measuring N-terminal-proBNP or BNP before noncardiac surgery to enhance perioperative cardiac risk estimation in patients who are age 65 or older, patients who are age 45 to 64 with significant cardiovascular disease, or patients who have an RCRI score of 1 or higher.
Further prospective randomized studies are needed to assess the utility of measuring BNP for preoperative cardiac risk evaluation.
PATIENTS WITH OBSTRUCTIVE SLEEP APNEA
Patients with obstructive sleep apnea scheduled for surgery under anesthesia have a higher risk of perioperative complications than patients without the disease, including higher rates of cardiac complications and atrial fibrillation. However, the evidence is insufficient to support canceling or delaying surgery in patients with suspected obstructive sleep apnea.
After comorbid conditions are optimally treated, patients with obstructive sleep apnea can proceed to surgery, provided strategies for mitigating complications are implemented.13
TO STRESS OR NOT TO STRESS?
A common question is whether to perform a stress test before surgery. Based on the ACC/AHA guidelines,5 preoperative stress testing is not indicated solely to assess surgical risk if there is no other indication for it.
Stress testing can be used to determine whether the patient needs coronary revascularization. However, routine coronary revascularization is not recommended before noncardiac surgery exclusively to reduce perioperative cardiac events.
This conclusion is based on a landmark trial in which revascularization had no significant effect on outcomes.14 That trial included high-risk patients undergoing major vascular surgery who had greater than 70% stenosis of 1 or more major coronary arteries on angiography, randomized to either revascularization or no revascularization. It excluded patients with severe left main artery disease, ejection fraction less than 20%, and severe aortic stenosis. Results showed no differences in the rates of postoperative death, myocardial infarction, and stroke between the 2 groups. Furthermore, there was no postoperative survival difference during 5 years of follow-up.
Stress testing may be considered for patients with elevated risk and whose functional capacity is poor (< 4 metabolic equivalents) or unknown if it will change the management strategy. Another consideration affecting whether to perform stress testing is whether the surgery can be deferred for a month if the stress test is positive and a bare-metal coronary stent is placed, to allow for completion of dual antiplatelet therapy.
SHOULD WE ROUTINELY MONITOR TROPONIN AFTER SURGERY IN ASYMPTOMATIC PATIENTS?
Currently, the role of routine monitoring of troponin postoperatively in asymptomatic patients is unclear. The Canadian Cardiovascular Society12 recommends monitoring troponin in selected group of patients, eg, those with an RCRI score of 1 or higher, age 65 or older, a significant cardiac history, or elevated BNP preoperatively. However, at this point we do not have strong evidence regarding the implications of mild asymptomatic troponin elevation postoperatively and how to manage it. Two currently ongoing randomized controlled trials will answer those questions:
- The Management of Myocardial Injury After Noncardiac Surgery (MANAGE) trial, comparing the use of dabigatran and omeprazole vs placebo in myocardial injury postoperatively
- The Study of Ticagrelor Versus Aspirin Treatment in Patients With Myocardial Injury Post Major Non-cardiac Surgery (INTREPID).
- Lee TH, Marcantonio ER, Mangione CM, et al. Derivation and prospective validation of a simple index for prediction of cardiac risk of major noncardiac surgery. Circulation 1999; 100:1043–1049.
- Gupta PK, Gupta H, Sundaram A, et al. Development and validation of a risk calculator for prediction of cardiac risk after surgery. Circulation 2011; 124:381–387.
- Devereaux PJ, Sessler DI. Cardiac complications in patients undergoing major noncardiac surgery. N Engl J Med 2015; 373:2258–2269.
- Smilowitz NR, Gupta N, Ramakrishna H, Guo Y, Berger JS, Bangalore S. Perioperative major adverse cardiovascular and cerebrovascular events associated with noncardiac surgery. JAMA Cardiol 2017; 2:181–187.
- Fleisher LA, Fleischmann KE, Auerbach AD, et al; American College of Cardiology; American Heart Association. 2014 ACC/AHA guideline on perioperative cardiovascular evaluation and management of patients undergoing noncardiac surgery: a report of the American College of Cardiology/American Heart Association Task Force on practice guidelines. J Am Coll Cardiol 2014; 64:e77–e137 [Simultaneous publication: Circulation 2014; 130:2215–2245].
- Thygesen K, Alpert JS, Jaffe AS, et al, for the Joint ESC/ACCF/AHA/WHF Task Force for the Universal Definition of Myocardial Infarction. Third universal definition of myocardial infarction. Circulation 2012; 126:2020–2035.
- Tashiro T, Pislaru SV, Blustin JM, et al. Perioperative risk of major non-cardiac surgery in patients with severe aortic stenosis: a reappraisal in contemporary practice. Eur Heart J 2014; 35:2372–2381.
- Jørgensen ME, Torp-Pedersen C, Gislason GH, et al. Time elapsed after ischemic stroke and risk of adverse cardiovascular events and mortality following elective noncardiac surgery. JAMA 2014; 312:269–277.
- Kaw R, Hernandez AV, Pasupuleti V, et al; Cardiovascular Meta-analyses Research Group. Effect of diastolic dysfunction on postoperative outcomes after cardiovascular surgery: a systematic review and meta-analysis. J Thorac Cardiovasc Surg 2016; 152:1142–1153.
- Flu WJ, van Kuijk JP, Hoeks SE, et al. Prognostic implications of asymptomatic left ventricular dysfunction in patients undergoing vascular surgery. Anesthesiology 2010; 112:1316–1324.
- Rodseth R, Lurati Buse G, Bolliger D, et al. The predictive ability of pre-operative B-type natriuretic peptide in vascular patients for major adverse cardiac events: an individual patient data meta-analysis. J Am Coll Cardiol 2011; 58:522–529.
- Duceppe E, Parlow J, MacDonald P, et al. Canadian Cardiovascular Society Guidelines on perioperative cardiac risk assessment and management for patients who undergo noncardiac surgery. Can J Cardiol 2017; 33:17–32.
- Chung F, Memtsoudis SG, Ramachandran SK, et al. Society of Anesthesia and Sleep Medicine guidelines on preoperative screening and assessment of adult patients with obstructive sleep apnea. Anesth Analg 2016; 123:452–473.
- McFalls EO, Ward HB, Moritz TE, et al. Coronary-artery revascularization before elective major vascular surgery. N Engl J Med 2004; 351:2795–2804.
Neither of the two cardiac risk assessment indexes most commonly used (Table 1)1,2 is completely accurate, nor is one superior to the other. To provide the most accurate assessment of cardiac risk, practitioners need to select the index most applicable to the circumstances of the individual patient.
CARDIAC COMPLICATIONS ARE INCREASING
CARDIAC RISK ASSESSMENT INDEXES
The 2 risk assessment indexes most often used are:
- The Revised Cardiac Risk Index (RCRI)1
- The National Surgical Quality Improvement Program (NSQIP) risk index, also known as the Gupta index.2
Both are endorsed by the American College of Cardiology (ACC) and the American Heart Association (AHA).5 The RCRI, introduced in 1999, is more commonly used, but the NSQIP, introduced in 2011, is based on a larger sample size.
Both indexes consider various factors in estimating the risk, with some overlap. The main outcome assessed in both indexes is the risk of a major cardiac event, ie, myocardial infarction or cardiac arrest. The RCRI outcome also includes ventricular fibrillation, complete heart block, and pulmonary edema, which may be sequelae to cardiac arrest and myocardial infarction. This difference in defined outcomes between the indexes is not likely to account for a significant variation in the prediction of risk; however, this is difficult to prove.
Each index defines myocardial infarction differently. The current clinical definition6 includes detection of a rise or fall of cardiac biomarker values (preferably cardiac troponins) with at least 1 value above the 99th percentile upper reference limit and at least 1 of the following:
- Symptoms of ischemia
- New ST-T wave changes or new left bundle branch block
- New pathologic Q waves
- Imaging evidence of new loss of viable myocardium tissue or new regional wall- motion abnormality
- Finding of an intracoronary thrombus.
As seen in Table 1, the definition of myocardial infarction in NSQIP was one of the following: ST-segment elevation, new left bundle branch block, Q waves, or a troponin level greater than 3 times normal. Patients may have mild troponin leak of unknown significance without chest pain after surgery. This suggests that NSQIP may have overdiagnosed myocardial infarction.
USE IN CLINICAL PRACTICE
In clinical practice, which risk index is more accurate? Should clinicians become familiar with one index and keep using it? The 2014 ACC/AHA guidelines5 do not recommend one over the other, nor do they define the clinical situations that could lead to significant underestimation of risk.
The following are cases in which the indexes provide contradictory risk assessments.
Case 1. A 60-year-old man scheduled for surgery has diabetes mellitus, for which he takes insulin, and stable heart failure (left ventricular ejection fraction 40%). His RCRI score is 2, indicating an elevated 7% risk of cardiac complications; however, his NSQIP index is 0.31%. In this case, the NSQIP index probably underestimates the risk, as insulin-dependent diabetes and heart failure are not variables in the NSQIP index.
Case 2. A 60-year-old man who is partially functionally dependent and is on oxygen for severe chronic obstructive pulmonary disease is scheduled for craniotomy. His RCRI score is 0 (low risk), but his NSQIP index score (4.87%) indicates an elevated risk of cardiac complications based on his functional status, symptomatic chronic obstructive pulmonary disease, and high-risk surgery. In this case, the RCRI probably underestimates the risk.
These cases show that practitioners should not rely on just one index, but should rather decide which index to apply case by case. This avoids underestimating the risk. In patients with poor functional status and higher American Society of Anesthesiology class, the NSQIP index may provide a more accurate risk estimation than the RCRI. Patients with cardiomyopathy as well as those with insulin-dependent diabetes may be well assessed by the RCRI.
The following situations require additional caution when using these indexes, to avoid over- and underestimating cardiac risk.
PATIENTS WITH SEVERE AORTIC STENOSIS
Neither index lists severe aortic stenosis as a risk factor. The RCRI derivation and validation studies had only 5 patients with severe aortic stenosis, and the NSQIP validation study did not include any patients with aortic stenosis. Nevertheless, severe aortic stenosis increases the risk of cardiac complications in the perioperative period,7 making it important to consider in these patients.
Although patients with severe symptomatic aortic stenosis need valvular intervention before the surgery, patients who have asymptomatic severe aortic stenosis without associated cardiac dysfunction do not. Close hemodynamic monitoring during surgery is reasonable in the latter group.5,7
PATIENTS WITH RECENT STROKE
What would be the cardiac risk for a patient scheduled for elective hip surgery who has had a stroke within the last 3 months? If one applies both indexes, the cardiac risk comes to less than 1% (low risk) in both cases. However, this could be deceiving. A large study8 published in 2014 showed an elevated risk of cardiac complications in patients undergoing noncardiac surgery who had had an ischemic stroke within the previous 6 months; in the first 3 months, the odds ratio of developing a major adverse cardiovascular event was 14.23.This clearly overrides the traditional expert opinion-based evidence, which is that a time lapse of only 1 month after an ischemic stroke is safe for surgery.
PATIENTS WITH DIASTOLIC DYSFUNCTION
A 2016 meta-analysis and systematic review found that preoperative diastolic dysfunction was associated with higher rates of postoperative mortality and major adverse cardiac events, regardless of the left ventricular ejection fraction.9 However, the studies investigated included mostly patients undergoing cardiovascular surgeries. This raises the question of whether asymptomatic patients need echocardiography before surgery.
In a patient who has diastolic dysfunction, one should maintain adequate blood pressure control and euvolemia before the surgery and avoid hypertensive spikes in the immediate perioperative period, as hypertension is the worst enemy of those with diastolic dysfunction. Patients with atrial fibrillation may need more stringent heart rate control.
In a prospective study involving 1,005 consecutive vascular surgery patients, the 30-day cardiovascular event rate was highest in patients with symptomatic heart failure (49%), followed by those with asymptomatic systolic left ventricular dysfunction (23%), asymptomatic diastolic left ventricular dysfunction (18%), and normal left ventricular function (10%).10
Further studies are needed to determine whether the data obtained from the assessment of ventricular function in patients without signs or symptoms are significant enough to require updates to the criteria.
WHAT ABOUT THE ROLE OF BNP?
In a meta-analysis of 15 noncardiac surgery studies in 850 patients, preoperative B-type natriuretic peptide (BNP) levels independently predicted major adverse cardiac events, with levels greater than 372 pg/mL having a 36.7% incidence of major adverse cardiac events.11
A recent publication by the Canadian Cardiovascular Society12 strongly recommended measuring N-terminal-proBNP or BNP before noncardiac surgery to enhance perioperative cardiac risk estimation in patients who are age 65 or older, patients who are age 45 to 64 with significant cardiovascular disease, or patients who have an RCRI score of 1 or higher.
Further prospective randomized studies are needed to assess the utility of measuring BNP for preoperative cardiac risk evaluation.
PATIENTS WITH OBSTRUCTIVE SLEEP APNEA
Patients with obstructive sleep apnea scheduled for surgery under anesthesia have a higher risk of perioperative complications than patients without the disease, including higher rates of cardiac complications and atrial fibrillation. However, the evidence is insufficient to support canceling or delaying surgery in patients with suspected obstructive sleep apnea.
After comorbid conditions are optimally treated, patients with obstructive sleep apnea can proceed to surgery, provided strategies for mitigating complications are implemented.13
TO STRESS OR NOT TO STRESS?
A common question is whether to perform a stress test before surgery. Based on the ACC/AHA guidelines,5 preoperative stress testing is not indicated solely to assess surgical risk if there is no other indication for it.
Stress testing can be used to determine whether the patient needs coronary revascularization. However, routine coronary revascularization is not recommended before noncardiac surgery exclusively to reduce perioperative cardiac events.
This conclusion is based on a landmark trial in which revascularization had no significant effect on outcomes.14 That trial included high-risk patients undergoing major vascular surgery who had greater than 70% stenosis of 1 or more major coronary arteries on angiography, randomized to either revascularization or no revascularization. It excluded patients with severe left main artery disease, ejection fraction less than 20%, and severe aortic stenosis. Results showed no differences in the rates of postoperative death, myocardial infarction, and stroke between the 2 groups. Furthermore, there was no postoperative survival difference during 5 years of follow-up.
Stress testing may be considered for patients with elevated risk and whose functional capacity is poor (< 4 metabolic equivalents) or unknown if it will change the management strategy. Another consideration affecting whether to perform stress testing is whether the surgery can be deferred for a month if the stress test is positive and a bare-metal coronary stent is placed, to allow for completion of dual antiplatelet therapy.
SHOULD WE ROUTINELY MONITOR TROPONIN AFTER SURGERY IN ASYMPTOMATIC PATIENTS?
Currently, the role of routine monitoring of troponin postoperatively in asymptomatic patients is unclear. The Canadian Cardiovascular Society12 recommends monitoring troponin in selected group of patients, eg, those with an RCRI score of 1 or higher, age 65 or older, a significant cardiac history, or elevated BNP preoperatively. However, at this point we do not have strong evidence regarding the implications of mild asymptomatic troponin elevation postoperatively and how to manage it. Two currently ongoing randomized controlled trials will answer those questions:
- The Management of Myocardial Injury After Noncardiac Surgery (MANAGE) trial, comparing the use of dabigatran and omeprazole vs placebo in myocardial injury postoperatively
- The Study of Ticagrelor Versus Aspirin Treatment in Patients With Myocardial Injury Post Major Non-cardiac Surgery (INTREPID).
- Lee TH, Marcantonio ER, Mangione CM, et al. Derivation and prospective validation of a simple index for prediction of cardiac risk of major noncardiac surgery. Circulation 1999; 100:1043–1049.
- Gupta PK, Gupta H, Sundaram A, et al. Development and validation of a risk calculator for prediction of cardiac risk after surgery. Circulation 2011; 124:381–387.
- Devereaux PJ, Sessler DI. Cardiac complications in patients undergoing major noncardiac surgery. N Engl J Med 2015; 373:2258–2269.
- Smilowitz NR, Gupta N, Ramakrishna H, Guo Y, Berger JS, Bangalore S. Perioperative major adverse cardiovascular and cerebrovascular events associated with noncardiac surgery. JAMA Cardiol 2017; 2:181–187.
- Fleisher LA, Fleischmann KE, Auerbach AD, et al; American College of Cardiology; American Heart Association. 2014 ACC/AHA guideline on perioperative cardiovascular evaluation and management of patients undergoing noncardiac surgery: a report of the American College of Cardiology/American Heart Association Task Force on practice guidelines. J Am Coll Cardiol 2014; 64:e77–e137 [Simultaneous publication: Circulation 2014; 130:2215–2245].
- Thygesen K, Alpert JS, Jaffe AS, et al, for the Joint ESC/ACCF/AHA/WHF Task Force for the Universal Definition of Myocardial Infarction. Third universal definition of myocardial infarction. Circulation 2012; 126:2020–2035.
- Tashiro T, Pislaru SV, Blustin JM, et al. Perioperative risk of major non-cardiac surgery in patients with severe aortic stenosis: a reappraisal in contemporary practice. Eur Heart J 2014; 35:2372–2381.
- Jørgensen ME, Torp-Pedersen C, Gislason GH, et al. Time elapsed after ischemic stroke and risk of adverse cardiovascular events and mortality following elective noncardiac surgery. JAMA 2014; 312:269–277.
- Kaw R, Hernandez AV, Pasupuleti V, et al; Cardiovascular Meta-analyses Research Group. Effect of diastolic dysfunction on postoperative outcomes after cardiovascular surgery: a systematic review and meta-analysis. J Thorac Cardiovasc Surg 2016; 152:1142–1153.
- Flu WJ, van Kuijk JP, Hoeks SE, et al. Prognostic implications of asymptomatic left ventricular dysfunction in patients undergoing vascular surgery. Anesthesiology 2010; 112:1316–1324.
- Rodseth R, Lurati Buse G, Bolliger D, et al. The predictive ability of pre-operative B-type natriuretic peptide in vascular patients for major adverse cardiac events: an individual patient data meta-analysis. J Am Coll Cardiol 2011; 58:522–529.
- Duceppe E, Parlow J, MacDonald P, et al. Canadian Cardiovascular Society Guidelines on perioperative cardiac risk assessment and management for patients who undergo noncardiac surgery. Can J Cardiol 2017; 33:17–32.
- Chung F, Memtsoudis SG, Ramachandran SK, et al. Society of Anesthesia and Sleep Medicine guidelines on preoperative screening and assessment of adult patients with obstructive sleep apnea. Anesth Analg 2016; 123:452–473.
- McFalls EO, Ward HB, Moritz TE, et al. Coronary-artery revascularization before elective major vascular surgery. N Engl J Med 2004; 351:2795–2804.

The Frontier of Transition Medicine: A Unique Inpatient Model for Transitions of Care
The transition of care from pediatric to adult providers has drawn increased national attention to the survival of patients with chronic childhood conditions into adulthood.ttps://www.ncbi.nlm.nih.gov/books/NBK11432/ While survival outcomes have improved due to advances in care, many of these patients experience gaps in medical care when they move from pediatric to adult healthcare systems, resulting in age-inappropriate and fragmented care in adulthood.4 Many youth with chronic childhood conditions are not prepared to move into adult healthcare, and this lack of transition preparation is associated with poorer health outcomes, including elevated glycosylated hemoglobin and loss of transplanted organs.5-7 National transition efforts have largely focused on the outpatient setting and there remains a paucity of literature on inpatient transitions of care.8,9 Although transition-age patients represent a small percentage of patients at children’s hospitals, they accumulate more hospital days and have higher resource utilization compared to their pediatric cohorts.10 In this issue, Coller et al.11 characterize the current state of pediatric to adult inpatient transitions of care among general pediatric services at US children’s hospitals. Over 50% of children’s hospitals did not have a specific adult-oriented hospital identified to receive transitioning patients. Fewer than half of hospitals (38%) had an explicit inpatient transition policy. Notably only 2% of hospitals could track patient outcomes through transitions; however, 41% had systems in place to address insurance issues. Institutions with combined internal medicine-pediatric (Med-Peds) providers more frequently had inpatient transition initiatives (P = .04). It is clear from Coller et al.11 that the adoption of transition initiatives has been delayed since its introduction at the US Surgeon’s conference in 1989, and much work is needed to bridge this gap.12
Coller et al.11 spearhead establishing standardized transition programs using the multidisciplinary Six Core Elements framework and highlight effective techniques from existing inpatient transition processes.13 While we encourage providers to utilize existing partnerships in the outpatient community to bridge the gap for this at-risk population, shifting to adult care continues to be disorganized in the face of some key barriers including challenges in addressing psychosocial needs, gaps in insurance, and poor care coordination between pediatric and adult healthcare systems.4
We propose several inpatient activities to improve transitions. First, we suggest the development of an inpatient transition or Med-Peds consult service across all hospitals. The Med-Peds consult service would implement the Six Core Elements, including transition readiness, transition planning, and providing insurance and referral resources. A Med-Peds consult service has been well received at our institution as it identifies clear leaders with expertise in transition. Coller et al.11 report only 11% of children’s hospitals surveyed had transition policies that referenced inpatient transitions of care. For those institutions without Med-Peds providers, we recommend establishing a hospital-wide transition policy, and identifying hospitalists trained in transitions, with multidisciplinary approaches to staff their transition consult service.
Tracking and monitoring youth in the inpatient transition process occurred in only 2% of hospitals surveyed. We urge for automatic consults to the transition service for adult aged patients admitted to children’s hospitals. With current electronic health records (EHRs), admission order sets with built-in transition consults for adolescents and young adults would improve the identification and tracking of youths. Assuming care of a pediatric patient with multiple comorbidities can be overwhelming for providers.14 The transition consult service could alleviate some of this anxiety with clear and concise documentation using standardized, readily available transition templates. These templates would summarize the patient’s past medical history and outline current medical problems, necessary subspecialty referrals, insurance status, limitations in activities of daily living, ancillary services (including physical therapy, occupational therapy, speech therapy, transportation services), and current level of readiness and independence.
In summary, the transition of care from pediatric to adult providers is a particularly vulnerable time for young adults with chronic medical conditions, and efforts focused on inpatient transitions of medical care have overall been limited. Crucial barriers include addressing psychosocial needs, gaps in insurance, and poor communication between pediatric and adult providers.4 Coller et al.11 have identified several gaps in inpatient transitions of care as well as multiple areas of focus to improve the patient experience. Based on the findings of this study, we urge children’s hospitals caring for adult patients to identify transition leaders, partner with an adult hospital to foster effective transitions, and to protocolize inpatient and outpatient models of transition. Perhaps the most concerning finding of this study was the widespread inability to track transition outcomes. Our group’s experience has led us to believe that coupling an inpatient transition consult team with EHR-based interventions to identify patients and follow outcomes has the most potential to improve inpatient transitions of care from pediatric to adult providers.
Disclosure
The authors have no conflicts of interests or financial disclosures.
1. Elborn JS, Shale DJ, Britton JR. Cystic fibrosis: current survival and population estimates to the year 2000. Thorax. 1991;46(12):881-885.
2. Reid GJ, Webb GD, Barzel M, McCrindle BW, Irvine MJ, Siu SC. Estimates of life expectancy by adolescents and young adults with congenital heart disease. J Am Coll Cardiol. 2006;48(2):349-355. doi:10.1016/j.jacc.2006.03.041.
3. Ferris ME, Gipson DS, Kimmel PL, Eggers PW. Trends in treatment and outcomes of survival of adolescents initiating end-stage renal disease care in the United States of America. Pediatr Nephrol. 2006;21(7):1020-1026. doi:10.1007/s00467-006-0059-9.
4. Sharma N, O’Hare K, Antonelli RC, Sawicki GS. Transition care: future directions in education, health policy, and outcomes research. Acad Pediatr. 2014;14(2):120-127. doi:10.1016/j.acap.2013.11.007.
5. Harden PN, Walsh G, Bandler N, et al. Bridging the gap: an integrated paediatric to adult clinical service for young adults with kidney failure. BMJ. 2012;344:e3718. doi:10.1136/bmj.e3718.
6. Watson AR. Non-compliance and transfer from paediatric to adult transplant unit. Pediatr Nephrol. 2000;14(6):469-472.
7. Lotstein DS, Seid M, Klingensmith G, et al. Transition from pediatric to adult care for youth diagnosed with type 1 diabetes in adolescence. Pediatrics. 2013;131(4):e1062-1070. doi:10.1542/peds.2012-1450.
8. Scal P. Transition for youth with chronic conditions: primary care physicians’ approaches. Pediatrics. 2002;110(6 Pt 2):1315-1321.
9. Kelly AM, Kratz B, Bielski M, Rinehart PM. Implementing transitions for youth with complex chronic conditions using the medical home model. Pediatrics. 2002;110(6 Pt 2):1322-1327.
10. Goodman DM, Hall M, Levin A, et al. Adults with chronic health conditions originating in childhood: inpatient experience in children’s hospitals. Pediatrics. 2011;128(1):5-13. doi:10.1542/peds.2010-2037.
11. Coller RJ, Ahrens S, Ehlenbach M, et al. Transitioning from General Pediatric to Adult-Oriented Inpatient Care: National Survey of US Children’s Hospitals. J Hosp Med. 2018;13(1):13-20.
12. Olson D. Health Care Transitions for Young People. In Field MJ, Jette AM, Institute of Medicine (US) Committee on Disability in America, editors. The Future of Disability in America. Washington, DC: National Academy Press; 2007. https://www.ncbi.nlm.nih.gov/books/NBK11432/.
13. GotTransition.org. http://www.gottransition.org/. Accessed September 15, 2017.
14. Okumura MJ, Kerr EA, Cabana MD, Davis MM, Demonner S, Heisler M. Physician views on barriers to primary care for young adults with childhood-onset chronic disease. Pediatrics. 2010;125(4):e748-754. doi:10.1542/peds.2008-3451.
The transition of care from pediatric to adult providers has drawn increased national attention to the survival of patients with chronic childhood conditions into adulthood.ttps://www.ncbi.nlm.nih.gov/books/NBK11432/ While survival outcomes have improved due to advances in care, many of these patients experience gaps in medical care when they move from pediatric to adult healthcare systems, resulting in age-inappropriate and fragmented care in adulthood.4 Many youth with chronic childhood conditions are not prepared to move into adult healthcare, and this lack of transition preparation is associated with poorer health outcomes, including elevated glycosylated hemoglobin and loss of transplanted organs.5-7 National transition efforts have largely focused on the outpatient setting and there remains a paucity of literature on inpatient transitions of care.8,9 Although transition-age patients represent a small percentage of patients at children’s hospitals, they accumulate more hospital days and have higher resource utilization compared to their pediatric cohorts.10 In this issue, Coller et al.11 characterize the current state of pediatric to adult inpatient transitions of care among general pediatric services at US children’s hospitals. Over 50% of children’s hospitals did not have a specific adult-oriented hospital identified to receive transitioning patients. Fewer than half of hospitals (38%) had an explicit inpatient transition policy. Notably only 2% of hospitals could track patient outcomes through transitions; however, 41% had systems in place to address insurance issues. Institutions with combined internal medicine-pediatric (Med-Peds) providers more frequently had inpatient transition initiatives (P = .04). It is clear from Coller et al.11 that the adoption of transition initiatives has been delayed since its introduction at the US Surgeon’s conference in 1989, and much work is needed to bridge this gap.12
Coller et al.11 spearhead establishing standardized transition programs using the multidisciplinary Six Core Elements framework and highlight effective techniques from existing inpatient transition processes.13 While we encourage providers to utilize existing partnerships in the outpatient community to bridge the gap for this at-risk population, shifting to adult care continues to be disorganized in the face of some key barriers including challenges in addressing psychosocial needs, gaps in insurance, and poor care coordination between pediatric and adult healthcare systems.4
We propose several inpatient activities to improve transitions. First, we suggest the development of an inpatient transition or Med-Peds consult service across all hospitals. The Med-Peds consult service would implement the Six Core Elements, including transition readiness, transition planning, and providing insurance and referral resources. A Med-Peds consult service has been well received at our institution as it identifies clear leaders with expertise in transition. Coller et al.11 report only 11% of children’s hospitals surveyed had transition policies that referenced inpatient transitions of care. For those institutions without Med-Peds providers, we recommend establishing a hospital-wide transition policy, and identifying hospitalists trained in transitions, with multidisciplinary approaches to staff their transition consult service.
Tracking and monitoring youth in the inpatient transition process occurred in only 2% of hospitals surveyed. We urge for automatic consults to the transition service for adult aged patients admitted to children’s hospitals. With current electronic health records (EHRs), admission order sets with built-in transition consults for adolescents and young adults would improve the identification and tracking of youths. Assuming care of a pediatric patient with multiple comorbidities can be overwhelming for providers.14 The transition consult service could alleviate some of this anxiety with clear and concise documentation using standardized, readily available transition templates. These templates would summarize the patient’s past medical history and outline current medical problems, necessary subspecialty referrals, insurance status, limitations in activities of daily living, ancillary services (including physical therapy, occupational therapy, speech therapy, transportation services), and current level of readiness and independence.
In summary, the transition of care from pediatric to adult providers is a particularly vulnerable time for young adults with chronic medical conditions, and efforts focused on inpatient transitions of medical care have overall been limited. Crucial barriers include addressing psychosocial needs, gaps in insurance, and poor communication between pediatric and adult providers.4 Coller et al.11 have identified several gaps in inpatient transitions of care as well as multiple areas of focus to improve the patient experience. Based on the findings of this study, we urge children’s hospitals caring for adult patients to identify transition leaders, partner with an adult hospital to foster effective transitions, and to protocolize inpatient and outpatient models of transition. Perhaps the most concerning finding of this study was the widespread inability to track transition outcomes. Our group’s experience has led us to believe that coupling an inpatient transition consult team with EHR-based interventions to identify patients and follow outcomes has the most potential to improve inpatient transitions of care from pediatric to adult providers.
Disclosure
The authors have no conflicts of interests or financial disclosures.
1. Elborn JS, Shale DJ, Britton JR. Cystic fibrosis: current survival and population estimates to the year 2000. Thorax. 1991;46(12):881-885.
2. Reid GJ, Webb GD, Barzel M, McCrindle BW, Irvine MJ, Siu SC. Estimates of life expectancy by adolescents and young adults with congenital heart disease. J Am Coll Cardiol. 2006;48(2):349-355. doi:10.1016/j.jacc.2006.03.041.
3. Ferris ME, Gipson DS, Kimmel PL, Eggers PW. Trends in treatment and outcomes of survival of adolescents initiating end-stage renal disease care in the United States of America. Pediatr Nephrol. 2006;21(7):1020-1026. doi:10.1007/s00467-006-0059-9.
4. Sharma N, O’Hare K, Antonelli RC, Sawicki GS. Transition care: future directions in education, health policy, and outcomes research. Acad Pediatr. 2014;14(2):120-127. doi:10.1016/j.acap.2013.11.007.
5. Harden PN, Walsh G, Bandler N, et al. Bridging the gap: an integrated paediatric to adult clinical service for young adults with kidney failure. BMJ. 2012;344:e3718. doi:10.1136/bmj.e3718.
6. Watson AR. Non-compliance and transfer from paediatric to adult transplant unit. Pediatr Nephrol. 2000;14(6):469-472.
7. Lotstein DS, Seid M, Klingensmith G, et al. Transition from pediatric to adult care for youth diagnosed with type 1 diabetes in adolescence. Pediatrics. 2013;131(4):e1062-1070. doi:10.1542/peds.2012-1450.
8. Scal P. Transition for youth with chronic conditions: primary care physicians’ approaches. Pediatrics. 2002;110(6 Pt 2):1315-1321.
9. Kelly AM, Kratz B, Bielski M, Rinehart PM. Implementing transitions for youth with complex chronic conditions using the medical home model. Pediatrics. 2002;110(6 Pt 2):1322-1327.
10. Goodman DM, Hall M, Levin A, et al. Adults with chronic health conditions originating in childhood: inpatient experience in children’s hospitals. Pediatrics. 2011;128(1):5-13. doi:10.1542/peds.2010-2037.
11. Coller RJ, Ahrens S, Ehlenbach M, et al. Transitioning from General Pediatric to Adult-Oriented Inpatient Care: National Survey of US Children’s Hospitals. J Hosp Med. 2018;13(1):13-20.
12. Olson D. Health Care Transitions for Young People. In Field MJ, Jette AM, Institute of Medicine (US) Committee on Disability in America, editors. The Future of Disability in America. Washington, DC: National Academy Press; 2007. https://www.ncbi.nlm.nih.gov/books/NBK11432/.
13. GotTransition.org. http://www.gottransition.org/. Accessed September 15, 2017.
14. Okumura MJ, Kerr EA, Cabana MD, Davis MM, Demonner S, Heisler M. Physician views on barriers to primary care for young adults with childhood-onset chronic disease. Pediatrics. 2010;125(4):e748-754. doi:10.1542/peds.2008-3451.
© 2018 Society of Hospital Medicine
Too Much of a Good Thing: Appropriate CTPA Use in the Diagnosis of PE
There is abundant evidence that the use of computed tomography pulmonary angiography (CTPA) is increasing in emergency departments and more patients are being diagnosed with pulmonary embolism (PE).1,2 The increasing availability and resolution of CTPA technology since the late 1990s has led some to suggest that PE is now being overdiagnosed, which is supported by decreasing PE case–fatality rates and the detection of small, subsegmental clots that do not result in any meaningful right-ventricular dysfunction.3,4 Indeed, recent guidelines allow that not all small PEs require anticoagulation therapy.5 Beyond overdiagnosis, there are potential patient-level harms associated with the liberal use of CTPA imaging, including the consequences of radiation and intravenous contrast exposure.4,6 At the societal level, excess CTPA use contributes to the growing costs of healthcare.2,7
Despite the above concerns, CTPA remains the diagnostic test of choice for PE. There are multiple approaches that are suggested to appropriately use CTPA in the workup of suspected PE, the most common of which is endorsed by best practice publications and combines a clinical score (eg, Well’s score) with D-dimer testing, reserving CTPA for those patients with high clinical risk and/or positive D-dimer.8,9 Despite the professional recommendation, studies have shown that the use of PE diagnostic algorithms in clinical practice is suboptimal, resulting in much practice variation and contributing to the overuse of CTPA.10,11 In this issue, as a means of clarifying what measures improve adherence with recommended best practices, Deblois and colleagues12 perform a systematic review of the published interventions that have attempted to reduce CTPA imaging in the diagnosis of PE.
Deblois and colleagues are to be commended for summarizing what is unfortunately a very heterogeneous literature, the limitations of which precluded a formal meta-analysis. The authors report that most of the 17 reviewed studies incorporated either electronic clinical decision support (CDS; usually imbedded into a computerized physician order entry) tools or educational interventions in a retrospective, before-and-after design; only 3 studies were experimental and included a control group. Most of the studies included efficacy, with a few evaluating safety. There was little available evidence regarding cost-effectiveness or barriers to implementation. The most studied approach, CDS, was associated with a decrease in the use of CTPA of between 8.3% and 25.4% along with an increase in PE diagnostic yield of between 3.3% and 4.4%. Likewise, the appropriate use of CTPA (consistent with best practice recommendations) increased with CDS intervention f
As discussed by the authors, CDS was the most studied and most effective intervention to improve appropriate CTPA use, albeit modest in its impact. The lack of contextual details about what factors made CDS effective or not effective makes it difficult to make general recommendations. One cited study did include physician reasons for not embracing CDS, which are not surprising in nature and reflect concerns about impaired efficiency and preference for native clinical judgement over that of electronic tools.
Moving forward, CDS, perhaps coupled with performance feedback, seems to offer the best hope of reducing inappropriate CTPA use. The growing use of electronic medical records, which is accelerated in the United States by the meaningful use provisions of the Health Information Technology for Economic and Clinical Health Act of 2009, implies that CDS tools are going to be implemented across the spectrum of diagnoses, including that of PE.13 The goals of CDS interventions, namely improved patient safety, quality, and cost-effectiveness, are more likely to be achieved if those studying and designing these electronic tools understand the day-to-day practice of clinical medicine. As summarized by Bates and colleagues14 in the “Ten Commandments for Effective Clinical Decision Support,” CDS interventions will be successful in changing physician behavior and promoting the right test or treatment only if they seamlessly fit into the clinical workflow, have no impact on (or improve upon) physician efficiency, and minimize the need for additional information from the user. As suggested by Deblois et al.,12 future studies of CDS interventions that aim to align CTPA use with recommended best practices should incorporate more rigorous methodological quality, include safety and cost-effectiveness outcomes, and, perhaps most importantly, attempt to understand the environmental and organizational factors that contribute to CDS tool effectiveness.
Disclosure
The authors have declared no conflicts of interest.
1. Kocher KE, Meurer WJ, Fazel R, Scott PA, Krumholz HM, Nallamothu BK. National trends in use of computed tomography in the emergency department. Ann Emerg Med. 2011;58(5):452-462. PubMed
2. Smith SB, Geske JB, Kathuria P, et al. Analysis of National Trends in Admissions for Pulmonary Embolism. Chest. 2016;150(1):35-45. PubMed
3. Wiener RS, Schwartz LM, Woloshin S. Time trends in pulmonary embolism in the United States: evidence of overdiagnosis. Arch Intern Med. 2011;171(9):831-837. PubMed
4. Wiener RS, Schwartz LM, Woloshin S. When a test is too good: how CT pulmonary angiograms find pulmonary emboli that do not need to be found. BMJ. 2013;347:f3368. PubMed
5. Kearon C, Akl EA, Ornelas J, et al. Antithrombotic Therapy for VTE Disease: CHEST Guideline and Expert Panel Report. Chest. 2016;149(2):315-352. PubMed
6. Sarma A, Heilbrun ME, Conner KE, Stevens SM, Woller SC, Elliott CG. Radiation and chest CT scan examinations: what do we know? Chest. 2012;142(3):750-760. PubMed
7. Fanikos J, Rao A, Seger AC, Carter D, Piazza G, Goldhaber SZ. Hospital costs of acute pulmonary embolism. Am J Med. 2013;126(2):127-132. PubMed
8. Raja AS, Greenberg JO, Qaseem A, et al. Evaluation of Patients With Suspected Acute Pulmonary Embolism: Best Practice Advice From the Clinical Guidelines Committee of the American College of Physicians. Ann Intern Med. 2015;163(9):701-711. PubMed
9. Schuur JD, Carney DP, Lyn ET, et al. A top-five list for emergency medicine: a pilot project to improve the value of emergency care. JAMA Intern Med. 2014;174(4):509-515. PubMed
10. Alhassan S, Sayf AA, Arsene C, Krayem H. Suboptimal implementation of diagnostic algorithms and overuse of computed tomography-pulmonary angiography in patients with suspected pulmonary embolism. Ann Thorac Med. 2016;11(4):254-260. PubMed
11. Crichlow A, Cuker A, Mills AM. Overuse of computed tomography pulmonary angiography in the evaluation of patients with suspected pulmonary embolism in the emergency department. Acad Emerg Med. 2012;19(11):1219-1226. PubMed
12. Deblois S, Chartrand-Lefebvre C, Toporwicz K, Zhongyi C, Lepanto L. Interventions to reduce the overuse of imaging for pulmonary embolism: a systematic review. J Hosp Med. 2018;13(1):52-61. PubMed
13. Murphy EV. Clinical decision support: effectiveness in improving quality processes and clinical outcomes and factors that may influence success. Yale J Biol Med. 2014;87(2):187-197. PubMed
14. Bates DW, Kuperman GJ, Wang S, et al. Ten commandments for effective clinical decision support: making the practice of evidence-based medicine a reality. J Am Med Inform Assoc. 2003;10(6):523-530. PubMed
There is abundant evidence that the use of computed tomography pulmonary angiography (CTPA) is increasing in emergency departments and more patients are being diagnosed with pulmonary embolism (PE).1,2 The increasing availability and resolution of CTPA technology since the late 1990s has led some to suggest that PE is now being overdiagnosed, which is supported by decreasing PE case–fatality rates and the detection of small, subsegmental clots that do not result in any meaningful right-ventricular dysfunction.3,4 Indeed, recent guidelines allow that not all small PEs require anticoagulation therapy.5 Beyond overdiagnosis, there are potential patient-level harms associated with the liberal use of CTPA imaging, including the consequences of radiation and intravenous contrast exposure.4,6 At the societal level, excess CTPA use contributes to the growing costs of healthcare.2,7
Despite the above concerns, CTPA remains the diagnostic test of choice for PE. There are multiple approaches that are suggested to appropriately use CTPA in the workup of suspected PE, the most common of which is endorsed by best practice publications and combines a clinical score (eg, Well’s score) with D-dimer testing, reserving CTPA for those patients with high clinical risk and/or positive D-dimer.8,9 Despite the professional recommendation, studies have shown that the use of PE diagnostic algorithms in clinical practice is suboptimal, resulting in much practice variation and contributing to the overuse of CTPA.10,11 In this issue, as a means of clarifying what measures improve adherence with recommended best practices, Deblois and colleagues12 perform a systematic review of the published interventions that have attempted to reduce CTPA imaging in the diagnosis of PE.
Deblois and colleagues are to be commended for summarizing what is unfortunately a very heterogeneous literature, the limitations of which precluded a formal meta-analysis. The authors report that most of the 17 reviewed studies incorporated either electronic clinical decision support (CDS; usually imbedded into a computerized physician order entry) tools or educational interventions in a retrospective, before-and-after design; only 3 studies were experimental and included a control group. Most of the studies included efficacy, with a few evaluating safety. There was little available evidence regarding cost-effectiveness or barriers to implementation. The most studied approach, CDS, was associated with a decrease in the use of CTPA of between 8.3% and 25.4% along with an increase in PE diagnostic yield of between 3.3% and 4.4%. Likewise, the appropriate use of CTPA (consistent with best practice recommendations) increased with CDS intervention f
As discussed by the authors, CDS was the most studied and most effective intervention to improve appropriate CTPA use, albeit modest in its impact. The lack of contextual details about what factors made CDS effective or not effective makes it difficult to make general recommendations. One cited study did include physician reasons for not embracing CDS, which are not surprising in nature and reflect concerns about impaired efficiency and preference for native clinical judgement over that of electronic tools.
Moving forward, CDS, perhaps coupled with performance feedback, seems to offer the best hope of reducing inappropriate CTPA use. The growing use of electronic medical records, which is accelerated in the United States by the meaningful use provisions of the Health Information Technology for Economic and Clinical Health Act of 2009, implies that CDS tools are going to be implemented across the spectrum of diagnoses, including that of PE.13 The goals of CDS interventions, namely improved patient safety, quality, and cost-effectiveness, are more likely to be achieved if those studying and designing these electronic tools understand the day-to-day practice of clinical medicine. As summarized by Bates and colleagues14 in the “Ten Commandments for Effective Clinical Decision Support,” CDS interventions will be successful in changing physician behavior and promoting the right test or treatment only if they seamlessly fit into the clinical workflow, have no impact on (or improve upon) physician efficiency, and minimize the need for additional information from the user. As suggested by Deblois et al.,12 future studies of CDS interventions that aim to align CTPA use with recommended best practices should incorporate more rigorous methodological quality, include safety and cost-effectiveness outcomes, and, perhaps most importantly, attempt to understand the environmental and organizational factors that contribute to CDS tool effectiveness.
Disclosure
The authors have declared no conflicts of interest.
1. Kocher KE, Meurer WJ, Fazel R, Scott PA, Krumholz HM, Nallamothu BK. National trends in use of computed tomography in the emergency department. Ann Emerg Med. 2011;58(5):452-462. PubMed
2. Smith SB, Geske JB, Kathuria P, et al. Analysis of National Trends in Admissions for Pulmonary Embolism. Chest. 2016;150(1):35-45. PubMed
3. Wiener RS, Schwartz LM, Woloshin S. Time trends in pulmonary embolism in the United States: evidence of overdiagnosis. Arch Intern Med. 2011;171(9):831-837. PubMed
4. Wiener RS, Schwartz LM, Woloshin S. When a test is too good: how CT pulmonary angiograms find pulmonary emboli that do not need to be found. BMJ. 2013;347:f3368. PubMed
5. Kearon C, Akl EA, Ornelas J, et al. Antithrombotic Therapy for VTE Disease: CHEST Guideline and Expert Panel Report. Chest. 2016;149(2):315-352. PubMed
6. Sarma A, Heilbrun ME, Conner KE, Stevens SM, Woller SC, Elliott CG. Radiation and chest CT scan examinations: what do we know? Chest. 2012;142(3):750-760. PubMed
7. Fanikos J, Rao A, Seger AC, Carter D, Piazza G, Goldhaber SZ. Hospital costs of acute pulmonary embolism. Am J Med. 2013;126(2):127-132. PubMed
8. Raja AS, Greenberg JO, Qaseem A, et al. Evaluation of Patients With Suspected Acute Pulmonary Embolism: Best Practice Advice From the Clinical Guidelines Committee of the American College of Physicians. Ann Intern Med. 2015;163(9):701-711. PubMed
9. Schuur JD, Carney DP, Lyn ET, et al. A top-five list for emergency medicine: a pilot project to improve the value of emergency care. JAMA Intern Med. 2014;174(4):509-515. PubMed
10. Alhassan S, Sayf AA, Arsene C, Krayem H. Suboptimal implementation of diagnostic algorithms and overuse of computed tomography-pulmonary angiography in patients with suspected pulmonary embolism. Ann Thorac Med. 2016;11(4):254-260. PubMed
11. Crichlow A, Cuker A, Mills AM. Overuse of computed tomography pulmonary angiography in the evaluation of patients with suspected pulmonary embolism in the emergency department. Acad Emerg Med. 2012;19(11):1219-1226. PubMed
12. Deblois S, Chartrand-Lefebvre C, Toporwicz K, Zhongyi C, Lepanto L. Interventions to reduce the overuse of imaging for pulmonary embolism: a systematic review. J Hosp Med. 2018;13(1):52-61. PubMed
13. Murphy EV. Clinical decision support: effectiveness in improving quality processes and clinical outcomes and factors that may influence success. Yale J Biol Med. 2014;87(2):187-197. PubMed
14. Bates DW, Kuperman GJ, Wang S, et al. Ten commandments for effective clinical decision support: making the practice of evidence-based medicine a reality. J Am Med Inform Assoc. 2003;10(6):523-530. PubMed
Interventions to Reduce the Overuse of Imaging for Pulmonary Embolism: A Systematic Review
The last 2 decades have seen a dramatic rise in the use of medical imaging in general,1,2 as well as in the diagnostic workup of pulmonary embolism (PE) more specifically, since the introduction of multidetector row computed tomography pulmonary angiography (CTPA) in 1998.3 From 1999 to 2010, the proportions of emergency department (ED) visits associated with a diagnosis of PE and admissions for PE have increased markedly in the United States, where the situation has been well documented.4,5 A 14-fold increase in the use of CTPA was observed in health maintenance organizations from 2001 to 2008.3 A significant increase in the probability of having a diagnosis of PE in the ED was reported, likely because of increased access to CTPA, from 2001 to 2010.4 With a prevalence of 2% or less in the ED, diagnostic yields as low as 5% suggest a significant problem of overuse.6,7
Strategies have been proposed to improve the appropriateness of imaging in the detection of PE, and these rely on the use of a validated clinical decision rule (CDR) to assess the pretest probability of the diagnosis. The purpose of this systematic review is to summarize the evidence associated with interventions aimed at reducing the overuse of imaging in the diagnostic workup of PE in the ED and hospital wards. Specifically, the types of interventions, their clinical effectiveness, as well as possible harms will be assessed. A secondary objective is to appraise the impact of these interventions on healthcare costs as well as the facilitators and barriers to their implementation.
METHODS
Inclusion Criteria
Targeted settings were EDs and inpatient services of adult tertiary and quaternary care hospitals. The search addressed interventions aimed at reducing the overuse of imaging in the diagnostic workup for PE. The comparators were usual care or another type of related intervention. The main outcomes considered were the use of imaging, diagnostic yield, radiation dose, adherence to guidelines to a quality measure, safety, and costs; both experimental and observational studies were included.
Literature Search
A systematic literature search in the following electronic databases was performed: PubMed, MEDLINE, Embase, and EBM Reviews (Cochrane, ACP Journal Club, Database of Abstracts of Reviews of Effects, Cochrane Central Register of Controlled Trials, Cochrane Methodology Register, Cochrane Health Technology Assessment, and the NHS Economic Evaluation Database). The reference period was from 1998 to March 28, 2017, and publications in English and French were searched. The detailed search strategy, adapted to each of the databases, appears in supplemental Appendix 1.
Study Selection and Data Extraction
One author (SD) reviewed the titles of the selected articles and excluded those that obviously did not satisfy the inclusion criteria. Then, 2 authors (SD and LL) independently reviewed the titles and abstracts of the remaining articles. They reviewed the full manuscript of potentially relevant articles for inclusion. Disagreements that could not be resolved by discussion would have been arbitrated by a third author (CCL); however, no such disagreement occurred.
Quality and Risk of Bias Assessment
For experimental or quasiexperimental studies that involved an intervention group and a control group, the criteria proposed by the Cochrane collaborative for the evaluation of bias were used.8 For studies using a before and after design, the following main biases associated with such designs were assessed: history effect, maturation bias, testing bias, regression to the mean, and conditioning bias.9
Data Extraction and Synthesis
Data pertaining to efficacy, safety, costs, and facilitators and barriers to the implementation of interventions were extracted from the studies. The research process adhered to the Preferred Reporting Items for Systematic Reviews and Meta-Analyses 2009 checklist.10 In view of the heterogeneity of the studies, a narrative synthesis was produced in accordance with the methodology proposed by Popay et al.11 The review protocol was registered in PROSPERO (this registry can be consulted at the following URL address: http://www.crd.york.ac.uk/PROSPERO/).
RESULTS
The search screened 2814 records after the removal of duplicates and studies published before 1998. The figure illustrates the literature selection process.12 Seventeen studies were included in the review following appraisal. Most of the studies (15/17) evaluated interventions in the ED,7,13-26 while the remaining studies (2/17) were conducted in clinical wards of acute care hospitals.27,28 Thirteen studies were conducted in the United States, 3 in Australia, and 1 in Europe. Four types of interventions were identified in the selected studies: electronic clinical decision support (CDS) (8/17), educational interventions (7/17), performance feedback reports (PFRs) (1/17), and an institutional clinical pretest policy (1/17). In 10 of the studies, the proposed intervention was mandatory.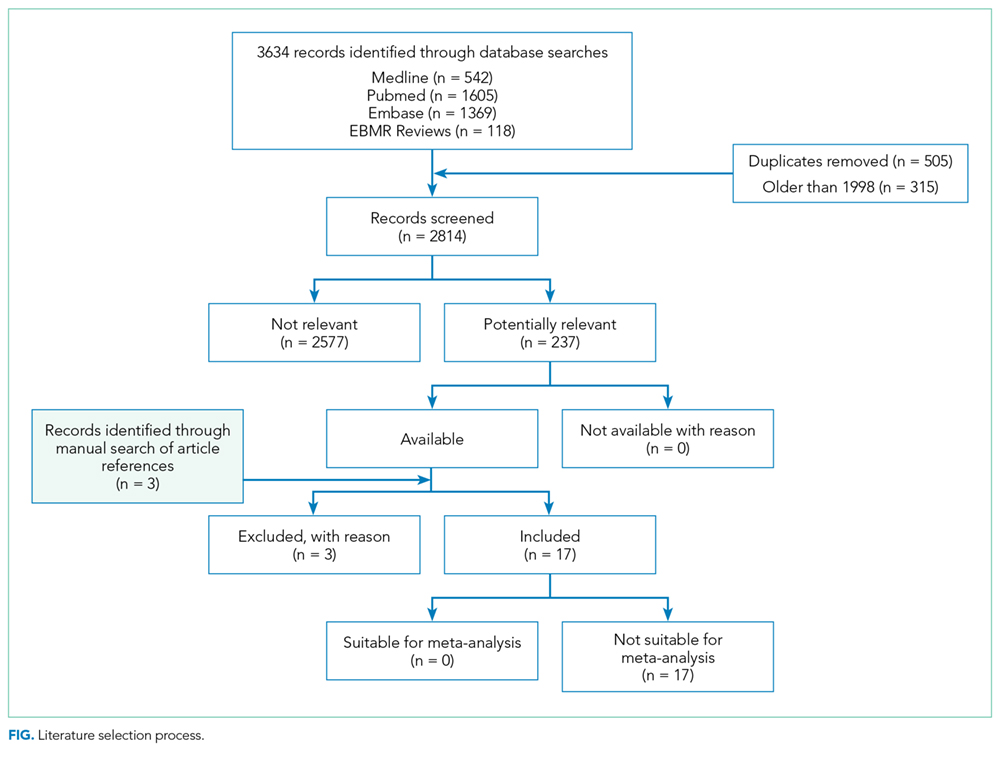
One systematic review and meta-analysis pertaining to the impact of CDRs on CTPA use and yield was identified.29 Five of the studies it included were also included in the present review.13,16,21-23 However, its focus is different than the present one, which aims at assessing the evidence associated with the interventions being implemented to promote the use of the CDRs.29
The list of included studies appears in supplemental Appendix 2. The list of potentially relevant studies that were finally excluded is provided in supplemental Appendix 3.
Most studies (14/17) presented a before-after design, with data collection corresponding to periods preceding and following a specific intervention. Most of them are retrospective and assessed the efficacy and safety results. They were deemed of generally poor quality and were subject to many of the biases mentioned above as well as to an interaction between the intervention and its implementation context. The remaining 3 studies were experimental in design with a comparative control group.13,14,27 In 2 of these studies, a comparison was made with traditional clinical practice (no intervention).13,27 In the third, the intervention was compared with CDS only.14 The control group studies were of intermediate to very good quality and were subject to biases of performance, detection, selection, and attrition.
Table 1 summarizes the study characteristics of the included studies. The detailed methodological quality appraisal of the control group studies appears in supplemental Appendix 4.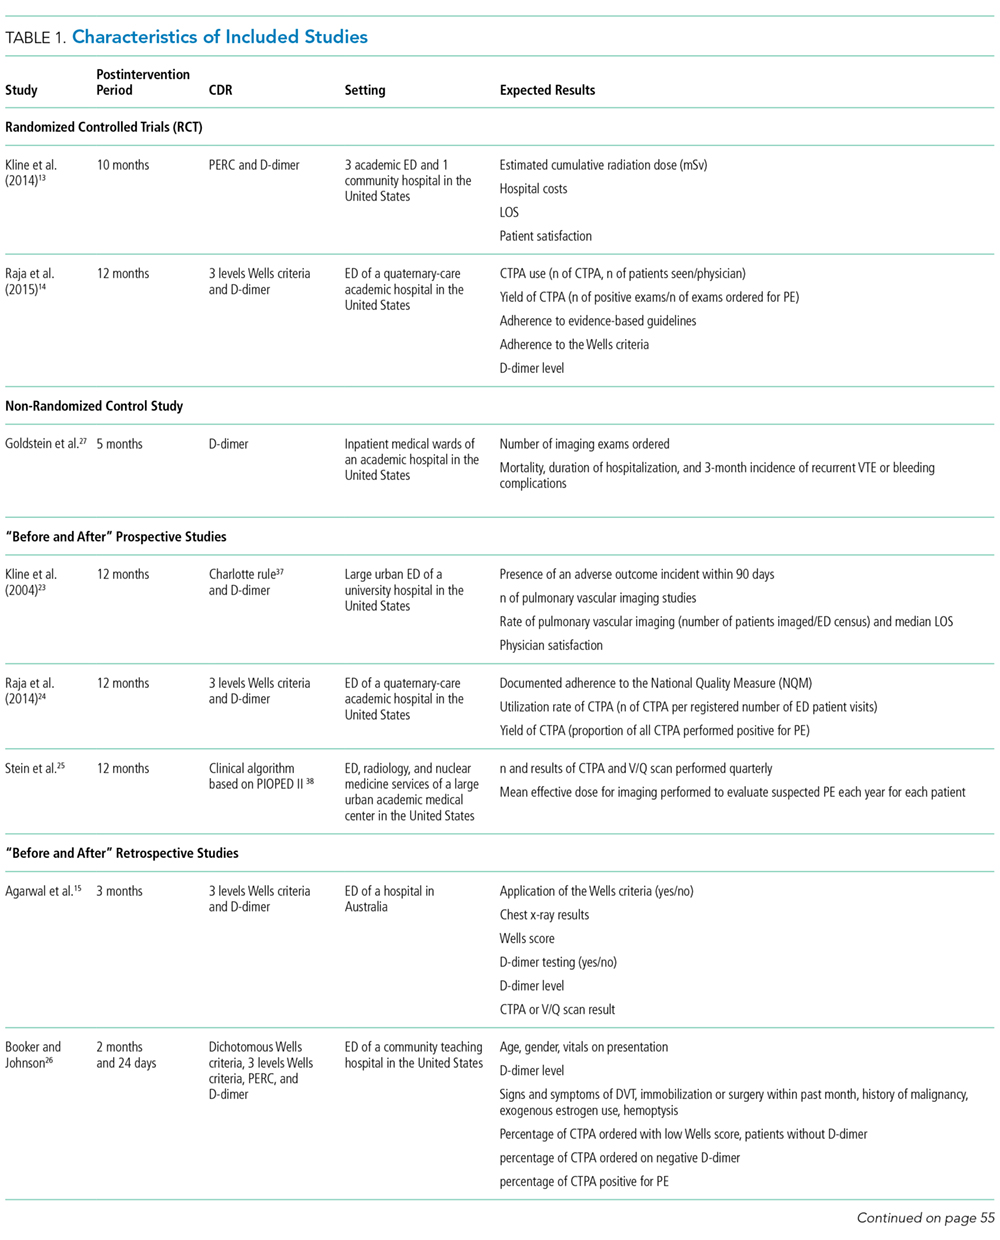
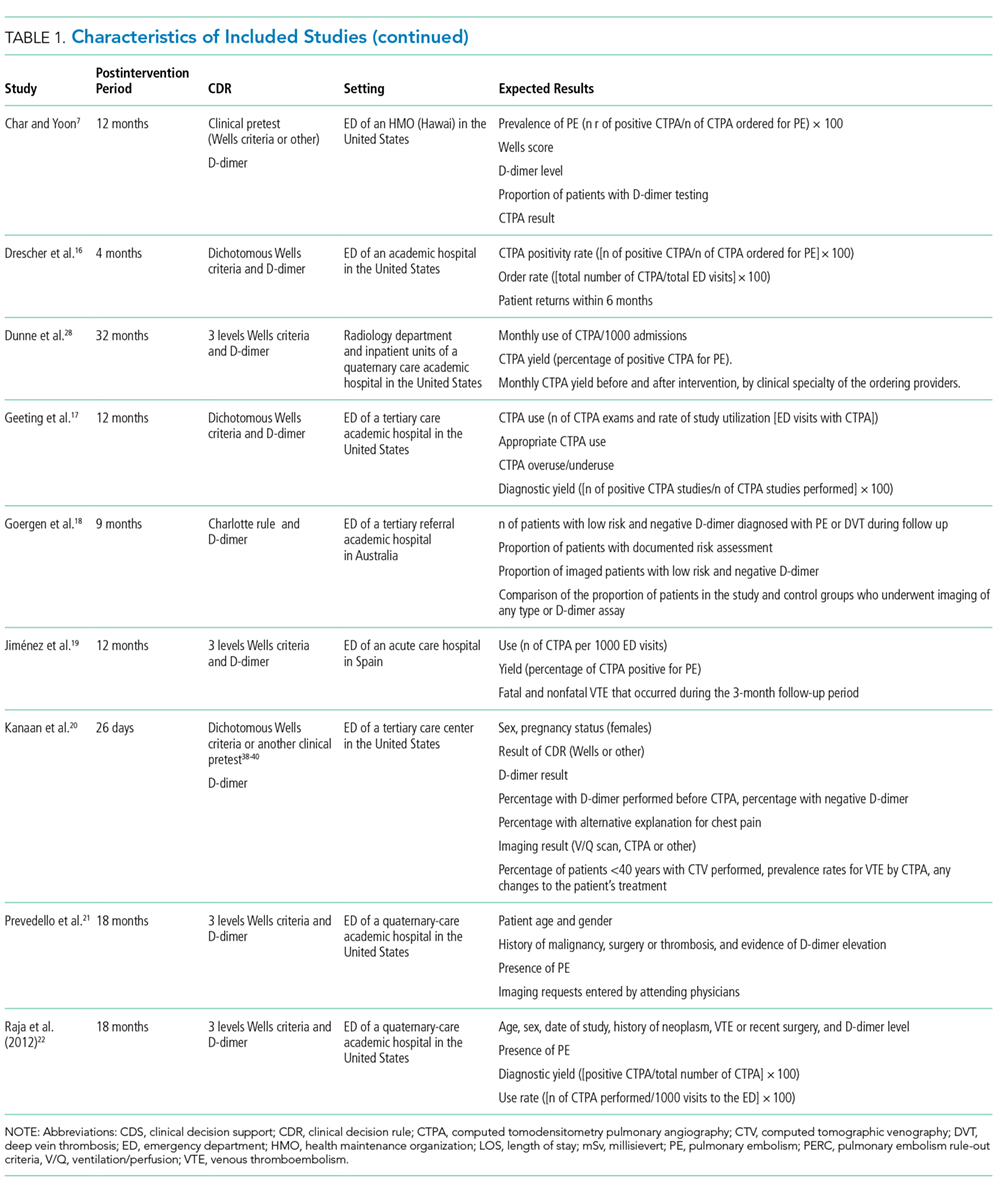
Efficacy
CDS and PFRs
Eight of the studies appraised CDS interventions.13,16,17,19,21,22,24,28 They consisted of computer-based applications imbedded into the computerized physician order entry of the setting (ED or clinical ward of an acute care hospital), which are prompted when a physician orders an imaging exam or D-dimer test.
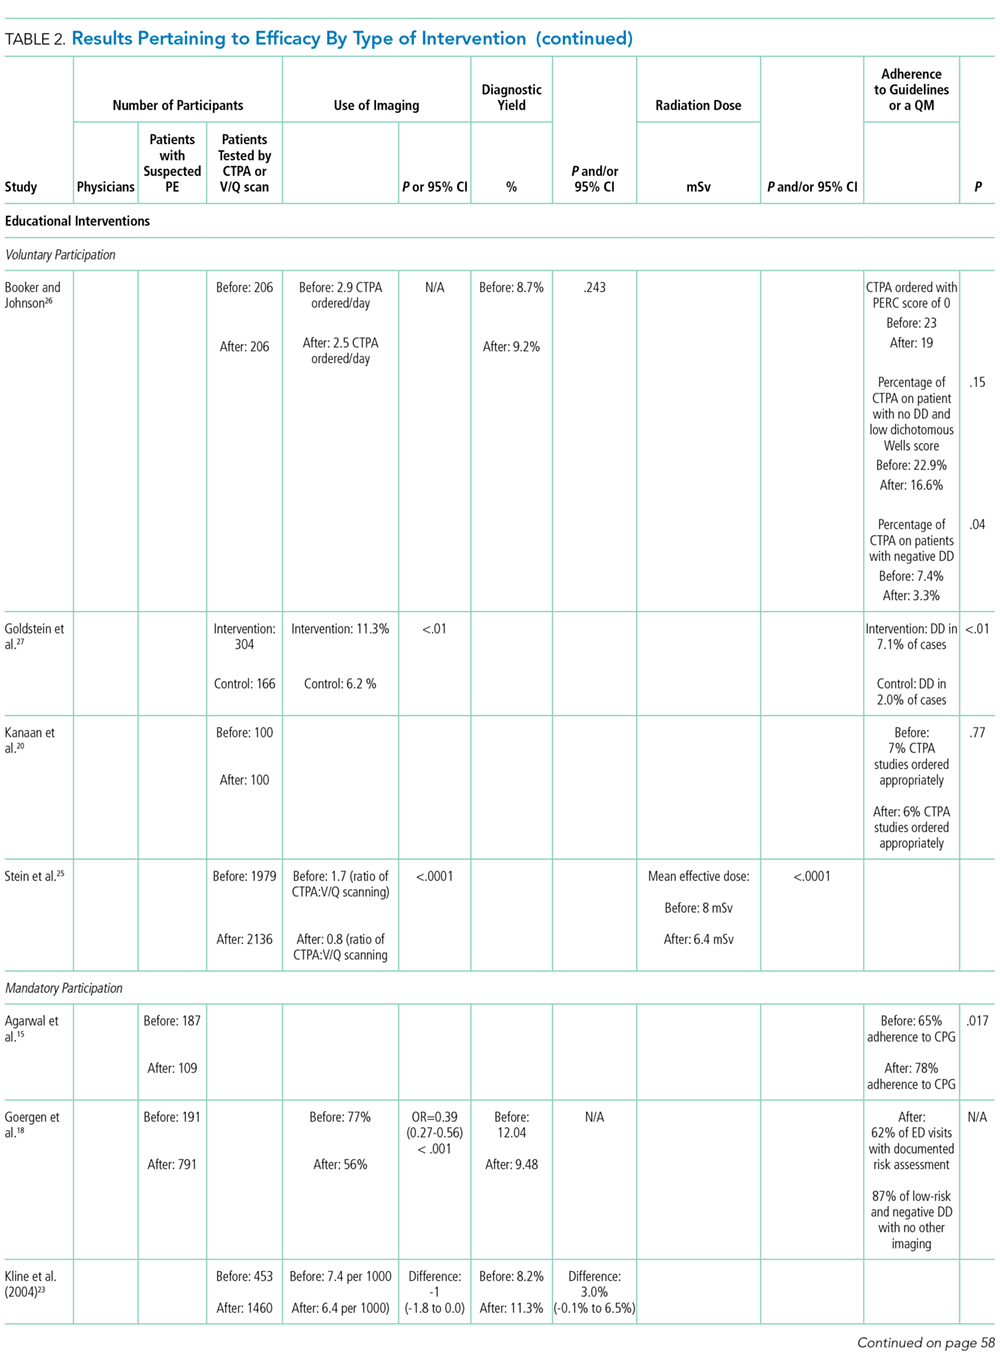
Educational Interventions and Policy
Seven of the interventions assessed in the included studies were educational in their essence, involving training sessions aimed at strengthening physician use of CDRs for the diagnosis of PE.15,18,20,23,25-27 Three studies observed a statistically significant impact on the
The impact of a policy fostering the use of a CDR and D-dimer was appraised in 1 study.7 This intervention translated into a significant reduction of CTPA use and a significant increase of CTPA diagnostic yield. However, only 4% of patient charts reported a clinical probability of PE, and in most cases, the type of CDR used was not mentioned.7
Safety
A minority of studies evaluated the safety of the interventions.13,18,19,23,25,27 Only 2 of these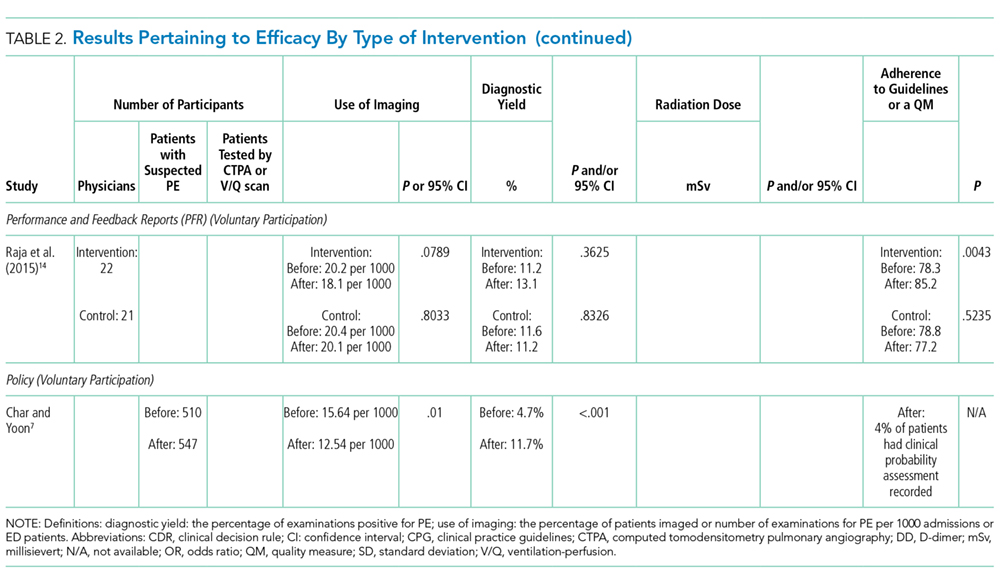
The 2 studies involving a control group did not find significant differences between the intervention and the control groups with respect to mortality, complications because of thromboembolic and bleeding events, or any other adverse event during the 3-months’ follow-up.13,27
Jiménez et al.19 reported less than 1% mortality following the implementation of a CDS (0.7%; 95% CI, 0.2%-1.1%). In their study assessing the impact of an educational intervention, Kline et al.23 (2004) observed that none of the patients discharged with a fully negative Charlotte rule died suddenly and unexpectedly at 90-day follow-up. However, another educational intervention aimed at reducing ED patients’ radiation exposure observed a significant increase in the 90-day all-cause mortality of patients with negative CTPA, which was associated with a decline in the 90-day mortality of patients with negative ventilation/perfusion (V/Q) scanning.25
Jiménez et al.19 observed an absolute decrease of 2.5% in the incidence of symptomatic VTE events after the intervention (95% CI, 0.9%-4.6%; P < .01). The occurrence of VTE events, including PE, reached 1% in Goergen et al.18 and 3.9% in Kline et al.23 (2004) during follow-up.
Economic Aspects
Kline et al.13 (2014) found a significant decrease in charges and estimated costs for medical care within 90 days of initial ED presentation in the patients who were investigated with CTPA in the intervention group. The median costs of medical care within 30 days of the initial ED presentation were US $1274 in the control group and US $934 in the intervention group (P = .018).13 The median charges of medical care within 30 days of the initial ED presentation were US $7595 in the control group and US $6281 in the intervention group (P = .004).13
Facilitators and Barriers
Only 1 study appraised the reasons given by emergency physicians for not adhering to CDS recommendations.16 The reason most often given was the time needed to access and use the application, which was perceived as having a negative impact on productivity as well as a preference for intuitive clinical judgment.16 Though not the result of specific evaluation or data collection, some authors commented on the factors that may facilitate or impede the implementation of interventions to diminish the inappropriate use.14,20 Kanaan et al.20 proposed that factors other than the knowledge of current clinical guidelines may explain CTPA use. Booker and Johnson26 suggested that the demand for rapid turnover in the ED may lead to “so-called ‘blanket ordering’, which attempts to reach diagnosis as quickly as possible despite cost and patient safety.” Raja et al.14 (2015) suggested that the unambiguous representation of guidelines based on validated, high-quality evidence in the CDS may have improved physician adoption in their study.
DISCUSSION
Efficacy
Baseline values for the use of imaging and diagnostic yield show important variation, especially when compared with the study performed in Europe.19 In general, only a modest impact is measured with regard to a decrease in the use of imaging, an increase in diagnostic use, and adherence to validated CDRs.
Among the interventions appraised, CDS was evaluated in the largest number of included studies, and its
The impact of CDS on diagnostic yield was mixed because 3 studies observed an increase in diagnostic yield postintervention,16,21,22 and 3 others monitored no significant impact.19,24,28 Adherence to guidelines or a quality measure was assessed in 2 studies, which reported a significant increase in appropriate ordering.17,24 Raja et al.24 (2014) observed an 18.7% increase in appropriate ordering after the implementation of a CDS from 56.9% to 75.6% (P < .01). Geeting et al.17 observed a similar increase, with appropriate ordering increasing from 58% to 76% over the duration of the intervention. However, this increase in appropriate use was not associated with a variation in CTPA use or diagnostic yield, which leads the investigators to posit that the physicians gradually inflated the Wells score they keyed into the CDS despite that no threshold Wells score was required to perform a CTPA.17
Raja et al.14 (2015) demonstrated that the implementation of performance feedback reporting, in addition to a CDS, can significantly increase adherence to CDR for the evaluation of PE in the ED. Additional studies would help to better understand the potential impact of such reports on CTPA use in the diagnostic workup of PE. However, it suggests that a combination of interventions, including the implementation of a CDS, performance feedback reporting, and well-designed and specific educational interventions, may have a more significant impact than any of these types of interventions taken separately.
The impact of the educational interventions appraised in this review on the expected results is mixed, though it is difficult to compare the observed results and draw conclusive remarks, as the characteristics of the interventions and study designs are different from each other.
Safety
There is limited evidence on the safety of appraised interventions. Only 6 studies appraised venous thrombolic events or mortality.13,18,19,23,25,27 However, no adverse events were noted in those studies evaluating possible complications or missed diagnoses. Additional research is needed to confirm the safety of the interventions appraised in this systematic review.
Facilitators and Barriers
There are significant limitations with respect to the analysis of the factors that favor or impede the implementation of the interventions appraised in this review. However, 2 studies that did not meet the inclusion criteria appraised physicians’ perceptions and attitudes toward prescribing imaging tests in the diagnostic workup of PE.31,32 One is Swiss31 and the other is Canadian.32 Both were conducted in the ED of academic hospitals. Rohacek et al.31 observed that defensive behaviors, such as “fear of missing PE,” were frequent and associated with a lower probability of a positive CTPA (OR = 0.36; 95% CI, 0.14-0.92). Ahn et al.32 concluded that, although ED physicians who participated in their survey possessed limited knowledge of radiation doses of CTPA and V/Q scans, they opted for V/Q scans that emit lower radiation doses in younger patients, especially females, which may reflect efforts done in the study setting to reduce patients’ radiation exposure.
There is not enough data to conclude on safety and the impact on healthcare costs.
Implications for Future Research
Future controlled studies of high methodological quality would help to better understand the effects associated with the implementation of the interventions aimed at reducing the inappropriate use of imaging in the diagnostic workup of PE. Efficacy results show that the success of the implementation of the various types of interventions is variable. This variation may be at least partly attributable to contextual factors, such as the external environment, the organizational leadership and culture, or the microsystem, such as differences in care patterns.33-35 The impact of context factors on the effectiveness of the interventions should be assessed further with appropriate tools.33,34,36
CONCLUSION
The joint use of CDS and PFRs appears more effective than the other types of intervention in reducing the inappropriate use of CTPA. However, an approach combining these with well-designed educational interventions as well as policies may be even more effective.
Future studies of high methodological quality would strengthen the evidence concerning the relative efficacy and safety of the interventions appraised, especially when various types are combined. Future research should also aim at bringing answers to the knowledge gaps related to the factors of success and barriers associated with the implementation of the interventions.
Disclosure
The authors report no conflict of interest.
1. Smith-Bindman R, Miglioretti DL, Johnson E, et al. Use of diagnostic imaging studies and associated radiation exposure for patients enrolled in large integrated health care systems, 1996-2010. JAMA. 2012;307(22):2400-2409. PubMed
2. Canadian Institute for Health Information (CIHI). Medical Imaging in Canada 2012. https://www.cihi.ca/en/mit_summary_2012_en.pdf. Accessed December 14, 2016.
3. Wiener RS, Schwartz LM, Woloshin S. When a test is too good: how CT pulmonary angiograms find pulmonary emboli that do not need to be found. BMJ. 2013;347:f3368. doi:10.1136/bmj.f3368. PubMed
4. Schissler AJ, Rozenshtein A, Schluger NW, Einstein AJ. National trends in emergency room diagnosis of pulmonary embolism, 2001-2010: a cross-sectional study. Respir Res. 2015;16:44-50. PubMed
5. Minges KE, Bikdeli B, Wang Y, et al. National Trends in Pulmonary Embolism Hospitalization Rates and Outcomes for Adults Aged >/=65 Years in the United States (1999 to 2010). Am J Cardiol. 2015;116(9):1436-1442. PubMed
6. Duriseti RS, Brandeau ML. Cost-effectiveness of strategies for diagnosing pulmonary embolism among emergency department patients presenting with undifferentiated symptoms. Ann Emerg Med. 2010;56(4):321-332.e310. PubMed
7. Char S, Yoon HC. Improving appropriate use of pulmonary computed tomography angiography by increasing the serum D-dimer threshold and assessing clinical probability. Perm J. 2014;18(4):10-15. PubMed
8. Higgins JP, Altman DG, Gotzsche PC, et al. The Cochrane Collaboration’s tool for assessing risk of bias in randomised trials. BMJ. 2011;343:d5928. doi:10.1136/bmj.d5928 PubMed
9. Champagne F, Brousselle A, Contendriopoulos AP, Hartz Z. L’analyse des effets. In: Brousselle A, Champagne F, Contandriopoulos AP, Hartz Z, editors. L’évaluation: Concepts et Méthodes 2e Edition. Montréal: Les Presses de l’Université de Montréal; 2011: 173-198.
10. Moher D, Liberati A, Tetzlaff J, Altman DG. Preferred reporting items for systematic reviews and meta-analyses: the PRISMA statement. J Clin Epidemiol. 2009;62(10):1006-1012. PubMed
11. Popay J, Roberts H, Sowden A, et al. Guidance on the Conduct of Narrative Synthesis in Systematic Reviews. Manchester, UK: ESRC Methods Programme; 2006.
12. Velasco M, Perleth M, Drummond M, et al. Best practice in undertaking and reporting health technology assessments. Working group 4 report. Int J Technol Assess Health Care. 2002;18(2):361-422. PubMed
13. Kline JA, Jones AE, Shapiro NI, et al. Multicenter, randomized trial of quantitative pretest probability to reduce unnecessary medical radiation exposure in emergency department patients with chest pain and dyspnea. Circ Cardiovasc Imaging. 2014;7(1):66-73. PubMed
14. Raja AS, Ip IK, Dunne RM, Schuur JD, Mills AM, Khorasani R. Effects of Performance Feedback Reports on Adherence to Evidence-Based Guidelines in Use of CT for Evaluation of Pulmonary Embolism in the Emergency Department: A Randomized Trial. AJR Am J Roentgenol. 2015;205(5):936-940. PubMed
15. Agarwal A, Persaud J, Grabinski R, Rabinowitz D, Bremner A, Mendelson R. Pulmonary embolism: are we there yet? J Med Imaging Radiat Oncol. 2012;56(3):270-281. PubMed
16. Drescher FS, Chandrika S, Weir ID, et al. Effectiveness and acceptability of a computerized decision support system using modified Wells criteria for evaluation of suspected pulmonary embolism. Ann Emerg Med. 2011;57(6):613-621. PubMed
17. Geeting GK, Beck M, Bruno MA, et al. Mandatory Assignment of Modified Wells Score Before CT Angiography for Pulmonary Embolism Fails to Improve Utilization or Percentage of Positive Cases. AJR Am J Roentgenol. 2016;207(2):442-449. PubMed
18. Goergen SK, Chan T, de Campo JF, et al. Reducing the use of diagnostic imaging in patients with suspected pulmonary embolism: validation of a risk assessment strategy. Emerg Med Australas. 2005;17(1):16-23. PubMed
19. Jiménez D, Resano S, Otero R, et al. Computerised clinical decision support for suspected PE. Thorax. 2015;70(9):909-911. PubMed
20. Kanaan Y, Knoepp UD, Kelly AM. The influence of education on appropriateness rates for CT pulmonary angiography in emergency department patients. Acad Radiol. 2013;20(9):1107-1114. PubMed
21. Prevedello LM, Raja AS, Ip IK, Sodickson A, Khorasani R. Does clinical decision support reduce unwarranted variation in yield of CT pulmonary angiogram? Am J Med. 2013;126(11):975-981. PubMed
22. Raja AS, Ip IK, Prevedello LM, et al. Effect of computerized clinical decision support on the use and yield of CT pulmonary angiography in the emergency department. Radiology. 2012;262(2):468-474. PubMed
23. Kline JA, Webb WB, Jones AE, Hernandez-Nino J. Impact of a rapid rule-out protocol for pulmonary embolism on the rate of screening, missed cases, and pulmonary vascular imaging in an urban US emergency department. Ann Emerg Med. 2004;44(5):490-502. PubMed
24. Raja AS, Gupta A, Ip IK, Mills AM, Khorasani R. The use of decision support to measure documented adherence to a national imaging quality measure. Acad Radiol. 2014;21(3):378-383. PubMed
25. Stein EG, Haramati LB, Chamarthy M, Sprayregen S, Davitt MM, Freeman LM. Success of a safe and simple algorithm to reduce use of CT pulmonary angiography in the emergency department. AJR Am J Roentgenol. 2010;194(2):392-397. PubMed
26. Booker MT, Johnson JO. Optimizing CT Pulmonary Angiogram Utilization in a Community Emergency Department: A Pre- and Postintervention Study. J Am Coll Radiol. 2017;14(1):65-71. PubMed
27. Goldstein NM, Kollef MH, Ward S, Gage BF. The impact of the introduction of a rapid D-dimer assay on the diagnostic evaluation of suspected pulmonary embolism. Arch Intern Med. 2001;161(4):567-571. PubMed
28. Dunne RM, Ip IK, Abbett S, et al. Effect of Evidence-based Clinical Decision Support on the Use and Yield of CT Pulmonary Angiographic Imaging in Hospitalized Patients. Radiology. 2015;276(1):167-174. PubMed
29. Wang RC, Bent S, Weber E, Neilson J, Smith-Bindman R, Fahimi J. The Impact of Clinical Decision Rules on Computed Tomography Use and Yield for Pulmonary Embolism: A Systematic Review and Meta-analysis. Ann Emerg Med. 2016;67(6):693-701. PubMed
30. Prevedello LM, Raja AS, Ip IK, Sodickson A, Khorasani R. Does clinical decision support reduce unwarranted variation in yield of CT pulmonary angiogram? Am J Med. 2013;126(11):975-981. PubMed
31. Rohacek M, Buatsi J, Szucs-Farkas Z, et al. Ordering CT pulmonary angiography to exclude pulmonary embolism: defense versus evidence in the emergency room. Intensive Care Med. 2012;38(8):1345-1351. PubMed
32. Ahn JS, Edmonds ML, McLeod SL, Dreyer JF. Familiarity with radiation exposure dose from diagnostic imaging for acute pulmonary embolism and current patterns of practice. CJEM. 2014;16(5):393-404. PubMed
33. Kringos DS, Sunol R, Wagner C, et al. The influence of context on the effectiveness of hospital quality improvement strategies: a review of systematic reviews. BMC Health Serv Res. 2015;15(277):015-0906. PubMed
34. Kaplan HC, Brady PW, Dritz MC, et al. The influence of context on quality improvement success in health care: a systematic review of the literature. Milbank Q. 2010;88(4):500-559. PubMed
35. Pernod G, Caterino J, Maignan M, Tissier C, Kassis J, Lazarchick J. D-dimer use and pulmonary embolism diagnosis in emergency units: Why is there such a difference in pulmonary embolism prevalence between the United States of America and countries outside USA? PLoS ONE. 2017;12(1):e0169268. doi:10.1371/journal.pone.0169268 PubMed
36. Saillour-Glenisson F, Domecq S, Kret M, Sibe M, Dumond JP, Michel P. Design and validation of a questionnaire to assess organizational culture in French hospital wards. BMC Health Serv Res. 2016;16:491-503. PubMed
37. Kline JA, Nelson RD, Jackson RE, Courtney DM. Criteria for the safe use of D-dimer testing in emergency department patients with suspected pulmonary embolism: a multicenter US study. Ann Emerg Med. 2002;39(2):144-152. PubMed
38. Stein PD, Fowler SE, Goodman LR, et al. Multidetector computed tomography for acute pulmonary embolism. New Engl J Med. 2006;354(22):2317-2327. PubMed
39. Stein PD, Woodard PK, Weg JG, et al. Diagnostic pathways in acute pulmonary embolism: recommendations of the PIOPED II investigators. Am J Med. 2006;119(12):1048-1055. PubMed
40. Torbicki A, Perrier A, Konstantinides S, et al. Guidelines on the diagnosis and management of acute pulmonary embolism: the Task Force for the Diagnosis and Management of Acute Pulmonary Embolism of the European Society of Cardiology (ESC). Eur Heart J. 2008;29(18):2276-2315. PubMed
The last 2 decades have seen a dramatic rise in the use of medical imaging in general,1,2 as well as in the diagnostic workup of pulmonary embolism (PE) more specifically, since the introduction of multidetector row computed tomography pulmonary angiography (CTPA) in 1998.3 From 1999 to 2010, the proportions of emergency department (ED) visits associated with a diagnosis of PE and admissions for PE have increased markedly in the United States, where the situation has been well documented.4,5 A 14-fold increase in the use of CTPA was observed in health maintenance organizations from 2001 to 2008.3 A significant increase in the probability of having a diagnosis of PE in the ED was reported, likely because of increased access to CTPA, from 2001 to 2010.4 With a prevalence of 2% or less in the ED, diagnostic yields as low as 5% suggest a significant problem of overuse.6,7
Strategies have been proposed to improve the appropriateness of imaging in the detection of PE, and these rely on the use of a validated clinical decision rule (CDR) to assess the pretest probability of the diagnosis. The purpose of this systematic review is to summarize the evidence associated with interventions aimed at reducing the overuse of imaging in the diagnostic workup of PE in the ED and hospital wards. Specifically, the types of interventions, their clinical effectiveness, as well as possible harms will be assessed. A secondary objective is to appraise the impact of these interventions on healthcare costs as well as the facilitators and barriers to their implementation.
METHODS
Inclusion Criteria
Targeted settings were EDs and inpatient services of adult tertiary and quaternary care hospitals. The search addressed interventions aimed at reducing the overuse of imaging in the diagnostic workup for PE. The comparators were usual care or another type of related intervention. The main outcomes considered were the use of imaging, diagnostic yield, radiation dose, adherence to guidelines to a quality measure, safety, and costs; both experimental and observational studies were included.
Literature Search
A systematic literature search in the following electronic databases was performed: PubMed, MEDLINE, Embase, and EBM Reviews (Cochrane, ACP Journal Club, Database of Abstracts of Reviews of Effects, Cochrane Central Register of Controlled Trials, Cochrane Methodology Register, Cochrane Health Technology Assessment, and the NHS Economic Evaluation Database). The reference period was from 1998 to March 28, 2017, and publications in English and French were searched. The detailed search strategy, adapted to each of the databases, appears in supplemental Appendix 1.
Study Selection and Data Extraction
One author (SD) reviewed the titles of the selected articles and excluded those that obviously did not satisfy the inclusion criteria. Then, 2 authors (SD and LL) independently reviewed the titles and abstracts of the remaining articles. They reviewed the full manuscript of potentially relevant articles for inclusion. Disagreements that could not be resolved by discussion would have been arbitrated by a third author (CCL); however, no such disagreement occurred.
Quality and Risk of Bias Assessment
For experimental or quasiexperimental studies that involved an intervention group and a control group, the criteria proposed by the Cochrane collaborative for the evaluation of bias were used.8 For studies using a before and after design, the following main biases associated with such designs were assessed: history effect, maturation bias, testing bias, regression to the mean, and conditioning bias.9
Data Extraction and Synthesis
Data pertaining to efficacy, safety, costs, and facilitators and barriers to the implementation of interventions were extracted from the studies. The research process adhered to the Preferred Reporting Items for Systematic Reviews and Meta-Analyses 2009 checklist.10 In view of the heterogeneity of the studies, a narrative synthesis was produced in accordance with the methodology proposed by Popay et al.11 The review protocol was registered in PROSPERO (this registry can be consulted at the following URL address: http://www.crd.york.ac.uk/PROSPERO/).
RESULTS
The search screened 2814 records after the removal of duplicates and studies published before 1998. The figure illustrates the literature selection process.12 Seventeen studies were included in the review following appraisal. Most of the studies (15/17) evaluated interventions in the ED,7,13-26 while the remaining studies (2/17) were conducted in clinical wards of acute care hospitals.27,28 Thirteen studies were conducted in the United States, 3 in Australia, and 1 in Europe. Four types of interventions were identified in the selected studies: electronic clinical decision support (CDS) (8/17), educational interventions (7/17), performance feedback reports (PFRs) (1/17), and an institutional clinical pretest policy (1/17). In 10 of the studies, the proposed intervention was mandatory.
One systematic review and meta-analysis pertaining to the impact of CDRs on CTPA use and yield was identified.29 Five of the studies it included were also included in the present review.13,16,21-23 However, its focus is different than the present one, which aims at assessing the evidence associated with the interventions being implemented to promote the use of the CDRs.29
The list of included studies appears in supplemental Appendix 2. The list of potentially relevant studies that were finally excluded is provided in supplemental Appendix 3.
Most studies (14/17) presented a before-after design, with data collection corresponding to periods preceding and following a specific intervention. Most of them are retrospective and assessed the efficacy and safety results. They were deemed of generally poor quality and were subject to many of the biases mentioned above as well as to an interaction between the intervention and its implementation context. The remaining 3 studies were experimental in design with a comparative control group.13,14,27 In 2 of these studies, a comparison was made with traditional clinical practice (no intervention).13,27 In the third, the intervention was compared with CDS only.14 The control group studies were of intermediate to very good quality and were subject to biases of performance, detection, selection, and attrition.
Table 1 summarizes the study characteristics of the included studies. The detailed methodological quality appraisal of the control group studies appears in supplemental Appendix 4.
Efficacy
CDS and PFRs
Eight of the studies appraised CDS interventions.13,16,17,19,21,22,24,28 They consisted of computer-based applications imbedded into the computerized physician order entry of the setting (ED or clinical ward of an acute care hospital), which are prompted when a physician orders an imaging exam or D-dimer test.
Educational Interventions and Policy
Seven of the interventions assessed in the included studies were educational in their essence, involving training sessions aimed at strengthening physician use of CDRs for the diagnosis of PE.15,18,20,23,25-27 Three studies observed a statistically significant impact on the
The impact of a policy fostering the use of a CDR and D-dimer was appraised in 1 study.7 This intervention translated into a significant reduction of CTPA use and a significant increase of CTPA diagnostic yield. However, only 4% of patient charts reported a clinical probability of PE, and in most cases, the type of CDR used was not mentioned.7
Safety
A minority of studies evaluated the safety of the interventions.13,18,19,23,25,27 Only 2 of these
The 2 studies involving a control group did not find significant differences between the intervention and the control groups with respect to mortality, complications because of thromboembolic and bleeding events, or any other adverse event during the 3-months’ follow-up.13,27
Jiménez et al.19 reported less than 1% mortality following the implementation of a CDS (0.7%; 95% CI, 0.2%-1.1%). In their study assessing the impact of an educational intervention, Kline et al.23 (2004) observed that none of the patients discharged with a fully negative Charlotte rule died suddenly and unexpectedly at 90-day follow-up. However, another educational intervention aimed at reducing ED patients’ radiation exposure observed a significant increase in the 90-day all-cause mortality of patients with negative CTPA, which was associated with a decline in the 90-day mortality of patients with negative ventilation/perfusion (V/Q) scanning.25
Jiménez et al.19 observed an absolute decrease of 2.5% in the incidence of symptomatic VTE events after the intervention (95% CI, 0.9%-4.6%; P < .01). The occurrence of VTE events, including PE, reached 1% in Goergen et al.18 and 3.9% in Kline et al.23 (2004) during follow-up.
Economic Aspects
Kline et al.13 (2014) found a significant decrease in charges and estimated costs for medical care within 90 days of initial ED presentation in the patients who were investigated with CTPA in the intervention group. The median costs of medical care within 30 days of the initial ED presentation were US $1274 in the control group and US $934 in the intervention group (P = .018).13 The median charges of medical care within 30 days of the initial ED presentation were US $7595 in the control group and US $6281 in the intervention group (P = .004).13
Facilitators and Barriers
Only 1 study appraised the reasons given by emergency physicians for not adhering to CDS recommendations.16 The reason most often given was the time needed to access and use the application, which was perceived as having a negative impact on productivity as well as a preference for intuitive clinical judgment.16 Though not the result of specific evaluation or data collection, some authors commented on the factors that may facilitate or impede the implementation of interventions to diminish the inappropriate use.14,20 Kanaan et al.20 proposed that factors other than the knowledge of current clinical guidelines may explain CTPA use. Booker and Johnson26 suggested that the demand for rapid turnover in the ED may lead to “so-called ‘blanket ordering’, which attempts to reach diagnosis as quickly as possible despite cost and patient safety.” Raja et al.14 (2015) suggested that the unambiguous representation of guidelines based on validated, high-quality evidence in the CDS may have improved physician adoption in their study.
DISCUSSION
Efficacy
Baseline values for the use of imaging and diagnostic yield show important variation, especially when compared with the study performed in Europe.19 In general, only a modest impact is measured with regard to a decrease in the use of imaging, an increase in diagnostic use, and adherence to validated CDRs.
Among the interventions appraised, CDS was evaluated in the largest number of included studies, and its
The impact of CDS on diagnostic yield was mixed because 3 studies observed an increase in diagnostic yield postintervention,16,21,22 and 3 others monitored no significant impact.19,24,28 Adherence to guidelines or a quality measure was assessed in 2 studies, which reported a significant increase in appropriate ordering.17,24 Raja et al.24 (2014) observed an 18.7% increase in appropriate ordering after the implementation of a CDS from 56.9% to 75.6% (P < .01). Geeting et al.17 observed a similar increase, with appropriate ordering increasing from 58% to 76% over the duration of the intervention. However, this increase in appropriate use was not associated with a variation in CTPA use or diagnostic yield, which leads the investigators to posit that the physicians gradually inflated the Wells score they keyed into the CDS despite that no threshold Wells score was required to perform a CTPA.17
Raja et al.14 (2015) demonstrated that the implementation of performance feedback reporting, in addition to a CDS, can significantly increase adherence to CDR for the evaluation of PE in the ED. Additional studies would help to better understand the potential impact of such reports on CTPA use in the diagnostic workup of PE. However, it suggests that a combination of interventions, including the implementation of a CDS, performance feedback reporting, and well-designed and specific educational interventions, may have a more significant impact than any of these types of interventions taken separately.
The impact of the educational interventions appraised in this review on the expected results is mixed, though it is difficult to compare the observed results and draw conclusive remarks, as the characteristics of the interventions and study designs are different from each other.
Safety
There is limited evidence on the safety of appraised interventions. Only 6 studies appraised venous thrombolic events or mortality.13,18,19,23,25,27 However, no adverse events were noted in those studies evaluating possible complications or missed diagnoses. Additional research is needed to confirm the safety of the interventions appraised in this systematic review.
Facilitators and Barriers
There are significant limitations with respect to the analysis of the factors that favor or impede the implementation of the interventions appraised in this review. However, 2 studies that did not meet the inclusion criteria appraised physicians’ perceptions and attitudes toward prescribing imaging tests in the diagnostic workup of PE.31,32 One is Swiss31 and the other is Canadian.32 Both were conducted in the ED of academic hospitals. Rohacek et al.31 observed that defensive behaviors, such as “fear of missing PE,” were frequent and associated with a lower probability of a positive CTPA (OR = 0.36; 95% CI, 0.14-0.92). Ahn et al.32 concluded that, although ED physicians who participated in their survey possessed limited knowledge of radiation doses of CTPA and V/Q scans, they opted for V/Q scans that emit lower radiation doses in younger patients, especially females, which may reflect efforts done in the study setting to reduce patients’ radiation exposure.
There is not enough data to conclude on safety and the impact on healthcare costs.
Implications for Future Research
Future controlled studies of high methodological quality would help to better understand the effects associated with the implementation of the interventions aimed at reducing the inappropriate use of imaging in the diagnostic workup of PE. Efficacy results show that the success of the implementation of the various types of interventions is variable. This variation may be at least partly attributable to contextual factors, such as the external environment, the organizational leadership and culture, or the microsystem, such as differences in care patterns.33-35 The impact of context factors on the effectiveness of the interventions should be assessed further with appropriate tools.33,34,36
CONCLUSION
The joint use of CDS and PFRs appears more effective than the other types of intervention in reducing the inappropriate use of CTPA. However, an approach combining these with well-designed educational interventions as well as policies may be even more effective.
Future studies of high methodological quality would strengthen the evidence concerning the relative efficacy and safety of the interventions appraised, especially when various types are combined. Future research should also aim at bringing answers to the knowledge gaps related to the factors of success and barriers associated with the implementation of the interventions.
Disclosure
The authors report no conflict of interest.
1. Smith-Bindman R, Miglioretti DL, Johnson E, et al. Use of diagnostic imaging studies and associated radiation exposure for patients enrolled in large integrated health care systems, 1996-2010. JAMA. 2012;307(22):2400-2409. PubMed
2. Canadian Institute for Health Information (CIHI). Medical Imaging in Canada 2012. https://www.cihi.ca/en/mit_summary_2012_en.pdf. Accessed December 14, 2016.
3. Wiener RS, Schwartz LM, Woloshin S. When a test is too good: how CT pulmonary angiograms find pulmonary emboli that do not need to be found. BMJ. 2013;347:f3368. doi:10.1136/bmj.f3368. PubMed
4. Schissler AJ, Rozenshtein A, Schluger NW, Einstein AJ. National trends in emergency room diagnosis of pulmonary embolism, 2001-2010: a cross-sectional study. Respir Res. 2015;16:44-50. PubMed
5. Minges KE, Bikdeli B, Wang Y, et al. National Trends in Pulmonary Embolism Hospitalization Rates and Outcomes for Adults Aged >/=65 Years in the United States (1999 to 2010). Am J Cardiol. 2015;116(9):1436-1442. PubMed
6. Duriseti RS, Brandeau ML. Cost-effectiveness of strategies for diagnosing pulmonary embolism among emergency department patients presenting with undifferentiated symptoms. Ann Emerg Med. 2010;56(4):321-332.e310. PubMed
7. Char S, Yoon HC. Improving appropriate use of pulmonary computed tomography angiography by increasing the serum D-dimer threshold and assessing clinical probability. Perm J. 2014;18(4):10-15. PubMed
8. Higgins JP, Altman DG, Gotzsche PC, et al. The Cochrane Collaboration’s tool for assessing risk of bias in randomised trials. BMJ. 2011;343:d5928. doi:10.1136/bmj.d5928 PubMed
9. Champagne F, Brousselle A, Contendriopoulos AP, Hartz Z. L’analyse des effets. In: Brousselle A, Champagne F, Contandriopoulos AP, Hartz Z, editors. L’évaluation: Concepts et Méthodes 2e Edition. Montréal: Les Presses de l’Université de Montréal; 2011: 173-198.
10. Moher D, Liberati A, Tetzlaff J, Altman DG. Preferred reporting items for systematic reviews and meta-analyses: the PRISMA statement. J Clin Epidemiol. 2009;62(10):1006-1012. PubMed
11. Popay J, Roberts H, Sowden A, et al. Guidance on the Conduct of Narrative Synthesis in Systematic Reviews. Manchester, UK: ESRC Methods Programme; 2006.
12. Velasco M, Perleth M, Drummond M, et al. Best practice in undertaking and reporting health technology assessments. Working group 4 report. Int J Technol Assess Health Care. 2002;18(2):361-422. PubMed
13. Kline JA, Jones AE, Shapiro NI, et al. Multicenter, randomized trial of quantitative pretest probability to reduce unnecessary medical radiation exposure in emergency department patients with chest pain and dyspnea. Circ Cardiovasc Imaging. 2014;7(1):66-73. PubMed
14. Raja AS, Ip IK, Dunne RM, Schuur JD, Mills AM, Khorasani R. Effects of Performance Feedback Reports on Adherence to Evidence-Based Guidelines in Use of CT for Evaluation of Pulmonary Embolism in the Emergency Department: A Randomized Trial. AJR Am J Roentgenol. 2015;205(5):936-940. PubMed
15. Agarwal A, Persaud J, Grabinski R, Rabinowitz D, Bremner A, Mendelson R. Pulmonary embolism: are we there yet? J Med Imaging Radiat Oncol. 2012;56(3):270-281. PubMed
16. Drescher FS, Chandrika S, Weir ID, et al. Effectiveness and acceptability of a computerized decision support system using modified Wells criteria for evaluation of suspected pulmonary embolism. Ann Emerg Med. 2011;57(6):613-621. PubMed
17. Geeting GK, Beck M, Bruno MA, et al. Mandatory Assignment of Modified Wells Score Before CT Angiography for Pulmonary Embolism Fails to Improve Utilization or Percentage of Positive Cases. AJR Am J Roentgenol. 2016;207(2):442-449. PubMed
18. Goergen SK, Chan T, de Campo JF, et al. Reducing the use of diagnostic imaging in patients with suspected pulmonary embolism: validation of a risk assessment strategy. Emerg Med Australas. 2005;17(1):16-23. PubMed
19. Jiménez D, Resano S, Otero R, et al. Computerised clinical decision support for suspected PE. Thorax. 2015;70(9):909-911. PubMed
20. Kanaan Y, Knoepp UD, Kelly AM. The influence of education on appropriateness rates for CT pulmonary angiography in emergency department patients. Acad Radiol. 2013;20(9):1107-1114. PubMed
21. Prevedello LM, Raja AS, Ip IK, Sodickson A, Khorasani R. Does clinical decision support reduce unwarranted variation in yield of CT pulmonary angiogram? Am J Med. 2013;126(11):975-981. PubMed
22. Raja AS, Ip IK, Prevedello LM, et al. Effect of computerized clinical decision support on the use and yield of CT pulmonary angiography in the emergency department. Radiology. 2012;262(2):468-474. PubMed
23. Kline JA, Webb WB, Jones AE, Hernandez-Nino J. Impact of a rapid rule-out protocol for pulmonary embolism on the rate of screening, missed cases, and pulmonary vascular imaging in an urban US emergency department. Ann Emerg Med. 2004;44(5):490-502. PubMed
24. Raja AS, Gupta A, Ip IK, Mills AM, Khorasani R. The use of decision support to measure documented adherence to a national imaging quality measure. Acad Radiol. 2014;21(3):378-383. PubMed
25. Stein EG, Haramati LB, Chamarthy M, Sprayregen S, Davitt MM, Freeman LM. Success of a safe and simple algorithm to reduce use of CT pulmonary angiography in the emergency department. AJR Am J Roentgenol. 2010;194(2):392-397. PubMed
26. Booker MT, Johnson JO. Optimizing CT Pulmonary Angiogram Utilization in a Community Emergency Department: A Pre- and Postintervention Study. J Am Coll Radiol. 2017;14(1):65-71. PubMed
27. Goldstein NM, Kollef MH, Ward S, Gage BF. The impact of the introduction of a rapid D-dimer assay on the diagnostic evaluation of suspected pulmonary embolism. Arch Intern Med. 2001;161(4):567-571. PubMed
28. Dunne RM, Ip IK, Abbett S, et al. Effect of Evidence-based Clinical Decision Support on the Use and Yield of CT Pulmonary Angiographic Imaging in Hospitalized Patients. Radiology. 2015;276(1):167-174. PubMed
29. Wang RC, Bent S, Weber E, Neilson J, Smith-Bindman R, Fahimi J. The Impact of Clinical Decision Rules on Computed Tomography Use and Yield for Pulmonary Embolism: A Systematic Review and Meta-analysis. Ann Emerg Med. 2016;67(6):693-701. PubMed
30. Prevedello LM, Raja AS, Ip IK, Sodickson A, Khorasani R. Does clinical decision support reduce unwarranted variation in yield of CT pulmonary angiogram? Am J Med. 2013;126(11):975-981. PubMed
31. Rohacek M, Buatsi J, Szucs-Farkas Z, et al. Ordering CT pulmonary angiography to exclude pulmonary embolism: defense versus evidence in the emergency room. Intensive Care Med. 2012;38(8):1345-1351. PubMed
32. Ahn JS, Edmonds ML, McLeod SL, Dreyer JF. Familiarity with radiation exposure dose from diagnostic imaging for acute pulmonary embolism and current patterns of practice. CJEM. 2014;16(5):393-404. PubMed
33. Kringos DS, Sunol R, Wagner C, et al. The influence of context on the effectiveness of hospital quality improvement strategies: a review of systematic reviews. BMC Health Serv Res. 2015;15(277):015-0906. PubMed
34. Kaplan HC, Brady PW, Dritz MC, et al. The influence of context on quality improvement success in health care: a systematic review of the literature. Milbank Q. 2010;88(4):500-559. PubMed
35. Pernod G, Caterino J, Maignan M, Tissier C, Kassis J, Lazarchick J. D-dimer use and pulmonary embolism diagnosis in emergency units: Why is there such a difference in pulmonary embolism prevalence between the United States of America and countries outside USA? PLoS ONE. 2017;12(1):e0169268. doi:10.1371/journal.pone.0169268 PubMed
36. Saillour-Glenisson F, Domecq S, Kret M, Sibe M, Dumond JP, Michel P. Design and validation of a questionnaire to assess organizational culture in French hospital wards. BMC Health Serv Res. 2016;16:491-503. PubMed
37. Kline JA, Nelson RD, Jackson RE, Courtney DM. Criteria for the safe use of D-dimer testing in emergency department patients with suspected pulmonary embolism: a multicenter US study. Ann Emerg Med. 2002;39(2):144-152. PubMed
38. Stein PD, Fowler SE, Goodman LR, et al. Multidetector computed tomography for acute pulmonary embolism. New Engl J Med. 2006;354(22):2317-2327. PubMed
39. Stein PD, Woodard PK, Weg JG, et al. Diagnostic pathways in acute pulmonary embolism: recommendations of the PIOPED II investigators. Am J Med. 2006;119(12):1048-1055. PubMed
40. Torbicki A, Perrier A, Konstantinides S, et al. Guidelines on the diagnosis and management of acute pulmonary embolism: the Task Force for the Diagnosis and Management of Acute Pulmonary Embolism of the European Society of Cardiology (ESC). Eur Heart J. 2008;29(18):2276-2315. PubMed
© 2018 Society of Hospital Medicine
Transitioning from General Pediatric to Adult-Oriented Inpatient Care: National Survey of US Children’s Hospitals
Over 90% of children with chronic diseases now survive into adulthood.1,2 Clinical advances overcoming diseases previously fatal in childhood create new challenges for health systems with limited capacity to manage young adults with complicated and unfamiliar childhood-onset conditions. Consequently, improving the transition from pediatric to adult-oriented care has become a national priority.
Although major pediatric-adult transition initiatives—such as the Six Core Elements Framework,3 a technical brief from the Agency for Healthcare Research and Quality,4 and joint statements from major medical societies5,6—outline key transition recommendations generally and for outpatients, they contain limited or no guidance specifically devoted to transitioning inpatient hospital care from pediatric to adult-oriented settings. Key unknowns include whether, when, and how to transition inpatient care from children’s to nonchildren’s hospitals and how this can be integrated into comprehensive youth-adult transition care.
Nevertheless, the number of discharges of 18- to 21-year-old patients with chronic conditions admitted to children’s hospitals is increasing at a faster rate than discharges of other age groups,7 suggesting both that the population is growing in size and that there are important barriers to transitioning these patients into nonchildren’s hospital settings. Spending on adult patients 18 years or older admitted to children’s hospitals has grown to $1 billion annually.8 Hospitalizations are a commonly proposed outcome measure of pediatric-adult transition work.1,9,10 For example, higher rates of avoidable hospitalizations during early adulthood have been observed for 15- to 22-year-olds with kidney failure cared for exclusively in adult-oriented facilities and during the years immediately after transfer to adult care.11
While research is beginning to describe outcomes of adult-aged patients with childhood-onset chronic conditions admitted to children’s hospitals,7,12,13 there has been no comprehensive description of efforts within children’s hospitals to transition such patients into adult-oriented inpatient settings. This information is necessary to outline institutional needs, delineate opportunities for improvement, and help clinicians strategically organize services for patients requiring this transition.
We sought to characterize the current state of the transition from pediatric- to adult-oriented inpatient care across general pediatric inpatient services at US children’s hospitals. We hypothesized that only a limited and inconsistent set of activities would be practiced. We also hypothesized that institutions having formal outpatient transition processes or providers with specialization to care for this age group, such as dual-trained internal medicine–pediatrics (med–peds) physicians, would report performing more activities.
METHODS
Study Design, Setting, Participants
We conducted a national survey of leaders of inpatient general pediatrics services at US children’s hospitals from January 2016 to July 2016. Hospitals were identified using the online Children’s Hospital Association directory. Hospitals without inpatient general pediatrics services (eg, rehabilitation or subspecialty-only facilities) were excluded.
We identified a single respondent from each of the 195 remaining children’s hospitals using a structured protocol. Phone numbers and e-mail addresses of potential respondents were gathered from hospital or medical school directories. Following a standard script, study team members contacted potential respondents to describe the purpose of the study and to confirm their contact information. Hospitals were also allowed to designate a different individual with more specific expertise to participate, when relevant (eg, specific faculty member leading a related quality improvement initiative). The goal was to identify a leader of inpatient care with the most knowledge of institutional practices related to the transition to adult inpatient care. Examples of respondent roles included director of inpatient pediatrics, chief of hospital medicine or general pediatrics, medical director, and similar titles.
Survey Elements
As part of a larger quality improvement initiative at our institution, a multidisciplinary team of pediatric and internal medicine healthcare providers (physicians, nurse practitioners, nurses, case managers, social workers, child life specialists), as well as parents and patients, developed an “ideal state” with this transition and a consensus-based conceptual framework of key patient and institutional determinants of a formal inpatient transition initiative for children with chronic conditions within a children’s hospital (Figure). 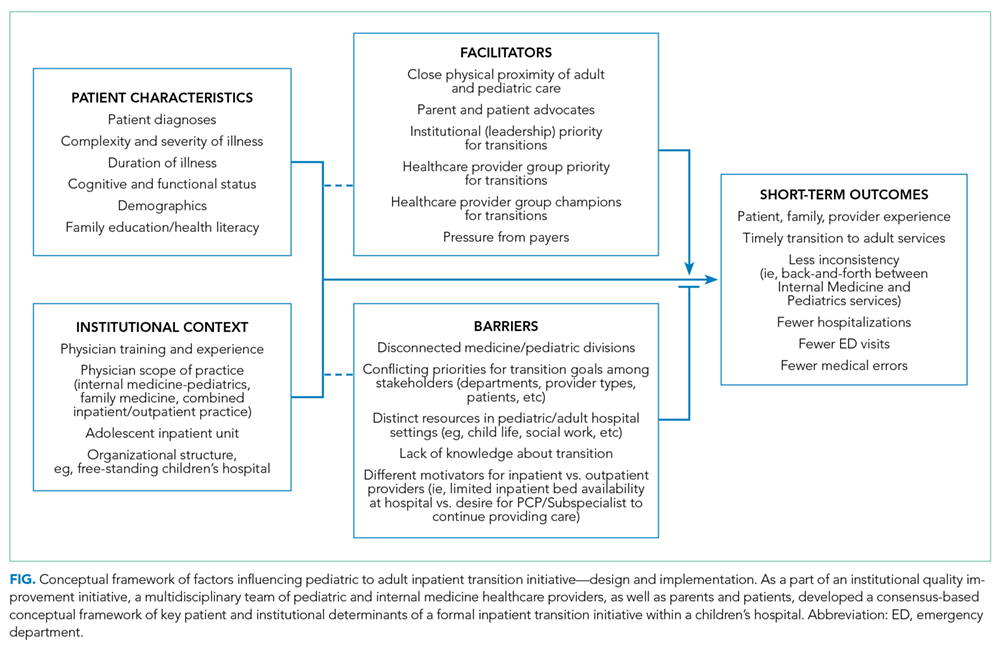
Institutional Context and Factors Influencing Inpatient Transitions
The following hospital characteristics were assessed: administrative structure (free-standing, hospital-within-hospital, or “free-leaning,” ie, separate physical structure but same administrative structure as a general hospital), urban versus rural, academic versus nonacademic, presence of an inpatient adolescent unit, presence of subspecialty admitting services, and providers with med–peds or family medicine training. The following provider group characteristics were assessed: number of full-time equivalents (FTEs), scope of practice (inpatient only, combination inpatient/outpatient), proportion of providers at a “senior” level (ie, at least 7 years posttraining or at an associate professor rank), estimated number of discharges per week, and proportion of patients cared for without resident physicians.
Inpatient Transition Initiative
Each institution was categorized as having or not having an inpatient transition initiative by whether they indicated having either (1) an institutional leader of the transition from pediatric to adult-oriented inpatient settings or (2) an inpatient transition process, for which “process” was defined as “a standard, organized, and predictable set of transition activities that may or may not be documented, but the steps are generally agreed upon.”
Specific Inpatient Transition Activities
Respondents indicated whether 22 activities occurred consistently, defined as at least 50% of the time. To facilitate description, activities were grouped into categories using the labels from the Six Core Elements framework3 (Table 1): Policy, Tracking and Monitoring, Readiness, Planning, Transfer of Care, and Transfer Completion. Respondents were also asked whether outpatient pediatric-adult transition activities existed at their institution and whether they were linked to inpatient transition activities.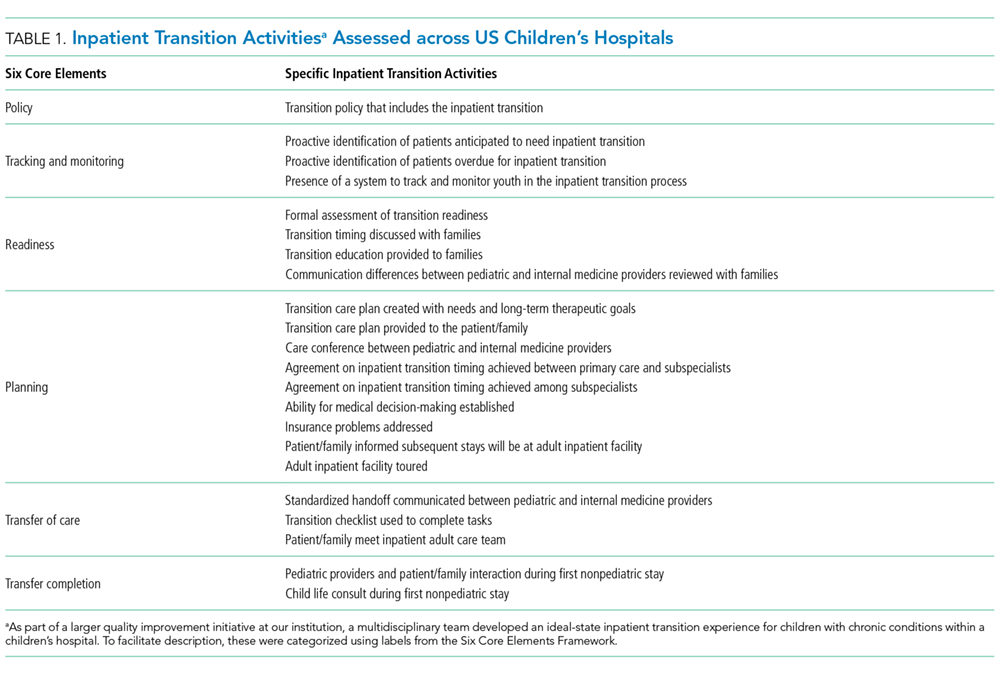
Data Collection
After verifying contact information, respondents received an advanced priming phone call followed by a mailed request to participate with a printed uniform resource locator (URL) to the web survey. Two email reminders containing the URL were sent to nonresponders at 5 and 10 days after the initial mailing. Remaining nonresponders then received a reminder phone call, followed by a mailed paper copy of the survey questionnaire to be completed by hand approximately 2 weeks after the last emailed request. The survey was administered using the Qualtrics web survey platform (www.qualtrics.com). Data collection occurred between January 2016 and July 2016. Participants received a $20 incentive.
Statistical Analysis
Descriptive statistics summarized the current state of inpatient transition at general pediatrics services across US children’s hospitals. Exploratory factor analysis assessed whether individual activities were sufficiently correlated to allow grouping items and constructing scales. Differences in institutional or respondent characteristics between hospitals that did and did not report having an inpatient initiative were compared using t tests for continuous data. Fisher’s exact test was used for categorical data because some cell sizes were ≤5. Bivariate logistic regression quantified associations between presence versus absence of specific transition activities and presence versus absence of an inpatient transition initiative. Analyses were completed in STATA (SE version 14.0; StataCorp, College Station, Texas). The institutional review board at our institution approved this study.
RESULTS
Responses were received from 96 of 195 children’s hospitals (49.2% response rate). Responding institution characteristics are summarized in Table 2. Free-standing children’s hospitals made up just over one-third of the sample (36%), while the remaining were free-leaning (22%) or hospital-within-hospital (43%). Most children’s hospitals (58%) did not have a specific adult-oriented hospital identified to receive transitioning patients. Slightly more than 10% had an inpatient adolescent unit. The majority of institutions were academic medical centers (78%) in urban locations (88%). Respondents represented small (<5 FTE, 21%), medium (6-10 FTE, 36%), and large provider groups (11+ FTE, 44%). Although 70% of respondents described their groups as “hospitalist only,” meaning providers only practiced inpatient general pediatrics, nearly 30% had providers practicing inpatient and outpatient general pediatrics. Just over 40% of respondents reported having med–peds providers. Pediatric-adult transition processes for outpatient care were present at 45% of institutions.
Transition Activities
Thirty-eight percent of children’s hospitals had an inpatient transition initiative using our study definition—31% by having a set of generally agreed upon activities, 19% by having a leader, and 11% having both. Inpatient transition leaders included pediatric hospitalists (43%), pediatric subspecialists and primary care providers (14% each), med–peds providers (11%), or case managers (7%). Respondent and institutional characteristics were similar at institutions that did and did not have an inpatient transition initiative (Table 2); however, children’s hospitals with inpatient transition initiatives more often had med–peds providers (P = .04). Institutions with pediatric-adult outpatient care transition processes more often had an inpatient initiative (71% and 29%, respectively; P = .001).
Exploratory factor analysis identified 2 groups of well-correlated items, which we grouped into “preparation” and “transfer initiation” scales (supplementary Appendix). The preparation scale was composed of the following 5 items (Cronbach α = 0.84): proactive identification of patients anticipated to need transition, proactive identification of patients overdue for transition, readiness formally assessed, timing discussed with family, and patient and/or family informed that the next stay would be at the adult facility. The transfer initiation scale comprised the following 6 items (Cronbach α = 0.72): transition education provided to families, primary care–subspecialist agreement on timing, subspecialist–subspecialist agreement on timing, patient decision-making ability established, adult facility tour, and standardized handoff communication between healthcare providers. While these items were analyzed only in this scale, other activities were analyzed as independent variables. In this analysis, 40.9% of institutions had a preparation scale score of 0 (no items performed), while 13% had all 5 items performed. Transfer initiation scale scores ranged from 0 (47%) to 6 (2%).
Specific activities varied widely across institutions, and none of the activities occurred at a majority of children’s hospitals (Table 3). Only 11% of children’s hospital transition policies referenced transitions of inpatient care. The activity most commonly reported across children’s hospitals was addressing potential insurance problems (41%). The least common inpatient transition activities were having child life consult during the first adult hospital stay (6%) or having a system to track and monitor youth in the inpatient transition process (2%). Transition processes and policies were relatively new among institutions that had them—average years an inpatient transition process had been in place was 1.2 (SD 0.4), and average years with a transition policy, including inpatient care, was 1.3 (SD 0.4).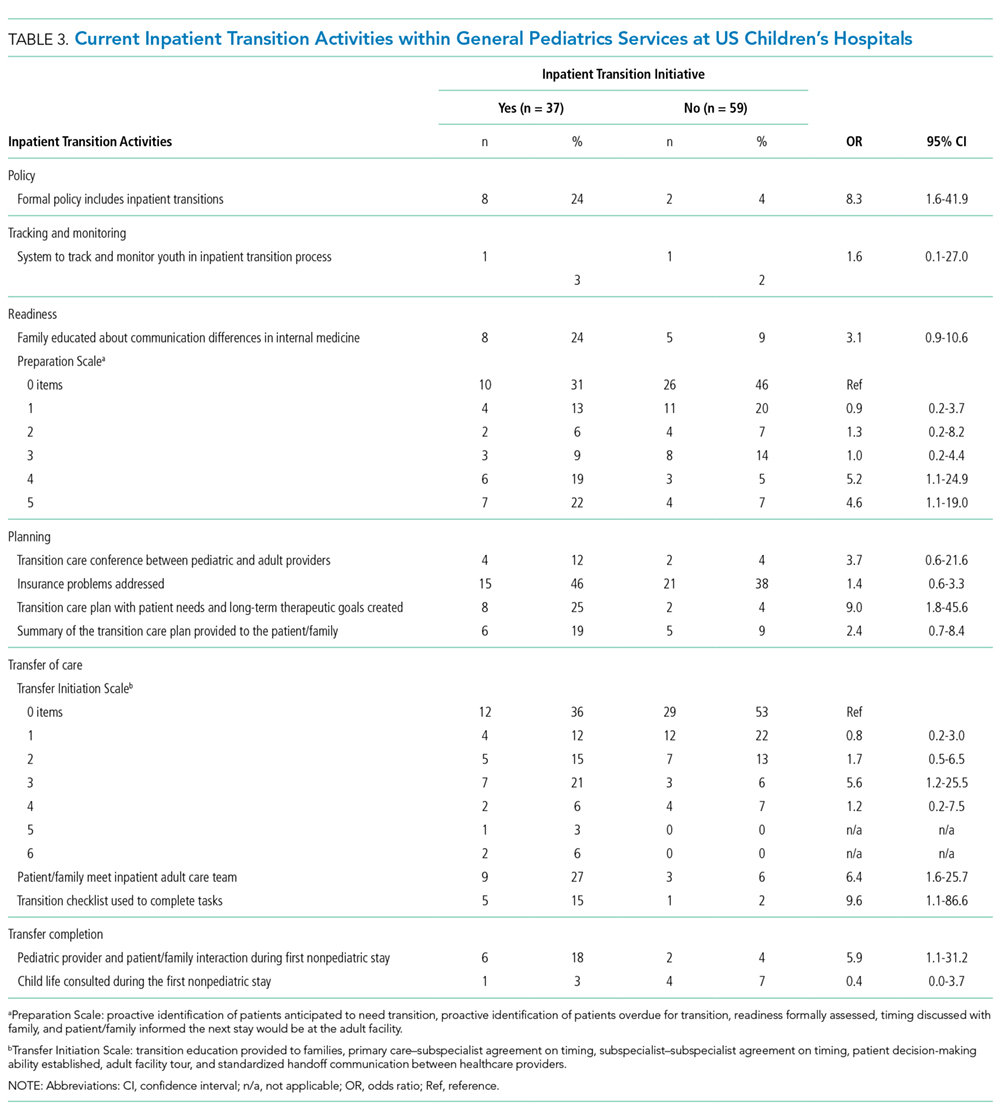
Transition Activities at Hospitals With and Without an Inpatient Transition Initiative
Most activities assessed in this study (both scales plus 5 of 11 individual activities) were significantly more common in children’s hospitals with an inpatient transition initiative (Table 3). The most common activity was addressing potential insurance problems (46%), and the least common activity was having a system to track and monitor youth in the inpatient transition process (3%). The majority of institutions without an inpatient transition initiative (53%) performed 0 transfer initiation scale items. Large effect sizes between hospitals with and without a transition initiative were observed for use of a checklist to complete tasks (odds ratio [OR] 9.6, P = .04) and creation of a transition care plan (OR 9.0, P = .008). Of the 6 activities performed at similarly low frequencies at institutions with and without an initiative, half involved transition planning, the essential step after readiness but before actual transfer of care.
DISCUSSION
We conducted the first national survey describing the policies and procedures of the transition of general inpatient care from children’s to adult-oriented hospitals for youth and young adults with chronic conditions. Our main findings demonstrate that a relatively small number of general inpatient services at children’s hospitals have leaders or dedicated processes to shepherd this transition, and a minority have a specific adult hospital identified to receive their patients. Even among institutions with inpatient transition initiatives, there is wide variability in the performance of activities to facilitate transitioning out of US children’s hospitals. In these institutions, performance seems to be more lacking in later links of the transition chain. Results from this work can serve as a baseline and identify organizational needs and opportunities for future work.
Children’s hospital general services with and without an inpatient pediatric-adult transition initiative had largely similar characteristics; however, the limited sample size may lack power to detect some differences. Perhaps not surprisingly, having med–peds providers and outpatient transition processes were the characteristics most associated with having an inpatient pediatric-adult transition initiative. The observation that over 70% of hospitals with an outpatient process had an inpatient transition leader or dedicated process makes us optimistic that as general transition efforts expand, more robust inpatient transition activities may be achievable.
We appreciate that the most appropriate location to care for hospitalized young adults with childhood-onset chronic conditions is neither known nor answered with this study. Both options face challenges—adult-oriented hospitals may not be equipped to care for adult manifestations of childhood-onset conditions,14,15 while children’s hospitals may lack the resources and expertise to provide comprehensive care to adults.7 Although hospital charges and lengths of stay may be greater when adults with childhood-onset chronic conditions are admitted to children’s compared with adult hospitals,12,13,16 important confounders such as severity of illness could explain why adult-aged patients may both remain in children’s hospitals at older ages and simultaneously have worse outcomes than peers. Regardless, at some point, transitioning care into an adult-oriented hospital may be in patients’ best interests. If so, families and providers need guidance on (1) the important aspects of this transition and (2) how to effectively implement the transition.
Because the most important inpatient transition care activities are not empirically known, we designed our survey to assess a broad set of desirable activities emerging from our multidisciplinary quality improvement work. We mapped these activities to the categories used by the Six Core Elements framework.3 Addressing insurance issues was one of the most commonly reported activities, although still fewer than 50% of hospitals reported addressing these problems. It was notable that the majority of institutions without a transition initiative performed none of the transfer initiation scale items. In addition, 2 features of transition efforts highlighted by advocates nationally—use of a checklist and creation of a transition care plan— were 9 times more likely when sites had transition initiatives. Such findings may be motivating for institutions that are considering establishing a transition initiative. Overall, we were not surprised with hospitals’ relatively low performance across most transition activities because only about 40% of US families of children with special healthcare needs report receiving the general services they need to transition to adult healthcare.17
We suspect that a number of the studied inpatient transition activities may be uncommon for structural reasons. For example, having child life consultation during an initial adult stay was rare. In fact, we observed post hoc that it occurred only in hospital-within-hospital systems, an expected finding because adult-only facilities are unlikely to have child life personnel. Other barriers, however, are less obviously structural. Almost no respondents indicated providing a tour of an adult facility, which was true whether the children’s hospital was free-standing or hospital-within-hospital. Given that hospitals with med–peds providers more often had inpatient transition initiatives, it would be interesting to examine whether institutions with med–peds training programs are able to overcome more of these barriers because of the bridges inherently created between departments even when at physically separated sites.
Having a system to track and/or monitor youth going through the transition process was also uncommon. This presumably valuable activity is one of the Six Core Elements3 and is reminiscent of population management strategies increasingly common in primary care.18 Pediatric hospitalists might benefit from adopting a similar philosophy for certain patient populations. Determining whether this activity would be most appropriately managed by inpatient providers versus being integrated into a comprehensive tracking and/or monitoring strategy (ie, inpatient care plus primary care, subspecialty care, school, employment, insurance, etc.) is worth continued consideration.
Although the activities we studied spanned many important dimensions, the most important transition activities in any given context may differ based on institutional resources and those of nearby adult healthcare providers.16 For example, an activity may be absent at a children’s hospital because it is already readily handled in primary care within that health system. Understanding how local resources and patient needs influence the relationship between transition activities and outcomes is an important next step in this line of work. Such research could inform how institutions adapt effective transition activities (eg, developing care plans) to most efficiently meet the needs of their patients and families.
Our findings align with and advance the limited work published on this aspect of transition. A systematic literature review of general healthcare transition interventions found that meeting adult providers prior to transitioning out of the pediatric system was associated with less concern about admission to the adult hospital floor.9 Formally recognizing inpatient care as a part of a comprehensive approach to transition may help adults with childhood-onset chronic conditions progress into adult-oriented hospitals. Inpatient and outpatient providers can educate one another on critical aspects of transition that span across settings. The Cystic Fibrosis (CF) Foundation has established a set of processes to facilitate the transition to adult care and specifically articulates the transfer to adult inpatient settings.19,20 Perhaps as a result, CF is also one of few conditions with fewer adult patients being admitted to children’s hospitals7 despite the increasing number of adults living with the condition.19 Adapting the CF Foundation approach to other chronic conditions may be an effective approach.
Our study has important limitations. Most pertinently, the list of transition activities was developed at a single institution. Although drawing on accepted national guidelines and a diverse local quality improvement group, our listed activities could not be exhaustive. Care plan development and posttransition follow-up activities may benefit from ongoing development in subsequent work. Continuing to identify and integrate approaches taken at other children’s hospitals will also be informative. For example, some children’s hospitals have introduced adult medicine consultative services to focus on transition, attending children’s hospital safety rounds, and sharing standard care protocols for adult patients still cared for in pediatric settings (eg, stroke and myocardial infarction).16
In addition, our findings are limited to generalist teams at children’s hospitals and may not be applicable to inpatient subspecialty services. We could not compare differences in respondents versus nonrespondents to determine whether important selection bias exists. Respondent answers could not be verified. Despite our attempt to identify the most informed respondent at each hospital, responses may have differed with other hospital respondents. We used a novel instrument with unknown psychometric properties. Our data provide only the children’s hospital perspective, and perspectives of others (eg, families, primary care pediatricians or internists, subspecialists, etc.) will be valuable to explore in subsequent research. Subsequent research should investigate the relative importance and feasibility of specific inpatient transition activities, ideal timing, as well as the expected outcomes of high-quality inpatient transition. An important question for future work is to identify which patients are most likely to benefit by having inpatient care as part of their transition plan.
CONCLUSIONS
Nevertheless, the clinical and health services implications of this facet of transition appear to be substantial.16 To meet the Maternal and Child Health Bureau (MCHB) core outcome for children with special healthcare needs to receive “the services necessary to make transitions to adult healthcare,”21 development, validation, and implementation of effective inpatient-specific transition activities and a set of measurable processes and outcomes are needed. A key direction for the healthcare transitions field, with respect to inpatient care, is to determine the activities most effective at improving relevant patient and family outcomes. Ultimately, we advocate that the transition of inpatient care be integrated into comprehensive approaches to transitional care.
Disclosure: The project described was supported in part by the Clinical and Translational Science Award (CTSA) program, through the National Institutes of Health (NIH) National Center for Advancing Translational Sciences (NCATS), grant UL1TR000427. The content is solely the responsibility of the authors and does not necessarily represent the official views of the NIH. The project was also supported by the University of Wisconsin Departments of Pediatrics and Medicine. The authors have no financial or other relationships relevant to this article to disclose.
1. Vaks Y, Bensen R, Steidtmann D, et al. Better health, less spending: Redesigning the transition from pediatric to adult healthcare for youth with chronic illness. Healthc (Amst). 2016;4(1):57-68.
2. Bensen R, Steidtmann D, Vaks Y. A Triple Aim Approach to Transition from Pediatric to Adult Health Care for Youth with Special Health Care Needs. Palo Alto, CA: Lucile Packard Foundation for Children’s Health; 2014.
3. Got Transition. Center for Health Care Transition Improvement 2016; http://www.gottransition.org/. Accessed April 4, 2016.
4. McPheeters M, Davis AM, Taylor JL, Brown RF, Potter SA, Epstein RA. Transition Care for Children with Special Health Needs. Technical Brief No. 15. Rockville, MD: Agency for Healthcare Research and Quality; 2014.
5. American Academy of Pediatrics, American Academy of Family Physicians, American College of Physicians, Transitions Clinical Report Authoring Group, Cooley WC, Sagerman PJ. Supporting the health care transition from adolescence to adulthood in the medical home. Pediatrics. 2011;128(1):182-200.
6. American Academy of Pediatrics, American Academy of Family Physicians, American College of Physicians-American Society of Internal Medicine. A consensus statement on health care transitions for young adults with special health care needs. Pediatrics. 2002;110(6 Pt 2):1304-1306.
7. Goodman DM, Hall M, Levin A, et al. Adults with chronic health conditions originating in childhood: inpatient experience in children’s hospitals. Pediatrics. 2011;128(1):5-13.
8. Goodman DM, Mendez E, Throop C, Ogata ES. Adult survivors of pediatric illness: the impact on pediatric hospitals. Pediatrics. 2002;110(3):583-589.
9. Bloom SR, Kuhlthau K, Van Cleave J, Knapp AA, Newacheck P, Perrin JM. Health care transition for youth with special health care needs. J Adolesc Health. 2012;51(3):213-219.
10. Fair C, Cuttance J, Sharma N, et al. International and Interdisciplinary Identification of Health Care Transition Outcomes. JAMA Pediatr. 2016;170(3):205-211.
11. Samuel SM, Nettel-Aguirre A, Soo A, Hemmelgarn B, Tonelli M, Foster B. Avoidable hospitalizations in youth with kidney failure after transfer to or with only adult care. Pediatrics. 2014;133(4):e993-e1000.
12. Okumura MJ, Campbell AD, Nasr SZ, Davis MM. Inpatient health care use among adult survivors of chronic childhood illnesses in the United States. Arch Pediatr Adolesc Med. 2006;160(10):1054-1060.
13. Edwards JD, Houtrow AJ, Vasilevskis EE, Dudley RA, Okumura MJ. Multi-institutional profile of adults admitted to pediatric intensive care units. JAMA Pediatr. 2013;167(5):436-443.
14. Peter NG, Forke CM, Ginsburg KR, Schwarz DF. Transition from pediatric to adult care: internists’ perspectives. Pediatrics. 2009;123(2):417-423.
15. Okumura MJ, Heisler M, Davis MM, Cabana MD, Demonner S, Kerr EA. Comfort of general internists and general pediatricians in providing care for young adults with chronic illnesses of childhood. J Gen Intern Med. 2008;23(10):1621-1627.
16. Kinnear B, O’Toole JK. Care of Adults in Children’s Hospitals: Acknowledging the Aging Elephant in the Room. JAMA Pediatr. 2015;169(12):1081-1082.
17. McManus MA, Pollack LR, Cooley WC, et al. Current status of transition preparation among youth with special needs in the United States. Pediatrics. 2013;131(6):1090-1097.
18. Kelleher KJ, Cooper J, Deans K, et al. Cost saving and quality of care in a pediatric accountable care organization. Pediatrics. 2015;135(3):e582-e589.
19. Tuchman LK, Schwartz LA, Sawicki GS, Britto MT. Cystic fibrosis and transition to adult medical care. Pediatrics. 2010;125(3):566-573.
20. Yankaskas JR, Marshall BC, Sufian B, Simon RH, Rodman D. Cystic fibrosis adult care: consensus conference report. Chest. 2004;125(1 Suppl):1S-39S.
21. CSHCN Core System Outcomes: Goals for a System of Care. The National Survey of Children with Special Health Care Needs Chartbook 2009-2010. http://mchb.hrsa.gov/cshcn0910/core/co.html Accessed November 30, 2016.
Over 90% of children with chronic diseases now survive into adulthood.1,2 Clinical advances overcoming diseases previously fatal in childhood create new challenges for health systems with limited capacity to manage young adults with complicated and unfamiliar childhood-onset conditions. Consequently, improving the transition from pediatric to adult-oriented care has become a national priority.
Although major pediatric-adult transition initiatives—such as the Six Core Elements Framework,3 a technical brief from the Agency for Healthcare Research and Quality,4 and joint statements from major medical societies5,6—outline key transition recommendations generally and for outpatients, they contain limited or no guidance specifically devoted to transitioning inpatient hospital care from pediatric to adult-oriented settings. Key unknowns include whether, when, and how to transition inpatient care from children’s to nonchildren’s hospitals and how this can be integrated into comprehensive youth-adult transition care.
Nevertheless, the number of discharges of 18- to 21-year-old patients with chronic conditions admitted to children’s hospitals is increasing at a faster rate than discharges of other age groups,7 suggesting both that the population is growing in size and that there are important barriers to transitioning these patients into nonchildren’s hospital settings. Spending on adult patients 18 years or older admitted to children’s hospitals has grown to $1 billion annually.8 Hospitalizations are a commonly proposed outcome measure of pediatric-adult transition work.1,9,10 For example, higher rates of avoidable hospitalizations during early adulthood have been observed for 15- to 22-year-olds with kidney failure cared for exclusively in adult-oriented facilities and during the years immediately after transfer to adult care.11
While research is beginning to describe outcomes of adult-aged patients with childhood-onset chronic conditions admitted to children’s hospitals,7,12,13 there has been no comprehensive description of efforts within children’s hospitals to transition such patients into adult-oriented inpatient settings. This information is necessary to outline institutional needs, delineate opportunities for improvement, and help clinicians strategically organize services for patients requiring this transition.
We sought to characterize the current state of the transition from pediatric- to adult-oriented inpatient care across general pediatric inpatient services at US children’s hospitals. We hypothesized that only a limited and inconsistent set of activities would be practiced. We also hypothesized that institutions having formal outpatient transition processes or providers with specialization to care for this age group, such as dual-trained internal medicine–pediatrics (med–peds) physicians, would report performing more activities.
METHODS
Study Design, Setting, Participants
We conducted a national survey of leaders of inpatient general pediatrics services at US children’s hospitals from January 2016 to July 2016. Hospitals were identified using the online Children’s Hospital Association directory. Hospitals without inpatient general pediatrics services (eg, rehabilitation or subspecialty-only facilities) were excluded.
We identified a single respondent from each of the 195 remaining children’s hospitals using a structured protocol. Phone numbers and e-mail addresses of potential respondents were gathered from hospital or medical school directories. Following a standard script, study team members contacted potential respondents to describe the purpose of the study and to confirm their contact information. Hospitals were also allowed to designate a different individual with more specific expertise to participate, when relevant (eg, specific faculty member leading a related quality improvement initiative). The goal was to identify a leader of inpatient care with the most knowledge of institutional practices related to the transition to adult inpatient care. Examples of respondent roles included director of inpatient pediatrics, chief of hospital medicine or general pediatrics, medical director, and similar titles.
Survey Elements
As part of a larger quality improvement initiative at our institution, a multidisciplinary team of pediatric and internal medicine healthcare providers (physicians, nurse practitioners, nurses, case managers, social workers, child life specialists), as well as parents and patients, developed an “ideal state” with this transition and a consensus-based conceptual framework of key patient and institutional determinants of a formal inpatient transition initiative for children with chronic conditions within a children’s hospital (Figure).
Institutional Context and Factors Influencing Inpatient Transitions
The following hospital characteristics were assessed: administrative structure (free-standing, hospital-within-hospital, or “free-leaning,” ie, separate physical structure but same administrative structure as a general hospital), urban versus rural, academic versus nonacademic, presence of an inpatient adolescent unit, presence of subspecialty admitting services, and providers with med–peds or family medicine training. The following provider group characteristics were assessed: number of full-time equivalents (FTEs), scope of practice (inpatient only, combination inpatient/outpatient), proportion of providers at a “senior” level (ie, at least 7 years posttraining or at an associate professor rank), estimated number of discharges per week, and proportion of patients cared for without resident physicians.
Inpatient Transition Initiative
Each institution was categorized as having or not having an inpatient transition initiative by whether they indicated having either (1) an institutional leader of the transition from pediatric to adult-oriented inpatient settings or (2) an inpatient transition process, for which “process” was defined as “a standard, organized, and predictable set of transition activities that may or may not be documented, but the steps are generally agreed upon.”
Specific Inpatient Transition Activities
Respondents indicated whether 22 activities occurred consistently, defined as at least 50% of the time. To facilitate description, activities were grouped into categories using the labels from the Six Core Elements framework3 (Table 1): Policy, Tracking and Monitoring, Readiness, Planning, Transfer of Care, and Transfer Completion. Respondents were also asked whether outpatient pediatric-adult transition activities existed at their institution and whether they were linked to inpatient transition activities.
Data Collection
After verifying contact information, respondents received an advanced priming phone call followed by a mailed request to participate with a printed uniform resource locator (URL) to the web survey. Two email reminders containing the URL were sent to nonresponders at 5 and 10 days after the initial mailing. Remaining nonresponders then received a reminder phone call, followed by a mailed paper copy of the survey questionnaire to be completed by hand approximately 2 weeks after the last emailed request. The survey was administered using the Qualtrics web survey platform (www.qualtrics.com). Data collection occurred between January 2016 and July 2016. Participants received a $20 incentive.
Statistical Analysis
Descriptive statistics summarized the current state of inpatient transition at general pediatrics services across US children’s hospitals. Exploratory factor analysis assessed whether individual activities were sufficiently correlated to allow grouping items and constructing scales. Differences in institutional or respondent characteristics between hospitals that did and did not report having an inpatient initiative were compared using t tests for continuous data. Fisher’s exact test was used for categorical data because some cell sizes were ≤5. Bivariate logistic regression quantified associations between presence versus absence of specific transition activities and presence versus absence of an inpatient transition initiative. Analyses were completed in STATA (SE version 14.0; StataCorp, College Station, Texas). The institutional review board at our institution approved this study.
RESULTS
Responses were received from 96 of 195 children’s hospitals (49.2% response rate). Responding institution characteristics are summarized in Table 2. Free-standing children’s hospitals made up just over one-third of the sample (36%), while the remaining were free-leaning (22%) or hospital-within-hospital (43%). Most children’s hospitals (58%) did not have a specific adult-oriented hospital identified to receive transitioning patients. Slightly more than 10% had an inpatient adolescent unit. The majority of institutions were academic medical centers (78%) in urban locations (88%). Respondents represented small (<5 FTE, 21%), medium (6-10 FTE, 36%), and large provider groups (11+ FTE, 44%). Although 70% of respondents described their groups as “hospitalist only,” meaning providers only practiced inpatient general pediatrics, nearly 30% had providers practicing inpatient and outpatient general pediatrics. Just over 40% of respondents reported having med–peds providers. Pediatric-adult transition processes for outpatient care were present at 45% of institutions.
Transition Activities
Thirty-eight percent of children’s hospitals had an inpatient transition initiative using our study definition—31% by having a set of generally agreed upon activities, 19% by having a leader, and 11% having both. Inpatient transition leaders included pediatric hospitalists (43%), pediatric subspecialists and primary care providers (14% each), med–peds providers (11%), or case managers (7%). Respondent and institutional characteristics were similar at institutions that did and did not have an inpatient transition initiative (Table 2); however, children’s hospitals with inpatient transition initiatives more often had med–peds providers (P = .04). Institutions with pediatric-adult outpatient care transition processes more often had an inpatient initiative (71% and 29%, respectively; P = .001).
Exploratory factor analysis identified 2 groups of well-correlated items, which we grouped into “preparation” and “transfer initiation” scales (supplementary Appendix). The preparation scale was composed of the following 5 items (Cronbach α = 0.84): proactive identification of patients anticipated to need transition, proactive identification of patients overdue for transition, readiness formally assessed, timing discussed with family, and patient and/or family informed that the next stay would be at the adult facility. The transfer initiation scale comprised the following 6 items (Cronbach α = 0.72): transition education provided to families, primary care–subspecialist agreement on timing, subspecialist–subspecialist agreement on timing, patient decision-making ability established, adult facility tour, and standardized handoff communication between healthcare providers. While these items were analyzed only in this scale, other activities were analyzed as independent variables. In this analysis, 40.9% of institutions had a preparation scale score of 0 (no items performed), while 13% had all 5 items performed. Transfer initiation scale scores ranged from 0 (47%) to 6 (2%).
Specific activities varied widely across institutions, and none of the activities occurred at a majority of children’s hospitals (Table 3). Only 11% of children’s hospital transition policies referenced transitions of inpatient care. The activity most commonly reported across children’s hospitals was addressing potential insurance problems (41%). The least common inpatient transition activities were having child life consult during the first adult hospital stay (6%) or having a system to track and monitor youth in the inpatient transition process (2%). Transition processes and policies were relatively new among institutions that had them—average years an inpatient transition process had been in place was 1.2 (SD 0.4), and average years with a transition policy, including inpatient care, was 1.3 (SD 0.4).
Transition Activities at Hospitals With and Without an Inpatient Transition Initiative
Most activities assessed in this study (both scales plus 5 of 11 individual activities) were significantly more common in children’s hospitals with an inpatient transition initiative (Table 3). The most common activity was addressing potential insurance problems (46%), and the least common activity was having a system to track and monitor youth in the inpatient transition process (3%). The majority of institutions without an inpatient transition initiative (53%) performed 0 transfer initiation scale items. Large effect sizes between hospitals with and without a transition initiative were observed for use of a checklist to complete tasks (odds ratio [OR] 9.6, P = .04) and creation of a transition care plan (OR 9.0, P = .008). Of the 6 activities performed at similarly low frequencies at institutions with and without an initiative, half involved transition planning, the essential step after readiness but before actual transfer of care.
DISCUSSION
We conducted the first national survey describing the policies and procedures of the transition of general inpatient care from children’s to adult-oriented hospitals for youth and young adults with chronic conditions. Our main findings demonstrate that a relatively small number of general inpatient services at children’s hospitals have leaders or dedicated processes to shepherd this transition, and a minority have a specific adult hospital identified to receive their patients. Even among institutions with inpatient transition initiatives, there is wide variability in the performance of activities to facilitate transitioning out of US children’s hospitals. In these institutions, performance seems to be more lacking in later links of the transition chain. Results from this work can serve as a baseline and identify organizational needs and opportunities for future work.
Children’s hospital general services with and without an inpatient pediatric-adult transition initiative had largely similar characteristics; however, the limited sample size may lack power to detect some differences. Perhaps not surprisingly, having med–peds providers and outpatient transition processes were the characteristics most associated with having an inpatient pediatric-adult transition initiative. The observation that over 70% of hospitals with an outpatient process had an inpatient transition leader or dedicated process makes us optimistic that as general transition efforts expand, more robust inpatient transition activities may be achievable.
We appreciate that the most appropriate location to care for hospitalized young adults with childhood-onset chronic conditions is neither known nor answered with this study. Both options face challenges—adult-oriented hospitals may not be equipped to care for adult manifestations of childhood-onset conditions,14,15 while children’s hospitals may lack the resources and expertise to provide comprehensive care to adults.7 Although hospital charges and lengths of stay may be greater when adults with childhood-onset chronic conditions are admitted to children’s compared with adult hospitals,12,13,16 important confounders such as severity of illness could explain why adult-aged patients may both remain in children’s hospitals at older ages and simultaneously have worse outcomes than peers. Regardless, at some point, transitioning care into an adult-oriented hospital may be in patients’ best interests. If so, families and providers need guidance on (1) the important aspects of this transition and (2) how to effectively implement the transition.
Because the most important inpatient transition care activities are not empirically known, we designed our survey to assess a broad set of desirable activities emerging from our multidisciplinary quality improvement work. We mapped these activities to the categories used by the Six Core Elements framework.3 Addressing insurance issues was one of the most commonly reported activities, although still fewer than 50% of hospitals reported addressing these problems. It was notable that the majority of institutions without a transition initiative performed none of the transfer initiation scale items. In addition, 2 features of transition efforts highlighted by advocates nationally—use of a checklist and creation of a transition care plan— were 9 times more likely when sites had transition initiatives. Such findings may be motivating for institutions that are considering establishing a transition initiative. Overall, we were not surprised with hospitals’ relatively low performance across most transition activities because only about 40% of US families of children with special healthcare needs report receiving the general services they need to transition to adult healthcare.17
We suspect that a number of the studied inpatient transition activities may be uncommon for structural reasons. For example, having child life consultation during an initial adult stay was rare. In fact, we observed post hoc that it occurred only in hospital-within-hospital systems, an expected finding because adult-only facilities are unlikely to have child life personnel. Other barriers, however, are less obviously structural. Almost no respondents indicated providing a tour of an adult facility, which was true whether the children’s hospital was free-standing or hospital-within-hospital. Given that hospitals with med–peds providers more often had inpatient transition initiatives, it would be interesting to examine whether institutions with med–peds training programs are able to overcome more of these barriers because of the bridges inherently created between departments even when at physically separated sites.
Having a system to track and/or monitor youth going through the transition process was also uncommon. This presumably valuable activity is one of the Six Core Elements3 and is reminiscent of population management strategies increasingly common in primary care.18 Pediatric hospitalists might benefit from adopting a similar philosophy for certain patient populations. Determining whether this activity would be most appropriately managed by inpatient providers versus being integrated into a comprehensive tracking and/or monitoring strategy (ie, inpatient care plus primary care, subspecialty care, school, employment, insurance, etc.) is worth continued consideration.
Although the activities we studied spanned many important dimensions, the most important transition activities in any given context may differ based on institutional resources and those of nearby adult healthcare providers.16 For example, an activity may be absent at a children’s hospital because it is already readily handled in primary care within that health system. Understanding how local resources and patient needs influence the relationship between transition activities and outcomes is an important next step in this line of work. Such research could inform how institutions adapt effective transition activities (eg, developing care plans) to most efficiently meet the needs of their patients and families.
Our findings align with and advance the limited work published on this aspect of transition. A systematic literature review of general healthcare transition interventions found that meeting adult providers prior to transitioning out of the pediatric system was associated with less concern about admission to the adult hospital floor.9 Formally recognizing inpatient care as a part of a comprehensive approach to transition may help adults with childhood-onset chronic conditions progress into adult-oriented hospitals. Inpatient and outpatient providers can educate one another on critical aspects of transition that span across settings. The Cystic Fibrosis (CF) Foundation has established a set of processes to facilitate the transition to adult care and specifically articulates the transfer to adult inpatient settings.19,20 Perhaps as a result, CF is also one of few conditions with fewer adult patients being admitted to children’s hospitals7 despite the increasing number of adults living with the condition.19 Adapting the CF Foundation approach to other chronic conditions may be an effective approach.
Our study has important limitations. Most pertinently, the list of transition activities was developed at a single institution. Although drawing on accepted national guidelines and a diverse local quality improvement group, our listed activities could not be exhaustive. Care plan development and posttransition follow-up activities may benefit from ongoing development in subsequent work. Continuing to identify and integrate approaches taken at other children’s hospitals will also be informative. For example, some children’s hospitals have introduced adult medicine consultative services to focus on transition, attending children’s hospital safety rounds, and sharing standard care protocols for adult patients still cared for in pediatric settings (eg, stroke and myocardial infarction).16
In addition, our findings are limited to generalist teams at children’s hospitals and may not be applicable to inpatient subspecialty services. We could not compare differences in respondents versus nonrespondents to determine whether important selection bias exists. Respondent answers could not be verified. Despite our attempt to identify the most informed respondent at each hospital, responses may have differed with other hospital respondents. We used a novel instrument with unknown psychometric properties. Our data provide only the children’s hospital perspective, and perspectives of others (eg, families, primary care pediatricians or internists, subspecialists, etc.) will be valuable to explore in subsequent research. Subsequent research should investigate the relative importance and feasibility of specific inpatient transition activities, ideal timing, as well as the expected outcomes of high-quality inpatient transition. An important question for future work is to identify which patients are most likely to benefit by having inpatient care as part of their transition plan.
CONCLUSIONS
Nevertheless, the clinical and health services implications of this facet of transition appear to be substantial.16 To meet the Maternal and Child Health Bureau (MCHB) core outcome for children with special healthcare needs to receive “the services necessary to make transitions to adult healthcare,”21 development, validation, and implementation of effective inpatient-specific transition activities and a set of measurable processes and outcomes are needed. A key direction for the healthcare transitions field, with respect to inpatient care, is to determine the activities most effective at improving relevant patient and family outcomes. Ultimately, we advocate that the transition of inpatient care be integrated into comprehensive approaches to transitional care.
Disclosure: The project described was supported in part by the Clinical and Translational Science Award (CTSA) program, through the National Institutes of Health (NIH) National Center for Advancing Translational Sciences (NCATS), grant UL1TR000427. The content is solely the responsibility of the authors and does not necessarily represent the official views of the NIH. The project was also supported by the University of Wisconsin Departments of Pediatrics and Medicine. The authors have no financial or other relationships relevant to this article to disclose.
1. Vaks Y, Bensen R, Steidtmann D, et al. Better health, less spending: Redesigning the transition from pediatric to adult healthcare for youth with chronic illness. Healthc (Amst). 2016;4(1):57-68.
2. Bensen R, Steidtmann D, Vaks Y. A Triple Aim Approach to Transition from Pediatric to Adult Health Care for Youth with Special Health Care Needs. Palo Alto, CA: Lucile Packard Foundation for Children’s Health; 2014.
3. Got Transition. Center for Health Care Transition Improvement 2016; http://www.gottransition.org/. Accessed April 4, 2016.
4. McPheeters M, Davis AM, Taylor JL, Brown RF, Potter SA, Epstein RA. Transition Care for Children with Special Health Needs. Technical Brief No. 15. Rockville, MD: Agency for Healthcare Research and Quality; 2014.
5. American Academy of Pediatrics, American Academy of Family Physicians, American College of Physicians, Transitions Clinical Report Authoring Group, Cooley WC, Sagerman PJ. Supporting the health care transition from adolescence to adulthood in the medical home. Pediatrics. 2011;128(1):182-200.
6. American Academy of Pediatrics, American Academy of Family Physicians, American College of Physicians-American Society of Internal Medicine. A consensus statement on health care transitions for young adults with special health care needs. Pediatrics. 2002;110(6 Pt 2):1304-1306.
7. Goodman DM, Hall M, Levin A, et al. Adults with chronic health conditions originating in childhood: inpatient experience in children’s hospitals. Pediatrics. 2011;128(1):5-13.
8. Goodman DM, Mendez E, Throop C, Ogata ES. Adult survivors of pediatric illness: the impact on pediatric hospitals. Pediatrics. 2002;110(3):583-589.
9. Bloom SR, Kuhlthau K, Van Cleave J, Knapp AA, Newacheck P, Perrin JM. Health care transition for youth with special health care needs. J Adolesc Health. 2012;51(3):213-219.
10. Fair C, Cuttance J, Sharma N, et al. International and Interdisciplinary Identification of Health Care Transition Outcomes. JAMA Pediatr. 2016;170(3):205-211.
11. Samuel SM, Nettel-Aguirre A, Soo A, Hemmelgarn B, Tonelli M, Foster B. Avoidable hospitalizations in youth with kidney failure after transfer to or with only adult care. Pediatrics. 2014;133(4):e993-e1000.
12. Okumura MJ, Campbell AD, Nasr SZ, Davis MM. Inpatient health care use among adult survivors of chronic childhood illnesses in the United States. Arch Pediatr Adolesc Med. 2006;160(10):1054-1060.
13. Edwards JD, Houtrow AJ, Vasilevskis EE, Dudley RA, Okumura MJ. Multi-institutional profile of adults admitted to pediatric intensive care units. JAMA Pediatr. 2013;167(5):436-443.
14. Peter NG, Forke CM, Ginsburg KR, Schwarz DF. Transition from pediatric to adult care: internists’ perspectives. Pediatrics. 2009;123(2):417-423.
15. Okumura MJ, Heisler M, Davis MM, Cabana MD, Demonner S, Kerr EA. Comfort of general internists and general pediatricians in providing care for young adults with chronic illnesses of childhood. J Gen Intern Med. 2008;23(10):1621-1627.
16. Kinnear B, O’Toole JK. Care of Adults in Children’s Hospitals: Acknowledging the Aging Elephant in the Room. JAMA Pediatr. 2015;169(12):1081-1082.
17. McManus MA, Pollack LR, Cooley WC, et al. Current status of transition preparation among youth with special needs in the United States. Pediatrics. 2013;131(6):1090-1097.
18. Kelleher KJ, Cooper J, Deans K, et al. Cost saving and quality of care in a pediatric accountable care organization. Pediatrics. 2015;135(3):e582-e589.
19. Tuchman LK, Schwartz LA, Sawicki GS, Britto MT. Cystic fibrosis and transition to adult medical care. Pediatrics. 2010;125(3):566-573.
20. Yankaskas JR, Marshall BC, Sufian B, Simon RH, Rodman D. Cystic fibrosis adult care: consensus conference report. Chest. 2004;125(1 Suppl):1S-39S.
21. CSHCN Core System Outcomes: Goals for a System of Care. The National Survey of Children with Special Health Care Needs Chartbook 2009-2010. http://mchb.hrsa.gov/cshcn0910/core/co.html Accessed November 30, 2016.
© 2018 Society of Hospital Medicine
Out with the Old, in with the New
A new year often comes with resolutions to jettison old tendencies, increase emphasis on what has been successful, and develop new habits. For 2018, the Journal of Hospital Medicine’s year begins with resolutions that span these same areas.
The journal has been incredibly successful over the last 5 years, with a near doubling in the volume of manuscripts we have been receiving; the rise in submissions has been paralleled by the increased quality of submissions. JHM has moved on from our old approach of seeking out authors and research to having great research and authors seek us. In 2018, we expect that the challenges of our startup days will continue to recede into the past.
Many of JHM’s old habits have been incredibly successful, and we recommit ourselves to these areas. JHM is committed to providing the best possible service to its authors in the form of the rapid processing of papers under our charge and, most importantly, the highest quality peer and editorial review. Our internal mantra of “making papers better whether we accept them or not” remains a cornerstone of our efforts. The journal has been innovative in developing new and influential series, such as the Things We Do For No Reason and the Choosing Wisely®: Next Steps series. JHM’s focus on digital dissemination and social media grew further in 2017, with the #JHMChat Twitter journal clubs engaging hundreds of participants and generating literally millions of impressions.
For 2018, JHM will continue to develop and innovate in areas that reflect the field of Hospital Medicine as well as trends in peer-reviewed publishing. I am particularly excited to see the launch of a new series entitled “In the Hospital,” a series of papers that will highlight the role of connectedness, humanism, and resilience in creating the social fabric of the hospital workplace. We have renewed our relationship with the American Board of Internal Medicine Foundation to support both the Things We Do For No Reason series as well as Choosing Wisely®: Next Steps, series that will help flesh out aspects of healthcare that remain central to our practice as policies and payment models change.
As our practices become nearly wholly contained within digital workspaces, JHM will begin to highlight digital health papers in newsletters while also developing increased expertise internally. The transition to digital platforms for clinical care will be reflected in the revisiting of JHM’s digital dissemination strategy, in which we will be working to more rapidly publish papers online, often online only and with more frequent accompaniment by blogs, tweets, and the ability for readers to comment.
Our editorial sensibilities will not change; JHM’s goal is to reflect Hospital Medicine’s traditional focus areas on health-systems improvement as a discipline. But beginning in 2018 and for the future, we will also push the field and Hospital Medicine practice by publishing papers that change how we care for patients and suggest fundamental changes in how we manage diseases.
Finally, all of these efforts will be contained within a brilliant new layout and design schema, the first new design for JHM since its first issue more than 12 years ago.
JHM’s past successes and future initiatives are the result of old habits we hope to renew: a deep commitment from JHM’s editors, to whom I am deeply thankful, and from our authors, peer reviewers, and readers who help us put forward a journal that continues to grow in excellence and influence. We look forward to renewing these commitments during 2018 and welcome your help.
© 2018 Society of Hospital Medicine
Hospitalists in the ICU: Necessary But Not Sufficient
In the United States, up to 6 million patients are admitted to intensive care units (ICUs) annually at a cost estimated to exceed $80 billion or about 13% of total hospital costs.1,2 It also appears that as our population ages and illness severity increases, demand for ICU care is increasing.3 Given its importance, the organization and delivery of critical care has been extensively studied. High-intensity physician staffing by an intensivist (all patients managed or comanaged by an intensivist), while inconsistently shown to be associated with improved outcomes, has been endorsed as a high-quality care model by professional societies and the Leapfrog group. Despite its adoption by many hospitals, widespread implementation has been hampered by a national shortage of intensivists that continues to worsen over time. Hospitals, by necessity, look to alternative models to care for critically ill patients, and one such model is the use of hospitalists.
The Society of Hospital Medicine estimates that there are nearly 50,000 hospitalists practicing in the United States, and several studies show they routinely provide care in the nation’s ICUs.4 While in some ICUs hospitalists work alongside intensivists, in many, they work without intensivist support, and regardless of the model, they often serve as the primary attending physician. There is good reason to think this model of care would be effective. Most hospitalists are internists, graduating from training programs that tend to emphasize care of acutely ill hospitalized patients. Hospitalists are often present in the hospital 24/7, are comfortable working in multidisciplinary teams, and routinely engage in quality improvement, which are all characteristics common in highly functioning ICUs. Yet, a study in this issue of the Journal of Hospital Medicine raises some concern.
Sweigart and colleagues5 surveyed 425 hospitalists to understand the structure and perception of their ICU practices. Consistent with prior studies, 77% provided ICU care with 66% serving as the primary attending. A novel finding is the high level of angst and lack of support hospitalists perceived in caring for these critically ill patients. Among rural hospitalists, 43% reported they were expected to practice beyond their perceived scope of practice, and almost a third reported they never had sufficient intensivist support. Even more concerning is that among hospitalists serving as the primary attending, over two-thirds reported difficulty transferring patients to a higher level of care (Sweigart et al.5). While we have concerns over how representative this sample is of hospitalist practice (the survey response rate was only about 10%), it does appear that many hospitalists feel very uncomfortable with the ICU care they are providing and perceive barriers to moving their patients to a potentially safer care setting.
While one might argue more intensivists would solve this problem, calls for more intensivists are shortsighted, as there are compelling reasons to believe that such efforts will do little to address the mismatch between patient need and provider supply. Graduate medical education slots for intensivists cannot be easily and affordably increased, and even if more intensivists could be trained, there are few incentives to encourage them to work where they are needed most. Prioritization of intensivist training also diverts resources from training demands in equally important undersupplied specialties such as primary care.6 Finally, simply increasing intensivist supply fails to attend to important issues surrounding the multidisciplinary nature of care in an ICU, which relies heavily on multiple providers communicating and collaborating to provide optimal care. As noted in the study by Sweigart and colleagues,5 even in settings where intensivists were available 24 hours per day or made all major decisions, nearly one-third of hospitalists felt they practiced beyond their scope of expertise, suggesting that more intensivists may do little to improve hospitalists’ comfort in caring for patients in the ICU.
In lieu of increasing intensivist numbers, policymakers should consider several strategies that have the potential to improve the quality of care delivered to patients in the ICU without increasing intensivists. Recent data suggest that some ICU patients can be safely managed by physician assistants and nurse practitioners.7,8 Care models involving such providers may free up overworked intensivists and hospitalists, allowing them to focus their efforts on the sickest patients. ICU telemedicine has also emerged as a promising tool that can bring the expertise of intensivists to hospitals where they are needed. Beyond the additional oversight of routine care practices it provides, telemedicine could allow rapid and real time consultation with intensivists for clinicians at the bedside facing difficult management decisions, potentially saving lives.9 The rapid growth of clinically integrated networks, which often include large well-staffed medical centers surrounded by many smaller regional hospitals, might facilitate faster implementation of innovative telemedicine models. Regionalization of care is a third strategy that may improve the quality of care for the critically ill without increasing intensivist supply. Regionalization seeks to selectively transfer the most ill patients to high-volume centers with the greatest expertise in critical care, a practice associated with reduced mortality.10 Of course, for regionalization to be successful, front-line providers like hospitalists need to be able to orchestrate the transfer to the referral center, a process that, as noted by Sweigart and others, is neither easy nor universally successful.11
A final strategy would be to reduce the demand for intensivists through limiting the number of individuals in an ICU. While policies that explicitly ration ICU beds for individuals who have the greatest ability to benefit are ethically problematic, reductions in ICU beds would force providers to implicitly allocate beds more efficiently. There are a multitude of studies showing that our nation’s ICUs are often filled with patients who derive little benefit from intensive care.12,13 Further research on ethically sound strategies to avoid ICU admission for patients unlikely to benefit is desperately needed. With fewer patients in an ICU, the busy intensivist could focus on the sickest patients and spend more time communicating with hospitalists about patients they are managing together.
Regardless of the care models that develop, hospitalists will increasingly be called upon to staff ICUs. Hospitalists are necessary, but as the study by Sweigart et al.5 suggests, just throwing them into our current ICU models with little support from their critical care colleagues is not sufficient. In the absence of a major influx of new intensivists, hospital medicine and critical care professional societies need to actively collaborate to develop creative training and educational models that provide hospitalists with the necessary skills to care for the critically ill and to lead the multidisciplinary care teams they will work within. More importantly, these professional societies must advocate together for more substantial reform to our current ICU care models. Novel solutions that prioritize the efficient use of existing ICU beds for those individuals with the greatest ability to benefit, but also capitalize on emerging technologies and regional centers of excellence, have great potential to address the mismatch between supply and demand. Given the increasing demand and substantial cost for ICU care, we can’t afford to continue with business as usual.
Disclosure
The authors declared no conflicts of interest.
1. Pastores SM, Dakwar J, Halpern NA. Costs of critical care medicine. Crit Care Clin. 2012;28(1):1-10, v. PubMed
2. Nguyen YL, Kahn JM, Angus DC. Reorganizing adult critical care delivery: the role of regionalization, telemedicine, and community outreach. Am J Respir Crit Care Med. 2010;181(11):1164-1169. PubMed
3. Halpern NA, Goldman DA, Tan KS, Pastores SM. Trends in Critical Care Beds and Use Among Population Groups and Medicare and Medicaid Beneficiaries in the United States: 2000-2010. Crit Care Med. 2016;44(8):1490-1499. PubMed
4. Hyzy RC, Flanders SA, Pronovost PJ, et al. Characteristics of intensive care units in Michigan: Not an open and closed case. J Hosp Med. 2010;5(1):4-9. PubMed
5. Sweigart JR, Aymond D, Burger A, et al. Characterizing Hospitalist Practice and Perceptions of Critical Care Delivery. J Hosp Med. In press. PubMed
6. Kahn JM, Rubenfeld GD. The myth of the workforce crisis. Why the United States does not need more intensivist physicians. Am J Respir Crit Care Med. 2015;191(2):128-134. PubMed
7. Gershengorn HB, Johnson MP, Factor P. The use of nonphysician providers in adult intensive care units. Am J Respir Crit Care Med. 2012;185(6):600-605. PubMed
8. Gershengorn HB, Wunsch H, Wahab R, et al. Impact of nonphysician staffing on outcomes in a medical ICU. Chest. 2011;139(6):1347-1353. PubMed
9. Kahn JM, Le TQ, Barnato AE, et al. ICU Telemedicine and Critical Care Mortality: A National Effectiveness Study. Med Care. 2016;54(3):319-325. PubMed
10. Kahn JM, Linde-Zwirble WT, Wunsch H, et al. Potential value of regionalized intensive care for mechanically ventilated medical patients. Am J Respir Crit Care Med. 2008;177(3):285-291. PubMed
11. Bosk EA, Veinot T, Iwashyna TJ. Which patients and where: a qualitative study of patient transfers from community hospitals. Med Care. 2011;49(6):592-598. PubMed
12. Admon AJ, Wunsch H, Iwashyna TJ, Cooke CR. Hospital Contributions to Variability in the Use of ICUs Among Elderly Medicare Recipients. Crit Care Med. 2017;45(1):75-84. PubMed
13. Seymour CW, Iwashyna TJ, Ehlenbach WJ, Wunsch H, Cooke CR. Hospital-level variation in the use of intensive care. Health Serv Res. 2012;47(5):2060-2080. PubMed
In the United States, up to 6 million patients are admitted to intensive care units (ICUs) annually at a cost estimated to exceed $80 billion or about 13% of total hospital costs.1,2 It also appears that as our population ages and illness severity increases, demand for ICU care is increasing.3 Given its importance, the organization and delivery of critical care has been extensively studied. High-intensity physician staffing by an intensivist (all patients managed or comanaged by an intensivist), while inconsistently shown to be associated with improved outcomes, has been endorsed as a high-quality care model by professional societies and the Leapfrog group. Despite its adoption by many hospitals, widespread implementation has been hampered by a national shortage of intensivists that continues to worsen over time. Hospitals, by necessity, look to alternative models to care for critically ill patients, and one such model is the use of hospitalists.
The Society of Hospital Medicine estimates that there are nearly 50,000 hospitalists practicing in the United States, and several studies show they routinely provide care in the nation’s ICUs.4 While in some ICUs hospitalists work alongside intensivists, in many, they work without intensivist support, and regardless of the model, they often serve as the primary attending physician. There is good reason to think this model of care would be effective. Most hospitalists are internists, graduating from training programs that tend to emphasize care of acutely ill hospitalized patients. Hospitalists are often present in the hospital 24/7, are comfortable working in multidisciplinary teams, and routinely engage in quality improvement, which are all characteristics common in highly functioning ICUs. Yet, a study in this issue of the Journal of Hospital Medicine raises some concern.
Sweigart and colleagues5 surveyed 425 hospitalists to understand the structure and perception of their ICU practices. Consistent with prior studies, 77% provided ICU care with 66% serving as the primary attending. A novel finding is the high level of angst and lack of support hospitalists perceived in caring for these critically ill patients. Among rural hospitalists, 43% reported they were expected to practice beyond their perceived scope of practice, and almost a third reported they never had sufficient intensivist support. Even more concerning is that among hospitalists serving as the primary attending, over two-thirds reported difficulty transferring patients to a higher level of care (Sweigart et al.5). While we have concerns over how representative this sample is of hospitalist practice (the survey response rate was only about 10%), it does appear that many hospitalists feel very uncomfortable with the ICU care they are providing and perceive barriers to moving their patients to a potentially safer care setting.
While one might argue more intensivists would solve this problem, calls for more intensivists are shortsighted, as there are compelling reasons to believe that such efforts will do little to address the mismatch between patient need and provider supply. Graduate medical education slots for intensivists cannot be easily and affordably increased, and even if more intensivists could be trained, there are few incentives to encourage them to work where they are needed most. Prioritization of intensivist training also diverts resources from training demands in equally important undersupplied specialties such as primary care.6 Finally, simply increasing intensivist supply fails to attend to important issues surrounding the multidisciplinary nature of care in an ICU, which relies heavily on multiple providers communicating and collaborating to provide optimal care. As noted in the study by Sweigart and colleagues,5 even in settings where intensivists were available 24 hours per day or made all major decisions, nearly one-third of hospitalists felt they practiced beyond their scope of expertise, suggesting that more intensivists may do little to improve hospitalists’ comfort in caring for patients in the ICU.
In lieu of increasing intensivist numbers, policymakers should consider several strategies that have the potential to improve the quality of care delivered to patients in the ICU without increasing intensivists. Recent data suggest that some ICU patients can be safely managed by physician assistants and nurse practitioners.7,8 Care models involving such providers may free up overworked intensivists and hospitalists, allowing them to focus their efforts on the sickest patients. ICU telemedicine has also emerged as a promising tool that can bring the expertise of intensivists to hospitals where they are needed. Beyond the additional oversight of routine care practices it provides, telemedicine could allow rapid and real time consultation with intensivists for clinicians at the bedside facing difficult management decisions, potentially saving lives.9 The rapid growth of clinically integrated networks, which often include large well-staffed medical centers surrounded by many smaller regional hospitals, might facilitate faster implementation of innovative telemedicine models. Regionalization of care is a third strategy that may improve the quality of care for the critically ill without increasing intensivist supply. Regionalization seeks to selectively transfer the most ill patients to high-volume centers with the greatest expertise in critical care, a practice associated with reduced mortality.10 Of course, for regionalization to be successful, front-line providers like hospitalists need to be able to orchestrate the transfer to the referral center, a process that, as noted by Sweigart and others, is neither easy nor universally successful.11
A final strategy would be to reduce the demand for intensivists through limiting the number of individuals in an ICU. While policies that explicitly ration ICU beds for individuals who have the greatest ability to benefit are ethically problematic, reductions in ICU beds would force providers to implicitly allocate beds more efficiently. There are a multitude of studies showing that our nation’s ICUs are often filled with patients who derive little benefit from intensive care.12,13 Further research on ethically sound strategies to avoid ICU admission for patients unlikely to benefit is desperately needed. With fewer patients in an ICU, the busy intensivist could focus on the sickest patients and spend more time communicating with hospitalists about patients they are managing together.
Regardless of the care models that develop, hospitalists will increasingly be called upon to staff ICUs. Hospitalists are necessary, but as the study by Sweigart et al.5 suggests, just throwing them into our current ICU models with little support from their critical care colleagues is not sufficient. In the absence of a major influx of new intensivists, hospital medicine and critical care professional societies need to actively collaborate to develop creative training and educational models that provide hospitalists with the necessary skills to care for the critically ill and to lead the multidisciplinary care teams they will work within. More importantly, these professional societies must advocate together for more substantial reform to our current ICU care models. Novel solutions that prioritize the efficient use of existing ICU beds for those individuals with the greatest ability to benefit, but also capitalize on emerging technologies and regional centers of excellence, have great potential to address the mismatch between supply and demand. Given the increasing demand and substantial cost for ICU care, we can’t afford to continue with business as usual.
Disclosure
The authors declared no conflicts of interest.
1. Pastores SM, Dakwar J, Halpern NA. Costs of critical care medicine. Crit Care Clin. 2012;28(1):1-10, v. PubMed
2. Nguyen YL, Kahn JM, Angus DC. Reorganizing adult critical care delivery: the role of regionalization, telemedicine, and community outreach. Am J Respir Crit Care Med. 2010;181(11):1164-1169. PubMed
3. Halpern NA, Goldman DA, Tan KS, Pastores SM. Trends in Critical Care Beds and Use Among Population Groups and Medicare and Medicaid Beneficiaries in the United States: 2000-2010. Crit Care Med. 2016;44(8):1490-1499. PubMed
4. Hyzy RC, Flanders SA, Pronovost PJ, et al. Characteristics of intensive care units in Michigan: Not an open and closed case. J Hosp Med. 2010;5(1):4-9. PubMed
5. Sweigart JR, Aymond D, Burger A, et al. Characterizing Hospitalist Practice and Perceptions of Critical Care Delivery. J Hosp Med. In press. PubMed
6. Kahn JM, Rubenfeld GD. The myth of the workforce crisis. Why the United States does not need more intensivist physicians. Am J Respir Crit Care Med. 2015;191(2):128-134. PubMed
7. Gershengorn HB, Johnson MP, Factor P. The use of nonphysician providers in adult intensive care units. Am J Respir Crit Care Med. 2012;185(6):600-605. PubMed
8. Gershengorn HB, Wunsch H, Wahab R, et al. Impact of nonphysician staffing on outcomes in a medical ICU. Chest. 2011;139(6):1347-1353. PubMed
9. Kahn JM, Le TQ, Barnato AE, et al. ICU Telemedicine and Critical Care Mortality: A National Effectiveness Study. Med Care. 2016;54(3):319-325. PubMed
10. Kahn JM, Linde-Zwirble WT, Wunsch H, et al. Potential value of regionalized intensive care for mechanically ventilated medical patients. Am J Respir Crit Care Med. 2008;177(3):285-291. PubMed
11. Bosk EA, Veinot T, Iwashyna TJ. Which patients and where: a qualitative study of patient transfers from community hospitals. Med Care. 2011;49(6):592-598. PubMed
12. Admon AJ, Wunsch H, Iwashyna TJ, Cooke CR. Hospital Contributions to Variability in the Use of ICUs Among Elderly Medicare Recipients. Crit Care Med. 2017;45(1):75-84. PubMed
13. Seymour CW, Iwashyna TJ, Ehlenbach WJ, Wunsch H, Cooke CR. Hospital-level variation in the use of intensive care. Health Serv Res. 2012;47(5):2060-2080. PubMed
© 2018 Society of Hospital Medicine
Characterizing Hospitalist Practice and Perceptions of Critical Care Delivery
Despite calls for board-certified intensivist physicians to lead critical care delivery,1-3 the intensivist shortage in the United States continues to worsen,4 with projected shortfalls of 22% by 2020 and 35% by 2030.5 Many hospitals currently have inadequate or no board-certified intensivist support.6 The intensivist shortage has necessitated the development of alternative intensive care unit (ICU) staffing models, including engagement in telemedicine,7 the utilization of advanced practice providers,8 and dependence on hospitalists9 to deliver critical care services to ICU patients. Presently, research does not clearly show consistent differences in clinical outcomes based on the training of the clinical provider, although optimized teamwork and team rounds in the ICU do seem to be associated with improved outcomes.10-12
In its 2016 annual survey of hospital medicine (HM) leaders, the Society of Hospital Medicine (SHM) documented that most HM groups care for ICU patients, with up to 80% of hospitalist groups in some regions delivering critical care.13 In many United States hospitals, hospitalists serve as the primary if not lone physician providers of critical care.6,14 HM, with its team-based approach and on-site presence, shares many of the key attributes and values that define high-functioning critical care teams, and many hospitalists likely capably deliver some critical care services.9 However, hospitalists are also a highly heterogeneous work force with varied exposure to and comfort with critical care medicine, making it difficult to generalize hospitalists’ scope of practice in the ICU.
Because hospitalists render a significant amount of critical care in the United States, we surveyed practicing hospitalists to understand their demographics and practice roles in the ICU setting and to ascertain how they are supported when doing so. Additionally, we sought to identify mismatches between the ICU services that hospitalists provide and what they feel prepared and supported to deliver. Finally, we attempted to elucidate how hospitalists who practice in the ICU might respond to novel educational offerings targeted to mitigate cognitive or procedural gaps.
METHODS
We developed and deployed a survey to address the aforementioned questions. The survey content was developed iteratively by the Critical Care Task Force of SHM’s Education Committee and subsequently approved by SHM’s Education Committee and Board of Directors. Members of the Critical Care Task Force include critical care physicians and hospitalists. The survey included 25 items (supplemental Appendix A). Seventeen questions addressed the demographics and practice roles of hospitalists in the ICU, 5 addressed cognitive and procedural practice gaps, and 3 addressed how hospitalists would respond to educational opportunities in critical care. We used conditional formatting to ensure that only respondents who deliver ICU care could answer questions related to ICU practice. The survey was delivered by using an online survey platform (Survey Monkey, San Mateo, CA).
The survey was deployed in 3 phases from March to October of 2016. Initially, we distributed a pilot survey to professional contacts of the Critical Care Task Force to solicit feedback and refine the survey’s format and content. These contacts were largely academic hospitalists from our local institutions. We then distributed the survey to hospitalists via professional networks with instructions to forward the link to interested hospitalists. Finally, we distributed the survey to approximately 4000 hospitalists randomly selected from SHM’s national listserv of approximately 12,000 hospitalists. Respondents could enter a drawing for a monetary prize upon completion of the survey.
None of the survey questions changed during the 3 phases of survey deployment, and the data reported herein were compiled from all 3 phases of the survey deployment. Frequency tables were created using Tableau (version 10.0; Tableau Software, Seattle, WA). Comparisons between categorical questions were made by using χ2 and Fischer exact tests to calculate P values for associations by using SAS (version 9.3; SAS Institute, Cary, NC). Associations with P values below .05 were considered statistically significant.
RESULTS
Objective 1: Demographics and Practice Role
Four hundred and twenty-five hospitalists responded to the survey. The first 2 phases (pilot survey and distribution via professional networks) generated 101 responses, and the third phase (via SHM’s listserv) generated an additional 324 responses. As the survey was anonymous, we could not determine which hospitals or geographic regions were represented. Three hundred and twenty-five of the 425 hospitalists who completed the survey (77%) reported that they delivered care in the ICU. Of these 325 hospitalists, 45 served only as consultants, while the remaining 280 (66% of the total sample) served as the primary attending physician in the ICU. Among these primary providers of care in the ICU, 60 (21%) practiced in rural settings and 220 (79%) practiced in nonrural settings (Figure 1).
The demographics of our respondents were similar to those of the SHM annual survey,13 in which 66% of respondents delivered ICU care. Forty-one percent of our respondents worked in critical access or small community hospitals, 24% in academic medical centers, and 34% in large community centers with an academic affiliation. The SHM annual survey cohort included more physicians from nonteaching hospitals (58.7%) and fewer from academic medical centers (14.8%).13
Hospitalists’ presence in the ICU varied by practice setting (Table 1). 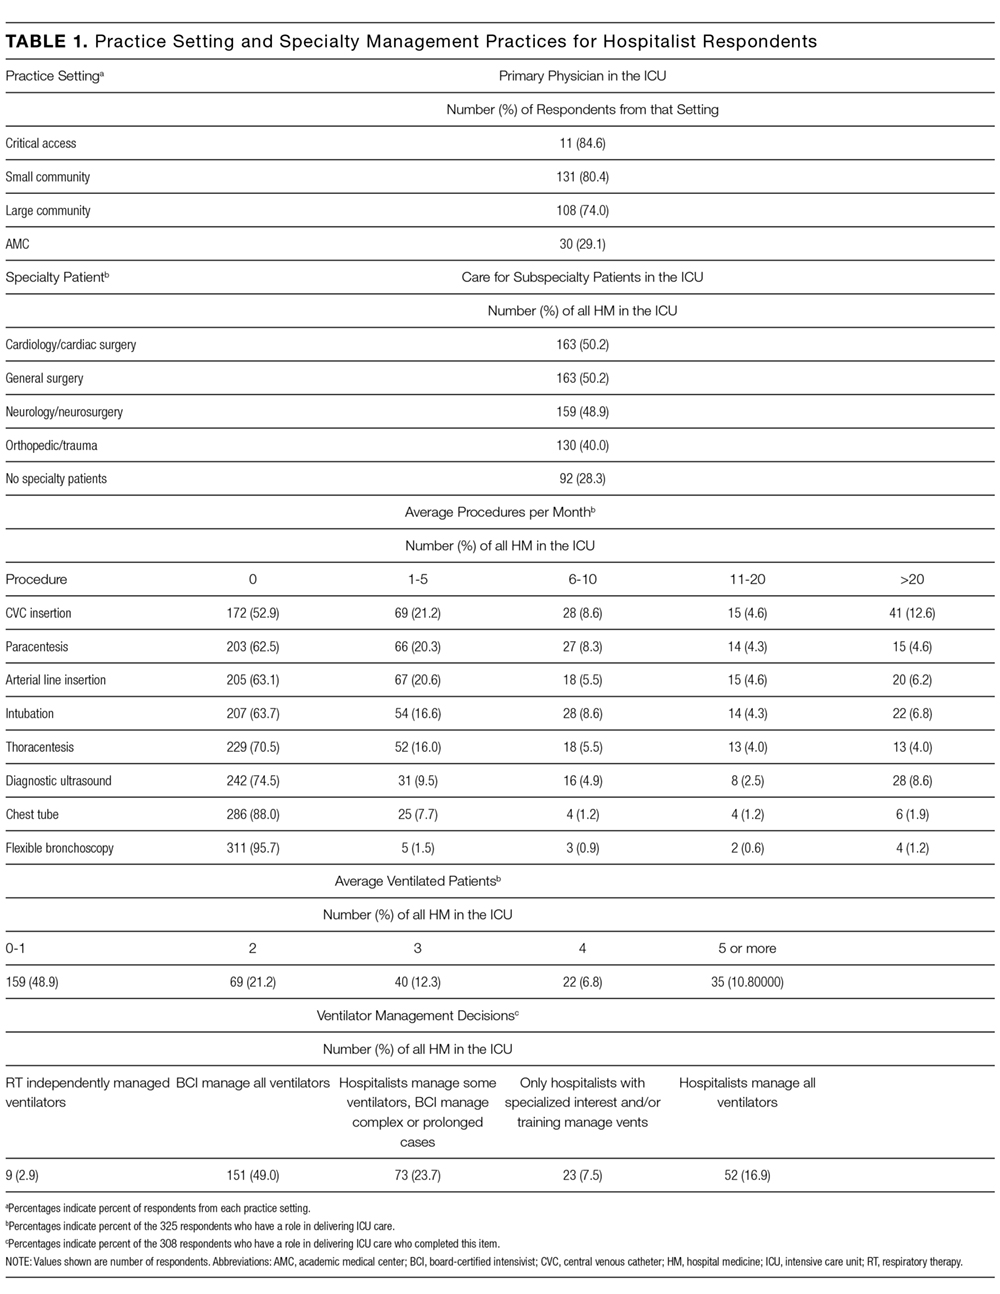
Hospitalists were significantly more prevalent in rural ICUs than in nonrural settings (96% vs 73%; Table 2). 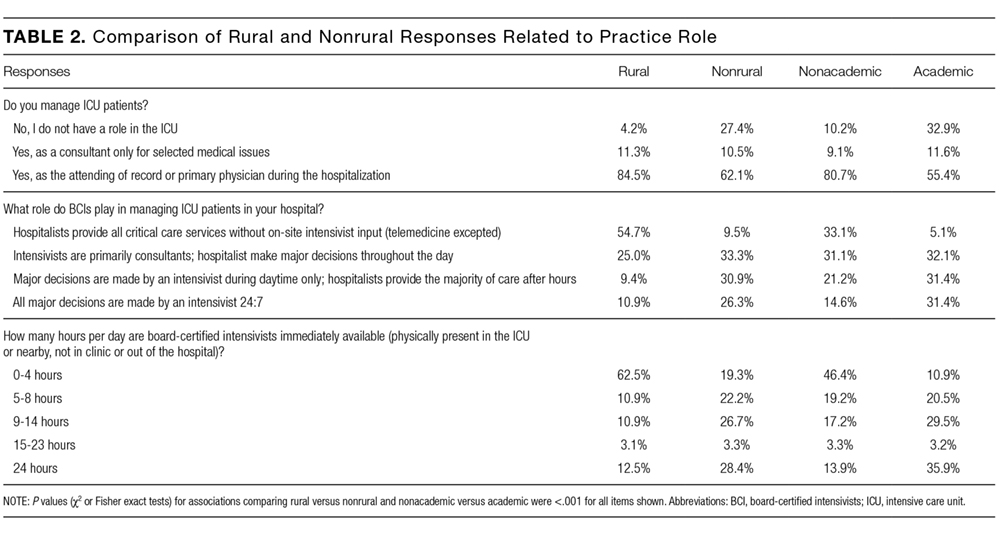
We found similar results when comparing academic hospitalists (those working in an academic medical center or academic-affiliated hospital) with nonacademic hospitalists (those working in critical access or small community centers). Specifically, hospitalists in nonacademic settings were significantly more prevalent in ICUs (90% vs 67%; Table 2), more likely to serve as the primary attending (81% vs 55%), and more likely to deliver all critical care services (64% vs 25%). Sixty-four percent of respondents from nonacademic settings reported that hospitalists manage all or most ICU patients in their hospital as opposed to 25% for academic respondents (χ2P value for association <.001). Intensivist availability was also significantly lower in nonacademic ICUs (Table 2).
We also sought to determine whether the ability to transfer critically ill patients to higher levels of care effectively mitigated shortfalls in intensivist staffing. When restricted to hospitalists who served as primary providers for ICU patients, 28% of all respondents and 51% of rural hospitalists reported transferring patients to a higher level of care.
Sixty-seven percent of hospitalists who served as primary physicians for ICU patients in any setting reported at least moderate difficulty arranging transfers to higher levels of care.
Objective 2: Identifying the Practice Gap
Hospitalists’ perceptions of practicing critical care beyond their skill level and without sufficient board-certified intensivist support varied by both practice location and practice type (Table 3). 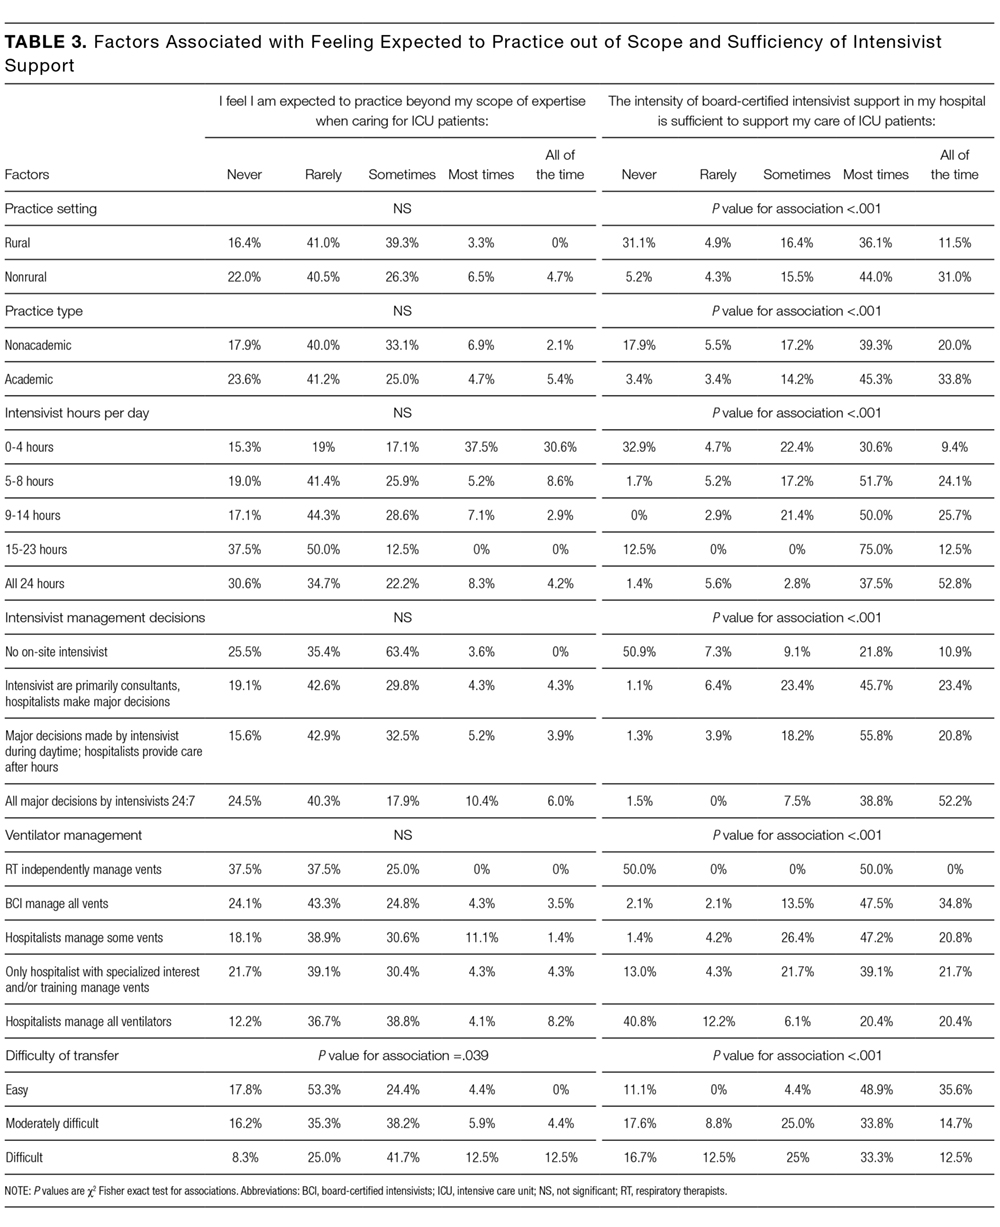
There were similar discrepancies between academic and nonacademic respondents. Forty-two percent of respondents practicing in nonacademic settings reported being expected to practice beyond their scope at least some of the time, and 18% reported that intensivist support was never sufficient. This contrasts with academic hospitalists, of whom 35% reported feeling expected to practice outside their scope, and less than 4% reported the available support from intensivists was never sufficient. For comparisons of academic and nonacademic respondents, only perceptions of sufficient board-certified intensivist support reached statistical significance (Table 3).
The role of intensivists in making management decisions and the strategy for ventilator management decisions correlated significantly with perception of intensivist support (P < .001) but not with the perception of practicing beyond one’s scope. The number of ventilated patients did not correlate significantly with either perception of intensivist support or of being expected to practice beyond scope.
Difficulty transferring patients to a higher level of care was the only attribute that significantly correlated with hospitalists’ perceptions of having to practice beyond their skill level (P < .05; Table 3). Difficulty of transfer was also significantly associated with perceived adequacy of board-certified intensivist support (P < .001). Total hours of intensivist coverage, intensivist role in decision making, and ventilator management arrangements also correlated significantly with the perceived adequacy of board-certified intensivist support (P < .001 for all; Table 3).
Objective 3: Assessing Interest in Critical Care Education
More than 85% of respondents indicated interest in obtaining additional critical care training and some form of certification short of fellowship training. Preferred modes of content delivery included courses or precourses at national meetings, academies, or online modules. Hospitalists in smaller communities indicated preference for online resources.
DISCUSSION
This survey of a large national cohort of hospitalists from diverse practice settings validates previous studies suggesting that hospitalists deliver critical care services, most notably in community and rural hospitals.13 A substantial subset of our respondents represented rural practice settings, which allowed us to compare rural and nonrural hospitalists as well as those practicing in academic and nonacademic settings. In assessing both the objective services that hospitalists provided as well as their subjective perceptions of how they practiced, we could correlate factors associated with the sense of practicing beyond one’s skill or feeling inadequately supported by board-certified intensivists.
More than a third of responding hospitalists who practiced in the ICU reported that they practiced beyond their self-perceived skill level, and almost three-fourths indicated that they practiced without consistent or adequate board-certified intensivist support. Rural and nonacademic hospitalists were far more likely to report delivering critical care beyond their comfort level and having insufficient board-certified intensivist support.
Calls for board-certified intensivists to deliver critical care to all critically ill patients do not reflect the reality in many American hospitals and, either by intent or by default, hospitalists have become the major and often sole providers of critical care services in many hospitals without robust intensivist support. We suspect that this phenomenon has been consistently underreported in the literature because academic hospitalists generally do not practice critical care.15
Many potential solutions to the intensivist shortage have been explored. Prior efforts in the United States have focused largely on care standardization and the recruitment of more trainees into existing critical care training pathways.16 Other countries have created multidisciplinary critical care training pathways that delink critical care from specific subspecialty training programs.17 Another potential solution to ensure that critically ill patients receive care from board-certified intensivists is to regionalize critical care such that the sickest patients are consistently transferred to referral centers with robust intensivist staffing.1,18 While such an approach has been effectively implemented for trauma patients7, it has yet to materialize on a systemic basis for other critically ill cohorts. Moreover, our data suggest that hospitalists who attempt to transfer patients to higher levels of critical care find doing so burdensome and difficult.
Our surveyed hospitalists overwhelmingly expressed interest in augmenting their critical care skills and knowledge. However, most existing critical care educational offerings are not optimized for hospitalists, either focusing on very specific skills or knowledge (eg, procedural techniques or point-of-care ultrasound) or providing entry-level or very foundational education. None of these offerings provide comprehensive, structured training schemas for hospitalists who need to evolve beyond basic critical care skills to manage critically ill patients competently and consistently for extended periods of time.
Our study has several limitations. First, we estimate that about 10% of invited participants responded to this survey, but as respondents could forward the survey via professional networks, this is only an estimate. It is possible but unlikely that some respondents could have completed the survey more than once. Second, because our analysis identified only associations, we cannot infer causality for any of our findings. Third, the questionnaire was not designed to capture the acuity threshold at which point each respondent would prefer to transfer their patients into an ICU setting or to another institution for assistance in critical care management. We recognize that definitions and perceptions of patient acuity vary markedly from one hospital to the next, and a patient who can be comfortably managed in a floor setting in one hospital may require ICU care in a smaller or less well-resourced hospital. Practice patterns relating to acuity thresholds could have a substantial impact both on critical care patient volumes and on provider perceptions and, as such, warrant further study.
Finally, as respondents participated voluntarily, our sample may have overrepresented hospitalists who practice or are interested in critical care, thereby overestimating the scope of the problem and hospitalists’ interest in nonfellowship critical care training and certification. However, this seems unlikely given that, relative to SHM’s annual survey, we overrepresented hospitalists from academic and large community medical centers who generally provide less critical care than other hospitalists.13 Provided that roughly 85% of the estimated 50,000 American hospitalists practice outside of academic medical centers,13 perhaps as many as 37,000 hospitalists regularly deliver care to critically ill patients in ICUs. In light of the evolving intensivist shortage,4,5 this number seems likely to continue to grow. Whatever biases may exist in our sample, it is evident that a substantial number of ICU patients are managed by hospitalists who feel unprepared and undersupported to perform the task.
Without a massive and sustained increase in the number of board-certified intensivists or a systemic national plan to regionalize critical care delivery, hospitalists will continue to practice critical care, frequently with inadequate knowledge, skills, or intensivist support. Fortunately, these same hospitalists appear to be highly interested in augmenting their skills to care for their critically ill patients. The HM and critical care communities must rise to this challenge and help these providers deliver safe, appropriate, and high-quality care to their critically ill patients.
Disclosure
Mark V. Williams, MD, FACP, MHM, receives funding from the Patient Centered Outcomes Research Institute, Agency for Healthcare Research and Quality, Centers for Medicare & Medicaid Services, and Society of Hospital Medicine honoraria.
Society of Hospital Medicine Resources
1. Barnato AE, Kahn JM, Rubenfeld GD, et al. Prioritizing the organization and management of intensive care services in the United States: the PrOMIS Conference. Crit Care Med. 2007;35(4):1003-1011. PubMed
2. The Leapfrog Group. Factsheet: ICU Physician Staffing. Leapfrog Hospital Survey. Washington, DC: The Leapfrog Group; 2016.
3. Baumann MH, Simpson SQ, Stahl M, Raoof S, Marciniuk DD, Gutterman DD. First, do no harm: less training not equal quality care. Am J Crit Care. Jul 2012;21(4):227-230. PubMed
4. Krell K. Critical care workforce. Crit Care Med. 2008;36(4):1350-1353. PubMed
5. Angus DC, Kelley MA, Schmitz RJ, White A, Popovich J, Jr. Caring for the critically ill patient. Current and projected workforce requirements for care of the critically ill and patients with pulmonary disease: can we meet the requirements of an aging population? JAMA. 2000;284(21):2762-2770. PubMed
6. Hyzy RC, Flanders SA, Pronovost PJ, et al. Characteristics of intensive care units in Michigan: not an open and closed case. J Hosp Med. 2010;5(1):4-9. PubMed
7. Kahn JM, Cicero BD, Wallace DJ, Iwashyna TJ. Adoption of ICU telemedicine in the United States. Crit Care Med. 2014;42(2):362-368. PubMed
8. Kleinpell RM, Ely EW, Grabenkort R. Nurse practitioners and physician assistants in the intensive care unit: an evidence-based review. Crit Care Med. 2008;36(10):2888-2897. PubMed
9. Heisler M. Hospitalists and intensivists: partners in caring for the critically ill--the time has come. J Hosp Med. 2010;5(1):1-3. PubMed
10. Checkley W, Martin GS, Brown SM, et al. Structure, process, and annual ICU mortality across 69 centers: United States Critical Illness and Injury Trials Group Critical Illness Outcomes Study. Crit Care Med. 2014;42(2):344-356. PubMed
11. Wise KR, Akopov VA, Williams BR, Jr., Ido MS, Leeper KV, Jr., Dressler DD. Hospitalists and intensivists in the medical ICU: a prospective observational study comparing mortality and length of stay between two staffing models. J Hosp Med. 2012;7(3):183-189. PubMed
12. Yoo EJ, Edwards JD, Dean ML, Dudley RA. Multidisciplinary Critical Care and Intensivist Staffing: Results of a Statewide Survey and Association With Mortality. J Intensive Care Med. 2016;31(5):325-332. PubMed
13. Society of Hospital Medicine. 2016 State of Hospital Medicine Report. Philadelphia: Society of Hospital Medicine; 2016.
14. Siegal EM, Dressler DD, Dichter JR, Gorman MJ, Lipsett PA. Training a hospitalist workforce to address the intensivist shortage in American hospitals: a position paper from the Society of Hospital Medicine and the Society of Critical Care Medicine. Crit Care Med. 2012;40(6):1952-1956. PubMed
15. Weled BJ, Adzhigirey LA, Hodgman TM, et al. Critical Care Delivery: The Importance of Process of Care and ICU Structure to Improved Outcomes: An Update From the American College of Critical Care Medicine Task Force on Models of Critical Care. Crit Care Med. 2015;43(7):1520-1525. PubMed
16. Kelley MA, Angus D, Chalfin DB, et al. The critical care crisis in the United States: a report from the profession. Chest. 2004;125(4):1514-1517. PubMed
17. Bion JF, Ramsay G, Roussos C, Burchardi H. Intensive care training and specialty status in Europe: international comparisons. Task Force on Educational issues of the European Society of Intensive Care Medicine. Intensive Care Med. 1998;24(4);372-377. PubMed
18. Kahn JM, Branas CC, Schwab CW, Asch DA. Regionalization of medical critical care: what can we learn from the trauma experience? Crit Care Med. 2008;36(11):3085-3088. PubMed
Despite calls for board-certified intensivist physicians to lead critical care delivery,1-3 the intensivist shortage in the United States continues to worsen,4 with projected shortfalls of 22% by 2020 and 35% by 2030.5 Many hospitals currently have inadequate or no board-certified intensivist support.6 The intensivist shortage has necessitated the development of alternative intensive care unit (ICU) staffing models, including engagement in telemedicine,7 the utilization of advanced practice providers,8 and dependence on hospitalists9 to deliver critical care services to ICU patients. Presently, research does not clearly show consistent differences in clinical outcomes based on the training of the clinical provider, although optimized teamwork and team rounds in the ICU do seem to be associated with improved outcomes.10-12
In its 2016 annual survey of hospital medicine (HM) leaders, the Society of Hospital Medicine (SHM) documented that most HM groups care for ICU patients, with up to 80% of hospitalist groups in some regions delivering critical care.13 In many United States hospitals, hospitalists serve as the primary if not lone physician providers of critical care.6,14 HM, with its team-based approach and on-site presence, shares many of the key attributes and values that define high-functioning critical care teams, and many hospitalists likely capably deliver some critical care services.9 However, hospitalists are also a highly heterogeneous work force with varied exposure to and comfort with critical care medicine, making it difficult to generalize hospitalists’ scope of practice in the ICU.
Because hospitalists render a significant amount of critical care in the United States, we surveyed practicing hospitalists to understand their demographics and practice roles in the ICU setting and to ascertain how they are supported when doing so. Additionally, we sought to identify mismatches between the ICU services that hospitalists provide and what they feel prepared and supported to deliver. Finally, we attempted to elucidate how hospitalists who practice in the ICU might respond to novel educational offerings targeted to mitigate cognitive or procedural gaps.
METHODS
We developed and deployed a survey to address the aforementioned questions. The survey content was developed iteratively by the Critical Care Task Force of SHM’s Education Committee and subsequently approved by SHM’s Education Committee and Board of Directors. Members of the Critical Care Task Force include critical care physicians and hospitalists. The survey included 25 items (supplemental Appendix A). Seventeen questions addressed the demographics and practice roles of hospitalists in the ICU, 5 addressed cognitive and procedural practice gaps, and 3 addressed how hospitalists would respond to educational opportunities in critical care. We used conditional formatting to ensure that only respondents who deliver ICU care could answer questions related to ICU practice. The survey was delivered by using an online survey platform (Survey Monkey, San Mateo, CA).
The survey was deployed in 3 phases from March to October of 2016. Initially, we distributed a pilot survey to professional contacts of the Critical Care Task Force to solicit feedback and refine the survey’s format and content. These contacts were largely academic hospitalists from our local institutions. We then distributed the survey to hospitalists via professional networks with instructions to forward the link to interested hospitalists. Finally, we distributed the survey to approximately 4000 hospitalists randomly selected from SHM’s national listserv of approximately 12,000 hospitalists. Respondents could enter a drawing for a monetary prize upon completion of the survey.
None of the survey questions changed during the 3 phases of survey deployment, and the data reported herein were compiled from all 3 phases of the survey deployment. Frequency tables were created using Tableau (version 10.0; Tableau Software, Seattle, WA). Comparisons between categorical questions were made by using χ2 and Fischer exact tests to calculate P values for associations by using SAS (version 9.3; SAS Institute, Cary, NC). Associations with P values below .05 were considered statistically significant.
RESULTS
Objective 1: Demographics and Practice Role
Four hundred and twenty-five hospitalists responded to the survey. The first 2 phases (pilot survey and distribution via professional networks) generated 101 responses, and the third phase (via SHM’s listserv) generated an additional 324 responses. As the survey was anonymous, we could not determine which hospitals or geographic regions were represented. Three hundred and twenty-five of the 425 hospitalists who completed the survey (77%) reported that they delivered care in the ICU. Of these 325 hospitalists, 45 served only as consultants, while the remaining 280 (66% of the total sample) served as the primary attending physician in the ICU. Among these primary providers of care in the ICU, 60 (21%) practiced in rural settings and 220 (79%) practiced in nonrural settings (Figure 1).
The demographics of our respondents were similar to those of the SHM annual survey,13 in which 66% of respondents delivered ICU care. Forty-one percent of our respondents worked in critical access or small community hospitals, 24% in academic medical centers, and 34% in large community centers with an academic affiliation. The SHM annual survey cohort included more physicians from nonteaching hospitals (58.7%) and fewer from academic medical centers (14.8%).13
Hospitalists’ presence in the ICU varied by practice setting (Table 1).
Hospitalists were significantly more prevalent in rural ICUs than in nonrural settings (96% vs 73%; Table 2).
We found similar results when comparing academic hospitalists (those working in an academic medical center or academic-affiliated hospital) with nonacademic hospitalists (those working in critical access or small community centers). Specifically, hospitalists in nonacademic settings were significantly more prevalent in ICUs (90% vs 67%; Table 2), more likely to serve as the primary attending (81% vs 55%), and more likely to deliver all critical care services (64% vs 25%). Sixty-four percent of respondents from nonacademic settings reported that hospitalists manage all or most ICU patients in their hospital as opposed to 25% for academic respondents (χ2P value for association <.001). Intensivist availability was also significantly lower in nonacademic ICUs (Table 2).
We also sought to determine whether the ability to transfer critically ill patients to higher levels of care effectively mitigated shortfalls in intensivist staffing. When restricted to hospitalists who served as primary providers for ICU patients, 28% of all respondents and 51% of rural hospitalists reported transferring patients to a higher level of care.
Sixty-seven percent of hospitalists who served as primary physicians for ICU patients in any setting reported at least moderate difficulty arranging transfers to higher levels of care.
Objective 2: Identifying the Practice Gap
Hospitalists’ perceptions of practicing critical care beyond their skill level and without sufficient board-certified intensivist support varied by both practice location and practice type (Table 3).
There were similar discrepancies between academic and nonacademic respondents. Forty-two percent of respondents practicing in nonacademic settings reported being expected to practice beyond their scope at least some of the time, and 18% reported that intensivist support was never sufficient. This contrasts with academic hospitalists, of whom 35% reported feeling expected to practice outside their scope, and less than 4% reported the available support from intensivists was never sufficient. For comparisons of academic and nonacademic respondents, only perceptions of sufficient board-certified intensivist support reached statistical significance (Table 3).
The role of intensivists in making management decisions and the strategy for ventilator management decisions correlated significantly with perception of intensivist support (P < .001) but not with the perception of practicing beyond one’s scope. The number of ventilated patients did not correlate significantly with either perception of intensivist support or of being expected to practice beyond scope.
Difficulty transferring patients to a higher level of care was the only attribute that significantly correlated with hospitalists’ perceptions of having to practice beyond their skill level (P < .05; Table 3). Difficulty of transfer was also significantly associated with perceived adequacy of board-certified intensivist support (P < .001). Total hours of intensivist coverage, intensivist role in decision making, and ventilator management arrangements also correlated significantly with the perceived adequacy of board-certified intensivist support (P < .001 for all; Table 3).
Objective 3: Assessing Interest in Critical Care Education
More than 85% of respondents indicated interest in obtaining additional critical care training and some form of certification short of fellowship training. Preferred modes of content delivery included courses or precourses at national meetings, academies, or online modules. Hospitalists in smaller communities indicated preference for online resources.
DISCUSSION
This survey of a large national cohort of hospitalists from diverse practice settings validates previous studies suggesting that hospitalists deliver critical care services, most notably in community and rural hospitals.13 A substantial subset of our respondents represented rural practice settings, which allowed us to compare rural and nonrural hospitalists as well as those practicing in academic and nonacademic settings. In assessing both the objective services that hospitalists provided as well as their subjective perceptions of how they practiced, we could correlate factors associated with the sense of practicing beyond one’s skill or feeling inadequately supported by board-certified intensivists.
More than a third of responding hospitalists who practiced in the ICU reported that they practiced beyond their self-perceived skill level, and almost three-fourths indicated that they practiced without consistent or adequate board-certified intensivist support. Rural and nonacademic hospitalists were far more likely to report delivering critical care beyond their comfort level and having insufficient board-certified intensivist support.
Calls for board-certified intensivists to deliver critical care to all critically ill patients do not reflect the reality in many American hospitals and, either by intent or by default, hospitalists have become the major and often sole providers of critical care services in many hospitals without robust intensivist support. We suspect that this phenomenon has been consistently underreported in the literature because academic hospitalists generally do not practice critical care.15
Many potential solutions to the intensivist shortage have been explored. Prior efforts in the United States have focused largely on care standardization and the recruitment of more trainees into existing critical care training pathways.16 Other countries have created multidisciplinary critical care training pathways that delink critical care from specific subspecialty training programs.17 Another potential solution to ensure that critically ill patients receive care from board-certified intensivists is to regionalize critical care such that the sickest patients are consistently transferred to referral centers with robust intensivist staffing.1,18 While such an approach has been effectively implemented for trauma patients7, it has yet to materialize on a systemic basis for other critically ill cohorts. Moreover, our data suggest that hospitalists who attempt to transfer patients to higher levels of critical care find doing so burdensome and difficult.
Our surveyed hospitalists overwhelmingly expressed interest in augmenting their critical care skills and knowledge. However, most existing critical care educational offerings are not optimized for hospitalists, either focusing on very specific skills or knowledge (eg, procedural techniques or point-of-care ultrasound) or providing entry-level or very foundational education. None of these offerings provide comprehensive, structured training schemas for hospitalists who need to evolve beyond basic critical care skills to manage critically ill patients competently and consistently for extended periods of time.
Our study has several limitations. First, we estimate that about 10% of invited participants responded to this survey, but as respondents could forward the survey via professional networks, this is only an estimate. It is possible but unlikely that some respondents could have completed the survey more than once. Second, because our analysis identified only associations, we cannot infer causality for any of our findings. Third, the questionnaire was not designed to capture the acuity threshold at which point each respondent would prefer to transfer their patients into an ICU setting or to another institution for assistance in critical care management. We recognize that definitions and perceptions of patient acuity vary markedly from one hospital to the next, and a patient who can be comfortably managed in a floor setting in one hospital may require ICU care in a smaller or less well-resourced hospital. Practice patterns relating to acuity thresholds could have a substantial impact both on critical care patient volumes and on provider perceptions and, as such, warrant further study.
Finally, as respondents participated voluntarily, our sample may have overrepresented hospitalists who practice or are interested in critical care, thereby overestimating the scope of the problem and hospitalists’ interest in nonfellowship critical care training and certification. However, this seems unlikely given that, relative to SHM’s annual survey, we overrepresented hospitalists from academic and large community medical centers who generally provide less critical care than other hospitalists.13 Provided that roughly 85% of the estimated 50,000 American hospitalists practice outside of academic medical centers,13 perhaps as many as 37,000 hospitalists regularly deliver care to critically ill patients in ICUs. In light of the evolving intensivist shortage,4,5 this number seems likely to continue to grow. Whatever biases may exist in our sample, it is evident that a substantial number of ICU patients are managed by hospitalists who feel unprepared and undersupported to perform the task.
Without a massive and sustained increase in the number of board-certified intensivists or a systemic national plan to regionalize critical care delivery, hospitalists will continue to practice critical care, frequently with inadequate knowledge, skills, or intensivist support. Fortunately, these same hospitalists appear to be highly interested in augmenting their skills to care for their critically ill patients. The HM and critical care communities must rise to this challenge and help these providers deliver safe, appropriate, and high-quality care to their critically ill patients.
Disclosure
Mark V. Williams, MD, FACP, MHM, receives funding from the Patient Centered Outcomes Research Institute, Agency for Healthcare Research and Quality, Centers for Medicare & Medicaid Services, and Society of Hospital Medicine honoraria.
Society of Hospital Medicine Resources
1. Barnato AE, Kahn JM, Rubenfeld GD, et al. Prioritizing the organization and management of intensive care services in the United States: the PrOMIS Conference. Crit Care Med. 2007;35(4):1003-1011. PubMed
2. The Leapfrog Group. Factsheet: ICU Physician Staffing. Leapfrog Hospital Survey. Washington, DC: The Leapfrog Group; 2016.
3. Baumann MH, Simpson SQ, Stahl M, Raoof S, Marciniuk DD, Gutterman DD. First, do no harm: less training not equal quality care. Am J Crit Care. Jul 2012;21(4):227-230. PubMed
4. Krell K. Critical care workforce. Crit Care Med. 2008;36(4):1350-1353. PubMed
5. Angus DC, Kelley MA, Schmitz RJ, White A, Popovich J, Jr. Caring for the critically ill patient. Current and projected workforce requirements for care of the critically ill and patients with pulmonary disease: can we meet the requirements of an aging population? JAMA. 2000;284(21):2762-2770. PubMed
6. Hyzy RC, Flanders SA, Pronovost PJ, et al. Characteristics of intensive care units in Michigan: not an open and closed case. J Hosp Med. 2010;5(1):4-9. PubMed
7. Kahn JM, Cicero BD, Wallace DJ, Iwashyna TJ. Adoption of ICU telemedicine in the United States. Crit Care Med. 2014;42(2):362-368. PubMed
8. Kleinpell RM, Ely EW, Grabenkort R. Nurse practitioners and physician assistants in the intensive care unit: an evidence-based review. Crit Care Med. 2008;36(10):2888-2897. PubMed
9. Heisler M. Hospitalists and intensivists: partners in caring for the critically ill--the time has come. J Hosp Med. 2010;5(1):1-3. PubMed
10. Checkley W, Martin GS, Brown SM, et al. Structure, process, and annual ICU mortality across 69 centers: United States Critical Illness and Injury Trials Group Critical Illness Outcomes Study. Crit Care Med. 2014;42(2):344-356. PubMed
11. Wise KR, Akopov VA, Williams BR, Jr., Ido MS, Leeper KV, Jr., Dressler DD. Hospitalists and intensivists in the medical ICU: a prospective observational study comparing mortality and length of stay between two staffing models. J Hosp Med. 2012;7(3):183-189. PubMed
12. Yoo EJ, Edwards JD, Dean ML, Dudley RA. Multidisciplinary Critical Care and Intensivist Staffing: Results of a Statewide Survey and Association With Mortality. J Intensive Care Med. 2016;31(5):325-332. PubMed
13. Society of Hospital Medicine. 2016 State of Hospital Medicine Report. Philadelphia: Society of Hospital Medicine; 2016.
14. Siegal EM, Dressler DD, Dichter JR, Gorman MJ, Lipsett PA. Training a hospitalist workforce to address the intensivist shortage in American hospitals: a position paper from the Society of Hospital Medicine and the Society of Critical Care Medicine. Crit Care Med. 2012;40(6):1952-1956. PubMed
15. Weled BJ, Adzhigirey LA, Hodgman TM, et al. Critical Care Delivery: The Importance of Process of Care and ICU Structure to Improved Outcomes: An Update From the American College of Critical Care Medicine Task Force on Models of Critical Care. Crit Care Med. 2015;43(7):1520-1525. PubMed
16. Kelley MA, Angus D, Chalfin DB, et al. The critical care crisis in the United States: a report from the profession. Chest. 2004;125(4):1514-1517. PubMed
17. Bion JF, Ramsay G, Roussos C, Burchardi H. Intensive care training and specialty status in Europe: international comparisons. Task Force on Educational issues of the European Society of Intensive Care Medicine. Intensive Care Med. 1998;24(4);372-377. PubMed
18. Kahn JM, Branas CC, Schwab CW, Asch DA. Regionalization of medical critical care: what can we learn from the trauma experience? Crit Care Med. 2008;36(11):3085-3088. PubMed
© 2018 Society of Hospital Medicine