User login
Utilization, Cost, and Prescription Trends of Antipsychotics Prescribed by Dermatologists for Medicare Patients
To the Editor:
Patients with primary psychiatric disorders with dermatologic manifestations often seek treatment from dermatologists instead of psychiatrists.1 For example, patients with delusions of parasitosis may lack insight into the underlying etiology of their disease and instead fixate on establishing an organic cause for their symptoms. As a result, it is an increasingly common practice for dermatologists to diagnose and treat psychiatric conditions.1 The goal of this study was to evaluate trends for the top 5 antipsychotics most frequently prescribed by dermatologists in the Medicare Part D database.
In this retrospective analysis, we consulted the Medicare Provider Utilization and Payment Data for January 2013 through December 2020, which is provided to the public by the Centers for Medicare & Medicaid Services.2 Only prescribing data from dermatologists were included in this study by using the built-in filter on the website to select “dermatology” as the prescriber type. All other provider types were excluded. We chose the top 5 most prescribed antipsychotics based on the number of supply days reported. Supply days—defined by Medicare as the number of days’ worth of medication that is prescribed—were used as a metric for utilization; therefore, each drug’s total supply days prescribed by dermatologists were calculated using this combined filter of drug name and total supply days using the database.
To analyze utilization over time, the annual average growth rate (AAGR) was calculated by determining the growth rate in total supply days annually from 2013 to 2020 and then averaging those rates to determine the overall AAGR. For greater clinical relevance, we calculated the average growth in supply days for the entire study period by determining the difference in the number of supply days for each year and then averaging these values. This was done to consider overall trends across dermatology rather than individual dermatologist prescribing patterns.
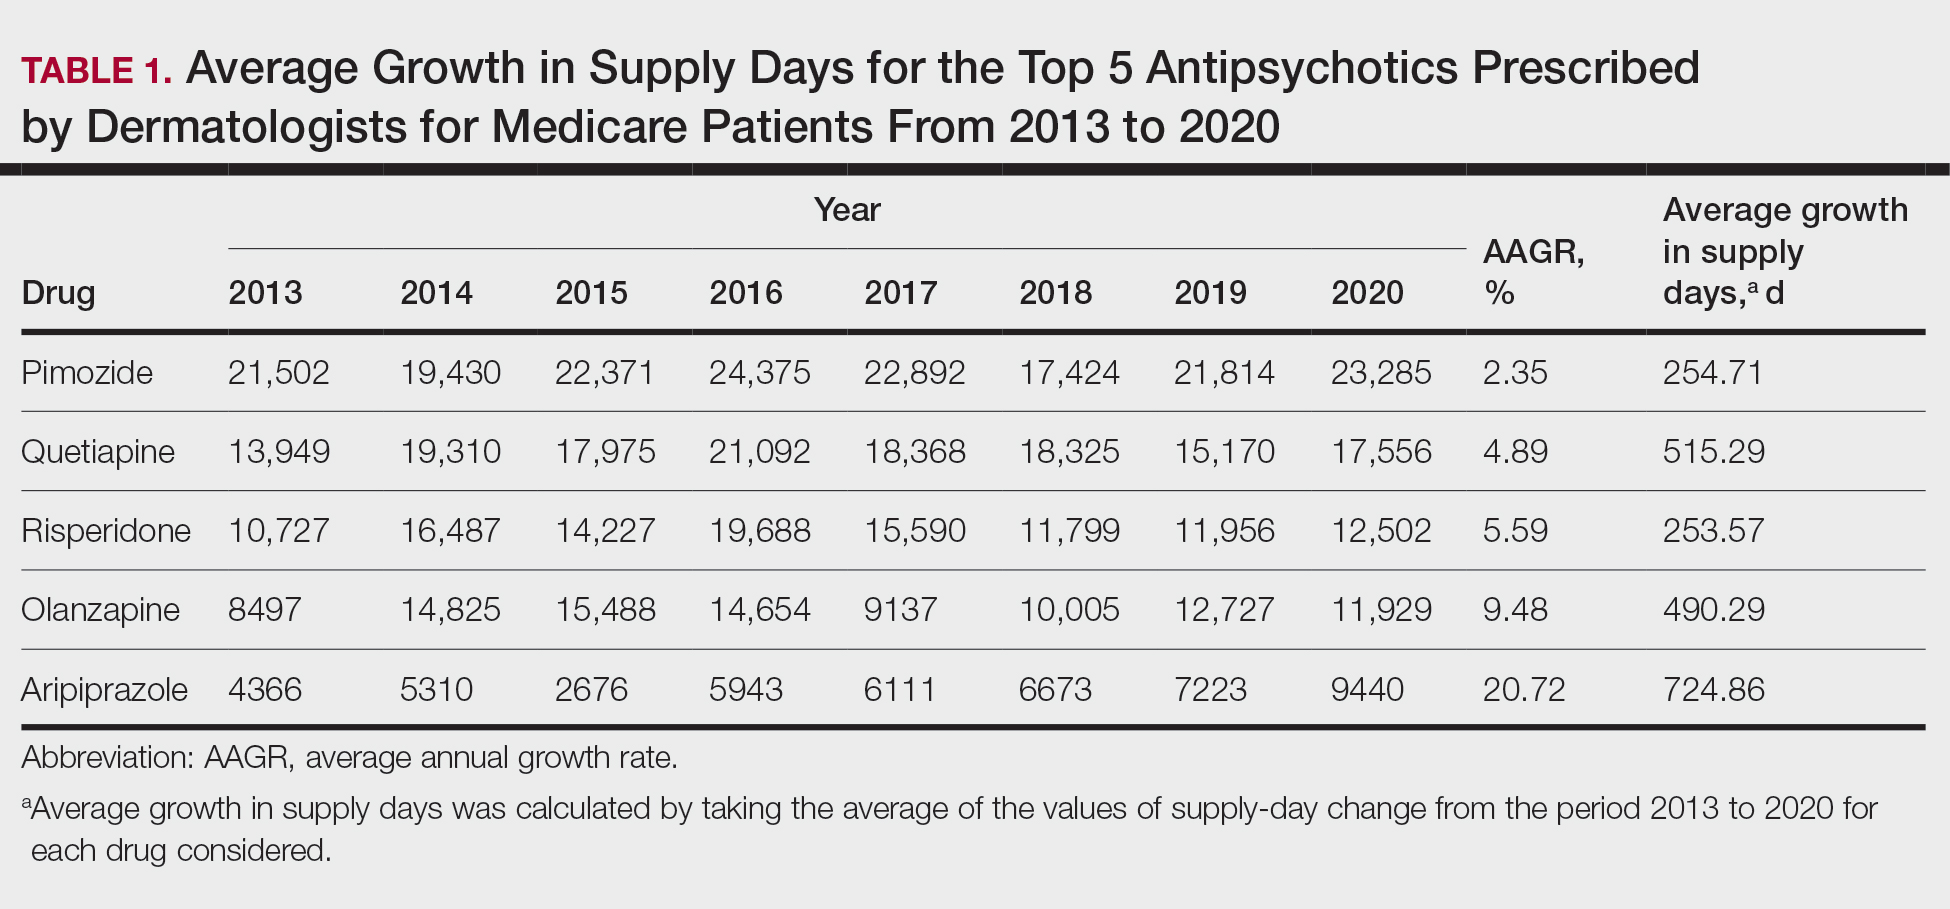
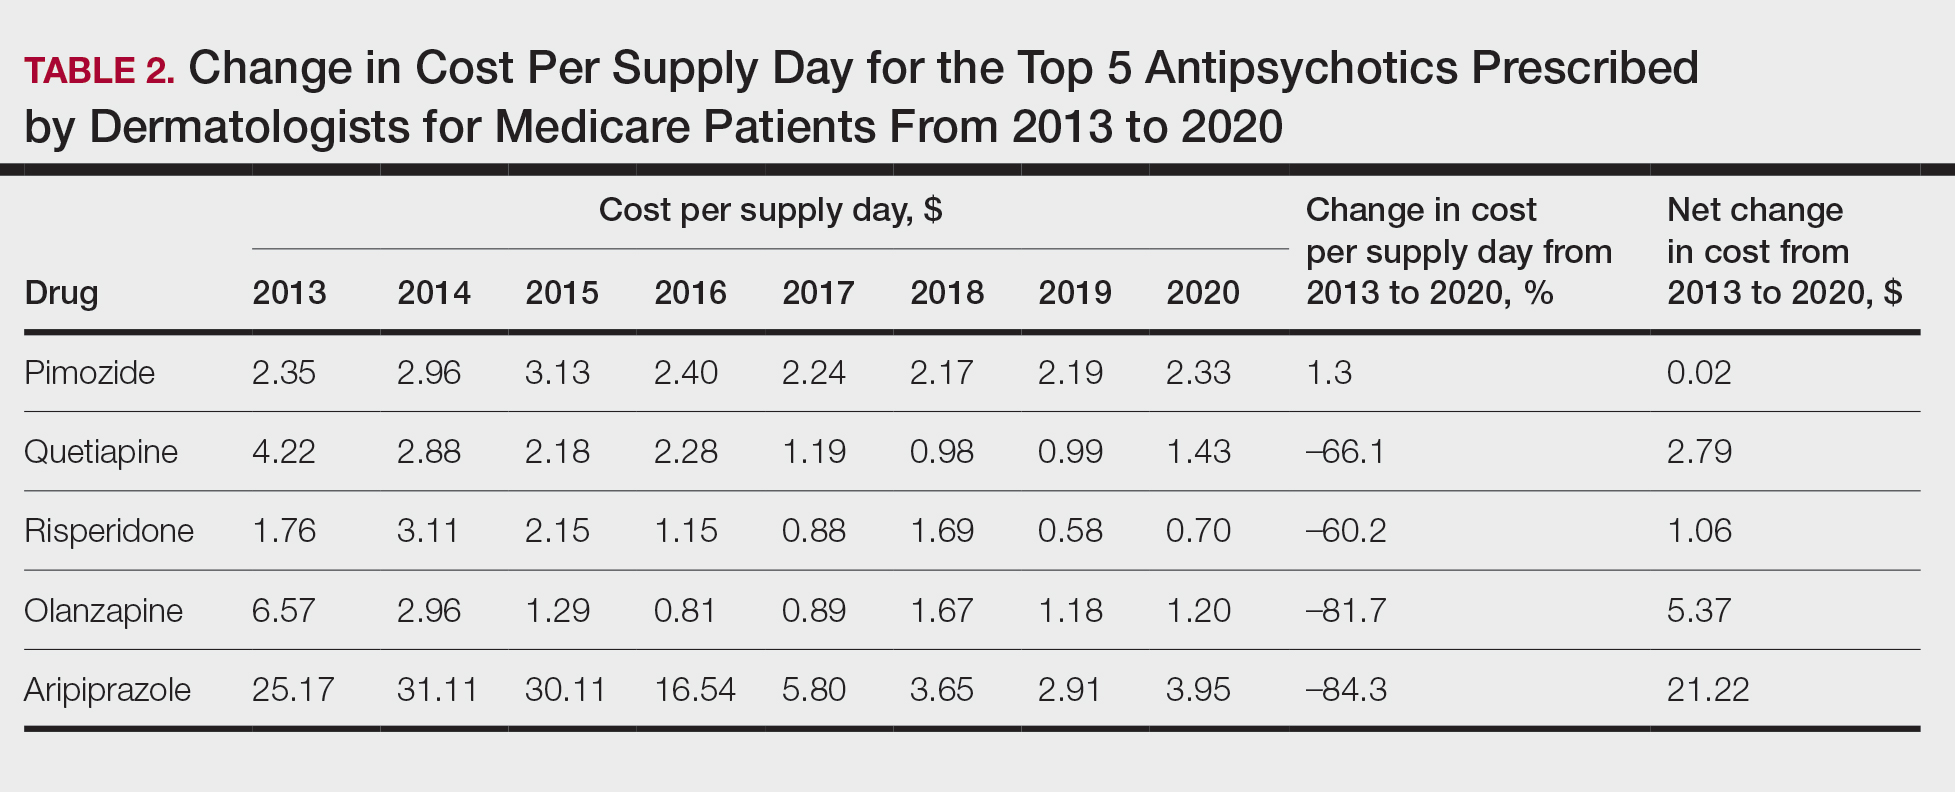
Based on our analysis, the antipsychotics most frequently prescribed by dermatologists for Medicare patients from January 2013 to December 2020 were pimozide, quetiapine, risperidone, olanzapine, and aripiprazole. The AAGR for each drug was 2.35%, 4.89%, 5.59%, 9.48%, and 20.72%, respectively, which is consistent with increased utilization over the study period for all 5 drugs (Table 1). The change in cost per supply day for the same period was 1.3%, –66.1%, –60.2%, –81.7%, and –84.3%, respectively. The net difference in cost per supply day over this entire period was $0.02, –$2.79, –$1.06, –$5.37, and –$21.22, respectively (Table 2).
There were several limitations to our study. Our analysis was limited to the Medicare population. Uninsured patients and those with Medicare Advantage or private health insurance plans were not included. In the Medicare database, only prescribers who prescribed a medication 10 times or more were recorded; therefore, some prescribers were not captured.
Although there was an increase in the dermatologic use of all 5 drugs in this study, perhaps the most marked growth was exhibited by aripiprazole, which had an AAGR of 20.72% (Table 1). Affordability may have been a factor, as the most marked reduction in price per supply day was noted for aripiprazole during the study period. Pimozide, which traditionally has been the first-line therapy for delusions of parasitosis, is the only first-generation antipsychotic drug among the 5 most frequently prescribed antipsychotics.3 Interestingly, pimozide had the lowest AAGR compared with the 4 second-generation antipsychotics. This finding also is corroborated by the average growth in supply days. While pimozide is a first-generation antipsychotic and had the lowest AAGR, pimozide still was the most prescribed antipsychotic in this study. Considering the average growth in Medicare beneficiaries during the study period was 2.70% per year,2 the AAGR of the 4 other drugs excluding pimozide shows that this growth was larger than what can be attributed to an increase in population size.
The most common conditions for which dermatologists prescribe antipsychotics are primary delusional infestation disorders as well as a range of self-inflicted dermatologic manifestations of dermatitis artefacta.4 Particularly, dermatologist-prescribed antipsychotics are first-line for these conditions in which perception of a persistent disease state is present.4 Importantly, dermatologists must differentiate between other dermatology-related psychiatric conditions such as trichotillomania and body dysmorphic disorder, which tend to respond better to selective serotonin reuptake inhibitors.4 Our data suggest that dermatologists are increasing their utilization of second-generation antipsychotics at a higher rate than first-generation antipsychotics, likely due to the lower risk of extrapyramidal symptoms. Patients are more willing to initiate a trial of psychiatric medication when it is prescribed by a dermatologist vs a psychiatrist due to lack of perceived stigma, which can lead to greater treatment compliance rates.5 As mentioned previously, as part of the differential, dermatologists also can effectively prescribe medications such as selective serotonin reuptake inhibitors for symptoms including anxiety, trichotillomania, body dysmorphic disorder, or secondary psychiatric disorders as a result of the burden of skin disease.5
In many cases, a dermatologist may be the first and only specialist to evaluate patients with conditions that overlap within the jurisdiction of dermatology and psychiatry. It is imperative that dermatologists feel comfortable treating this vulnerable patient population. As demonstrated by Medicare prescription data, the increasing utilization of antipsychotics in our specialty demands that dermatologists possess an adequate working knowledge of psychopharmacology, which may be accomplished during residency training through several directives, including focused didactic sessions, elective rotations in psychiatry, increased exposure to psychocutaneous lectures at national conferences, and finally through the establishment of joint dermatology-psychiatry clinics with interdepartmental collaboration.
- Weber MB, Recuero JK, Almeida CS. Use of psychiatric drugs in dermatology. An Bras Dermatol. 2020;95:133-143. doi:10.1016/j.abd.2019.12.002
- Centers for Medicare & Medicaid Services. Medicare provider utilization and payment data: part D prescriber. Updated September 10, 2024. Accessed October 7, 2024. https://www.cms.gov/data -research/statistics-trends-and-reports/medicare-provider-utilization-payment-data/part-d-prescriber
- Bolognia J, Schaffe JV, Lorenzo C. Dermatology. In: Duncan KO, Koo JYM, eds. Psychocutaneous Diseases. Elsevier; 2017:128-136.
- Gupta MA, Vujcic B, Pur DR, et al. Use of antipsychotic drugs in dermatology. Clin Dermatol. 2018;36:765-773. doi:10.1016/j.clindermatol.2018.08.006
- Jafferany M, Stamu-O’Brien C, Mkhoyan R, et al. Psychotropic drugs in dermatology: a dermatologist’s approach and choice of medications. Dermatol Ther. 2020;33:E13385. doi:10.1111/dth.13385
To the Editor:
Patients with primary psychiatric disorders with dermatologic manifestations often seek treatment from dermatologists instead of psychiatrists.1 For example, patients with delusions of parasitosis may lack insight into the underlying etiology of their disease and instead fixate on establishing an organic cause for their symptoms. As a result, it is an increasingly common practice for dermatologists to diagnose and treat psychiatric conditions.1 The goal of this study was to evaluate trends for the top 5 antipsychotics most frequently prescribed by dermatologists in the Medicare Part D database.
In this retrospective analysis, we consulted the Medicare Provider Utilization and Payment Data for January 2013 through December 2020, which is provided to the public by the Centers for Medicare & Medicaid Services.2 Only prescribing data from dermatologists were included in this study by using the built-in filter on the website to select “dermatology” as the prescriber type. All other provider types were excluded. We chose the top 5 most prescribed antipsychotics based on the number of supply days reported. Supply days—defined by Medicare as the number of days’ worth of medication that is prescribed—were used as a metric for utilization; therefore, each drug’s total supply days prescribed by dermatologists were calculated using this combined filter of drug name and total supply days using the database.
To analyze utilization over time, the annual average growth rate (AAGR) was calculated by determining the growth rate in total supply days annually from 2013 to 2020 and then averaging those rates to determine the overall AAGR. For greater clinical relevance, we calculated the average growth in supply days for the entire study period by determining the difference in the number of supply days for each year and then averaging these values. This was done to consider overall trends across dermatology rather than individual dermatologist prescribing patterns.
Based on our analysis, the antipsychotics most frequently prescribed by dermatologists for Medicare patients from January 2013 to December 2020 were pimozide, quetiapine, risperidone, olanzapine, and aripiprazole. The AAGR for each drug was 2.35%, 4.89%, 5.59%, 9.48%, and 20.72%, respectively, which is consistent with increased utilization over the study period for all 5 drugs (Table 1). The change in cost per supply day for the same period was 1.3%, –66.1%, –60.2%, –81.7%, and –84.3%, respectively. The net difference in cost per supply day over this entire period was $0.02, –$2.79, –$1.06, –$5.37, and –$21.22, respectively (Table 2).
There were several limitations to our study. Our analysis was limited to the Medicare population. Uninsured patients and those with Medicare Advantage or private health insurance plans were not included. In the Medicare database, only prescribers who prescribed a medication 10 times or more were recorded; therefore, some prescribers were not captured.
Although there was an increase in the dermatologic use of all 5 drugs in this study, perhaps the most marked growth was exhibited by aripiprazole, which had an AAGR of 20.72% (Table 1). Affordability may have been a factor, as the most marked reduction in price per supply day was noted for aripiprazole during the study period. Pimozide, which traditionally has been the first-line therapy for delusions of parasitosis, is the only first-generation antipsychotic drug among the 5 most frequently prescribed antipsychotics.3 Interestingly, pimozide had the lowest AAGR compared with the 4 second-generation antipsychotics. This finding also is corroborated by the average growth in supply days. While pimozide is a first-generation antipsychotic and had the lowest AAGR, pimozide still was the most prescribed antipsychotic in this study. Considering the average growth in Medicare beneficiaries during the study period was 2.70% per year,2 the AAGR of the 4 other drugs excluding pimozide shows that this growth was larger than what can be attributed to an increase in population size.
The most common conditions for which dermatologists prescribe antipsychotics are primary delusional infestation disorders as well as a range of self-inflicted dermatologic manifestations of dermatitis artefacta.4 Particularly, dermatologist-prescribed antipsychotics are first-line for these conditions in which perception of a persistent disease state is present.4 Importantly, dermatologists must differentiate between other dermatology-related psychiatric conditions such as trichotillomania and body dysmorphic disorder, which tend to respond better to selective serotonin reuptake inhibitors.4 Our data suggest that dermatologists are increasing their utilization of second-generation antipsychotics at a higher rate than first-generation antipsychotics, likely due to the lower risk of extrapyramidal symptoms. Patients are more willing to initiate a trial of psychiatric medication when it is prescribed by a dermatologist vs a psychiatrist due to lack of perceived stigma, which can lead to greater treatment compliance rates.5 As mentioned previously, as part of the differential, dermatologists also can effectively prescribe medications such as selective serotonin reuptake inhibitors for symptoms including anxiety, trichotillomania, body dysmorphic disorder, or secondary psychiatric disorders as a result of the burden of skin disease.5
In many cases, a dermatologist may be the first and only specialist to evaluate patients with conditions that overlap within the jurisdiction of dermatology and psychiatry. It is imperative that dermatologists feel comfortable treating this vulnerable patient population. As demonstrated by Medicare prescription data, the increasing utilization of antipsychotics in our specialty demands that dermatologists possess an adequate working knowledge of psychopharmacology, which may be accomplished during residency training through several directives, including focused didactic sessions, elective rotations in psychiatry, increased exposure to psychocutaneous lectures at national conferences, and finally through the establishment of joint dermatology-psychiatry clinics with interdepartmental collaboration.
- Weber MB, Recuero JK, Almeida CS. Use of psychiatric drugs in dermatology. An Bras Dermatol. 2020;95:133-143. doi:10.1016/j.abd.2019.12.002
- Centers for Medicare & Medicaid Services. Medicare provider utilization and payment data: part D prescriber. Updated September 10, 2024. Accessed October 7, 2024. https://www.cms.gov/data -research/statistics-trends-and-reports/medicare-provider-utilization-payment-data/part-d-prescriber
- Bolognia J, Schaffe JV, Lorenzo C. Dermatology. In: Duncan KO, Koo JYM, eds. Psychocutaneous Diseases. Elsevier; 2017:128-136.
- Gupta MA, Vujcic B, Pur DR, et al. Use of antipsychotic drugs in dermatology. Clin Dermatol. 2018;36:765-773. doi:10.1016/j.clindermatol.2018.08.006
- Jafferany M, Stamu-O’Brien C, Mkhoyan R, et al. Psychotropic drugs in dermatology: a dermatologist’s approach and choice of medications. Dermatol Ther. 2020;33:E13385. doi:10.1111/dth.13385
Practice Points
- Dermatologists are frontline medical providers who can be useful in screening for primary psychiatric disorders in patients with dermatologic manifestations.
- Second-generation antipsychotics are effective for treating many psychiatric disorders.
Treat-to-Target Outcomes With Tapinarof Cream 1% in Phase 3 Trials for Plaque Psoriasis
Psoriasis is a chronic inflammatory disease affecting approximately 8 million adults in the United States and 2% of the global population.1,2 Psoriasis causes pain, itching, and disfigurement and is associated with a physical, psychological, and economic burden that substantially affects health-related quality of life.3-5
Setting treatment goals and treating to target are evidence-based approaches that have been successfully applied to several chronic diseases to improve patient outcomes, including diabetes, hypertension, and rheumatoid arthritis.6-9 Treat-to-target strategies generally set low disease activity (or remission) as an overall goal and seek to achieve this using available therapeutic options as necessary. Introduced following the availability of biologics and targeted systemic therapies, treat-to-target strategies generally provide guidance on expectations of treatment but not specific treatments, as personalized treatment decisions depend on an assessment of individual patients and consider clinical and demographic features as well as preferences for available therapeutic options. If targets are not achieved in the assigned time span, adjustments can be made to the treatment approach in close consultation with the patient. If the target is reached, follow-up visits can be scheduled to ensure improvement is maintained or to establish if more aggressive goals could be selected.
Treat-to-target strategies for the management of psoriasis developed by the National Psoriasis Foundation (NPF) Medical Board include reducing the extent of psoriasis to 1% or lower total body surface area (BSA) after 3 months of treatment.10 Treatment targets endorsed by the European Academy of Dermatology and Venereology (EADV) in guidelines on the use of systemic therapies in psoriasis include achieving a 75% or greater reduction in Psoriasis Area and Severity Index (PASI) score within 3 to 4 months of treatment.11
In clinical practice, many patients do not achieve these treatment targets, and topical treatments alone generally are insufficient in achieving treatment goals for psoriasis.12,13 Moreover, conventional topical treatments (eg, topical corticosteroids) used by most patients with psoriasis regardless of disease severity are associated with adverse events that can limit their use. Most topical corticosteroids have US Food and Drug Administration label restrictions relating to sites of application, duration and extent of use, and frequency of administration.14,15
Tapinarof cream 1% (VTAMA [Dermavant Sciences, Inc]) is a first-in-class topical nonsteroidal aryl hydrocarbon receptor agonist that was approved by the US Food and Drug Administration for the treatment of plaque psoriasis in adults16 and is being studied for the treatment of plaque psoriasis in children 2 years and older as well as for atopic dermatitis in adults and children 2 years and older. In PSOARING 1 (ClinicalTrials .gov identifier NCT03956355) and PSOARING 2 (NCT03983980)—identical 12-week pivotal phase 3 trials—monotherapy with tapinarof cream 1% once daily (QD) demonstrated statistically significant efficacy vs vehicle cream and was well tolerated in adults with mild to severe plaque psoriasis (Supplementary Figure S1).17 Lebwohl et al17 reported that significantly higher PASI75 responses were observed at week 12 with tapinarof cream vs vehicle in PSOARING 1 and PSOARING 2 (36% and 48% vs 10% and 7%, respectively; both P<.0001). A significantly higher PASI90 response of 19% and 21% at week 12 also was observed with tapinarof cream vs 2% and 3% with vehicle in PSOARING 1 and PSOARING 2, respectively (P=.0005 and P<.0001).17
In PSOARING 3 (NCT04053387)—the long-term extension trial (Supplementary Figure S1)—efficacy continued to improve or was maintained beyond the two 12-week trials, with improvements in total BSA affected and PASI scores for up to 52 weeks.18 Tapinarof cream 1% QD demonstrated positive, rapid, and durable outcomes in PSOARING 3, including high rates of complete disease clearance (Physician Global Assessment [PGA] score=0 [clear])(40.9% [312/763]), durability of response on treatment with no evidence of tachyphylaxis, and a remittive effect of approximately 4 months when off therapy (defined as maintenance of a PGA score of 0 [clear] or 1 [almost clear] after first achieving a PGA score of 0).18
Herein, we report absolute treatment targets for patients with plaque psoriasis who received tapinarof cream 1% QD in the PSOARING trials that are at least as stringent as the corresponding NPF and EADV targets of achieving a total BSA affected of 1% or lower or a PASI75 response within 3 to 4 months, respectively.
METHODS
Study Design
The pooled efficacy analyses included all patients with a baseline PGA score of 2 or higher (mild or worse) before treatment with tapinarof cream 1% QD in the PSOARING trials. This included patients who received tapinarof cream 1% in PSOARING 1 and PSOARING 2 who may or may not have continued into PSOARING 3, as well as those who received the vehicle in PSOARING 1 and PSOARING 2 who enrolled in PSOARING 3 and had a PGA score of 2 or higher before receiving tapinarof cream 1%.
Trial Participants
Full methods, including inclusion and exclusion criteria, for the PSOARING trials have been previously reported.17,18 Patients were aged 18 to 75 years and had chronic plaque psoriasis that was stable for at least 6 months before randomization; 3% to 20% total BSA affected (excluding the scalp, palms, fingernails, toenails, and soles); and a PGA score of 2 (mild), 3 (moderate), or 4 (severe) at baseline.
The clinical trials were conducted in compliance with the guidelines for Good Clinical Practice and the Declaration of Helsinki. Approval was obtained from local ethics committees or institutional review boards at each center. All patients provided written informed consent.
Trial Treatment
In PSOARING 1 and PSOARING 2, patients were randomized (2:1) to receive tapinarof cream 1% or vehicle QD for 12 weeks. In PSOARING 3 (the long-term extension trial), patients received up to 40 weeks of open-label tapinarof, followed by 4 weeks of follow-up off treatment. Patients received intermittent or continuous treatment with tapinarof cream 1% in PSOARING 3 based on PGA score: those entering the trial with a PGA score of 1 or higher received tapinarof cream 1% until complete disease clearance was achieved (defined as a PGA score of 0 [clear]). Those entering PSOARING 3 with or achieving a PGA score of 0 (clear) discontinued treatment and were observed for the duration of maintenance of a PGA score of 0 (clear) or 1 (almost clear) while off therapy (the protocol-defined “duration of remittive effect”). If disease worsening (defined as a PGA score 2 or higher) occurred, tapinarof cream 1% was restarted and continued until a PGA score of 0 (clear) was achieved. This pattern of treatment, discontinuation on achieving a PGA score of 0 (clear), and retreatment on disease worsening continued until the end of the trial. As a result, patients in PSOARING 3 could receive tapinarof cream 1% continuously or intermittently for 40 weeks.
Outcome Measures and Statistical Analyses
The assessment of total BSA affected by plaque psoriasis is an estimate of the total extent of disease as a percentage of total skin area. In the PSOARING trials, the skin surface of one hand (palm and digits) was assumed to be approximately equivalent to 1% BSA. The total BSA affected by psoriasis was evaluated from 0% to 100%, with greater total BSA affected being an indication of more extensive disease. The BSA efficacy outcomes used in these analyses were based post hoc on the proportion of patients who achieved a 1% or lower or 0.5% or lower total BSA affected.
Psoriasis Area and Severity Index scores assess both the severity and extent of psoriasis. A PASI score lower than 5 often is considered indicative of mild psoriasis, a score of 5 to 10 indicates moderate disease, and a score higher than 10 indicates severe disease.19 The maximum PASI score is 72. The PASI efficacy outcomes used in these analyses were based post hoc on the proportion of patients who achieved an absolute total PASI score of 3 or lower, 2 or lower, and 1 or lower.
Efficacy analyses were based on pooled data for all patients in the PSOARING trials who had a PGA score of 2 to 4 (mild to severe) before treatment with tapinarof cream 1% in the intention-to-treat population using observed cases. Time-to-target analyses were based on Kaplan-Meier (KM) estimates using observed cases.
Safety analyses included the incidence and frequency of adverse events and were based on all patients who received tapinarof cream 1% in the PSOARING trials.
RESULTS
Baseline Patient Demographics and Disease Characteristics
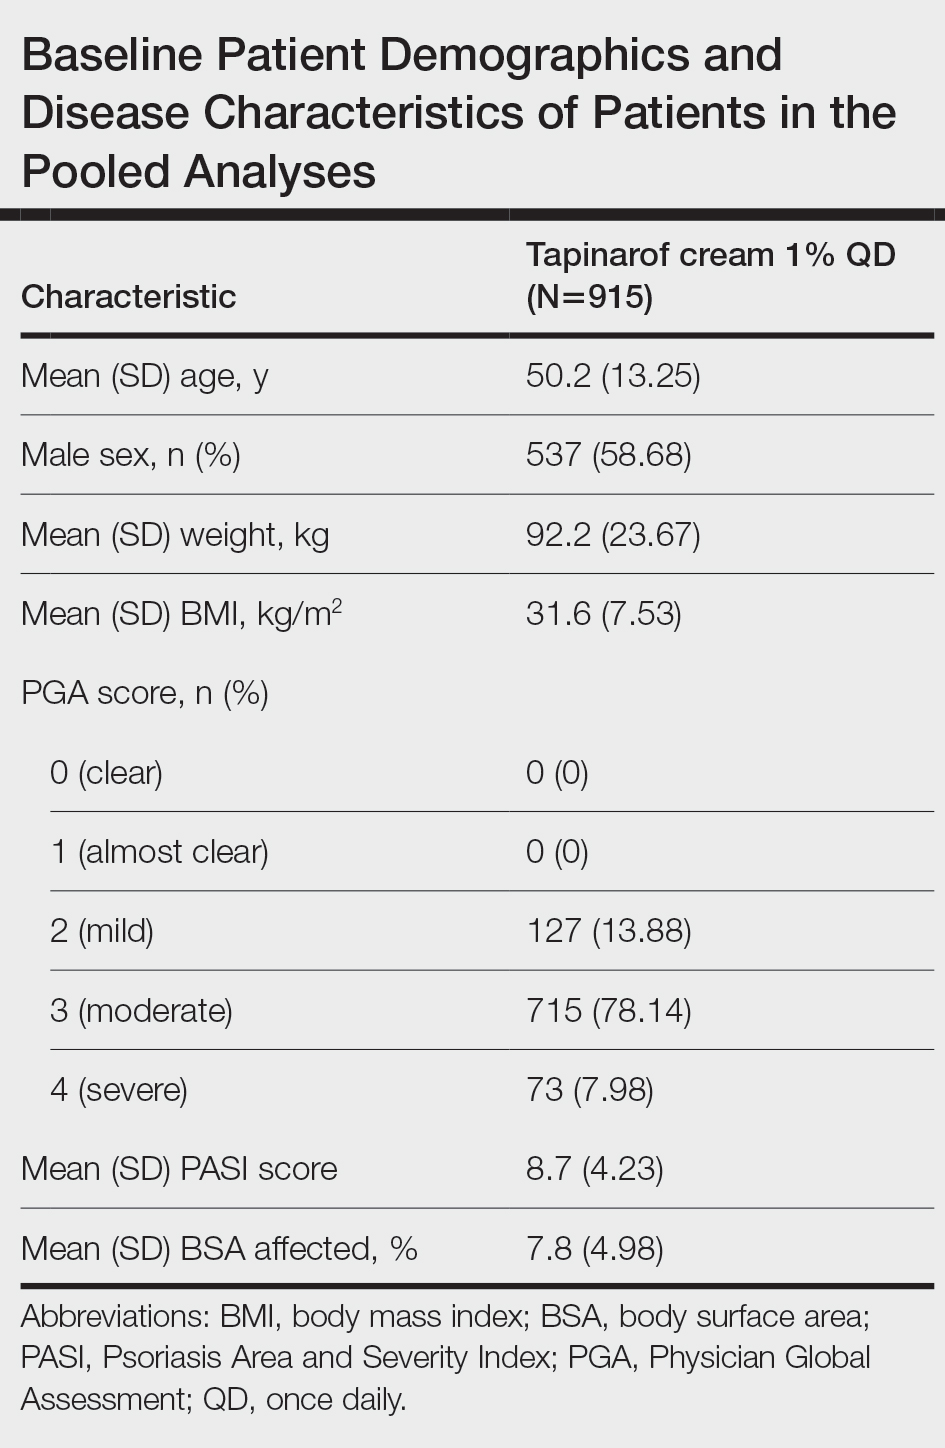
The pooled efficacy analyses included 915 eligible patients (Table). At baseline, the mean (SD) age was 50.2 (13.25) years, 58.7% were male, the mean (SD) weight was 92.2 (23.67) kg, and the mean (SD) body mass index was 31.6 (7.53) kg/m2. The percentage of patients with a PGA score of 2 (mild), 3 (moderate), or 4 (severe) was 13.9%, 78.1%, and 8.0%, respectively. The mean (SD) PASI score was 8.7 (4.23) and mean (SD) total BSA affected was 7.8% (4.98).
Efficacy
Achievement of BSA-Affected Targets—
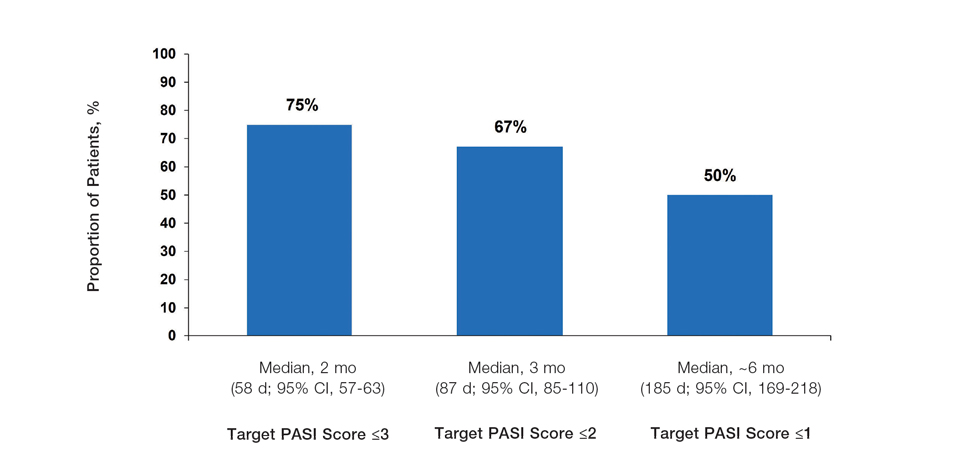
Achievement of Absolute PASI Targets—Across the total trial period (up to 52 weeks), an absolute total PASI score of 3 or lower was achieved by 75% of patients (686/915), with a median time to achieve this of 2 months (KM estimate: 58 days [95% CI, 57-63]); approximately 67% of patients (612/915) achieved a total PASI score of 2 or lower, with a median time to achieve of 3 months (KM estimate: 87 days [95% CI, 85-110])(Figure 2; Supplementary Figures S3a and S3b). A PASI score of 1 or lower was achieved by approximately 50% of patients (460/915), with a median time to achieve of approximately 6 months (KM estimate: 185 days [95% CI, 169-218])(Figure 2, Supplementary Figure S3c).
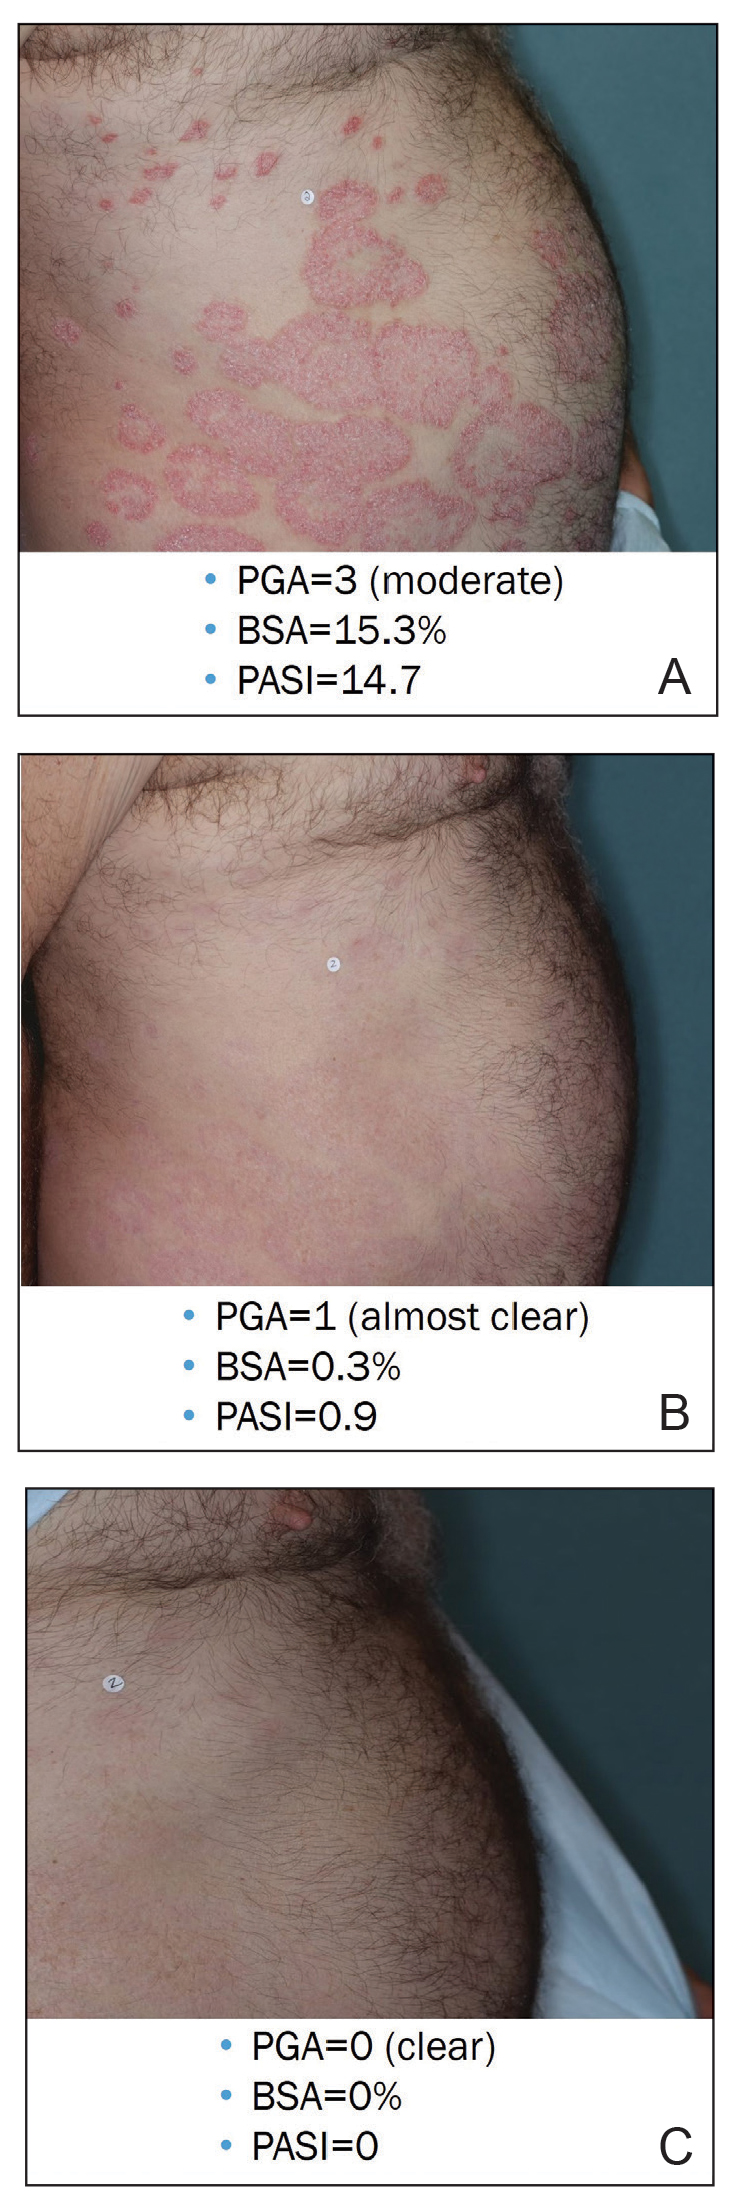
Illustrative Case—Case photography showing the clinical response in a 63-year-old man with moderate plaque psoriasis in PSOARING 2 is shown in Figure 3. After 12 weeks of treatment with tapinarof cream 1% QD, the patient achieved all primary and secondary efficacy end points. In addition to achieving the regulatory end point of a PGA score of 0 (clear) or 1 (almost clear) and a decrease from baseline of at least 2 points, achievement of 0% total BSA affected and a total PASI score of 0 at week 12 exceeded the NPF and EADV consensus treatment targets.10,11 Targets were achieved as early as week 4, with a total BSA affected of 0.5% or lower and a total PASI score of 1 or lower, illustrated by marked skin clearing and only faint residual erythema that completely resolved at week 12, with the absence of postinflammatory hyperpigmentation.
Safety
Safety data for the PSOARING trials have been previously reported.17,18 The most common treatment-emergent adverse events were folliculitis, contact dermatitis, upper respiratory tract infection, and nasopharyngitis. Treatment-emergent adverse events generally were mild or moderate in severity and did not lead to trial discontinuation.17,18
COMMENT
Treat-to-target management approaches aim to improve patient outcomes by striving to achieve optimal goals. The treat-to-target approach supports shared decision-making between clinicians and patients based on common expectations of what constitutes treatment success.
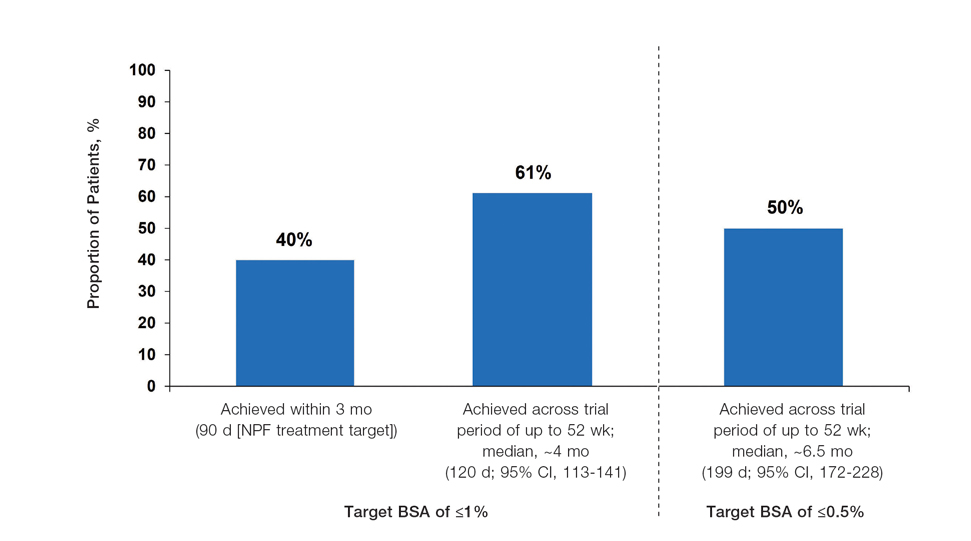
The findings of this analysis based on pooled data from a large cohort of patients demonstrate that a high proportion of patients can achieve or exceed recommended treatment targets with tapinarof cream 1% QD and maintain improvements long-term. The NPF-recommended treatment target of 1% or lower BSA affected within approximately 3 months (90 days) of treatment was achieved by 40% of tapinarof-treated patients. In addition, 1% or lower BSA affected at any time during the trials was achieved by 61% of patients (median, approximately 4 months). The analyses also indicated that PASI total scores of 3 or lower and 2 or lower were achieved by 75% and 67% of tapinarof-treated patients, respectively, within 2 to 3 months.
These findings support the previously reported efficacy of tapinarof cream, including high rates of complete disease clearance (40.9% [312/763]), durable response following treatment interruption, an off-therapy remittive effect of approximately 4 months, and good disease control on therapy with no evidence of tachyphylaxis.17,18
CONCLUSION
Taken together with previously reported tapinarof efficacy and safety results, our findings demonstrate that a high proportion of patients treated with tapinarof cream as monotherapy can achieve aggressive treatment targets set by both US and European guidelines developed for systemic and biologic therapies. Tapinarof cream 1% QD is an effective topical treatment option for patients with plaque psoriasis that has been approved without restrictions relating to severity or extent of disease treated, duration of use, or application sites, including application to sensitive and intertriginous skin.
Acknowledgments—Editorial and medical writing support under the guidance of the authors was provided by Melanie Govender, MSc (Med), ApotheCom (United Kingdom), and was funded by Dermavant Sciences, Inc, in accordance with Good Publication Practice (GPP) guidelines.
- Armstrong AW, Mehta MD, Schupp CW, et al. Psoriasis prevalence in adults in the United States. JAMA Dermatol. 2021;157:940-946.
- Parisi R, Iskandar IYK, Kontopantelis E, et al. National, regional, and worldwide epidemiology of psoriasis: systematic analysis and modelling study. BMJ. 2020;369:m1590.
- Pilon D, Teeple A, Zhdanava M, et al. The economic burden of psoriasis with high comorbidity among privately insured patients in the United States. J Med Econ. 2019;22:196-203.
- Singh S, Taylor C, Kornmehl H, et al. Psoriasis and suicidality: a systematic review and meta-analysis. J Am Acad Dermatol. 2017;77:425-440.e2.
- Feldman SR, Goffe B, Rice G, et al. The challenge of managing psoriasis: unmet medical needs and stakeholder perspectives. Am Health Drug Benefits. 2016;9:504-513.
- Ford JA, Solomon DH. Challenges in implementing treat-to-target strategies in rheumatology. Rheum Dis Clin North Am. 2019;45:101-112.
- Sitbon O, Galiè N. Treat-to-target strategies in pulmonary arterial hypertension: the importance of using multiple goals. Eur Respir Rev. 2010;19:272-278.
- Smolen JS, Aletaha D, Bijlsma JW, et al. Treating rheumatoid arthritis to target: recommendations of an international task force. Ann Rheum Dis. 2010;69:631-637.
- Wangnoo SK, Sethi B, Sahay RK, et al. Treat-to-target trials in diabetes. Indian J Endocrinol Metab. 2014;18:166-174.
- Armstrong AW, Siegel MP, Bagel J, et al. From the Medical Board of the National Psoriasis Foundation: treatment targets for plaque psoriasis. J Am Acad Dermatol. 2017;76:290-298.
- Pathirana D, Ormerod AD, Saiag P, et al. European S3-guidelines on the systemic treatment of psoriasis vulgaris. J Eur Acad Dermatol Venereol. 2009;23(Suppl 2):1-70.
- Strober BE, van der Walt JM, Armstrong AW, et al. Clinical goals and barriers to effective psoriasis care. Dermatol Ther (Heidelb). 2019; 9:5-18.
- Bagel J, Gold LS. Combining topical psoriasis treatment to enhance systemic and phototherapy: a review of the literature. J Drugs Dermatol. 2017;16:1209-1222.
- Elmets CA, Korman NJ, Prater EF, et al. Joint AAD-NPF Guidelines of care for the management and treatment of psoriasis with topical therapy and alternative medicine modalities for psoriasis severity measures. J Am Acad Dermatol. 2021;84:432-470.
- Stein Gold LF. Topical therapies for psoriasis: improving management strategies and patient adherence. Semin Cutan Med Surg. 2016;35 (2 Suppl 2):S36-S44; quiz S45.
- VTAMA® (tapinarof) cream. Prescribing information. Dermavant Sciences; 2022. Accessed September 13, 2024. https://www.accessdata.fda.gov/drugsatfda_docs/label/2022/215272s000lbl.pdf
- Lebwohl MG, Stein Gold L, Strober B, et al. Phase 3 trials of tapinarof cream for plaque psoriasis. N Engl J Med. 2021;385:2219-2229 and supplementary appendix.
- Strober B, Stein Gold L, Bissonnette R, et al. One-year safety and efficacy of tapinarof cream for the treatment of plaque psoriasis: results from the PSOARING 3 trial. J Am Acad Dermatol. 2022;87:800-806.
- Clinical Review Report: Guselkumab (Tremfya) [Internet]. Canadian Agency for Drugs and Technologies in Health; 2018. Accessed September 13, 2024. https://www.ncbi.nlm.nih.gov/books/NBK534047/pdf/Bookshelf_NBK534047.pdf
Psoriasis is a chronic inflammatory disease affecting approximately 8 million adults in the United States and 2% of the global population.1,2 Psoriasis causes pain, itching, and disfigurement and is associated with a physical, psychological, and economic burden that substantially affects health-related quality of life.3-5
Setting treatment goals and treating to target are evidence-based approaches that have been successfully applied to several chronic diseases to improve patient outcomes, including diabetes, hypertension, and rheumatoid arthritis.6-9 Treat-to-target strategies generally set low disease activity (or remission) as an overall goal and seek to achieve this using available therapeutic options as necessary. Introduced following the availability of biologics and targeted systemic therapies, treat-to-target strategies generally provide guidance on expectations of treatment but not specific treatments, as personalized treatment decisions depend on an assessment of individual patients and consider clinical and demographic features as well as preferences for available therapeutic options. If targets are not achieved in the assigned time span, adjustments can be made to the treatment approach in close consultation with the patient. If the target is reached, follow-up visits can be scheduled to ensure improvement is maintained or to establish if more aggressive goals could be selected.
Treat-to-target strategies for the management of psoriasis developed by the National Psoriasis Foundation (NPF) Medical Board include reducing the extent of psoriasis to 1% or lower total body surface area (BSA) after 3 months of treatment.10 Treatment targets endorsed by the European Academy of Dermatology and Venereology (EADV) in guidelines on the use of systemic therapies in psoriasis include achieving a 75% or greater reduction in Psoriasis Area and Severity Index (PASI) score within 3 to 4 months of treatment.11
In clinical practice, many patients do not achieve these treatment targets, and topical treatments alone generally are insufficient in achieving treatment goals for psoriasis.12,13 Moreover, conventional topical treatments (eg, topical corticosteroids) used by most patients with psoriasis regardless of disease severity are associated with adverse events that can limit their use. Most topical corticosteroids have US Food and Drug Administration label restrictions relating to sites of application, duration and extent of use, and frequency of administration.14,15
Tapinarof cream 1% (VTAMA [Dermavant Sciences, Inc]) is a first-in-class topical nonsteroidal aryl hydrocarbon receptor agonist that was approved by the US Food and Drug Administration for the treatment of plaque psoriasis in adults16 and is being studied for the treatment of plaque psoriasis in children 2 years and older as well as for atopic dermatitis in adults and children 2 years and older. In PSOARING 1 (ClinicalTrials .gov identifier NCT03956355) and PSOARING 2 (NCT03983980)—identical 12-week pivotal phase 3 trials—monotherapy with tapinarof cream 1% once daily (QD) demonstrated statistically significant efficacy vs vehicle cream and was well tolerated in adults with mild to severe plaque psoriasis (Supplementary Figure S1).17 Lebwohl et al17 reported that significantly higher PASI75 responses were observed at week 12 with tapinarof cream vs vehicle in PSOARING 1 and PSOARING 2 (36% and 48% vs 10% and 7%, respectively; both P<.0001). A significantly higher PASI90 response of 19% and 21% at week 12 also was observed with tapinarof cream vs 2% and 3% with vehicle in PSOARING 1 and PSOARING 2, respectively (P=.0005 and P<.0001).17
In PSOARING 3 (NCT04053387)—the long-term extension trial (Supplementary Figure S1)—efficacy continued to improve or was maintained beyond the two 12-week trials, with improvements in total BSA affected and PASI scores for up to 52 weeks.18 Tapinarof cream 1% QD demonstrated positive, rapid, and durable outcomes in PSOARING 3, including high rates of complete disease clearance (Physician Global Assessment [PGA] score=0 [clear])(40.9% [312/763]), durability of response on treatment with no evidence of tachyphylaxis, and a remittive effect of approximately 4 months when off therapy (defined as maintenance of a PGA score of 0 [clear] or 1 [almost clear] after first achieving a PGA score of 0).18
Herein, we report absolute treatment targets for patients with plaque psoriasis who received tapinarof cream 1% QD in the PSOARING trials that are at least as stringent as the corresponding NPF and EADV targets of achieving a total BSA affected of 1% or lower or a PASI75 response within 3 to 4 months, respectively.
METHODS
Study Design
The pooled efficacy analyses included all patients with a baseline PGA score of 2 or higher (mild or worse) before treatment with tapinarof cream 1% QD in the PSOARING trials. This included patients who received tapinarof cream 1% in PSOARING 1 and PSOARING 2 who may or may not have continued into PSOARING 3, as well as those who received the vehicle in PSOARING 1 and PSOARING 2 who enrolled in PSOARING 3 and had a PGA score of 2 or higher before receiving tapinarof cream 1%.
Trial Participants
Full methods, including inclusion and exclusion criteria, for the PSOARING trials have been previously reported.17,18 Patients were aged 18 to 75 years and had chronic plaque psoriasis that was stable for at least 6 months before randomization; 3% to 20% total BSA affected (excluding the scalp, palms, fingernails, toenails, and soles); and a PGA score of 2 (mild), 3 (moderate), or 4 (severe) at baseline.
The clinical trials were conducted in compliance with the guidelines for Good Clinical Practice and the Declaration of Helsinki. Approval was obtained from local ethics committees or institutional review boards at each center. All patients provided written informed consent.
Trial Treatment
In PSOARING 1 and PSOARING 2, patients were randomized (2:1) to receive tapinarof cream 1% or vehicle QD for 12 weeks. In PSOARING 3 (the long-term extension trial), patients received up to 40 weeks of open-label tapinarof, followed by 4 weeks of follow-up off treatment. Patients received intermittent or continuous treatment with tapinarof cream 1% in PSOARING 3 based on PGA score: those entering the trial with a PGA score of 1 or higher received tapinarof cream 1% until complete disease clearance was achieved (defined as a PGA score of 0 [clear]). Those entering PSOARING 3 with or achieving a PGA score of 0 (clear) discontinued treatment and were observed for the duration of maintenance of a PGA score of 0 (clear) or 1 (almost clear) while off therapy (the protocol-defined “duration of remittive effect”). If disease worsening (defined as a PGA score 2 or higher) occurred, tapinarof cream 1% was restarted and continued until a PGA score of 0 (clear) was achieved. This pattern of treatment, discontinuation on achieving a PGA score of 0 (clear), and retreatment on disease worsening continued until the end of the trial. As a result, patients in PSOARING 3 could receive tapinarof cream 1% continuously or intermittently for 40 weeks.
Outcome Measures and Statistical Analyses
The assessment of total BSA affected by plaque psoriasis is an estimate of the total extent of disease as a percentage of total skin area. In the PSOARING trials, the skin surface of one hand (palm and digits) was assumed to be approximately equivalent to 1% BSA. The total BSA affected by psoriasis was evaluated from 0% to 100%, with greater total BSA affected being an indication of more extensive disease. The BSA efficacy outcomes used in these analyses were based post hoc on the proportion of patients who achieved a 1% or lower or 0.5% or lower total BSA affected.
Psoriasis Area and Severity Index scores assess both the severity and extent of psoriasis. A PASI score lower than 5 often is considered indicative of mild psoriasis, a score of 5 to 10 indicates moderate disease, and a score higher than 10 indicates severe disease.19 The maximum PASI score is 72. The PASI efficacy outcomes used in these analyses were based post hoc on the proportion of patients who achieved an absolute total PASI score of 3 or lower, 2 or lower, and 1 or lower.
Efficacy analyses were based on pooled data for all patients in the PSOARING trials who had a PGA score of 2 to 4 (mild to severe) before treatment with tapinarof cream 1% in the intention-to-treat population using observed cases. Time-to-target analyses were based on Kaplan-Meier (KM) estimates using observed cases.
Safety analyses included the incidence and frequency of adverse events and were based on all patients who received tapinarof cream 1% in the PSOARING trials.
RESULTS
Baseline Patient Demographics and Disease Characteristics
The pooled efficacy analyses included 915 eligible patients (Table). At baseline, the mean (SD) age was 50.2 (13.25) years, 58.7% were male, the mean (SD) weight was 92.2 (23.67) kg, and the mean (SD) body mass index was 31.6 (7.53) kg/m2. The percentage of patients with a PGA score of 2 (mild), 3 (moderate), or 4 (severe) was 13.9%, 78.1%, and 8.0%, respectively. The mean (SD) PASI score was 8.7 (4.23) and mean (SD) total BSA affected was 7.8% (4.98).
Efficacy
Achievement of BSA-Affected Targets—
Achievement of Absolute PASI Targets—Across the total trial period (up to 52 weeks), an absolute total PASI score of 3 or lower was achieved by 75% of patients (686/915), with a median time to achieve this of 2 months (KM estimate: 58 days [95% CI, 57-63]); approximately 67% of patients (612/915) achieved a total PASI score of 2 or lower, with a median time to achieve of 3 months (KM estimate: 87 days [95% CI, 85-110])(Figure 2; Supplementary Figures S3a and S3b). A PASI score of 1 or lower was achieved by approximately 50% of patients (460/915), with a median time to achieve of approximately 6 months (KM estimate: 185 days [95% CI, 169-218])(Figure 2, Supplementary Figure S3c).
Illustrative Case—Case photography showing the clinical response in a 63-year-old man with moderate plaque psoriasis in PSOARING 2 is shown in Figure 3. After 12 weeks of treatment with tapinarof cream 1% QD, the patient achieved all primary and secondary efficacy end points. In addition to achieving the regulatory end point of a PGA score of 0 (clear) or 1 (almost clear) and a decrease from baseline of at least 2 points, achievement of 0% total BSA affected and a total PASI score of 0 at week 12 exceeded the NPF and EADV consensus treatment targets.10,11 Targets were achieved as early as week 4, with a total BSA affected of 0.5% or lower and a total PASI score of 1 or lower, illustrated by marked skin clearing and only faint residual erythema that completely resolved at week 12, with the absence of postinflammatory hyperpigmentation.
Safety
Safety data for the PSOARING trials have been previously reported.17,18 The most common treatment-emergent adverse events were folliculitis, contact dermatitis, upper respiratory tract infection, and nasopharyngitis. Treatment-emergent adverse events generally were mild or moderate in severity and did not lead to trial discontinuation.17,18
COMMENT
Treat-to-target management approaches aim to improve patient outcomes by striving to achieve optimal goals. The treat-to-target approach supports shared decision-making between clinicians and patients based on common expectations of what constitutes treatment success.
The findings of this analysis based on pooled data from a large cohort of patients demonstrate that a high proportion of patients can achieve or exceed recommended treatment targets with tapinarof cream 1% QD and maintain improvements long-term. The NPF-recommended treatment target of 1% or lower BSA affected within approximately 3 months (90 days) of treatment was achieved by 40% of tapinarof-treated patients. In addition, 1% or lower BSA affected at any time during the trials was achieved by 61% of patients (median, approximately 4 months). The analyses also indicated that PASI total scores of 3 or lower and 2 or lower were achieved by 75% and 67% of tapinarof-treated patients, respectively, within 2 to 3 months.
These findings support the previously reported efficacy of tapinarof cream, including high rates of complete disease clearance (40.9% [312/763]), durable response following treatment interruption, an off-therapy remittive effect of approximately 4 months, and good disease control on therapy with no evidence of tachyphylaxis.17,18
CONCLUSION
Taken together with previously reported tapinarof efficacy and safety results, our findings demonstrate that a high proportion of patients treated with tapinarof cream as monotherapy can achieve aggressive treatment targets set by both US and European guidelines developed for systemic and biologic therapies. Tapinarof cream 1% QD is an effective topical treatment option for patients with plaque psoriasis that has been approved without restrictions relating to severity or extent of disease treated, duration of use, or application sites, including application to sensitive and intertriginous skin.
Acknowledgments—Editorial and medical writing support under the guidance of the authors was provided by Melanie Govender, MSc (Med), ApotheCom (United Kingdom), and was funded by Dermavant Sciences, Inc, in accordance with Good Publication Practice (GPP) guidelines.
- Armstrong AW, Mehta MD, Schupp CW, et al. Psoriasis prevalence in adults in the United States. JAMA Dermatol. 2021;157:940-946.
- Parisi R, Iskandar IYK, Kontopantelis E, et al. National, regional, and worldwide epidemiology of psoriasis: systematic analysis and modelling study. BMJ. 2020;369:m1590.
- Pilon D, Teeple A, Zhdanava M, et al. The economic burden of psoriasis with high comorbidity among privately insured patients in the United States. J Med Econ. 2019;22:196-203.
- Singh S, Taylor C, Kornmehl H, et al. Psoriasis and suicidality: a systematic review and meta-analysis. J Am Acad Dermatol. 2017;77:425-440.e2.
- Feldman SR, Goffe B, Rice G, et al. The challenge of managing psoriasis: unmet medical needs and stakeholder perspectives. Am Health Drug Benefits. 2016;9:504-513.
- Ford JA, Solomon DH. Challenges in implementing treat-to-target strategies in rheumatology. Rheum Dis Clin North Am. 2019;45:101-112.
- Sitbon O, Galiè N. Treat-to-target strategies in pulmonary arterial hypertension: the importance of using multiple goals. Eur Respir Rev. 2010;19:272-278.
- Smolen JS, Aletaha D, Bijlsma JW, et al. Treating rheumatoid arthritis to target: recommendations of an international task force. Ann Rheum Dis. 2010;69:631-637.
- Wangnoo SK, Sethi B, Sahay RK, et al. Treat-to-target trials in diabetes. Indian J Endocrinol Metab. 2014;18:166-174.
- Armstrong AW, Siegel MP, Bagel J, et al. From the Medical Board of the National Psoriasis Foundation: treatment targets for plaque psoriasis. J Am Acad Dermatol. 2017;76:290-298.
- Pathirana D, Ormerod AD, Saiag P, et al. European S3-guidelines on the systemic treatment of psoriasis vulgaris. J Eur Acad Dermatol Venereol. 2009;23(Suppl 2):1-70.
- Strober BE, van der Walt JM, Armstrong AW, et al. Clinical goals and barriers to effective psoriasis care. Dermatol Ther (Heidelb). 2019; 9:5-18.
- Bagel J, Gold LS. Combining topical psoriasis treatment to enhance systemic and phototherapy: a review of the literature. J Drugs Dermatol. 2017;16:1209-1222.
- Elmets CA, Korman NJ, Prater EF, et al. Joint AAD-NPF Guidelines of care for the management and treatment of psoriasis with topical therapy and alternative medicine modalities for psoriasis severity measures. J Am Acad Dermatol. 2021;84:432-470.
- Stein Gold LF. Topical therapies for psoriasis: improving management strategies and patient adherence. Semin Cutan Med Surg. 2016;35 (2 Suppl 2):S36-S44; quiz S45.
- VTAMA® (tapinarof) cream. Prescribing information. Dermavant Sciences; 2022. Accessed September 13, 2024. https://www.accessdata.fda.gov/drugsatfda_docs/label/2022/215272s000lbl.pdf
- Lebwohl MG, Stein Gold L, Strober B, et al. Phase 3 trials of tapinarof cream for plaque psoriasis. N Engl J Med. 2021;385:2219-2229 and supplementary appendix.
- Strober B, Stein Gold L, Bissonnette R, et al. One-year safety and efficacy of tapinarof cream for the treatment of plaque psoriasis: results from the PSOARING 3 trial. J Am Acad Dermatol. 2022;87:800-806.
- Clinical Review Report: Guselkumab (Tremfya) [Internet]. Canadian Agency for Drugs and Technologies in Health; 2018. Accessed September 13, 2024. https://www.ncbi.nlm.nih.gov/books/NBK534047/pdf/Bookshelf_NBK534047.pdf
Practice Points
- In clinical practice, many patients with psoriasis do not achieve treatment targets set forth by the National Psoriasis Foundation and the European Academy of Dermatology and Venereology, and topical treatments alone generally are insufficient in achieving treatment goals for psoriasis.
- Tapinarof cream 1% is a nonsteroidal aryl hydrocarbon receptor agonist approved by the US Food and Drug Administration for the treatment of plaque psoriasis in adults; it also is being studied for the treatment of plaque psoriasis in children 2 years and older.
- Tapinarof cream 1% is an effective topical treatment option for patients with plaque psoriasis of any severity, with no limitations on treatment duration, total extent of use, or application sites, including intertriginous skin and sensitive areas.

Pediatric Melanoma Outcomes by Race and Socioeconomic Factors
To the Editor:
Skin cancers are extremely common worldwide. Malignant melanomas comprise approximately 1 in 5 of these cancers. Exposure to UV radiation is postulated to be responsible for a global rise in melanoma cases over the past 50 years.1 Pediatric melanoma is a particularly rare condition that affects approximately 6 in every 1 million children.2 Melanoma incidence in children ranges by age, increasing by approximately 10-fold from age 1 to 4 years to age 15 to 19 years. Tumor ulceration is a feature more commonly seen among children younger than 10 years and is associated with worse outcomes. Tumor thickness and ulceration strongly predict sentinel lymph node metastases among children, which also is associated with a poor prognosis.3
A recent study evaluating stage IV melanoma survival rates in adolescents and young adults (AYAs) vs older adults found that survival is much worse among AYAs. Thicker tumors and public health insurance also were associated with worse survival rates for AYAs, while early detection was associated with better survival rates.4
Health disparities and their role in the prognosis of pediatric melanoma is another important factor. One study analyzed this relationship at the state level using Texas Cancer Registry data (1995-2009).5 Patients’ socioeconomic status (SES) and driving distance to the nearest pediatric cancer care center were included in the analysis. Hispanic children were found to be 3 times more likely to present with advanced disease than non-Hispanic White children. Although SES and distance to the nearest treatment center were not found to affect the melanoma stage at presentation, Hispanic ethnicity or being in the lowest SES quartile were correlated with a higher mortality risk.5
When considering specific subtypes of melanoma, acral lentiginous melanoma (ALM) is known to develop in patients with skin of color. A 2023 study by Holman et al6 reported that the percentage of melanomas that were ALMs ranged from 0.8% in non-Hispanic White individuals to 19.1% in Hispanic Black, American Indian/Alaska Native, and Asian/Pacific Islander individuals. However, ALM is rare in children. In a pooled cohort study with patient information retrieved from the nationwide Dutch Pathology Registry, only 1 child and 1 adolescent were found to have ALM across a total of 514 patients.7 We sought to analyze pediatric melanoma outcomes based on race and other barriers to appropriate care.
We conducted a search of the Surveillance, Epidemiology, and End Results (SEER) database from January 1995 to December 2016 for patients aged 21 years and younger with a primary melanoma diagnosis. The primary outcome was the 5-year survival rate. County-level SES variables were used to calculate a prosperity index. Kaplan-Meier analysis and Cox proportional hazards model were used to compare 5-year survival rates among the different racial/ethnic groups.
A sample of 2742 patients was identified during the study period and followed for 5 years. Eighty-two percent were White, 6% Hispanic, 2% Asian, 1% Black, and 5% classified as other/unknown race (data were missing for 4%). The cohort was predominantly female (61%). White patients were more likely to present with localized disease than any other race/ethnicity (83% vs 65% in Hispanic, 60% in Asian/Pacific Islander, and 45% in Black patients [P<.05]).
Black and Hispanic patients had the worst 5-year survival rates on bivariate analysis. On multivariate analysis, this finding remained significant for Hispanic patients when compared with White patients (hazard ratio, 2.37 [P<.05]). Increasing age, male sex, advanced stage at diagnosis, and failure to receive surgery were associated with increased odds of mortality.
Patients with regionalized and disseminated disease had increased odds of mortality (6.16 and 64.45, respectively; P<.05) compared with patients with localized disease. Socioeconomic status and urbanization were not found to influence 5-year survival rates.
Pediatric melanoma often presents a clinical challenge with special considerations. Pediatric-specific predisposing risk factors for melanoma and an atypical clinical presentation are some of the major concerns that necessitate a tailored approach to this malignancy, especially among different age groups, skin types, and racial and socioeconomic groups.5
Standard ABCDE criteria often are inadequate for accurate detection of pediatric melanomas. Initial lesions often manifest as raised, red, amelanotic lesions mimicking pyogenic granulomas. Lesions tend to be very small (<6 mm in diameter) and can be uniform in color, thereby making the melanoma more difficult to detect compared to the characteristic findings in adults.5 Bleeding or ulceration often can be a warning sign during physical examination.
With regard to incidence, pediatric melanoma is relatively rare. Since the 1970s, the incidence of pediatric melanoma has been increasing; however, a recent analysis of the SEER database showed a decreasing trend from 2000 to 2010.4
Our analysis of the SEER data showed an increased risk for pediatric melanoma in older adolescents. In addition, the incidence of pediatric melanoma was higher in females of all racial groups except Asian/Pacific Islander individuals. However, SES was not found to significantly influence the 5-year survival rate in pediatric melanoma.
White pediatric patients were more likely to present with localized disease compared with other races. Pediatric melanoma patients with regional disease had a 6-fold increase in mortality rate vs those with localized disease; those with disseminated disease had a 65-fold higher risk. Consistent with this, Black and Hispanic patients had the worst 5-year survival rates on bivariate analysis.
These findings suggest a relationship between race, melanoma spread, and disease severity. Patient education programs need to be directed specifically to minority groups to improve their knowledge on evolving skin lesions and sun protection practices. Physicians also need to have heightened suspicion and better knowledge of the unique traits of pediatric melanoma.5
Given the considerable influence these disparities can have on melanoma outcomes, further research is needed to characterize outcomes based on race and determine obstacles to appropriate care. Improved public outreach initiatives that accommodate specific cultural barriers (eg, language, traditional patterns of behavior) also are required to improve current circumstances.
- Arnold M, Singh D, Laversanne M, et al. Global burden of cutaneous melanoma in 2020 and projections to 2040. JAMA Dermatol. 2022;158:495-503.
- McCormack L, Hawryluk EB. Pediatric melanoma update. G Ital Dermatol Venereol. 2018;153:707-715.
- Saiyed FK, Hamilton EC, Austin MT. Pediatric melanoma: incidence, treatment, and prognosis. Pediatric Health Med Ther. 2017;8:39-45.
- Wojcik KY, Hawkins M, Anderson-Mellies A, et al. Melanoma survival by age group: population-based disparities for adolescent and young adult patients by stage, tumor thickness, and insurance type. J Am Acad Dermatol. 2023;88:831-840.
- Hamilton EC, Nguyen HT, Chang YC, et al. Health disparities influence childhood melanoma stage at diagnosis and outcome. J Pediatr. 2016;175:182-187.
- Holman DM, King JB, White A, et al. Acral lentiginous melanoma incidence by sex, race, ethnicity, and stage in the United States, 2010-2019. Prev Med. 2023;175:107692. doi:10.1016/j.ypmed.2023.107692
- El Sharouni MA, Rawson RV, Potter AJ, et al. Melanomas in children and adolescents: clinicopathologic features and survival outcomes. J Am Acad Dermatol. 2023;88:609-616. doi:10.1016/j.jaad.2022.08.067
To the Editor:
Skin cancers are extremely common worldwide. Malignant melanomas comprise approximately 1 in 5 of these cancers. Exposure to UV radiation is postulated to be responsible for a global rise in melanoma cases over the past 50 years.1 Pediatric melanoma is a particularly rare condition that affects approximately 6 in every 1 million children.2 Melanoma incidence in children ranges by age, increasing by approximately 10-fold from age 1 to 4 years to age 15 to 19 years. Tumor ulceration is a feature more commonly seen among children younger than 10 years and is associated with worse outcomes. Tumor thickness and ulceration strongly predict sentinel lymph node metastases among children, which also is associated with a poor prognosis.3
A recent study evaluating stage IV melanoma survival rates in adolescents and young adults (AYAs) vs older adults found that survival is much worse among AYAs. Thicker tumors and public health insurance also were associated with worse survival rates for AYAs, while early detection was associated with better survival rates.4
Health disparities and their role in the prognosis of pediatric melanoma is another important factor. One study analyzed this relationship at the state level using Texas Cancer Registry data (1995-2009).5 Patients’ socioeconomic status (SES) and driving distance to the nearest pediatric cancer care center were included in the analysis. Hispanic children were found to be 3 times more likely to present with advanced disease than non-Hispanic White children. Although SES and distance to the nearest treatment center were not found to affect the melanoma stage at presentation, Hispanic ethnicity or being in the lowest SES quartile were correlated with a higher mortality risk.5
When considering specific subtypes of melanoma, acral lentiginous melanoma (ALM) is known to develop in patients with skin of color. A 2023 study by Holman et al6 reported that the percentage of melanomas that were ALMs ranged from 0.8% in non-Hispanic White individuals to 19.1% in Hispanic Black, American Indian/Alaska Native, and Asian/Pacific Islander individuals. However, ALM is rare in children. In a pooled cohort study with patient information retrieved from the nationwide Dutch Pathology Registry, only 1 child and 1 adolescent were found to have ALM across a total of 514 patients.7 We sought to analyze pediatric melanoma outcomes based on race and other barriers to appropriate care.
We conducted a search of the Surveillance, Epidemiology, and End Results (SEER) database from January 1995 to December 2016 for patients aged 21 years and younger with a primary melanoma diagnosis. The primary outcome was the 5-year survival rate. County-level SES variables were used to calculate a prosperity index. Kaplan-Meier analysis and Cox proportional hazards model were used to compare 5-year survival rates among the different racial/ethnic groups.
A sample of 2742 patients was identified during the study period and followed for 5 years. Eighty-two percent were White, 6% Hispanic, 2% Asian, 1% Black, and 5% classified as other/unknown race (data were missing for 4%). The cohort was predominantly female (61%). White patients were more likely to present with localized disease than any other race/ethnicity (83% vs 65% in Hispanic, 60% in Asian/Pacific Islander, and 45% in Black patients [P<.05]).
Black and Hispanic patients had the worst 5-year survival rates on bivariate analysis. On multivariate analysis, this finding remained significant for Hispanic patients when compared with White patients (hazard ratio, 2.37 [P<.05]). Increasing age, male sex, advanced stage at diagnosis, and failure to receive surgery were associated with increased odds of mortality.
Patients with regionalized and disseminated disease had increased odds of mortality (6.16 and 64.45, respectively; P<.05) compared with patients with localized disease. Socioeconomic status and urbanization were not found to influence 5-year survival rates.
Pediatric melanoma often presents a clinical challenge with special considerations. Pediatric-specific predisposing risk factors for melanoma and an atypical clinical presentation are some of the major concerns that necessitate a tailored approach to this malignancy, especially among different age groups, skin types, and racial and socioeconomic groups.5
Standard ABCDE criteria often are inadequate for accurate detection of pediatric melanomas. Initial lesions often manifest as raised, red, amelanotic lesions mimicking pyogenic granulomas. Lesions tend to be very small (<6 mm in diameter) and can be uniform in color, thereby making the melanoma more difficult to detect compared to the characteristic findings in adults.5 Bleeding or ulceration often can be a warning sign during physical examination.
With regard to incidence, pediatric melanoma is relatively rare. Since the 1970s, the incidence of pediatric melanoma has been increasing; however, a recent analysis of the SEER database showed a decreasing trend from 2000 to 2010.4
Our analysis of the SEER data showed an increased risk for pediatric melanoma in older adolescents. In addition, the incidence of pediatric melanoma was higher in females of all racial groups except Asian/Pacific Islander individuals. However, SES was not found to significantly influence the 5-year survival rate in pediatric melanoma.
White pediatric patients were more likely to present with localized disease compared with other races. Pediatric melanoma patients with regional disease had a 6-fold increase in mortality rate vs those with localized disease; those with disseminated disease had a 65-fold higher risk. Consistent with this, Black and Hispanic patients had the worst 5-year survival rates on bivariate analysis.
These findings suggest a relationship between race, melanoma spread, and disease severity. Patient education programs need to be directed specifically to minority groups to improve their knowledge on evolving skin lesions and sun protection practices. Physicians also need to have heightened suspicion and better knowledge of the unique traits of pediatric melanoma.5
Given the considerable influence these disparities can have on melanoma outcomes, further research is needed to characterize outcomes based on race and determine obstacles to appropriate care. Improved public outreach initiatives that accommodate specific cultural barriers (eg, language, traditional patterns of behavior) also are required to improve current circumstances.
- Arnold M, Singh D, Laversanne M, et al. Global burden of cutaneous melanoma in 2020 and projections to 2040. JAMA Dermatol. 2022;158:495-503.
- McCormack L, Hawryluk EB. Pediatric melanoma update. G Ital Dermatol Venereol. 2018;153:707-715.
- Saiyed FK, Hamilton EC, Austin MT. Pediatric melanoma: incidence, treatment, and prognosis. Pediatric Health Med Ther. 2017;8:39-45.
- Wojcik KY, Hawkins M, Anderson-Mellies A, et al. Melanoma survival by age group: population-based disparities for adolescent and young adult patients by stage, tumor thickness, and insurance type. J Am Acad Dermatol. 2023;88:831-840.
- Hamilton EC, Nguyen HT, Chang YC, et al. Health disparities influence childhood melanoma stage at diagnosis and outcome. J Pediatr. 2016;175:182-187.
- Holman DM, King JB, White A, et al. Acral lentiginous melanoma incidence by sex, race, ethnicity, and stage in the United States, 2010-2019. Prev Med. 2023;175:107692. doi:10.1016/j.ypmed.2023.107692
- El Sharouni MA, Rawson RV, Potter AJ, et al. Melanomas in children and adolescents: clinicopathologic features and survival outcomes. J Am Acad Dermatol. 2023;88:609-616. doi:10.1016/j.jaad.2022.08.067
Practice Points
- Pediatric melanoma is a unique clinical entity with a different clinical presentation than in adults.
- Thicker tumors and disseminated disease are associated with a worse prognosis, and these factors are more commonly seen in Black and Hispanic patients.
Short Interval Repeat Colonoscopy After Inadequate Bowel Preparation Is Low Among Veterans
Colorectal cancer (CRC) is the third-most diagnosed cancer after breast and lung cancer, and is the second leading cause of global cancer related deaths.1 In 2023 in the United States, > 150,000 individuals were diagnosed with CRC and 52,000 died.2
Colonoscopy is an effective CRC screening method and the lone method recommended for polyp surveillance. Inadequate bowel preparation (IBP) has been estimated to occur in about 6% to 26% of colonoscopies. 3,4 The prevalence varies based on a variety of comorbidities, including immobility, diabetes mellitus, neurologic disorders, and use of opioids, with more occurrences of IBP noted in older adult, non-English speaking, and male individuals.4-6
The quality of bowel preparation is integral to the effectiveness of screening and surveillance colonoscopies. IBP has been associated with missed adenomas and significantly lower adenoma detection rates.7-9 In particular, IBP is independently associated with an increased risk of CRC in the future.3 Accordingly, the US Multisociety Task Force recommends repeat colonoscopies for individuals with IBP within 1 year.10 Ensuring that these individuals receive repeat colonoscopies is an essential part of CRC prevention. The benefit of repeat colonoscopy after IBP is highlighted by a retrospective analysis from Fung and colleagues that showed 81% of repeat colonoscopies had adequate bowel preparation, with higher numbers of adenomas detected on repeat compared to initial colonoscopies.11
Given the impact of bowel preparation quality on the diagnostic capability of the colonoscopy, adherence to guidelines for repeat colonoscopies in cases of IBP is paramount for effective CRC prevention. This study aims to measure the frequency of repeat colonoscopy after IBP and the factors associated with adherence to recommendations.
METHODS
Individuals who underwent colonoscopy at the Minneapolis Veterans Affairs Medical Center (MVAMC) from January 1, 2016, to October 19, 2021, were identified to allow for 400 days of follow-up from the index colonoscopy to the data collection date. During the COVID-19 pandemic, the colonoscopy procedure capacity was reduced by 50% from June 1, 2020, to December 1, 2020, delaying nonurgent procedures, including screening and surveillance colonoscopies.
Individuals who underwent colonoscopy for CRC screening or polyp surveillance, or following a positive fecal immunohistochemistry test (FIT) or virtual computed tomography colonoscopy were included. Patients with colonoscopy indications for iron deficiency anemia, gastrointestinal bleeding, disease activity assessment of inflammatory bowel disease, abdominal pain, or changes in bowel movement pattern were excluded. IBP was defined as recording a Boston Bowel Preparation Scale (BBPS) score of < 6, or < 2 in any segment, or described as poor or inadequate using the Aronchick scale.
Age, sex, race, marital status, distance to MVAMC, smoking status, comorbidities, and concurrent medication use, including antiplatelet, anticoagulation, and prescription opiates at the time of index colonoscopy were obtained from the Veterans Health Administration (VHA) Corporate Data Warehouse (CDW) using structured query language processing of colonoscopy procedure notes to extract preparation scores and other procedure information. The CDW contains extracts from VHA clinical and administrative systems that contain complete clinical data from October 1999.12 Current smoking status was defined as any smoking activity at the time the questionnaire was administered during a routine clinic visit within 400 days from the index colonoscopy.
Only individuals who were recommended to have repeat colonoscopy within 1 year were included. The intervals of 365 days and 400 days (1 year + about 1 additional month) were used in the event that the individual had a delay in scheduling their 1-year repeat colonoscopy. For individuals who did not undergo a colonoscopy at MVAMC within 400 days, a manual chart review of all available records was performed to determine whether a colonoscopy was performed at a non-VA facility.
Patients received written instructions for bowel preparation 2 weeks prior to the procedure. The preparation included magnesium citrate and a split dose of 4 liters of polyethylene glycol. Patients were also advised to start a low-fiber diet 3 days prior to the procedure and a clear liquid diet the day before the procedure. Patients with a history of IBP or those undergoing procedures with anesthesia received an additional 2 liters for a total of 6 liters of polyethylene glycol.
Statistical analysis
Baseline characteristics were reported as mean (SD) or median and IQR for continuous variables and percentage for categorical variables. Individuals who returned for colonoscopy within 400 days were compared to those who did not identify factors associated with adherence to recommendations. The data on individuals who returned for colonoscopy within 400 days were also analyzed for additional minor delays in the timing of the repeat colonoscopy. Continuous data were compared using Mann-Whitney U tests. Categorical data were compared using X2 or Fisher exact tests. Missing data were imputed from the analyses. All analyses were performed using SAS JMP Pro version 16. P < .05 was considered statistically significant.
RESULTS
There were 18,241 total colonoscopies performed between January 1, 2016, to October 19, 2021, and 13,818 colonoscopies had indications for screening for colon cancer, positive FIT, virtual colonoscopy, or surveillance. Of the 10,466 unique patients there were 5369 patients for polyp surveillance, 4054 patients for CRC screening, and 1043 patients for positive FIT or virtual colonoscopy. Of these, 571 individuals (5.5%) had IBP. Repeat colonoscopy within 1 year was recommended for 485 individuals (84.9%) who were included in this study (153 CRC screenings and 46 positive FITs) but not for 86 individuals (15.1%) (Figure 1). Among included patients, the mean (SD) age was 66.6 (7.2) years, and the majority were male (460 [94.8%]) and White (435 [89.7%]) (Table). Two hundred and forty-three (50.1%) were married.
Adherence to Recommended Interval Colonoscopy
Of the 485 patients with IBP who were recommended for follow-up colonoscopy, 287 (59.2%) had a colonoscopy within 1 year, and 198 (40.8%) did not; 17 patients (13.5%) had repeat colonoscopy within 366 to 400 days. Five (1.0%) individuals had a repeat colonoscopy the next day, and 77 (15.9%) had a repeat colonoscopy within 7 days. One hundred and twentysix (26.0%) individuals underwent no repeat colonoscopy during the study period (Figure 2).
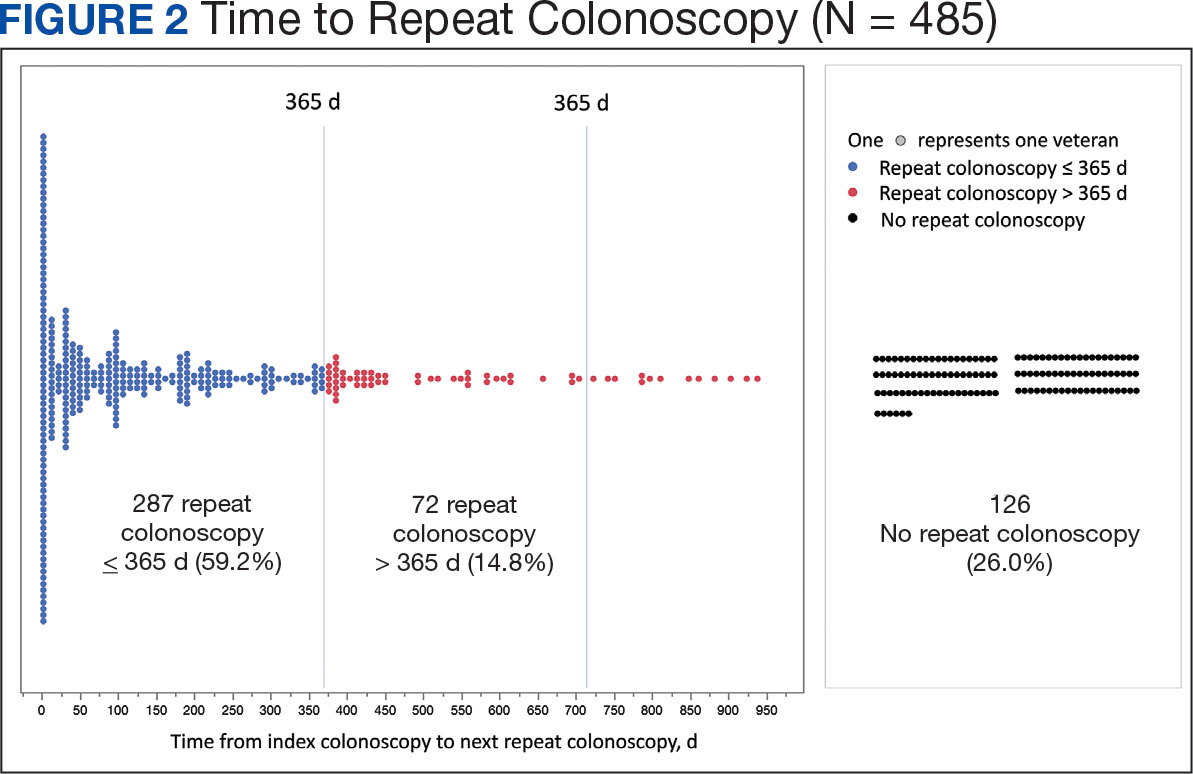
To account for the COVID-19 pandemic, the adherence rate of repeat colonoscopy within 1 year prepandemic (January 1, 2016, to December 1, 2018) was calculated along with the adherence rate postpandemic (January 1, 2019 to the end of the study). The rates were similar: 199 of 330 (60.3%) individuals prepandemic vs 88 of 155 (56.8%) individuals postpandemic (Figure 3).
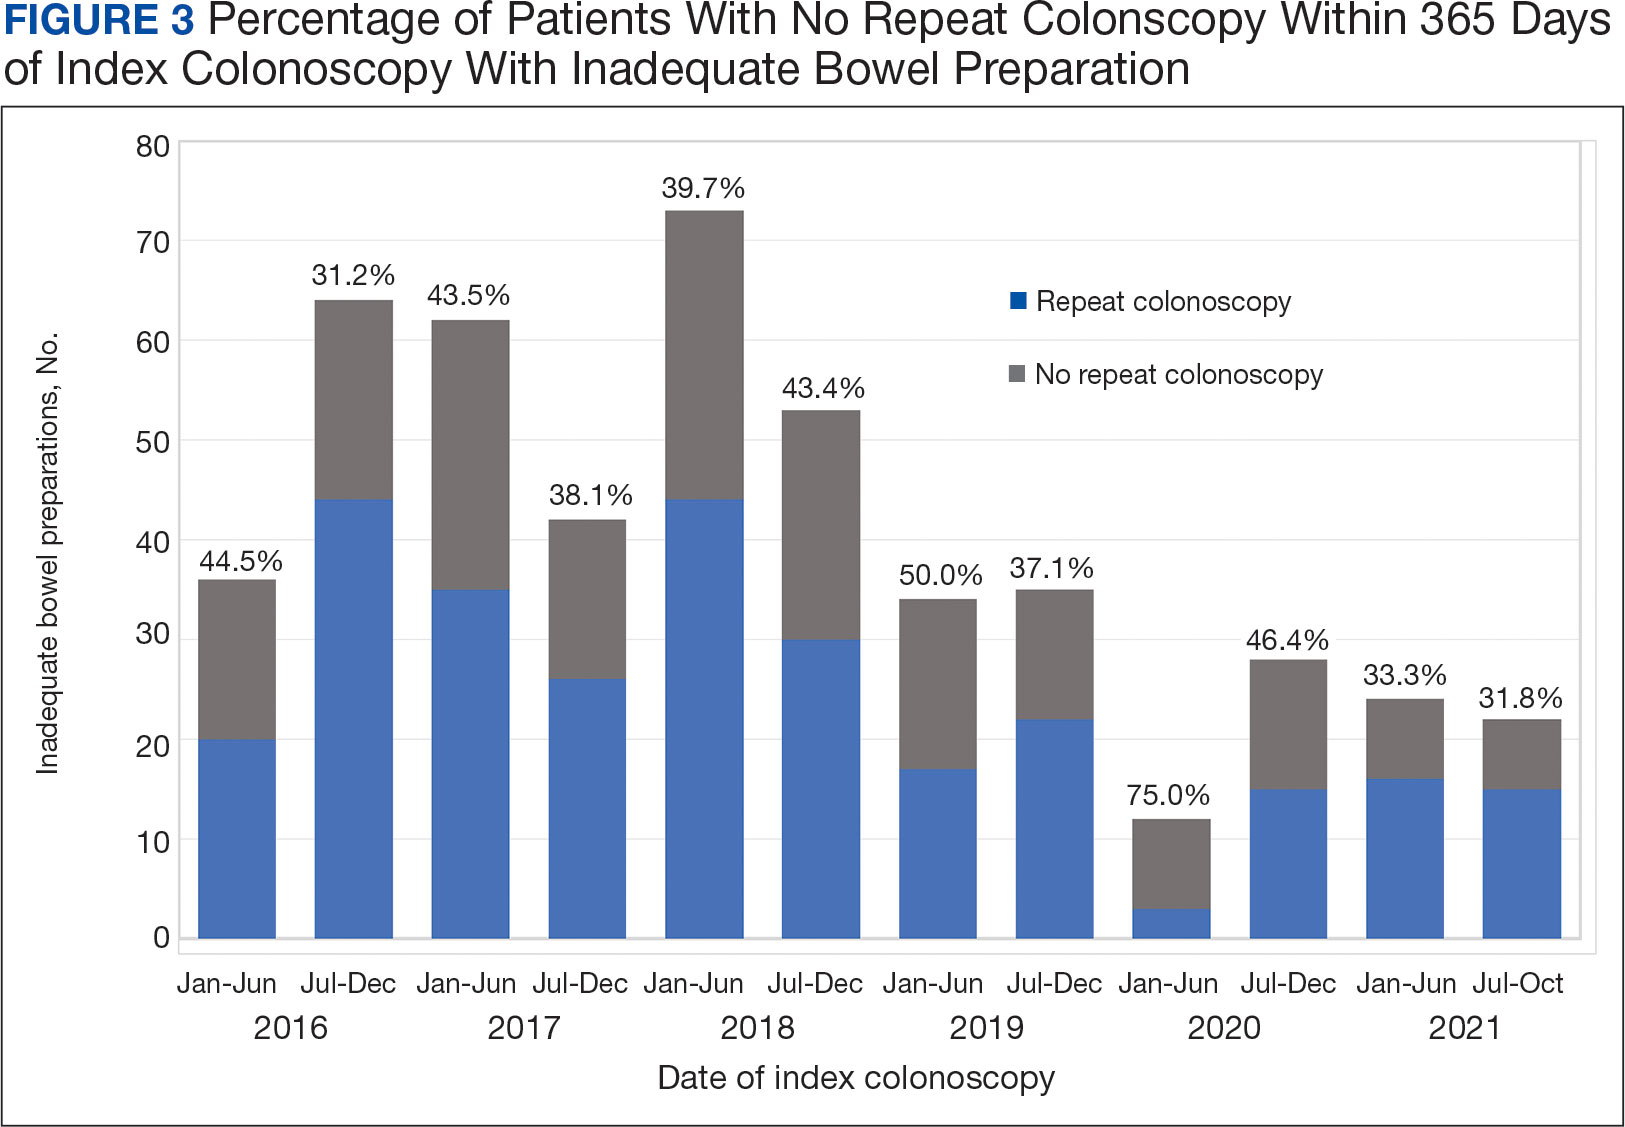
Significant Associations
Age, sex, and race were not associated with adherence to repeat colonoscopy within 1 year. Individuals living ≤ 40 miles from the endoscopy center were more likely to undergo a repeat colonoscopy within 1 year compared with those who lived > 40 miles away (61.7% vs 51.0%, P = .02). Current smoking status was associated with a lower rate of repeat colonoscopy within 1 year (25.8% vs 35.9%; P = .02). There were no differences with respect to inflammatory bowel disease diagnosis, mental health diagnosis, diabetes mellitus, cirrhosis, or medications used, including opioids, anticoagulation, and antiplatelet therapy.
Outcomes
Among individuals who had a repeat colonoscopy the day after the index colonoscopy, 53 of 56 individuals (94.6%) had adequate bowel preparation. Among individuals who had a repeat colonoscopy within 7 days, 70 of 77 (90.9%) had adequate bowel preparation. Of 287 individuals with a repeat colonoscopy within 1 year, 251 (87.5%) had adequate bowel preparation on the repeat colonoscopy. By 400 days after the index colonoscopy, 268 of 304 individuals (88.2%) had adequate bowel preparation.
In this study conducted at a large VA medical center, we found that 5.6% of individuals undergoing colonoscopies had IBP, a rate comparable to prior studies (6% to 26%).3,4 Only 59.2% of individuals underwent repeat colonoscopies within 1 year, as recommended after an index colonoscopy with IBP. Smoking and living longer distances (> 40 miles) from the endoscopy center were associated with a decreased adherence to the repeat colonoscopy recommendation.
Current guidelines recommend repeat colonoscopy for individuals with IBP within 1 year.10 In cases of IBP, the advanced adenoma miss rate is 36% upon repeat colonoscopy within 1 year.13 Despite the importance of a follow-up colonoscopy, clinician adherence with this recommendation remains low.10,14,15 However, in this study cohort, 485 of 571 individuals with IBP (84.9%) received recommendations for a repeat colonoscopy within 1 year. In the US, only 31.9% of 260,314 colonoscopies with IBP included recommendations for a follow-up colonoscopy within 1 year.14 This could be related to variations in endoscopist practice as well as patient risk factors for developing polyps, including family history of cancer and personal history of prior polyps. The findings of multiple polyps, high-risk adenomas, and cancer on the index colonoscopy also influences the endoscopist for repeat colonoscopy within 1 year.14
The timing for repeat colonoscopies within 1 year will be determined by the patients, clinicians, and available scheduling. In this study, the earlier repeat colonoscopies, especially those occurring the day after the index colonoscopy, had the highest success rate of adequate bowel preparation. In a prior study, repeating colonoscopies within the same day or the next day was also found to have a higher rate of adequate bowel preparation than repeat colonoscopies within 1 year (88.9% vs 83.5%).16
Ensuring the return of individuals with IBP for repeat colonoscopy is a challenging task. We identified that individuals who live further away from MVAMC and current smokers had a decreased probability of returning for a repeat colonoscopy. Toro and colleagues found a 68.7% return rate for a repeat colonoscopy within 1 year with individuals age ≥ 60 years, and patients who were White were less likely to proceed with a repeat colonoscopy within 1 year.17 The study did not provide data regarding smoking status or distance to the endoscopy center.17 In a prior study of veterans, the dual diagnosis of psychiatric disorders and substance abuse was associated with missed and canceled colonoscopy appointments.18 The distance to the endoscopy center has also been previously identified as a barrier to a colonoscopy following an abnormal FIT.19 Although not identified in this study due to the homogenous demographic profile, social determinants of health such as socioeconomic status, education, and insurance coverage are known barriers to cancer screening but were not evaluated in this study.20
Based on the identified risk factors, we have created a model for utilizing those risk factors to identify individuals at higher risk for noncompliance (ie, those who live further away from the endoscopy center or currently smoke). These individuals are proactively offered to use an intraprocedural bowel cleansing device to achieve adequate bowel preparation or priority rescheduling for a next-day colonoscopy.
Limitations
This study was a single-center study of the veteran population, which is predominantly White and male, thus limiting generalizability. The study is also limited by minimal available data on adenoma detection and colon cancer incidence on subsequent colonoscopies.
CONCLUSIONS
The rate of IBP was 5.5% in individuals undergoing colonoscopy for colon cancer screening, surveillance, positive FIT, or computed tomography colonography. Only 59.2% of those with IBP underwent the recommended repeat colonoscopy within 1 year. Smoking and distance to the endoscopy center were associated with a decreased adherence to the repeat colonoscopy recommendation. Additional efforts are needed to ensure that individuals with IBP return for timely repeat colonoscopy.
- Sung H, Ferlay J, Siegel RL, et al. Global Cancer Statistics 2020: GLOBOCAN Estimates of Incidence and Mortality Worldwide for 36 Cancers in 185 Countries. CA Cancer J Clin. 2021;71(3):209-249. doi:10.3322/caac.21660
- Siegel RL, Wagle NS, Cercek A, Smith RA, Jemal A. Colorectal cancer statistics, 2023. CA Cancer J Clin. 2023;73(3):233-254. doi:10.3322/caac.21772
- Atkin W, Wooldrage K, Brenner A, et al. Adenoma surveillance and colorectal cancer incidence: a retrospective, multicentre, cohort study. Lancet Oncol. 2017;18(6):823- 834. doi:10.1016/S1470-2045(17)30187-0
- Froehlich F, Wietlisbach V, Gonvers JJ, Burnand B, Vader JP. Impact of colonic cleansing on quality and diagnostic yield of colonoscopy: the European Panel of Appropriateness of Gastrointestinal Endoscopy European multicenter study. Gastrointest Endosc. 2005;61(3):378- 384. doi:10.1016/s0016-5107(04)02776-2
- Mahmood S, Farooqui SM, Madhoun MF. Predictors of inadequate bowel preparation for colonoscopy: a systematic review and meta-analysis. Eur J Gastroenterol Hepatol. 2018;30(8):819-826. doi:10.1097/MEG.0000000000001175
- ASGE Standards of Practice Committee, Saltzman JR, Cash BD, et al. Bowel preparation before colonoscopy. Gastrointest Endosc. 2015;81(4):781-794. doi:10.1016/j.gie.2014.09.048
- Clark BT, Protiva P, Nagar A, et al. Quantification of Adequate Bowel Preparation for Screening or Surveillance Colonoscopy in Men. Gastroenterology. 2016;150(2):396- e15. doi:10.1053/j.gastro.2015.09.041
- Sulz MC, Kröger A, Prakash M, Manser CN, Heinrich H, Misselwitz B. Meta-Analysis of the Effect of Bowel Preparation on Adenoma Detection: Early Adenomas Affected Stronger than Advanced Adenomas. PLoS One. 2016;11(6):e0154149. Published 2016 Jun 3. doi:10.1371/journal.pone.0154149
- Chokshi RV, Hovis CE, Hollander T, Early DS, Wang JS. Prevalence of missed adenomas in patients with inadequate bowel preparation on screening colonoscopy. Gastrointest Endosc. 2012;75(6):1197-1203. doi:10.1016/j.gie.2012.01.005
- Lieberman DA, Rex DK, Winawer SJ, Giardiello FM, Johnson DA, Levin TR. Guidelines for colonoscopy surveillance after screening and polypectomy: a consensus update by the US Multi-Society Task Force on Colorectal Cancer. Gastroenterology. 2012;143(3):844-857. doi:10.1053/j.gastro.2012.06.001
- Fung P, Syed A, Cole R, Farah K. Poor bowel prep: are you really going to come back within a year? Abstract presented at American Gastroenterological Association DDW 2021, May 21-23, 2021. doi:10.1016/S0016-5085(21)01204-X
- US Department of Veterans Affairs, VA Health Systems Research. Corporate data warehouse (CDW). Updated January 11, 2023. Accessed August 6, 2024. https://www.hsrd.research.va.gov/for_researchers/cdw.cfm
- Lebwohl B, Kastrinos F, Glick M, Rosenbaum AJ, Wang T, Neugut AI. The impact of suboptimal bowel preparation on adenoma miss rates and the factors associated with early repeat colonoscopy. Gastrointest Endosc. 2011;73(6):1207-1214. doi:10.1016/j.gie.2011.01.051
- Calderwood AH, Holub JL, Greenwald DA. Recommendations for follow-up interval after colonoscopy with inadequate bowel preparation in a national colonoscopy quality registry. Gastrointest Endosc. 2022;95(2):360-367. e2. doi:10.1016/j.gie.2021.09.027
- Latorre M, Roy A, Spyrou E, Garcia-Carrasquillo R, Rosenberg R, Lebwohl B. Adherence to guidelines after poor colonoscopy preparation: experience from a patient navigator program. Gastroenterology. 2016;151(1):P196. doi:10.1053/j.gastro.2016.05.027
- Bouquet E, Tomal J, Choksi Y. Next-day screening colonoscopy following inadequate bowel preparation may improve quality of preparation and adenoma detection in a veteran population. Am J Gastroenterol. 2020;115:S259. doi:10.14309/ajg.0000000000000853
- Toro B, Dawkins G, Friedenberg FK, Ehrlich AC. Risk factors for failure to return after a poor preparation colonoscopy: experience in a safety-net hospital, 255. Abstract presented at ACG October 2016. https://journals.lww.com/ajg/fulltext/2016/10001/risk_factors_for_failure_to_return_after_a_poor.255.aspx
- Partin MR, Gravely A, Gellad ZF, et al. Factors Associated With Missed and Cancelled Colonoscopy Appointments at Veterans Health Administration Facilities. Clin Gastroenterol Hepatol. 2016;14(2):259-267. doi:10.1016/j.cgh.2015.07.051
- Idos GE, Bonner JD, Haghighat S, et al. Bridging the Gap: Patient Navigation Increases Colonoscopy Follow-up After Abnormal FIT. Clin Transl Gastroenterol. 2021;12(2):e00307. doi:10.14309/ctg.0000000000000307
- Islami F, Baeker Bispo J, Lee H, et al. American Cancer Society’s report on the status of cancer disparities in the United States, 2023. CA Cancer J Clin. 2024;74(2):136- 166. doi:10.3322/caac.21812
Colorectal cancer (CRC) is the third-most diagnosed cancer after breast and lung cancer, and is the second leading cause of global cancer related deaths.1 In 2023 in the United States, > 150,000 individuals were diagnosed with CRC and 52,000 died.2
Colonoscopy is an effective CRC screening method and the lone method recommended for polyp surveillance. Inadequate bowel preparation (IBP) has been estimated to occur in about 6% to 26% of colonoscopies. 3,4 The prevalence varies based on a variety of comorbidities, including immobility, diabetes mellitus, neurologic disorders, and use of opioids, with more occurrences of IBP noted in older adult, non-English speaking, and male individuals.4-6
The quality of bowel preparation is integral to the effectiveness of screening and surveillance colonoscopies. IBP has been associated with missed adenomas and significantly lower adenoma detection rates.7-9 In particular, IBP is independently associated with an increased risk of CRC in the future.3 Accordingly, the US Multisociety Task Force recommends repeat colonoscopies for individuals with IBP within 1 year.10 Ensuring that these individuals receive repeat colonoscopies is an essential part of CRC prevention. The benefit of repeat colonoscopy after IBP is highlighted by a retrospective analysis from Fung and colleagues that showed 81% of repeat colonoscopies had adequate bowel preparation, with higher numbers of adenomas detected on repeat compared to initial colonoscopies.11
Given the impact of bowel preparation quality on the diagnostic capability of the colonoscopy, adherence to guidelines for repeat colonoscopies in cases of IBP is paramount for effective CRC prevention. This study aims to measure the frequency of repeat colonoscopy after IBP and the factors associated with adherence to recommendations.
METHODS
Individuals who underwent colonoscopy at the Minneapolis Veterans Affairs Medical Center (MVAMC) from January 1, 2016, to October 19, 2021, were identified to allow for 400 days of follow-up from the index colonoscopy to the data collection date. During the COVID-19 pandemic, the colonoscopy procedure capacity was reduced by 50% from June 1, 2020, to December 1, 2020, delaying nonurgent procedures, including screening and surveillance colonoscopies.
Individuals who underwent colonoscopy for CRC screening or polyp surveillance, or following a positive fecal immunohistochemistry test (FIT) or virtual computed tomography colonoscopy were included. Patients with colonoscopy indications for iron deficiency anemia, gastrointestinal bleeding, disease activity assessment of inflammatory bowel disease, abdominal pain, or changes in bowel movement pattern were excluded. IBP was defined as recording a Boston Bowel Preparation Scale (BBPS) score of < 6, or < 2 in any segment, or described as poor or inadequate using the Aronchick scale.
Age, sex, race, marital status, distance to MVAMC, smoking status, comorbidities, and concurrent medication use, including antiplatelet, anticoagulation, and prescription opiates at the time of index colonoscopy were obtained from the Veterans Health Administration (VHA) Corporate Data Warehouse (CDW) using structured query language processing of colonoscopy procedure notes to extract preparation scores and other procedure information. The CDW contains extracts from VHA clinical and administrative systems that contain complete clinical data from October 1999.12 Current smoking status was defined as any smoking activity at the time the questionnaire was administered during a routine clinic visit within 400 days from the index colonoscopy.
Only individuals who were recommended to have repeat colonoscopy within 1 year were included. The intervals of 365 days and 400 days (1 year + about 1 additional month) were used in the event that the individual had a delay in scheduling their 1-year repeat colonoscopy. For individuals who did not undergo a colonoscopy at MVAMC within 400 days, a manual chart review of all available records was performed to determine whether a colonoscopy was performed at a non-VA facility.
Patients received written instructions for bowel preparation 2 weeks prior to the procedure. The preparation included magnesium citrate and a split dose of 4 liters of polyethylene glycol. Patients were also advised to start a low-fiber diet 3 days prior to the procedure and a clear liquid diet the day before the procedure. Patients with a history of IBP or those undergoing procedures with anesthesia received an additional 2 liters for a total of 6 liters of polyethylene glycol.
Statistical analysis
Baseline characteristics were reported as mean (SD) or median and IQR for continuous variables and percentage for categorical variables. Individuals who returned for colonoscopy within 400 days were compared to those who did not identify factors associated with adherence to recommendations. The data on individuals who returned for colonoscopy within 400 days were also analyzed for additional minor delays in the timing of the repeat colonoscopy. Continuous data were compared using Mann-Whitney U tests. Categorical data were compared using X2 or Fisher exact tests. Missing data were imputed from the analyses. All analyses were performed using SAS JMP Pro version 16. P < .05 was considered statistically significant.
RESULTS
There were 18,241 total colonoscopies performed between January 1, 2016, to October 19, 2021, and 13,818 colonoscopies had indications for screening for colon cancer, positive FIT, virtual colonoscopy, or surveillance. Of the 10,466 unique patients there were 5369 patients for polyp surveillance, 4054 patients for CRC screening, and 1043 patients for positive FIT or virtual colonoscopy. Of these, 571 individuals (5.5%) had IBP. Repeat colonoscopy within 1 year was recommended for 485 individuals (84.9%) who were included in this study (153 CRC screenings and 46 positive FITs) but not for 86 individuals (15.1%) (Figure 1). Among included patients, the mean (SD) age was 66.6 (7.2) years, and the majority were male (460 [94.8%]) and White (435 [89.7%]) (Table). Two hundred and forty-three (50.1%) were married.
Adherence to Recommended Interval Colonoscopy
Of the 485 patients with IBP who were recommended for follow-up colonoscopy, 287 (59.2%) had a colonoscopy within 1 year, and 198 (40.8%) did not; 17 patients (13.5%) had repeat colonoscopy within 366 to 400 days. Five (1.0%) individuals had a repeat colonoscopy the next day, and 77 (15.9%) had a repeat colonoscopy within 7 days. One hundred and twentysix (26.0%) individuals underwent no repeat colonoscopy during the study period (Figure 2).
To account for the COVID-19 pandemic, the adherence rate of repeat colonoscopy within 1 year prepandemic (January 1, 2016, to December 1, 2018) was calculated along with the adherence rate postpandemic (January 1, 2019 to the end of the study). The rates were similar: 199 of 330 (60.3%) individuals prepandemic vs 88 of 155 (56.8%) individuals postpandemic (Figure 3).
Significant Associations
Age, sex, and race were not associated with adherence to repeat colonoscopy within 1 year. Individuals living ≤ 40 miles from the endoscopy center were more likely to undergo a repeat colonoscopy within 1 year compared with those who lived > 40 miles away (61.7% vs 51.0%, P = .02). Current smoking status was associated with a lower rate of repeat colonoscopy within 1 year (25.8% vs 35.9%; P = .02). There were no differences with respect to inflammatory bowel disease diagnosis, mental health diagnosis, diabetes mellitus, cirrhosis, or medications used, including opioids, anticoagulation, and antiplatelet therapy.
Outcomes
Among individuals who had a repeat colonoscopy the day after the index colonoscopy, 53 of 56 individuals (94.6%) had adequate bowel preparation. Among individuals who had a repeat colonoscopy within 7 days, 70 of 77 (90.9%) had adequate bowel preparation. Of 287 individuals with a repeat colonoscopy within 1 year, 251 (87.5%) had adequate bowel preparation on the repeat colonoscopy. By 400 days after the index colonoscopy, 268 of 304 individuals (88.2%) had adequate bowel preparation.
In this study conducted at a large VA medical center, we found that 5.6% of individuals undergoing colonoscopies had IBP, a rate comparable to prior studies (6% to 26%).3,4 Only 59.2% of individuals underwent repeat colonoscopies within 1 year, as recommended after an index colonoscopy with IBP. Smoking and living longer distances (> 40 miles) from the endoscopy center were associated with a decreased adherence to the repeat colonoscopy recommendation.
Current guidelines recommend repeat colonoscopy for individuals with IBP within 1 year.10 In cases of IBP, the advanced adenoma miss rate is 36% upon repeat colonoscopy within 1 year.13 Despite the importance of a follow-up colonoscopy, clinician adherence with this recommendation remains low.10,14,15 However, in this study cohort, 485 of 571 individuals with IBP (84.9%) received recommendations for a repeat colonoscopy within 1 year. In the US, only 31.9% of 260,314 colonoscopies with IBP included recommendations for a follow-up colonoscopy within 1 year.14 This could be related to variations in endoscopist practice as well as patient risk factors for developing polyps, including family history of cancer and personal history of prior polyps. The findings of multiple polyps, high-risk adenomas, and cancer on the index colonoscopy also influences the endoscopist for repeat colonoscopy within 1 year.14
The timing for repeat colonoscopies within 1 year will be determined by the patients, clinicians, and available scheduling. In this study, the earlier repeat colonoscopies, especially those occurring the day after the index colonoscopy, had the highest success rate of adequate bowel preparation. In a prior study, repeating colonoscopies within the same day or the next day was also found to have a higher rate of adequate bowel preparation than repeat colonoscopies within 1 year (88.9% vs 83.5%).16
Ensuring the return of individuals with IBP for repeat colonoscopy is a challenging task. We identified that individuals who live further away from MVAMC and current smokers had a decreased probability of returning for a repeat colonoscopy. Toro and colleagues found a 68.7% return rate for a repeat colonoscopy within 1 year with individuals age ≥ 60 years, and patients who were White were less likely to proceed with a repeat colonoscopy within 1 year.17 The study did not provide data regarding smoking status or distance to the endoscopy center.17 In a prior study of veterans, the dual diagnosis of psychiatric disorders and substance abuse was associated with missed and canceled colonoscopy appointments.18 The distance to the endoscopy center has also been previously identified as a barrier to a colonoscopy following an abnormal FIT.19 Although not identified in this study due to the homogenous demographic profile, social determinants of health such as socioeconomic status, education, and insurance coverage are known barriers to cancer screening but were not evaluated in this study.20
Based on the identified risk factors, we have created a model for utilizing those risk factors to identify individuals at higher risk for noncompliance (ie, those who live further away from the endoscopy center or currently smoke). These individuals are proactively offered to use an intraprocedural bowel cleansing device to achieve adequate bowel preparation or priority rescheduling for a next-day colonoscopy.
Limitations
This study was a single-center study of the veteran population, which is predominantly White and male, thus limiting generalizability. The study is also limited by minimal available data on adenoma detection and colon cancer incidence on subsequent colonoscopies.
CONCLUSIONS
The rate of IBP was 5.5% in individuals undergoing colonoscopy for colon cancer screening, surveillance, positive FIT, or computed tomography colonography. Only 59.2% of those with IBP underwent the recommended repeat colonoscopy within 1 year. Smoking and distance to the endoscopy center were associated with a decreased adherence to the repeat colonoscopy recommendation. Additional efforts are needed to ensure that individuals with IBP return for timely repeat colonoscopy.
- Sung H, Ferlay J, Siegel RL, et al. Global Cancer Statistics 2020: GLOBOCAN Estimates of Incidence and Mortality Worldwide for 36 Cancers in 185 Countries. CA Cancer J Clin. 2021;71(3):209-249. doi:10.3322/caac.21660
- Siegel RL, Wagle NS, Cercek A, Smith RA, Jemal A. Colorectal cancer statistics, 2023. CA Cancer J Clin. 2023;73(3):233-254. doi:10.3322/caac.21772
- Atkin W, Wooldrage K, Brenner A, et al. Adenoma surveillance and colorectal cancer incidence: a retrospective, multicentre, cohort study. Lancet Oncol. 2017;18(6):823- 834. doi:10.1016/S1470-2045(17)30187-0
- Froehlich F, Wietlisbach V, Gonvers JJ, Burnand B, Vader JP. Impact of colonic cleansing on quality and diagnostic yield of colonoscopy: the European Panel of Appropriateness of Gastrointestinal Endoscopy European multicenter study. Gastrointest Endosc. 2005;61(3):378- 384. doi:10.1016/s0016-5107(04)02776-2
- Mahmood S, Farooqui SM, Madhoun MF. Predictors of inadequate bowel preparation for colonoscopy: a systematic review and meta-analysis. Eur J Gastroenterol Hepatol. 2018;30(8):819-826. doi:10.1097/MEG.0000000000001175
- ASGE Standards of Practice Committee, Saltzman JR, Cash BD, et al. Bowel preparation before colonoscopy. Gastrointest Endosc. 2015;81(4):781-794. doi:10.1016/j.gie.2014.09.048
- Clark BT, Protiva P, Nagar A, et al. Quantification of Adequate Bowel Preparation for Screening or Surveillance Colonoscopy in Men. Gastroenterology. 2016;150(2):396- e15. doi:10.1053/j.gastro.2015.09.041
- Sulz MC, Kröger A, Prakash M, Manser CN, Heinrich H, Misselwitz B. Meta-Analysis of the Effect of Bowel Preparation on Adenoma Detection: Early Adenomas Affected Stronger than Advanced Adenomas. PLoS One. 2016;11(6):e0154149. Published 2016 Jun 3. doi:10.1371/journal.pone.0154149
- Chokshi RV, Hovis CE, Hollander T, Early DS, Wang JS. Prevalence of missed adenomas in patients with inadequate bowel preparation on screening colonoscopy. Gastrointest Endosc. 2012;75(6):1197-1203. doi:10.1016/j.gie.2012.01.005
- Lieberman DA, Rex DK, Winawer SJ, Giardiello FM, Johnson DA, Levin TR. Guidelines for colonoscopy surveillance after screening and polypectomy: a consensus update by the US Multi-Society Task Force on Colorectal Cancer. Gastroenterology. 2012;143(3):844-857. doi:10.1053/j.gastro.2012.06.001
- Fung P, Syed A, Cole R, Farah K. Poor bowel prep: are you really going to come back within a year? Abstract presented at American Gastroenterological Association DDW 2021, May 21-23, 2021. doi:10.1016/S0016-5085(21)01204-X
- US Department of Veterans Affairs, VA Health Systems Research. Corporate data warehouse (CDW). Updated January 11, 2023. Accessed August 6, 2024. https://www.hsrd.research.va.gov/for_researchers/cdw.cfm
- Lebwohl B, Kastrinos F, Glick M, Rosenbaum AJ, Wang T, Neugut AI. The impact of suboptimal bowel preparation on adenoma miss rates and the factors associated with early repeat colonoscopy. Gastrointest Endosc. 2011;73(6):1207-1214. doi:10.1016/j.gie.2011.01.051
- Calderwood AH, Holub JL, Greenwald DA. Recommendations for follow-up interval after colonoscopy with inadequate bowel preparation in a national colonoscopy quality registry. Gastrointest Endosc. 2022;95(2):360-367. e2. doi:10.1016/j.gie.2021.09.027
- Latorre M, Roy A, Spyrou E, Garcia-Carrasquillo R, Rosenberg R, Lebwohl B. Adherence to guidelines after poor colonoscopy preparation: experience from a patient navigator program. Gastroenterology. 2016;151(1):P196. doi:10.1053/j.gastro.2016.05.027
- Bouquet E, Tomal J, Choksi Y. Next-day screening colonoscopy following inadequate bowel preparation may improve quality of preparation and adenoma detection in a veteran population. Am J Gastroenterol. 2020;115:S259. doi:10.14309/ajg.0000000000000853
- Toro B, Dawkins G, Friedenberg FK, Ehrlich AC. Risk factors for failure to return after a poor preparation colonoscopy: experience in a safety-net hospital, 255. Abstract presented at ACG October 2016. https://journals.lww.com/ajg/fulltext/2016/10001/risk_factors_for_failure_to_return_after_a_poor.255.aspx
- Partin MR, Gravely A, Gellad ZF, et al. Factors Associated With Missed and Cancelled Colonoscopy Appointments at Veterans Health Administration Facilities. Clin Gastroenterol Hepatol. 2016;14(2):259-267. doi:10.1016/j.cgh.2015.07.051
- Idos GE, Bonner JD, Haghighat S, et al. Bridging the Gap: Patient Navigation Increases Colonoscopy Follow-up After Abnormal FIT. Clin Transl Gastroenterol. 2021;12(2):e00307. doi:10.14309/ctg.0000000000000307
- Islami F, Baeker Bispo J, Lee H, et al. American Cancer Society’s report on the status of cancer disparities in the United States, 2023. CA Cancer J Clin. 2024;74(2):136- 166. doi:10.3322/caac.21812
Establishing a Just Culture: Implications for the Veterans Health Administration Journey to High Reliability
Medical errors are a persistent problem and leading cause of preventable death in the United States. There is considerable momentum behind the idea that implementation of a just culture is foundational to detecting and learning from errors in pursuit of zero patient harm.1-6 Just culture is a framework that fosters an environment of trust within health care organizations, aiming to achieve fair outcomes for those involved in incidents or near misses. It emphasizes openness, accountability, and learning, prioritizing the repair of harm and systemic improvement over assigning blame.7
A just culture mindset reflects a significant shift in thinking that moves from the tendency to blame and punish others toward a focus on organizational learning and continued process improvement.8,9 This systemic shift in fundamental thinking transforms how leaders approach staff errors and how they are addressed.10 In essence, just culture reflects an ethos centered on openness, a deep appreciation of human fallibility, and shared accountability at both the individual and organizational levels.
Organizational learning and innovation are stifled in the absence of a just culture, and there is a tendency for employees to avoid disclosing their own errors as well as those of their colleagues.11 The transformation to a just culture is often slowed or disrupted by personal, systemic, and cultural barriers.12 It is imperative that all executive, service line, and frontline managers recognize and execute their distinct responsibilities while adjudicating the appropriate course of action in the aftermath of adverse events or near misses. This requires a nuanced understanding of the factors that contribute to errors at the individual and organizational levels to ensure an appropriate response.
The Veterans Health Administration (VHA) is orchestrating an enterprise transformation to develop into a high reliability organization (HRO). This began with a single-site test in 2016, which demonstrated successful results in patient safety culture, patient safety event reporting, and patient safety outcomes.13 In 2019, the VHA formally launched its enterprise-wide HRO journey in 18 hospital facilities, followed by successive waves of 67 and 54 facilities in 2021 and 2022, respectively. The VHA journey to transform into an HRO aligns with 3 pillars, 5 principles, and 7 values. The VHA has emphasized the importance of just culture as a foundational element of the HRO framework, specifically under the pillar of leadership. To promote leadership engagement, the VHA has employed an array of approaches that include education, leader coaching, and change management strategies. Given the diversity among VHA facilities, each with local cultures and histories, some sites have more readily implemented a just culture than others.14 A deeper exploration into potential obstacles, particularly concerning leadership engagement, could be instrumental for formulating strategies that further establish a just culture across the VHA.15
There is a paucity of empirical research regarding factors that facilitate and/or impede the implementation of a just culture in health care settings.16,17 Likert scale surveys, such as the Patient Safety Culture Module for the VHA All Employee Survey and its predecessor, the Patient Safety Culture Survey, have been used to assess culture and climate.18 However, qualitative evaluations directly assessing the lived experiences of those trying to implement a just culture provide additional depth and context that can help identify specific factors that support or impede becoming an HRO. The purpose of this study was to increase understanding of factors that influence the establishment and sustainment of a just culture and to identify specific methods for improving the implementation of just culture principles and practices aligned with HRO.
METHODS
This qualitative study explored facilitators and barriers to establishing and sustaining a just culture as experienced across a subset of VHA facilities by HRO leads or staff assigned with the primary responsibilities of supporting facility-level HRO transformation. HRO leads are assigned responsibility for supporting executive leadership in planning, coordinating, implementing, and monitoring activities to ensure effective high reliability efforts, including focused efforts to establish a robust patient safety program, a culture of safety, and a culture of continuous process improvement.
Virtual focus group discussions held via Microsoft Teams generated in-depth, diverse perspectives from participants across 16 VHA facilities. Qualitative research and evaluation methods provide an enhanced depth of understanding and allow the emergence of detailed data.19 A qualitative grounded theory approach elicits complex, multifaceted phenomena that cannot be appreciated solely by numeric data.20 Grounded theory was selected to limit preconceived notions and provide a more systematic analysis, including open, axial, and thematic coding. Such methods afford opportunities to adapt to unplanned follow-up questions and thus provide a flexible approach to generate new ideas and concepts.21 Additionally, qualitative methods help overcome the tendencies of respondents to agree rather than disagree when presented with Likert-style scales, which tend to skew responses toward the positive.22
Participants must have been assigned as an HRO lead for ≥ 6 months at the same facility. Potential participants were identified through purposive sampling, considering their leadership roles in HRO and experience with just culture implementation, the size and complexity of their facility, and geographic distribution. Invitations explaining the study and encouraging voluntary participation to participate were emailed. Of 37 HRO leads invited to participate in the study, 16 agreed to participate and attended 1 of 3 hour-long focus group sessions. One session was rescheduled due to limited attendance. Participants represented a mix of VHA sites in terms of geography, facility size, and complexity.
Focus Group Procedures
Demographic data were collected prior to sessions via an online form to better understand the participant population, including facility complexity level, length of time in HRO lead role, clinical background, and facility level just culture training. Each session was led by an experienced focus group facilitator (CV) who was not directly involved with the overall HRO implementation to establish a neutral perspective. Each session was attended by 4 to 7 participants and 2 observers who took notes. The sessions were recorded and included automated transcriptions, which were edited for accuracy.
Focus group sessions began with a brief introduction and an opportunity for participants to ask questions. Participants were then asked a series of open-ended questions to elicit responses regardingfacilitators, barriers, and leadership support needed for implementing just culture. The questions were part of a facilitator guide that included an introductory script and discussion prompts to ensure consistency across focus groups.
Facilitators were defined as factors that increase the likelihood of establishing or sustaining a just culture. Barriers were defined as factors that decrease or inhibit the likelihood of establishing or sustaining just culture. The focus group facilitator encouraged all participants to share their views and provided clarification if needed, as well as prompts and examples where appropriate, but primarily sought to elicit responses to the questions.
Institutional review board review and approval were not required for this quality improvement initiative. The project adhered to ethical standards of research, including asking participants for verbal consent and preserving their confidentiality. Participation was voluntary, and prior to the focus group sessions, participants were provided information explaining the study’s purpose, procedures, and their rights. Participant identities were kept confidential, and all data were anonymized during the analysis phase. Pseudonyms or identifiers were used during data transcription to protect participant identity. All data, including recordings and transcriptions, were stored on password-protected devices accessible only to the research team. Any identifiable information was removed during data analysis to ensure confidentiality.
Analysis
Focus group recordings were transcribed verbatim, capturing all verbal interactions and nonverbal cues that may contribute to understanding the participants' perspectives. Thematic analysis was used to analyze the qualitative data from the focus group discussions.23 The transcribed data were organized, coded, and analyzed using ATLAS.ti 23 qualitative data software to identify key themes and patterns.
Results
The themes identified include the 5 facilitators, barriers, and recommendations most frequently mentioned by HRO leads across focus group sessions. The nature of each theme is described, along with commonly mentioned examples and direct quotes from participants that illustrate our understanding of their perspectives.
Facilitators
Training and coaching (26 responses). The availability of training around the Just Culture Decision Support Tool (DST) was cited as a practical aid in guiding leaders through complex just culture decisions to ensure consistency and fairness. Additionally, an executive leadership team that served as champions for just culture principles played a vital role in promoting and sustaining the approach: “Training them on the roll-out of the decision support tool with supervisors at all levels, and education for just culture and making it part of our safety forum has helped for the last 4 months.” “Having some regular training and share-out cadences embedded within the schedule as well as dynamic directors and well-trained executive leadership team (ELT) for support has been a facilitator.”
Increased transparency (16 responses). Participants consistently highlighted the importance of leadership transparency as a key facilitator for implementing just culture. Open and honest communication from top-level executives fostered an environment of trust and accountability. Approachable and physically present leadership was seen as essential for creating a culture where employees felt comfortable reporting errors and concerns without fear of retaliation: “They’re surprisingly honest with themselves about what we can do, what we cannot do, and they set the expectations exactly at that.”
Approachable leadership (15 responses). Participants frequently mentioned the importance of having dynamic leadership spearheading the implementation of just culture and leading by example. Having a leadership team that accepts accountability and reinforces consistency in the manner that near misses or mistakes are addressed is paramount to promoting the principles of just culture and increasing psychological safety: “We do have very approachable leadership, which I know is hard if you’re trying to implement that nationwide, it’s hard to implement approachability. But I do think that people raise their concerns, and they’ll stop them in the hallway and ask them questions. So, in terms of comfort level with the executive leadership, I do think that’s high, which would promote psychological safety.”
Feedback loops and follow through (13 responses). Participants emphasized the importance of taking concrete actions to address concerns and improve processes. Regular check-ins with supervisors to discuss matters related to just culture provided a structured opportunity for addressing issues and reinforcing the importance of the approach: “One thing that we’ve really focused on is not only identifying mistakes, but [taking] ownership. We continue to track it until … it’s completed and then a process of how to communicate that back and really using closed loop communication with the staff and letting them know.”
Forums and town halls (10 responses). These platforms created feedback loops that were seen as invaluable tools for sharing near misses, celebrating successes, and promoting open dialogue. Forums and town halls cultivated a culture of continuous improvement and trust: “We’ll celebrate catches, a safety story is inside that catch. So, if we celebrate the change, people feel safer to speak up.” “Truthfully, we’ve had a great relationship since establishing our safety forums and just value open lines of communication.”
Barriers
Inadequate training (30 responses). Insufficient engagement during training—limited bandwidth and availability to attend and actively participate in training—was perceived as detrimental to creating awareness and buy-in from staff, supervisors, and leadership, thereby hindering successful integration of just culture principles. Participants also identified too many conflicting priorities from VHA leadership, which contributes to training and information fatigue among staff and supervisors. “Our biggest barrier is just so many different competing priorities going on. We have so much that we’re asking people to do.” “One hundred percent training is feeling more like a ticked box than actually yielding results, I have a very hard time getting staff engaged.”
Inconsistency between executive leaders and middle managers (28 responses). A lack of consistency in the commitment to and enactment of just culture principles among leaders poses a challenge. Participants gave several examples of inconsistencies in messaging and reinforcement of just culture principles, leading to confusion among staff and hindering adoption. Likewise, the absence of standardized procedures for implementing just culture created variability: “The director coming in and trying to change things, it put a lot of resistance, we struggle with getting the other ELT members on board … some of the messages that come out at times can feel more punitive.”
Middle management resistance (22 responses). In some instances, participants reported middle managers exhibiting attitudes and behaviors that undermined the application of just culture principles and effectiveness. Such attitudes and behaviors were attributed to a lack of adequate training, coaching, and awareness. Other perceived contributions included fear of failure and a desire to distance oneself from staff who have made mistakes: “As soon as someone makes an error, they go straight to suspend them, and that’s the disconnect right there.” “There’s almost a level of working in the opposite direction in some of the mid-management.”
Cultural misalignment (18 responses). The existing culture of distancing oneself from mistakes presented a significant barrier to the adoption of just culture because it clashed with the principles of open reporting and accountability. Staff underreported errors or framed them in a way that minimized personal responsibility, thereby making it more essential to put in the necessary and difficult work to learn from mistakes: “One, you’re going to get in trouble. There’s going to be more work added to you or something of that nature."
Lack of accountability for opposition(17 responses). Participants noted a clear lack of accountability for those who opposed or showed resistance to just culture, which allowed resistance to persist without consequences. In many instances, leaders were described as having overlooked repeated instances of unjust attitudes and behaviors (eg, inappropriate blame or punishment), which allowed those practices to continue. “Executive leadership is standing on the hill and saying we’re a just culture and we do everything correctly, and staff has the expectation that they’re going to be treated with just culture and then the middle management is setting that on fire, then we show them that that’s not just culture, and they continue to have those poor behaviors, but there’s a lack of accountability.”
Limited bandwidth and lack of coordination (14 responses). HRO leads often faced role-specific constraints in having adequate time and authority to coordinate efforts to implement or sustain just culture. This includes challenges with coordination across organizational levels (eg, between the hospital and regional Veterans Integrated Service Network [VISN] management levels) and across departments within the hospital (eg, between human resources and service lines or units). “Our VISN human resources is completely detached. They’ll not cooperate with these efforts, which is hard.” “There’s not enough bandwidth to actually support, I’m just 1 person.” “[There’s] all these mandated trainings of 8 hours when we’re already fatigued, short-staffed, taking 3 other HRO classes.”
Recommendations
Training improvements (24 responses). HRO leads recommended that comprehensive training programs be developed and implemented for staff, supervisors, and leadership to increase awareness and understanding of just culture principles. These training initiatives should focus on fostering a shared understanding of the core tenets of just culture, the importance of error reporting, and the processes involved in fair and consistent decision making (eg, training simulations on use of the Just Culture DST). “We’ve really never had any formal training on the decision support tool. I hope that what’s coming out for next year. We’ll have some more formal training for the tool because I think it would be great to really have our leadership and our supervisors and our managers use that tool.” “We can give a more directed and intentional training to leadership on the 4 foundational practices and what it means to implement those and what it means to utilize that behavioral component of HRO.”
Clear and consistent procedures toincrease accountability (22 responses). To promote a culture of accountability and consistency in the application of just culture principles, organizations should establish clear mechanisms for reporting, investigating, and addressing incidents. Standardized procedures and DSTs can aid in ensuring that responses to errors are equitable and align with just culture principles: “I recommend accountability; if it’s clearly evidenced that you’re not toeing the just culture line, then we need to be able to do something about it and not just finger wag.” “[We need to have] a templated way to approach just culture implementation. The decision support tool is great, I absolutely love having the resources and being able to find a lot of clinical examples and discussion tools like that. But when it comes down to it, not having that kind of official thing to fall back on it can be a little bit rough.”
Additional coaching and consultationsupport (15 responses). To support supervisors in effectively implementing just culture within their teams, participants recommended that organizations provide ongoing coaching and mentorship opportunities. Additionally, third-party consultants with expertise in just culture were described as offering valuable guidance, particularly in cases where internal staff resources or HRO lead bandwidth may be limited. “There are so many consulting agencies with HRO that have been contracted to do different projects, but maybe that can help with an educational program.” “I want to see my executive leadership coach the supervisors up right and then allow them to do one-on-ones and facilitate and empower the frontline staff, and it’s just a good way of transparency and communication.”
Improved leadership sponsorship (15 responses). Participants noted that leadership buy-in is crucial for the successful implementation of just culture. Facilities should actively engage and educate leadership teams on the benefits of just culture and how it aligns with broader patient safety and organizational goals. Leaders should be visible and active champions of its principles, supporting change in their daily engagements with staff. “ELT support is absolutely necessary. Why? Because they will make it important to those in their service lines. They will make it important to those supervisors and managers. If it’s not important to that ELT member, then it’s not going to be important to that manager or that supervisor.”
Improved collaboration with patient safety and human resources (6 responses). Collaborative efforts with patient safety and human resources departments were seen as instrumental in supporting just culture, emphasizing its importance, and effectively addressing issues. Coordinating with these departments specifically contributes to consistent reinforcement and expands the bandwidth of HRO leads. These departments play integral roles in supporting just culture through effective policies, procedures, and communication. “I think it would be really helpful to have common language between what human resources teaches and what is in our decision support tool.”
DISCUSSION
This study sought to collect and synthesize the experiences of leaders across a large, integrated health care system in establishing and sustaining a just culture as part of an enterprise journey to become an HRO.24 The VHA has provided enterprise-wide support (eg, training, leader coaching, and communications) for the implementation of HRO principles and practices with the goal of creating a culture of safety, which includes just culture elements. This support includes enterprise program offices, VISNs, and hospital facilities, though notably, there is variability in how HRO is implemented at the local level. The facilitators, barriers, and recommendations presented in this article are representative of the designated HRO leads at VHA hospital facilities who have direct experience with implementing and sustaining just culture. The themes presented offer specific opportunities for intervention and actionable strategies to enhance just culture initiatives, foster psychological safety and accountability, and ultimately improve the quality of care and patient outcomes.3,25
Frequently identified facilitators such as providing training and coaching, having leaders who are available and approachable, demonstrating follow-through to address identified issues, and creating venues where errors and successes can be openly discussed.26 These facilitators are aligned with enterprise HRO support strategies orchestrated by the VHA at the enterprise VISN and facility levels to support a culture of safety, continuous process improvement, and leadership commitment.
Frequently identified barriers included inadequate training, inconsistent application of just culture by middle managers vs senior leaders, a lack of accountability or corrective action when unjust corrective actions took place, time and resource constraints, and inadequate coordination across departments (eg, operational departments and human resources) and organizational levels. These factors were identified through focus groups with a limited set of HRO leads. They may reflect challenges to changing culture that may be deeply engrained in individual histories, organizational norms, and systemic practices. Improving upon these just culture initiatives requires multifaceted approaches and working through resistance to change.
VHA HRO leads identified several actionable recommendations that may be used in pursuit of a just culture. First, improvements in training involving how to apply just culture principles and, specifically, the use of the Just Culture DST were identified as an opportunity for improvement. The VHA National Center for Patient Safety developed the DST as an aid for leaders to effectively address errors in line with just culture principles, balancing individual and system accountability.27 The DST specifically addresses human error as well as risky and reckless behavior, and it clarifies the delineation between individual and organizational accountability (Table).3
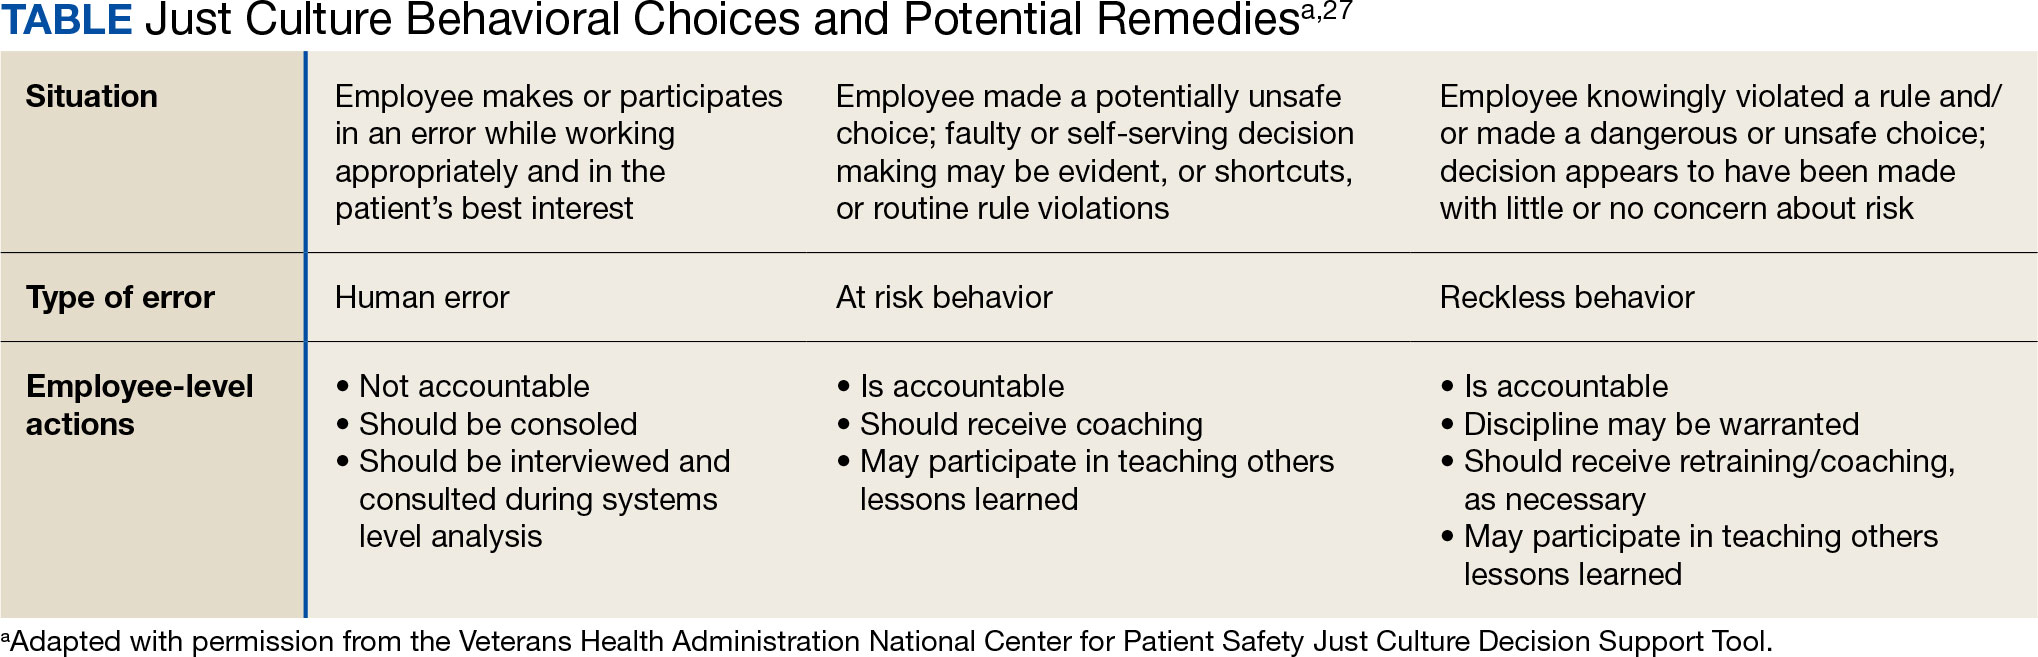
Scenario-based interactive training and simulations may prove especially useful for middle managers and frontline supervisors who are closest to errors. Clear and repeatable procedures for determining courses of action for accountability in response are needed, and support for their application must be coordinated across multiple departments (eg, patient safety and human resources) to ensure consistency and fairness. Coaching and consultation are also viewed as beneficial in supporting applications. Coaching is provided to senior leaders across most facilities, but the availability of specific, role-based coaching and training is more limited for middle managers and frontline supervisors who may benefit most from hands-on support.
Lastly, sponsorship from leaders was viewed as critical to success, but follow through to ensure support flows down from the executive suite to the frontline is variable across facilities and requires consistent effort over time. This is especially challenging given the frequent turnover in leadership roles evident in the VHA and other health care systems.
Limitations
This study employed qualitative methods and sampled a relatively small subset of experienced leaders with specific roles in implementing HRO in the VHA. Thus, it should not be considered representative of the perspectives of all leaders within the VHA or other health care systems. Future studies should assess facilitators and barriers beyond the facility level, including a focus incorporating both the VISN and VHA. More broadly, qualitative methods such as those employed in this study offer great depth and nuance but have limited ability to identify system-wide trends and differences. As such, it may be beneficial to specifically look at sites that are high- or low-performing on measures of patient safety culture to identify differences that may inform implementation strategies based on organizational maturity and readiness for change.
Conclusions
Successful implementation of these recommendations will require ongoing commitment, collaboration, and a sustained effort from all stakeholders involved at multiple levels of the health care system. Monitoring and evaluating progress should be conducted regularly to ensure that recommendations lead to improvements in implementing just culture principles. This quality improvement study adds to the knowledge base on factors that impact the just culture and broader efforts to realize HRO principles and practices in health care systems. The approach of this study may serve as a model for identifying opportunities to improve HRO implementation within the VHA and other settings, especially when paired with ongoing quantitative evaluation of organizational safety culture, just culture behaviors, and patient outcomes.
- Aljabari S, Kadhim Z. Common barriers to reporting medical errors. ScientificWorldJournal. 2021;2021:6494889. doi:10.1155/2021/6494889
- Arnal-Velasco D, Heras-Hernando V. Learning from errors and resilience. Curr Opin Anaesthesiol. 2023;36(3):376-381. doi:10.1097/ACO.0000000000001257
- Murray JS, Clifford J, Larson S, Lee JK, Sculli GL. Implementing just culture to improve patient safety. Mil Med. doi:10.1093/milmed/usac115
- Murray JS, Kelly S, Hanover C. Promoting psychological safety in healthcare organizations. Mil Med. 2022;187(7-8):808-810. doi:10.1093/milmed/usac041
- van Baarle E, Hartman L, Rooijakkers S, et al. Fostering a just culture in healthcare organizations: experiences in practice. BMC Health Serv Res. 2022;22(1):1035. doi:10.1186/s12913-022-08418-z
- Weenink JW, Wallenburg I, Hartman L, et al. Role of the regulator in enabling a just culture: a qualitative study in mental health and hospital care. BMJ Open. 2022;12(7):e061321. doi:10.1136/bmjopen-2022-061321
- White RM, Delacroix R. Second victim phenomenon: is ‘just culture’ a reality? An integrative review. Appl Nurs Res. 2020;56:151319. doi:10.1016/j.apnr.2020.151319
- Cribb A, O’Hara JK, Waring J. Improving responses to safety incidents: we need to talk about justice. BMJ Qual Saf. 2022;31(4):327-330. doi:10.1136/bmjqs-2021-014333
- Rocco C, Rodríguez AM, Noya B. Elimination of punitive outcomes and criminalization of medical errors. Curr Opin Anaesthesiol. 2022;35(6):728-732. doi:10.1097/ACO.0000000000001197
- Dekker S, Rafferty J, Oates A. Restorative Just Culture in Practice: Implementation and Evaluation. Routledge; 2022.
- Brattebø G, Flaatten HK. Errors in medicine: punishment versus learning medical adverse events revisited - expanding the frame. Curr Opin Anaesthesiol. 2023;36(2):240-245. doi:10.1097/ACO.0000000000001235
- Shabel W, Dennis JL. Missouri’s just culture collaborative. J Healthc Risk Manag. 2012;32(2):38-43. doi:10.1002/jhrm.21093
- Sculli GL, Pendley-Louis R, Neily J, et al. A high-reliability organization framework for health care: a multiyear implementation strategy and associated outcomes. J Patient Saf. 2022;18(1):64-70. doi:10.1097/PTS.0000000000000788
- Martin G, Chew S, McCarthy I, Dawson J, Dixon-Woods M. Encouraging openness in health care: policy and practice implications of a mixed-methods study in the English National Health Service. J Health Serv Res Policy. 2023;28(1):14-24. doi:10.1177/13558196221109053
- Siewert B, Brook OR, Swedeen S, Eisenberg RL, Hochman M. Overcoming human barriers to safety event reporting in radiology. Radiographics. 2019;39(1):251-263. doi:10.1148/rg.2019180135
- Barkell NP, Snyder SS. Just culture in healthcare: an integrative review. Nurs Forum. 2021;56(1):103-111. doi:10.1111/nuf.12525
- Murray JS, Lee J, Larson S, Range A, Scott D, Clifford J. Requirements for implementing a ‘just culture’ within healthcare organisations: an integrative review. BMJ Open Qual. 2023;12(2)e002237. doi:10.1136/bmjoq-2022-002237
- Mohr DC, Chen C, Sullivan J, Gunnar W, Damschroder L. Development and validation of the Veterans Health Administration patient safety culture survey. J Patient Saf. 2022;18(6):539-545. doi:10.1097/PTS.0000000000001027
- Creswell JW. Research Design: Qualitative, Quantitative, and Mixed Methods Approaches. 4th ed. SAGE Publications, Inc.; 2014.
- Patton MQ. Qualitative Research & Evaluation Methods: Integrating Theory and Practice. 4th ed. SAGE Publications, Inc.; 2015.
- Maxwell JA. Qualitative Research Design: An Interactive Approach. 3rd ed. SAGE Publications, Inc.; 2013.
- Krumpal I. Determinants of social desirability bias in sensitive surveys: a literature review. Qual Quant. 2013;47(4):2025-2047. doi:10.1007/s11135-011-9640-9
- Braun V, Clarke V. Thematic Analysis: A Practical Guide. SAGE Publications, Inc; 2021.
- Cox GR, Starr LM. VHA’s movement for change: implementing high-reliability principles and practices. J Healthc Manag. 2023;68(3):151-157. doi:10.1097/JDM-D-23-00056
- Dietl JE, Derksen C, Keller FM, Lippke S. Interdisciplinary and interprofessional communication intervention: how psychological safety fosters communication and increases patient safety. Front Psychol. 2023;14:1164288. doi:10.3389/fpsyg.2023.1164288
- Eng DM, Schweikart SJ. Why accountability sharing in health care organizational cultures means patients are probably safer. AMA J Ethics. 2020;22(9):E779-E783. doi:10.1001/amajethics.2020.779
- Veterans Health Administration National Center for Patient Safety. Just Culture Decision Support Tool. Revised May 2021. Accessed August 5, 2024.https://www.patientsafety.va.gov/docs/Just-Culture-Decision-Support-Tool-2022.pdf
Medical errors are a persistent problem and leading cause of preventable death in the United States. There is considerable momentum behind the idea that implementation of a just culture is foundational to detecting and learning from errors in pursuit of zero patient harm.1-6 Just culture is a framework that fosters an environment of trust within health care organizations, aiming to achieve fair outcomes for those involved in incidents or near misses. It emphasizes openness, accountability, and learning, prioritizing the repair of harm and systemic improvement over assigning blame.7
A just culture mindset reflects a significant shift in thinking that moves from the tendency to blame and punish others toward a focus on organizational learning and continued process improvement.8,9 This systemic shift in fundamental thinking transforms how leaders approach staff errors and how they are addressed.10 In essence, just culture reflects an ethos centered on openness, a deep appreciation of human fallibility, and shared accountability at both the individual and organizational levels.
Organizational learning and innovation are stifled in the absence of a just culture, and there is a tendency for employees to avoid disclosing their own errors as well as those of their colleagues.11 The transformation to a just culture is often slowed or disrupted by personal, systemic, and cultural barriers.12 It is imperative that all executive, service line, and frontline managers recognize and execute their distinct responsibilities while adjudicating the appropriate course of action in the aftermath of adverse events or near misses. This requires a nuanced understanding of the factors that contribute to errors at the individual and organizational levels to ensure an appropriate response.
The Veterans Health Administration (VHA) is orchestrating an enterprise transformation to develop into a high reliability organization (HRO). This began with a single-site test in 2016, which demonstrated successful results in patient safety culture, patient safety event reporting, and patient safety outcomes.13 In 2019, the VHA formally launched its enterprise-wide HRO journey in 18 hospital facilities, followed by successive waves of 67 and 54 facilities in 2021 and 2022, respectively. The VHA journey to transform into an HRO aligns with 3 pillars, 5 principles, and 7 values. The VHA has emphasized the importance of just culture as a foundational element of the HRO framework, specifically under the pillar of leadership. To promote leadership engagement, the VHA has employed an array of approaches that include education, leader coaching, and change management strategies. Given the diversity among VHA facilities, each with local cultures and histories, some sites have more readily implemented a just culture than others.14 A deeper exploration into potential obstacles, particularly concerning leadership engagement, could be instrumental for formulating strategies that further establish a just culture across the VHA.15
There is a paucity of empirical research regarding factors that facilitate and/or impede the implementation of a just culture in health care settings.16,17 Likert scale surveys, such as the Patient Safety Culture Module for the VHA All Employee Survey and its predecessor, the Patient Safety Culture Survey, have been used to assess culture and climate.18 However, qualitative evaluations directly assessing the lived experiences of those trying to implement a just culture provide additional depth and context that can help identify specific factors that support or impede becoming an HRO. The purpose of this study was to increase understanding of factors that influence the establishment and sustainment of a just culture and to identify specific methods for improving the implementation of just culture principles and practices aligned with HRO.
METHODS
This qualitative study explored facilitators and barriers to establishing and sustaining a just culture as experienced across a subset of VHA facilities by HRO leads or staff assigned with the primary responsibilities of supporting facility-level HRO transformation. HRO leads are assigned responsibility for supporting executive leadership in planning, coordinating, implementing, and monitoring activities to ensure effective high reliability efforts, including focused efforts to establish a robust patient safety program, a culture of safety, and a culture of continuous process improvement.
Virtual focus group discussions held via Microsoft Teams generated in-depth, diverse perspectives from participants across 16 VHA facilities. Qualitative research and evaluation methods provide an enhanced depth of understanding and allow the emergence of detailed data.19 A qualitative grounded theory approach elicits complex, multifaceted phenomena that cannot be appreciated solely by numeric data.20 Grounded theory was selected to limit preconceived notions and provide a more systematic analysis, including open, axial, and thematic coding. Such methods afford opportunities to adapt to unplanned follow-up questions and thus provide a flexible approach to generate new ideas and concepts.21 Additionally, qualitative methods help overcome the tendencies of respondents to agree rather than disagree when presented with Likert-style scales, which tend to skew responses toward the positive.22
Participants must have been assigned as an HRO lead for ≥ 6 months at the same facility. Potential participants were identified through purposive sampling, considering their leadership roles in HRO and experience with just culture implementation, the size and complexity of their facility, and geographic distribution. Invitations explaining the study and encouraging voluntary participation to participate were emailed. Of 37 HRO leads invited to participate in the study, 16 agreed to participate and attended 1 of 3 hour-long focus group sessions. One session was rescheduled due to limited attendance. Participants represented a mix of VHA sites in terms of geography, facility size, and complexity.
Focus Group Procedures
Demographic data were collected prior to sessions via an online form to better understand the participant population, including facility complexity level, length of time in HRO lead role, clinical background, and facility level just culture training. Each session was led by an experienced focus group facilitator (CV) who was not directly involved with the overall HRO implementation to establish a neutral perspective. Each session was attended by 4 to 7 participants and 2 observers who took notes. The sessions were recorded and included automated transcriptions, which were edited for accuracy.
Focus group sessions began with a brief introduction and an opportunity for participants to ask questions. Participants were then asked a series of open-ended questions to elicit responses regardingfacilitators, barriers, and leadership support needed for implementing just culture. The questions were part of a facilitator guide that included an introductory script and discussion prompts to ensure consistency across focus groups.
Facilitators were defined as factors that increase the likelihood of establishing or sustaining a just culture. Barriers were defined as factors that decrease or inhibit the likelihood of establishing or sustaining just culture. The focus group facilitator encouraged all participants to share their views and provided clarification if needed, as well as prompts and examples where appropriate, but primarily sought to elicit responses to the questions.
Institutional review board review and approval were not required for this quality improvement initiative. The project adhered to ethical standards of research, including asking participants for verbal consent and preserving their confidentiality. Participation was voluntary, and prior to the focus group sessions, participants were provided information explaining the study’s purpose, procedures, and their rights. Participant identities were kept confidential, and all data were anonymized during the analysis phase. Pseudonyms or identifiers were used during data transcription to protect participant identity. All data, including recordings and transcriptions, were stored on password-protected devices accessible only to the research team. Any identifiable information was removed during data analysis to ensure confidentiality.
Analysis
Focus group recordings were transcribed verbatim, capturing all verbal interactions and nonverbal cues that may contribute to understanding the participants' perspectives. Thematic analysis was used to analyze the qualitative data from the focus group discussions.23 The transcribed data were organized, coded, and analyzed using ATLAS.ti 23 qualitative data software to identify key themes and patterns.
Results
The themes identified include the 5 facilitators, barriers, and recommendations most frequently mentioned by HRO leads across focus group sessions. The nature of each theme is described, along with commonly mentioned examples and direct quotes from participants that illustrate our understanding of their perspectives.
Facilitators
Training and coaching (26 responses). The availability of training around the Just Culture Decision Support Tool (DST) was cited as a practical aid in guiding leaders through complex just culture decisions to ensure consistency and fairness. Additionally, an executive leadership team that served as champions for just culture principles played a vital role in promoting and sustaining the approach: “Training them on the roll-out of the decision support tool with supervisors at all levels, and education for just culture and making it part of our safety forum has helped for the last 4 months.” “Having some regular training and share-out cadences embedded within the schedule as well as dynamic directors and well-trained executive leadership team (ELT) for support has been a facilitator.”
Increased transparency (16 responses). Participants consistently highlighted the importance of leadership transparency as a key facilitator for implementing just culture. Open and honest communication from top-level executives fostered an environment of trust and accountability. Approachable and physically present leadership was seen as essential for creating a culture where employees felt comfortable reporting errors and concerns without fear of retaliation: “They’re surprisingly honest with themselves about what we can do, what we cannot do, and they set the expectations exactly at that.”
Approachable leadership (15 responses). Participants frequently mentioned the importance of having dynamic leadership spearheading the implementation of just culture and leading by example. Having a leadership team that accepts accountability and reinforces consistency in the manner that near misses or mistakes are addressed is paramount to promoting the principles of just culture and increasing psychological safety: “We do have very approachable leadership, which I know is hard if you’re trying to implement that nationwide, it’s hard to implement approachability. But I do think that people raise their concerns, and they’ll stop them in the hallway and ask them questions. So, in terms of comfort level with the executive leadership, I do think that’s high, which would promote psychological safety.”
Feedback loops and follow through (13 responses). Participants emphasized the importance of taking concrete actions to address concerns and improve processes. Regular check-ins with supervisors to discuss matters related to just culture provided a structured opportunity for addressing issues and reinforcing the importance of the approach: “One thing that we’ve really focused on is not only identifying mistakes, but [taking] ownership. We continue to track it until … it’s completed and then a process of how to communicate that back and really using closed loop communication with the staff and letting them know.”
Forums and town halls (10 responses). These platforms created feedback loops that were seen as invaluable tools for sharing near misses, celebrating successes, and promoting open dialogue. Forums and town halls cultivated a culture of continuous improvement and trust: “We’ll celebrate catches, a safety story is inside that catch. So, if we celebrate the change, people feel safer to speak up.” “Truthfully, we’ve had a great relationship since establishing our safety forums and just value open lines of communication.”
Barriers
Inadequate training (30 responses). Insufficient engagement during training—limited bandwidth and availability to attend and actively participate in training—was perceived as detrimental to creating awareness and buy-in from staff, supervisors, and leadership, thereby hindering successful integration of just culture principles. Participants also identified too many conflicting priorities from VHA leadership, which contributes to training and information fatigue among staff and supervisors. “Our biggest barrier is just so many different competing priorities going on. We have so much that we’re asking people to do.” “One hundred percent training is feeling more like a ticked box than actually yielding results, I have a very hard time getting staff engaged.”
Inconsistency between executive leaders and middle managers (28 responses). A lack of consistency in the commitment to and enactment of just culture principles among leaders poses a challenge. Participants gave several examples of inconsistencies in messaging and reinforcement of just culture principles, leading to confusion among staff and hindering adoption. Likewise, the absence of standardized procedures for implementing just culture created variability: “The director coming in and trying to change things, it put a lot of resistance, we struggle with getting the other ELT members on board … some of the messages that come out at times can feel more punitive.”
Middle management resistance (22 responses). In some instances, participants reported middle managers exhibiting attitudes and behaviors that undermined the application of just culture principles and effectiveness. Such attitudes and behaviors were attributed to a lack of adequate training, coaching, and awareness. Other perceived contributions included fear of failure and a desire to distance oneself from staff who have made mistakes: “As soon as someone makes an error, they go straight to suspend them, and that’s the disconnect right there.” “There’s almost a level of working in the opposite direction in some of the mid-management.”
Cultural misalignment (18 responses). The existing culture of distancing oneself from mistakes presented a significant barrier to the adoption of just culture because it clashed with the principles of open reporting and accountability. Staff underreported errors or framed them in a way that minimized personal responsibility, thereby making it more essential to put in the necessary and difficult work to learn from mistakes: “One, you’re going to get in trouble. There’s going to be more work added to you or something of that nature."
Lack of accountability for opposition(17 responses). Participants noted a clear lack of accountability for those who opposed or showed resistance to just culture, which allowed resistance to persist without consequences. In many instances, leaders were described as having overlooked repeated instances of unjust attitudes and behaviors (eg, inappropriate blame or punishment), which allowed those practices to continue. “Executive leadership is standing on the hill and saying we’re a just culture and we do everything correctly, and staff has the expectation that they’re going to be treated with just culture and then the middle management is setting that on fire, then we show them that that’s not just culture, and they continue to have those poor behaviors, but there’s a lack of accountability.”
Limited bandwidth and lack of coordination (14 responses). HRO leads often faced role-specific constraints in having adequate time and authority to coordinate efforts to implement or sustain just culture. This includes challenges with coordination across organizational levels (eg, between the hospital and regional Veterans Integrated Service Network [VISN] management levels) and across departments within the hospital (eg, between human resources and service lines or units). “Our VISN human resources is completely detached. They’ll not cooperate with these efforts, which is hard.” “There’s not enough bandwidth to actually support, I’m just 1 person.” “[There’s] all these mandated trainings of 8 hours when we’re already fatigued, short-staffed, taking 3 other HRO classes.”
Recommendations
Training improvements (24 responses). HRO leads recommended that comprehensive training programs be developed and implemented for staff, supervisors, and leadership to increase awareness and understanding of just culture principles. These training initiatives should focus on fostering a shared understanding of the core tenets of just culture, the importance of error reporting, and the processes involved in fair and consistent decision making (eg, training simulations on use of the Just Culture DST). “We’ve really never had any formal training on the decision support tool. I hope that what’s coming out for next year. We’ll have some more formal training for the tool because I think it would be great to really have our leadership and our supervisors and our managers use that tool.” “We can give a more directed and intentional training to leadership on the 4 foundational practices and what it means to implement those and what it means to utilize that behavioral component of HRO.”
Clear and consistent procedures toincrease accountability (22 responses). To promote a culture of accountability and consistency in the application of just culture principles, organizations should establish clear mechanisms for reporting, investigating, and addressing incidents. Standardized procedures and DSTs can aid in ensuring that responses to errors are equitable and align with just culture principles: “I recommend accountability; if it’s clearly evidenced that you’re not toeing the just culture line, then we need to be able to do something about it and not just finger wag.” “[We need to have] a templated way to approach just culture implementation. The decision support tool is great, I absolutely love having the resources and being able to find a lot of clinical examples and discussion tools like that. But when it comes down to it, not having that kind of official thing to fall back on it can be a little bit rough.”
Additional coaching and consultationsupport (15 responses). To support supervisors in effectively implementing just culture within their teams, participants recommended that organizations provide ongoing coaching and mentorship opportunities. Additionally, third-party consultants with expertise in just culture were described as offering valuable guidance, particularly in cases where internal staff resources or HRO lead bandwidth may be limited. “There are so many consulting agencies with HRO that have been contracted to do different projects, but maybe that can help with an educational program.” “I want to see my executive leadership coach the supervisors up right and then allow them to do one-on-ones and facilitate and empower the frontline staff, and it’s just a good way of transparency and communication.”
Improved leadership sponsorship (15 responses). Participants noted that leadership buy-in is crucial for the successful implementation of just culture. Facilities should actively engage and educate leadership teams on the benefits of just culture and how it aligns with broader patient safety and organizational goals. Leaders should be visible and active champions of its principles, supporting change in their daily engagements with staff. “ELT support is absolutely necessary. Why? Because they will make it important to those in their service lines. They will make it important to those supervisors and managers. If it’s not important to that ELT member, then it’s not going to be important to that manager or that supervisor.”
Improved collaboration with patient safety and human resources (6 responses). Collaborative efforts with patient safety and human resources departments were seen as instrumental in supporting just culture, emphasizing its importance, and effectively addressing issues. Coordinating with these departments specifically contributes to consistent reinforcement and expands the bandwidth of HRO leads. These departments play integral roles in supporting just culture through effective policies, procedures, and communication. “I think it would be really helpful to have common language between what human resources teaches and what is in our decision support tool.”
DISCUSSION
This study sought to collect and synthesize the experiences of leaders across a large, integrated health care system in establishing and sustaining a just culture as part of an enterprise journey to become an HRO.24 The VHA has provided enterprise-wide support (eg, training, leader coaching, and communications) for the implementation of HRO principles and practices with the goal of creating a culture of safety, which includes just culture elements. This support includes enterprise program offices, VISNs, and hospital facilities, though notably, there is variability in how HRO is implemented at the local level. The facilitators, barriers, and recommendations presented in this article are representative of the designated HRO leads at VHA hospital facilities who have direct experience with implementing and sustaining just culture. The themes presented offer specific opportunities for intervention and actionable strategies to enhance just culture initiatives, foster psychological safety and accountability, and ultimately improve the quality of care and patient outcomes.3,25
Frequently identified facilitators such as providing training and coaching, having leaders who are available and approachable, demonstrating follow-through to address identified issues, and creating venues where errors and successes can be openly discussed.26 These facilitators are aligned with enterprise HRO support strategies orchestrated by the VHA at the enterprise VISN and facility levels to support a culture of safety, continuous process improvement, and leadership commitment.
Frequently identified barriers included inadequate training, inconsistent application of just culture by middle managers vs senior leaders, a lack of accountability or corrective action when unjust corrective actions took place, time and resource constraints, and inadequate coordination across departments (eg, operational departments and human resources) and organizational levels. These factors were identified through focus groups with a limited set of HRO leads. They may reflect challenges to changing culture that may be deeply engrained in individual histories, organizational norms, and systemic practices. Improving upon these just culture initiatives requires multifaceted approaches and working through resistance to change.
VHA HRO leads identified several actionable recommendations that may be used in pursuit of a just culture. First, improvements in training involving how to apply just culture principles and, specifically, the use of the Just Culture DST were identified as an opportunity for improvement. The VHA National Center for Patient Safety developed the DST as an aid for leaders to effectively address errors in line with just culture principles, balancing individual and system accountability.27 The DST specifically addresses human error as well as risky and reckless behavior, and it clarifies the delineation between individual and organizational accountability (Table).3
Scenario-based interactive training and simulations may prove especially useful for middle managers and frontline supervisors who are closest to errors. Clear and repeatable procedures for determining courses of action for accountability in response are needed, and support for their application must be coordinated across multiple departments (eg, patient safety and human resources) to ensure consistency and fairness. Coaching and consultation are also viewed as beneficial in supporting applications. Coaching is provided to senior leaders across most facilities, but the availability of specific, role-based coaching and training is more limited for middle managers and frontline supervisors who may benefit most from hands-on support.
Lastly, sponsorship from leaders was viewed as critical to success, but follow through to ensure support flows down from the executive suite to the frontline is variable across facilities and requires consistent effort over time. This is especially challenging given the frequent turnover in leadership roles evident in the VHA and other health care systems.
Limitations
This study employed qualitative methods and sampled a relatively small subset of experienced leaders with specific roles in implementing HRO in the VHA. Thus, it should not be considered representative of the perspectives of all leaders within the VHA or other health care systems. Future studies should assess facilitators and barriers beyond the facility level, including a focus incorporating both the VISN and VHA. More broadly, qualitative methods such as those employed in this study offer great depth and nuance but have limited ability to identify system-wide trends and differences. As such, it may be beneficial to specifically look at sites that are high- or low-performing on measures of patient safety culture to identify differences that may inform implementation strategies based on organizational maturity and readiness for change.
Conclusions
Successful implementation of these recommendations will require ongoing commitment, collaboration, and a sustained effort from all stakeholders involved at multiple levels of the health care system. Monitoring and evaluating progress should be conducted regularly to ensure that recommendations lead to improvements in implementing just culture principles. This quality improvement study adds to the knowledge base on factors that impact the just culture and broader efforts to realize HRO principles and practices in health care systems. The approach of this study may serve as a model for identifying opportunities to improve HRO implementation within the VHA and other settings, especially when paired with ongoing quantitative evaluation of organizational safety culture, just culture behaviors, and patient outcomes.
- Aljabari S, Kadhim Z. Common barriers to reporting medical errors. ScientificWorldJournal. 2021;2021:6494889. doi:10.1155/2021/6494889
- Arnal-Velasco D, Heras-Hernando V. Learning from errors and resilience. Curr Opin Anaesthesiol. 2023;36(3):376-381. doi:10.1097/ACO.0000000000001257
- Murray JS, Clifford J, Larson S, Lee JK, Sculli GL. Implementing just culture to improve patient safety. Mil Med. doi:10.1093/milmed/usac115
- Murray JS, Kelly S, Hanover C. Promoting psychological safety in healthcare organizations. Mil Med. 2022;187(7-8):808-810. doi:10.1093/milmed/usac041
- van Baarle E, Hartman L, Rooijakkers S, et al. Fostering a just culture in healthcare organizations: experiences in practice. BMC Health Serv Res. 2022;22(1):1035. doi:10.1186/s12913-022-08418-z
- Weenink JW, Wallenburg I, Hartman L, et al. Role of the regulator in enabling a just culture: a qualitative study in mental health and hospital care. BMJ Open. 2022;12(7):e061321. doi:10.1136/bmjopen-2022-061321
- White RM, Delacroix R. Second victim phenomenon: is ‘just culture’ a reality? An integrative review. Appl Nurs Res. 2020;56:151319. doi:10.1016/j.apnr.2020.151319
- Cribb A, O’Hara JK, Waring J. Improving responses to safety incidents: we need to talk about justice. BMJ Qual Saf. 2022;31(4):327-330. doi:10.1136/bmjqs-2021-014333
- Rocco C, Rodríguez AM, Noya B. Elimination of punitive outcomes and criminalization of medical errors. Curr Opin Anaesthesiol. 2022;35(6):728-732. doi:10.1097/ACO.0000000000001197
- Dekker S, Rafferty J, Oates A. Restorative Just Culture in Practice: Implementation and Evaluation. Routledge; 2022.
- Brattebø G, Flaatten HK. Errors in medicine: punishment versus learning medical adverse events revisited - expanding the frame. Curr Opin Anaesthesiol. 2023;36(2):240-245. doi:10.1097/ACO.0000000000001235
- Shabel W, Dennis JL. Missouri’s just culture collaborative. J Healthc Risk Manag. 2012;32(2):38-43. doi:10.1002/jhrm.21093
- Sculli GL, Pendley-Louis R, Neily J, et al. A high-reliability organization framework for health care: a multiyear implementation strategy and associated outcomes. J Patient Saf. 2022;18(1):64-70. doi:10.1097/PTS.0000000000000788
- Martin G, Chew S, McCarthy I, Dawson J, Dixon-Woods M. Encouraging openness in health care: policy and practice implications of a mixed-methods study in the English National Health Service. J Health Serv Res Policy. 2023;28(1):14-24. doi:10.1177/13558196221109053
- Siewert B, Brook OR, Swedeen S, Eisenberg RL, Hochman M. Overcoming human barriers to safety event reporting in radiology. Radiographics. 2019;39(1):251-263. doi:10.1148/rg.2019180135
- Barkell NP, Snyder SS. Just culture in healthcare: an integrative review. Nurs Forum. 2021;56(1):103-111. doi:10.1111/nuf.12525
- Murray JS, Lee J, Larson S, Range A, Scott D, Clifford J. Requirements for implementing a ‘just culture’ within healthcare organisations: an integrative review. BMJ Open Qual. 2023;12(2)e002237. doi:10.1136/bmjoq-2022-002237
- Mohr DC, Chen C, Sullivan J, Gunnar W, Damschroder L. Development and validation of the Veterans Health Administration patient safety culture survey. J Patient Saf. 2022;18(6):539-545. doi:10.1097/PTS.0000000000001027
- Creswell JW. Research Design: Qualitative, Quantitative, and Mixed Methods Approaches. 4th ed. SAGE Publications, Inc.; 2014.
- Patton MQ. Qualitative Research & Evaluation Methods: Integrating Theory and Practice. 4th ed. SAGE Publications, Inc.; 2015.
- Maxwell JA. Qualitative Research Design: An Interactive Approach. 3rd ed. SAGE Publications, Inc.; 2013.
- Krumpal I. Determinants of social desirability bias in sensitive surveys: a literature review. Qual Quant. 2013;47(4):2025-2047. doi:10.1007/s11135-011-9640-9
- Braun V, Clarke V. Thematic Analysis: A Practical Guide. SAGE Publications, Inc; 2021.
- Cox GR, Starr LM. VHA’s movement for change: implementing high-reliability principles and practices. J Healthc Manag. 2023;68(3):151-157. doi:10.1097/JDM-D-23-00056
- Dietl JE, Derksen C, Keller FM, Lippke S. Interdisciplinary and interprofessional communication intervention: how psychological safety fosters communication and increases patient safety. Front Psychol. 2023;14:1164288. doi:10.3389/fpsyg.2023.1164288
- Eng DM, Schweikart SJ. Why accountability sharing in health care organizational cultures means patients are probably safer. AMA J Ethics. 2020;22(9):E779-E783. doi:10.1001/amajethics.2020.779
- Veterans Health Administration National Center for Patient Safety. Just Culture Decision Support Tool. Revised May 2021. Accessed August 5, 2024.https://www.patientsafety.va.gov/docs/Just-Culture-Decision-Support-Tool-2022.pdf
CDK7 Inhibition in Patient-Derived Organoid Modeling of Biliary Tract Cancers
Background
Biliary tract cancers (BTC) represent an important rare cancer type in Veterans. The heterogeneity of BTC has revealed distinct molecular subtypes, however a majority of patients remain without precision-based targeted therapeutics. Epigenomic remodeling has been considered as a shared mechanism of therapeutic resistance. Cyclin dependant kinase 7 (CDK7) is an emerging therapeutic target that functions by phosphorylation of RNA polymerase II and cell cycle progression. Here, we investigate CDK7 inhibition using small molecule inhibition (SY-5609) across a panel of BTC organoid models.
Methods
PCOs were expanded from patient-derived tissues and shared models provided from the NCI. Organoid response was tracked from growth using Z-stacked high content imaging (Cytation5) to track individual organoid growth and established viability markers of Caspase-3/7 (C3/7) and ToPro3, for induced apoptosis and necrosis for phenotypic screening. Treatment groups included media control, positive control (cycloheximide) 200uM continuous, gemcitabine (gem) 10uM 24h, cisplatin (cis) 5uM 48h, combination gem+cis, and SY-5609 10nM 144h. Glass’s delta was used to standardize effect size relative to media control.
Results
Patient-derived cancer organoids were generated across four unique models including pathogenic (A-B) IDH1 p.R132G, (C) FGFR2-HPGDS fusion and (D) non-targetable molecular profile (CCNE1 amplified, BRCA1 splice variant). In the non-targeted model, CDK7 inhibition achieved growth arrest +2.0% (SY-5607) v. +43.0% (media control) with effect size >1.1. This response was similar to standard of care gem+cis with growth of +1.5% and augmented using the combination of gem+SY-5609 -3.1% with effect size of >1.3. When treated with CDK7 inhibition, persistent growth was seen across models of IDH1 mutant and FGFR2-HPGDS2 fusion cancers. High content imaging revealed subclonal populations with failed induction of apoptosis and necrosis at 144h, suggestive of the critical need to address intrinsic resistant populations to both SOC chemotherapy and novel targeted strategies.
Conclusions
Across a diversity of BTC cancer models, CDK7 inhibition was found to achieve growth arrest in a CCNE1 amplified cancer model. High content imaging of organoids can identify subclonal resistant populations as a critical unmet need in future therapeutic development. Ongoing work is adapting these techniques to multiple small molecule inhibitors that target transcription including EZH1/2 and CDK9.
Carboplatin as a Radiosensitizing Agent in Locally Advanced Head and Neck Cancer: Friendly to an Older Veteran Population
Background
The standard of care for locally advanced head and neck squamous cell carcinoma (HNSCC) is combination chemoradiotherapy. Platinum-based chemotherapy is used for radiosensitization and significantly improves locoregional control and survival. Cisplatin is the standard of care; however, many patients are cisplatin-ineligible due to underlying comorbidities. Carboplatin is an alternative chemotherapy in these patients, but efficacy data are lacking. Purpose: To evaluate the efficacy and tolerability of weekly carboplatin concurrent with radiation in veterans with locally advanced HNSCC.
Methods
Our tumor registry was used to identify patients who received platinum-based chemoradiotherapy for stage III-IVB HNSCC at a single center between 2007 to 2017. Patients who received carboplatin were identified. Data including dosing, toxicities, and disease response was collected and analyzed.
Results
A total of 26 patients who received weekly carboplatin were analyzed. All patients were male with an average age of 65. A usual dose of carboplatin AUC 2 was utilized. The average cumulative dose for weekly carboplatin was AUC 12, with most patients (65%) receiving 6 doses or more. The mean number of weekly carboplatin doses held was 0.3. 7 patients (27%) had at least one dose held. 21 (81%) patients showed treatment benefit: 19 (73%) had complete response and 2 (8%) had partial response on first scan following treatment. The four most common toxicities were mucositis (69%), nausea/vomiting (23%), oral thrush (19%), and dermatologic toxicities (19%). The most common toxicities causing dose interruption were fatigue (12%), neutropenia (8%), and thrombocytopenia (8%). Grade 3/4 mucositis was experienced in 6 patients (23%). Other grade 3/4 toxicities included neutropenia (8%), anemia (8%), thrombocytopenia (1%), nephrotoxicity (1%) and nausea (1%).
Conclusions
Carboplatin was both efficacious and well tolerated in our older veteran population. These findings add to the limited body of evidence examining weekly carboplatin in patients with advanced head and neck cancer. While cisplatin remains standard of care, carboplatin may be a reasonable alternative as evidenced in a real-world veteran population.
Variation in Cardiovascular Risk Assessment Status in Patients Receiving Oral Anti-Cancer Therapies: A Focus on Equity throughout VISN (Veteran Integrated Service Network) 12
Background
Oral anti-cancer therapies have quickly moved to the forefront of cancer treatment for several oncologic disease states. While these treatments have led to improvements in prognosis and ease of administration, many of these agents carry the risk of serious short- and long-term toxicities affecting the cardiovascular system. This prompted the Journal of the American Heart Association (JAHA) to release special guidance focused on cardiovascular monitoring strategies for anti-cancer agents. The primary objective of this retrospective review was to evaluate compliance with cardiovascular monitoring based on JAHA cardio-oncologic guidelines. The secondary objective was to assess disparities in cardiovascular monitoring based on markers of equity such as race/ ethnicity, rurality, socioeconomic status and gender.
Methods
Patients who initiated pazopanib, cabozantinib, lenvatinib, axitinib, regorafenib, nilotinib, ibrutinib, sorafenib, sunitinib, ponatinib or everolimus between January 1, 2019 and December 31, 2022 at a VHA VISN 12 site with oncology services were followed forward until treatment discontinuation or 12 months of therapy had been completed. Data was acquired utilizing the VA Informatics and Computing Infrastructure (VINCI) and the Corporate Data Warehouse (CDW). The following cardiovascular monitoring markers were recorded at baseline and months 3, 6, 9 and 12 after initiation anti-cancer therapy: blood pressure, blood glucose, cholesterol, ECG and echocardiogram. Descriptive statistics were used to examine all continuous variables, while frequencies were used to examine categorical variables. Univariate statistics were performed on all items respectively.
Results
A total of 219 patients were identified initiating pre-specified oral anti-cancer therapies during the study time period. Of these, a total of n=145 met study inclusion criteria. 97% were male (n=141), 80% (n=116) had a racial background of white, 36% (n=52) live in rural or highly rural locations and 23% (n=34) lived in a high poverty area. Based on the primary endpoint, the mean compliance with recommended cardiovascular monitoring was 44.95% [IQR 12]. There was no statistically significant difference in cardiovascular monitoring based on equity.
Conclusions
Overall uptake of cardiovascular monitoring markers recommended by JAHA guidance is low. We plan to evaluate methods to increase these measures, utilizing clinical pharmacy provider support throughout VISN 12.
Developing a Cancer Rehabilitation Program—Improving Access to Ancillary Services to Mitigate the Impact of Cancer and its Treatments for Veterans Diagnosed With Cancer
Background
Approximately 56,000 Veterans are diagnosed with cancer every year in the VA system. Up to 90% of survivors have at least one impairment that decreases their quality of life, but only 2-9% are receiving cancer rehabilitation. Current research in cancer care demonstrates the importance of prospective surveillance, rehabilitation, and a multidisciplinary (MultiD) approach to cancer survivorship. Multi-D treatments help mitigate the effects of cancer and its treatments as the veterans proceed through care, improve outcomes, and streamline the process to meet all rehabilitation needs for those affected by cancer. Prior to the development of this program all services except navigation were available. Those diagnosed with cancer were not receiving prehabilitation and consults to ancillary services did not occur until after active cancer treatment was completed. CCRP united existing Multi-D programs to better serve the needs of veterans with cancer. Development of the CCRP CPRS Consult menu has allowed for improved access for both providers and veterans.
Methods
Identified the need for ancillary services during cancer survivorship, regardless of Veterans treatment location within or outside the VA system. Initiated tracking via CCR consults, developed a CCRP guidebook to identify all services available and how to access them as well as the CCCRP consult menu to create easier access for providers and veterans. Tracking via Multi-D departments that allow for tracking in CPRS via CCRP Consult.
Results
Prior to FY23 no cancer rehab consults existed. Consults received since program implementation: Navigation: 144, Physical Therapy: 102, Occupational Therapy: 7, Speech: 15. All other Multi-D did not track CCRP-specific consults. Other tools for data analysis are utilized in other departments in which gaps in coordination of care have been caught/resolved, and advocacy has increased.
Conclusions
Comprehensive cancer care from diagnosis throughout survivorship improves quality of life. A Multi-D comprehensive Cancer rehabilitation provides an opportunity to streamline care via a CPRS Menu. Other VA medical centers can develop a Multi-D cancer rehabilitation program to coordinate treatments from diagnosis through survivorship. This is an opportunity to make the VA the forefront of oncology care – by providing all services within one system.
Optimization of Hematology/ Oncology E-Consult Ordering Process
Background
Multiple responses or repeat e-consults were observed by Hematology/Oncology Department. Root cause analysis uncovered that 60% of e-consults ordered required multiple responses or repeat econsults for the same clinical situation, often due to the need for additional lab testing before the e-consult question could be addressed. Hematology/Oncology econsult ordering process did not have an order design menu to provide guidance on appropriate questions, simplified ordering of relevant tests, or ways to identify patients that were either already established in the Hem/Onc clinic or patients that would be better managed with a more urgent or in-person consultation. This quality improvement project was created to improve the appropriateness and efficiency of hematology/oncology e-consult ordering process.
Methods
Using Plan-Do-Study-Act (PDSA) quality improvement methodology, a project team lead by Hematology/Oncology, Clinical Informatics, Clinical Application Coordinator and the Systems Redesign Coordinator, rebuilt menus to navigate referring providers to the appropriate e-consults. This would improve the process flow and enhance clear communication. The primary process improvement goals were 1) to decrease the number of e-consults that were better suited for inperson evaluation; 2) decrease the number of Hem/Onc e-consults that lack adequate clinical lab information and 3) decrease the number of e-consults for patients that are already established with a Hematology/Oncology provider.
Results
Baseline sample data (7-1-23-11-30-22)-revealed only 60% of e-consults placed were deemed appropriate. 13% required certain minimum lab testing, 11% were already established patients and 11% were better managed through in-person consultation. After the first PDSA cycle, from 9/21/23-3/29/24, 72% of econsults were deemed appropriate (114/158), a 12% improvement.
Conclusions
The success of the project supports the use of existing VA hospital-based program resources such as clinical informatics and utilizing frontline physician input. This input was critical to the redesigned ordering process. Ultimately, our process improvement efforts helped facilitate communication and information flow which improved our ability to better coordinate our Veteran’s care.