User login
Ischemic Stroke After Hip Operation
In the United States, hip operations (internal fixation of fracture or total hip arthroplasty [THA]) are the most common noncardiac major surgical procedures performed in patients age 65 years and older (45.2 procedures per 100,000 persons per year).1 This number of procedures is projected to increase substantially in the coming decades.
Little is known about the clinical predictors of postoperative stroke in patients undergoing hip surgical procedures. Further, recent results of the Perioperative Ischemic Evaluation (POISE) trial have shown that measures taken to reduce cardiac complications postoperatively may adversely affect the risk of stroke.2 The POISE study showed decreases in myocardial infarction and coronary revascularization but accompanying increases in stroke and death with use of ‐blockers in patients undergoing noncardiac surgery.
Prevention of adverse events is one of the top priorities of the U.S. health care system today.35 Risk stratification and therapeutic optimization of underlying chronic diseases may be important in decreasing perioperative risk and improving postoperative outcomes.
Our objective was to determine the rate of postoperative ischemic stroke in all residents of Olmsted County, MN, who underwent hip operation between 1988 and 2002 and to identify clinical predictors of postoperative stroke.
Subjects and Methods
Olmsted County is one of the few places in the world where comprehensive population‐based studies of disease etiology and outcomes are feasible. This feasibility is due to the Rochester Epidemiology Project, a medical records linkage system that provides access to the records of all medical care in the community.1 All medical diagnoses made for a resident of Olmsted County are entered on a master sheet in the patient's medical record, which is then entered into a central computer index.
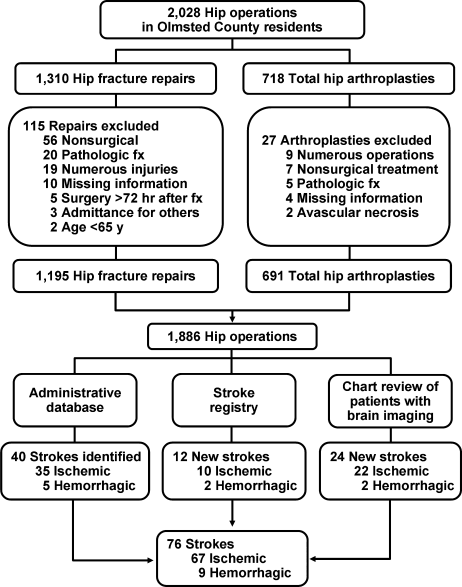
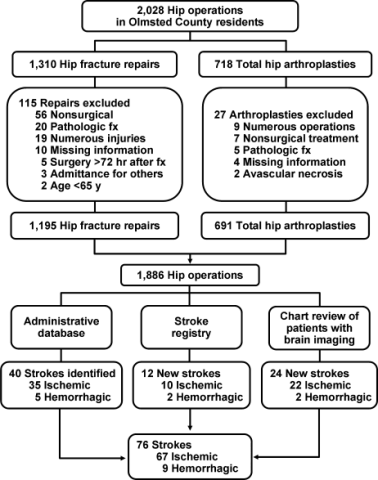
Hip operations were identified using the Surgical Information Recording System data warehouse, where detailed data are stored as International Classification of Diseases, 9th edition (ICD‐9) codes for all surgical procedures performed from January 1, 1988, forward. A total of 2028 THAs and hip fracture repairs (ICD‐9 codes 81.51, 81.52, 81.53, 79.15, and 79.25) performed between 1988 and 2002 in Olmsted County were identified. Of the hip procedures, 142 were excluded (Figure 1). The final analysis cohort contained 1886 hip operations1195 hip fracture repairs and 691 THAs.
The population‐based cohort was assembled and the data were abstracted from complete inpatient and outpatient records from admission for surgical treatment up to 1 year after surgery. Only those patients who had given prior authorization for research were included in the study cohort. The Mayo Clinic Institutional Review Board approved the study.
Case Ascertainment
We used several screening procedures to completely enumerate all postoperative strokes in our study population (Figure 1). The Mayo Clinic administrative database was used to identify all cases with relevant cerebrovascular disease (ICD‐9 codes 430.0‐437.9, 368.12, 781.4, and 784.3) within 1 year after hip operation. The Rochester Stroke Registry identified incident cases of ischemic stroke in Olmsted County from 1988 through 1994. The clinic's administrative database was also used to identify brain imaging studies (brain computed tomography, magnetic resonance imaging, or carotid ultrasonography) between the day of the procedure and 1 year postoperatively. A neurologist reviewed each image and the associated medical record identified during the screening process in detail for the constellation of signs and symptoms consistent with the diagnosis of stroke. Death certificates and autopsy reports were also reviewed to identify persons with the diagnosis of stroke. The outcome (stroke) was masked to the nurse abstractor who reviewed charts for predictors of postoperative stroke (eg, atrial fibrillation, coronary artery disease [CAD], history of stroke, medication use). The exposed or unexposed status of the patients to the predictors of stroke was masked to the physician (A.S.P.) who screened electronic medical records for the outcome measure (stroke).
Cerebral infarction or ischemic stroke was defined as the acute onset of a neurologic deficit that persisted for longer than 24 hours and corresponded to an arterial vascular territory of the cerebral hemispheres, brainstem, or cerebellum, with or without computed tomographic or magnetic resonance imaging documentation. Transient ischemic attack was defined as an episode of focal neurologic symptoms with abrupt onset and rapid resolution, lasting less than 24 hours, and due to altered circulation to a limited region of the brain.
Only patients with ischemic strokes clinically documented by a neurologist were included in the analysis.
Primary Outcomes
Outcomes were the cumulative probability of ischemic stroke and predictors of stroke in the first 12 months after surgical treatment of the hip.
Statistical Analysis
Continuous variables are presented as mean (standard deviation [SD]); categorical variables are presented as number and percentage. Two‐sample t tests or Wilcoxon rank sum tests were used to test for differences between THAs and hip fracture repairs in demographic characteristics, past medical history, and baseline clinical data composed of continuous variables; 2 or Fisher exact tests were used for categorical variables. No patient was lost to follow‐up during the 1 year after the initial surgery. However, the data of patients who died or had a second hip procedure within that period were censored.
The rate of ischemic stroke within 1 year after the incident hip procedure was calculated using the Kaplan‐Meier method. Second hip procedures within that period were counted as additional cases. Rates were calculated for the overall group, as well as for the univariate risk factors of operative procedure type, age, sex, past medical history of stroke, hypertension, atrial fibrillation, CAD, chronic obstructive pulmonary disease (COPD), diabetes mellitus, and chronic renal insufficiency. Use of ‐blockers, hydroxymethylglutaryl‐coenzyme A (HMG‐CoA) reductase inhibitors, or aspirin at hospital admission was also considered. Cox proportional hazards regression models were used to evaluate the risk of ischemic stroke for each of these univariate risk factors. Multivariable Cox proportional hazards models were constructed with adjustments for operative procedure type, age, sex, and comorbid conditions such as atrial fibrillation and hypertension. These covariates were added in a stepwise selection to identify factors significantly associated with the outcome. To account for patients who had a second hip procedure within 1 year of their first operation, we calculated all Cox proportional hazards regression results using the robust sandwich estimate of the covariance matrix. The proportional hazards assumption for all Cox models was evaluated with the methods proposed by Therneau and Grambsch;6 no violations of this assumption were identified. The rate of postoperative stroke after adjusting for the competing risk of death was calculated using the approach of Gooley et al.7 All statistical tests were 2‐sided, and a P value was considered significant if it was less than 0.05. Statistical analyses were performed using statistical software (SAS version 9.1.3; SAS Institute, Inc., Cary, NC).
Results
Among the patients with the 1886 hip procedures, 67 ischemic strokes were identified within 1 year after the index surgical procedure10 (1.4%) among the 691 THAs and 57 (4.8%) among the 1195 hip fracture repairs. Baseline characteristics are summarized in Table 1. Compared with the THA group, patients in the hip fracture repair group were more likely to be older and female. Additionally, such comorbid conditions as a history of stroke, diabetes mellitus, congestive heart failure, atrial fibrillation, or dementia were more prevalent in the hip fracture repair group.
| Characteristics | Surgical Procedure | Total (n = 1,886) | P Value* | |
|---|---|---|---|---|
| THA (n = 691) | Fracture Repair (n = 1,195) | |||
| ||||
| Age, years | 74.9 (6.59) | 84.2 (7.49) | 80.8 (8.46) | <0.001 |
| Sex, male | 258 (37.3) | 234 (19.6) | 492 (26.1) | <0.001 |
| Race, White | 690 (100) | 1,187 (99.3) | 1,877 (99.5) | 0.17 |
| BMI | 27.7 (5.36) | 23.3 (4.93) | 24.9 (5.52) | <0.001 |
| History | ||||
| Hypertension | 424 (61.4) | 695 (58.2) | 1,119 (59.3) | 0.17 |
| Diabetes | 57 (8.2) | 141 (11.8) | 198 (10.5) | 0.02 |
| Stroke | 50 (7.2) | 334 (27.9) | 384 (20.4) | <0.001 |
| CHF | 100 (14.5) | 321 (26.9) | 421 (22.3) | <0.001 |
| Atrial fibrillation | 72 (10.4) | 241 (20.2) | 313 (16.6) | <0.001 |
| Dementia | 16 (2.3) | 407 (34.1) | 423 (22.4) | <0.001 |
| ASA risk classification | <0.001 | |||
| 1 or 2 | 343 (49.6) | 172 (14.4) | 515 (27.3) | |
| 3, 4, or 5 | 348 (50.4) | 1,022 (85.6) | 1,370 (72.7) | |
| Medication on admission | ||||
| Aspirin | 168 (24.3) | 369 (30.9) | 537 (28.5) | 0.002 |
| ‐Blocker | 134 (19.4) | 184 (15.4) | 318 (16.9) | 0.03 |
| Insulin | 12 (1.7) | 48 (4) | 60 (3.2) | 0.007 |
| Length of stay, days | 7.3 (3.9) | 10.0 (7.61) | 9.0 (6.63) | <0.001 |
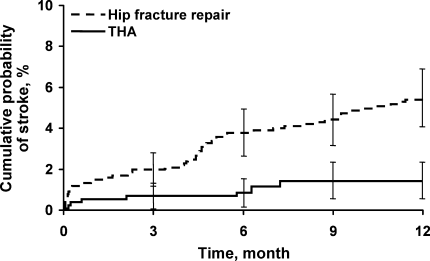
Univariate analyses assessing the rate and risk of postoperative ischemic stroke are shown in Table 2. The rate of stroke was significantly greater among hip fracture repairs than THAs 30 days postoperatively and 1 year postoperatively (1.5% vs. 0.6% and 5.5% vs. 1.5%, respectively; P < 0.001) (Figure 2). In our study we found an annual incidence rate of ischemic stroke of 4093 per 100,000 person‐years (95% confidence interval [CI], 3172‐5198 per 100,000 person‐years). Accounting for death as a competing risk for stroke had little impact on the rate of stroke overall or within the 2 surgical groups (results not shown). Univariate Cox proportional hazards models showed that neither sex nor history of hypertension, diabetes mellitus, COPD, chronic renal insufficiency, or CAD or use of HMG‐CoA reductase inhibitors or ‐blockers were significant predictors of ischemic stroke. However, other clinical risk factors, such as a history of atrial fibrillation (hazard ratio [HR], 2.16; P = 0.005), hip fracture repair vs. THA (HR, 3.80; P < 0.001), increased age (HR, 2.20; P = 0.017), aspirin use (HR, 1.8; P = 0.014), and history of previous stroke (HR, 4.18; P < 0.001), were significantly associated with an increased risk of stroke (Table 2).
| Variable | Number of Patients | Number of Events | Rate (%) | Hazard Ratio | P Value | |
|---|---|---|---|---|---|---|
| 30‐Day (95% CI) | 1‐Year (95% CI) | |||||
| ||||||
| Overall | 1886 | 67 | 1.2 (0.7‐1.7) | 3.9 (3‐4.8) | ||
| Type of operative procedure | ||||||
| THA | 691 | 10 | 0.6 (0.0‐1.1) | 1.5 (0.6‐2.4) | ||
| Hip fracture repair | 1195 | 57 | 1.5 (0.8‐2.2) | 5.5 (4.1‐6.9) | 3.80 (1.94‐7.44) | <0.001 |
| Age at operation, years | ||||||
| <75 | 528 | 11 | 1.0 (0.1‐1.8) | 2.1 (0.9‐3.3) | ||
| 75 | 1358 | 56 | 1.3 (0.7‐1.9) | 4.7 (3.5‐5.8) | 2.20 (1.15‐4.21) | 0.02 |
| Sex | ||||||
| Female | 1394 | 54 | 1.3 (0.7‐1.9) | 4.2 (3.1‐5.3) | ||
| Male | 492 | 13 | 0.8 (0.0‐1.7) | 2.9 (1.3‐4.4) | 0.69 (0.38‐1.27) | 0.24 |
| History of stroke | ||||||
| No | 1502 | 34 | 0.7 (0.3‐1.2) | 2.4 (1.6‐3.3) | ||
| Yes | 384 | 33 | 3.0 (1.2‐4.7) | 9.9 (6.6‐13) | 4.18 (2.59‐6.74) | <0.001 |
| History of hypertension | ||||||
| No | 767 | 23 | 0.8 (0.2‐1.4) | 3.4 (2.0‐4.7) | ||
| Yes | 1119 | 44 | 1.5 (0.7‐2.2) | 4.2 (3.0‐5.5) | 1.29 (0.78‐2.14) | 0.32 |
| History of atrial fibrillation | ||||||
| No | 1573 | 48 | 1.0 (0.5‐1.5) | 3.3 (2.4‐4.2) | ||
| Yes | 313 | 19 | 1.9 (0.4‐3.5) | 7.0 (3.9‐9.9) | 2.16 (1.27‐3.67) | 0.005 |
| History of CAD | ||||||
| No | 1224 | 40 | 1.1 (0.5‐1.6) | 3.5 (2.4‐4.5) | ||
| Yes | 662 | 27 | 1.4 (0.5‐2.3) | 4.7 (2.9‐6.4) | 1.34 (0.82‐2.19) | 0.24 |
| History of COPD | ||||||
| No | 1606 | 62 | 1.4 (0.8‐2.0) | 4.2 (3.1‐5.2) | ||
| Yes | 280 | 5 | 0 (0.0‐0.0) | 2.2 (0.3‐4.1) | 0.49 (0.20‐1.22) | 0.13 |
| History of diabetes mellitus | ||||||
| No | 1688 | 56 | 1.1 (0.6‐1.7) | 3.6 (2.7‐4.5) | ||
| Yes | 198 | 11 | 1.5 (0‐3.3) | 6.3 (2.6‐9.9) | 1.75 (0.92‐3.34) | 0.09 |
| History of renal insufficiency | ||||||
| No | 1718 | 58 | 1.0 (0.5‐1.5) | 3.7 (2.7‐4.6) | ||
| Yes | 168 | 9 | 3.0 (0.4‐5.5) | 5.8 (2‐9.5) | 1.77 (0.88‐3.57) | 0.11 |
| Aspirin use | ||||||
| No | 1349 | 39 | 0.7 (0.2‐1.1) | 3.2 (2.2‐4.2) | ||
| Yes | 537 | 28 | 2.5 (0.1‐3.8) | 5.7 (3.6‐7.7) | 1.86 (1.13‐3.06) | 0.01 |
| ‐Blocker use | ||||||
| No | 1568 | 52 | 1.1 (0.6‐1.6) | 3.6 (2.7‐4.6) | ||
| Yes | 318 | 15 | 1.6 (0.2‐3.0) | 5.1 (2.6‐7.6) | 1.42 (0.81‐2.52) | 0.22 |
| HMG‐CoA reductase inhibitor use | ||||||
| No | 1736 | 63 | 1.2 (0.7‐1.7) | 4.0 (3.0‐4.9) | ||
| Yes (statin/other lipid lowering drugs) | 148 | 4 | 1.4 (0‐3.2) | 2.8 (0.1‐5.4) | 0.70 (0.26‐1.94) | 0.50 |
Because age was associated with the type of surgical procedure (87% of hip fracture repair patients were 75 years or older compared with 45% of THA patients), the effect of hip fracture repair on ischemic stroke was adjusted for age. For similar reasons, sex was also examined as an adjusting factor. Adjustment for age and sex resulted in only a slight attenuation of the HR for hip fracture repair vs. THA, from 3.8 to 3.4. A further analysis also adjusted for history of hypertension and history of atrial fibrillation, both comorbidities commonly associated with ischemic stroke. After adjustment for age, sex, history of hypertension, and history of atrial fibrillation, the risk of ischemic stroke was still significantly greater in the hip fracture repair group than in the THA group (HR, 2.8; 95% CI, 1.4‐5.7; P = 0.005).
To determine the most important predictors of postoperative ischemic stroke, multivariable analysis was conducted with stepwise selection. Potential risk factors included the following: operative procedure type (hip fracture repair vs. THA), age, sex, and history of stroke, hypertension, atrial fibrillation, CAD, COPD, diabetes mellitus, and chronic renal insufficiency, as well as use of ‐blockers, HMG‐CoA reductase inhibitors, and aspirin on hospital admission. Among all these factors, history of stroke (HR, 3.27; P < 0.001) and hip fracture repair vs. THA (HR, 2.74; P = 0.004) were confirmed to be significant predictors of postoperative ischemic stroke; the other factors did not significantly affect the model (Figure 2).
Comment
Our findings contrast those of previous studies that focused on perioperative ischemic stroke rates for specific surgical procedures,2, 8, 9 but do seem concordant with published results for early event rates of cerebrovascular accident or transient ischemic attack (1%) following hip fracture.10 The data from our study suggest that perioperative stroke cumulative probability is relatively high for hip procedures at both 30 days (1.2%) and 1 year (3.9%) after the index surgical procedure compared with general procedures. Subjects with a history of stroke who were undergoing hip operation had a postoperative stroke risk of 3.0% at 30 days and 9.9% at 1 year.
The incidence of stroke was greater in the hip fracture repair group (1.5% at 30 days and 5.5% at 1 year) than in the elective THA group (0.6% at 30 days and 1.5% at 1 year). The increased 1‐year mortality for patients undergoing hip surgery compared with the general population is in part due to cerebrovascular disease,10 and, therefore, the 1‐year stroke incidence is important.
After adjustment for age, sex, and comorbidities (hypertension and atrial fibrillation), the risk of postoperative ischemic stroke was 2.71 times greater in the hip fracture repair group than in the THA group (P = 0.006). These data are important in counseling and caring for patients undergoing different types of hip procedures.
From 1985 through 1989, for the age group (75‐84 years old) that best fits the demographics of our cohort, both men and women had limited variation over time in annual incidence rates of stroke (2149‐1074 strokes per 100,000 population per year) for Olmsted County, MN.11 In our study we found an annual incidence rate of ischemic stroke of 4,093 per 100,000 person‐years (95% CI, 3172‐5198 per 100,000 person‐years). The lower limit of the 95% CI is higher than the rates reported for Olmsted County, suggesting that having hip surgery increases the 1‐year risk of ischemic stroke.
Previous studies have shown that the risk factor most consistently correlated to perioperative ischemic stroke is a history of stroke.9 In our study, history of stroke and type of hip fracture surgery were confirmed to be the strongest predictors of postoperative stroke. History of hypertension, atrial fibrillation, CAD, COPD, diabetes, or chronic renal insufficiency was not correlated to perioperative ischemic stroke.
Nonmodifiable risk factors, such as advanced age, serve as markers of stroke risk and help identify high‐risk populations that may require aggressive intervention. After age adjustment of hip fracture repair, age was no longer significantly associated with postoperative stroke.
Cerebrovascular disease appears to be a marker for CAD, and, therefore, patients with a history of stroke usually have a Revised Cardiac Risk Index that may suggest the use of ‐blockers. According to the recent results of the POISE trial, use of ‐blockers could lead to increased stroke incidence.2 Our results showed no significant correlation between stroke risk and ‐blocker use, but our study period was from 1988 to 2002, when titration of ‐blocker dose to heart rates of 55 to 60 beats per minute was not common practice.
Several studies have confirmed the value of aspirin in decreasing the rate of vascular outcomes after diagnosis of transient ischemic attack or stroke.12 In our study, aspirin use on hospital admission was found in the univariate analysis to be associated with an increased risk of stroke, but this finding was not confirmed after adjustments for age, sex, and comorbid conditions. Aspirin use on admission was not a significant predictor of postoperative stroke, most likely because aspirin use can be considered a marker of increased cardiovascular risk and we adjusted for these comorbid conditions.
The limitations of this study are inherent in its retrospective design. First, we identified all incident cases of stroke after hip operation by reviewing medical records and then abstracting data from those records. We may have missed some mild strokes if they were misclassified as peripheral vestibular neuropathy, migraine, or even seizure. Less likely is that we missed strokes within the first 30 days after the procedure because that is the period in which patients with hip operation are either hospitalized or sent for rehabilitation in skilled nursing facilities. It is known that institutionalization leads to better surveillance and more complete ascertainment of any medical event.
The event rate of postoperative stroke at 30 days after hip operation was low. Therefore, we did not have the statistical power to comment meaningfully on predictors of stroke at 30 days after the hip procedure. Any nonrespondent or volunteer bias was addressed by using data from the Rochester Epidemiology Project, which allowed us to identify all Olmsted County residents who underwent hip operation between 1988 and 2002. The diagnostic suspicion bias was also accounted for in our study design because different physicians provided care and outcome measurement.
Our results apply for the patients who underwent hip operation between 1988 and 2002. The noncardiac surgery guidelines have been revised between 1988 and 2002, and we did not perform a stratified analysis by index year. The next step in our study will be to extend our data collection to 2008 and look at time trends.
Conclusion
In this population‐based historical cohort study, patients undergoing hip operation had a 3.9% cumulative probability of ischemic stroke during the first postoperative year. History of stroke and type of hip procedure (ie, hip fracture repair) were the strongest predictors of this complication. Because history of stroke is such a strong predictor of postoperative stroke, the perioperative management of these patients should probably be tailored, with closely observed blood pressure management and antihypertensive medication adjustment, to avoid compromising cerebral perfusion. Also, to avoid postoperative hypercoagulability that increases the risk of stroke, these patients may need to begin receiving antiplatelets as soon as is surgically acceptable.1315
- .History of the Rochester Epidemiology Project.Mayo Clin Proc.1996;71(3):266–274.
- POISE Study Group;,,,,,, et al.Effects of extended‐release metoprolol succinate in patients undergoing non‐cardiac surgery (POISE trial): a randomised controlled trial.Lancet.2008;371(9627):1839–1847.
- ,,,,,, et al;American Heart Association Statistics Committee and Stroke Statistics Subcommittee. Heart disease and stroke statistics—2006 update: a report from the American Heart Association Statistics Committee and Stroke Statistics Subcommittee.Circulation.2006;113(6):e85–e151.
- Shojania KG, Duncan BW, McDonald KM, Wachter RM, Markowitz AJ, eds.Making health care safer: a critical analysis of patient safety practices. Evidence Report/Technology Assessment No.43.AHRQ publication no. 01‐E058.Rockville, MD:Agency for Healthcare Research and Quality (AHRQ),U.S. Department of Health and Human Services;2001.668 p.
- ,,.Deaths due to medical errors are exaggerated in Institute of Medicine report.JAMA.2000;284(1):93–95.
- ,.Modeling survival data: extending the Cox model.New York:Springer;2000.
- ,,,.Estimation of failure probabilities in the presence of competing risks: new representations of old estimators.Stat Med.1999;18(6):695–706.
- ,,.Postoperative cerebrovascular accidents in general surgery.Acta Anaesthesiol Scand.1988;32(8):698–701.
- ,,,,,, et al.Perioperative stroke risk in 173 consecutive patients with a past history of stroke.Arch Surg.1990;125(8):986–989.
- ,,,,.Medical complications and outcomes after hip fracture repair.Arch Intern Med.2002;162(18):2053–2057.
- ,,,,.Stroke incidence, prevalence, and survival: secular trends in Rochester, Minnesota, through 1989.Stroke.1996;27(3):373–380.
- CAST (Chinese Acute Stroke Trial) Collaborative Group.Randomised placebo‐controlled trial of early aspirin use in 20,000 patients with acute ischaemic stroke.Lancet.1997;349(9066):1641–1649.
- ,,.Coagulation activation and organ dysfunction following cardiac surgery.Chest.2005;128(1):229–236.
- ,,,,,.Intra‐ and postoperative fibrinolysis in patients undergoing cardiopulmonary bypass surgery.Haemostasis.1991;21(1):58–64.
- .Perioperative stroke.N Engl J Med.2007;356(7):706–713.
In the United States, hip operations (internal fixation of fracture or total hip arthroplasty [THA]) are the most common noncardiac major surgical procedures performed in patients age 65 years and older (45.2 procedures per 100,000 persons per year).1 This number of procedures is projected to increase substantially in the coming decades.
Little is known about the clinical predictors of postoperative stroke in patients undergoing hip surgical procedures. Further, recent results of the Perioperative Ischemic Evaluation (POISE) trial have shown that measures taken to reduce cardiac complications postoperatively may adversely affect the risk of stroke.2 The POISE study showed decreases in myocardial infarction and coronary revascularization but accompanying increases in stroke and death with use of ‐blockers in patients undergoing noncardiac surgery.
Prevention of adverse events is one of the top priorities of the U.S. health care system today.35 Risk stratification and therapeutic optimization of underlying chronic diseases may be important in decreasing perioperative risk and improving postoperative outcomes.
Our objective was to determine the rate of postoperative ischemic stroke in all residents of Olmsted County, MN, who underwent hip operation between 1988 and 2002 and to identify clinical predictors of postoperative stroke.
Subjects and Methods
Olmsted County is one of the few places in the world where comprehensive population‐based studies of disease etiology and outcomes are feasible. This feasibility is due to the Rochester Epidemiology Project, a medical records linkage system that provides access to the records of all medical care in the community.1 All medical diagnoses made for a resident of Olmsted County are entered on a master sheet in the patient's medical record, which is then entered into a central computer index.
Hip operations were identified using the Surgical Information Recording System data warehouse, where detailed data are stored as International Classification of Diseases, 9th edition (ICD‐9) codes for all surgical procedures performed from January 1, 1988, forward. A total of 2028 THAs and hip fracture repairs (ICD‐9 codes 81.51, 81.52, 81.53, 79.15, and 79.25) performed between 1988 and 2002 in Olmsted County were identified. Of the hip procedures, 142 were excluded (Figure 1). The final analysis cohort contained 1886 hip operations1195 hip fracture repairs and 691 THAs.
The population‐based cohort was assembled and the data were abstracted from complete inpatient and outpatient records from admission for surgical treatment up to 1 year after surgery. Only those patients who had given prior authorization for research were included in the study cohort. The Mayo Clinic Institutional Review Board approved the study.
Case Ascertainment
We used several screening procedures to completely enumerate all postoperative strokes in our study population (Figure 1). The Mayo Clinic administrative database was used to identify all cases with relevant cerebrovascular disease (ICD‐9 codes 430.0‐437.9, 368.12, 781.4, and 784.3) within 1 year after hip operation. The Rochester Stroke Registry identified incident cases of ischemic stroke in Olmsted County from 1988 through 1994. The clinic's administrative database was also used to identify brain imaging studies (brain computed tomography, magnetic resonance imaging, or carotid ultrasonography) between the day of the procedure and 1 year postoperatively. A neurologist reviewed each image and the associated medical record identified during the screening process in detail for the constellation of signs and symptoms consistent with the diagnosis of stroke. Death certificates and autopsy reports were also reviewed to identify persons with the diagnosis of stroke. The outcome (stroke) was masked to the nurse abstractor who reviewed charts for predictors of postoperative stroke (eg, atrial fibrillation, coronary artery disease [CAD], history of stroke, medication use). The exposed or unexposed status of the patients to the predictors of stroke was masked to the physician (A.S.P.) who screened electronic medical records for the outcome measure (stroke).
Cerebral infarction or ischemic stroke was defined as the acute onset of a neurologic deficit that persisted for longer than 24 hours and corresponded to an arterial vascular territory of the cerebral hemispheres, brainstem, or cerebellum, with or without computed tomographic or magnetic resonance imaging documentation. Transient ischemic attack was defined as an episode of focal neurologic symptoms with abrupt onset and rapid resolution, lasting less than 24 hours, and due to altered circulation to a limited region of the brain.
Only patients with ischemic strokes clinically documented by a neurologist were included in the analysis.
Primary Outcomes
Outcomes were the cumulative probability of ischemic stroke and predictors of stroke in the first 12 months after surgical treatment of the hip.
Statistical Analysis
Continuous variables are presented as mean (standard deviation [SD]); categorical variables are presented as number and percentage. Two‐sample t tests or Wilcoxon rank sum tests were used to test for differences between THAs and hip fracture repairs in demographic characteristics, past medical history, and baseline clinical data composed of continuous variables; 2 or Fisher exact tests were used for categorical variables. No patient was lost to follow‐up during the 1 year after the initial surgery. However, the data of patients who died or had a second hip procedure within that period were censored.
The rate of ischemic stroke within 1 year after the incident hip procedure was calculated using the Kaplan‐Meier method. Second hip procedures within that period were counted as additional cases. Rates were calculated for the overall group, as well as for the univariate risk factors of operative procedure type, age, sex, past medical history of stroke, hypertension, atrial fibrillation, CAD, chronic obstructive pulmonary disease (COPD), diabetes mellitus, and chronic renal insufficiency. Use of ‐blockers, hydroxymethylglutaryl‐coenzyme A (HMG‐CoA) reductase inhibitors, or aspirin at hospital admission was also considered. Cox proportional hazards regression models were used to evaluate the risk of ischemic stroke for each of these univariate risk factors. Multivariable Cox proportional hazards models were constructed with adjustments for operative procedure type, age, sex, and comorbid conditions such as atrial fibrillation and hypertension. These covariates were added in a stepwise selection to identify factors significantly associated with the outcome. To account for patients who had a second hip procedure within 1 year of their first operation, we calculated all Cox proportional hazards regression results using the robust sandwich estimate of the covariance matrix. The proportional hazards assumption for all Cox models was evaluated with the methods proposed by Therneau and Grambsch;6 no violations of this assumption were identified. The rate of postoperative stroke after adjusting for the competing risk of death was calculated using the approach of Gooley et al.7 All statistical tests were 2‐sided, and a P value was considered significant if it was less than 0.05. Statistical analyses were performed using statistical software (SAS version 9.1.3; SAS Institute, Inc., Cary, NC).
Results
Among the patients with the 1886 hip procedures, 67 ischemic strokes were identified within 1 year after the index surgical procedure10 (1.4%) among the 691 THAs and 57 (4.8%) among the 1195 hip fracture repairs. Baseline characteristics are summarized in Table 1. Compared with the THA group, patients in the hip fracture repair group were more likely to be older and female. Additionally, such comorbid conditions as a history of stroke, diabetes mellitus, congestive heart failure, atrial fibrillation, or dementia were more prevalent in the hip fracture repair group.
| Characteristics | Surgical Procedure | Total (n = 1,886) | P Value* | |
|---|---|---|---|---|
| THA (n = 691) | Fracture Repair (n = 1,195) | |||
| ||||
| Age, years | 74.9 (6.59) | 84.2 (7.49) | 80.8 (8.46) | <0.001 |
| Sex, male | 258 (37.3) | 234 (19.6) | 492 (26.1) | <0.001 |
| Race, White | 690 (100) | 1,187 (99.3) | 1,877 (99.5) | 0.17 |
| BMI | 27.7 (5.36) | 23.3 (4.93) | 24.9 (5.52) | <0.001 |
| History | ||||
| Hypertension | 424 (61.4) | 695 (58.2) | 1,119 (59.3) | 0.17 |
| Diabetes | 57 (8.2) | 141 (11.8) | 198 (10.5) | 0.02 |
| Stroke | 50 (7.2) | 334 (27.9) | 384 (20.4) | <0.001 |
| CHF | 100 (14.5) | 321 (26.9) | 421 (22.3) | <0.001 |
| Atrial fibrillation | 72 (10.4) | 241 (20.2) | 313 (16.6) | <0.001 |
| Dementia | 16 (2.3) | 407 (34.1) | 423 (22.4) | <0.001 |
| ASA risk classification | <0.001 | |||
| 1 or 2 | 343 (49.6) | 172 (14.4) | 515 (27.3) | |
| 3, 4, or 5 | 348 (50.4) | 1,022 (85.6) | 1,370 (72.7) | |
| Medication on admission | ||||
| Aspirin | 168 (24.3) | 369 (30.9) | 537 (28.5) | 0.002 |
| ‐Blocker | 134 (19.4) | 184 (15.4) | 318 (16.9) | 0.03 |
| Insulin | 12 (1.7) | 48 (4) | 60 (3.2) | 0.007 |
| Length of stay, days | 7.3 (3.9) | 10.0 (7.61) | 9.0 (6.63) | <0.001 |
Univariate analyses assessing the rate and risk of postoperative ischemic stroke are shown in Table 2. The rate of stroke was significantly greater among hip fracture repairs than THAs 30 days postoperatively and 1 year postoperatively (1.5% vs. 0.6% and 5.5% vs. 1.5%, respectively; P < 0.001) (Figure 2). In our study we found an annual incidence rate of ischemic stroke of 4093 per 100,000 person‐years (95% confidence interval [CI], 3172‐5198 per 100,000 person‐years). Accounting for death as a competing risk for stroke had little impact on the rate of stroke overall or within the 2 surgical groups (results not shown). Univariate Cox proportional hazards models showed that neither sex nor history of hypertension, diabetes mellitus, COPD, chronic renal insufficiency, or CAD or use of HMG‐CoA reductase inhibitors or ‐blockers were significant predictors of ischemic stroke. However, other clinical risk factors, such as a history of atrial fibrillation (hazard ratio [HR], 2.16; P = 0.005), hip fracture repair vs. THA (HR, 3.80; P < 0.001), increased age (HR, 2.20; P = 0.017), aspirin use (HR, 1.8; P = 0.014), and history of previous stroke (HR, 4.18; P < 0.001), were significantly associated with an increased risk of stroke (Table 2).
| Variable | Number of Patients | Number of Events | Rate (%) | Hazard Ratio | P Value | |
|---|---|---|---|---|---|---|
| 30‐Day (95% CI) | 1‐Year (95% CI) | |||||
| ||||||
| Overall | 1886 | 67 | 1.2 (0.7‐1.7) | 3.9 (3‐4.8) | ||
| Type of operative procedure | ||||||
| THA | 691 | 10 | 0.6 (0.0‐1.1) | 1.5 (0.6‐2.4) | ||
| Hip fracture repair | 1195 | 57 | 1.5 (0.8‐2.2) | 5.5 (4.1‐6.9) | 3.80 (1.94‐7.44) | <0.001 |
| Age at operation, years | ||||||
| <75 | 528 | 11 | 1.0 (0.1‐1.8) | 2.1 (0.9‐3.3) | ||
| 75 | 1358 | 56 | 1.3 (0.7‐1.9) | 4.7 (3.5‐5.8) | 2.20 (1.15‐4.21) | 0.02 |
| Sex | ||||||
| Female | 1394 | 54 | 1.3 (0.7‐1.9) | 4.2 (3.1‐5.3) | ||
| Male | 492 | 13 | 0.8 (0.0‐1.7) | 2.9 (1.3‐4.4) | 0.69 (0.38‐1.27) | 0.24 |
| History of stroke | ||||||
| No | 1502 | 34 | 0.7 (0.3‐1.2) | 2.4 (1.6‐3.3) | ||
| Yes | 384 | 33 | 3.0 (1.2‐4.7) | 9.9 (6.6‐13) | 4.18 (2.59‐6.74) | <0.001 |
| History of hypertension | ||||||
| No | 767 | 23 | 0.8 (0.2‐1.4) | 3.4 (2.0‐4.7) | ||
| Yes | 1119 | 44 | 1.5 (0.7‐2.2) | 4.2 (3.0‐5.5) | 1.29 (0.78‐2.14) | 0.32 |
| History of atrial fibrillation | ||||||
| No | 1573 | 48 | 1.0 (0.5‐1.5) | 3.3 (2.4‐4.2) | ||
| Yes | 313 | 19 | 1.9 (0.4‐3.5) | 7.0 (3.9‐9.9) | 2.16 (1.27‐3.67) | 0.005 |
| History of CAD | ||||||
| No | 1224 | 40 | 1.1 (0.5‐1.6) | 3.5 (2.4‐4.5) | ||
| Yes | 662 | 27 | 1.4 (0.5‐2.3) | 4.7 (2.9‐6.4) | 1.34 (0.82‐2.19) | 0.24 |
| History of COPD | ||||||
| No | 1606 | 62 | 1.4 (0.8‐2.0) | 4.2 (3.1‐5.2) | ||
| Yes | 280 | 5 | 0 (0.0‐0.0) | 2.2 (0.3‐4.1) | 0.49 (0.20‐1.22) | 0.13 |
| History of diabetes mellitus | ||||||
| No | 1688 | 56 | 1.1 (0.6‐1.7) | 3.6 (2.7‐4.5) | ||
| Yes | 198 | 11 | 1.5 (0‐3.3) | 6.3 (2.6‐9.9) | 1.75 (0.92‐3.34) | 0.09 |
| History of renal insufficiency | ||||||
| No | 1718 | 58 | 1.0 (0.5‐1.5) | 3.7 (2.7‐4.6) | ||
| Yes | 168 | 9 | 3.0 (0.4‐5.5) | 5.8 (2‐9.5) | 1.77 (0.88‐3.57) | 0.11 |
| Aspirin use | ||||||
| No | 1349 | 39 | 0.7 (0.2‐1.1) | 3.2 (2.2‐4.2) | ||
| Yes | 537 | 28 | 2.5 (0.1‐3.8) | 5.7 (3.6‐7.7) | 1.86 (1.13‐3.06) | 0.01 |
| ‐Blocker use | ||||||
| No | 1568 | 52 | 1.1 (0.6‐1.6) | 3.6 (2.7‐4.6) | ||
| Yes | 318 | 15 | 1.6 (0.2‐3.0) | 5.1 (2.6‐7.6) | 1.42 (0.81‐2.52) | 0.22 |
| HMG‐CoA reductase inhibitor use | ||||||
| No | 1736 | 63 | 1.2 (0.7‐1.7) | 4.0 (3.0‐4.9) | ||
| Yes (statin/other lipid lowering drugs) | 148 | 4 | 1.4 (0‐3.2) | 2.8 (0.1‐5.4) | 0.70 (0.26‐1.94) | 0.50 |
Because age was associated with the type of surgical procedure (87% of hip fracture repair patients were 75 years or older compared with 45% of THA patients), the effect of hip fracture repair on ischemic stroke was adjusted for age. For similar reasons, sex was also examined as an adjusting factor. Adjustment for age and sex resulted in only a slight attenuation of the HR for hip fracture repair vs. THA, from 3.8 to 3.4. A further analysis also adjusted for history of hypertension and history of atrial fibrillation, both comorbidities commonly associated with ischemic stroke. After adjustment for age, sex, history of hypertension, and history of atrial fibrillation, the risk of ischemic stroke was still significantly greater in the hip fracture repair group than in the THA group (HR, 2.8; 95% CI, 1.4‐5.7; P = 0.005).
To determine the most important predictors of postoperative ischemic stroke, multivariable analysis was conducted with stepwise selection. Potential risk factors included the following: operative procedure type (hip fracture repair vs. THA), age, sex, and history of stroke, hypertension, atrial fibrillation, CAD, COPD, diabetes mellitus, and chronic renal insufficiency, as well as use of ‐blockers, HMG‐CoA reductase inhibitors, and aspirin on hospital admission. Among all these factors, history of stroke (HR, 3.27; P < 0.001) and hip fracture repair vs. THA (HR, 2.74; P = 0.004) were confirmed to be significant predictors of postoperative ischemic stroke; the other factors did not significantly affect the model (Figure 2).
Comment
Our findings contrast those of previous studies that focused on perioperative ischemic stroke rates for specific surgical procedures,2, 8, 9 but do seem concordant with published results for early event rates of cerebrovascular accident or transient ischemic attack (1%) following hip fracture.10 The data from our study suggest that perioperative stroke cumulative probability is relatively high for hip procedures at both 30 days (1.2%) and 1 year (3.9%) after the index surgical procedure compared with general procedures. Subjects with a history of stroke who were undergoing hip operation had a postoperative stroke risk of 3.0% at 30 days and 9.9% at 1 year.
The incidence of stroke was greater in the hip fracture repair group (1.5% at 30 days and 5.5% at 1 year) than in the elective THA group (0.6% at 30 days and 1.5% at 1 year). The increased 1‐year mortality for patients undergoing hip surgery compared with the general population is in part due to cerebrovascular disease,10 and, therefore, the 1‐year stroke incidence is important.
After adjustment for age, sex, and comorbidities (hypertension and atrial fibrillation), the risk of postoperative ischemic stroke was 2.71 times greater in the hip fracture repair group than in the THA group (P = 0.006). These data are important in counseling and caring for patients undergoing different types of hip procedures.
From 1985 through 1989, for the age group (75‐84 years old) that best fits the demographics of our cohort, both men and women had limited variation over time in annual incidence rates of stroke (2149‐1074 strokes per 100,000 population per year) for Olmsted County, MN.11 In our study we found an annual incidence rate of ischemic stroke of 4,093 per 100,000 person‐years (95% CI, 3172‐5198 per 100,000 person‐years). The lower limit of the 95% CI is higher than the rates reported for Olmsted County, suggesting that having hip surgery increases the 1‐year risk of ischemic stroke.
Previous studies have shown that the risk factor most consistently correlated to perioperative ischemic stroke is a history of stroke.9 In our study, history of stroke and type of hip fracture surgery were confirmed to be the strongest predictors of postoperative stroke. History of hypertension, atrial fibrillation, CAD, COPD, diabetes, or chronic renal insufficiency was not correlated to perioperative ischemic stroke.
Nonmodifiable risk factors, such as advanced age, serve as markers of stroke risk and help identify high‐risk populations that may require aggressive intervention. After age adjustment of hip fracture repair, age was no longer significantly associated with postoperative stroke.
Cerebrovascular disease appears to be a marker for CAD, and, therefore, patients with a history of stroke usually have a Revised Cardiac Risk Index that may suggest the use of ‐blockers. According to the recent results of the POISE trial, use of ‐blockers could lead to increased stroke incidence.2 Our results showed no significant correlation between stroke risk and ‐blocker use, but our study period was from 1988 to 2002, when titration of ‐blocker dose to heart rates of 55 to 60 beats per minute was not common practice.
Several studies have confirmed the value of aspirin in decreasing the rate of vascular outcomes after diagnosis of transient ischemic attack or stroke.12 In our study, aspirin use on hospital admission was found in the univariate analysis to be associated with an increased risk of stroke, but this finding was not confirmed after adjustments for age, sex, and comorbid conditions. Aspirin use on admission was not a significant predictor of postoperative stroke, most likely because aspirin use can be considered a marker of increased cardiovascular risk and we adjusted for these comorbid conditions.
The limitations of this study are inherent in its retrospective design. First, we identified all incident cases of stroke after hip operation by reviewing medical records and then abstracting data from those records. We may have missed some mild strokes if they were misclassified as peripheral vestibular neuropathy, migraine, or even seizure. Less likely is that we missed strokes within the first 30 days after the procedure because that is the period in which patients with hip operation are either hospitalized or sent for rehabilitation in skilled nursing facilities. It is known that institutionalization leads to better surveillance and more complete ascertainment of any medical event.
The event rate of postoperative stroke at 30 days after hip operation was low. Therefore, we did not have the statistical power to comment meaningfully on predictors of stroke at 30 days after the hip procedure. Any nonrespondent or volunteer bias was addressed by using data from the Rochester Epidemiology Project, which allowed us to identify all Olmsted County residents who underwent hip operation between 1988 and 2002. The diagnostic suspicion bias was also accounted for in our study design because different physicians provided care and outcome measurement.
Our results apply for the patients who underwent hip operation between 1988 and 2002. The noncardiac surgery guidelines have been revised between 1988 and 2002, and we did not perform a stratified analysis by index year. The next step in our study will be to extend our data collection to 2008 and look at time trends.
Conclusion
In this population‐based historical cohort study, patients undergoing hip operation had a 3.9% cumulative probability of ischemic stroke during the first postoperative year. History of stroke and type of hip procedure (ie, hip fracture repair) were the strongest predictors of this complication. Because history of stroke is such a strong predictor of postoperative stroke, the perioperative management of these patients should probably be tailored, with closely observed blood pressure management and antihypertensive medication adjustment, to avoid compromising cerebral perfusion. Also, to avoid postoperative hypercoagulability that increases the risk of stroke, these patients may need to begin receiving antiplatelets as soon as is surgically acceptable.1315
In the United States, hip operations (internal fixation of fracture or total hip arthroplasty [THA]) are the most common noncardiac major surgical procedures performed in patients age 65 years and older (45.2 procedures per 100,000 persons per year).1 This number of procedures is projected to increase substantially in the coming decades.
Little is known about the clinical predictors of postoperative stroke in patients undergoing hip surgical procedures. Further, recent results of the Perioperative Ischemic Evaluation (POISE) trial have shown that measures taken to reduce cardiac complications postoperatively may adversely affect the risk of stroke.2 The POISE study showed decreases in myocardial infarction and coronary revascularization but accompanying increases in stroke and death with use of ‐blockers in patients undergoing noncardiac surgery.
Prevention of adverse events is one of the top priorities of the U.S. health care system today.35 Risk stratification and therapeutic optimization of underlying chronic diseases may be important in decreasing perioperative risk and improving postoperative outcomes.
Our objective was to determine the rate of postoperative ischemic stroke in all residents of Olmsted County, MN, who underwent hip operation between 1988 and 2002 and to identify clinical predictors of postoperative stroke.
Subjects and Methods
Olmsted County is one of the few places in the world where comprehensive population‐based studies of disease etiology and outcomes are feasible. This feasibility is due to the Rochester Epidemiology Project, a medical records linkage system that provides access to the records of all medical care in the community.1 All medical diagnoses made for a resident of Olmsted County are entered on a master sheet in the patient's medical record, which is then entered into a central computer index.
Hip operations were identified using the Surgical Information Recording System data warehouse, where detailed data are stored as International Classification of Diseases, 9th edition (ICD‐9) codes for all surgical procedures performed from January 1, 1988, forward. A total of 2028 THAs and hip fracture repairs (ICD‐9 codes 81.51, 81.52, 81.53, 79.15, and 79.25) performed between 1988 and 2002 in Olmsted County were identified. Of the hip procedures, 142 were excluded (Figure 1). The final analysis cohort contained 1886 hip operations1195 hip fracture repairs and 691 THAs.
The population‐based cohort was assembled and the data were abstracted from complete inpatient and outpatient records from admission for surgical treatment up to 1 year after surgery. Only those patients who had given prior authorization for research were included in the study cohort. The Mayo Clinic Institutional Review Board approved the study.
Case Ascertainment
We used several screening procedures to completely enumerate all postoperative strokes in our study population (Figure 1). The Mayo Clinic administrative database was used to identify all cases with relevant cerebrovascular disease (ICD‐9 codes 430.0‐437.9, 368.12, 781.4, and 784.3) within 1 year after hip operation. The Rochester Stroke Registry identified incident cases of ischemic stroke in Olmsted County from 1988 through 1994. The clinic's administrative database was also used to identify brain imaging studies (brain computed tomography, magnetic resonance imaging, or carotid ultrasonography) between the day of the procedure and 1 year postoperatively. A neurologist reviewed each image and the associated medical record identified during the screening process in detail for the constellation of signs and symptoms consistent with the diagnosis of stroke. Death certificates and autopsy reports were also reviewed to identify persons with the diagnosis of stroke. The outcome (stroke) was masked to the nurse abstractor who reviewed charts for predictors of postoperative stroke (eg, atrial fibrillation, coronary artery disease [CAD], history of stroke, medication use). The exposed or unexposed status of the patients to the predictors of stroke was masked to the physician (A.S.P.) who screened electronic medical records for the outcome measure (stroke).
Cerebral infarction or ischemic stroke was defined as the acute onset of a neurologic deficit that persisted for longer than 24 hours and corresponded to an arterial vascular territory of the cerebral hemispheres, brainstem, or cerebellum, with or without computed tomographic or magnetic resonance imaging documentation. Transient ischemic attack was defined as an episode of focal neurologic symptoms with abrupt onset and rapid resolution, lasting less than 24 hours, and due to altered circulation to a limited region of the brain.
Only patients with ischemic strokes clinically documented by a neurologist were included in the analysis.
Primary Outcomes
Outcomes were the cumulative probability of ischemic stroke and predictors of stroke in the first 12 months after surgical treatment of the hip.
Statistical Analysis
Continuous variables are presented as mean (standard deviation [SD]); categorical variables are presented as number and percentage. Two‐sample t tests or Wilcoxon rank sum tests were used to test for differences between THAs and hip fracture repairs in demographic characteristics, past medical history, and baseline clinical data composed of continuous variables; 2 or Fisher exact tests were used for categorical variables. No patient was lost to follow‐up during the 1 year after the initial surgery. However, the data of patients who died or had a second hip procedure within that period were censored.
The rate of ischemic stroke within 1 year after the incident hip procedure was calculated using the Kaplan‐Meier method. Second hip procedures within that period were counted as additional cases. Rates were calculated for the overall group, as well as for the univariate risk factors of operative procedure type, age, sex, past medical history of stroke, hypertension, atrial fibrillation, CAD, chronic obstructive pulmonary disease (COPD), diabetes mellitus, and chronic renal insufficiency. Use of ‐blockers, hydroxymethylglutaryl‐coenzyme A (HMG‐CoA) reductase inhibitors, or aspirin at hospital admission was also considered. Cox proportional hazards regression models were used to evaluate the risk of ischemic stroke for each of these univariate risk factors. Multivariable Cox proportional hazards models were constructed with adjustments for operative procedure type, age, sex, and comorbid conditions such as atrial fibrillation and hypertension. These covariates were added in a stepwise selection to identify factors significantly associated with the outcome. To account for patients who had a second hip procedure within 1 year of their first operation, we calculated all Cox proportional hazards regression results using the robust sandwich estimate of the covariance matrix. The proportional hazards assumption for all Cox models was evaluated with the methods proposed by Therneau and Grambsch;6 no violations of this assumption were identified. The rate of postoperative stroke after adjusting for the competing risk of death was calculated using the approach of Gooley et al.7 All statistical tests were 2‐sided, and a P value was considered significant if it was less than 0.05. Statistical analyses were performed using statistical software (SAS version 9.1.3; SAS Institute, Inc., Cary, NC).
Results
Among the patients with the 1886 hip procedures, 67 ischemic strokes were identified within 1 year after the index surgical procedure10 (1.4%) among the 691 THAs and 57 (4.8%) among the 1195 hip fracture repairs. Baseline characteristics are summarized in Table 1. Compared with the THA group, patients in the hip fracture repair group were more likely to be older and female. Additionally, such comorbid conditions as a history of stroke, diabetes mellitus, congestive heart failure, atrial fibrillation, or dementia were more prevalent in the hip fracture repair group.
| Characteristics | Surgical Procedure | Total (n = 1,886) | P Value* | |
|---|---|---|---|---|
| THA (n = 691) | Fracture Repair (n = 1,195) | |||
| ||||
| Age, years | 74.9 (6.59) | 84.2 (7.49) | 80.8 (8.46) | <0.001 |
| Sex, male | 258 (37.3) | 234 (19.6) | 492 (26.1) | <0.001 |
| Race, White | 690 (100) | 1,187 (99.3) | 1,877 (99.5) | 0.17 |
| BMI | 27.7 (5.36) | 23.3 (4.93) | 24.9 (5.52) | <0.001 |
| History | ||||
| Hypertension | 424 (61.4) | 695 (58.2) | 1,119 (59.3) | 0.17 |
| Diabetes | 57 (8.2) | 141 (11.8) | 198 (10.5) | 0.02 |
| Stroke | 50 (7.2) | 334 (27.9) | 384 (20.4) | <0.001 |
| CHF | 100 (14.5) | 321 (26.9) | 421 (22.3) | <0.001 |
| Atrial fibrillation | 72 (10.4) | 241 (20.2) | 313 (16.6) | <0.001 |
| Dementia | 16 (2.3) | 407 (34.1) | 423 (22.4) | <0.001 |
| ASA risk classification | <0.001 | |||
| 1 or 2 | 343 (49.6) | 172 (14.4) | 515 (27.3) | |
| 3, 4, or 5 | 348 (50.4) | 1,022 (85.6) | 1,370 (72.7) | |
| Medication on admission | ||||
| Aspirin | 168 (24.3) | 369 (30.9) | 537 (28.5) | 0.002 |
| ‐Blocker | 134 (19.4) | 184 (15.4) | 318 (16.9) | 0.03 |
| Insulin | 12 (1.7) | 48 (4) | 60 (3.2) | 0.007 |
| Length of stay, days | 7.3 (3.9) | 10.0 (7.61) | 9.0 (6.63) | <0.001 |
Univariate analyses assessing the rate and risk of postoperative ischemic stroke are shown in Table 2. The rate of stroke was significantly greater among hip fracture repairs than THAs 30 days postoperatively and 1 year postoperatively (1.5% vs. 0.6% and 5.5% vs. 1.5%, respectively; P < 0.001) (Figure 2). In our study we found an annual incidence rate of ischemic stroke of 4093 per 100,000 person‐years (95% confidence interval [CI], 3172‐5198 per 100,000 person‐years). Accounting for death as a competing risk for stroke had little impact on the rate of stroke overall or within the 2 surgical groups (results not shown). Univariate Cox proportional hazards models showed that neither sex nor history of hypertension, diabetes mellitus, COPD, chronic renal insufficiency, or CAD or use of HMG‐CoA reductase inhibitors or ‐blockers were significant predictors of ischemic stroke. However, other clinical risk factors, such as a history of atrial fibrillation (hazard ratio [HR], 2.16; P = 0.005), hip fracture repair vs. THA (HR, 3.80; P < 0.001), increased age (HR, 2.20; P = 0.017), aspirin use (HR, 1.8; P = 0.014), and history of previous stroke (HR, 4.18; P < 0.001), were significantly associated with an increased risk of stroke (Table 2).
| Variable | Number of Patients | Number of Events | Rate (%) | Hazard Ratio | P Value | |
|---|---|---|---|---|---|---|
| 30‐Day (95% CI) | 1‐Year (95% CI) | |||||
| ||||||
| Overall | 1886 | 67 | 1.2 (0.7‐1.7) | 3.9 (3‐4.8) | ||
| Type of operative procedure | ||||||
| THA | 691 | 10 | 0.6 (0.0‐1.1) | 1.5 (0.6‐2.4) | ||
| Hip fracture repair | 1195 | 57 | 1.5 (0.8‐2.2) | 5.5 (4.1‐6.9) | 3.80 (1.94‐7.44) | <0.001 |
| Age at operation, years | ||||||
| <75 | 528 | 11 | 1.0 (0.1‐1.8) | 2.1 (0.9‐3.3) | ||
| 75 | 1358 | 56 | 1.3 (0.7‐1.9) | 4.7 (3.5‐5.8) | 2.20 (1.15‐4.21) | 0.02 |
| Sex | ||||||
| Female | 1394 | 54 | 1.3 (0.7‐1.9) | 4.2 (3.1‐5.3) | ||
| Male | 492 | 13 | 0.8 (0.0‐1.7) | 2.9 (1.3‐4.4) | 0.69 (0.38‐1.27) | 0.24 |
| History of stroke | ||||||
| No | 1502 | 34 | 0.7 (0.3‐1.2) | 2.4 (1.6‐3.3) | ||
| Yes | 384 | 33 | 3.0 (1.2‐4.7) | 9.9 (6.6‐13) | 4.18 (2.59‐6.74) | <0.001 |
| History of hypertension | ||||||
| No | 767 | 23 | 0.8 (0.2‐1.4) | 3.4 (2.0‐4.7) | ||
| Yes | 1119 | 44 | 1.5 (0.7‐2.2) | 4.2 (3.0‐5.5) | 1.29 (0.78‐2.14) | 0.32 |
| History of atrial fibrillation | ||||||
| No | 1573 | 48 | 1.0 (0.5‐1.5) | 3.3 (2.4‐4.2) | ||
| Yes | 313 | 19 | 1.9 (0.4‐3.5) | 7.0 (3.9‐9.9) | 2.16 (1.27‐3.67) | 0.005 |
| History of CAD | ||||||
| No | 1224 | 40 | 1.1 (0.5‐1.6) | 3.5 (2.4‐4.5) | ||
| Yes | 662 | 27 | 1.4 (0.5‐2.3) | 4.7 (2.9‐6.4) | 1.34 (0.82‐2.19) | 0.24 |
| History of COPD | ||||||
| No | 1606 | 62 | 1.4 (0.8‐2.0) | 4.2 (3.1‐5.2) | ||
| Yes | 280 | 5 | 0 (0.0‐0.0) | 2.2 (0.3‐4.1) | 0.49 (0.20‐1.22) | 0.13 |
| History of diabetes mellitus | ||||||
| No | 1688 | 56 | 1.1 (0.6‐1.7) | 3.6 (2.7‐4.5) | ||
| Yes | 198 | 11 | 1.5 (0‐3.3) | 6.3 (2.6‐9.9) | 1.75 (0.92‐3.34) | 0.09 |
| History of renal insufficiency | ||||||
| No | 1718 | 58 | 1.0 (0.5‐1.5) | 3.7 (2.7‐4.6) | ||
| Yes | 168 | 9 | 3.0 (0.4‐5.5) | 5.8 (2‐9.5) | 1.77 (0.88‐3.57) | 0.11 |
| Aspirin use | ||||||
| No | 1349 | 39 | 0.7 (0.2‐1.1) | 3.2 (2.2‐4.2) | ||
| Yes | 537 | 28 | 2.5 (0.1‐3.8) | 5.7 (3.6‐7.7) | 1.86 (1.13‐3.06) | 0.01 |
| ‐Blocker use | ||||||
| No | 1568 | 52 | 1.1 (0.6‐1.6) | 3.6 (2.7‐4.6) | ||
| Yes | 318 | 15 | 1.6 (0.2‐3.0) | 5.1 (2.6‐7.6) | 1.42 (0.81‐2.52) | 0.22 |
| HMG‐CoA reductase inhibitor use | ||||||
| No | 1736 | 63 | 1.2 (0.7‐1.7) | 4.0 (3.0‐4.9) | ||
| Yes (statin/other lipid lowering drugs) | 148 | 4 | 1.4 (0‐3.2) | 2.8 (0.1‐5.4) | 0.70 (0.26‐1.94) | 0.50 |
Because age was associated with the type of surgical procedure (87% of hip fracture repair patients were 75 years or older compared with 45% of THA patients), the effect of hip fracture repair on ischemic stroke was adjusted for age. For similar reasons, sex was also examined as an adjusting factor. Adjustment for age and sex resulted in only a slight attenuation of the HR for hip fracture repair vs. THA, from 3.8 to 3.4. A further analysis also adjusted for history of hypertension and history of atrial fibrillation, both comorbidities commonly associated with ischemic stroke. After adjustment for age, sex, history of hypertension, and history of atrial fibrillation, the risk of ischemic stroke was still significantly greater in the hip fracture repair group than in the THA group (HR, 2.8; 95% CI, 1.4‐5.7; P = 0.005).
To determine the most important predictors of postoperative ischemic stroke, multivariable analysis was conducted with stepwise selection. Potential risk factors included the following: operative procedure type (hip fracture repair vs. THA), age, sex, and history of stroke, hypertension, atrial fibrillation, CAD, COPD, diabetes mellitus, and chronic renal insufficiency, as well as use of ‐blockers, HMG‐CoA reductase inhibitors, and aspirin on hospital admission. Among all these factors, history of stroke (HR, 3.27; P < 0.001) and hip fracture repair vs. THA (HR, 2.74; P = 0.004) were confirmed to be significant predictors of postoperative ischemic stroke; the other factors did not significantly affect the model (Figure 2).
Comment
Our findings contrast those of previous studies that focused on perioperative ischemic stroke rates for specific surgical procedures,2, 8, 9 but do seem concordant with published results for early event rates of cerebrovascular accident or transient ischemic attack (1%) following hip fracture.10 The data from our study suggest that perioperative stroke cumulative probability is relatively high for hip procedures at both 30 days (1.2%) and 1 year (3.9%) after the index surgical procedure compared with general procedures. Subjects with a history of stroke who were undergoing hip operation had a postoperative stroke risk of 3.0% at 30 days and 9.9% at 1 year.
The incidence of stroke was greater in the hip fracture repair group (1.5% at 30 days and 5.5% at 1 year) than in the elective THA group (0.6% at 30 days and 1.5% at 1 year). The increased 1‐year mortality for patients undergoing hip surgery compared with the general population is in part due to cerebrovascular disease,10 and, therefore, the 1‐year stroke incidence is important.
After adjustment for age, sex, and comorbidities (hypertension and atrial fibrillation), the risk of postoperative ischemic stroke was 2.71 times greater in the hip fracture repair group than in the THA group (P = 0.006). These data are important in counseling and caring for patients undergoing different types of hip procedures.
From 1985 through 1989, for the age group (75‐84 years old) that best fits the demographics of our cohort, both men and women had limited variation over time in annual incidence rates of stroke (2149‐1074 strokes per 100,000 population per year) for Olmsted County, MN.11 In our study we found an annual incidence rate of ischemic stroke of 4,093 per 100,000 person‐years (95% CI, 3172‐5198 per 100,000 person‐years). The lower limit of the 95% CI is higher than the rates reported for Olmsted County, suggesting that having hip surgery increases the 1‐year risk of ischemic stroke.
Previous studies have shown that the risk factor most consistently correlated to perioperative ischemic stroke is a history of stroke.9 In our study, history of stroke and type of hip fracture surgery were confirmed to be the strongest predictors of postoperative stroke. History of hypertension, atrial fibrillation, CAD, COPD, diabetes, or chronic renal insufficiency was not correlated to perioperative ischemic stroke.
Nonmodifiable risk factors, such as advanced age, serve as markers of stroke risk and help identify high‐risk populations that may require aggressive intervention. After age adjustment of hip fracture repair, age was no longer significantly associated with postoperative stroke.
Cerebrovascular disease appears to be a marker for CAD, and, therefore, patients with a history of stroke usually have a Revised Cardiac Risk Index that may suggest the use of ‐blockers. According to the recent results of the POISE trial, use of ‐blockers could lead to increased stroke incidence.2 Our results showed no significant correlation between stroke risk and ‐blocker use, but our study period was from 1988 to 2002, when titration of ‐blocker dose to heart rates of 55 to 60 beats per minute was not common practice.
Several studies have confirmed the value of aspirin in decreasing the rate of vascular outcomes after diagnosis of transient ischemic attack or stroke.12 In our study, aspirin use on hospital admission was found in the univariate analysis to be associated with an increased risk of stroke, but this finding was not confirmed after adjustments for age, sex, and comorbid conditions. Aspirin use on admission was not a significant predictor of postoperative stroke, most likely because aspirin use can be considered a marker of increased cardiovascular risk and we adjusted for these comorbid conditions.
The limitations of this study are inherent in its retrospective design. First, we identified all incident cases of stroke after hip operation by reviewing medical records and then abstracting data from those records. We may have missed some mild strokes if they were misclassified as peripheral vestibular neuropathy, migraine, or even seizure. Less likely is that we missed strokes within the first 30 days after the procedure because that is the period in which patients with hip operation are either hospitalized or sent for rehabilitation in skilled nursing facilities. It is known that institutionalization leads to better surveillance and more complete ascertainment of any medical event.
The event rate of postoperative stroke at 30 days after hip operation was low. Therefore, we did not have the statistical power to comment meaningfully on predictors of stroke at 30 days after the hip procedure. Any nonrespondent or volunteer bias was addressed by using data from the Rochester Epidemiology Project, which allowed us to identify all Olmsted County residents who underwent hip operation between 1988 and 2002. The diagnostic suspicion bias was also accounted for in our study design because different physicians provided care and outcome measurement.
Our results apply for the patients who underwent hip operation between 1988 and 2002. The noncardiac surgery guidelines have been revised between 1988 and 2002, and we did not perform a stratified analysis by index year. The next step in our study will be to extend our data collection to 2008 and look at time trends.
Conclusion
In this population‐based historical cohort study, patients undergoing hip operation had a 3.9% cumulative probability of ischemic stroke during the first postoperative year. History of stroke and type of hip procedure (ie, hip fracture repair) were the strongest predictors of this complication. Because history of stroke is such a strong predictor of postoperative stroke, the perioperative management of these patients should probably be tailored, with closely observed blood pressure management and antihypertensive medication adjustment, to avoid compromising cerebral perfusion. Also, to avoid postoperative hypercoagulability that increases the risk of stroke, these patients may need to begin receiving antiplatelets as soon as is surgically acceptable.1315
- .History of the Rochester Epidemiology Project.Mayo Clin Proc.1996;71(3):266–274.
- POISE Study Group;,,,,,, et al.Effects of extended‐release metoprolol succinate in patients undergoing non‐cardiac surgery (POISE trial): a randomised controlled trial.Lancet.2008;371(9627):1839–1847.
- ,,,,,, et al;American Heart Association Statistics Committee and Stroke Statistics Subcommittee. Heart disease and stroke statistics—2006 update: a report from the American Heart Association Statistics Committee and Stroke Statistics Subcommittee.Circulation.2006;113(6):e85–e151.
- Shojania KG, Duncan BW, McDonald KM, Wachter RM, Markowitz AJ, eds.Making health care safer: a critical analysis of patient safety practices. Evidence Report/Technology Assessment No.43.AHRQ publication no. 01‐E058.Rockville, MD:Agency for Healthcare Research and Quality (AHRQ),U.S. Department of Health and Human Services;2001.668 p.
- ,,.Deaths due to medical errors are exaggerated in Institute of Medicine report.JAMA.2000;284(1):93–95.
- ,.Modeling survival data: extending the Cox model.New York:Springer;2000.
- ,,,.Estimation of failure probabilities in the presence of competing risks: new representations of old estimators.Stat Med.1999;18(6):695–706.
- ,,.Postoperative cerebrovascular accidents in general surgery.Acta Anaesthesiol Scand.1988;32(8):698–701.
- ,,,,,, et al.Perioperative stroke risk in 173 consecutive patients with a past history of stroke.Arch Surg.1990;125(8):986–989.
- ,,,,.Medical complications and outcomes after hip fracture repair.Arch Intern Med.2002;162(18):2053–2057.
- ,,,,.Stroke incidence, prevalence, and survival: secular trends in Rochester, Minnesota, through 1989.Stroke.1996;27(3):373–380.
- CAST (Chinese Acute Stroke Trial) Collaborative Group.Randomised placebo‐controlled trial of early aspirin use in 20,000 patients with acute ischaemic stroke.Lancet.1997;349(9066):1641–1649.
- ,,.Coagulation activation and organ dysfunction following cardiac surgery.Chest.2005;128(1):229–236.
- ,,,,,.Intra‐ and postoperative fibrinolysis in patients undergoing cardiopulmonary bypass surgery.Haemostasis.1991;21(1):58–64.
- .Perioperative stroke.N Engl J Med.2007;356(7):706–713.
- .History of the Rochester Epidemiology Project.Mayo Clin Proc.1996;71(3):266–274.
- POISE Study Group;,,,,,, et al.Effects of extended‐release metoprolol succinate in patients undergoing non‐cardiac surgery (POISE trial): a randomised controlled trial.Lancet.2008;371(9627):1839–1847.
- ,,,,,, et al;American Heart Association Statistics Committee and Stroke Statistics Subcommittee. Heart disease and stroke statistics—2006 update: a report from the American Heart Association Statistics Committee and Stroke Statistics Subcommittee.Circulation.2006;113(6):e85–e151.
- Shojania KG, Duncan BW, McDonald KM, Wachter RM, Markowitz AJ, eds.Making health care safer: a critical analysis of patient safety practices. Evidence Report/Technology Assessment No.43.AHRQ publication no. 01‐E058.Rockville, MD:Agency for Healthcare Research and Quality (AHRQ),U.S. Department of Health and Human Services;2001.668 p.
- ,,.Deaths due to medical errors are exaggerated in Institute of Medicine report.JAMA.2000;284(1):93–95.
- ,.Modeling survival data: extending the Cox model.New York:Springer;2000.
- ,,,.Estimation of failure probabilities in the presence of competing risks: new representations of old estimators.Stat Med.1999;18(6):695–706.
- ,,.Postoperative cerebrovascular accidents in general surgery.Acta Anaesthesiol Scand.1988;32(8):698–701.
- ,,,,,, et al.Perioperative stroke risk in 173 consecutive patients with a past history of stroke.Arch Surg.1990;125(8):986–989.
- ,,,,.Medical complications and outcomes after hip fracture repair.Arch Intern Med.2002;162(18):2053–2057.
- ,,,,.Stroke incidence, prevalence, and survival: secular trends in Rochester, Minnesota, through 1989.Stroke.1996;27(3):373–380.
- CAST (Chinese Acute Stroke Trial) Collaborative Group.Randomised placebo‐controlled trial of early aspirin use in 20,000 patients with acute ischaemic stroke.Lancet.1997;349(9066):1641–1649.
- ,,.Coagulation activation and organ dysfunction following cardiac surgery.Chest.2005;128(1):229–236.
- ,,,,,.Intra‐ and postoperative fibrinolysis in patients undergoing cardiopulmonary bypass surgery.Haemostasis.1991;21(1):58–64.
- .Perioperative stroke.N Engl J Med.2007;356(7):706–713.
Copyright © 2009 Society of Hospital Medicine
Transitions of Care Consensus Policy Statement
Studies of the transition of care between inpatient and outpatient settings have shown that there are significant patient safety and quality deficiencies in our current system. The transition from the hospital setting to the outpatient setting has been more extensively studied than the transition from the outpatient setting to the inpatient setting. One prospective cohort study of 400 patients found that 1 in 5 patients discharged from the hospital to home experienced an adverse event, which was defined as an injury resulting from medical management rather than the underlying disease, within 3 weeks of discharge.1 This study also concluded that 66% of these were drug‐related adverse events, many of which could have been avoided or mitigated. Another prospective cross‐sectional study of 2644 patient discharges found that approximately 40% of the patients had pending test results at the time of discharge and that 10% of these required some action, yet the outpatient physicians and patients were unaware of these results.2 Medication discrepancies have also been shown to be prevalent, with 1 prospective observational study of 375 patients showing that 14% of elderly patients had 1 or more medication discrepancies and 14% of those patients with medication discrepancies were rehospitalized within 30 days versus 6% of the patients who did not experience a medication discrepancy.3 A recent review of the literature cited improving transitional care as a key area of opportunity for improving postdischarge care4
Lack of communication has clearly been shown to adversely affect postdischarge care transitions.5 A recent summary of the literature by a Society of Hospital Medicine (SHM)/Society of General Internal Medicine (SGIM) task force found that direct communication between hospital physicians and primary care physicians occurs infrequently (in 3%‐20% of cases studied), and the availability of a discharge summary at the first postdischarge visit is low (12%‐34%) and does not improve greatly even after 4 weeks (51%‐77%); this affects the quality of care in approximately 25% of follow‐up visits.5 This systematic review of the literature also found that discharge summaries often lack important information such as diagnostic test results, the treatment or hospital course, discharge medications, test results pending at discharge, patient or family counseling, and follow‐up plans.
However, the lack of studies of the communication between ambulatory physicians and hospital physicians prior to admission or during emergency department (ED) visits does not imply that this communication is not equally important and essential to high‐quality care. According to the Centers for Disease Control, the greatest source of hospital admissions in many institutions is the ED. Over 115,000,000 visits were made to the nation's approximately 4828 EDs in 2005, and about 85.2% of ED visits end in discharge.6 The ED is also the point of re‐entry into the system for individuals who may have had an adverse outcome linked to a prior hospitalization.6 Communication between hospital physicians and primary care physicians must be established to create a loop of continuous care and diminish morbidity and mortality at this critical transition point.
While transitions can be a risky period for patient safety, observational studies suggest there are benefits to transitions. A new physician may notice something overlooked by the current caregivers.712 Another factor contributing to the challenges of care transitions is the lack of a single clinician or clinical entity taking responsibility for coordination across the continuum of the patient's overall healthcare, regardless of setting.13 Studies indicate that a relationship with a medical home is associated with better health on both the individual and population levels, with lower overall costs of care and with reductions in disparities in health between socially disadvantaged subpopulations and more socially advantaged populations.14 Several medical societies have addressed this issue, including the American College of Physicians (ACP), SGIM, American Academy of Family Physicians, and American Academy of Pediatrics, and they have proposed the concept of the medical home or patient‐centered medical home, which calls for clinicians to assume this responsibility for coordinating their patients' care across settings and for the healthcare system to value and reimburse clinicians for this patient‐centered and comprehensive method of practice.1517
Finally, patients and their families or caregivers have an important role to play in transitions of care. Several observational and cross‐sectional studies have shown that patients and their caregivers and families express significant feelings of anxiety during care transitions. This anxiety can be caused by a lack of understanding and preparation for their self‐care role in the next care setting, confusion due to conflicting advice from different practitioners, and a sense of abandonment attributable to the inability to contact an appropriate healthcare practitioner for guidance, and they report an overall disregard for their preferences and input into the design of the care plan.1820 Clearly, there is room for improvement in all these areas of the inpatient and outpatient care transition, and the Transitions of Care Consensus Conference (TOCCC) attempted to address these areas by developing standards for the transition of care that also harmonize with the work of the Stepping up to the Plate (SUTTP) Alliance of the American Board of Internal Medicine (ABIM) Foundation.21 In addition, other important stakeholders are addressing this topic and actively working to improve communication and continuity in care, including the Centers for Medicare and Medicaid Services (CMS) and the National Quality Forum (NQF). CMS recently developed the Continuity Assessment Record & Evaluation (CARE) tool, a data collection instrument designed to be a standardized, interoperable, common assessment tool to capture key patient characteristics that will provide information related to resource utilization, clinical outcomes, and postdischarge disposition. NQF held a national forum on care coordination in the spring of 2008.
In summary, it is clear that there are qualitative and quantitative deficiencies in transitions of care between the inpatient and outpatient setting that are affecting patient safety and experience with care. The transition from the inpatient setting to the outpatient setting has been more extensively studied, and this body of literature has underscored for the TOCCC several important areas in need of guidance and improvement. Because of this, the scope of application of this document should initially emphasize inpatient‐to‐outpatient transitions as a first step in learning how to improve these processes. However, the transition from the outpatient setting to the inpatient setting also is a clear priority. Because the needs for transfer of information, authority, and responsibility may be different in these situations, a second phase of additional work to develop principles to guide these transitions should be undertaken as quickly as possible. Experience gained in applying these principles to inpatient‐to‐outpatient transitions might usefully inform such work.
Communication among providers and with the patients and their families arose as a clear priority. Medication discrepancies, pending tests, and unknown diagnostic or treatment plans have an immediate impact on patients' health and outcomes. The TOCCC discussed what elements should be among the standard pieces of information exchanged among providers during these transition points. The dire need for coordination of care or a coordinating clinician/medical home became a clear theme in the deliberations of the TOCCC. Most importantly, the role of the patients and their families/caregivers in their continuing care is apparent, and the TOCCC felt this must be an integral part of any principles or standards for transitions of care.
Methods
In the fall/winter of 2006, the executive committees of ACP, SGIM, and SHM agreed to jointly develop a policy statement on transitions of care. Transitions of care specifically between the inpatient and outpatient settings were selected as an ideal topic for collaboration for the 3 societies as they represent the continuum of care for internal medicine within these settings. To accomplish this, the 3 organizations decided to convene a consensus conference to develop consensus guidelines and standards concerning transitions between inpatient and outpatient settings through a multi‐stakeholder process. A steering committee was convened with representatives from ACP, SGIM, SHM, the Agency for Healthcare Research and Quality (AHRQ), ABIM, and the American Geriatric Society (AGS). The steering committee developed the agenda and invitee list for the consensus conference. After the conference was held, the steering committee was expanded to include representation from the American College of Emergency Physicians (ACEP) and the Society for Academic Emergency Medicine (SAEM).
During the planning stages of the TOCCC, the steering committee became aware of the SUTTP Alliance of the ABIM Foundation. The SUTTP Alliance has representation from medical specialties such as internal medicine and its subspecialties, family medicine, and surgery. The alliance was formed in 2006 and has been working on care coordination across multiple settings and specialties. The SUTTP Alliance had developed a set of principles and standards for care transitions and agreed to provide the draft document to the TOCCC for review, input, and further development and refinement.
Recommendations on Principles and Standards for Managing Transitions in Care Between the Inpatient and Outpatient Settings from ACP, SGIM, SHM, AGS, ACEP, and SAEM
The SUTTP Alliance presented a draft document entitled Principles and Standards for Managing Transitions in Care. In this document, the SUTTP Alliance proposes 5 principles and 8 standards for effective care transitions. A key element of the conference was a presentation by NQF on how to move from principles to standards and eventually to measures. This presentation provided the TOCCC with the theoretical underpinnings for the discussion of these principles and standards and how the TOCCC would provide input on them. The presentation provided an outline for the flow from principles to measures. First, there needs to be a framework that provides guiding principles for what we would like to measure and eventually report. From those principles, a set of preferred practices or standards are developed; the standards are more granular and allow for more specificity in describing the desired practice or outcome and its elements. Standards then provide a roadmap for identification and development of performance measures. With this framework in mind, the TOCCC then discussed in detail the SUTTP principles and standards.
The 5 principles for effective care transitions developed by the SUTTP Alliance are as follows:
-
Accountability.
-
Communication: clear and direct communication of treatment plans and follow‐up expectations.
-
Timely feedback and feed‐forward of information.
-
Involvement of the patient and family member, unless inappropriate, in all steps.
-
Respect of the hub of coordination of care.
The TOCCC re‐affirmed these principles and added 4 additional principles to this list. Three of the new principles were statements within the 8 standards developed by the SUTTP, but when taking into consideration the framework for the development of principles into standards, the TOCCC felt that the statements were better represented as principles. They are as follows:
-
All patients and their families/caregivers should have and should be able to identify their medical home or coordinating clinician (ie, practice or practitioner). (This was originally part of the coordinating clinicians standard, and the TOCCC voted to elevate this to a principle).
-
At every point along the transition, the patients and/or their families/caregivers need to know who is responsible for care at that point and who to contact and how.
-
National standards should be established for transitions in care and should be adopted and implemented at the national and community level through public health institutions, national accreditation bodies, medical societies, medical institutions, and so forth in order to improve patient outcomes and patient safety. (This was originally part of the SUTTP community standards standard, and the TOCCC moved to elevate this to a principle).
-
For monitoring and improving transitions, standardized metrics related to these standards should be used in order to lead to continuous quality improvement and accountability. (This was originally part of the measurement standard, and the TOCCC voted to elevate this to a principle).
The SUTTP Alliance proposed the following 8 standards for care transitions:
-
Coordinating clinicians.
-
Care plans.
-
Communication infrastructure.
-
Standard communication formats.
-
Transition responsibility.
-
Timeliness.
-
Community standards.
-
Measurement.
The TOCCC affirmed these standards and through a consensus process added more specificity to most of them and elevated components of some of them to principles, as discussed previously. The TOCCC proposes that the following be merged with the SUTTP standards:
-
Coordinating clinicians. Communication and information exchange between the medical home and the receiving provider should occur in an amount of time that will allow the receiving provider to effectively treat the patient. This communication and information exchange should ideally occur whenever patients are at a transition of care (eg, at discharge from the inpatient setting). The timeliness of this communication should be consistent with the patient's clinical presentation and, in the case of a patient being discharged, the urgency of the follow‐up required. Guidelines will need to be developed that address both the timeliness and means of communication between the discharging physician and the medical home. Communication and information exchange between the medical home and other physicians may be in the form of a call, voice mail, fax, or other secure, private, and accessible means including mutual access to an electronic health record.
The ED represents a unique subset of transitions of care. The potential transition can generally be described as outpatient to outpatient or outpatient to inpatient, depending on whether or not the patient is admitted to the hospital. The outpatient‐to‐outpatient transition can also encompass a number of potential variations. Patients with a medical home may be referred to the ED by the medical home, or they may self‐refer. A significant number of patients do not have a physician and self‐refer to the ED. The disposition from the ED, either outpatient to outpatient or outpatient to inpatient, is similarly represented by a number of variables. Discharged patients may or may not have a medical home, may or may not need a specialist, and may or may not require urgent (24 hours) follow‐up. Admitted patients may or may not have a medical home and may or may not require specialty care. This variety of variables precludes a single approach to ED transition of care coordination. The determination of which scenarios will be appropriate for the development of standards (coordinating clinicians and transition responsibility) will require further contributions from ACEP and SAEM and review by the steering committee.
-
Care plans/transition record. The TOCCC also agreed that there is a minimal set of data elements that should always be part of the transition record. The TOCCC suggested that this minimal data set be part of an initial implementation of this standard. That list includes the following:
The TOCCC discussed what components should be included in an ideal transition record and agreed on the following elements:
The TOCCC also added a new standard under this heading: Patients and/or their families/caregivers must receive, understand, and be encouraged to participate in the development of the transition record, which should take into consideration patients' health literacy and insurance status and be culturally sensitive.
-
Principle diagnosis and problem list.
-
Medication list (reconciliation) including over‐the‐counter medications/herbals, allergies, and drug interactions.
-
Clear identification of the medical home/transferring coordinating physician/emnstitution and the contact information.
-
Patient's cognitive status.
-
Test results/pending results.
-
Principle diagnosis and problem list.
-
Medication list (reconciliation) including over‐the‐counter medications/herbals, allergies, and drug interactions.
-
Emergency plan and contact number and person.
-
Treatment and diagnostic plan.
-
Prognosis and goals of care.
-
Test results/pending results.
-
Clear identification of the medical home and/or transferring coordinating physician/emnstitution.
-
Patient's cognitive status.
-
Advance directives, power of attorney, and consent.
-
Planned interventions, durable medical equipment, wound care, and so forth.
-
Assessment of caregiver status.
-
Communication infrastructure. All communications between providers and between providers and patients and families/caregivers need to be secure, private, Health Insurance Portability and Accountability Actcompliant, and accessible to patients and those practitioners who care for them. Communication needs to be 2‐way with an opportunity for clarification and feedback. Each sending provider needs to provide a contact name and the number of an individual who can respond to questions or concerns. The content of transferred information needs to include a core standardized data set. This information needs to be transferred as a living database; that is, it is created only once, and then each subsequent provider only needs to update, validate, or modify the information. Patient information should be available to the provider prior to the patient's arrival. Information transfer needs to adhere to national data standards. Patients should be provided with a medication list that is accessible (paper or electronic), clear, and dated.
-
Standard communication formats. Communities need to develop standard data transfer forms (templates and transmission protocols). Access to a patient's medical history needs to be on a current and ongoing basis with the ability to modify information as a patient's condition changes. Patients, families, and caregivers should have access to their information (nothing about me without me). A section on the transfer record should be devoted to communicating a patient's preferences, priorities, goals, and values (eg, the patient does not want intubation).
-
Transition responsibility. The sending provider/emnstitution/team at the clinical organization maintains responsibility for the care of the patient until the receiving clinician/location confirms that the transfer and assumption of responsibility is complete (within a reasonable timeframe for the receiving clinician to receive the information; ie, transfers that occur in the middle of the night can be communicated during standard working hours). The sending provider should be available for clarification with issues of care within a reasonable timeframe after the transfer has been completed, and this timeframe should be based on the conditions of the transfer settings. The patient should be able to identify the responsible provider. In the case of patients who do not have an ongoing ambulatory care provider or whose ambulatory care provider has not assumed responsibility, the hospital‐based clinicians will not be required to assume responsibility for the care of these patients once they are discharged.
-
Timeliness. Timeliness of feedback and feed‐forward of information from a sending provider to a receiving provider should be contingent on 4 factors:
This information should be available at the time of the patient encounter.
-
Transition settings.
-
Patient circumstances.
-
Level of acuity.
-
Clear transition responsibility.
-
Community standards. Medical communities/emnstitutions must demonstrate accountability for transitions of care by adopting national standards, and processes should be established to promote effective transitions of care.
-
Measurement. For monitoring and improving transitions, standardized metrics related to these standards should be used. These metrics/measures should be evidence‐based, address documented gaps, and have a demonstrated impact on improving care (complying with performance measure standards) whenever feasible. Results from measurements using standardized metrics must lead to continuous improvement of the transition process. The validity, reliability, cost, and impact, including unintended consequences, of these measures should be assessed and re‐evaluated.
All these standards should be applied with special attention to the various transition settings and should be appropriate to each transition setting. Measure developers will need to take this into account when developing measures based on these proposed standards.
The TOCCC also went through a consensus prioritization exercise to rank‐order the consensus standards. All meeting participants were asked to rank their top 3 priorities of the 7 standards, giving a numeric score of 1 for their highest priority, a score of 2 for their second highest priority, and a score of 3 for their third highest priority. Summary scores were calculated, and the standards were rank‐ordered from the lowest summary score to the highest. The TOCCC recognizes that full implementation of all of these standards may not be feasible and that these standards may be implemented on a stepped or incremental basis. This prioritization can assist in deciding which of these to implement. The results of the prioritization exercise are as follows:
-
All transitions must include a transition record
-
Transition responsibility
-
Coordinating clinicians
-
Patient and family involvement and ownership of the transition record
-
Communication infrastructure
-
Timeliness
-
Community standards
Future Challenges
In addition to the work on the principles and standards, the TOCCC uncovered six further challenges which are described below.
Electronic Health Record
There was disagreement in the group concerning the extent to which electronic health records would resolve the existing issues involved in poor transfers of care. However, the group did concur that: established transition standards should not be contingent upon the existence of an electronic health record and some universally, nationally‐defined set of core transfer information should be the short‐term target of efforts to establish electronic transfers of information
Use of a Transition Record
There should be a core data set (much smaller than a complete health record or discharge summary) that goes to the patient and the receiving provider, and this data set should include items in the core record described previously.
Medical Home
There was a lot of discussion about the benefits and challenges of establishing a medical home and inculcating the concept into delivery and payment structures. The group was favorable to the concept; however, since the medical home is not yet a nationally defined standard, care transition standards should not be contingent upon the existence of a medical home. Wording of future standards should use a general term for the clinician coordinating care across sites in addition to the term medical home. Using both terms will acknowledge the movement toward the medical home without requiring adoption of medical home practices to refine and implement quality measures for care transitions.
Pay for Performance
The group strongly agreed that behaviors and clinical practices are influenced by payment structures. Therefore, they agreed that a new principle should be established to advocate for changes in reimbursement practices to reward safe, complete transfers of information and care. However, the development of standards and measures should move forward on the basis of the current reimbursement practices and without assumptions of future changes.
Underserved/Disadvantaged Populations
Care transition standards and measures should be the same for all economic groups with careful attention that lower socioeconomic groups are not forgotten or unintentionally disadvantaged, including the potential for cherry‐picking. It should be noted that underserved populations may not always have a medical home because of their disadvantaged access to the health system and providers. Moreover, clinicians who care for underserved/disadvantaged populations should not be penalized by standards that assume continuous clinical care and ongoing relationships with patients who may access the health system only sporadically.
Need for Patient‐Centered Approaches
The group agreed that across all principles and standards previously established by the SUTTP coalition, greater emphasis is needed on patient‐centered approaches to care including, but not limited to, the inclusion of patient and families in care and transition planning, greater access to medical records, and the need for education at the time of discharge regarding self‐care and core transfer information.
Next Steps for the TOCCC
The TOCCC focuses only on the transitions between the inpatient and outpatient settings and does not address the equally important transitions between many other different care settings, such as the transition from a hospital to a nursing home or rehabilitation facility. The intent of the TOCCC is to provide this document to national measure developers such as the Physician Consortium for Performance Improvement and others in order to guide measure development and ultimately lead to improvements in quality and safety in care transitions.
Appendix
Conference Description
The TOCCC was held over 2 days on July 11 to 12, 2007 at ACP headquarters in Philadelphia, PA. There were 51 participants representing over 30 organizations. Participating organizations included medical specialty societies from internal medicine as well as family medicine and pediatrics, governmental agencies such as AHRQ and CMS, performance measure developers such as the National Committee for Quality Assurance and the American Medical Association Physician Consortium on Performance Improvement, nurse associations such as the Visiting Nurse Associations of America and Home Care and Hospice, pharmacist groups, and patient groups such as the Institute for Family‐Centered Care. The morning of the first day was dedicated to presentations covering the AHRQ Stanford Evidence‐Based Practice Center's evidence report on care coordination, the literature concerning transitions of care, the continuum of measurement from principles to standards to measures, and the SUTTP document of principles. The attendees then split into breakout groups that discussed the principles and standards developed by the SUTTP and refined and/or revised them. All discussions were summarized and agreed on by consensus and were presented by the breakout groups to the full conference attendees. The second day was dedicated to reviewing the work of the breakout groups and further refinement of the principles and standards through a group consensus process. Once this was completed, the attendees then prioritized the standards with a group consensus voting process. Each attendee was given 1 vote, and each attendee attached a rating of 1 for highest priority and 3 for lowest priority to the standards. The summary scores were then calculated, and the standards were then ranked from those summary scores.
The final activity of the conference was to discuss some of the overarching themes and environmental factors that could influence the acceptance, endorsement, and implementation of the standards developed. The TOCCC adjourned with the tasks of forwarding its conclusions to the SUTTP Alliance and developing a policy document to be reviewed by other stakeholders not well represented at the conference. Two such pivotal organizations were ACEP and SAEM, which were added to the steering committee after the conference. Subsequently, ACP, SGIM, SHM, AGS, ACEP, and SAEM approved the summary document, and they will forward it to the other participating organizations for possible endorsement and to national developers of measures and standards for use in performance measurement development.
Appendix
Conflict of Interest Statements
This is a summary of conflict of interest statements for faculty, authors, members of the planning committees, and staff (ACP, SHM, and SGIM)
The following members of the steering (or planning) committee and staff of the TOCCC have declared a conflict of interest:
-
Dennis Beck, MD, FACEP (ACEP representative; President and Chief Executive Officer of Beacon Medical Services): 100 units of stock options/holdings in Beacon Hill Medical Services.
-
Tina Budnitz, MPH (SHM staff; Senior Advisor for Quality Initiatives, SHM): employment by SHM
-
Eric S. Holmboe, MD (ABIM representative; Senior Vice President of Quality Research and Academic Affairs, ABIM): employment by ABIM.
-
Vincenza Snow, MD, FACP (ACP staff; Director of Clinical Programs and Quality of Care, ACP): research grants from the Centers for Disease Control, Atlantic Philanthropies, Novo Nordisk, Bristol Myers Squibb, Boehringer Ingelheim, Pfizer, United Healthcare Foundation, and Sanofi Pasteur.
-
Laurence D. Wellikson, MD, FACP (SHM staff; Chief Executive Officer of SHM): employment by SHM.
-
Mark V. Williams, MD, FACP (cochair and SHM representative; Editor in Chief of the Journal of Hospital Medicine and former President of SHM): membership in SHM.
The following members of the steering (or planning) committee and staff of the TOCCC have declared no conflict of interest:
-
David Atkins, MD, MPH [AHRQ representative; Associate Director of Quality Enhancement Research Initiative, Department of Veteran Affairs, Office of Research and Development, Health Services Research & Development (124)].
-
Doriane C. Miller, MD (cochair and SGIM representative; Associate Division Chief of General Internal Medicine, Stroger Hospital of Cook County).
-
Jane Potter, MD (AGS representative; Professor and Chief of Geriatrics, University of Nebraska Medical Center).
-
Robert L. Wears, MD, FACEP (SAEM representative; Professor of the Department of Emergency Medicine, University of Florida).
-
Kevin B. Weiss, MD, MPH, MS, FACP (chair and ACP representative; Chief Executive Officer of the American Board of Medical Specialties).
- ,,, et al.The incidence and severity of adverse events affecting patients after discharge from the hospital.Ann Intern Med.2003;138(3):161–167.
- ,,, et al.Patient safety concerns arising from test results that return after hospital discharge.Ann Intern Med.2005;143(2):121–128.
- ,,,.Posthospital medication discrepancies: prevalence and contributing factors.Arch Intern Med.2005;165(16):1842–1847.
- ,.Addressing post‐discharge adverse events: a neglected area.Jt Comm J Qual Patient Saf.2008;34(2):85–97.
- ,,, et al.Deficits in communication and information transfer between hospital‐based and primary care physicians: implications for patient safety and continuity of care.JAMA.2007;297(8):831–841.
- ,,. National Hospital Ambulatory Medical Care Survey: 2005 Emergency Department Summary.Hyattsville, MD:National Center for Health Statistics;2007.Advance Data from Vital and Health Statistics; vol386.
- .Do short breaks increase or decrease anesthetic risk?J Clin Anesth.1989;1(3):228–231.
- ,,,.Critical incidents associated with intraoperative exchanges of anesthesia personnel.Anesthesiology.1982;56(6):456–461.
- ,,, et al.Shift changes among emergency physicians: best of times, worst of times. In:Proceedings of the Human Factors and Ergonomics Society 47th Annual Meeting.Denver, CO:Human Factors and Ergonomics Society;2003:1420–1423.
- ,,, et al.Transitions in care: signovers in the emergency department. In:Proceedings of the Human Factors and Ergonomics Society 48th Annual Meeting.New Orleans, LA:Human Factors and Ergonomics Society;2004:1625–1628.
- ,,, et al.Conceptual framework for the safety of handovers. In: Henriksen K, ed.Advances in Patient Safety.Rockville, MD:Agency for Healthcare Research and Quality/Department of Defense;2005:309–321.
- .Medical errors and emergency medicine: will the difficult questions be asked, and answered?Acad Emerg Med.2003;10(8):910–911.
- ,.Lost in transition: challenges and opportunities for improving the quality of transitional care.Ann Intern Med.2004;141(7):533–536.
- ,.The medical home, access to care, and insurance: a review of evidence.Pediatrics.2004;113(5 suppl):1493–1498.
- Blue Ribbon Panel of the Society of General Internal Medicine.Redesigning the practice model for general internal medicine. A proposal for coordinated care: a policy monograph of the Society of General Internal Medicine.J Gen Intern Med.2007;22(3):400–409.
- Medical Home Initiatives for Children with Special Needs Project Advisory Committee.The medical home.Pediatrics.2002;110(1 pt 1):184–186.
- American College of Physicians. The advanced medical home: a patient‐centered, physician‐guided model of healthcare. A policy monograph.2006. http://www.acponline.org/advocacy/where_we_stand/policy/adv_med.pdf. Accessed March 13, 2009.
- ,,, et al.Development and testing of a measure designed to assess the quality of care transitions.Int J Integr Care.2002;2:e02.
- ,,, et al.Carepartner experiences with hospital care.Med Care.1999;37(1):33–38.
- ,,.Assessing the quality of preparation for post hospital care from the patient's perspective: the care transitions measure.Med Care.2005;43(3):246–255.
- American Board of Internal Medicine Foundation. Stepping up to the Plate Alliance. Principles and Standards for managing transitions in care (in press). Available at http://www.abimfoundation.org/publications/pdf_issue_brief/F06‐05‐2007_6.pdf. Accessed March 13,2009.
Studies of the transition of care between inpatient and outpatient settings have shown that there are significant patient safety and quality deficiencies in our current system. The transition from the hospital setting to the outpatient setting has been more extensively studied than the transition from the outpatient setting to the inpatient setting. One prospective cohort study of 400 patients found that 1 in 5 patients discharged from the hospital to home experienced an adverse event, which was defined as an injury resulting from medical management rather than the underlying disease, within 3 weeks of discharge.1 This study also concluded that 66% of these were drug‐related adverse events, many of which could have been avoided or mitigated. Another prospective cross‐sectional study of 2644 patient discharges found that approximately 40% of the patients had pending test results at the time of discharge and that 10% of these required some action, yet the outpatient physicians and patients were unaware of these results.2 Medication discrepancies have also been shown to be prevalent, with 1 prospective observational study of 375 patients showing that 14% of elderly patients had 1 or more medication discrepancies and 14% of those patients with medication discrepancies were rehospitalized within 30 days versus 6% of the patients who did not experience a medication discrepancy.3 A recent review of the literature cited improving transitional care as a key area of opportunity for improving postdischarge care4
Lack of communication has clearly been shown to adversely affect postdischarge care transitions.5 A recent summary of the literature by a Society of Hospital Medicine (SHM)/Society of General Internal Medicine (SGIM) task force found that direct communication between hospital physicians and primary care physicians occurs infrequently (in 3%‐20% of cases studied), and the availability of a discharge summary at the first postdischarge visit is low (12%‐34%) and does not improve greatly even after 4 weeks (51%‐77%); this affects the quality of care in approximately 25% of follow‐up visits.5 This systematic review of the literature also found that discharge summaries often lack important information such as diagnostic test results, the treatment or hospital course, discharge medications, test results pending at discharge, patient or family counseling, and follow‐up plans.
However, the lack of studies of the communication between ambulatory physicians and hospital physicians prior to admission or during emergency department (ED) visits does not imply that this communication is not equally important and essential to high‐quality care. According to the Centers for Disease Control, the greatest source of hospital admissions in many institutions is the ED. Over 115,000,000 visits were made to the nation's approximately 4828 EDs in 2005, and about 85.2% of ED visits end in discharge.6 The ED is also the point of re‐entry into the system for individuals who may have had an adverse outcome linked to a prior hospitalization.6 Communication between hospital physicians and primary care physicians must be established to create a loop of continuous care and diminish morbidity and mortality at this critical transition point.
While transitions can be a risky period for patient safety, observational studies suggest there are benefits to transitions. A new physician may notice something overlooked by the current caregivers.712 Another factor contributing to the challenges of care transitions is the lack of a single clinician or clinical entity taking responsibility for coordination across the continuum of the patient's overall healthcare, regardless of setting.13 Studies indicate that a relationship with a medical home is associated with better health on both the individual and population levels, with lower overall costs of care and with reductions in disparities in health between socially disadvantaged subpopulations and more socially advantaged populations.14 Several medical societies have addressed this issue, including the American College of Physicians (ACP), SGIM, American Academy of Family Physicians, and American Academy of Pediatrics, and they have proposed the concept of the medical home or patient‐centered medical home, which calls for clinicians to assume this responsibility for coordinating their patients' care across settings and for the healthcare system to value and reimburse clinicians for this patient‐centered and comprehensive method of practice.1517
Finally, patients and their families or caregivers have an important role to play in transitions of care. Several observational and cross‐sectional studies have shown that patients and their caregivers and families express significant feelings of anxiety during care transitions. This anxiety can be caused by a lack of understanding and preparation for their self‐care role in the next care setting, confusion due to conflicting advice from different practitioners, and a sense of abandonment attributable to the inability to contact an appropriate healthcare practitioner for guidance, and they report an overall disregard for their preferences and input into the design of the care plan.1820 Clearly, there is room for improvement in all these areas of the inpatient and outpatient care transition, and the Transitions of Care Consensus Conference (TOCCC) attempted to address these areas by developing standards for the transition of care that also harmonize with the work of the Stepping up to the Plate (SUTTP) Alliance of the American Board of Internal Medicine (ABIM) Foundation.21 In addition, other important stakeholders are addressing this topic and actively working to improve communication and continuity in care, including the Centers for Medicare and Medicaid Services (CMS) and the National Quality Forum (NQF). CMS recently developed the Continuity Assessment Record & Evaluation (CARE) tool, a data collection instrument designed to be a standardized, interoperable, common assessment tool to capture key patient characteristics that will provide information related to resource utilization, clinical outcomes, and postdischarge disposition. NQF held a national forum on care coordination in the spring of 2008.
In summary, it is clear that there are qualitative and quantitative deficiencies in transitions of care between the inpatient and outpatient setting that are affecting patient safety and experience with care. The transition from the inpatient setting to the outpatient setting has been more extensively studied, and this body of literature has underscored for the TOCCC several important areas in need of guidance and improvement. Because of this, the scope of application of this document should initially emphasize inpatient‐to‐outpatient transitions as a first step in learning how to improve these processes. However, the transition from the outpatient setting to the inpatient setting also is a clear priority. Because the needs for transfer of information, authority, and responsibility may be different in these situations, a second phase of additional work to develop principles to guide these transitions should be undertaken as quickly as possible. Experience gained in applying these principles to inpatient‐to‐outpatient transitions might usefully inform such work.
Communication among providers and with the patients and their families arose as a clear priority. Medication discrepancies, pending tests, and unknown diagnostic or treatment plans have an immediate impact on patients' health and outcomes. The TOCCC discussed what elements should be among the standard pieces of information exchanged among providers during these transition points. The dire need for coordination of care or a coordinating clinician/medical home became a clear theme in the deliberations of the TOCCC. Most importantly, the role of the patients and their families/caregivers in their continuing care is apparent, and the TOCCC felt this must be an integral part of any principles or standards for transitions of care.
Methods
In the fall/winter of 2006, the executive committees of ACP, SGIM, and SHM agreed to jointly develop a policy statement on transitions of care. Transitions of care specifically between the inpatient and outpatient settings were selected as an ideal topic for collaboration for the 3 societies as they represent the continuum of care for internal medicine within these settings. To accomplish this, the 3 organizations decided to convene a consensus conference to develop consensus guidelines and standards concerning transitions between inpatient and outpatient settings through a multi‐stakeholder process. A steering committee was convened with representatives from ACP, SGIM, SHM, the Agency for Healthcare Research and Quality (AHRQ), ABIM, and the American Geriatric Society (AGS). The steering committee developed the agenda and invitee list for the consensus conference. After the conference was held, the steering committee was expanded to include representation from the American College of Emergency Physicians (ACEP) and the Society for Academic Emergency Medicine (SAEM).
During the planning stages of the TOCCC, the steering committee became aware of the SUTTP Alliance of the ABIM Foundation. The SUTTP Alliance has representation from medical specialties such as internal medicine and its subspecialties, family medicine, and surgery. The alliance was formed in 2006 and has been working on care coordination across multiple settings and specialties. The SUTTP Alliance had developed a set of principles and standards for care transitions and agreed to provide the draft document to the TOCCC for review, input, and further development and refinement.
Recommendations on Principles and Standards for Managing Transitions in Care Between the Inpatient and Outpatient Settings from ACP, SGIM, SHM, AGS, ACEP, and SAEM
The SUTTP Alliance presented a draft document entitled Principles and Standards for Managing Transitions in Care. In this document, the SUTTP Alliance proposes 5 principles and 8 standards for effective care transitions. A key element of the conference was a presentation by NQF on how to move from principles to standards and eventually to measures. This presentation provided the TOCCC with the theoretical underpinnings for the discussion of these principles and standards and how the TOCCC would provide input on them. The presentation provided an outline for the flow from principles to measures. First, there needs to be a framework that provides guiding principles for what we would like to measure and eventually report. From those principles, a set of preferred practices or standards are developed; the standards are more granular and allow for more specificity in describing the desired practice or outcome and its elements. Standards then provide a roadmap for identification and development of performance measures. With this framework in mind, the TOCCC then discussed in detail the SUTTP principles and standards.
The 5 principles for effective care transitions developed by the SUTTP Alliance are as follows:
-
Accountability.
-
Communication: clear and direct communication of treatment plans and follow‐up expectations.
-
Timely feedback and feed‐forward of information.
-
Involvement of the patient and family member, unless inappropriate, in all steps.
-
Respect of the hub of coordination of care.
The TOCCC re‐affirmed these principles and added 4 additional principles to this list. Three of the new principles were statements within the 8 standards developed by the SUTTP, but when taking into consideration the framework for the development of principles into standards, the TOCCC felt that the statements were better represented as principles. They are as follows:
-
All patients and their families/caregivers should have and should be able to identify their medical home or coordinating clinician (ie, practice or practitioner). (This was originally part of the coordinating clinicians standard, and the TOCCC voted to elevate this to a principle).
-
At every point along the transition, the patients and/or their families/caregivers need to know who is responsible for care at that point and who to contact and how.
-
National standards should be established for transitions in care and should be adopted and implemented at the national and community level through public health institutions, national accreditation bodies, medical societies, medical institutions, and so forth in order to improve patient outcomes and patient safety. (This was originally part of the SUTTP community standards standard, and the TOCCC moved to elevate this to a principle).
-
For monitoring and improving transitions, standardized metrics related to these standards should be used in order to lead to continuous quality improvement and accountability. (This was originally part of the measurement standard, and the TOCCC voted to elevate this to a principle).
The SUTTP Alliance proposed the following 8 standards for care transitions:
-
Coordinating clinicians.
-
Care plans.
-
Communication infrastructure.
-
Standard communication formats.
-
Transition responsibility.
-
Timeliness.
-
Community standards.
-
Measurement.
The TOCCC affirmed these standards and through a consensus process added more specificity to most of them and elevated components of some of them to principles, as discussed previously. The TOCCC proposes that the following be merged with the SUTTP standards:
-
Coordinating clinicians. Communication and information exchange between the medical home and the receiving provider should occur in an amount of time that will allow the receiving provider to effectively treat the patient. This communication and information exchange should ideally occur whenever patients are at a transition of care (eg, at discharge from the inpatient setting). The timeliness of this communication should be consistent with the patient's clinical presentation and, in the case of a patient being discharged, the urgency of the follow‐up required. Guidelines will need to be developed that address both the timeliness and means of communication between the discharging physician and the medical home. Communication and information exchange between the medical home and other physicians may be in the form of a call, voice mail, fax, or other secure, private, and accessible means including mutual access to an electronic health record.
The ED represents a unique subset of transitions of care. The potential transition can generally be described as outpatient to outpatient or outpatient to inpatient, depending on whether or not the patient is admitted to the hospital. The outpatient‐to‐outpatient transition can also encompass a number of potential variations. Patients with a medical home may be referred to the ED by the medical home, or they may self‐refer. A significant number of patients do not have a physician and self‐refer to the ED. The disposition from the ED, either outpatient to outpatient or outpatient to inpatient, is similarly represented by a number of variables. Discharged patients may or may not have a medical home, may or may not need a specialist, and may or may not require urgent (24 hours) follow‐up. Admitted patients may or may not have a medical home and may or may not require specialty care. This variety of variables precludes a single approach to ED transition of care coordination. The determination of which scenarios will be appropriate for the development of standards (coordinating clinicians and transition responsibility) will require further contributions from ACEP and SAEM and review by the steering committee.
-
Care plans/transition record. The TOCCC also agreed that there is a minimal set of data elements that should always be part of the transition record. The TOCCC suggested that this minimal data set be part of an initial implementation of this standard. That list includes the following:
The TOCCC discussed what components should be included in an ideal transition record and agreed on the following elements:
The TOCCC also added a new standard under this heading: Patients and/or their families/caregivers must receive, understand, and be encouraged to participate in the development of the transition record, which should take into consideration patients' health literacy and insurance status and be culturally sensitive.
-
Principle diagnosis and problem list.
-
Medication list (reconciliation) including over‐the‐counter medications/herbals, allergies, and drug interactions.
-
Clear identification of the medical home/transferring coordinating physician/emnstitution and the contact information.
-
Patient's cognitive status.
-
Test results/pending results.
-
Principle diagnosis and problem list.
-
Medication list (reconciliation) including over‐the‐counter medications/herbals, allergies, and drug interactions.
-
Emergency plan and contact number and person.
-
Treatment and diagnostic plan.
-
Prognosis and goals of care.
-
Test results/pending results.
-
Clear identification of the medical home and/or transferring coordinating physician/emnstitution.
-
Patient's cognitive status.
-
Advance directives, power of attorney, and consent.
-
Planned interventions, durable medical equipment, wound care, and so forth.
-
Assessment of caregiver status.
-
Communication infrastructure. All communications between providers and between providers and patients and families/caregivers need to be secure, private, Health Insurance Portability and Accountability Actcompliant, and accessible to patients and those practitioners who care for them. Communication needs to be 2‐way with an opportunity for clarification and feedback. Each sending provider needs to provide a contact name and the number of an individual who can respond to questions or concerns. The content of transferred information needs to include a core standardized data set. This information needs to be transferred as a living database; that is, it is created only once, and then each subsequent provider only needs to update, validate, or modify the information. Patient information should be available to the provider prior to the patient's arrival. Information transfer needs to adhere to national data standards. Patients should be provided with a medication list that is accessible (paper or electronic), clear, and dated.
-
Standard communication formats. Communities need to develop standard data transfer forms (templates and transmission protocols). Access to a patient's medical history needs to be on a current and ongoing basis with the ability to modify information as a patient's condition changes. Patients, families, and caregivers should have access to their information (nothing about me without me). A section on the transfer record should be devoted to communicating a patient's preferences, priorities, goals, and values (eg, the patient does not want intubation).
-
Transition responsibility. The sending provider/emnstitution/team at the clinical organization maintains responsibility for the care of the patient until the receiving clinician/location confirms that the transfer and assumption of responsibility is complete (within a reasonable timeframe for the receiving clinician to receive the information; ie, transfers that occur in the middle of the night can be communicated during standard working hours). The sending provider should be available for clarification with issues of care within a reasonable timeframe after the transfer has been completed, and this timeframe should be based on the conditions of the transfer settings. The patient should be able to identify the responsible provider. In the case of patients who do not have an ongoing ambulatory care provider or whose ambulatory care provider has not assumed responsibility, the hospital‐based clinicians will not be required to assume responsibility for the care of these patients once they are discharged.
-
Timeliness. Timeliness of feedback and feed‐forward of information from a sending provider to a receiving provider should be contingent on 4 factors:
This information should be available at the time of the patient encounter.
-
Transition settings.
-
Patient circumstances.
-
Level of acuity.
-
Clear transition responsibility.
-
Community standards. Medical communities/emnstitutions must demonstrate accountability for transitions of care by adopting national standards, and processes should be established to promote effective transitions of care.
-
Measurement. For monitoring and improving transitions, standardized metrics related to these standards should be used. These metrics/measures should be evidence‐based, address documented gaps, and have a demonstrated impact on improving care (complying with performance measure standards) whenever feasible. Results from measurements using standardized metrics must lead to continuous improvement of the transition process. The validity, reliability, cost, and impact, including unintended consequences, of these measures should be assessed and re‐evaluated.
All these standards should be applied with special attention to the various transition settings and should be appropriate to each transition setting. Measure developers will need to take this into account when developing measures based on these proposed standards.
The TOCCC also went through a consensus prioritization exercise to rank‐order the consensus standards. All meeting participants were asked to rank their top 3 priorities of the 7 standards, giving a numeric score of 1 for their highest priority, a score of 2 for their second highest priority, and a score of 3 for their third highest priority. Summary scores were calculated, and the standards were rank‐ordered from the lowest summary score to the highest. The TOCCC recognizes that full implementation of all of these standards may not be feasible and that these standards may be implemented on a stepped or incremental basis. This prioritization can assist in deciding which of these to implement. The results of the prioritization exercise are as follows:
-
All transitions must include a transition record
-
Transition responsibility
-
Coordinating clinicians
-
Patient and family involvement and ownership of the transition record
-
Communication infrastructure
-
Timeliness
-
Community standards
Future Challenges
In addition to the work on the principles and standards, the TOCCC uncovered six further challenges which are described below.
Electronic Health Record
There was disagreement in the group concerning the extent to which electronic health records would resolve the existing issues involved in poor transfers of care. However, the group did concur that: established transition standards should not be contingent upon the existence of an electronic health record and some universally, nationally‐defined set of core transfer information should be the short‐term target of efforts to establish electronic transfers of information
Use of a Transition Record
There should be a core data set (much smaller than a complete health record or discharge summary) that goes to the patient and the receiving provider, and this data set should include items in the core record described previously.
Medical Home
There was a lot of discussion about the benefits and challenges of establishing a medical home and inculcating the concept into delivery and payment structures. The group was favorable to the concept; however, since the medical home is not yet a nationally defined standard, care transition standards should not be contingent upon the existence of a medical home. Wording of future standards should use a general term for the clinician coordinating care across sites in addition to the term medical home. Using both terms will acknowledge the movement toward the medical home without requiring adoption of medical home practices to refine and implement quality measures for care transitions.
Pay for Performance
The group strongly agreed that behaviors and clinical practices are influenced by payment structures. Therefore, they agreed that a new principle should be established to advocate for changes in reimbursement practices to reward safe, complete transfers of information and care. However, the development of standards and measures should move forward on the basis of the current reimbursement practices and without assumptions of future changes.
Underserved/Disadvantaged Populations
Care transition standards and measures should be the same for all economic groups with careful attention that lower socioeconomic groups are not forgotten or unintentionally disadvantaged, including the potential for cherry‐picking. It should be noted that underserved populations may not always have a medical home because of their disadvantaged access to the health system and providers. Moreover, clinicians who care for underserved/disadvantaged populations should not be penalized by standards that assume continuous clinical care and ongoing relationships with patients who may access the health system only sporadically.
Need for Patient‐Centered Approaches
The group agreed that across all principles and standards previously established by the SUTTP coalition, greater emphasis is needed on patient‐centered approaches to care including, but not limited to, the inclusion of patient and families in care and transition planning, greater access to medical records, and the need for education at the time of discharge regarding self‐care and core transfer information.
Next Steps for the TOCCC
The TOCCC focuses only on the transitions between the inpatient and outpatient settings and does not address the equally important transitions between many other different care settings, such as the transition from a hospital to a nursing home or rehabilitation facility. The intent of the TOCCC is to provide this document to national measure developers such as the Physician Consortium for Performance Improvement and others in order to guide measure development and ultimately lead to improvements in quality and safety in care transitions.
Appendix
Conference Description
The TOCCC was held over 2 days on July 11 to 12, 2007 at ACP headquarters in Philadelphia, PA. There were 51 participants representing over 30 organizations. Participating organizations included medical specialty societies from internal medicine as well as family medicine and pediatrics, governmental agencies such as AHRQ and CMS, performance measure developers such as the National Committee for Quality Assurance and the American Medical Association Physician Consortium on Performance Improvement, nurse associations such as the Visiting Nurse Associations of America and Home Care and Hospice, pharmacist groups, and patient groups such as the Institute for Family‐Centered Care. The morning of the first day was dedicated to presentations covering the AHRQ Stanford Evidence‐Based Practice Center's evidence report on care coordination, the literature concerning transitions of care, the continuum of measurement from principles to standards to measures, and the SUTTP document of principles. The attendees then split into breakout groups that discussed the principles and standards developed by the SUTTP and refined and/or revised them. All discussions were summarized and agreed on by consensus and were presented by the breakout groups to the full conference attendees. The second day was dedicated to reviewing the work of the breakout groups and further refinement of the principles and standards through a group consensus process. Once this was completed, the attendees then prioritized the standards with a group consensus voting process. Each attendee was given 1 vote, and each attendee attached a rating of 1 for highest priority and 3 for lowest priority to the standards. The summary scores were then calculated, and the standards were then ranked from those summary scores.
The final activity of the conference was to discuss some of the overarching themes and environmental factors that could influence the acceptance, endorsement, and implementation of the standards developed. The TOCCC adjourned with the tasks of forwarding its conclusions to the SUTTP Alliance and developing a policy document to be reviewed by other stakeholders not well represented at the conference. Two such pivotal organizations were ACEP and SAEM, which were added to the steering committee after the conference. Subsequently, ACP, SGIM, SHM, AGS, ACEP, and SAEM approved the summary document, and they will forward it to the other participating organizations for possible endorsement and to national developers of measures and standards for use in performance measurement development.
Appendix
Conflict of Interest Statements
This is a summary of conflict of interest statements for faculty, authors, members of the planning committees, and staff (ACP, SHM, and SGIM)
The following members of the steering (or planning) committee and staff of the TOCCC have declared a conflict of interest:
-
Dennis Beck, MD, FACEP (ACEP representative; President and Chief Executive Officer of Beacon Medical Services): 100 units of stock options/holdings in Beacon Hill Medical Services.
-
Tina Budnitz, MPH (SHM staff; Senior Advisor for Quality Initiatives, SHM): employment by SHM
-
Eric S. Holmboe, MD (ABIM representative; Senior Vice President of Quality Research and Academic Affairs, ABIM): employment by ABIM.
-
Vincenza Snow, MD, FACP (ACP staff; Director of Clinical Programs and Quality of Care, ACP): research grants from the Centers for Disease Control, Atlantic Philanthropies, Novo Nordisk, Bristol Myers Squibb, Boehringer Ingelheim, Pfizer, United Healthcare Foundation, and Sanofi Pasteur.
-
Laurence D. Wellikson, MD, FACP (SHM staff; Chief Executive Officer of SHM): employment by SHM.
-
Mark V. Williams, MD, FACP (cochair and SHM representative; Editor in Chief of the Journal of Hospital Medicine and former President of SHM): membership in SHM.
The following members of the steering (or planning) committee and staff of the TOCCC have declared no conflict of interest:
-
David Atkins, MD, MPH [AHRQ representative; Associate Director of Quality Enhancement Research Initiative, Department of Veteran Affairs, Office of Research and Development, Health Services Research & Development (124)].
-
Doriane C. Miller, MD (cochair and SGIM representative; Associate Division Chief of General Internal Medicine, Stroger Hospital of Cook County).
-
Jane Potter, MD (AGS representative; Professor and Chief of Geriatrics, University of Nebraska Medical Center).
-
Robert L. Wears, MD, FACEP (SAEM representative; Professor of the Department of Emergency Medicine, University of Florida).
-
Kevin B. Weiss, MD, MPH, MS, FACP (chair and ACP representative; Chief Executive Officer of the American Board of Medical Specialties).
Studies of the transition of care between inpatient and outpatient settings have shown that there are significant patient safety and quality deficiencies in our current system. The transition from the hospital setting to the outpatient setting has been more extensively studied than the transition from the outpatient setting to the inpatient setting. One prospective cohort study of 400 patients found that 1 in 5 patients discharged from the hospital to home experienced an adverse event, which was defined as an injury resulting from medical management rather than the underlying disease, within 3 weeks of discharge.1 This study also concluded that 66% of these were drug‐related adverse events, many of which could have been avoided or mitigated. Another prospective cross‐sectional study of 2644 patient discharges found that approximately 40% of the patients had pending test results at the time of discharge and that 10% of these required some action, yet the outpatient physicians and patients were unaware of these results.2 Medication discrepancies have also been shown to be prevalent, with 1 prospective observational study of 375 patients showing that 14% of elderly patients had 1 or more medication discrepancies and 14% of those patients with medication discrepancies were rehospitalized within 30 days versus 6% of the patients who did not experience a medication discrepancy.3 A recent review of the literature cited improving transitional care as a key area of opportunity for improving postdischarge care4
Lack of communication has clearly been shown to adversely affect postdischarge care transitions.5 A recent summary of the literature by a Society of Hospital Medicine (SHM)/Society of General Internal Medicine (SGIM) task force found that direct communication between hospital physicians and primary care physicians occurs infrequently (in 3%‐20% of cases studied), and the availability of a discharge summary at the first postdischarge visit is low (12%‐34%) and does not improve greatly even after 4 weeks (51%‐77%); this affects the quality of care in approximately 25% of follow‐up visits.5 This systematic review of the literature also found that discharge summaries often lack important information such as diagnostic test results, the treatment or hospital course, discharge medications, test results pending at discharge, patient or family counseling, and follow‐up plans.
However, the lack of studies of the communication between ambulatory physicians and hospital physicians prior to admission or during emergency department (ED) visits does not imply that this communication is not equally important and essential to high‐quality care. According to the Centers for Disease Control, the greatest source of hospital admissions in many institutions is the ED. Over 115,000,000 visits were made to the nation's approximately 4828 EDs in 2005, and about 85.2% of ED visits end in discharge.6 The ED is also the point of re‐entry into the system for individuals who may have had an adverse outcome linked to a prior hospitalization.6 Communication between hospital physicians and primary care physicians must be established to create a loop of continuous care and diminish morbidity and mortality at this critical transition point.
While transitions can be a risky period for patient safety, observational studies suggest there are benefits to transitions. A new physician may notice something overlooked by the current caregivers.712 Another factor contributing to the challenges of care transitions is the lack of a single clinician or clinical entity taking responsibility for coordination across the continuum of the patient's overall healthcare, regardless of setting.13 Studies indicate that a relationship with a medical home is associated with better health on both the individual and population levels, with lower overall costs of care and with reductions in disparities in health between socially disadvantaged subpopulations and more socially advantaged populations.14 Several medical societies have addressed this issue, including the American College of Physicians (ACP), SGIM, American Academy of Family Physicians, and American Academy of Pediatrics, and they have proposed the concept of the medical home or patient‐centered medical home, which calls for clinicians to assume this responsibility for coordinating their patients' care across settings and for the healthcare system to value and reimburse clinicians for this patient‐centered and comprehensive method of practice.1517
Finally, patients and their families or caregivers have an important role to play in transitions of care. Several observational and cross‐sectional studies have shown that patients and their caregivers and families express significant feelings of anxiety during care transitions. This anxiety can be caused by a lack of understanding and preparation for their self‐care role in the next care setting, confusion due to conflicting advice from different practitioners, and a sense of abandonment attributable to the inability to contact an appropriate healthcare practitioner for guidance, and they report an overall disregard for their preferences and input into the design of the care plan.1820 Clearly, there is room for improvement in all these areas of the inpatient and outpatient care transition, and the Transitions of Care Consensus Conference (TOCCC) attempted to address these areas by developing standards for the transition of care that also harmonize with the work of the Stepping up to the Plate (SUTTP) Alliance of the American Board of Internal Medicine (ABIM) Foundation.21 In addition, other important stakeholders are addressing this topic and actively working to improve communication and continuity in care, including the Centers for Medicare and Medicaid Services (CMS) and the National Quality Forum (NQF). CMS recently developed the Continuity Assessment Record & Evaluation (CARE) tool, a data collection instrument designed to be a standardized, interoperable, common assessment tool to capture key patient characteristics that will provide information related to resource utilization, clinical outcomes, and postdischarge disposition. NQF held a national forum on care coordination in the spring of 2008.
In summary, it is clear that there are qualitative and quantitative deficiencies in transitions of care between the inpatient and outpatient setting that are affecting patient safety and experience with care. The transition from the inpatient setting to the outpatient setting has been more extensively studied, and this body of literature has underscored for the TOCCC several important areas in need of guidance and improvement. Because of this, the scope of application of this document should initially emphasize inpatient‐to‐outpatient transitions as a first step in learning how to improve these processes. However, the transition from the outpatient setting to the inpatient setting also is a clear priority. Because the needs for transfer of information, authority, and responsibility may be different in these situations, a second phase of additional work to develop principles to guide these transitions should be undertaken as quickly as possible. Experience gained in applying these principles to inpatient‐to‐outpatient transitions might usefully inform such work.
Communication among providers and with the patients and their families arose as a clear priority. Medication discrepancies, pending tests, and unknown diagnostic or treatment plans have an immediate impact on patients' health and outcomes. The TOCCC discussed what elements should be among the standard pieces of information exchanged among providers during these transition points. The dire need for coordination of care or a coordinating clinician/medical home became a clear theme in the deliberations of the TOCCC. Most importantly, the role of the patients and their families/caregivers in their continuing care is apparent, and the TOCCC felt this must be an integral part of any principles or standards for transitions of care.
Methods
In the fall/winter of 2006, the executive committees of ACP, SGIM, and SHM agreed to jointly develop a policy statement on transitions of care. Transitions of care specifically between the inpatient and outpatient settings were selected as an ideal topic for collaboration for the 3 societies as they represent the continuum of care for internal medicine within these settings. To accomplish this, the 3 organizations decided to convene a consensus conference to develop consensus guidelines and standards concerning transitions between inpatient and outpatient settings through a multi‐stakeholder process. A steering committee was convened with representatives from ACP, SGIM, SHM, the Agency for Healthcare Research and Quality (AHRQ), ABIM, and the American Geriatric Society (AGS). The steering committee developed the agenda and invitee list for the consensus conference. After the conference was held, the steering committee was expanded to include representation from the American College of Emergency Physicians (ACEP) and the Society for Academic Emergency Medicine (SAEM).
During the planning stages of the TOCCC, the steering committee became aware of the SUTTP Alliance of the ABIM Foundation. The SUTTP Alliance has representation from medical specialties such as internal medicine and its subspecialties, family medicine, and surgery. The alliance was formed in 2006 and has been working on care coordination across multiple settings and specialties. The SUTTP Alliance had developed a set of principles and standards for care transitions and agreed to provide the draft document to the TOCCC for review, input, and further development and refinement.
Recommendations on Principles and Standards for Managing Transitions in Care Between the Inpatient and Outpatient Settings from ACP, SGIM, SHM, AGS, ACEP, and SAEM
The SUTTP Alliance presented a draft document entitled Principles and Standards for Managing Transitions in Care. In this document, the SUTTP Alliance proposes 5 principles and 8 standards for effective care transitions. A key element of the conference was a presentation by NQF on how to move from principles to standards and eventually to measures. This presentation provided the TOCCC with the theoretical underpinnings for the discussion of these principles and standards and how the TOCCC would provide input on them. The presentation provided an outline for the flow from principles to measures. First, there needs to be a framework that provides guiding principles for what we would like to measure and eventually report. From those principles, a set of preferred practices or standards are developed; the standards are more granular and allow for more specificity in describing the desired practice or outcome and its elements. Standards then provide a roadmap for identification and development of performance measures. With this framework in mind, the TOCCC then discussed in detail the SUTTP principles and standards.
The 5 principles for effective care transitions developed by the SUTTP Alliance are as follows:
-
Accountability.
-
Communication: clear and direct communication of treatment plans and follow‐up expectations.
-
Timely feedback and feed‐forward of information.
-
Involvement of the patient and family member, unless inappropriate, in all steps.
-
Respect of the hub of coordination of care.
The TOCCC re‐affirmed these principles and added 4 additional principles to this list. Three of the new principles were statements within the 8 standards developed by the SUTTP, but when taking into consideration the framework for the development of principles into standards, the TOCCC felt that the statements were better represented as principles. They are as follows:
-
All patients and their families/caregivers should have and should be able to identify their medical home or coordinating clinician (ie, practice or practitioner). (This was originally part of the coordinating clinicians standard, and the TOCCC voted to elevate this to a principle).
-
At every point along the transition, the patients and/or their families/caregivers need to know who is responsible for care at that point and who to contact and how.
-
National standards should be established for transitions in care and should be adopted and implemented at the national and community level through public health institutions, national accreditation bodies, medical societies, medical institutions, and so forth in order to improve patient outcomes and patient safety. (This was originally part of the SUTTP community standards standard, and the TOCCC moved to elevate this to a principle).
-
For monitoring and improving transitions, standardized metrics related to these standards should be used in order to lead to continuous quality improvement and accountability. (This was originally part of the measurement standard, and the TOCCC voted to elevate this to a principle).
The SUTTP Alliance proposed the following 8 standards for care transitions:
-
Coordinating clinicians.
-
Care plans.
-
Communication infrastructure.
-
Standard communication formats.
-
Transition responsibility.
-
Timeliness.
-
Community standards.
-
Measurement.
The TOCCC affirmed these standards and through a consensus process added more specificity to most of them and elevated components of some of them to principles, as discussed previously. The TOCCC proposes that the following be merged with the SUTTP standards:
-
Coordinating clinicians. Communication and information exchange between the medical home and the receiving provider should occur in an amount of time that will allow the receiving provider to effectively treat the patient. This communication and information exchange should ideally occur whenever patients are at a transition of care (eg, at discharge from the inpatient setting). The timeliness of this communication should be consistent with the patient's clinical presentation and, in the case of a patient being discharged, the urgency of the follow‐up required. Guidelines will need to be developed that address both the timeliness and means of communication between the discharging physician and the medical home. Communication and information exchange between the medical home and other physicians may be in the form of a call, voice mail, fax, or other secure, private, and accessible means including mutual access to an electronic health record.
The ED represents a unique subset of transitions of care. The potential transition can generally be described as outpatient to outpatient or outpatient to inpatient, depending on whether or not the patient is admitted to the hospital. The outpatient‐to‐outpatient transition can also encompass a number of potential variations. Patients with a medical home may be referred to the ED by the medical home, or they may self‐refer. A significant number of patients do not have a physician and self‐refer to the ED. The disposition from the ED, either outpatient to outpatient or outpatient to inpatient, is similarly represented by a number of variables. Discharged patients may or may not have a medical home, may or may not need a specialist, and may or may not require urgent (24 hours) follow‐up. Admitted patients may or may not have a medical home and may or may not require specialty care. This variety of variables precludes a single approach to ED transition of care coordination. The determination of which scenarios will be appropriate for the development of standards (coordinating clinicians and transition responsibility) will require further contributions from ACEP and SAEM and review by the steering committee.
-
Care plans/transition record. The TOCCC also agreed that there is a minimal set of data elements that should always be part of the transition record. The TOCCC suggested that this minimal data set be part of an initial implementation of this standard. That list includes the following:
The TOCCC discussed what components should be included in an ideal transition record and agreed on the following elements:
The TOCCC also added a new standard under this heading: Patients and/or their families/caregivers must receive, understand, and be encouraged to participate in the development of the transition record, which should take into consideration patients' health literacy and insurance status and be culturally sensitive.
-
Principle diagnosis and problem list.
-
Medication list (reconciliation) including over‐the‐counter medications/herbals, allergies, and drug interactions.
-
Clear identification of the medical home/transferring coordinating physician/emnstitution and the contact information.
-
Patient's cognitive status.
-
Test results/pending results.
-
Principle diagnosis and problem list.
-
Medication list (reconciliation) including over‐the‐counter medications/herbals, allergies, and drug interactions.
-
Emergency plan and contact number and person.
-
Treatment and diagnostic plan.
-
Prognosis and goals of care.
-
Test results/pending results.
-
Clear identification of the medical home and/or transferring coordinating physician/emnstitution.
-
Patient's cognitive status.
-
Advance directives, power of attorney, and consent.
-
Planned interventions, durable medical equipment, wound care, and so forth.
-
Assessment of caregiver status.
-
Communication infrastructure. All communications between providers and between providers and patients and families/caregivers need to be secure, private, Health Insurance Portability and Accountability Actcompliant, and accessible to patients and those practitioners who care for them. Communication needs to be 2‐way with an opportunity for clarification and feedback. Each sending provider needs to provide a contact name and the number of an individual who can respond to questions or concerns. The content of transferred information needs to include a core standardized data set. This information needs to be transferred as a living database; that is, it is created only once, and then each subsequent provider only needs to update, validate, or modify the information. Patient information should be available to the provider prior to the patient's arrival. Information transfer needs to adhere to national data standards. Patients should be provided with a medication list that is accessible (paper or electronic), clear, and dated.
-
Standard communication formats. Communities need to develop standard data transfer forms (templates and transmission protocols). Access to a patient's medical history needs to be on a current and ongoing basis with the ability to modify information as a patient's condition changes. Patients, families, and caregivers should have access to their information (nothing about me without me). A section on the transfer record should be devoted to communicating a patient's preferences, priorities, goals, and values (eg, the patient does not want intubation).
-
Transition responsibility. The sending provider/emnstitution/team at the clinical organization maintains responsibility for the care of the patient until the receiving clinician/location confirms that the transfer and assumption of responsibility is complete (within a reasonable timeframe for the receiving clinician to receive the information; ie, transfers that occur in the middle of the night can be communicated during standard working hours). The sending provider should be available for clarification with issues of care within a reasonable timeframe after the transfer has been completed, and this timeframe should be based on the conditions of the transfer settings. The patient should be able to identify the responsible provider. In the case of patients who do not have an ongoing ambulatory care provider or whose ambulatory care provider has not assumed responsibility, the hospital‐based clinicians will not be required to assume responsibility for the care of these patients once they are discharged.
-
Timeliness. Timeliness of feedback and feed‐forward of information from a sending provider to a receiving provider should be contingent on 4 factors:
This information should be available at the time of the patient encounter.
-
Transition settings.
-
Patient circumstances.
-
Level of acuity.
-
Clear transition responsibility.
-
Community standards. Medical communities/emnstitutions must demonstrate accountability for transitions of care by adopting national standards, and processes should be established to promote effective transitions of care.
-
Measurement. For monitoring and improving transitions, standardized metrics related to these standards should be used. These metrics/measures should be evidence‐based, address documented gaps, and have a demonstrated impact on improving care (complying with performance measure standards) whenever feasible. Results from measurements using standardized metrics must lead to continuous improvement of the transition process. The validity, reliability, cost, and impact, including unintended consequences, of these measures should be assessed and re‐evaluated.
All these standards should be applied with special attention to the various transition settings and should be appropriate to each transition setting. Measure developers will need to take this into account when developing measures based on these proposed standards.
The TOCCC also went through a consensus prioritization exercise to rank‐order the consensus standards. All meeting participants were asked to rank their top 3 priorities of the 7 standards, giving a numeric score of 1 for their highest priority, a score of 2 for their second highest priority, and a score of 3 for their third highest priority. Summary scores were calculated, and the standards were rank‐ordered from the lowest summary score to the highest. The TOCCC recognizes that full implementation of all of these standards may not be feasible and that these standards may be implemented on a stepped or incremental basis. This prioritization can assist in deciding which of these to implement. The results of the prioritization exercise are as follows:
-
All transitions must include a transition record
-
Transition responsibility
-
Coordinating clinicians
-
Patient and family involvement and ownership of the transition record
-
Communication infrastructure
-
Timeliness
-
Community standards
Future Challenges
In addition to the work on the principles and standards, the TOCCC uncovered six further challenges which are described below.
Electronic Health Record
There was disagreement in the group concerning the extent to which electronic health records would resolve the existing issues involved in poor transfers of care. However, the group did concur that: established transition standards should not be contingent upon the existence of an electronic health record and some universally, nationally‐defined set of core transfer information should be the short‐term target of efforts to establish electronic transfers of information
Use of a Transition Record
There should be a core data set (much smaller than a complete health record or discharge summary) that goes to the patient and the receiving provider, and this data set should include items in the core record described previously.
Medical Home
There was a lot of discussion about the benefits and challenges of establishing a medical home and inculcating the concept into delivery and payment structures. The group was favorable to the concept; however, since the medical home is not yet a nationally defined standard, care transition standards should not be contingent upon the existence of a medical home. Wording of future standards should use a general term for the clinician coordinating care across sites in addition to the term medical home. Using both terms will acknowledge the movement toward the medical home without requiring adoption of medical home practices to refine and implement quality measures for care transitions.
Pay for Performance
The group strongly agreed that behaviors and clinical practices are influenced by payment structures. Therefore, they agreed that a new principle should be established to advocate for changes in reimbursement practices to reward safe, complete transfers of information and care. However, the development of standards and measures should move forward on the basis of the current reimbursement practices and without assumptions of future changes.
Underserved/Disadvantaged Populations
Care transition standards and measures should be the same for all economic groups with careful attention that lower socioeconomic groups are not forgotten or unintentionally disadvantaged, including the potential for cherry‐picking. It should be noted that underserved populations may not always have a medical home because of their disadvantaged access to the health system and providers. Moreover, clinicians who care for underserved/disadvantaged populations should not be penalized by standards that assume continuous clinical care and ongoing relationships with patients who may access the health system only sporadically.
Need for Patient‐Centered Approaches
The group agreed that across all principles and standards previously established by the SUTTP coalition, greater emphasis is needed on patient‐centered approaches to care including, but not limited to, the inclusion of patient and families in care and transition planning, greater access to medical records, and the need for education at the time of discharge regarding self‐care and core transfer information.
Next Steps for the TOCCC
The TOCCC focuses only on the transitions between the inpatient and outpatient settings and does not address the equally important transitions between many other different care settings, such as the transition from a hospital to a nursing home or rehabilitation facility. The intent of the TOCCC is to provide this document to national measure developers such as the Physician Consortium for Performance Improvement and others in order to guide measure development and ultimately lead to improvements in quality and safety in care transitions.
Appendix
Conference Description
The TOCCC was held over 2 days on July 11 to 12, 2007 at ACP headquarters in Philadelphia, PA. There were 51 participants representing over 30 organizations. Participating organizations included medical specialty societies from internal medicine as well as family medicine and pediatrics, governmental agencies such as AHRQ and CMS, performance measure developers such as the National Committee for Quality Assurance and the American Medical Association Physician Consortium on Performance Improvement, nurse associations such as the Visiting Nurse Associations of America and Home Care and Hospice, pharmacist groups, and patient groups such as the Institute for Family‐Centered Care. The morning of the first day was dedicated to presentations covering the AHRQ Stanford Evidence‐Based Practice Center's evidence report on care coordination, the literature concerning transitions of care, the continuum of measurement from principles to standards to measures, and the SUTTP document of principles. The attendees then split into breakout groups that discussed the principles and standards developed by the SUTTP and refined and/or revised them. All discussions were summarized and agreed on by consensus and were presented by the breakout groups to the full conference attendees. The second day was dedicated to reviewing the work of the breakout groups and further refinement of the principles and standards through a group consensus process. Once this was completed, the attendees then prioritized the standards with a group consensus voting process. Each attendee was given 1 vote, and each attendee attached a rating of 1 for highest priority and 3 for lowest priority to the standards. The summary scores were then calculated, and the standards were then ranked from those summary scores.
The final activity of the conference was to discuss some of the overarching themes and environmental factors that could influence the acceptance, endorsement, and implementation of the standards developed. The TOCCC adjourned with the tasks of forwarding its conclusions to the SUTTP Alliance and developing a policy document to be reviewed by other stakeholders not well represented at the conference. Two such pivotal organizations were ACEP and SAEM, which were added to the steering committee after the conference. Subsequently, ACP, SGIM, SHM, AGS, ACEP, and SAEM approved the summary document, and they will forward it to the other participating organizations for possible endorsement and to national developers of measures and standards for use in performance measurement development.
Appendix
Conflict of Interest Statements
This is a summary of conflict of interest statements for faculty, authors, members of the planning committees, and staff (ACP, SHM, and SGIM)
The following members of the steering (or planning) committee and staff of the TOCCC have declared a conflict of interest:
-
Dennis Beck, MD, FACEP (ACEP representative; President and Chief Executive Officer of Beacon Medical Services): 100 units of stock options/holdings in Beacon Hill Medical Services.
-
Tina Budnitz, MPH (SHM staff; Senior Advisor for Quality Initiatives, SHM): employment by SHM
-
Eric S. Holmboe, MD (ABIM representative; Senior Vice President of Quality Research and Academic Affairs, ABIM): employment by ABIM.
-
Vincenza Snow, MD, FACP (ACP staff; Director of Clinical Programs and Quality of Care, ACP): research grants from the Centers for Disease Control, Atlantic Philanthropies, Novo Nordisk, Bristol Myers Squibb, Boehringer Ingelheim, Pfizer, United Healthcare Foundation, and Sanofi Pasteur.
-
Laurence D. Wellikson, MD, FACP (SHM staff; Chief Executive Officer of SHM): employment by SHM.
-
Mark V. Williams, MD, FACP (cochair and SHM representative; Editor in Chief of the Journal of Hospital Medicine and former President of SHM): membership in SHM.
The following members of the steering (or planning) committee and staff of the TOCCC have declared no conflict of interest:
-
David Atkins, MD, MPH [AHRQ representative; Associate Director of Quality Enhancement Research Initiative, Department of Veteran Affairs, Office of Research and Development, Health Services Research & Development (124)].
-
Doriane C. Miller, MD (cochair and SGIM representative; Associate Division Chief of General Internal Medicine, Stroger Hospital of Cook County).
-
Jane Potter, MD (AGS representative; Professor and Chief of Geriatrics, University of Nebraska Medical Center).
-
Robert L. Wears, MD, FACEP (SAEM representative; Professor of the Department of Emergency Medicine, University of Florida).
-
Kevin B. Weiss, MD, MPH, MS, FACP (chair and ACP representative; Chief Executive Officer of the American Board of Medical Specialties).
- ,,, et al.The incidence and severity of adverse events affecting patients after discharge from the hospital.Ann Intern Med.2003;138(3):161–167.
- ,,, et al.Patient safety concerns arising from test results that return after hospital discharge.Ann Intern Med.2005;143(2):121–128.
- ,,,.Posthospital medication discrepancies: prevalence and contributing factors.Arch Intern Med.2005;165(16):1842–1847.
- ,.Addressing post‐discharge adverse events: a neglected area.Jt Comm J Qual Patient Saf.2008;34(2):85–97.
- ,,, et al.Deficits in communication and information transfer between hospital‐based and primary care physicians: implications for patient safety and continuity of care.JAMA.2007;297(8):831–841.
- ,,. National Hospital Ambulatory Medical Care Survey: 2005 Emergency Department Summary.Hyattsville, MD:National Center for Health Statistics;2007.Advance Data from Vital and Health Statistics; vol386.
- .Do short breaks increase or decrease anesthetic risk?J Clin Anesth.1989;1(3):228–231.
- ,,,.Critical incidents associated with intraoperative exchanges of anesthesia personnel.Anesthesiology.1982;56(6):456–461.
- ,,, et al.Shift changes among emergency physicians: best of times, worst of times. In:Proceedings of the Human Factors and Ergonomics Society 47th Annual Meeting.Denver, CO:Human Factors and Ergonomics Society;2003:1420–1423.
- ,,, et al.Transitions in care: signovers in the emergency department. In:Proceedings of the Human Factors and Ergonomics Society 48th Annual Meeting.New Orleans, LA:Human Factors and Ergonomics Society;2004:1625–1628.
- ,,, et al.Conceptual framework for the safety of handovers. In: Henriksen K, ed.Advances in Patient Safety.Rockville, MD:Agency for Healthcare Research and Quality/Department of Defense;2005:309–321.
- .Medical errors and emergency medicine: will the difficult questions be asked, and answered?Acad Emerg Med.2003;10(8):910–911.
- ,.Lost in transition: challenges and opportunities for improving the quality of transitional care.Ann Intern Med.2004;141(7):533–536.
- ,.The medical home, access to care, and insurance: a review of evidence.Pediatrics.2004;113(5 suppl):1493–1498.
- Blue Ribbon Panel of the Society of General Internal Medicine.Redesigning the practice model for general internal medicine. A proposal for coordinated care: a policy monograph of the Society of General Internal Medicine.J Gen Intern Med.2007;22(3):400–409.
- Medical Home Initiatives for Children with Special Needs Project Advisory Committee.The medical home.Pediatrics.2002;110(1 pt 1):184–186.
- American College of Physicians. The advanced medical home: a patient‐centered, physician‐guided model of healthcare. A policy monograph.2006. http://www.acponline.org/advocacy/where_we_stand/policy/adv_med.pdf. Accessed March 13, 2009.
- ,,, et al.Development and testing of a measure designed to assess the quality of care transitions.Int J Integr Care.2002;2:e02.
- ,,, et al.Carepartner experiences with hospital care.Med Care.1999;37(1):33–38.
- ,,.Assessing the quality of preparation for post hospital care from the patient's perspective: the care transitions measure.Med Care.2005;43(3):246–255.
- American Board of Internal Medicine Foundation. Stepping up to the Plate Alliance. Principles and Standards for managing transitions in care (in press). Available at http://www.abimfoundation.org/publications/pdf_issue_brief/F06‐05‐2007_6.pdf. Accessed March 13,2009.
- ,,, et al.The incidence and severity of adverse events affecting patients after discharge from the hospital.Ann Intern Med.2003;138(3):161–167.
- ,,, et al.Patient safety concerns arising from test results that return after hospital discharge.Ann Intern Med.2005;143(2):121–128.
- ,,,.Posthospital medication discrepancies: prevalence and contributing factors.Arch Intern Med.2005;165(16):1842–1847.
- ,.Addressing post‐discharge adverse events: a neglected area.Jt Comm J Qual Patient Saf.2008;34(2):85–97.
- ,,, et al.Deficits in communication and information transfer between hospital‐based and primary care physicians: implications for patient safety and continuity of care.JAMA.2007;297(8):831–841.
- ,,. National Hospital Ambulatory Medical Care Survey: 2005 Emergency Department Summary.Hyattsville, MD:National Center for Health Statistics;2007.Advance Data from Vital and Health Statistics; vol386.
- .Do short breaks increase or decrease anesthetic risk?J Clin Anesth.1989;1(3):228–231.
- ,,,.Critical incidents associated with intraoperative exchanges of anesthesia personnel.Anesthesiology.1982;56(6):456–461.
- ,,, et al.Shift changes among emergency physicians: best of times, worst of times. In:Proceedings of the Human Factors and Ergonomics Society 47th Annual Meeting.Denver, CO:Human Factors and Ergonomics Society;2003:1420–1423.
- ,,, et al.Transitions in care: signovers in the emergency department. In:Proceedings of the Human Factors and Ergonomics Society 48th Annual Meeting.New Orleans, LA:Human Factors and Ergonomics Society;2004:1625–1628.
- ,,, et al.Conceptual framework for the safety of handovers. In: Henriksen K, ed.Advances in Patient Safety.Rockville, MD:Agency for Healthcare Research and Quality/Department of Defense;2005:309–321.
- .Medical errors and emergency medicine: will the difficult questions be asked, and answered?Acad Emerg Med.2003;10(8):910–911.
- ,.Lost in transition: challenges and opportunities for improving the quality of transitional care.Ann Intern Med.2004;141(7):533–536.
- ,.The medical home, access to care, and insurance: a review of evidence.Pediatrics.2004;113(5 suppl):1493–1498.
- Blue Ribbon Panel of the Society of General Internal Medicine.Redesigning the practice model for general internal medicine. A proposal for coordinated care: a policy monograph of the Society of General Internal Medicine.J Gen Intern Med.2007;22(3):400–409.
- Medical Home Initiatives for Children with Special Needs Project Advisory Committee.The medical home.Pediatrics.2002;110(1 pt 1):184–186.
- American College of Physicians. The advanced medical home: a patient‐centered, physician‐guided model of healthcare. A policy monograph.2006. http://www.acponline.org/advocacy/where_we_stand/policy/adv_med.pdf. Accessed March 13, 2009.
- ,,, et al.Development and testing of a measure designed to assess the quality of care transitions.Int J Integr Care.2002;2:e02.
- ,,, et al.Carepartner experiences with hospital care.Med Care.1999;37(1):33–38.
- ,,.Assessing the quality of preparation for post hospital care from the patient's perspective: the care transitions measure.Med Care.2005;43(3):246–255.
- American Board of Internal Medicine Foundation. Stepping up to the Plate Alliance. Principles and Standards for managing transitions in care (in press). Available at http://www.abimfoundation.org/publications/pdf_issue_brief/F06‐05‐2007_6.pdf. Accessed March 13,2009.
Discharge Software and Readmissions
Adverse events occur to patients after their discharge from acute care hospitals.1, 2 Most of these injuries are adverse drug events, procedure‐related events, nosocomial infections, or falls.1 Postdischarge adverse events are associated with several days of symptoms, nonpermanent disability, emergency department visits, or hospital readmission.1, 3 When adverse events are preventable or ameliorable, the most common root cause is poor communication between hospital personnel and either the patient or the outpatient primary care physician.1 In addition, there may be deficits in discharge processes related to assessment and communication of unresolved problems.1 Systematic reviews have shown that discharge communication is an inefficient and error‐prone process.46
One potential solution to poor discharge communication is health information technology.7 An example of technology is discharge software with a computerized physician order entry (CPOE) system. By definition, a CPOE system is a computer‐based system that automates direct entry of orders by physicians and ensures standardized, legible, and complete orders.8 The benefits of CPOE have been tested in other inpatient settings.8, 9 It is logical to consider software applications with CPOE for discharge interventions.7
Several mechanisms explain the potential benefit of discharge software with CPOE.7 Applications with CPOE decrease medication errors.8, 10 Software with decision support could prompt physicians to enter posthospitalization appointment dates and orders for preventive services.11, 12 Discharge software could facilitate medication reconciliation and generate patient instructions and information.4, 1315 The potential benefits of discharge software with CPOE provide a rationale for clinical trials to measure benefits.
Previous studies addressed discharge applications of health information technology. Observational studies recorded outcomes such as physician satisfaction.16, 17 Prior randomized clinical trials measured quality and timeliness of discharge summaries.18 However, these previous trials did not assess clinically relevant outcomes like readmissions, emergency department visits, or adverse events. We performed a cluster‐randomized trial to assess the value of a discharge software application of CPOE. The rationale for our clustered design complied with recommendations from a systematic review of discharge interventions.5 Our objective was to assess the benefit of discharge software with CPOE when used to discharge patients at high risk for repeat admission. After the intervention, we compared the rates of hospital readmission, emergency department visits, and postdischarge adverse events due to medical management.
Methods
The trial design was a cluster randomized, controlled trial with blinded outcome assessment. Follow‐up occurred until 6 months after discharge from index hospitalization at a 730‐bed, tertiary care, teaching hospital in central Illinois. The Peoria Institutional Review Board approved the protocol for human research.
Participants
The cluster definition was the hospital physician. Patients discharged by the physician comprised the cluster. Hospital physicians and patients were enrolled between November 2004 and January 2007. Internal medicine resident or attending physicians were eligible. We excluded hospital physicians if their assignments to inpatient duties were less than 2 months during the 27‐month enrollment period. The rationale for the physician exclusion was a consequence of the patient enrollment rate of 3 to 5 patients per physician per month. Physicians with brief assignments could not achieve the goal of 9 or more patients per cluster. After physicians gave informed consent to screen their patients, trained research coordinators applied inclusion and exclusion criteria and obtained informed consent from patients. Research personnel identified all consecutive, unique, adult inpatients who were discharged to home. Patient inclusion required a probability of repeat admission (Pra) score 0.40.19, 20 The Pra score came from a logistic model of age, gender, prior hospitalizations, prior doctor visits, self‐rated health status, presence of informal caregiver in the home, and comorbid coronary heart disease and diabetes mellitus. Research coordinators calculated the Pra within 2 days before discharge from the index hospitalization. Other details about exclusion criteria have been published.21 If a patient's outpatient primary care physician treated the patient during the index hospitalization, then there was no perceived barrier in physician‐to‐physician communication and we excluded the patient.
Intervention
The research intervention was a CPOE software application that facilitated communication at the time of hospital discharge to patients, retail pharmacists, and community physicians. Details about the discharge software appeared in a previous publication.7 Software features included required fields, pick lists, standard drug doses, alerts, reminders, and online reference information. The software prompted the discharging physician to enter pending tests and order tests after discharge. Hospital physicians used the software on the day of discharge and automatically generated 4 discharge documents. The first document was a personalized letter to the outpatient physician with discharge diagnoses, reconciled medication list, diet and activity instructions, patient education materials provided, and follow‐up appointments and studies. Second, the software printed legible prescriptions along with specific information for the dispensing pharmacist about changes and deletions in the patient's previous regimen. Third, the software created patient instructions with addresses and telephone numbers for follow‐up appointments and tests. Fourth, the software printed a legible discharge order including all of the aforementioned information.
The control intervention was the usual care discharge process as described previously.7 Hospital physicians and ward nurses completed handwritten discharge forms on the day of discharge. The forms contained blanks for discharge diagnoses, discharge medications, medication instructions, postdischarge activities and restrictions, postdischarge diet, postdischarge diagnostic and therapeutic interventions, and appointments. Patients received handwritten copies of the forms, 1 page of which also included medication instructions and prescriptions. A previous publication gave details about the standard care available to all patients regardless of intervention.7
Randomization
The unit of randomization was the hospital physician who performed the discharge process. Random allocation was to discharge software or usual care discharge process. The randomization ratio was 1:1, the block size was 2, and there was no stratification or matching. There was concealed allocation and details are available from the investigators. Hospital physicians subsequently used their randomly assigned process when discharging their patients who enrolled in the study. After random allocation, it was not possible to conceal the test or control intervention from physicians or their patients. Likewise, it was not possible to conceal the outcome ascertainment, including readmission, from the hospital physicians.
All hospital physicians received training on the usual care discharge process. Physicians assigned to discharge software completed additional training via multimedia demonstration with 1‐on‐1 coaching as needed. Physicians assigned to usual care did not receive training on the discharge software and were blocked from using the software. After informed consent, patients were passive recipients of the research intervention performed by their discharging physician. Patients received the research intervention on the day of discharge from the index hospitalization.
The baseline assessment of patient characteristics occurred during the index hospitalization. Trained data abstractors recorded patient demographic data plus variables to calculate the Pra score for probability for repeat admission. We recorded additional variables because of their possible association with readmission.15, 2229 Data came from the patient or proxy for physical functioning and mental health (SF‐36, Version 2; Medical Outcomes Trust, Boston, MA). Other data for predictor variables came from interviews or hospital records.
Outcome Assessment
The primary study outcome was the proportion of patients readmitted at least once within 6 months after the index hospitalization. Readmission was for any reason and included observation and full admission status. Secondary outcomes were emergency department visits that did not result in hospital admission. Outcome assessment occurred at the patient level. We obtained data for readmissions and emergency department visits from 6 hospitals in central Illinois where study patients were likely to seek care. We validated readmissions and emergency department visits via patient/proxy telephone interviews that occurred 6 months after index hospital discharge. Interviewers were blind to intervention assignment. We evaluated the adequacy of the blind and asked interviewers to guess the patient's intervention assignment.
Another secondary outcome was the proportion of patients who experienced an adverse event related to medical management within 1 month after discharge. For adverse event ascertainment, we employed the process of Forster et al.1, 2 Within 20 to 40 days after discharge, an internal medicine physician performed telephone interviews with the patient or proxy. The interviewer recorded symptoms, drug information, other treatment, hospital readmissions, and emergency department visits. Another physician compiled case summaries from interview data and information abstracted from the electronic medical record, including dictated discharge summaries from the index hospitalization and postdischarge emergency department visits, diagnostic test results, and readmission reports. Two additional internal medicine physicians adjudicated each case summary separately. We counted adverse events only when adjudicators agreed that medical management probably or definitely caused the event. The initial rating by each adjudicator revealed moderate‐to‐good agreement (Kappa = 0.52).30 When initial adjudications were discordant, then adjudicators met and resolved all discrepancies. The adjudicators also scored the severity of the adverse event. The severity scale options were serious laboratory abnormality only, 1 day of symptoms, several days of symptoms, nonpermanent disability, permanent disability, or death. The adjudicators also scored the adverse event as preventable (yes/no), ameliorable (yes/no), and recorded system problems associated with preventable and ameliorable adverse events.1 For adverse drug events, the adjudicators recorded preventability categories defined by previous investigators.31 We designed the adverse event outcome ascertainment as a blinded process. We evaluated the success of the blind and asked adjudicators to guess the patient's intervention assignment.
Sample Size
The sample size analysis employed several assumptions regarding the proportion of readmitted patients. The estimated readmission rate after usual care was 37%.24, 3236 The minimum clinically relevant difference in readmission rates was 13%, an empirical boundary for quantitative significance.37 Estimates for intracluster correlation were not available when we designed the trial. We projected intracluster correlations with low, medium, and high values. The cluster number and size were selected to maintain test significance level, 1‐sided alpha, <0.05 and power >80%. The sample size assumed no interim analysis. The initial sample size estimates were 11 physician clusters per intervention with 25 patients per cluster. During the first 2 months of patient recruitment, we observed that we could not consistently achieve clusters with 25 patients. We recalculated the sample size. Using the same assumptions, we found we could achieve similar test significance and power with 35 physician clusters per intervention and 9 patients per cluster. The sample size calculator was nQuery (Statistical Solutions, Saugus, MA).
Statistical Methods
Analyses were performed with SPSS PC (Version 15.0.1; SPSS Inc, Chicago, IL). Using descriptive statistics, we reported baseline variables as means and standard deviations (SD) for interval variables, and percentages for categorical variables. For outcome variables, we utilized the principle of intention‐to‐treat and assumed patient exposure to the intervention randomly assigned to their discharging physician. We inspected scatter plots and correlations for all variables to test assumptions regarding normal distribution, homogeneity of variance, and linearity of relationships between independent and dependent variables. When assumptions failed, we stratified variables (median or thirds) or performed transformations to satisfy assumptions. For patient‐level outcome variables, we calculated intracluster correlation coefficients. The assessment of the blind was unaffected by the cluster assumption so we used the chi‐square procedure. For analysis of time to event, we used Kaplan‐Meier plots.
The primary hypothesis was a significant decrease in the primary readmission outcome for patients assigned to discharge software. We tested the primary hypothesis with generalized estimating equations that corrected for clustering by hospital physician and adjusted for covariates that predicted readmission. The intervention variable was discharge software versus usual care handwritten discharge. We reported parameter estimates of the intervention variable coefficient and Wald 95% confidence interval (95% CI) with and without correction for cluster. For the secondary, patient‐level outcomes, we performed similar analyses with generalized estimating equations that corrected for clustering by hospital physician.
During covariate analysis, we screened all baseline variables for their correlation with readmission. The variable with the highest correlation and P value <0.05 entered initially in the general estimating equation. After initial variable entry, we evaluated subsequent variables with partial correlations that controlled for variables entered previously. At each iterative step, we entered into the model the variable with the highest partial correlation and P value <0.05.
In exploratory analyses, we examined intervention group differences within strata defined by covariates that predicted readmission. We used generalized estimating equations and adjusted for the other covariates that predicted readmission.
Results
We screened 127 physicians who were general internal medicine hospital physicians. Seventy physicians consented and received random allocation to discharge software or usual care. The physician characteristics appear in Table 1. Most of the hospital physicians were interns in the first year of postgraduate training (58.6%; 41/70). We excluded 57 physicians for reasons shown in the trial flow diagram (Figure 1). The most common reason for hospital physician exclusion applied to resident physicians in their last months of training before graduation or emergency department residents temporarily assigned to internal medicine training. We approached 6,884 patients during their index hospitalization. After excluding 6,253 ineligible patients, we enrolled and followed 631 patients who received the discharge intervention (Figure 1). During 6 months of follow‐up, a small proportion of patients died (3%; 20/631). Hospital records were available for deceased patients and they were included in the analysis. A small proportion (6%; 41/631) of patients withdrew consent or left the trial for other reasons during 6 months. There was no differential dropout between the interventions. Protocol deviations were rare (0.5%; 3/631). Three patients erroneously received usual care discharge from physicians assigned to discharge software. All 631 patients were included in the intention‐to‐treat analysis. The baseline characteristics of the randomly‐assigned hospital physicians and their patients are in Table 1.
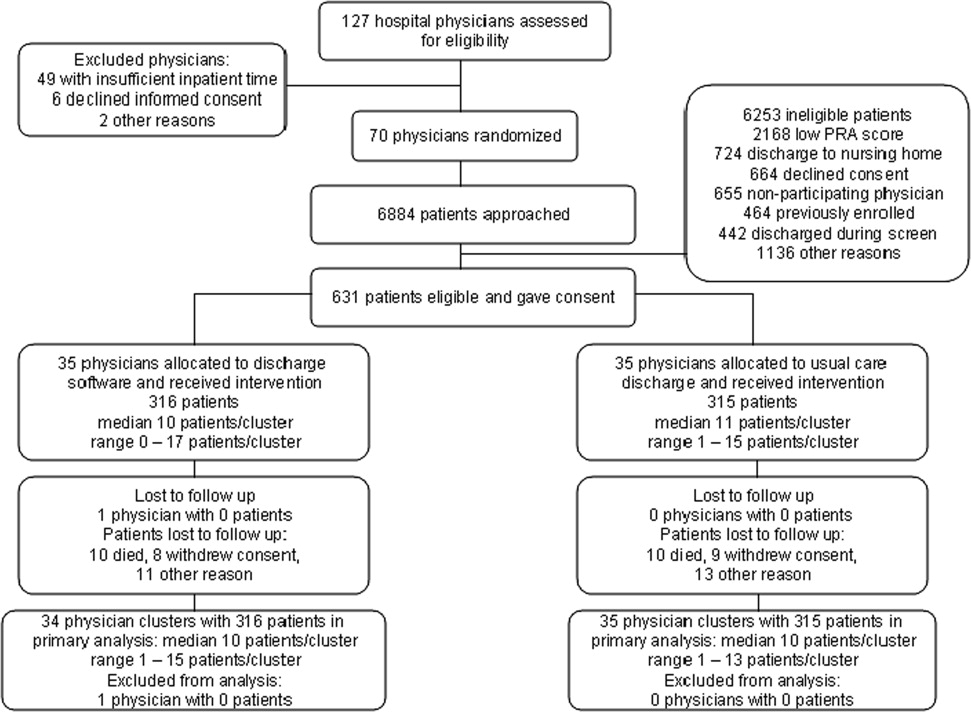
| Discharge Software | Usual Care | |
|---|---|---|
| ||
| Hospital physician characteristics, n (%) | (n = 35) | (n = 35) |
| Postgraduate year 1 | 18 (51.4) | 23 (65.7) |
| Postgraduate years 2‐4 | 10 (28.6) | 7 (20.0) |
| Attending physician | 7 (20.0) | 5 (14.3) |
| Patient characteristics | (n = 316) | (n = 315) |
| Gender, female, n (%) | 180 (57.0) | 168 (53.3) |
| Age, years, n (%) | ||
| 18‐44 | 68 (21.5) | 95 (30.2) |
| 45‐54 | 79 (25.0) | 76 (24.1) |
| 55‐64 | 86 (27.2) | 74 (23.5) |
| 65‐98 | 83 (26.3) | 70 (22.2) |
| Race, n (%) | ||
| Caucasian | 239 (75.6) | 229 (72.7) |
| Black | 72 (22.8) | 85 (27.0) |
| Other | 5 (1.6) | 1 (0.3) |
| Self‐rated health status, n (%) | ||
| Poor | 82 (25.9) | 108 (34.3) |
| Fair | 169 (53.5) | 147 (46.7) |
| Good | 54 (17.1) | 46 (14.6) |
| Very good | 10 (3.2) | 11 (3.5) |
| Excellent | 1 (0.3) | 3 (1.0) |
| Diabetes mellitus, n (%) | 172 (54.4) | 177 (56.2) |
| Chronic obstructive pulmonary disease, n (%) | ||
| None | 259 (82.0) | 257 (81.6) |
| Without oral steroid or home oxygen | 28 (8.9) | 26 (8.3) |
| With chronic oral steroid | 10 (3.2) | 8 (2.5) |
| With home oxygen oral steroid | 19 (6.0) | 24 (7.6) |
| Coronary heart disease, n (%) | 133 (42.1) | 120 (38.1) |
| Heart failure, n (%) | 80 (25.3) | 67 (21.3) |
| Informal caregiver available, yes, n (%) | 313 (99.1) | 313 (99.4) |
| Taking loop diuretic, n (%) | 110 (34.8) | 88 (27.9) |
| Physical functioning from SF‐36, n (%) | ||
| Lowest third | 128 (40.5) | 121 (38.4) |
| Upper two‐thirds | 188 (59.5) | 194 (61.6) |
| Mental health from SF‐36, n (%) | ||
| Lowest third | 113 (35.8) | 117 (37.1)* |
| Upper two‐thirds | 203 (64.2) | 197 (62.5)* |
| Hospital admissions during year prior to index admission, n (%) | ||
| 0 or 1 | 247 (78.2) | 224 (71.1) |
| 2 or more | 69 (21.8) | 91 (28.9) |
| Emergency department visits during 6 months before index admission, n (%) | ||
| 0 or 1 | 194 (61.4) | 168 (53.3) |
| 2 or more | 122 (38.6) | 147 (46.7) |
| Outpatient doctor or clinic visits during year prior to index admission | ||
| 0 to 4 | 97 (30.7%) | 77 (24.4%) |
| 5 to 8 | 68 (21.5%) | 81 (25.7%) |
| 9 to 12 | 82 (25.9%) | 84 (26.7%) |
| 13 or more | 69 (21.8%) | 73 (23.2%) |
| Insurance or payor | ||
| Medicare, age less than 65 years | 18 (5.7%) | 13 (4.1%) |
| Medicare, age 65 years and older | 56 (17.7%) | 40 (12.7%) |
| Medicaid, age less than 65 years | 98 (31.0%) | 130 (41.3%) |
| Medicaid, age 65 years and older | 17 (5.4%) | 20 (6.3%) |
| Commercial or veteran | 85 (26.9%) | 61 (19.4%) |
| Self‐pay | 42 (13.3%) | 51 (16.2%) |
| Religious participation | ||
| Never | 159 (50.3%) | 164 (52.1%) |
| 1‐24 times per year | 55 (17.4%) | 51 (16.2%) |
| 1‐7 times per week | 102 (32.3%) | 100 (31.7%) |
| Volunteer activity, 1 or more hour/month | 31 (9.8%) | 39 (12.4%) |
| Employment status | ||
| Not working | 229 (72.5%) | 233 (74.4%)* |
| Part‐time (<37.5 hours/week) | 30 (9.5%) | 25 (8.0%)* |
| Full‐time (at least 37.5 hour/week) | 57 (18.0%) | 55 (17.6%)* |
| Number of discharge medications, mean (SD) | 10.5 (4.8) | 9.9 (5.1) |
| Severity of illness, mean (SD) | 1.8 (1.2) | 1.6 (1.3) |
| Charlson‐Deyo comorbidity, mean (SD) | 1.7 (1.4) | 1.6 (1.9) |
| Index hospital length of stay, days, mean (SD) | 3.9 (3.5) | 3.5 (3.5) |
| Blood urea nitrogen, mean (SD) | 17.9 (12.9) | 19.1 (12.9) |
| Probability of repeat admission, Pra, mean (SD) | 0.486 (0.072) | 0.495 (0.076) |
We asked outpatient physicians about their receipt of discharge communication from hospital physicians. The text of the question was, How soon after discharge did you receive any information (in any form) relating to this patient's hospital admission and discharge plans? We mailed the question 10 days after discharge to outpatient physicians designated by patients enrolled in the study. Among patients in the discharge software group, 75.0% (237/316) of their outpatient physicians responded to the question. The response rate was 80.6% (254/315) from physicians who followed patients in the usual care group. Respondents from the discharge software group said within 1‐2 days or within a week for 56.0% (177/316) of patients. Respondents from the usual care group said within 1‐2 days or within a week for 57.1% (180/315) of patients. The difference between the intervention groups, 1.1% (95% CI, 9.2% to 6.9%), was not significant.
The primary, prespecified, outcome of the study was the proportion of patients with at least 1 readmission to the hospital. After intervention with discharge software versus usual care, there was no significant difference in readmission rates (Table 2) or time to first readmission (Figure 2). We screened all baseline variables in Table 1 and sought predictors of readmission to employ in adjusted models. For example, we evaluated physician level of training because we wondered if experience or seniority affected readmission when hospital physicians used the discharge software or usual care discharge. The candidate variable, physician level of training, did not correlate with readmission (rho = 0.066; P = 0.100), so it was dropped from subsequent analyses. After screening all variables in Table 1, we found 4 independent predictors of readmission: previous hospitalizations, previous emergency department visits, heart failure, and physical function. Generalized estimating equations for readmission that adjusted for predictor variables confirmed a negligible parameter estimate for the discharge intervention variable coefficient (Table 2).
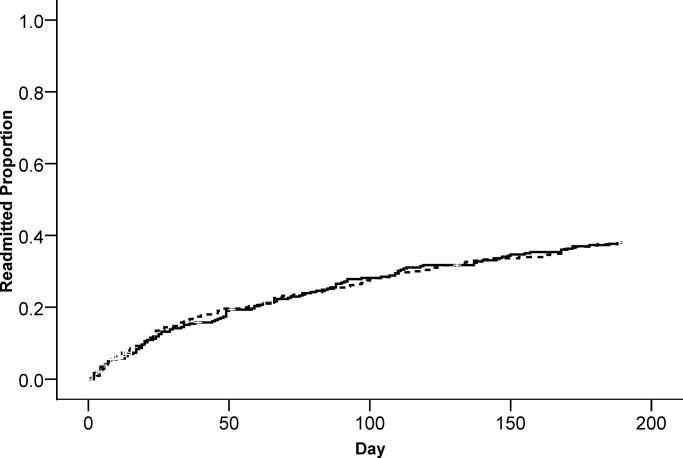
| Outcome | Discharge Software, n (%) | Usual Care, n (%) | Parameter Estimate Without Cluster Correction Intervention Coefficient (95% CI) | P Value | Parameter Estimate With Cluster Correction Intervention Coefficient (95% CI) | P Value |
|---|---|---|---|---|---|---|
| ||||||
| Readmitted within 6 months | 117 (37.0%) | 119 (37.8%) | 0.005* (0.076, 0.067) | 0.897 | 0.005* (0.074, 0.065) | 0.894 |
| Emergency department visit within 6 months | 112 (35.4%) | 128 (40.6%) | 0.052 (0.128, 0.024) | 0.179 | 0.052 (0.115, 0.011) | 0.108 |
| Adverse event within 1 month | 23 (7.3%) | 23 (7.3%) | 0.003 (0.037, 0.043) | 0.886 | 0.003 (0.037, 0.043) | 0.884 |
We evaluated emergency department visits that were unrelated to readmission as secondary, prespecified, outcomes. The results were similar to readmission results. While the proportion of patients with at least 1 emergency department visit was lower for the discharge software intervention, the difference with usual care was not significant (Table 2). There was no significant difference between interventions for time to first emergency department visit (Figure 3).
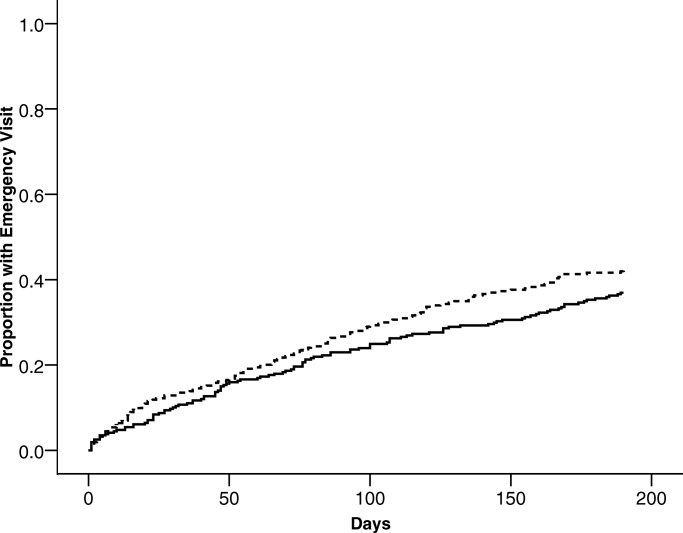
Postdischarge adverse events were secondary, prespecified, outcomes. Data for adverse event adjudication were available for 98% (309/316) of discharge software patients and 97% (307/315) of usual care patients. Within 1 month after discharge, 46 patients had adverse events probably or definitely related to medical management. Two patients had 2 events and 1 patient had 3 events. For analysis, we randomly selected 1 event per patient. When comparing patients assigned to discharge software versus usual care, there were no differences in adverse events related to medical management (Table 2). Most of the events were possible adverse drug events (74%; 34/46). The adverse event severity was several days of symptoms or nonpermanent disability for 76% (35/46) of the adverse events. Adjudicators rated 26% (12/46) of the adverse events as preventable and 46% (21/46) as ameliorable. The absolute numbers of events were small. There were no differences between discharge software and usual care patients within adverse event strata defined by type, severity, preventable, or ameliorable (Table 3). For most of the patients with adverse events, the adjudicators could not identify a system problem or preventability category (Table 3). When a deficiency was evident, there was no pattern to suggest a significant difference between discharge software patients versus usual care patients.
| Discharge Software (n) | Usual Care Discharge (n) | |
|---|---|---|
| ||
| At least 1 adverse event | 23 | 23 |
| Preventable adverse event | 7 | 5 |
| Ameliorable adverse event | 9 | 12 |
| Adverse event severity | ||
| Serious laboratory abnormality only or 1 day of symptoms | 5 | 5 |
| Several days of symptoms or nonpermanent disability | 18 | 17 |
| Permanent disability or death | 0 | 1 |
| Adverse event by type | ||
| Possible adverse drug event | 17 | 17 |
| Procedure‐related injury | 2 | 1 |
| Therapeutic error | 4 | 4 |
| Diagnostic error | 0 | 1 |
| System problems associated with preventable or ameliorable adverse events | ||
| Inadequate patient education regarding the medical condition or its treatment | 0 | 1 |
| Poor communication between patient and physician | 2 | 1 |
| Poor communication between hospital and community physicians | 0 | 0 |
| Inadequate monitoring of the patient's illness after discharge | 0 | 6 |
| Inadequate monitoring of the patient's treatment after discharge | 2 | 6 |
| No emergency contact number given to patient to call about problems | 0 | 0 |
| Patient with problems getting prescribed medications immediately | 1 | 0 |
| Inadequate home services | 0 | 0 |
| Delayed follow‐up care | 0 | 3 |
| Premature hospital discharge | 1 | 2 |
| Adverse drug event (ADE) preventability categories | ||
| Drug involved in the ADE inappropriate for the clinical condition | 2 | 4 |
| Dose, route, or frequency inappropriate for age, weight, creatinine clearance, or disease | 1 | 2 |
| Failure to obtain required lab tests and/or drug levels | 1 | 2 |
| Prior history of an adverse event or allergy to the drug | 1 | 2 |
| Drug‐drug interaction involved in the ADE | 2 | 0 |
| Toxic serum drug level documented | 0 | 0 |
| Noncompliance involved in the ADE | 0 | 1 |
When we designed the trial, we assumed variance in outcomes measured at the patient level. We predicted some variance attributable to clustering by hospital physician. After the trial, we calculated the intracluster correlation coefficients for readmissions, emergency department visits, and adverse events. For all of these outcomes, the intracluster correlation coefficients were negligible. We also evaluated generalized estimating equations with and without correction for hospital physician cluster. We confirmed the negligible cluster effect on confidence intervals for intervention coefficients (Table 2).
We performed an exploratory stratified analysis. We evaluated the intervention effect on readmission within subgroups defined by covariates that predicted readmission (Table 4). When the intervention groups were compared within baseline categories of previous hospitalizations, previous emergency department visits, heart failure, and physical functioning, there was a consistent pattern with no differential effect by intervention assignment. None of the intervention coefficients were statistically significant (Table 4).
| Subgroup | Discharge Software Readmitted n/n (%) | Usual Care Readmitted n/n (%) | Adjusted Parameter Estimate Intervention Coefficient (95% CI) |
|---|---|---|---|
| |||
| Hospital admissions during year prior to index admission | |||
| 0 or 1 | 77/247 (31.2) | 73/224 (32.6) | 0.025 (0.095, 0.045)* |
| 2 or more | 40/69 (58.0) | 46/91 (50.5) | 0.059 (0.090, 0.208)* |
| Emergency department visits during 6 months before index admission | |||
| 0 or 1 | 64/194 (33.0) | 45/168 (26.8) | 0.033 (0.047, 0.113) |
| 2 or more | 53/122 (43.4) | 74/147 (50.3) | 0.071 (0.188, 0.046) |
| Heart failure | |||
| Present | 40/80 (50.0) | 36/67 (53.7) | 0.024 (0.224, 0.177) |
| Absent | 77/236 (32.6) | 83/248 (33.5) | 0.000 (0.076, 0.075) |
| Physical functioning from SF‐36 | |||
| Lowest third | 55/128 (43.0) | 59/121 (48.8) | 0.032 (0.161, 0.096) |
| Upper two‐thirds | 62/188 (33.0) | 60/194 (30.9) | 0.012 (0.071, 0.095) |
Assessment of the Success of the Blind
We evaluated the adequacy of the blind for outcome assessors who interviewed patients or adjudicated adverse events. The guesses of outcomes assessors were unrelated to true intervention assignment (all P values >0.097). We interpreted the blind as adequate for outcome assessors who recorded readmissions, emergency department visits, and adverse events.
Discussion
We performed a cluster‐randomized clinical trial to measure the effects of discharge software versus usual care handwritten discharge. The discharge software with CPOE implemented elements of high‐quality discharge planning and communication endorsed by the National Quality Forum and systematic reviews.6, 38 Despite theoretical benefits, our discharge software intervention did not reduce readmissions or emergency department visits. What were potential explanations for our results? We assumed an association between postdischarge adverse events and readmissions or emergency department visits.1 Our failure to reduce adverse events might explain the failure to reduce readmissions or emergency department visits. Another potential explanation was related to adverse drug events. Other investigators showed most postdischarge adverse events were adverse drug events and our data confirmed previous studies.1, 2 Medication reconciliation at discharge was a potential mechanism for adverse drug event reduction.14 Medication reconciliation was the standard at the study hospital, so it was unethical to deny reconciliation to patients assigned to either intervention.39 Required medication reconciliation in both groups, by its known effect on preventable adverse drug events, might have reduced the event rates in both groups.14 This possibility is supported by the low rate of adverse events observed in our study compared with other studies.1 We speculate that the low background rate of adverse events at the study hospital may have minimized events in both the discharge software and usual care groups and prevented detection of software benefits, if present.39
One limitation of our study may have been the discharge software. The automated decision support in our software lacked features that might have improved outcomes. For example, the software did not generate a list of diagnostic test results that were pending at the time of discharge. Our software relied on prompts to the physician user that did not specify which tests were pending. The software did not perform error checks on the discharge orders to warn physicians about drug‐drug interactions, therapeutic duplications, or missing items (eg, immunizations, drugs, education). The absence of these software enhancements made our discharge process vulnerable to the lapses and slips of the physician user. Whether or not such enhancements affect clinically relevant outcomes remains a testable hypothesis for future studies.
Another limitation of our study was the outpatient physician response. Discharge software did not increase the proportion of outpatient physicians who said they received communication within 7 days after hospital discharge. Our intervention addressed the sending partner but not the receiving partner in the communication dyad. Our discharge software was not designed to change information flow within the outpatient physician office. We do not know if discharge communication arrived and remained unnoticed until the patient called or visited the outpatient clinic. Future studies of discharge communication should consider a closed loop design to assure receipt and comprehension.
When we designed our study, we expected at least some variance between patient clusters attributable to the physician who performed the discharge. Our analysis of intracluster correlation revealed negligible variance. We speculate the highly‐standardized discharge process implemented by discharge software and usual care at our hospital resulted in minimal variance. Future studies of discharge interventions may consider designs that avoid cluster randomization.
In conclusion, a discharge software application of CPOE did not affect readmissions, emergency department visits, or adverse events after discharge.
Acknowledgements
The authors thank Howard S. Cohen, MD, for his review of the trial protocol and the manuscript.
- ,,,,.The incidence and severity of adverse events affecting patients after discharge from the hospital.Ann Intern Med.2003;138(3):161–167.
- ,,, et al.Adverse events among medical patients after discharge from hospital.CMAJ.2004;170(3):345–349.
- ,,,,.Frequency of new or worsening symptoms in the posthospitalization period.J Hosp Med.2007;2(2):58–68.
- ,,.Written and verbal information versus verbal information only for patients being discharged from acute hospital settings to home.Cochrane Database Syst Rev.2003;(4):CD003716.
- ,,,.Discharge planning from hospital to home.Cochrane Database Syst Rev.2004;(1):CD000313.
- ,,,,,.Deficits in communication and information transfer between hospital‐based and primary care physicians: implications for patient safety and continuity of care.JAMA.2007;297(8):831–841.
- ,,.Software design to facilitate information transfer at hospital discharge.Inform Prim Care.2006;14(2):109–119.
- ,,.Effects of computerized physician order entry and clinical decision support systems on medication safety: a systematic review.Arch Intern Med.2003;163(12):1409–1416.
- ,.Computer physician order entry: benefits, costs, and issues.Ann Intern Med.2003;139(1):31–39.
- ,,, et al.Systematic review: impact of health information technology on quality, efficiency, and costs of medical care.Ann Intern Med.2006;144(10):742–752.
- ,,,,,.Compliance with post‐hospitalization follow‐up visits: rationing by inconvenience?Ethn Dis.1999;9(3):387–395.
- ,,,,,.A computerized reminder system to increase the use of preventive care for hospitalized patients.N Engl J Med.2001;345(13):965–970.
- ,,,.Evaluation of a new integrated discharge prescription form.Ann Pharmacother.2001;35(7‐8):953–958.
- ,,, et al.Role of pharmacist counseling in preventing adverse drug events after hospitalization.Arch Intern Med.2006;166(5):565–571.
- ,,,,,.Factors associated with unplanned hospital readmission among patients 65 years of age and older in a Medicare managed care plan.Am J Med.1999;107(1):13–17.
- ,.Closing the loop of patient care—a clinical trial of a computerized discharge medication program.Proc Annu Symp Comput Appl Med Care.1994:841–845.
- ,,,.A comprehensive inpatient discharge system.Proc AMIA Annu Fall Symp.1996:699–703.
- Agency for Healthcare Research and Quality. Making health care safer: a critical analysis of patient safety practices, subchapter 42.3. Discharge summaries and follow‐up. Available at: http://www.ahrq.gov/clinic/ptsafety/chap42b. htm#42.3. Accessed January 2009.
- ,,.Predictive validity of a questionnaire that identifies older persons at risk for hospital admission.J Am Geriatr Soc.1995;43(4):374–377.
- ,,,.Predictive validity of the Pra instrument among older recipients of managed care.J Am Geriatr Soc.1997;45(5):614–617.
- ,,.Brief scale measuring patient preparedness for hospital discharge to home: psychometric properties.J Hosp Med.2008;3(6):446–454.
- .SF‐36 health survey update.Spine.2000;25(24):3130–3139.
- ,,,,,.Development of a method to identify seniors at high risk for high hospital utilization.Med Care.2002;40(9):782–793.
- ,,, et al.Comprehensive discharge planning and home follow‐up of hospitalized elders: arandomized clinical trial.JAMA.1999;281(7):613–620.
- ,,, et al.Predicting non‐elective hospital readmissions: a multi‐site study. Department of Veterans Affairs Cooperative Study Group on Primary Care and Readmissions.J Clin Epidemiol.2000;53:1113–1118.
- ,.Identification of factors associated with hospital readmission and development of a predictive model.Health Serv Res.1992;27(1):81–101.
- ,.Risk‐adjusting acute myocardial infarction mortality: are APR‐DRGs the right tool?Health Serv Res.2000;34(7):1469–1489.
- ,,.Adapting a clinical comorbidity index for use with ICD‐9‐CM administrative databases.J Clin Epidemiol.1992;45(6):613–619.
- ,,.The community assessment risk screen (CARS): identifying elderly persons at risk for hospitalization or emergency department visit.Am J Manag Care.2000;6(8):925–933.
- ,,,.Clinical Epidemiology: A Basic Science for Clinical Medicine.2nd ed.Boston:Little, Brown;1991.
- ,,,,.Identifying clinically significant preventable adverse drug events through a hospital's database of adverse drug reaction reports.Am J Health Syst Pharm.2002;59(18):1742–1749.
- ,,,,,.A pharmacy discharge plan for hospitalized elderly patients—a randomized controlled trial.Age Ageing.2001;30(1):33–40.
- ,,,,.Can GP input into discharge planning result in better outcomes for the frail aged: results from a randomized controlled trial.Fam Pract.1999;16(3):289–293.
- ,,,,,.Comprehensive discharge planning with postdischarge support for older patients with congestive heart failure: a meta‐analysis.JAMA.2004;291(11):1358–1367.
- ,,,,,.Can readmission after stroke be prevented? Results of a randomized clinical study: a postdischarge follow‐up service for stroke survivors.Stroke.2000;31(5):1038–1045.
- ,,.Does increased access to primary care reduce hospital readmissions? Veterans Affairs Cooperative Study Group on Primary Care and Hospital Readmission.N Engl J Med.1996;334(22):1441–147.
- ,,.Indexes and boundaries for “quantitative significance” in statistical decisions.J Clin Epidemiol.1990;43(12):1273–1284.
- National Quality Forum. Safe Practices for Better Healthcare 2006 Update, A Consensus Report, Safe Practice 11: Discharge Systems. Available at: http://qualityforum.org/pdf/reports/safe_practices/txsppublic.pdf. Accessed January 2009.
- ,.OSF Healthcare's journey in patient safety.Qual Manag Health Care.2004;13(1):53–59.
Adverse events occur to patients after their discharge from acute care hospitals.1, 2 Most of these injuries are adverse drug events, procedure‐related events, nosocomial infections, or falls.1 Postdischarge adverse events are associated with several days of symptoms, nonpermanent disability, emergency department visits, or hospital readmission.1, 3 When adverse events are preventable or ameliorable, the most common root cause is poor communication between hospital personnel and either the patient or the outpatient primary care physician.1 In addition, there may be deficits in discharge processes related to assessment and communication of unresolved problems.1 Systematic reviews have shown that discharge communication is an inefficient and error‐prone process.46
One potential solution to poor discharge communication is health information technology.7 An example of technology is discharge software with a computerized physician order entry (CPOE) system. By definition, a CPOE system is a computer‐based system that automates direct entry of orders by physicians and ensures standardized, legible, and complete orders.8 The benefits of CPOE have been tested in other inpatient settings.8, 9 It is logical to consider software applications with CPOE for discharge interventions.7
Several mechanisms explain the potential benefit of discharge software with CPOE.7 Applications with CPOE decrease medication errors.8, 10 Software with decision support could prompt physicians to enter posthospitalization appointment dates and orders for preventive services.11, 12 Discharge software could facilitate medication reconciliation and generate patient instructions and information.4, 1315 The potential benefits of discharge software with CPOE provide a rationale for clinical trials to measure benefits.
Previous studies addressed discharge applications of health information technology. Observational studies recorded outcomes such as physician satisfaction.16, 17 Prior randomized clinical trials measured quality and timeliness of discharge summaries.18 However, these previous trials did not assess clinically relevant outcomes like readmissions, emergency department visits, or adverse events. We performed a cluster‐randomized trial to assess the value of a discharge software application of CPOE. The rationale for our clustered design complied with recommendations from a systematic review of discharge interventions.5 Our objective was to assess the benefit of discharge software with CPOE when used to discharge patients at high risk for repeat admission. After the intervention, we compared the rates of hospital readmission, emergency department visits, and postdischarge adverse events due to medical management.
Methods
The trial design was a cluster randomized, controlled trial with blinded outcome assessment. Follow‐up occurred until 6 months after discharge from index hospitalization at a 730‐bed, tertiary care, teaching hospital in central Illinois. The Peoria Institutional Review Board approved the protocol for human research.
Participants
The cluster definition was the hospital physician. Patients discharged by the physician comprised the cluster. Hospital physicians and patients were enrolled between November 2004 and January 2007. Internal medicine resident or attending physicians were eligible. We excluded hospital physicians if their assignments to inpatient duties were less than 2 months during the 27‐month enrollment period. The rationale for the physician exclusion was a consequence of the patient enrollment rate of 3 to 5 patients per physician per month. Physicians with brief assignments could not achieve the goal of 9 or more patients per cluster. After physicians gave informed consent to screen their patients, trained research coordinators applied inclusion and exclusion criteria and obtained informed consent from patients. Research personnel identified all consecutive, unique, adult inpatients who were discharged to home. Patient inclusion required a probability of repeat admission (Pra) score 0.40.19, 20 The Pra score came from a logistic model of age, gender, prior hospitalizations, prior doctor visits, self‐rated health status, presence of informal caregiver in the home, and comorbid coronary heart disease and diabetes mellitus. Research coordinators calculated the Pra within 2 days before discharge from the index hospitalization. Other details about exclusion criteria have been published.21 If a patient's outpatient primary care physician treated the patient during the index hospitalization, then there was no perceived barrier in physician‐to‐physician communication and we excluded the patient.
Intervention
The research intervention was a CPOE software application that facilitated communication at the time of hospital discharge to patients, retail pharmacists, and community physicians. Details about the discharge software appeared in a previous publication.7 Software features included required fields, pick lists, standard drug doses, alerts, reminders, and online reference information. The software prompted the discharging physician to enter pending tests and order tests after discharge. Hospital physicians used the software on the day of discharge and automatically generated 4 discharge documents. The first document was a personalized letter to the outpatient physician with discharge diagnoses, reconciled medication list, diet and activity instructions, patient education materials provided, and follow‐up appointments and studies. Second, the software printed legible prescriptions along with specific information for the dispensing pharmacist about changes and deletions in the patient's previous regimen. Third, the software created patient instructions with addresses and telephone numbers for follow‐up appointments and tests. Fourth, the software printed a legible discharge order including all of the aforementioned information.
The control intervention was the usual care discharge process as described previously.7 Hospital physicians and ward nurses completed handwritten discharge forms on the day of discharge. The forms contained blanks for discharge diagnoses, discharge medications, medication instructions, postdischarge activities and restrictions, postdischarge diet, postdischarge diagnostic and therapeutic interventions, and appointments. Patients received handwritten copies of the forms, 1 page of which also included medication instructions and prescriptions. A previous publication gave details about the standard care available to all patients regardless of intervention.7
Randomization
The unit of randomization was the hospital physician who performed the discharge process. Random allocation was to discharge software or usual care discharge process. The randomization ratio was 1:1, the block size was 2, and there was no stratification or matching. There was concealed allocation and details are available from the investigators. Hospital physicians subsequently used their randomly assigned process when discharging their patients who enrolled in the study. After random allocation, it was not possible to conceal the test or control intervention from physicians or their patients. Likewise, it was not possible to conceal the outcome ascertainment, including readmission, from the hospital physicians.
All hospital physicians received training on the usual care discharge process. Physicians assigned to discharge software completed additional training via multimedia demonstration with 1‐on‐1 coaching as needed. Physicians assigned to usual care did not receive training on the discharge software and were blocked from using the software. After informed consent, patients were passive recipients of the research intervention performed by their discharging physician. Patients received the research intervention on the day of discharge from the index hospitalization.
The baseline assessment of patient characteristics occurred during the index hospitalization. Trained data abstractors recorded patient demographic data plus variables to calculate the Pra score for probability for repeat admission. We recorded additional variables because of their possible association with readmission.15, 2229 Data came from the patient or proxy for physical functioning and mental health (SF‐36, Version 2; Medical Outcomes Trust, Boston, MA). Other data for predictor variables came from interviews or hospital records.
Outcome Assessment
The primary study outcome was the proportion of patients readmitted at least once within 6 months after the index hospitalization. Readmission was for any reason and included observation and full admission status. Secondary outcomes were emergency department visits that did not result in hospital admission. Outcome assessment occurred at the patient level. We obtained data for readmissions and emergency department visits from 6 hospitals in central Illinois where study patients were likely to seek care. We validated readmissions and emergency department visits via patient/proxy telephone interviews that occurred 6 months after index hospital discharge. Interviewers were blind to intervention assignment. We evaluated the adequacy of the blind and asked interviewers to guess the patient's intervention assignment.
Another secondary outcome was the proportion of patients who experienced an adverse event related to medical management within 1 month after discharge. For adverse event ascertainment, we employed the process of Forster et al.1, 2 Within 20 to 40 days after discharge, an internal medicine physician performed telephone interviews with the patient or proxy. The interviewer recorded symptoms, drug information, other treatment, hospital readmissions, and emergency department visits. Another physician compiled case summaries from interview data and information abstracted from the electronic medical record, including dictated discharge summaries from the index hospitalization and postdischarge emergency department visits, diagnostic test results, and readmission reports. Two additional internal medicine physicians adjudicated each case summary separately. We counted adverse events only when adjudicators agreed that medical management probably or definitely caused the event. The initial rating by each adjudicator revealed moderate‐to‐good agreement (Kappa = 0.52).30 When initial adjudications were discordant, then adjudicators met and resolved all discrepancies. The adjudicators also scored the severity of the adverse event. The severity scale options were serious laboratory abnormality only, 1 day of symptoms, several days of symptoms, nonpermanent disability, permanent disability, or death. The adjudicators also scored the adverse event as preventable (yes/no), ameliorable (yes/no), and recorded system problems associated with preventable and ameliorable adverse events.1 For adverse drug events, the adjudicators recorded preventability categories defined by previous investigators.31 We designed the adverse event outcome ascertainment as a blinded process. We evaluated the success of the blind and asked adjudicators to guess the patient's intervention assignment.
Sample Size
The sample size analysis employed several assumptions regarding the proportion of readmitted patients. The estimated readmission rate after usual care was 37%.24, 3236 The minimum clinically relevant difference in readmission rates was 13%, an empirical boundary for quantitative significance.37 Estimates for intracluster correlation were not available when we designed the trial. We projected intracluster correlations with low, medium, and high values. The cluster number and size were selected to maintain test significance level, 1‐sided alpha, <0.05 and power >80%. The sample size assumed no interim analysis. The initial sample size estimates were 11 physician clusters per intervention with 25 patients per cluster. During the first 2 months of patient recruitment, we observed that we could not consistently achieve clusters with 25 patients. We recalculated the sample size. Using the same assumptions, we found we could achieve similar test significance and power with 35 physician clusters per intervention and 9 patients per cluster. The sample size calculator was nQuery (Statistical Solutions, Saugus, MA).
Statistical Methods
Analyses were performed with SPSS PC (Version 15.0.1; SPSS Inc, Chicago, IL). Using descriptive statistics, we reported baseline variables as means and standard deviations (SD) for interval variables, and percentages for categorical variables. For outcome variables, we utilized the principle of intention‐to‐treat and assumed patient exposure to the intervention randomly assigned to their discharging physician. We inspected scatter plots and correlations for all variables to test assumptions regarding normal distribution, homogeneity of variance, and linearity of relationships between independent and dependent variables. When assumptions failed, we stratified variables (median or thirds) or performed transformations to satisfy assumptions. For patient‐level outcome variables, we calculated intracluster correlation coefficients. The assessment of the blind was unaffected by the cluster assumption so we used the chi‐square procedure. For analysis of time to event, we used Kaplan‐Meier plots.
The primary hypothesis was a significant decrease in the primary readmission outcome for patients assigned to discharge software. We tested the primary hypothesis with generalized estimating equations that corrected for clustering by hospital physician and adjusted for covariates that predicted readmission. The intervention variable was discharge software versus usual care handwritten discharge. We reported parameter estimates of the intervention variable coefficient and Wald 95% confidence interval (95% CI) with and without correction for cluster. For the secondary, patient‐level outcomes, we performed similar analyses with generalized estimating equations that corrected for clustering by hospital physician.
During covariate analysis, we screened all baseline variables for their correlation with readmission. The variable with the highest correlation and P value <0.05 entered initially in the general estimating equation. After initial variable entry, we evaluated subsequent variables with partial correlations that controlled for variables entered previously. At each iterative step, we entered into the model the variable with the highest partial correlation and P value <0.05.
In exploratory analyses, we examined intervention group differences within strata defined by covariates that predicted readmission. We used generalized estimating equations and adjusted for the other covariates that predicted readmission.
Results
We screened 127 physicians who were general internal medicine hospital physicians. Seventy physicians consented and received random allocation to discharge software or usual care. The physician characteristics appear in Table 1. Most of the hospital physicians were interns in the first year of postgraduate training (58.6%; 41/70). We excluded 57 physicians for reasons shown in the trial flow diagram (Figure 1). The most common reason for hospital physician exclusion applied to resident physicians in their last months of training before graduation or emergency department residents temporarily assigned to internal medicine training. We approached 6,884 patients during their index hospitalization. After excluding 6,253 ineligible patients, we enrolled and followed 631 patients who received the discharge intervention (Figure 1). During 6 months of follow‐up, a small proportion of patients died (3%; 20/631). Hospital records were available for deceased patients and they were included in the analysis. A small proportion (6%; 41/631) of patients withdrew consent or left the trial for other reasons during 6 months. There was no differential dropout between the interventions. Protocol deviations were rare (0.5%; 3/631). Three patients erroneously received usual care discharge from physicians assigned to discharge software. All 631 patients were included in the intention‐to‐treat analysis. The baseline characteristics of the randomly‐assigned hospital physicians and their patients are in Table 1.
| Discharge Software | Usual Care | |
|---|---|---|
| ||
| Hospital physician characteristics, n (%) | (n = 35) | (n = 35) |
| Postgraduate year 1 | 18 (51.4) | 23 (65.7) |
| Postgraduate years 2‐4 | 10 (28.6) | 7 (20.0) |
| Attending physician | 7 (20.0) | 5 (14.3) |
| Patient characteristics | (n = 316) | (n = 315) |
| Gender, female, n (%) | 180 (57.0) | 168 (53.3) |
| Age, years, n (%) | ||
| 18‐44 | 68 (21.5) | 95 (30.2) |
| 45‐54 | 79 (25.0) | 76 (24.1) |
| 55‐64 | 86 (27.2) | 74 (23.5) |
| 65‐98 | 83 (26.3) | 70 (22.2) |
| Race, n (%) | ||
| Caucasian | 239 (75.6) | 229 (72.7) |
| Black | 72 (22.8) | 85 (27.0) |
| Other | 5 (1.6) | 1 (0.3) |
| Self‐rated health status, n (%) | ||
| Poor | 82 (25.9) | 108 (34.3) |
| Fair | 169 (53.5) | 147 (46.7) |
| Good | 54 (17.1) | 46 (14.6) |
| Very good | 10 (3.2) | 11 (3.5) |
| Excellent | 1 (0.3) | 3 (1.0) |
| Diabetes mellitus, n (%) | 172 (54.4) | 177 (56.2) |
| Chronic obstructive pulmonary disease, n (%) | ||
| None | 259 (82.0) | 257 (81.6) |
| Without oral steroid or home oxygen | 28 (8.9) | 26 (8.3) |
| With chronic oral steroid | 10 (3.2) | 8 (2.5) |
| With home oxygen oral steroid | 19 (6.0) | 24 (7.6) |
| Coronary heart disease, n (%) | 133 (42.1) | 120 (38.1) |
| Heart failure, n (%) | 80 (25.3) | 67 (21.3) |
| Informal caregiver available, yes, n (%) | 313 (99.1) | 313 (99.4) |
| Taking loop diuretic, n (%) | 110 (34.8) | 88 (27.9) |
| Physical functioning from SF‐36, n (%) | ||
| Lowest third | 128 (40.5) | 121 (38.4) |
| Upper two‐thirds | 188 (59.5) | 194 (61.6) |
| Mental health from SF‐36, n (%) | ||
| Lowest third | 113 (35.8) | 117 (37.1)* |
| Upper two‐thirds | 203 (64.2) | 197 (62.5)* |
| Hospital admissions during year prior to index admission, n (%) | ||
| 0 or 1 | 247 (78.2) | 224 (71.1) |
| 2 or more | 69 (21.8) | 91 (28.9) |
| Emergency department visits during 6 months before index admission, n (%) | ||
| 0 or 1 | 194 (61.4) | 168 (53.3) |
| 2 or more | 122 (38.6) | 147 (46.7) |
| Outpatient doctor or clinic visits during year prior to index admission | ||
| 0 to 4 | 97 (30.7%) | 77 (24.4%) |
| 5 to 8 | 68 (21.5%) | 81 (25.7%) |
| 9 to 12 | 82 (25.9%) | 84 (26.7%) |
| 13 or more | 69 (21.8%) | 73 (23.2%) |
| Insurance or payor | ||
| Medicare, age less than 65 years | 18 (5.7%) | 13 (4.1%) |
| Medicare, age 65 years and older | 56 (17.7%) | 40 (12.7%) |
| Medicaid, age less than 65 years | 98 (31.0%) | 130 (41.3%) |
| Medicaid, age 65 years and older | 17 (5.4%) | 20 (6.3%) |
| Commercial or veteran | 85 (26.9%) | 61 (19.4%) |
| Self‐pay | 42 (13.3%) | 51 (16.2%) |
| Religious participation | ||
| Never | 159 (50.3%) | 164 (52.1%) |
| 1‐24 times per year | 55 (17.4%) | 51 (16.2%) |
| 1‐7 times per week | 102 (32.3%) | 100 (31.7%) |
| Volunteer activity, 1 or more hour/month | 31 (9.8%) | 39 (12.4%) |
| Employment status | ||
| Not working | 229 (72.5%) | 233 (74.4%)* |
| Part‐time (<37.5 hours/week) | 30 (9.5%) | 25 (8.0%)* |
| Full‐time (at least 37.5 hour/week) | 57 (18.0%) | 55 (17.6%)* |
| Number of discharge medications, mean (SD) | 10.5 (4.8) | 9.9 (5.1) |
| Severity of illness, mean (SD) | 1.8 (1.2) | 1.6 (1.3) |
| Charlson‐Deyo comorbidity, mean (SD) | 1.7 (1.4) | 1.6 (1.9) |
| Index hospital length of stay, days, mean (SD) | 3.9 (3.5) | 3.5 (3.5) |
| Blood urea nitrogen, mean (SD) | 17.9 (12.9) | 19.1 (12.9) |
| Probability of repeat admission, Pra, mean (SD) | 0.486 (0.072) | 0.495 (0.076) |
We asked outpatient physicians about their receipt of discharge communication from hospital physicians. The text of the question was, How soon after discharge did you receive any information (in any form) relating to this patient's hospital admission and discharge plans? We mailed the question 10 days after discharge to outpatient physicians designated by patients enrolled in the study. Among patients in the discharge software group, 75.0% (237/316) of their outpatient physicians responded to the question. The response rate was 80.6% (254/315) from physicians who followed patients in the usual care group. Respondents from the discharge software group said within 1‐2 days or within a week for 56.0% (177/316) of patients. Respondents from the usual care group said within 1‐2 days or within a week for 57.1% (180/315) of patients. The difference between the intervention groups, 1.1% (95% CI, 9.2% to 6.9%), was not significant.
The primary, prespecified, outcome of the study was the proportion of patients with at least 1 readmission to the hospital. After intervention with discharge software versus usual care, there was no significant difference in readmission rates (Table 2) or time to first readmission (Figure 2). We screened all baseline variables in Table 1 and sought predictors of readmission to employ in adjusted models. For example, we evaluated physician level of training because we wondered if experience or seniority affected readmission when hospital physicians used the discharge software or usual care discharge. The candidate variable, physician level of training, did not correlate with readmission (rho = 0.066; P = 0.100), so it was dropped from subsequent analyses. After screening all variables in Table 1, we found 4 independent predictors of readmission: previous hospitalizations, previous emergency department visits, heart failure, and physical function. Generalized estimating equations for readmission that adjusted for predictor variables confirmed a negligible parameter estimate for the discharge intervention variable coefficient (Table 2).
| Outcome | Discharge Software, n (%) | Usual Care, n (%) | Parameter Estimate Without Cluster Correction Intervention Coefficient (95% CI) | P Value | Parameter Estimate With Cluster Correction Intervention Coefficient (95% CI) | P Value |
|---|---|---|---|---|---|---|
| ||||||
| Readmitted within 6 months | 117 (37.0%) | 119 (37.8%) | 0.005* (0.076, 0.067) | 0.897 | 0.005* (0.074, 0.065) | 0.894 |
| Emergency department visit within 6 months | 112 (35.4%) | 128 (40.6%) | 0.052 (0.128, 0.024) | 0.179 | 0.052 (0.115, 0.011) | 0.108 |
| Adverse event within 1 month | 23 (7.3%) | 23 (7.3%) | 0.003 (0.037, 0.043) | 0.886 | 0.003 (0.037, 0.043) | 0.884 |
We evaluated emergency department visits that were unrelated to readmission as secondary, prespecified, outcomes. The results were similar to readmission results. While the proportion of patients with at least 1 emergency department visit was lower for the discharge software intervention, the difference with usual care was not significant (Table 2). There was no significant difference between interventions for time to first emergency department visit (Figure 3).
Postdischarge adverse events were secondary, prespecified, outcomes. Data for adverse event adjudication were available for 98% (309/316) of discharge software patients and 97% (307/315) of usual care patients. Within 1 month after discharge, 46 patients had adverse events probably or definitely related to medical management. Two patients had 2 events and 1 patient had 3 events. For analysis, we randomly selected 1 event per patient. When comparing patients assigned to discharge software versus usual care, there were no differences in adverse events related to medical management (Table 2). Most of the events were possible adverse drug events (74%; 34/46). The adverse event severity was several days of symptoms or nonpermanent disability for 76% (35/46) of the adverse events. Adjudicators rated 26% (12/46) of the adverse events as preventable and 46% (21/46) as ameliorable. The absolute numbers of events were small. There were no differences between discharge software and usual care patients within adverse event strata defined by type, severity, preventable, or ameliorable (Table 3). For most of the patients with adverse events, the adjudicators could not identify a system problem or preventability category (Table 3). When a deficiency was evident, there was no pattern to suggest a significant difference between discharge software patients versus usual care patients.
| Discharge Software (n) | Usual Care Discharge (n) | |
|---|---|---|
| ||
| At least 1 adverse event | 23 | 23 |
| Preventable adverse event | 7 | 5 |
| Ameliorable adverse event | 9 | 12 |
| Adverse event severity | ||
| Serious laboratory abnormality only or 1 day of symptoms | 5 | 5 |
| Several days of symptoms or nonpermanent disability | 18 | 17 |
| Permanent disability or death | 0 | 1 |
| Adverse event by type | ||
| Possible adverse drug event | 17 | 17 |
| Procedure‐related injury | 2 | 1 |
| Therapeutic error | 4 | 4 |
| Diagnostic error | 0 | 1 |
| System problems associated with preventable or ameliorable adverse events | ||
| Inadequate patient education regarding the medical condition or its treatment | 0 | 1 |
| Poor communication between patient and physician | 2 | 1 |
| Poor communication between hospital and community physicians | 0 | 0 |
| Inadequate monitoring of the patient's illness after discharge | 0 | 6 |
| Inadequate monitoring of the patient's treatment after discharge | 2 | 6 |
| No emergency contact number given to patient to call about problems | 0 | 0 |
| Patient with problems getting prescribed medications immediately | 1 | 0 |
| Inadequate home services | 0 | 0 |
| Delayed follow‐up care | 0 | 3 |
| Premature hospital discharge | 1 | 2 |
| Adverse drug event (ADE) preventability categories | ||
| Drug involved in the ADE inappropriate for the clinical condition | 2 | 4 |
| Dose, route, or frequency inappropriate for age, weight, creatinine clearance, or disease | 1 | 2 |
| Failure to obtain required lab tests and/or drug levels | 1 | 2 |
| Prior history of an adverse event or allergy to the drug | 1 | 2 |
| Drug‐drug interaction involved in the ADE | 2 | 0 |
| Toxic serum drug level documented | 0 | 0 |
| Noncompliance involved in the ADE | 0 | 1 |
When we designed the trial, we assumed variance in outcomes measured at the patient level. We predicted some variance attributable to clustering by hospital physician. After the trial, we calculated the intracluster correlation coefficients for readmissions, emergency department visits, and adverse events. For all of these outcomes, the intracluster correlation coefficients were negligible. We also evaluated generalized estimating equations with and without correction for hospital physician cluster. We confirmed the negligible cluster effect on confidence intervals for intervention coefficients (Table 2).
We performed an exploratory stratified analysis. We evaluated the intervention effect on readmission within subgroups defined by covariates that predicted readmission (Table 4). When the intervention groups were compared within baseline categories of previous hospitalizations, previous emergency department visits, heart failure, and physical functioning, there was a consistent pattern with no differential effect by intervention assignment. None of the intervention coefficients were statistically significant (Table 4).
| Subgroup | Discharge Software Readmitted n/n (%) | Usual Care Readmitted n/n (%) | Adjusted Parameter Estimate Intervention Coefficient (95% CI) |
|---|---|---|---|
| |||
| Hospital admissions during year prior to index admission | |||
| 0 or 1 | 77/247 (31.2) | 73/224 (32.6) | 0.025 (0.095, 0.045)* |
| 2 or more | 40/69 (58.0) | 46/91 (50.5) | 0.059 (0.090, 0.208)* |
| Emergency department visits during 6 months before index admission | |||
| 0 or 1 | 64/194 (33.0) | 45/168 (26.8) | 0.033 (0.047, 0.113) |
| 2 or more | 53/122 (43.4) | 74/147 (50.3) | 0.071 (0.188, 0.046) |
| Heart failure | |||
| Present | 40/80 (50.0) | 36/67 (53.7) | 0.024 (0.224, 0.177) |
| Absent | 77/236 (32.6) | 83/248 (33.5) | 0.000 (0.076, 0.075) |
| Physical functioning from SF‐36 | |||
| Lowest third | 55/128 (43.0) | 59/121 (48.8) | 0.032 (0.161, 0.096) |
| Upper two‐thirds | 62/188 (33.0) | 60/194 (30.9) | 0.012 (0.071, 0.095) |
Assessment of the Success of the Blind
We evaluated the adequacy of the blind for outcome assessors who interviewed patients or adjudicated adverse events. The guesses of outcomes assessors were unrelated to true intervention assignment (all P values >0.097). We interpreted the blind as adequate for outcome assessors who recorded readmissions, emergency department visits, and adverse events.
Discussion
We performed a cluster‐randomized clinical trial to measure the effects of discharge software versus usual care handwritten discharge. The discharge software with CPOE implemented elements of high‐quality discharge planning and communication endorsed by the National Quality Forum and systematic reviews.6, 38 Despite theoretical benefits, our discharge software intervention did not reduce readmissions or emergency department visits. What were potential explanations for our results? We assumed an association between postdischarge adverse events and readmissions or emergency department visits.1 Our failure to reduce adverse events might explain the failure to reduce readmissions or emergency department visits. Another potential explanation was related to adverse drug events. Other investigators showed most postdischarge adverse events were adverse drug events and our data confirmed previous studies.1, 2 Medication reconciliation at discharge was a potential mechanism for adverse drug event reduction.14 Medication reconciliation was the standard at the study hospital, so it was unethical to deny reconciliation to patients assigned to either intervention.39 Required medication reconciliation in both groups, by its known effect on preventable adverse drug events, might have reduced the event rates in both groups.14 This possibility is supported by the low rate of adverse events observed in our study compared with other studies.1 We speculate that the low background rate of adverse events at the study hospital may have minimized events in both the discharge software and usual care groups and prevented detection of software benefits, if present.39
One limitation of our study may have been the discharge software. The automated decision support in our software lacked features that might have improved outcomes. For example, the software did not generate a list of diagnostic test results that were pending at the time of discharge. Our software relied on prompts to the physician user that did not specify which tests were pending. The software did not perform error checks on the discharge orders to warn physicians about drug‐drug interactions, therapeutic duplications, or missing items (eg, immunizations, drugs, education). The absence of these software enhancements made our discharge process vulnerable to the lapses and slips of the physician user. Whether or not such enhancements affect clinically relevant outcomes remains a testable hypothesis for future studies.
Another limitation of our study was the outpatient physician response. Discharge software did not increase the proportion of outpatient physicians who said they received communication within 7 days after hospital discharge. Our intervention addressed the sending partner but not the receiving partner in the communication dyad. Our discharge software was not designed to change information flow within the outpatient physician office. We do not know if discharge communication arrived and remained unnoticed until the patient called or visited the outpatient clinic. Future studies of discharge communication should consider a closed loop design to assure receipt and comprehension.
When we designed our study, we expected at least some variance between patient clusters attributable to the physician who performed the discharge. Our analysis of intracluster correlation revealed negligible variance. We speculate the highly‐standardized discharge process implemented by discharge software and usual care at our hospital resulted in minimal variance. Future studies of discharge interventions may consider designs that avoid cluster randomization.
In conclusion, a discharge software application of CPOE did not affect readmissions, emergency department visits, or adverse events after discharge.
Acknowledgements
The authors thank Howard S. Cohen, MD, for his review of the trial protocol and the manuscript.
Adverse events occur to patients after their discharge from acute care hospitals.1, 2 Most of these injuries are adverse drug events, procedure‐related events, nosocomial infections, or falls.1 Postdischarge adverse events are associated with several days of symptoms, nonpermanent disability, emergency department visits, or hospital readmission.1, 3 When adverse events are preventable or ameliorable, the most common root cause is poor communication between hospital personnel and either the patient or the outpatient primary care physician.1 In addition, there may be deficits in discharge processes related to assessment and communication of unresolved problems.1 Systematic reviews have shown that discharge communication is an inefficient and error‐prone process.46
One potential solution to poor discharge communication is health information technology.7 An example of technology is discharge software with a computerized physician order entry (CPOE) system. By definition, a CPOE system is a computer‐based system that automates direct entry of orders by physicians and ensures standardized, legible, and complete orders.8 The benefits of CPOE have been tested in other inpatient settings.8, 9 It is logical to consider software applications with CPOE for discharge interventions.7
Several mechanisms explain the potential benefit of discharge software with CPOE.7 Applications with CPOE decrease medication errors.8, 10 Software with decision support could prompt physicians to enter posthospitalization appointment dates and orders for preventive services.11, 12 Discharge software could facilitate medication reconciliation and generate patient instructions and information.4, 1315 The potential benefits of discharge software with CPOE provide a rationale for clinical trials to measure benefits.
Previous studies addressed discharge applications of health information technology. Observational studies recorded outcomes such as physician satisfaction.16, 17 Prior randomized clinical trials measured quality and timeliness of discharge summaries.18 However, these previous trials did not assess clinically relevant outcomes like readmissions, emergency department visits, or adverse events. We performed a cluster‐randomized trial to assess the value of a discharge software application of CPOE. The rationale for our clustered design complied with recommendations from a systematic review of discharge interventions.5 Our objective was to assess the benefit of discharge software with CPOE when used to discharge patients at high risk for repeat admission. After the intervention, we compared the rates of hospital readmission, emergency department visits, and postdischarge adverse events due to medical management.
Methods
The trial design was a cluster randomized, controlled trial with blinded outcome assessment. Follow‐up occurred until 6 months after discharge from index hospitalization at a 730‐bed, tertiary care, teaching hospital in central Illinois. The Peoria Institutional Review Board approved the protocol for human research.
Participants
The cluster definition was the hospital physician. Patients discharged by the physician comprised the cluster. Hospital physicians and patients were enrolled between November 2004 and January 2007. Internal medicine resident or attending physicians were eligible. We excluded hospital physicians if their assignments to inpatient duties were less than 2 months during the 27‐month enrollment period. The rationale for the physician exclusion was a consequence of the patient enrollment rate of 3 to 5 patients per physician per month. Physicians with brief assignments could not achieve the goal of 9 or more patients per cluster. After physicians gave informed consent to screen their patients, trained research coordinators applied inclusion and exclusion criteria and obtained informed consent from patients. Research personnel identified all consecutive, unique, adult inpatients who were discharged to home. Patient inclusion required a probability of repeat admission (Pra) score 0.40.19, 20 The Pra score came from a logistic model of age, gender, prior hospitalizations, prior doctor visits, self‐rated health status, presence of informal caregiver in the home, and comorbid coronary heart disease and diabetes mellitus. Research coordinators calculated the Pra within 2 days before discharge from the index hospitalization. Other details about exclusion criteria have been published.21 If a patient's outpatient primary care physician treated the patient during the index hospitalization, then there was no perceived barrier in physician‐to‐physician communication and we excluded the patient.
Intervention
The research intervention was a CPOE software application that facilitated communication at the time of hospital discharge to patients, retail pharmacists, and community physicians. Details about the discharge software appeared in a previous publication.7 Software features included required fields, pick lists, standard drug doses, alerts, reminders, and online reference information. The software prompted the discharging physician to enter pending tests and order tests after discharge. Hospital physicians used the software on the day of discharge and automatically generated 4 discharge documents. The first document was a personalized letter to the outpatient physician with discharge diagnoses, reconciled medication list, diet and activity instructions, patient education materials provided, and follow‐up appointments and studies. Second, the software printed legible prescriptions along with specific information for the dispensing pharmacist about changes and deletions in the patient's previous regimen. Third, the software created patient instructions with addresses and telephone numbers for follow‐up appointments and tests. Fourth, the software printed a legible discharge order including all of the aforementioned information.
The control intervention was the usual care discharge process as described previously.7 Hospital physicians and ward nurses completed handwritten discharge forms on the day of discharge. The forms contained blanks for discharge diagnoses, discharge medications, medication instructions, postdischarge activities and restrictions, postdischarge diet, postdischarge diagnostic and therapeutic interventions, and appointments. Patients received handwritten copies of the forms, 1 page of which also included medication instructions and prescriptions. A previous publication gave details about the standard care available to all patients regardless of intervention.7
Randomization
The unit of randomization was the hospital physician who performed the discharge process. Random allocation was to discharge software or usual care discharge process. The randomization ratio was 1:1, the block size was 2, and there was no stratification or matching. There was concealed allocation and details are available from the investigators. Hospital physicians subsequently used their randomly assigned process when discharging their patients who enrolled in the study. After random allocation, it was not possible to conceal the test or control intervention from physicians or their patients. Likewise, it was not possible to conceal the outcome ascertainment, including readmission, from the hospital physicians.
All hospital physicians received training on the usual care discharge process. Physicians assigned to discharge software completed additional training via multimedia demonstration with 1‐on‐1 coaching as needed. Physicians assigned to usual care did not receive training on the discharge software and were blocked from using the software. After informed consent, patients were passive recipients of the research intervention performed by their discharging physician. Patients received the research intervention on the day of discharge from the index hospitalization.
The baseline assessment of patient characteristics occurred during the index hospitalization. Trained data abstractors recorded patient demographic data plus variables to calculate the Pra score for probability for repeat admission. We recorded additional variables because of their possible association with readmission.15, 2229 Data came from the patient or proxy for physical functioning and mental health (SF‐36, Version 2; Medical Outcomes Trust, Boston, MA). Other data for predictor variables came from interviews or hospital records.
Outcome Assessment
The primary study outcome was the proportion of patients readmitted at least once within 6 months after the index hospitalization. Readmission was for any reason and included observation and full admission status. Secondary outcomes were emergency department visits that did not result in hospital admission. Outcome assessment occurred at the patient level. We obtained data for readmissions and emergency department visits from 6 hospitals in central Illinois where study patients were likely to seek care. We validated readmissions and emergency department visits via patient/proxy telephone interviews that occurred 6 months after index hospital discharge. Interviewers were blind to intervention assignment. We evaluated the adequacy of the blind and asked interviewers to guess the patient's intervention assignment.
Another secondary outcome was the proportion of patients who experienced an adverse event related to medical management within 1 month after discharge. For adverse event ascertainment, we employed the process of Forster et al.1, 2 Within 20 to 40 days after discharge, an internal medicine physician performed telephone interviews with the patient or proxy. The interviewer recorded symptoms, drug information, other treatment, hospital readmissions, and emergency department visits. Another physician compiled case summaries from interview data and information abstracted from the electronic medical record, including dictated discharge summaries from the index hospitalization and postdischarge emergency department visits, diagnostic test results, and readmission reports. Two additional internal medicine physicians adjudicated each case summary separately. We counted adverse events only when adjudicators agreed that medical management probably or definitely caused the event. The initial rating by each adjudicator revealed moderate‐to‐good agreement (Kappa = 0.52).30 When initial adjudications were discordant, then adjudicators met and resolved all discrepancies. The adjudicators also scored the severity of the adverse event. The severity scale options were serious laboratory abnormality only, 1 day of symptoms, several days of symptoms, nonpermanent disability, permanent disability, or death. The adjudicators also scored the adverse event as preventable (yes/no), ameliorable (yes/no), and recorded system problems associated with preventable and ameliorable adverse events.1 For adverse drug events, the adjudicators recorded preventability categories defined by previous investigators.31 We designed the adverse event outcome ascertainment as a blinded process. We evaluated the success of the blind and asked adjudicators to guess the patient's intervention assignment.
Sample Size
The sample size analysis employed several assumptions regarding the proportion of readmitted patients. The estimated readmission rate after usual care was 37%.24, 3236 The minimum clinically relevant difference in readmission rates was 13%, an empirical boundary for quantitative significance.37 Estimates for intracluster correlation were not available when we designed the trial. We projected intracluster correlations with low, medium, and high values. The cluster number and size were selected to maintain test significance level, 1‐sided alpha, <0.05 and power >80%. The sample size assumed no interim analysis. The initial sample size estimates were 11 physician clusters per intervention with 25 patients per cluster. During the first 2 months of patient recruitment, we observed that we could not consistently achieve clusters with 25 patients. We recalculated the sample size. Using the same assumptions, we found we could achieve similar test significance and power with 35 physician clusters per intervention and 9 patients per cluster. The sample size calculator was nQuery (Statistical Solutions, Saugus, MA).
Statistical Methods
Analyses were performed with SPSS PC (Version 15.0.1; SPSS Inc, Chicago, IL). Using descriptive statistics, we reported baseline variables as means and standard deviations (SD) for interval variables, and percentages for categorical variables. For outcome variables, we utilized the principle of intention‐to‐treat and assumed patient exposure to the intervention randomly assigned to their discharging physician. We inspected scatter plots and correlations for all variables to test assumptions regarding normal distribution, homogeneity of variance, and linearity of relationships between independent and dependent variables. When assumptions failed, we stratified variables (median or thirds) or performed transformations to satisfy assumptions. For patient‐level outcome variables, we calculated intracluster correlation coefficients. The assessment of the blind was unaffected by the cluster assumption so we used the chi‐square procedure. For analysis of time to event, we used Kaplan‐Meier plots.
The primary hypothesis was a significant decrease in the primary readmission outcome for patients assigned to discharge software. We tested the primary hypothesis with generalized estimating equations that corrected for clustering by hospital physician and adjusted for covariates that predicted readmission. The intervention variable was discharge software versus usual care handwritten discharge. We reported parameter estimates of the intervention variable coefficient and Wald 95% confidence interval (95% CI) with and without correction for cluster. For the secondary, patient‐level outcomes, we performed similar analyses with generalized estimating equations that corrected for clustering by hospital physician.
During covariate analysis, we screened all baseline variables for their correlation with readmission. The variable with the highest correlation and P value <0.05 entered initially in the general estimating equation. After initial variable entry, we evaluated subsequent variables with partial correlations that controlled for variables entered previously. At each iterative step, we entered into the model the variable with the highest partial correlation and P value <0.05.
In exploratory analyses, we examined intervention group differences within strata defined by covariates that predicted readmission. We used generalized estimating equations and adjusted for the other covariates that predicted readmission.
Results
We screened 127 physicians who were general internal medicine hospital physicians. Seventy physicians consented and received random allocation to discharge software or usual care. The physician characteristics appear in Table 1. Most of the hospital physicians were interns in the first year of postgraduate training (58.6%; 41/70). We excluded 57 physicians for reasons shown in the trial flow diagram (Figure 1). The most common reason for hospital physician exclusion applied to resident physicians in their last months of training before graduation or emergency department residents temporarily assigned to internal medicine training. We approached 6,884 patients during their index hospitalization. After excluding 6,253 ineligible patients, we enrolled and followed 631 patients who received the discharge intervention (Figure 1). During 6 months of follow‐up, a small proportion of patients died (3%; 20/631). Hospital records were available for deceased patients and they were included in the analysis. A small proportion (6%; 41/631) of patients withdrew consent or left the trial for other reasons during 6 months. There was no differential dropout between the interventions. Protocol deviations were rare (0.5%; 3/631). Three patients erroneously received usual care discharge from physicians assigned to discharge software. All 631 patients were included in the intention‐to‐treat analysis. The baseline characteristics of the randomly‐assigned hospital physicians and their patients are in Table 1.
| Discharge Software | Usual Care | |
|---|---|---|
| ||
| Hospital physician characteristics, n (%) | (n = 35) | (n = 35) |
| Postgraduate year 1 | 18 (51.4) | 23 (65.7) |
| Postgraduate years 2‐4 | 10 (28.6) | 7 (20.0) |
| Attending physician | 7 (20.0) | 5 (14.3) |
| Patient characteristics | (n = 316) | (n = 315) |
| Gender, female, n (%) | 180 (57.0) | 168 (53.3) |
| Age, years, n (%) | ||
| 18‐44 | 68 (21.5) | 95 (30.2) |
| 45‐54 | 79 (25.0) | 76 (24.1) |
| 55‐64 | 86 (27.2) | 74 (23.5) |
| 65‐98 | 83 (26.3) | 70 (22.2) |
| Race, n (%) | ||
| Caucasian | 239 (75.6) | 229 (72.7) |
| Black | 72 (22.8) | 85 (27.0) |
| Other | 5 (1.6) | 1 (0.3) |
| Self‐rated health status, n (%) | ||
| Poor | 82 (25.9) | 108 (34.3) |
| Fair | 169 (53.5) | 147 (46.7) |
| Good | 54 (17.1) | 46 (14.6) |
| Very good | 10 (3.2) | 11 (3.5) |
| Excellent | 1 (0.3) | 3 (1.0) |
| Diabetes mellitus, n (%) | 172 (54.4) | 177 (56.2) |
| Chronic obstructive pulmonary disease, n (%) | ||
| None | 259 (82.0) | 257 (81.6) |
| Without oral steroid or home oxygen | 28 (8.9) | 26 (8.3) |
| With chronic oral steroid | 10 (3.2) | 8 (2.5) |
| With home oxygen oral steroid | 19 (6.0) | 24 (7.6) |
| Coronary heart disease, n (%) | 133 (42.1) | 120 (38.1) |
| Heart failure, n (%) | 80 (25.3) | 67 (21.3) |
| Informal caregiver available, yes, n (%) | 313 (99.1) | 313 (99.4) |
| Taking loop diuretic, n (%) | 110 (34.8) | 88 (27.9) |
| Physical functioning from SF‐36, n (%) | ||
| Lowest third | 128 (40.5) | 121 (38.4) |
| Upper two‐thirds | 188 (59.5) | 194 (61.6) |
| Mental health from SF‐36, n (%) | ||
| Lowest third | 113 (35.8) | 117 (37.1)* |
| Upper two‐thirds | 203 (64.2) | 197 (62.5)* |
| Hospital admissions during year prior to index admission, n (%) | ||
| 0 or 1 | 247 (78.2) | 224 (71.1) |
| 2 or more | 69 (21.8) | 91 (28.9) |
| Emergency department visits during 6 months before index admission, n (%) | ||
| 0 or 1 | 194 (61.4) | 168 (53.3) |
| 2 or more | 122 (38.6) | 147 (46.7) |
| Outpatient doctor or clinic visits during year prior to index admission | ||
| 0 to 4 | 97 (30.7%) | 77 (24.4%) |
| 5 to 8 | 68 (21.5%) | 81 (25.7%) |
| 9 to 12 | 82 (25.9%) | 84 (26.7%) |
| 13 or more | 69 (21.8%) | 73 (23.2%) |
| Insurance or payor | ||
| Medicare, age less than 65 years | 18 (5.7%) | 13 (4.1%) |
| Medicare, age 65 years and older | 56 (17.7%) | 40 (12.7%) |
| Medicaid, age less than 65 years | 98 (31.0%) | 130 (41.3%) |
| Medicaid, age 65 years and older | 17 (5.4%) | 20 (6.3%) |
| Commercial or veteran | 85 (26.9%) | 61 (19.4%) |
| Self‐pay | 42 (13.3%) | 51 (16.2%) |
| Religious participation | ||
| Never | 159 (50.3%) | 164 (52.1%) |
| 1‐24 times per year | 55 (17.4%) | 51 (16.2%) |
| 1‐7 times per week | 102 (32.3%) | 100 (31.7%) |
| Volunteer activity, 1 or more hour/month | 31 (9.8%) | 39 (12.4%) |
| Employment status | ||
| Not working | 229 (72.5%) | 233 (74.4%)* |
| Part‐time (<37.5 hours/week) | 30 (9.5%) | 25 (8.0%)* |
| Full‐time (at least 37.5 hour/week) | 57 (18.0%) | 55 (17.6%)* |
| Number of discharge medications, mean (SD) | 10.5 (4.8) | 9.9 (5.1) |
| Severity of illness, mean (SD) | 1.8 (1.2) | 1.6 (1.3) |
| Charlson‐Deyo comorbidity, mean (SD) | 1.7 (1.4) | 1.6 (1.9) |
| Index hospital length of stay, days, mean (SD) | 3.9 (3.5) | 3.5 (3.5) |
| Blood urea nitrogen, mean (SD) | 17.9 (12.9) | 19.1 (12.9) |
| Probability of repeat admission, Pra, mean (SD) | 0.486 (0.072) | 0.495 (0.076) |
We asked outpatient physicians about their receipt of discharge communication from hospital physicians. The text of the question was, How soon after discharge did you receive any information (in any form) relating to this patient's hospital admission and discharge plans? We mailed the question 10 days after discharge to outpatient physicians designated by patients enrolled in the study. Among patients in the discharge software group, 75.0% (237/316) of their outpatient physicians responded to the question. The response rate was 80.6% (254/315) from physicians who followed patients in the usual care group. Respondents from the discharge software group said within 1‐2 days or within a week for 56.0% (177/316) of patients. Respondents from the usual care group said within 1‐2 days or within a week for 57.1% (180/315) of patients. The difference between the intervention groups, 1.1% (95% CI, 9.2% to 6.9%), was not significant.
The primary, prespecified, outcome of the study was the proportion of patients with at least 1 readmission to the hospital. After intervention with discharge software versus usual care, there was no significant difference in readmission rates (Table 2) or time to first readmission (Figure 2). We screened all baseline variables in Table 1 and sought predictors of readmission to employ in adjusted models. For example, we evaluated physician level of training because we wondered if experience or seniority affected readmission when hospital physicians used the discharge software or usual care discharge. The candidate variable, physician level of training, did not correlate with readmission (rho = 0.066; P = 0.100), so it was dropped from subsequent analyses. After screening all variables in Table 1, we found 4 independent predictors of readmission: previous hospitalizations, previous emergency department visits, heart failure, and physical function. Generalized estimating equations for readmission that adjusted for predictor variables confirmed a negligible parameter estimate for the discharge intervention variable coefficient (Table 2).
| Outcome | Discharge Software, n (%) | Usual Care, n (%) | Parameter Estimate Without Cluster Correction Intervention Coefficient (95% CI) | P Value | Parameter Estimate With Cluster Correction Intervention Coefficient (95% CI) | P Value |
|---|---|---|---|---|---|---|
| ||||||
| Readmitted within 6 months | 117 (37.0%) | 119 (37.8%) | 0.005* (0.076, 0.067) | 0.897 | 0.005* (0.074, 0.065) | 0.894 |
| Emergency department visit within 6 months | 112 (35.4%) | 128 (40.6%) | 0.052 (0.128, 0.024) | 0.179 | 0.052 (0.115, 0.011) | 0.108 |
| Adverse event within 1 month | 23 (7.3%) | 23 (7.3%) | 0.003 (0.037, 0.043) | 0.886 | 0.003 (0.037, 0.043) | 0.884 |
We evaluated emergency department visits that were unrelated to readmission as secondary, prespecified, outcomes. The results were similar to readmission results. While the proportion of patients with at least 1 emergency department visit was lower for the discharge software intervention, the difference with usual care was not significant (Table 2). There was no significant difference between interventions for time to first emergency department visit (Figure 3).
Postdischarge adverse events were secondary, prespecified, outcomes. Data for adverse event adjudication were available for 98% (309/316) of discharge software patients and 97% (307/315) of usual care patients. Within 1 month after discharge, 46 patients had adverse events probably or definitely related to medical management. Two patients had 2 events and 1 patient had 3 events. For analysis, we randomly selected 1 event per patient. When comparing patients assigned to discharge software versus usual care, there were no differences in adverse events related to medical management (Table 2). Most of the events were possible adverse drug events (74%; 34/46). The adverse event severity was several days of symptoms or nonpermanent disability for 76% (35/46) of the adverse events. Adjudicators rated 26% (12/46) of the adverse events as preventable and 46% (21/46) as ameliorable. The absolute numbers of events were small. There were no differences between discharge software and usual care patients within adverse event strata defined by type, severity, preventable, or ameliorable (Table 3). For most of the patients with adverse events, the adjudicators could not identify a system problem or preventability category (Table 3). When a deficiency was evident, there was no pattern to suggest a significant difference between discharge software patients versus usual care patients.
| Discharge Software (n) | Usual Care Discharge (n) | |
|---|---|---|
| ||
| At least 1 adverse event | 23 | 23 |
| Preventable adverse event | 7 | 5 |
| Ameliorable adverse event | 9 | 12 |
| Adverse event severity | ||
| Serious laboratory abnormality only or 1 day of symptoms | 5 | 5 |
| Several days of symptoms or nonpermanent disability | 18 | 17 |
| Permanent disability or death | 0 | 1 |
| Adverse event by type | ||
| Possible adverse drug event | 17 | 17 |
| Procedure‐related injury | 2 | 1 |
| Therapeutic error | 4 | 4 |
| Diagnostic error | 0 | 1 |
| System problems associated with preventable or ameliorable adverse events | ||
| Inadequate patient education regarding the medical condition or its treatment | 0 | 1 |
| Poor communication between patient and physician | 2 | 1 |
| Poor communication between hospital and community physicians | 0 | 0 |
| Inadequate monitoring of the patient's illness after discharge | 0 | 6 |
| Inadequate monitoring of the patient's treatment after discharge | 2 | 6 |
| No emergency contact number given to patient to call about problems | 0 | 0 |
| Patient with problems getting prescribed medications immediately | 1 | 0 |
| Inadequate home services | 0 | 0 |
| Delayed follow‐up care | 0 | 3 |
| Premature hospital discharge | 1 | 2 |
| Adverse drug event (ADE) preventability categories | ||
| Drug involved in the ADE inappropriate for the clinical condition | 2 | 4 |
| Dose, route, or frequency inappropriate for age, weight, creatinine clearance, or disease | 1 | 2 |
| Failure to obtain required lab tests and/or drug levels | 1 | 2 |
| Prior history of an adverse event or allergy to the drug | 1 | 2 |
| Drug‐drug interaction involved in the ADE | 2 | 0 |
| Toxic serum drug level documented | 0 | 0 |
| Noncompliance involved in the ADE | 0 | 1 |
When we designed the trial, we assumed variance in outcomes measured at the patient level. We predicted some variance attributable to clustering by hospital physician. After the trial, we calculated the intracluster correlation coefficients for readmissions, emergency department visits, and adverse events. For all of these outcomes, the intracluster correlation coefficients were negligible. We also evaluated generalized estimating equations with and without correction for hospital physician cluster. We confirmed the negligible cluster effect on confidence intervals for intervention coefficients (Table 2).
We performed an exploratory stratified analysis. We evaluated the intervention effect on readmission within subgroups defined by covariates that predicted readmission (Table 4). When the intervention groups were compared within baseline categories of previous hospitalizations, previous emergency department visits, heart failure, and physical functioning, there was a consistent pattern with no differential effect by intervention assignment. None of the intervention coefficients were statistically significant (Table 4).
| Subgroup | Discharge Software Readmitted n/n (%) | Usual Care Readmitted n/n (%) | Adjusted Parameter Estimate Intervention Coefficient (95% CI) |
|---|---|---|---|
| |||
| Hospital admissions during year prior to index admission | |||
| 0 or 1 | 77/247 (31.2) | 73/224 (32.6) | 0.025 (0.095, 0.045)* |
| 2 or more | 40/69 (58.0) | 46/91 (50.5) | 0.059 (0.090, 0.208)* |
| Emergency department visits during 6 months before index admission | |||
| 0 or 1 | 64/194 (33.0) | 45/168 (26.8) | 0.033 (0.047, 0.113) |
| 2 or more | 53/122 (43.4) | 74/147 (50.3) | 0.071 (0.188, 0.046) |
| Heart failure | |||
| Present | 40/80 (50.0) | 36/67 (53.7) | 0.024 (0.224, 0.177) |
| Absent | 77/236 (32.6) | 83/248 (33.5) | 0.000 (0.076, 0.075) |
| Physical functioning from SF‐36 | |||
| Lowest third | 55/128 (43.0) | 59/121 (48.8) | 0.032 (0.161, 0.096) |
| Upper two‐thirds | 62/188 (33.0) | 60/194 (30.9) | 0.012 (0.071, 0.095) |
Assessment of the Success of the Blind
We evaluated the adequacy of the blind for outcome assessors who interviewed patients or adjudicated adverse events. The guesses of outcomes assessors were unrelated to true intervention assignment (all P values >0.097). We interpreted the blind as adequate for outcome assessors who recorded readmissions, emergency department visits, and adverse events.
Discussion
We performed a cluster‐randomized clinical trial to measure the effects of discharge software versus usual care handwritten discharge. The discharge software with CPOE implemented elements of high‐quality discharge planning and communication endorsed by the National Quality Forum and systematic reviews.6, 38 Despite theoretical benefits, our discharge software intervention did not reduce readmissions or emergency department visits. What were potential explanations for our results? We assumed an association between postdischarge adverse events and readmissions or emergency department visits.1 Our failure to reduce adverse events might explain the failure to reduce readmissions or emergency department visits. Another potential explanation was related to adverse drug events. Other investigators showed most postdischarge adverse events were adverse drug events and our data confirmed previous studies.1, 2 Medication reconciliation at discharge was a potential mechanism for adverse drug event reduction.14 Medication reconciliation was the standard at the study hospital, so it was unethical to deny reconciliation to patients assigned to either intervention.39 Required medication reconciliation in both groups, by its known effect on preventable adverse drug events, might have reduced the event rates in both groups.14 This possibility is supported by the low rate of adverse events observed in our study compared with other studies.1 We speculate that the low background rate of adverse events at the study hospital may have minimized events in both the discharge software and usual care groups and prevented detection of software benefits, if present.39
One limitation of our study may have been the discharge software. The automated decision support in our software lacked features that might have improved outcomes. For example, the software did not generate a list of diagnostic test results that were pending at the time of discharge. Our software relied on prompts to the physician user that did not specify which tests were pending. The software did not perform error checks on the discharge orders to warn physicians about drug‐drug interactions, therapeutic duplications, or missing items (eg, immunizations, drugs, education). The absence of these software enhancements made our discharge process vulnerable to the lapses and slips of the physician user. Whether or not such enhancements affect clinically relevant outcomes remains a testable hypothesis for future studies.
Another limitation of our study was the outpatient physician response. Discharge software did not increase the proportion of outpatient physicians who said they received communication within 7 days after hospital discharge. Our intervention addressed the sending partner but not the receiving partner in the communication dyad. Our discharge software was not designed to change information flow within the outpatient physician office. We do not know if discharge communication arrived and remained unnoticed until the patient called or visited the outpatient clinic. Future studies of discharge communication should consider a closed loop design to assure receipt and comprehension.
When we designed our study, we expected at least some variance between patient clusters attributable to the physician who performed the discharge. Our analysis of intracluster correlation revealed negligible variance. We speculate the highly‐standardized discharge process implemented by discharge software and usual care at our hospital resulted in minimal variance. Future studies of discharge interventions may consider designs that avoid cluster randomization.
In conclusion, a discharge software application of CPOE did not affect readmissions, emergency department visits, or adverse events after discharge.
Acknowledgements
The authors thank Howard S. Cohen, MD, for his review of the trial protocol and the manuscript.
- ,,,,.The incidence and severity of adverse events affecting patients after discharge from the hospital.Ann Intern Med.2003;138(3):161–167.
- ,,, et al.Adverse events among medical patients after discharge from hospital.CMAJ.2004;170(3):345–349.
- ,,,,.Frequency of new or worsening symptoms in the posthospitalization period.J Hosp Med.2007;2(2):58–68.
- ,,.Written and verbal information versus verbal information only for patients being discharged from acute hospital settings to home.Cochrane Database Syst Rev.2003;(4):CD003716.
- ,,,.Discharge planning from hospital to home.Cochrane Database Syst Rev.2004;(1):CD000313.
- ,,,,,.Deficits in communication and information transfer between hospital‐based and primary care physicians: implications for patient safety and continuity of care.JAMA.2007;297(8):831–841.
- ,,.Software design to facilitate information transfer at hospital discharge.Inform Prim Care.2006;14(2):109–119.
- ,,.Effects of computerized physician order entry and clinical decision support systems on medication safety: a systematic review.Arch Intern Med.2003;163(12):1409–1416.
- ,.Computer physician order entry: benefits, costs, and issues.Ann Intern Med.2003;139(1):31–39.
- ,,, et al.Systematic review: impact of health information technology on quality, efficiency, and costs of medical care.Ann Intern Med.2006;144(10):742–752.
- ,,,,,.Compliance with post‐hospitalization follow‐up visits: rationing by inconvenience?Ethn Dis.1999;9(3):387–395.
- ,,,,,.A computerized reminder system to increase the use of preventive care for hospitalized patients.N Engl J Med.2001;345(13):965–970.
- ,,,.Evaluation of a new integrated discharge prescription form.Ann Pharmacother.2001;35(7‐8):953–958.
- ,,, et al.Role of pharmacist counseling in preventing adverse drug events after hospitalization.Arch Intern Med.2006;166(5):565–571.
- ,,,,,.Factors associated with unplanned hospital readmission among patients 65 years of age and older in a Medicare managed care plan.Am J Med.1999;107(1):13–17.
- ,.Closing the loop of patient care—a clinical trial of a computerized discharge medication program.Proc Annu Symp Comput Appl Med Care.1994:841–845.
- ,,,.A comprehensive inpatient discharge system.Proc AMIA Annu Fall Symp.1996:699–703.
- Agency for Healthcare Research and Quality. Making health care safer: a critical analysis of patient safety practices, subchapter 42.3. Discharge summaries and follow‐up. Available at: http://www.ahrq.gov/clinic/ptsafety/chap42b. htm#42.3. Accessed January 2009.
- ,,.Predictive validity of a questionnaire that identifies older persons at risk for hospital admission.J Am Geriatr Soc.1995;43(4):374–377.
- ,,,.Predictive validity of the Pra instrument among older recipients of managed care.J Am Geriatr Soc.1997;45(5):614–617.
- ,,.Brief scale measuring patient preparedness for hospital discharge to home: psychometric properties.J Hosp Med.2008;3(6):446–454.
- .SF‐36 health survey update.Spine.2000;25(24):3130–3139.
- ,,,,,.Development of a method to identify seniors at high risk for high hospital utilization.Med Care.2002;40(9):782–793.
- ,,, et al.Comprehensive discharge planning and home follow‐up of hospitalized elders: arandomized clinical trial.JAMA.1999;281(7):613–620.
- ,,, et al.Predicting non‐elective hospital readmissions: a multi‐site study. Department of Veterans Affairs Cooperative Study Group on Primary Care and Readmissions.J Clin Epidemiol.2000;53:1113–1118.
- ,.Identification of factors associated with hospital readmission and development of a predictive model.Health Serv Res.1992;27(1):81–101.
- ,.Risk‐adjusting acute myocardial infarction mortality: are APR‐DRGs the right tool?Health Serv Res.2000;34(7):1469–1489.
- ,,.Adapting a clinical comorbidity index for use with ICD‐9‐CM administrative databases.J Clin Epidemiol.1992;45(6):613–619.
- ,,.The community assessment risk screen (CARS): identifying elderly persons at risk for hospitalization or emergency department visit.Am J Manag Care.2000;6(8):925–933.
- ,,,.Clinical Epidemiology: A Basic Science for Clinical Medicine.2nd ed.Boston:Little, Brown;1991.
- ,,,,.Identifying clinically significant preventable adverse drug events through a hospital's database of adverse drug reaction reports.Am J Health Syst Pharm.2002;59(18):1742–1749.
- ,,,,,.A pharmacy discharge plan for hospitalized elderly patients—a randomized controlled trial.Age Ageing.2001;30(1):33–40.
- ,,,,.Can GP input into discharge planning result in better outcomes for the frail aged: results from a randomized controlled trial.Fam Pract.1999;16(3):289–293.
- ,,,,,.Comprehensive discharge planning with postdischarge support for older patients with congestive heart failure: a meta‐analysis.JAMA.2004;291(11):1358–1367.
- ,,,,,.Can readmission after stroke be prevented? Results of a randomized clinical study: a postdischarge follow‐up service for stroke survivors.Stroke.2000;31(5):1038–1045.
- ,,.Does increased access to primary care reduce hospital readmissions? Veterans Affairs Cooperative Study Group on Primary Care and Hospital Readmission.N Engl J Med.1996;334(22):1441–147.
- ,,.Indexes and boundaries for “quantitative significance” in statistical decisions.J Clin Epidemiol.1990;43(12):1273–1284.
- National Quality Forum. Safe Practices for Better Healthcare 2006 Update, A Consensus Report, Safe Practice 11: Discharge Systems. Available at: http://qualityforum.org/pdf/reports/safe_practices/txsppublic.pdf. Accessed January 2009.
- ,.OSF Healthcare's journey in patient safety.Qual Manag Health Care.2004;13(1):53–59.
- ,,,,.The incidence and severity of adverse events affecting patients after discharge from the hospital.Ann Intern Med.2003;138(3):161–167.
- ,,, et al.Adverse events among medical patients after discharge from hospital.CMAJ.2004;170(3):345–349.
- ,,,,.Frequency of new or worsening symptoms in the posthospitalization period.J Hosp Med.2007;2(2):58–68.
- ,,.Written and verbal information versus verbal information only for patients being discharged from acute hospital settings to home.Cochrane Database Syst Rev.2003;(4):CD003716.
- ,,,.Discharge planning from hospital to home.Cochrane Database Syst Rev.2004;(1):CD000313.
- ,,,,,.Deficits in communication and information transfer between hospital‐based and primary care physicians: implications for patient safety and continuity of care.JAMA.2007;297(8):831–841.
- ,,.Software design to facilitate information transfer at hospital discharge.Inform Prim Care.2006;14(2):109–119.
- ,,.Effects of computerized physician order entry and clinical decision support systems on medication safety: a systematic review.Arch Intern Med.2003;163(12):1409–1416.
- ,.Computer physician order entry: benefits, costs, and issues.Ann Intern Med.2003;139(1):31–39.
- ,,, et al.Systematic review: impact of health information technology on quality, efficiency, and costs of medical care.Ann Intern Med.2006;144(10):742–752.
- ,,,,,.Compliance with post‐hospitalization follow‐up visits: rationing by inconvenience?Ethn Dis.1999;9(3):387–395.
- ,,,,,.A computerized reminder system to increase the use of preventive care for hospitalized patients.N Engl J Med.2001;345(13):965–970.
- ,,,.Evaluation of a new integrated discharge prescription form.Ann Pharmacother.2001;35(7‐8):953–958.
- ,,, et al.Role of pharmacist counseling in preventing adverse drug events after hospitalization.Arch Intern Med.2006;166(5):565–571.
- ,,,,,.Factors associated with unplanned hospital readmission among patients 65 years of age and older in a Medicare managed care plan.Am J Med.1999;107(1):13–17.
- ,.Closing the loop of patient care—a clinical trial of a computerized discharge medication program.Proc Annu Symp Comput Appl Med Care.1994:841–845.
- ,,,.A comprehensive inpatient discharge system.Proc AMIA Annu Fall Symp.1996:699–703.
- Agency for Healthcare Research and Quality. Making health care safer: a critical analysis of patient safety practices, subchapter 42.3. Discharge summaries and follow‐up. Available at: http://www.ahrq.gov/clinic/ptsafety/chap42b. htm#42.3. Accessed January 2009.
- ,,.Predictive validity of a questionnaire that identifies older persons at risk for hospital admission.J Am Geriatr Soc.1995;43(4):374–377.
- ,,,.Predictive validity of the Pra instrument among older recipients of managed care.J Am Geriatr Soc.1997;45(5):614–617.
- ,,.Brief scale measuring patient preparedness for hospital discharge to home: psychometric properties.J Hosp Med.2008;3(6):446–454.
- .SF‐36 health survey update.Spine.2000;25(24):3130–3139.
- ,,,,,.Development of a method to identify seniors at high risk for high hospital utilization.Med Care.2002;40(9):782–793.
- ,,, et al.Comprehensive discharge planning and home follow‐up of hospitalized elders: arandomized clinical trial.JAMA.1999;281(7):613–620.
- ,,, et al.Predicting non‐elective hospital readmissions: a multi‐site study. Department of Veterans Affairs Cooperative Study Group on Primary Care and Readmissions.J Clin Epidemiol.2000;53:1113–1118.
- ,.Identification of factors associated with hospital readmission and development of a predictive model.Health Serv Res.1992;27(1):81–101.
- ,.Risk‐adjusting acute myocardial infarction mortality: are APR‐DRGs the right tool?Health Serv Res.2000;34(7):1469–1489.
- ,,.Adapting a clinical comorbidity index for use with ICD‐9‐CM administrative databases.J Clin Epidemiol.1992;45(6):613–619.
- ,,.The community assessment risk screen (CARS): identifying elderly persons at risk for hospitalization or emergency department visit.Am J Manag Care.2000;6(8):925–933.
- ,,,.Clinical Epidemiology: A Basic Science for Clinical Medicine.2nd ed.Boston:Little, Brown;1991.
- ,,,,.Identifying clinically significant preventable adverse drug events through a hospital's database of adverse drug reaction reports.Am J Health Syst Pharm.2002;59(18):1742–1749.
- ,,,,,.A pharmacy discharge plan for hospitalized elderly patients—a randomized controlled trial.Age Ageing.2001;30(1):33–40.
- ,,,,.Can GP input into discharge planning result in better outcomes for the frail aged: results from a randomized controlled trial.Fam Pract.1999;16(3):289–293.
- ,,,,,.Comprehensive discharge planning with postdischarge support for older patients with congestive heart failure: a meta‐analysis.JAMA.2004;291(11):1358–1367.
- ,,,,,.Can readmission after stroke be prevented? Results of a randomized clinical study: a postdischarge follow‐up service for stroke survivors.Stroke.2000;31(5):1038–1045.
- ,,.Does increased access to primary care reduce hospital readmissions? Veterans Affairs Cooperative Study Group on Primary Care and Hospital Readmission.N Engl J Med.1996;334(22):1441–147.
- ,,.Indexes and boundaries for “quantitative significance” in statistical decisions.J Clin Epidemiol.1990;43(12):1273–1284.
- National Quality Forum. Safe Practices for Better Healthcare 2006 Update, A Consensus Report, Safe Practice 11: Discharge Systems. Available at: http://qualityforum.org/pdf/reports/safe_practices/txsppublic.pdf. Accessed January 2009.
- ,.OSF Healthcare's journey in patient safety.Qual Manag Health Care.2004;13(1):53–59.
Copyright © 2009 Society of Hospital Medicine
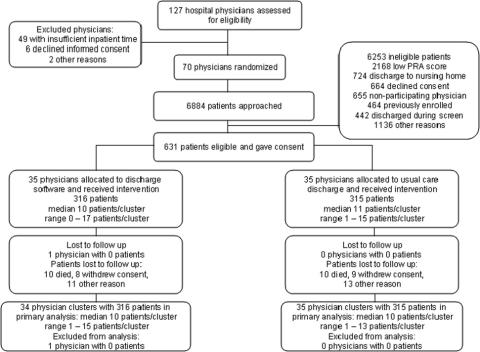
Community Service
Burke Kealey, MD, FHM, knows exactly what he brings to the SHM board table. With more than a decade of experience as a practicing hospitalist and directing the HM service he co-founded in 1997, Dr. Kealey says he will champion the community hospitalist cause during his three-year term on the 12-seat board.
"I want to be a voice for community hospitalists, both in urban and rural settings," says Dr. Kealey, who as medical director of hospital medicine at Health Partners Medical Group in Minneapolis oversees 65 hospitalists at five hospitals in the Twin Cities and two rural hospitals in western Wisconsin.
An active SHM member since the beginning, Dr. Kealey is a familiar face in society circles. He's a facilitator for SHM's Leadership Academy and practice management faculty for the One-Day Hospitalist University. He's served as chair of SHM's Practice Analysis Committee the past three years, and he is a staunch supporter of society efforts to nurture HM leaders through education, mentorship, and guidance.
As chair of the Practice Analysis Committee, Dr. Kealey has firsthand knowledge of SHM's efforts to collect, analyze, and distribute compensation and productivity benchmarks to the specialty. The biannual survey data is critical to negotiations between community hospitals and hospital administration, especially in these choppy economic waters.
"We need to make sure we are getting good data and we must tell the story better," Dr. Kealey says. "Rural hospitalists are growing, and they are hungry for information to compare their practice to others across the nation."
Just as he does in his own practice, Dr. Kealey wants SHM to promote an atmosphere of inclusivity. "We cannot do our daily job without the nursing staff [administrative staff, therapy, etc.]," he says. "We're not a one-man show."
Burke Kealey, MD, FHM, knows exactly what he brings to the SHM board table. With more than a decade of experience as a practicing hospitalist and directing the HM service he co-founded in 1997, Dr. Kealey says he will champion the community hospitalist cause during his three-year term on the 12-seat board.
"I want to be a voice for community hospitalists, both in urban and rural settings," says Dr. Kealey, who as medical director of hospital medicine at Health Partners Medical Group in Minneapolis oversees 65 hospitalists at five hospitals in the Twin Cities and two rural hospitals in western Wisconsin.
An active SHM member since the beginning, Dr. Kealey is a familiar face in society circles. He's a facilitator for SHM's Leadership Academy and practice management faculty for the One-Day Hospitalist University. He's served as chair of SHM's Practice Analysis Committee the past three years, and he is a staunch supporter of society efforts to nurture HM leaders through education, mentorship, and guidance.
As chair of the Practice Analysis Committee, Dr. Kealey has firsthand knowledge of SHM's efforts to collect, analyze, and distribute compensation and productivity benchmarks to the specialty. The biannual survey data is critical to negotiations between community hospitals and hospital administration, especially in these choppy economic waters.
"We need to make sure we are getting good data and we must tell the story better," Dr. Kealey says. "Rural hospitalists are growing, and they are hungry for information to compare their practice to others across the nation."
Just as he does in his own practice, Dr. Kealey wants SHM to promote an atmosphere of inclusivity. "We cannot do our daily job without the nursing staff [administrative staff, therapy, etc.]," he says. "We're not a one-man show."
Burke Kealey, MD, FHM, knows exactly what he brings to the SHM board table. With more than a decade of experience as a practicing hospitalist and directing the HM service he co-founded in 1997, Dr. Kealey says he will champion the community hospitalist cause during his three-year term on the 12-seat board.
"I want to be a voice for community hospitalists, both in urban and rural settings," says Dr. Kealey, who as medical director of hospital medicine at Health Partners Medical Group in Minneapolis oversees 65 hospitalists at five hospitals in the Twin Cities and two rural hospitals in western Wisconsin.
An active SHM member since the beginning, Dr. Kealey is a familiar face in society circles. He's a facilitator for SHM's Leadership Academy and practice management faculty for the One-Day Hospitalist University. He's served as chair of SHM's Practice Analysis Committee the past three years, and he is a staunch supporter of society efforts to nurture HM leaders through education, mentorship, and guidance.
As chair of the Practice Analysis Committee, Dr. Kealey has firsthand knowledge of SHM's efforts to collect, analyze, and distribute compensation and productivity benchmarks to the specialty. The biannual survey data is critical to negotiations between community hospitals and hospital administration, especially in these choppy economic waters.
"We need to make sure we are getting good data and we must tell the story better," Dr. Kealey says. "Rural hospitalists are growing, and they are hungry for information to compare their practice to others across the nation."
Just as he does in his own practice, Dr. Kealey wants SHM to promote an atmosphere of inclusivity. "We cannot do our daily job without the nursing staff [administrative staff, therapy, etc.]," he says. "We're not a one-man show."
The Blog Rounds
With thousands of hospitalists returning to work after the whirlwind that was HM09, many are contemplating lessons learned from the meeting. Here are a couple of interesting reads:
A Loss for Patients?
John Nelson, MD, FHM, FACP, a principal in the national hospitalist practice management consulting firm Nelson/Flores Associates and a columnist for The Hospitalist, says the annual meeting made him reminisce about how many hospitalists have given up full-time patient care since he and Winthrop F. Whitcomb, MD, FHM, a hospitalist at Mercy Medical Center in Springfield, Mass., founded the society in 1996.
“The longtime regulars were full-time patient caregivers way back when but now have other roles and now see patients only part of their time or not at all,” he writes in "The Hospitalist Leader" blog. “For a variety of reasons, these people have taken on roles other than patient care. I’m in that category, too, since I currently provide direct patient care only about 30% as much as the full-time hospitalists in the practice I’m in.”
Dr. Nelson says he worries patients are losing out on the unique, patient-centered care that hospitalists provide. "Hopefully, in their administrative roles, these hospitalists can do good things for even more patients than they could through bedside care," he writes. "We just need to make sure we aren't sucking the best doctors away from patient care simply because we've failed to create a sustainable and rewarding career in patient care."
Job Satisfaction
HM09 seems to have affirmed the career choice of "The Hospitalist Refugee", a hospitalist who blogs in the rural Midwest.
"While my current job is decidedly NOT where I want to practice (geographically or operationally), hospitalist medicine IS the environment I want to stay in," he writes. "I'm hopeful that when it comes time for me to find the next hospitalist job, our profession will have matured (with hopefully the leadership of SHM) enough that there is consistency and stability in the market."
Meeting Madness
Team Hospitalist member Randy Ferrance, DC, MD, FHM, was thoroughly impressed with the HM09 effort. Dr. Ferrance, a hospitalist at Riverside Tappahanock Hospital, a rural, 67-bed facility in Tappahannock, Va., offered his thoughts on the "HM09" blog.
"The sheer breadth and width of talent that SHM manages to attract—both in lecturers and attendees—is nothing short of impressive. This morning I was able to catch up on practice management ("What Have You Done for Me Lately") and medical management ("Heme/Onc Emergencies/Urgencies and Updates in Diagnosis and Management of CAD"), and soon I'll hear from Bob Wachter on managing accountability in a no-blame environment."
With thousands of hospitalists returning to work after the whirlwind that was HM09, many are contemplating lessons learned from the meeting. Here are a couple of interesting reads:
A Loss for Patients?
John Nelson, MD, FHM, FACP, a principal in the national hospitalist practice management consulting firm Nelson/Flores Associates and a columnist for The Hospitalist, says the annual meeting made him reminisce about how many hospitalists have given up full-time patient care since he and Winthrop F. Whitcomb, MD, FHM, a hospitalist at Mercy Medical Center in Springfield, Mass., founded the society in 1996.
“The longtime regulars were full-time patient caregivers way back when but now have other roles and now see patients only part of their time or not at all,” he writes in "The Hospitalist Leader" blog. “For a variety of reasons, these people have taken on roles other than patient care. I’m in that category, too, since I currently provide direct patient care only about 30% as much as the full-time hospitalists in the practice I’m in.”
Dr. Nelson says he worries patients are losing out on the unique, patient-centered care that hospitalists provide. "Hopefully, in their administrative roles, these hospitalists can do good things for even more patients than they could through bedside care," he writes. "We just need to make sure we aren't sucking the best doctors away from patient care simply because we've failed to create a sustainable and rewarding career in patient care."
Job Satisfaction
HM09 seems to have affirmed the career choice of "The Hospitalist Refugee", a hospitalist who blogs in the rural Midwest.
"While my current job is decidedly NOT where I want to practice (geographically or operationally), hospitalist medicine IS the environment I want to stay in," he writes. "I'm hopeful that when it comes time for me to find the next hospitalist job, our profession will have matured (with hopefully the leadership of SHM) enough that there is consistency and stability in the market."
Meeting Madness
Team Hospitalist member Randy Ferrance, DC, MD, FHM, was thoroughly impressed with the HM09 effort. Dr. Ferrance, a hospitalist at Riverside Tappahanock Hospital, a rural, 67-bed facility in Tappahannock, Va., offered his thoughts on the "HM09" blog.
"The sheer breadth and width of talent that SHM manages to attract—both in lecturers and attendees—is nothing short of impressive. This morning I was able to catch up on practice management ("What Have You Done for Me Lately") and medical management ("Heme/Onc Emergencies/Urgencies and Updates in Diagnosis and Management of CAD"), and soon I'll hear from Bob Wachter on managing accountability in a no-blame environment."
With thousands of hospitalists returning to work after the whirlwind that was HM09, many are contemplating lessons learned from the meeting. Here are a couple of interesting reads:
A Loss for Patients?
John Nelson, MD, FHM, FACP, a principal in the national hospitalist practice management consulting firm Nelson/Flores Associates and a columnist for The Hospitalist, says the annual meeting made him reminisce about how many hospitalists have given up full-time patient care since he and Winthrop F. Whitcomb, MD, FHM, a hospitalist at Mercy Medical Center in Springfield, Mass., founded the society in 1996.
“The longtime regulars were full-time patient caregivers way back when but now have other roles and now see patients only part of their time or not at all,” he writes in "The Hospitalist Leader" blog. “For a variety of reasons, these people have taken on roles other than patient care. I’m in that category, too, since I currently provide direct patient care only about 30% as much as the full-time hospitalists in the practice I’m in.”
Dr. Nelson says he worries patients are losing out on the unique, patient-centered care that hospitalists provide. "Hopefully, in their administrative roles, these hospitalists can do good things for even more patients than they could through bedside care," he writes. "We just need to make sure we aren't sucking the best doctors away from patient care simply because we've failed to create a sustainable and rewarding career in patient care."
Job Satisfaction
HM09 seems to have affirmed the career choice of "The Hospitalist Refugee", a hospitalist who blogs in the rural Midwest.
"While my current job is decidedly NOT where I want to practice (geographically or operationally), hospitalist medicine IS the environment I want to stay in," he writes. "I'm hopeful that when it comes time for me to find the next hospitalist job, our profession will have matured (with hopefully the leadership of SHM) enough that there is consistency and stability in the market."
Meeting Madness
Team Hospitalist member Randy Ferrance, DC, MD, FHM, was thoroughly impressed with the HM09 effort. Dr. Ferrance, a hospitalist at Riverside Tappahanock Hospital, a rural, 67-bed facility in Tappahannock, Va., offered his thoughts on the "HM09" blog.
"The sheer breadth and width of talent that SHM manages to attract—both in lecturers and attendees—is nothing short of impressive. This morning I was able to catch up on practice management ("What Have You Done for Me Lately") and medical management ("Heme/Onc Emergencies/Urgencies and Updates in Diagnosis and Management of CAD"), and soon I'll hear from Bob Wachter on managing accountability in a no-blame environment."
Watch Out for Phony Board Certification Offers
Physicians routinely are deluged with offers for certifications in hospital medicine, geriatric medicine and other specialties. Unaccredited boards have been set up to solicit phony certifications requiring no training, testing or medical background review, according to Christine Cassel, MD, president and CEO of the American Board of Internal Medicine (ABIM).
ABIM is concerned about the welfare of patients who may choose doctors representing themselves as "board certified" based on a certificate from one of these unaccredited boards.
"Physicians should trust their instincts," Dr. Cassel says. "If a deal seems too good to be true, it probably is. Hospitalists should be especially wary of solicitations from the American Board of Hospital Physicians (ABOHP). The organization is not a member of the American Board of Medical Specialties (ABMS), and is not recognized by key healthcare credentialing accreditation entities."
Robert Wachter, MD, chief of the division of hospital medicine at the University of California San Francisco Medical Center and chair of ABIM's Committee on Hospital Medicine Focused Recognition, adds, "The ABIM has been working hard to create a pathway that recognizes the professional focus of internist-hospitalists, and I hope it will be available in the not-so-distant future. Personally, I encourage all hospitalists to pursue board certification and keep their certification up-to-date. This scam points out the importance of ensuring that the certification is legitimate."
If an unrecognizable organization sends you a board certificate offer, alert ABIM at [email protected].
Physicians routinely are deluged with offers for certifications in hospital medicine, geriatric medicine and other specialties. Unaccredited boards have been set up to solicit phony certifications requiring no training, testing or medical background review, according to Christine Cassel, MD, president and CEO of the American Board of Internal Medicine (ABIM).
ABIM is concerned about the welfare of patients who may choose doctors representing themselves as "board certified" based on a certificate from one of these unaccredited boards.
"Physicians should trust their instincts," Dr. Cassel says. "If a deal seems too good to be true, it probably is. Hospitalists should be especially wary of solicitations from the American Board of Hospital Physicians (ABOHP). The organization is not a member of the American Board of Medical Specialties (ABMS), and is not recognized by key healthcare credentialing accreditation entities."
Robert Wachter, MD, chief of the division of hospital medicine at the University of California San Francisco Medical Center and chair of ABIM's Committee on Hospital Medicine Focused Recognition, adds, "The ABIM has been working hard to create a pathway that recognizes the professional focus of internist-hospitalists, and I hope it will be available in the not-so-distant future. Personally, I encourage all hospitalists to pursue board certification and keep their certification up-to-date. This scam points out the importance of ensuring that the certification is legitimate."
If an unrecognizable organization sends you a board certificate offer, alert ABIM at [email protected].
Physicians routinely are deluged with offers for certifications in hospital medicine, geriatric medicine and other specialties. Unaccredited boards have been set up to solicit phony certifications requiring no training, testing or medical background review, according to Christine Cassel, MD, president and CEO of the American Board of Internal Medicine (ABIM).
ABIM is concerned about the welfare of patients who may choose doctors representing themselves as "board certified" based on a certificate from one of these unaccredited boards.
"Physicians should trust their instincts," Dr. Cassel says. "If a deal seems too good to be true, it probably is. Hospitalists should be especially wary of solicitations from the American Board of Hospital Physicians (ABOHP). The organization is not a member of the American Board of Medical Specialties (ABMS), and is not recognized by key healthcare credentialing accreditation entities."
Robert Wachter, MD, chief of the division of hospital medicine at the University of California San Francisco Medical Center and chair of ABIM's Committee on Hospital Medicine Focused Recognition, adds, "The ABIM has been working hard to create a pathway that recognizes the professional focus of internist-hospitalists, and I hope it will be available in the not-so-distant future. Personally, I encourage all hospitalists to pursue board certification and keep their certification up-to-date. This scam points out the importance of ensuring that the certification is legitimate."
If an unrecognizable organization sends you a board certificate offer, alert ABIM at [email protected].
An Offer You Can Refuse
What is the main reason women make less money than men in identical positions? A lack of negotiation skills, says Rachel George, MD, MBA, FHM, regional medical director and vice president of operations for Brentwood, Tenn.-based Cogent Healthcare.
“Women aren’t as comfortable negotiating as men are,” Dr. George says. “The fact is, individuals who ask for more generally get more.”
Dr. George offers women the following negotiation tips:
1. Investigate. Research average salaries for the position you are applying for, the region you live in, and the company you’d be working for. One place to start: the 2007-2008 SHM Bi-annual Survey on the State of the Hospital Medicine Movement.
2. Set goals. Define how much you want to make and ask for that amount. “You try harder when you set a goal,” Dr. George says.
3. Create BATNA. This concept, from the book “Getting to Yes: Negotiating Agreements Without Giving In”, is about the Best Alternative To a Negotiated Agreement (BATNA). Ask yourself: Do you have other positions lined up in case the one you’re applying for doesn’t work out?
4. Be realistic. Ridiculous offers will get you nowhere. Don’t ask for higher than the 95th percentile of the average salary for the position you’re applying for.
5. Look beyond salary. If your potential employer won’t budge on salary, consider other forms of compensation: CME money, PTO time, fewer work hours. “All these things can be negotiated to achieve the right package for you,” Dr. George says.
6. Practice, practice, practice. Negotiation is a learned trait; try role-playing with someone you trust.
7. Be persistent. Women tend to give up sooner than men. “Bargaining doesn’t end at the first conversation or transaction,” she says.
What is the main reason women make less money than men in identical positions? A lack of negotiation skills, says Rachel George, MD, MBA, FHM, regional medical director and vice president of operations for Brentwood, Tenn.-based Cogent Healthcare.
“Women aren’t as comfortable negotiating as men are,” Dr. George says. “The fact is, individuals who ask for more generally get more.”
Dr. George offers women the following negotiation tips:
1. Investigate. Research average salaries for the position you are applying for, the region you live in, and the company you’d be working for. One place to start: the 2007-2008 SHM Bi-annual Survey on the State of the Hospital Medicine Movement.
2. Set goals. Define how much you want to make and ask for that amount. “You try harder when you set a goal,” Dr. George says.
3. Create BATNA. This concept, from the book “Getting to Yes: Negotiating Agreements Without Giving In”, is about the Best Alternative To a Negotiated Agreement (BATNA). Ask yourself: Do you have other positions lined up in case the one you’re applying for doesn’t work out?
4. Be realistic. Ridiculous offers will get you nowhere. Don’t ask for higher than the 95th percentile of the average salary for the position you’re applying for.
5. Look beyond salary. If your potential employer won’t budge on salary, consider other forms of compensation: CME money, PTO time, fewer work hours. “All these things can be negotiated to achieve the right package for you,” Dr. George says.
6. Practice, practice, practice. Negotiation is a learned trait; try role-playing with someone you trust.
7. Be persistent. Women tend to give up sooner than men. “Bargaining doesn’t end at the first conversation or transaction,” she says.
What is the main reason women make less money than men in identical positions? A lack of negotiation skills, says Rachel George, MD, MBA, FHM, regional medical director and vice president of operations for Brentwood, Tenn.-based Cogent Healthcare.
“Women aren’t as comfortable negotiating as men are,” Dr. George says. “The fact is, individuals who ask for more generally get more.”
Dr. George offers women the following negotiation tips:
1. Investigate. Research average salaries for the position you are applying for, the region you live in, and the company you’d be working for. One place to start: the 2007-2008 SHM Bi-annual Survey on the State of the Hospital Medicine Movement.
2. Set goals. Define how much you want to make and ask for that amount. “You try harder when you set a goal,” Dr. George says.
3. Create BATNA. This concept, from the book “Getting to Yes: Negotiating Agreements Without Giving In”, is about the Best Alternative To a Negotiated Agreement (BATNA). Ask yourself: Do you have other positions lined up in case the one you’re applying for doesn’t work out?
4. Be realistic. Ridiculous offers will get you nowhere. Don’t ask for higher than the 95th percentile of the average salary for the position you’re applying for.
5. Look beyond salary. If your potential employer won’t budge on salary, consider other forms of compensation: CME money, PTO time, fewer work hours. “All these things can be negotiated to achieve the right package for you,” Dr. George says.
6. Practice, practice, practice. Negotiation is a learned trait; try role-playing with someone you trust.
7. Be persistent. Women tend to give up sooner than men. “Bargaining doesn’t end at the first conversation or transaction,” she says.
Ready to Learn, Lead
Dan Dressler, MD, MSc, FHM, was introduced to the hospitalist concept a decade ago during a breakout session at a Society of General Internal Medicine meeting. A resident at the time, Dressler immediately latched on to the HM concept.
“I was like, ‘Wow, this is interesting. There are a lot of fun, exciting people,’ ” he says. “I thought they had a great vision for medicine. It was the direction I wanted to go.”
Dr. Dressler joined SHM in 2000. Now he supervises the nation’s largest academic hospitalist program and is one of SHM’s newest board members. He officially joined the 12-member board at HM09 in Chicago and will serve a three-year term.
Now the director of education for the section of hospital medicine, associate professor and associate residency director in the department of medicine at Emory University School of Medicine in Atlanta, Dressler has a passion for teaching, evidence-based medicine, and quality initiatives. He’s worked in academic and community hospital settings; he’s served on SHM’s Education Committee; and he’s chaired SHM’s Core Competencies task force. “I have a huge interest in education,” Dr. Dressler says, adding he will serve as the course director for HM11 in Dallas.
His mission is to make sure all hospitalists across the country have the same baseline skills. “I consider this a new opportunity, a new challenge,” he says. “I believe SHM is a high-level, high-quality organization. It’s a group that is going to lead medicine.”
Dan Dressler, MD, MSc, FHM, was introduced to the hospitalist concept a decade ago during a breakout session at a Society of General Internal Medicine meeting. A resident at the time, Dressler immediately latched on to the HM concept.
“I was like, ‘Wow, this is interesting. There are a lot of fun, exciting people,’ ” he says. “I thought they had a great vision for medicine. It was the direction I wanted to go.”
Dr. Dressler joined SHM in 2000. Now he supervises the nation’s largest academic hospitalist program and is one of SHM’s newest board members. He officially joined the 12-member board at HM09 in Chicago and will serve a three-year term.
Now the director of education for the section of hospital medicine, associate professor and associate residency director in the department of medicine at Emory University School of Medicine in Atlanta, Dressler has a passion for teaching, evidence-based medicine, and quality initiatives. He’s worked in academic and community hospital settings; he’s served on SHM’s Education Committee; and he’s chaired SHM’s Core Competencies task force. “I have a huge interest in education,” Dr. Dressler says, adding he will serve as the course director for HM11 in Dallas.
His mission is to make sure all hospitalists across the country have the same baseline skills. “I consider this a new opportunity, a new challenge,” he says. “I believe SHM is a high-level, high-quality organization. It’s a group that is going to lead medicine.”
Dan Dressler, MD, MSc, FHM, was introduced to the hospitalist concept a decade ago during a breakout session at a Society of General Internal Medicine meeting. A resident at the time, Dressler immediately latched on to the HM concept.
“I was like, ‘Wow, this is interesting. There are a lot of fun, exciting people,’ ” he says. “I thought they had a great vision for medicine. It was the direction I wanted to go.”
Dr. Dressler joined SHM in 2000. Now he supervises the nation’s largest academic hospitalist program and is one of SHM’s newest board members. He officially joined the 12-member board at HM09 in Chicago and will serve a three-year term.
Now the director of education for the section of hospital medicine, associate professor and associate residency director in the department of medicine at Emory University School of Medicine in Atlanta, Dressler has a passion for teaching, evidence-based medicine, and quality initiatives. He’s worked in academic and community hospital settings; he’s served on SHM’s Education Committee; and he’s chaired SHM’s Core Competencies task force. “I have a huge interest in education,” Dr. Dressler says, adding he will serve as the course director for HM11 in Dallas.
His mission is to make sure all hospitalists across the country have the same baseline skills. “I consider this a new opportunity, a new challenge,” he says. “I believe SHM is a high-level, high-quality organization. It’s a group that is going to lead medicine.”
Overcoming limitations of haploidentical HSCT
Researchers say they have found a strategy to overcome the limitations of haploidentical hematopoietic stem cell transplantation (HSCT).
To prevent the early, severe graft-versus-host disease (GVHD) associated with haploidentical HSCT, donor T cells reacting with recipient antigens are eliminated from the graft prior to transplant.
However, the depletion of T cells can lead to delayed immune reconstitution in the transplant recipient, which increases the risk of infection and death.
Results of a new study may help clinicians decrease those risks. The study showed that the infusion of specially engineered haploidentical donor T cells induced early reconstitution of post-HSCT immunity. These cells were also able to control GVHD and preserve a graft-versus-leukemia effect.
This study appeared in the May issue of The Lancet Oncology and was funded by the biotech company MolMed SpA.
Claudio Bordignon, MD, from the Raffaele Scientific Institute, Milan, Italy, and colleagues conducted this phase 1/2, multicenter, nonrandomized trial of haploidentical T-cell depleted HSCT in 50 high-risk leukemia patients in remission.
Of the 50 patients, 28 patients received T cells engineered to carry the herpes simplex thymidine kinase suicide gene (TK cells).
To prepare the TK cells, the researchers used the haploidentical donor T lymphocytes that were collected prior to mobilization with G-CSF or marrow harvesting of stem cells. The T lymphocytes were expanded in vitro and then transduced with the herpes simplex thymidine kinase suicide gene. This rendered the cells sensitive to the antiviral agent ganciclovir, which enabled the researchers to selectively eliminate the cells upon the development of GVHD.
Twenty-eight patients received a first dose of TK cells. If patients did not achieve immune reconstitution 30 days later, they received up to 3 additional monthly infusions of TK cells. Transplant recipients did not receive GVHD prophylaxis following TK cell infusion.
Twenty-two patients achieved immune reconstitution at a median time of 75 days after HSCT and 23 days following TK cell infusion. Immune reconstitution was dependent on the dose of TK cells.
A progressive decline in the number and severity of infectious complications occurred in patients with immune reconstitution. Patients without immune reconstitution continued to have more frequent and more severe infectious complications.
Nonrelapse mortality at 100 days posttransplant was lower in patients who achieved immune reconstitution than in those who did not, at 14% and 60%, respectively. The researchers said this was possibly due to protection from late infectious mortality.
Effective immune reconstitution did not increase the incidence of GVHD, the researchers said. Rates of GVHD were similar to rates reported in other studies. Ten patients developed grades 1 to 4 acute GVHD, and 1 patient developed chronic GVHD.
Dr Bordignon and colleagues said acute GVHD was directly associated with infiltration of the TK cells at affected lesions. The team was able to control acute GVHD by administering ganciclovir, thereby activating the suicide gene and eliminating the TK cells. 
Researchers say they have found a strategy to overcome the limitations of haploidentical hematopoietic stem cell transplantation (HSCT).
To prevent the early, severe graft-versus-host disease (GVHD) associated with haploidentical HSCT, donor T cells reacting with recipient antigens are eliminated from the graft prior to transplant.
However, the depletion of T cells can lead to delayed immune reconstitution in the transplant recipient, which increases the risk of infection and death.
Results of a new study may help clinicians decrease those risks. The study showed that the infusion of specially engineered haploidentical donor T cells induced early reconstitution of post-HSCT immunity. These cells were also able to control GVHD and preserve a graft-versus-leukemia effect.
This study appeared in the May issue of The Lancet Oncology and was funded by the biotech company MolMed SpA.
Claudio Bordignon, MD, from the Raffaele Scientific Institute, Milan, Italy, and colleagues conducted this phase 1/2, multicenter, nonrandomized trial of haploidentical T-cell depleted HSCT in 50 high-risk leukemia patients in remission.
Of the 50 patients, 28 patients received T cells engineered to carry the herpes simplex thymidine kinase suicide gene (TK cells).
To prepare the TK cells, the researchers used the haploidentical donor T lymphocytes that were collected prior to mobilization with G-CSF or marrow harvesting of stem cells. The T lymphocytes were expanded in vitro and then transduced with the herpes simplex thymidine kinase suicide gene. This rendered the cells sensitive to the antiviral agent ganciclovir, which enabled the researchers to selectively eliminate the cells upon the development of GVHD.
Twenty-eight patients received a first dose of TK cells. If patients did not achieve immune reconstitution 30 days later, they received up to 3 additional monthly infusions of TK cells. Transplant recipients did not receive GVHD prophylaxis following TK cell infusion.
Twenty-two patients achieved immune reconstitution at a median time of 75 days after HSCT and 23 days following TK cell infusion. Immune reconstitution was dependent on the dose of TK cells.
A progressive decline in the number and severity of infectious complications occurred in patients with immune reconstitution. Patients without immune reconstitution continued to have more frequent and more severe infectious complications.
Nonrelapse mortality at 100 days posttransplant was lower in patients who achieved immune reconstitution than in those who did not, at 14% and 60%, respectively. The researchers said this was possibly due to protection from late infectious mortality.
Effective immune reconstitution did not increase the incidence of GVHD, the researchers said. Rates of GVHD were similar to rates reported in other studies. Ten patients developed grades 1 to 4 acute GVHD, and 1 patient developed chronic GVHD.
Dr Bordignon and colleagues said acute GVHD was directly associated with infiltration of the TK cells at affected lesions. The team was able to control acute GVHD by administering ganciclovir, thereby activating the suicide gene and eliminating the TK cells.
Researchers say they have found a strategy to overcome the limitations of haploidentical hematopoietic stem cell transplantation (HSCT).
To prevent the early, severe graft-versus-host disease (GVHD) associated with haploidentical HSCT, donor T cells reacting with recipient antigens are eliminated from the graft prior to transplant.
However, the depletion of T cells can lead to delayed immune reconstitution in the transplant recipient, which increases the risk of infection and death.
Results of a new study may help clinicians decrease those risks. The study showed that the infusion of specially engineered haploidentical donor T cells induced early reconstitution of post-HSCT immunity. These cells were also able to control GVHD and preserve a graft-versus-leukemia effect.
This study appeared in the May issue of The Lancet Oncology and was funded by the biotech company MolMed SpA.
Claudio Bordignon, MD, from the Raffaele Scientific Institute, Milan, Italy, and colleagues conducted this phase 1/2, multicenter, nonrandomized trial of haploidentical T-cell depleted HSCT in 50 high-risk leukemia patients in remission.
Of the 50 patients, 28 patients received T cells engineered to carry the herpes simplex thymidine kinase suicide gene (TK cells).
To prepare the TK cells, the researchers used the haploidentical donor T lymphocytes that were collected prior to mobilization with G-CSF or marrow harvesting of stem cells. The T lymphocytes were expanded in vitro and then transduced with the herpes simplex thymidine kinase suicide gene. This rendered the cells sensitive to the antiviral agent ganciclovir, which enabled the researchers to selectively eliminate the cells upon the development of GVHD.
Twenty-eight patients received a first dose of TK cells. If patients did not achieve immune reconstitution 30 days later, they received up to 3 additional monthly infusions of TK cells. Transplant recipients did not receive GVHD prophylaxis following TK cell infusion.
Twenty-two patients achieved immune reconstitution at a median time of 75 days after HSCT and 23 days following TK cell infusion. Immune reconstitution was dependent on the dose of TK cells.
A progressive decline in the number and severity of infectious complications occurred in patients with immune reconstitution. Patients without immune reconstitution continued to have more frequent and more severe infectious complications.
Nonrelapse mortality at 100 days posttransplant was lower in patients who achieved immune reconstitution than in those who did not, at 14% and 60%, respectively. The researchers said this was possibly due to protection from late infectious mortality.
Effective immune reconstitution did not increase the incidence of GVHD, the researchers said. Rates of GVHD were similar to rates reported in other studies. Ten patients developed grades 1 to 4 acute GVHD, and 1 patient developed chronic GVHD.
Dr Bordignon and colleagues said acute GVHD was directly associated with infiltration of the TK cells at affected lesions. The team was able to control acute GVHD by administering ganciclovir, thereby activating the suicide gene and eliminating the TK cells.
Established, Energized, Engaged
The hospitalist movement has turned the corner from an emerging field to an established specialty some 30,000 strong that will be a change agent for healthcare reform, SHM officials declared today at HM09 in Chicago.
"Hospital medicine is the elephant that stood up," says Larry Wellikson, MD, FHM, CEO of SHM. "We are no longer the new people, the little engine that could. We are a huge force moving through medicine and healthcare—we like to think to good purpose."
Dr. Wellikson's comments punctuated the annual State of HM address, which drew a record crowd of 2,000 at this year's sold-out conference. His comments were bookended by former SHM president Patrick Cawley, MD, FHM, and SHM President Scott Flanders, MD, FHM. All three touted the society's collaborations with other healthcare groups, quality initiatives, and the seemingly endless growth spurt in the field.
The addresses followed the induction of the inaugural class of Fellows in Hospital Medicine. More than 400 of the 514 fellows were in attendance. HM leaders point to the fellowship program as another milestone in cementing HM's place in healthcare. Other plaudits were bestowed upon the society's training programs for patient discharge, the attention paid to the needs of academic hospitalists, and the Public Policy Committee’s work in connecting with congressional leaders who are likely to help President Obama shepherd through major healthcare reforms this summer.
"For a specialty that is so new, we have an absolutely special seat at the table," Dr. Wellikson says. "We are now ready for prime time, ready to lead, and ready to go."
The hospitalist movement has turned the corner from an emerging field to an established specialty some 30,000 strong that will be a change agent for healthcare reform, SHM officials declared today at HM09 in Chicago.
"Hospital medicine is the elephant that stood up," says Larry Wellikson, MD, FHM, CEO of SHM. "We are no longer the new people, the little engine that could. We are a huge force moving through medicine and healthcare—we like to think to good purpose."
Dr. Wellikson's comments punctuated the annual State of HM address, which drew a record crowd of 2,000 at this year's sold-out conference. His comments were bookended by former SHM president Patrick Cawley, MD, FHM, and SHM President Scott Flanders, MD, FHM. All three touted the society's collaborations with other healthcare groups, quality initiatives, and the seemingly endless growth spurt in the field.
The addresses followed the induction of the inaugural class of Fellows in Hospital Medicine. More than 400 of the 514 fellows were in attendance. HM leaders point to the fellowship program as another milestone in cementing HM's place in healthcare. Other plaudits were bestowed upon the society's training programs for patient discharge, the attention paid to the needs of academic hospitalists, and the Public Policy Committee’s work in connecting with congressional leaders who are likely to help President Obama shepherd through major healthcare reforms this summer.
"For a specialty that is so new, we have an absolutely special seat at the table," Dr. Wellikson says. "We are now ready for prime time, ready to lead, and ready to go."
The hospitalist movement has turned the corner from an emerging field to an established specialty some 30,000 strong that will be a change agent for healthcare reform, SHM officials declared today at HM09 in Chicago.
"Hospital medicine is the elephant that stood up," says Larry Wellikson, MD, FHM, CEO of SHM. "We are no longer the new people, the little engine that could. We are a huge force moving through medicine and healthcare—we like to think to good purpose."
Dr. Wellikson's comments punctuated the annual State of HM address, which drew a record crowd of 2,000 at this year's sold-out conference. His comments were bookended by former SHM president Patrick Cawley, MD, FHM, and SHM President Scott Flanders, MD, FHM. All three touted the society's collaborations with other healthcare groups, quality initiatives, and the seemingly endless growth spurt in the field.
The addresses followed the induction of the inaugural class of Fellows in Hospital Medicine. More than 400 of the 514 fellows were in attendance. HM leaders point to the fellowship program as another milestone in cementing HM's place in healthcare. Other plaudits were bestowed upon the society's training programs for patient discharge, the attention paid to the needs of academic hospitalists, and the Public Policy Committee’s work in connecting with congressional leaders who are likely to help President Obama shepherd through major healthcare reforms this summer.
"For a specialty that is so new, we have an absolutely special seat at the table," Dr. Wellikson says. "We are now ready for prime time, ready to lead, and ready to go."