User login
Disruptive Doctors
If you’ve been a hospitalist leader for a few years, you likely are familiar with the specter of the disruptive physician. Most group leaders dread dealing with a hospitalist who exhibits behavior that upsets the group or the hospital staff; fewer meet the task head-on and try to change that behavior; and fewer still enjoy the challenge.
If you fall into one of the first two categories, take comfort in knowing you aren’t alone. But if you know that problem hospitalists are a management challenge, you should seek counsel or training to address such issues when they arise.
—Aaron Gottesman, MD, FACP, Staten Island (N.Y.) University Hospital
Define “Disruptive”
Managers are responsible for maintaining equilibrium in their HM groups, so it’s important to understand what constitutes disruptive behavior. “What it really comes down to is behavior which can impair patient care, collegiality, and the overall work in the hospital,” says Aaron Gottesman, MD, FACP, director of hospitalist services at Staten Island University Hospital in New York. “If a specific physician or other staff member acts in a way that hampers staff satisfaction, patient satisfaction, and obviously care, then that is disruptive.”
Disruptive behavior in the hospital can come from any staff member, not just physicians. Disruptive physicians receive greater attention because their bad behavior is more likely to be noticed and reported. And they do tend to get angry. “Physicians are time-sensitive, and they’re perfectionists,” says Timothy J. Keogh, PhD, assistant professor at the Citadel School of Business Administration in Charleston, S.C., who has researched physicians’ personality traits. “When they’re put in a stressful situation—such as an ED or ICU, where the outcomes may be uncertain and they’re operating on insufficient sleep or under stress—you may see this behavior.”
Although HM is a stressful career path with challenges of its own, Dr. Gottesman says he rarely notices the same level of disruptive behavior as can be found in the ED, OR, or ICU. “I don’t think it occurs among hospitalists any more than among the general physician population,” he says. “Hospitalists are not under the same time constraints; they don’t have as much stress or pressure—or at least they have a different kind.”
So who is responsible for dealing with a physician who behaves badly? In all cases, it should be the individual’s immediate supervisor.
Policy Preparation
The crucial component in dealing with a disruptive employee is to have an official behavior policy that is shared with everyone in your organization. The Joint Commission recently required hospitals to employ a code of conduct that outlines acceptable and unacceptable behavior, and it sets a process for addressing problematic behavior.
“You can bet physicians and nurses know it, including the disruptive individuals,” Dr. Keogh says. “This will make it much easier for executives to enforce.”
Dr. Gottesman relies on his organization’s policy. “It’s absolutely critical to have a sense of direction, to know what’s appropriate and what’s inappropriate, to have a procedure to follow,” he says. “Having policies and protocol in place is also critical for legal protection if the situation escalates. It protects the physician, the staff, the patients, and the institution.”
Dr. Keogh, a faculty member of SHM’s Leadership Academy, recommends that all physician employees learn their code of conduct policy. “To prevent downstream behaviors, when you get a new hire, don’t just give them this statement—read that section to them out loud,” he advises. “This ensures that they notice it, and gives hospitalist executives a much stronger position when something happens.”
Face-to-Face Meeting
There are two proven methods to successfully deal with disruptive behavior: 1) React to it immediately, and 2) follow up to ensure it doesn’t happen again. When you receive a complaint about a disruptive hospitalist, gather all the information you can on the incident and schedule a meeting to discuss it with the party accused of poor behavior.
“The first occurrence should result in an informal conversation. ‘You stepped over the line here, and we have to make sure it doesn’t happen again,’ ” Dr. Keogh says. He recommends that a human resources staffer be present at this meeting, and supervisors should come prepared with documentation.
“You have to sit them down and go over a written document—don’t just talk about word-of-mouth. Go over the documented occurrence of the behavior,” Dr. Keogh explains. “Talk through what they did, and let them know that you both have to find a way to ensure that it doesn’t happen again. They’ll rationalize their behavior at first, but make sure they understand that it’s unacceptable.”
In the case of an allegation or a one-on-one dispute, Dr. Gottesman advises you “clarify both sides before taking any action. I hear both sides of the story, then we find some common ground and work toward a solution.” In his experience, he says, “by and large, most physicians tend to be responsive when spoken to in a constructive, positive fashion. Let them know that you’re here to support them, not prosecute them. You need to maintain a professional demeanor.”
Dr. Keogh says oftentimes the first disciplinary meeting will be enough to end the disruptive behavior. If the same individual has another incident, schedule a second meeting and emphasize the seriousness of the infraction and disciplinary measures. You might want to have a senior manager, such as your chief medical officer, join the discussion. Officially document the problem and identify the consequences if the employee is disruptive again.
Followup Is Key
Another key to quashing disruptive behavior is doing your part to ensure it doesn’t happen again. “The problem is that the impact is residual on the people around that individual, whether it’s the nurses or patients,” Dr. Keogh says. “The results are avoidance and silence.”
Supervisors should follow up on the disruptive behavior by placing themselves in the problem employee’s way; doing so will let you see how they work and how others react to them, and it will show that you’re keeping an eye on them. “The [manager] has to show ongoing oversight of that individual, with occasional walks in the [hospital halls] and ongoing verbal encouragement, to show that someone is paying attention,” Dr. Keogh says. “They can fall back into bad behaviors if they think no one is watching.” Positive recognition of good behavior and outcomes (i.e., improved patient satisfaction) also helps reinforce your followup.
Depending on the individual and the situation, dealing with a disruptive behavior can be a long-term, never-ending job. But it’s a necessary one.
“There has to be zero tolerance,” Dr. Gottesman says. “People should be comfortable and confident with reporting this behavior. It should not be accepted as a normal part of work to put up with it. And they should know that the situation will be looked at objectively, and both sides will be heard.” TH
Jane Jerrard is a freelance writer based in Chicago.
Market Watch
Product Withdrawal
- Efalizumab (Raptiva), the once-weekly monoclonal antibody used to treat moderate to severe plaque psoriasis, has been withdrawn from the U.S. market due to its association with an increased risk of developing progressive multifocal leukoencephalopathy (PML).1 Four cases of PML have been confirmed, and the manufacturer has decided the risks outweigh the benefits.2
New Generics
- Carbamazepine extended-release (generic Tegretol-XR) tablets (100 mg, 200 mg and 400 mg)3
- Mycophenolate mofetil (generic Cellcept)4
New Drugs, Indications & Dosage Forms
- You might have noticed some difficulty getting pancrelipase products for your patients with exocrine pancreatic insufficiency (EPI), pancreatitis, or cystic fibrosis. Here’s why: Pancreatic enzyme replacement therapies (PERT), pancreatic enzyme products (PEP), pancrelipase products, or EPI products were available prior to the formation of the U.S. Food and Drug Administration (FDA) and the Federal Food, Drug and Cosmetic Act (FDCA) of 1938.
Until recently, none of these drug products had been marketed under approved new drug applications (NDAs). Since none of the products were subject to the NDA process, they were never subjected to safety, efficacy, bioavailability, or dose-ranging studies.5 The FDA has since decided that these agents must undergo the NDA process and, if approved, will only be available with a prescription.6
Part of the guidance states that all approved formulations will contain “zero overfill.” In other words, the products will not have a range of lipase (90% to 165%), as they had before. Overfill leads to side effects, including diarrhea, flatulence, hyperuricosuria, hyperuricosemia, and fibrosing colonopathy.
The new deadline to submit an NDA is April 29, 2010. The FDA has approved its first PEP agent, Creon pancrelipase, under the new guidance. It is expected to be available later this year.7
- Amlodipine, hydrochlorothiazide (HCTZ), and valsartan (Exforge HCT) is the first—and currently only—triple-combination antihypertensive agent to receive FDA approval.8 It can be used in patients already on these three medications, or it can be used as add-on therapy in patients not adequately controlled on two agents. The manufacturer plans to price the agent the same as amlodipine/valsartan (Exforge). Dose options are amlodipine 5 mg/valsartan 160 mg/HCTZ 12.5 mg, up to a maximum of two tablets daily.9
- Bromocriptine (Cycloset) is reformulated in a lower dose that is fast-acting and should be taken in the morning to boost dopamine levels and improve glycemic control in Type 2 diabetes patients.10 The drug is approved for monotherapy, as an adjunct to sulfonylurea therapy, or metformin plus a sulfonylurea. It’s the first diabetes agent to be FDA-approved since the guidance on cardiovascular risks. The most common side effects in clinical trials were nausea and dizziness. It should be used cautiously in patients taking antihypertensive treatment. Women who are nursing should not use it. The launch date is unknown.11
- Golimumab (Simponi), a once-a-month tumor necrosis factor-alpha inhibitor injection, has been FDA-approved for treating moderate to severe rheumatoid arthritis, active psoriatic arthritis, and active ankylosing spondylitis.12 It carries the same warnings as other agents in the same class, including the risk of developing tuberculosis and invasive fungal infections. A risk evaluation mitigation strategy (REMS) and medication guide are required for this agent.
- Iloperidone (Fanapt), an atypical antipsychotic, has been FDA-approved to treat adults with schizophrenia. The most common side effects in clinical trials were dizziness, dry mouth, fatigue, nasal congestion, and orthostatic hypotension. Similar to other atypical antipsychotics, iloperidone carries a boxed warning regarding increased risk of death associated with treating behavioral problems in older patients with dementia-related psychosis, as it is not FDA-approved for this use.13
New Warnings
- Topical testosterone products (e.g., Androgel and Testim) have received a boxed warning.14 This warning is due to multiple reports of adverse effects in children exposed to the drug via contact with a topical testosterone-treated person. There are current product label precautions; however, the FDA has received reports of secondary exposure to testosterone in children 5 years old or younger. Adverse events included inappropriate genitalia enlargement, premature pubic hair development, bone age advancement, increased libido, and aggressive behavior. The FDA has provided recommendations to minimize secondary exposure. TH
Michele B. Kaufman, PharmD, BSc, RPh, is a freelance medical writer based in New York City.
References
- FDA statement on the voluntary withdrawal of Raptiva from the U.S. market. Food and Drug Administration Web site. Available at: www.fda.gov/NewsEvents/Newsroom/PressAnnouncements/ucm149561.htm Accessed July 2, 2009.
- Withdrawal of Raptiva from U.S. market. The Medical News Web site. Available at: www.news-medical.net/news/48133.aspx. Accessed May 12, 2009.
- Taro receives final FDA approval for carbamazepine extended-release tablets. Medicine News Today Web site. Available at: www.medicalnewstoday.com/articles/145217.php. Accessed May 12, 2009.
- FDA OKs Mylan generic version of transplant drug. Forbes Web site. Available at: www.forbes.com/feeds/ap/2009/05/07/ap6392275.html. Accessed May 8, 2009.
- Exocrine Pancreatic Insufficiency Drug Products. Federal Register Web site. Available at: www.fda.gov/ohrms/dockets/98fr/04-9652.htm. Accessed May 7, 2009.
- Guidance for industry exocrine pancreatic insufficiency drug products—submitting NDAs. FDA Web site. Available at: www.fda.gov/ohrms/dockets/98fr/2003d-0206-gdl0001.pdf. Accessed May 7, 2009.
- Phend C. FDA formally approves Creon pancrelipase. Medpage Today Web site. Available at: www.medpagetoday.com/ProductAlert/Prescriptions/14021. Accessed May 7, 2009.
- FDA approves Exforge HCT—the only high blood pressure treatment to combine three medications in a single pill. Novartis Web site. Available at: www.novartis.com/newsroom/media-releases/en/2009/1310474.shtml. Accessed May 7, 2009.
- Phend C. FDA approves triple-drug antihypertensive polypill. Medpage Today Web site. Available at: www.medpagetoday.com/ProductAlert/Prescriptions/14032. Accessed May 7, 2009.
- Neergaard L. FDA backs drug that treats diabetes via the brain. Physorg.com Web site. Available at: www.physorg.com/news160843146.html. Last Accessed May 8, 2009.
- FDA approves Cycloset. Drugs.com Web site. Available at: www.drugs.com/newdrugs/veroscience-announces-fda-approval-cycloset-type-2-diabetes-1344.html. Accessed May 8, 2009.
- FDA approves monthly injectable drug for treating three types of immune-related arthritis. FDA Web site. Available at: www.fda.gov/NewsEvents/Newsroom/PressAnnouncements/ucm149569.htm. Accessed April 24, 2009.
- FDA approves Fanapt to treat schizophrenia. FDA Web site. Available at: www.fda.gov/NewsEvents/Newsroom/PressAnnouncements/ucm149578.htm. Accessed May 7, 2009.
- Testosterone gel safety concerns prompt FDA to require label changes, medication guide. FDA Web site. Available at: www.fda.gov/NewsEvents/Newsroom/PressAnnouncements/ucm149580.htm. Accessed May 12, 2009.
In the Literature
In This Edition
Literature at a Glance
A guide to this month’s studies
- PE and COPD exacerbations.
- Care bundles and readmission rates.
- Family history and VTE risk.
- Vasopressor choice and mortality in sepsis.
- Vitamin K use in overanticoagulation.
- Appropriate treatment of asymptomatic bacteriuria.
- Guideline adherence in thrombocytopenia.
Pulmonary Embolism Frequently Complicates COPD Exacerbations
Clinical question: What percentage of patients with acute chronic obstructive pulmonary disease (COPD) exacerbations has pulmonary emboli?
Background: As many as 30% of COPD exacerbations have no apparent precipitating event. Even in patients with evidence of a precipitating event, such as an upper-respiratory illness or increased environmental irritants, pulmonary emboli (PE) may coexist and warrant evaluation.
Study design: Literature review.
Setting: Multiple studies in Europe and the U.S.
Synopsis: This literature review included five studies to estimate the rate of PE in patients with a COPD exacerbation. Overall incidence of PE in COPD exacerbations was 19.9%, but of those patients requiring hospitalization, the incidence was as high as 25.5%. Incidence estimates varied based on interpretation of data that were missing or inconsistent between studies. Patients most commonly present with dyspnea, chest pain, hemoptysis, cough, and palpitations. Six percent of PE patients presented with syncope; no patients with an exacerbation without a PE presented with syncope.
Risk of mortality from PE is almost twice as high in patients with a COPD exacerbation compared with PE in other settings. A significant number of patients have PE without history or evidence of DVT, so in situ thrombosis is a significant factor. The interpretation of these results is limited by the heterogeneity of the study designs, and by the relatively low number of cases. Larger trials are necessary.
Bottom line: Pulmonary emboli are present in as many as 25% of all COPD exacerbations. Delay in diagnosis of PE in COPD patients affects morbidity and mortality. PE should be a consideration in many COPD exacerbations.
Citation: Rizkallah J, Man SF, Din DD. Prevalence of pulmonary embolism in acute exacerbations of COPD: a systematic review and metaanalysis. Chest. 2009;135(3):786-793.
Targeted-Care Bundle Can Reduce ED Visits and Readmission Rates in High-Risk Elderly Patients
Clinical question: Can a care coordination bundle reduce length of stay (LOS), ED visits, or readmissions within 30 days of a hospital admission?
Background: Hospital-based care coordination interventions have shown mixed results in affecting LOS, post-discharge ED visits, and readmission rates. Although there has been some success with particular interventions, no consistent benefit has been demonstrated. Most notably, a recent meta-analysis of several different interventions showed no improvement in mortality, LOS, or readmission rates.
Study design: A randomized, controlled trial of select high-risk elderly patients.
Setting: A large teaching hospital at Baylor University Medical Center.
Synopsis: A “targeted-care bundle” was implemented with high-risk elderly patients to try to reduce LOS, readmissions, and ED visits. High-risk patients were identified by age, diagnosis-related group (DRG), number of medications at admission, comorbid conditions, and need for assistance in activities of daily living. Subjects were randomized to usual care or to receive a targeted-care bundle. The targeted-care bundle included multiple interventions. A study care coordinator provided daily patient education, including condition-specific teaching, discharge teaching and planning, and a follow-up phone call at five to seven days after discharge. A clinical pharmacist intervened for medication reconciliation at admission and discharge, medication teaching, and a follow-up phone call at five to seven days after discharge. Structured documents, including a personal health record and supplemental discharge form, were implemented.
The study had low enrollment, largely due to the requirement to obtain informed consent from all participants. Therefore, the study was underpowered to detect such target endpoints as LOS. A significant decrease in 30-day readmission rates/ED visits was noticed, but there was no persistent effect at 60 days.
The intervention was designed to use existing hospital staff in order to be practical for broad utilization. Future studies need to focus on increased enrollment to demonstrate beneficial effect.
Bottom line: Targeted health interventions focusing on education and coordination of care might effect some significant outcomes, most notably readmissions or ED visits within 30 days, but the nature of the clinical problem makes rigorous testing of interventions a challenge.
Citation: Kohler BE, Richter KM, Youngblood L, et al. Reduction of 30-day postdischarge hospital readmission or emergency department (ED) visit rates in high-risk elderly medical patients through delivery of a targeted care bundle. J Hosp Med. 2009;4(4):211-218.
Family History Is a Risk Factor for Venous Thrombosis
Clinical question: Is family history of additional value in predicting an individual’s risk of venous thrombosis once a genetic risk factor is identified?
Background: A positive family history of venous thrombosis might suggest the presence of genetic risk factors in a given family. However, it is not known whether family history is of additional significance—once a risk factor is identified—in predicting an individual’s risk for venous thrombosis.
Study design: Population-based, case-control study.
Setting: Participants in the Multiple Environmental and Genetic Assessment (MEGA) of risk factors for venous thrombosis study.
Synopsis: Recruitment, data collection, and blood samples were obtained from individuals in the MEGA study. Participants completed a questionnaire about risk factors for venous thrombosis and family history. A positive family history more than doubled the risk of venous thrombosis, and when more than one family member was affected, the risk increased fourfold. The risk for venous thrombosis increased 64 times for individuals who had a family history, genetic risk factor, and environmental risk factor when compared with those with a negative family history and no known risk factors.
The underreporting or overestimation of the prevalence of a positive family history might limit this study.
Bottom line: Family history is a risk indictor for a first venous thrombosis, despite the presence of other risk factors.
Citation: Bezemer ID, van der Meer FJ, Eikenboom JC, Rosendaal FR, Doggen CJ. The value of family history as a risk indicator for venous thrombosis. Arch Intern Med. 2009;169(6):610-615.
Vasopressor Choice Predicts Mortality in Septic Shock
Clinical question: Does vasopressor choice affect mortality in patients with community-acquired septic shock?
Background: Community-acquired septic shock is a common illness and, despite aggressive care, a leading cause of death. Randomized clinical control trials evaluating the efficacy and safety of different adrenergic supportive agents are lacking. Thus, both norepinephrine and dopamine are recommended as first-line agents in the treatment of septic shock by the Surviving Sepsis Campaign guidelines.
Study design: Multicenter, cohort observational study.
Setting: Seventeen intensive-care units in Portugal.
Synopsis: In adjusted analysis controlling for Simplified Acute Physiology Score (SAPS) II, use of norepinephrine in community-acquired septic shock was associated with higher hospital mortality and lower 28-day survival when compared with dopamine. Specifically, patients treated with norepinephrine had a statistically significant higher hospital mortality rate than those treated with dopamine (52% and 38.5%, respectively, P=0.002) and a lower 28-day survival (log rank=22.6; P<0.001). While this data is valuable, the nonrandomized, observational study design limits firm conclusions regarding vasopressor choice. Further results from three large trials comparing vasopressor use in septic shock should continue to shed light on this debate.
Bottom line: Norepinephrine administration is associated with higher hospital mortality and lower 28-day survival when compared with dopamine in patients with community-acquired septic shock.
Citation: Póvoa PR, Carneiro AH, Ribeiro OS, Pereira AC, Portuguese Community-Acquired Sepsis Study Group. Influence of vasopressor agent in septic shock mortality. Results from the Portuguese Community-Acquired Sepsis Study (SACiUCI study). Crit Care Med. 2009;37(2):410-416.
Oral Vitamin K Versus Placebo to Correct Excess Anticoagulation in Warfarin Patients
Clinical question: In nonbleeding patients with warfarin-associated coagulopathy, does oral vitamin K reduce bleeding events when compared to placebo?
Background: Warfarin is a common drug for primary and secondary prevention of thromboembolism, but it requires continued monitoring of the international normalized ratio (INR) value. INR values >4.0 are associated with an increase in bleeding complications, with specific concern for intracranial bleeding when INR values exceed 4.5. Small, randomized trials have shown that single, low-dose administration of oral vitamin K effectively reduces the INR in nonbleeding, overanticoagulated patients.
However, these studies have not shown if vitamin K reduces risk for bleeding without increasing the risk for thromboembolism.
Study design: Randomized, placebo-controlled trial.
Setting: Fourteen anticoagulation clinics in Canada, Italy, and the U.S.
Synopsis: Nonbleeding patients with supratherapeutic INR values between 4.5 and 10.0 were randomly assigned to receive 1.25 mg of oral vitamin K or placebo, then evaluated for all forms of bleeding for 90 days. Bleeding events were defined as “major bleeding,” “minor bleeding,” and “trivial bleeding.”
Though patients who received oral vitamin K had a significantly more rapid INR decrease, there were no differences between the two groups with regard to all bleeding events, thromboembolism, or death. The study was underpowered to detect differences in major bleeding.
Bottom line: Low-dose oral vitamin K leads to more rapid correction of the INR in overanticoagulated patients on warfarin therapy, but has little effect on clinical outcomes at 90 days.
Citation: Crowther MA, Ageno W, Garcia D, et al. Oral vitamin K versus placebo to correct excessive anticoagulation in patients receiving warfarin: a randomized trial. Ann Intern Med. 2009;150(5):293-300.
Inappropriate Treatment of Catheter-Associated Asymptomatic Bacteriuria
Clinical question: Are hospitalized patients with urinary catheters inappropriately treated with antibiotics for asymptomatic bacteriuria?
Background: Persons with catheters acquire bacteriuria at the rate of 3% to 10% per day, but in the majority of cases, no symptoms or secondary complications occur. Evidenced-based guidelines state that asymptomatic bacteriuria is not a clinically significant infection, and numerous studies have shown that treatment is unlikely to confer clinical benefit.
Study design: Retrospective cohort study.
Setting: A single-site Veterans Affairs hospital.
Synopsis: Using urine culture results over a three-month period from a single VA medical center, 280 cases were analyzed: 164 catheter-associated asymptomatic bacteriuria and 116 catheter-associated urinary tract infections (UTIs). A UTI was defined as having one or more of these symptoms: fever, urgency, frequency, dysuria, suprapubic tenderness, altered mental status, or hypotension in a patient without another recognized infection and a positive urine culture. Of the asymptomatic bacteriuria cases, 68% were managed appropriately with no antibiotic treatment; 32% were inappropriately treated with antibiotics.
In multivariate analysis, older patient age, predominance of gram-negative bacteria, and higher urine white blood cell count were significantly associated with inappropriate treatment.
This study highlights the fact that antibiotics continue to be used inappropriately in patients with catheters. Current guidelines do not distinguish well between asymptomatic bacteriuria and UTI, so there might be a knowledge gap. This study was based on urine culture data, not urinalysis of all patients with a catheter, so the symptomatic patients were likely over-represented.
An associated editorial observes that the study extrapolates data from studies that involved patients with uncomplicated UTIs and, therefore, might reach erroneous conclusions. Further, viewing catheter-associated symptomatic UTIs and catheter-associated asymptomatic bactiuria as dichotomous and warranting inherently different management fails to encompass a number of clinical factors, including co-infection, and further fails to acknowledge that removal of the catheter is the first step in treatment. However, the finding that antibiotics continue to be used inappropriately is useful.
Bottom line: A clinical determination of whether a patient with a catheter really has a symptomatic UTI/urosepsis or only has asymptomatic bacteriuria should precede starting antibiotics in hospitalized patients.
Citations: Cope M, Cevallos ME, Cadle RM, Darouiche RO, Musher DM, Trautner BW. Inappropriate treatment of catheter-associated asymptomatic bateriuria in a tertiary care hospital. Clin Infect Dis. 2009;48(9):1182-1188.
Kunin CM. Catheter-associated urinary tract infections: a syllogism compounded by a questionable dichotomy. Clin Infect Dis. 2009;48:1189-1190.
Current Practices in the Evaluation and Management of Thrombocytopenia in Heparin Patients
Clinical question: Are the current American College of Chest Physicians (ACCP) guidelines for the recognition, treatment, and prevention of heparin-induced thrombocytopenia (HIT) being followed?
Background: Heparin-based anticoagulation is frequently given to hospitalized patients, and approximately 1% to 5% of these patients develop HIT. In 2004, the ACCP published a consensus statement on the evaluation, management, and prevention of HIT.
Study design: Prospective, observational study.
Setting: Forty-eight U.S. hospitals in the Complications After Thrombocytopenia Caused by Heparin (CATCH) registry.
Synopsis: The CATCH trial enrolled patients receiving any form of heparin for >96 hours (n=2,420), cardiac-care-unit patients treated with heparin (n=1,090), and patients who had an HIT antibody assay performed (n=449), for a total of 3,536 total patients. The study included patients on unfractionated heparin (UFH) or low-molecular-weight heparin (LMWH). Thrombocytopenia was defined at a platelet count <150,000, or a decrease of 50% when compared with admission.
In the prolonged heparin group, 36.4% of patients developed thrombocytopenia; however, HIT was suspected in only 19.8% of these high-risk patients. While physicians were more likely to consider HIT in the cardiac-care patients (37.6%), the diagnosis was considered>24 hours after the thrombocytopenia developed. Physicians often waited until after a thromboembolic complication occurred before evaluating for HIT. More often than not, preventive measures were missed (e.g., failing to check for HIT antibodies, continuing heparin after HIT was suspected).
Bottom line: Thrombocytopenia is a common occurrence in patients receiving heparin and, despite the risk of devastating complications from HIT, treatment infrequently conforms to the established guidelines.
Citation: Crespo EM, Oliveira GBF, Honeycutt EF, et al. Evaluation and management of thrombocytopenia and suspected heparin-induced thrombocytopenia in hospitalized patients: The Complications After Thrombocytopenia Caused by Heparin (CATCH) registry. Am Heart J. 2009;157(4):651-657. TH
PEDIATRIC HM LITerature
Epinephrine and Dexamethasone Alone Do Not Reduce Hospital Admissions in Infants with Bronchiolitis
By Mark Shen, MD

Clinical question: Does nebulized epinephrine, oral dexamethasone, or a combination of the two result in a decrease in hospital admissions when given in the ED to infants with bronchiolitis?
Background: Bronchiolitis is the most common lower-respiratory-tract infection of infancy. Rates of admission have climbed in the past two decades. Bronchodilators and corticosteroids are not routinely recommended, and the evidence surrounding epinephrine and dexamethasone has shown varying results.
Study design: Randomized, double-blind, placebo-controlled trial.
Setting: Eight Canadian pediatric EDs.
Synopsis: Eight hundred infants ages six weeks to 12 months with a first episode of bronchiolitis were randomized to nebulized epinephrine and oral dexamethasone, epinephrine and oral placebo, dexamethasone and nebulized placebo, or oral and nebulized placebo. Epinephrine was delivered as two nebulizations 30 minutes apart, and dexamethasone was given as a 1 mg/kg oral dose, followed by five once-daily doses of 0.6 mg/kg. In unadjusted analysis, only the infants who received epinephrine and dexamethasone were less likely to be admitted to the hospital by day seven.
Limitations of this study include a small effect size and a non-statistically-significant difference between the epinephrine/dexamethasone group and placebo after statistical adjustment for multiple comparisons. Given that admission rates did not decrease in the epinephrine/placebo group and the dexamethasone/placebo group, this study supports national guidelines that do not recommend the routine use of these agents in bronchiolitis. The authors suggest that synergy between epinephrine and dexamethasone in bronchiolitis be further studied.
Bottom line: When given alone, epinephrine and dexamethasone do not reduce hospital admissions in infants with bronchiolitis.
Citation: Plint AC, Johnson DW, Patel H, et al. Epinephrine and dexamethasone in children with bronchiolitis. N Engl J Med. 2009;360(20):2079-2089.
Reviewed by Pediatric Editor Mark Shen, MD, medical director of hospital medicine at Dell Children’s Medical Center, Austin, Texas.
In This Edition
Literature at a Glance
A guide to this month’s studies
- PE and COPD exacerbations.
- Care bundles and readmission rates.
- Family history and VTE risk.
- Vasopressor choice and mortality in sepsis.
- Vitamin K use in overanticoagulation.
- Appropriate treatment of asymptomatic bacteriuria.
- Guideline adherence in thrombocytopenia.
Pulmonary Embolism Frequently Complicates COPD Exacerbations
Clinical question: What percentage of patients with acute chronic obstructive pulmonary disease (COPD) exacerbations has pulmonary emboli?
Background: As many as 30% of COPD exacerbations have no apparent precipitating event. Even in patients with evidence of a precipitating event, such as an upper-respiratory illness or increased environmental irritants, pulmonary emboli (PE) may coexist and warrant evaluation.
Study design: Literature review.
Setting: Multiple studies in Europe and the U.S.
Synopsis: This literature review included five studies to estimate the rate of PE in patients with a COPD exacerbation. Overall incidence of PE in COPD exacerbations was 19.9%, but of those patients requiring hospitalization, the incidence was as high as 25.5%. Incidence estimates varied based on interpretation of data that were missing or inconsistent between studies. Patients most commonly present with dyspnea, chest pain, hemoptysis, cough, and palpitations. Six percent of PE patients presented with syncope; no patients with an exacerbation without a PE presented with syncope.
Risk of mortality from PE is almost twice as high in patients with a COPD exacerbation compared with PE in other settings. A significant number of patients have PE without history or evidence of DVT, so in situ thrombosis is a significant factor. The interpretation of these results is limited by the heterogeneity of the study designs, and by the relatively low number of cases. Larger trials are necessary.
Bottom line: Pulmonary emboli are present in as many as 25% of all COPD exacerbations. Delay in diagnosis of PE in COPD patients affects morbidity and mortality. PE should be a consideration in many COPD exacerbations.
Citation: Rizkallah J, Man SF, Din DD. Prevalence of pulmonary embolism in acute exacerbations of COPD: a systematic review and metaanalysis. Chest. 2009;135(3):786-793.
Targeted-Care Bundle Can Reduce ED Visits and Readmission Rates in High-Risk Elderly Patients
Clinical question: Can a care coordination bundle reduce length of stay (LOS), ED visits, or readmissions within 30 days of a hospital admission?
Background: Hospital-based care coordination interventions have shown mixed results in affecting LOS, post-discharge ED visits, and readmission rates. Although there has been some success with particular interventions, no consistent benefit has been demonstrated. Most notably, a recent meta-analysis of several different interventions showed no improvement in mortality, LOS, or readmission rates.
Study design: A randomized, controlled trial of select high-risk elderly patients.
Setting: A large teaching hospital at Baylor University Medical Center.
Synopsis: A “targeted-care bundle” was implemented with high-risk elderly patients to try to reduce LOS, readmissions, and ED visits. High-risk patients were identified by age, diagnosis-related group (DRG), number of medications at admission, comorbid conditions, and need for assistance in activities of daily living. Subjects were randomized to usual care or to receive a targeted-care bundle. The targeted-care bundle included multiple interventions. A study care coordinator provided daily patient education, including condition-specific teaching, discharge teaching and planning, and a follow-up phone call at five to seven days after discharge. A clinical pharmacist intervened for medication reconciliation at admission and discharge, medication teaching, and a follow-up phone call at five to seven days after discharge. Structured documents, including a personal health record and supplemental discharge form, were implemented.
The study had low enrollment, largely due to the requirement to obtain informed consent from all participants. Therefore, the study was underpowered to detect such target endpoints as LOS. A significant decrease in 30-day readmission rates/ED visits was noticed, but there was no persistent effect at 60 days.
The intervention was designed to use existing hospital staff in order to be practical for broad utilization. Future studies need to focus on increased enrollment to demonstrate beneficial effect.
Bottom line: Targeted health interventions focusing on education and coordination of care might effect some significant outcomes, most notably readmissions or ED visits within 30 days, but the nature of the clinical problem makes rigorous testing of interventions a challenge.
Citation: Kohler BE, Richter KM, Youngblood L, et al. Reduction of 30-day postdischarge hospital readmission or emergency department (ED) visit rates in high-risk elderly medical patients through delivery of a targeted care bundle. J Hosp Med. 2009;4(4):211-218.
Family History Is a Risk Factor for Venous Thrombosis
Clinical question: Is family history of additional value in predicting an individual’s risk of venous thrombosis once a genetic risk factor is identified?
Background: A positive family history of venous thrombosis might suggest the presence of genetic risk factors in a given family. However, it is not known whether family history is of additional significance—once a risk factor is identified—in predicting an individual’s risk for venous thrombosis.
Study design: Population-based, case-control study.
Setting: Participants in the Multiple Environmental and Genetic Assessment (MEGA) of risk factors for venous thrombosis study.
Synopsis: Recruitment, data collection, and blood samples were obtained from individuals in the MEGA study. Participants completed a questionnaire about risk factors for venous thrombosis and family history. A positive family history more than doubled the risk of venous thrombosis, and when more than one family member was affected, the risk increased fourfold. The risk for venous thrombosis increased 64 times for individuals who had a family history, genetic risk factor, and environmental risk factor when compared with those with a negative family history and no known risk factors.
The underreporting or overestimation of the prevalence of a positive family history might limit this study.
Bottom line: Family history is a risk indictor for a first venous thrombosis, despite the presence of other risk factors.
Citation: Bezemer ID, van der Meer FJ, Eikenboom JC, Rosendaal FR, Doggen CJ. The value of family history as a risk indicator for venous thrombosis. Arch Intern Med. 2009;169(6):610-615.
Vasopressor Choice Predicts Mortality in Septic Shock
Clinical question: Does vasopressor choice affect mortality in patients with community-acquired septic shock?
Background: Community-acquired septic shock is a common illness and, despite aggressive care, a leading cause of death. Randomized clinical control trials evaluating the efficacy and safety of different adrenergic supportive agents are lacking. Thus, both norepinephrine and dopamine are recommended as first-line agents in the treatment of septic shock by the Surviving Sepsis Campaign guidelines.
Study design: Multicenter, cohort observational study.
Setting: Seventeen intensive-care units in Portugal.
Synopsis: In adjusted analysis controlling for Simplified Acute Physiology Score (SAPS) II, use of norepinephrine in community-acquired septic shock was associated with higher hospital mortality and lower 28-day survival when compared with dopamine. Specifically, patients treated with norepinephrine had a statistically significant higher hospital mortality rate than those treated with dopamine (52% and 38.5%, respectively, P=0.002) and a lower 28-day survival (log rank=22.6; P<0.001). While this data is valuable, the nonrandomized, observational study design limits firm conclusions regarding vasopressor choice. Further results from three large trials comparing vasopressor use in septic shock should continue to shed light on this debate.
Bottom line: Norepinephrine administration is associated with higher hospital mortality and lower 28-day survival when compared with dopamine in patients with community-acquired septic shock.
Citation: Póvoa PR, Carneiro AH, Ribeiro OS, Pereira AC, Portuguese Community-Acquired Sepsis Study Group. Influence of vasopressor agent in septic shock mortality. Results from the Portuguese Community-Acquired Sepsis Study (SACiUCI study). Crit Care Med. 2009;37(2):410-416.
Oral Vitamin K Versus Placebo to Correct Excess Anticoagulation in Warfarin Patients
Clinical question: In nonbleeding patients with warfarin-associated coagulopathy, does oral vitamin K reduce bleeding events when compared to placebo?
Background: Warfarin is a common drug for primary and secondary prevention of thromboembolism, but it requires continued monitoring of the international normalized ratio (INR) value. INR values >4.0 are associated with an increase in bleeding complications, with specific concern for intracranial bleeding when INR values exceed 4.5. Small, randomized trials have shown that single, low-dose administration of oral vitamin K effectively reduces the INR in nonbleeding, overanticoagulated patients.
However, these studies have not shown if vitamin K reduces risk for bleeding without increasing the risk for thromboembolism.
Study design: Randomized, placebo-controlled trial.
Setting: Fourteen anticoagulation clinics in Canada, Italy, and the U.S.
Synopsis: Nonbleeding patients with supratherapeutic INR values between 4.5 and 10.0 were randomly assigned to receive 1.25 mg of oral vitamin K or placebo, then evaluated for all forms of bleeding for 90 days. Bleeding events were defined as “major bleeding,” “minor bleeding,” and “trivial bleeding.”
Though patients who received oral vitamin K had a significantly more rapid INR decrease, there were no differences between the two groups with regard to all bleeding events, thromboembolism, or death. The study was underpowered to detect differences in major bleeding.
Bottom line: Low-dose oral vitamin K leads to more rapid correction of the INR in overanticoagulated patients on warfarin therapy, but has little effect on clinical outcomes at 90 days.
Citation: Crowther MA, Ageno W, Garcia D, et al. Oral vitamin K versus placebo to correct excessive anticoagulation in patients receiving warfarin: a randomized trial. Ann Intern Med. 2009;150(5):293-300.
Inappropriate Treatment of Catheter-Associated Asymptomatic Bacteriuria
Clinical question: Are hospitalized patients with urinary catheters inappropriately treated with antibiotics for asymptomatic bacteriuria?
Background: Persons with catheters acquire bacteriuria at the rate of 3% to 10% per day, but in the majority of cases, no symptoms or secondary complications occur. Evidenced-based guidelines state that asymptomatic bacteriuria is not a clinically significant infection, and numerous studies have shown that treatment is unlikely to confer clinical benefit.
Study design: Retrospective cohort study.
Setting: A single-site Veterans Affairs hospital.
Synopsis: Using urine culture results over a three-month period from a single VA medical center, 280 cases were analyzed: 164 catheter-associated asymptomatic bacteriuria and 116 catheter-associated urinary tract infections (UTIs). A UTI was defined as having one or more of these symptoms: fever, urgency, frequency, dysuria, suprapubic tenderness, altered mental status, or hypotension in a patient without another recognized infection and a positive urine culture. Of the asymptomatic bacteriuria cases, 68% were managed appropriately with no antibiotic treatment; 32% were inappropriately treated with antibiotics.
In multivariate analysis, older patient age, predominance of gram-negative bacteria, and higher urine white blood cell count were significantly associated with inappropriate treatment.
This study highlights the fact that antibiotics continue to be used inappropriately in patients with catheters. Current guidelines do not distinguish well between asymptomatic bacteriuria and UTI, so there might be a knowledge gap. This study was based on urine culture data, not urinalysis of all patients with a catheter, so the symptomatic patients were likely over-represented.
An associated editorial observes that the study extrapolates data from studies that involved patients with uncomplicated UTIs and, therefore, might reach erroneous conclusions. Further, viewing catheter-associated symptomatic UTIs and catheter-associated asymptomatic bactiuria as dichotomous and warranting inherently different management fails to encompass a number of clinical factors, including co-infection, and further fails to acknowledge that removal of the catheter is the first step in treatment. However, the finding that antibiotics continue to be used inappropriately is useful.
Bottom line: A clinical determination of whether a patient with a catheter really has a symptomatic UTI/urosepsis or only has asymptomatic bacteriuria should precede starting antibiotics in hospitalized patients.
Citations: Cope M, Cevallos ME, Cadle RM, Darouiche RO, Musher DM, Trautner BW. Inappropriate treatment of catheter-associated asymptomatic bateriuria in a tertiary care hospital. Clin Infect Dis. 2009;48(9):1182-1188.
Kunin CM. Catheter-associated urinary tract infections: a syllogism compounded by a questionable dichotomy. Clin Infect Dis. 2009;48:1189-1190.
Current Practices in the Evaluation and Management of Thrombocytopenia in Heparin Patients
Clinical question: Are the current American College of Chest Physicians (ACCP) guidelines for the recognition, treatment, and prevention of heparin-induced thrombocytopenia (HIT) being followed?
Background: Heparin-based anticoagulation is frequently given to hospitalized patients, and approximately 1% to 5% of these patients develop HIT. In 2004, the ACCP published a consensus statement on the evaluation, management, and prevention of HIT.
Study design: Prospective, observational study.
Setting: Forty-eight U.S. hospitals in the Complications After Thrombocytopenia Caused by Heparin (CATCH) registry.
Synopsis: The CATCH trial enrolled patients receiving any form of heparin for >96 hours (n=2,420), cardiac-care-unit patients treated with heparin (n=1,090), and patients who had an HIT antibody assay performed (n=449), for a total of 3,536 total patients. The study included patients on unfractionated heparin (UFH) or low-molecular-weight heparin (LMWH). Thrombocytopenia was defined at a platelet count <150,000, or a decrease of 50% when compared with admission.
In the prolonged heparin group, 36.4% of patients developed thrombocytopenia; however, HIT was suspected in only 19.8% of these high-risk patients. While physicians were more likely to consider HIT in the cardiac-care patients (37.6%), the diagnosis was considered>24 hours after the thrombocytopenia developed. Physicians often waited until after a thromboembolic complication occurred before evaluating for HIT. More often than not, preventive measures were missed (e.g., failing to check for HIT antibodies, continuing heparin after HIT was suspected).
Bottom line: Thrombocytopenia is a common occurrence in patients receiving heparin and, despite the risk of devastating complications from HIT, treatment infrequently conforms to the established guidelines.
Citation: Crespo EM, Oliveira GBF, Honeycutt EF, et al. Evaluation and management of thrombocytopenia and suspected heparin-induced thrombocytopenia in hospitalized patients: The Complications After Thrombocytopenia Caused by Heparin (CATCH) registry. Am Heart J. 2009;157(4):651-657. TH
PEDIATRIC HM LITerature
Epinephrine and Dexamethasone Alone Do Not Reduce Hospital Admissions in Infants with Bronchiolitis
By Mark Shen, MD
Clinical question: Does nebulized epinephrine, oral dexamethasone, or a combination of the two result in a decrease in hospital admissions when given in the ED to infants with bronchiolitis?
Background: Bronchiolitis is the most common lower-respiratory-tract infection of infancy. Rates of admission have climbed in the past two decades. Bronchodilators and corticosteroids are not routinely recommended, and the evidence surrounding epinephrine and dexamethasone has shown varying results.
Study design: Randomized, double-blind, placebo-controlled trial.
Setting: Eight Canadian pediatric EDs.
Synopsis: Eight hundred infants ages six weeks to 12 months with a first episode of bronchiolitis were randomized to nebulized epinephrine and oral dexamethasone, epinephrine and oral placebo, dexamethasone and nebulized placebo, or oral and nebulized placebo. Epinephrine was delivered as two nebulizations 30 minutes apart, and dexamethasone was given as a 1 mg/kg oral dose, followed by five once-daily doses of 0.6 mg/kg. In unadjusted analysis, only the infants who received epinephrine and dexamethasone were less likely to be admitted to the hospital by day seven.
Limitations of this study include a small effect size and a non-statistically-significant difference between the epinephrine/dexamethasone group and placebo after statistical adjustment for multiple comparisons. Given that admission rates did not decrease in the epinephrine/placebo group and the dexamethasone/placebo group, this study supports national guidelines that do not recommend the routine use of these agents in bronchiolitis. The authors suggest that synergy between epinephrine and dexamethasone in bronchiolitis be further studied.
Bottom line: When given alone, epinephrine and dexamethasone do not reduce hospital admissions in infants with bronchiolitis.
Citation: Plint AC, Johnson DW, Patel H, et al. Epinephrine and dexamethasone in children with bronchiolitis. N Engl J Med. 2009;360(20):2079-2089.
Reviewed by Pediatric Editor Mark Shen, MD, medical director of hospital medicine at Dell Children’s Medical Center, Austin, Texas.
Lessons in Leadership
For hospitalists attending SHM’s Leadership Academy, the final day isn’t the end of the experience. It’s just the beginning.
Now in its fifth year, the Leadership Academy provides hospitalists of all backgrounds the opportunity to come together and address the managerial and practical issues of HM that aren’t covered in medical school. The demand for leadership training within the specialty has been so great that the Leadership Academy is now split into two levels; Level II is reserved for hospitalists who have completed the Level I program or have an MBA.
Level I covers the fundamental elements for leading groups—and change—within a hospital. Hospitalists learn how to take on leadership roles, better understand group dynamics, manage conflict, and improve communication.
Level II, which traditionally has had smaller class sizes, goes deeper into managerial issues that relate to hospital administration and leadership. The advanced program features such all-day sessions as “Financial Storytelling” and the popular “Meta-Leadership in Hospital Medicine.”
Leadership Academy’s true impact is felt shortly after hospitalists return to their hospitals. “Hospitalists send e-mails within a week of the end of Leadership Academy,” says Larry Wellikson, MD, FHM, CEO of SHM. “They tell us about the tangible actions that they’ve already taken as a result of what they’ve learned over the four days of Leadership Academy. … In just a few days, hospitalists learn from some of the best in the specialty and thought leaders outside of the field, too.”
—Rachel George, MD, regional medical director, vice president of operations, Cogent Healthcare, Brentwood, Tenn.
Immediate Results
Hospitalists—and those who work with them—often see the change the academy has on a physician soon after the attendee returns to work. “It’s like a light bulb goes on,” says Rachel George, MD, regional medical director and vice president for operations at Brentwood, Tenn.-based Cogent Healthcare. “They get it. They come back from the Leadership Academy with an understanding of how to lead their own groups and manage through change.”
Dr. George, who attended Level I and Level II programs and now facilitates academy sessions, says Leadership Academy is “almost mandatory” for Cogent’s medical directors. The company encourages all of its physicians to attend.
One of the most valuable aspects of the program, she says, is the long-term impact. Dr. George completed the advanced course in 2005 and still enjoys catching up with her fellow academy attendees, as well as learning about what they have achieved in the subsequent years. Many classmates have become medical directors, and she says they credit the academy for many of the positive changes in their groups.
“It’s absolutely worth it,” she says. “Both levels are worth the time and investment. And ‘leadership’ doesn’t necessarily mean being a leader of your group. It can also mean being a leader of change and initiatives within the hospital.”

Active Training for Active Leaders
Although the word “academy” might conjure ideas of long-winded seminars or Socratic debate, SHM’s Leadership Academy emphasizes a hands-on learning style. Hospitalists are divided into groups to tackle real-world issues that affect hospitals, hospitalists, and patients, such as QI initiatives and ED throughput.
The courses feature some of the most engaging speakers in HM and insightful presentations from experts outside of the specialty.
The faculty also includes nonphysicians; for example, Tim Keogh, PhD, who teaches postgraduate managerial communications at The Citadel School of Business Administration in Charleston, S.C., and Tulane University’s School of Public Health and Tropical Medicine in New Orleans, offers a unique perspective to hospitalists who are often accustomed to learning only from those within the specialty.
Young Specialty Grows Leaders
The Leadership Academy’s origins stem from HM’s youthful roots; the average age of a hospitalist is 40, and the average age of a hospitalist leader is 43, according to SHM’s 2007-2008 “Bi-Annual Survey on the State of the Hospital Medicine Movement.” Unlike more established medical fields, HM is in the unique position of cultivating the first generation of the specialty’s leadership. Through mentorship and motivation, the academy is arming hospitalists with the tools they’ll need to become leaders in a still-developing field.
Individuals within HM benefit from leadership training, too. “I see Leadership Academy as filling a real void in hospital medicine,” Dr. George says. “We’re still a young profession. We don’t have a lot of gray hair in the field, but we’re in the unusual position to work closely with hospital administrators.”
That paradigm means hospitalists have to learn to speak the language of administration, she says. And they need to learn it quick if they want to create real change and value. For Dr. George, who sees the academy’s impact from the hospitalist and executive perspectives, the academy prepares hospitalists to fill a necessary role in the hospital.
“As a relatively new profession, we still have to prove ourselves on a regular basis,” she says. TH
Brendon Shank is a freelance writer based in Philadelphia.
Chapter Updates
Southwest Wisconsin Chapter

Hospitalists from five HM groups met May 7 in Madison. Julia Wright, MD, FHM, clinical associate professor of medicine and director of hospital medicine at the University of Wisconsin School of Medicine and Public Health in Madison, spoke about “The State of Hospital Medicine.” Her presentation included an exploration of factors that influence and drive the specialty, as well as a look at HM demographics.
Northern Nevada
The Northern Nevada chapter met April 7 at the Charlie Palmer Steakhouse in Reno. The 36 attendees represented five HM groups. The meeting topic was “Difficult Decisions in Anticoagulation,” with guest speaker Christine Tankersley, PharmD, from Sanofi-Aventis Pharmaceuticals.
The chapter provided Tankersley with several real-patient cases that involved challenging decisions, and she led a step-wise discussion within the context of new American College of Clinial Pharmacy guidelines for anticoagulation.
Chapter President Phil Goodman, MD, FHM, stressed the importance of joining SHM and attending the annual meeting. It was decided to continue the community SHM journal club, which enjoyed a successful debut in September 2008, with 15 attendees reviewing a pair of New England Journal of Medicine articles at P.F. Chang’s in Reno.
Annual chapter elections were planned for the next meeting.
Long Island
The March 19 meeting provided SHM updates on the national meeting, advancement to fellowship opportunities, and a call to encourage HM group leaders to promote SHM membership.
A presentation on antibiotic stewardship revealed data on the improved clinical and economical outcomes of such a program in the hospital setting.
Connecticut
Joseph Ming-Wah Li, MD, FHM, director of the hospital medicine program at Beth Israel Deaconess Medical Center in Boston and an SHM board member, spoke at the March 25 chapter meeting. He discussed the exponential growth of HM as a specialty and reviewed data on hospitalist numbers past, present, and future.
Dr. Li also analyzed data from SHM’s 2007-2008 “Bi-Annual Survey on the State of Hospital Medicine,” and provided benchmarks for hospitalist productivity, night scheduling, administrative work, use of physician extenders, and residents.
Dr. Li’s talk was followed by a presentation on billing-capture software by Courtney Shickel from Ingenious Med Company. The demonstration touted the benefits of using the software for charge capture and some quality measures. The data showed the software can increase hospital revenues within 30 to 60 days of implementation, and lost charges were almost completely mitigated.
Upstate South Carolina
The March 19 meeting brought together nearly 20 attendees representing five hospitals in upstate South Carolina. Bruce Friedman, MD, of Doctor’s Hospital presented information on doripenem (Doribax).
Following the presentation, chapter President Imran Shaikh, MD, a hospitalist with Inpatient Medicine Service, directed the business meeting. Members discussed development of a chapter newsletter as well as an online forum to allow discussion of clinical and administrative issues.
Sanjeev Kumar, MD, a hospitalist with Hospital Medicine Consultants, will query members as to which portal would be most accessible to members, then proceed with establishing the forum.
Georgia Coastal

The April 16 chapter meeting featured SHM board member and president-elect Jeff Wiese, MD, FHM, speaking on the direction of HM and the progress of a board certification in hospital medicine.
This meeting was well attended by SHM members, including physician assistants and nurse practitioners.
For hospitalists attending SHM’s Leadership Academy, the final day isn’t the end of the experience. It’s just the beginning.
Now in its fifth year, the Leadership Academy provides hospitalists of all backgrounds the opportunity to come together and address the managerial and practical issues of HM that aren’t covered in medical school. The demand for leadership training within the specialty has been so great that the Leadership Academy is now split into two levels; Level II is reserved for hospitalists who have completed the Level I program or have an MBA.
Level I covers the fundamental elements for leading groups—and change—within a hospital. Hospitalists learn how to take on leadership roles, better understand group dynamics, manage conflict, and improve communication.
Level II, which traditionally has had smaller class sizes, goes deeper into managerial issues that relate to hospital administration and leadership. The advanced program features such all-day sessions as “Financial Storytelling” and the popular “Meta-Leadership in Hospital Medicine.”
Leadership Academy’s true impact is felt shortly after hospitalists return to their hospitals. “Hospitalists send e-mails within a week of the end of Leadership Academy,” says Larry Wellikson, MD, FHM, CEO of SHM. “They tell us about the tangible actions that they’ve already taken as a result of what they’ve learned over the four days of Leadership Academy. … In just a few days, hospitalists learn from some of the best in the specialty and thought leaders outside of the field, too.”
—Rachel George, MD, regional medical director, vice president of operations, Cogent Healthcare, Brentwood, Tenn.
Immediate Results
Hospitalists—and those who work with them—often see the change the academy has on a physician soon after the attendee returns to work. “It’s like a light bulb goes on,” says Rachel George, MD, regional medical director and vice president for operations at Brentwood, Tenn.-based Cogent Healthcare. “They get it. They come back from the Leadership Academy with an understanding of how to lead their own groups and manage through change.”
Dr. George, who attended Level I and Level II programs and now facilitates academy sessions, says Leadership Academy is “almost mandatory” for Cogent’s medical directors. The company encourages all of its physicians to attend.
One of the most valuable aspects of the program, she says, is the long-term impact. Dr. George completed the advanced course in 2005 and still enjoys catching up with her fellow academy attendees, as well as learning about what they have achieved in the subsequent years. Many classmates have become medical directors, and she says they credit the academy for many of the positive changes in their groups.
“It’s absolutely worth it,” she says. “Both levels are worth the time and investment. And ‘leadership’ doesn’t necessarily mean being a leader of your group. It can also mean being a leader of change and initiatives within the hospital.”
Active Training for Active Leaders
Although the word “academy” might conjure ideas of long-winded seminars or Socratic debate, SHM’s Leadership Academy emphasizes a hands-on learning style. Hospitalists are divided into groups to tackle real-world issues that affect hospitals, hospitalists, and patients, such as QI initiatives and ED throughput.
The courses feature some of the most engaging speakers in HM and insightful presentations from experts outside of the specialty.
The faculty also includes nonphysicians; for example, Tim Keogh, PhD, who teaches postgraduate managerial communications at The Citadel School of Business Administration in Charleston, S.C., and Tulane University’s School of Public Health and Tropical Medicine in New Orleans, offers a unique perspective to hospitalists who are often accustomed to learning only from those within the specialty.
Young Specialty Grows Leaders
The Leadership Academy’s origins stem from HM’s youthful roots; the average age of a hospitalist is 40, and the average age of a hospitalist leader is 43, according to SHM’s 2007-2008 “Bi-Annual Survey on the State of the Hospital Medicine Movement.” Unlike more established medical fields, HM is in the unique position of cultivating the first generation of the specialty’s leadership. Through mentorship and motivation, the academy is arming hospitalists with the tools they’ll need to become leaders in a still-developing field.
Individuals within HM benefit from leadership training, too. “I see Leadership Academy as filling a real void in hospital medicine,” Dr. George says. “We’re still a young profession. We don’t have a lot of gray hair in the field, but we’re in the unusual position to work closely with hospital administrators.”
That paradigm means hospitalists have to learn to speak the language of administration, she says. And they need to learn it quick if they want to create real change and value. For Dr. George, who sees the academy’s impact from the hospitalist and executive perspectives, the academy prepares hospitalists to fill a necessary role in the hospital.
“As a relatively new profession, we still have to prove ourselves on a regular basis,” she says. TH
Brendon Shank is a freelance writer based in Philadelphia.
Chapter Updates
Southwest Wisconsin Chapter
Hospitalists from five HM groups met May 7 in Madison. Julia Wright, MD, FHM, clinical associate professor of medicine and director of hospital medicine at the University of Wisconsin School of Medicine and Public Health in Madison, spoke about “The State of Hospital Medicine.” Her presentation included an exploration of factors that influence and drive the specialty, as well as a look at HM demographics.
Northern Nevada
The Northern Nevada chapter met April 7 at the Charlie Palmer Steakhouse in Reno. The 36 attendees represented five HM groups. The meeting topic was “Difficult Decisions in Anticoagulation,” with guest speaker Christine Tankersley, PharmD, from Sanofi-Aventis Pharmaceuticals.
The chapter provided Tankersley with several real-patient cases that involved challenging decisions, and she led a step-wise discussion within the context of new American College of Clinial Pharmacy guidelines for anticoagulation.
Chapter President Phil Goodman, MD, FHM, stressed the importance of joining SHM and attending the annual meeting. It was decided to continue the community SHM journal club, which enjoyed a successful debut in September 2008, with 15 attendees reviewing a pair of New England Journal of Medicine articles at P.F. Chang’s in Reno.
Annual chapter elections were planned for the next meeting.
Long Island
The March 19 meeting provided SHM updates on the national meeting, advancement to fellowship opportunities, and a call to encourage HM group leaders to promote SHM membership.
A presentation on antibiotic stewardship revealed data on the improved clinical and economical outcomes of such a program in the hospital setting.
Connecticut
Joseph Ming-Wah Li, MD, FHM, director of the hospital medicine program at Beth Israel Deaconess Medical Center in Boston and an SHM board member, spoke at the March 25 chapter meeting. He discussed the exponential growth of HM as a specialty and reviewed data on hospitalist numbers past, present, and future.
Dr. Li also analyzed data from SHM’s 2007-2008 “Bi-Annual Survey on the State of Hospital Medicine,” and provided benchmarks for hospitalist productivity, night scheduling, administrative work, use of physician extenders, and residents.
Dr. Li’s talk was followed by a presentation on billing-capture software by Courtney Shickel from Ingenious Med Company. The demonstration touted the benefits of using the software for charge capture and some quality measures. The data showed the software can increase hospital revenues within 30 to 60 days of implementation, and lost charges were almost completely mitigated.
Upstate South Carolina
The March 19 meeting brought together nearly 20 attendees representing five hospitals in upstate South Carolina. Bruce Friedman, MD, of Doctor’s Hospital presented information on doripenem (Doribax).
Following the presentation, chapter President Imran Shaikh, MD, a hospitalist with Inpatient Medicine Service, directed the business meeting. Members discussed development of a chapter newsletter as well as an online forum to allow discussion of clinical and administrative issues.
Sanjeev Kumar, MD, a hospitalist with Hospital Medicine Consultants, will query members as to which portal would be most accessible to members, then proceed with establishing the forum.
Georgia Coastal
The April 16 chapter meeting featured SHM board member and president-elect Jeff Wiese, MD, FHM, speaking on the direction of HM and the progress of a board certification in hospital medicine.
This meeting was well attended by SHM members, including physician assistants and nurse practitioners.
JHM Makes Immediate Industry Impact

On June 19, the Journal of Hospital Medicine (JHM) received a higher-than-expected first Impact Factor score, the measure of citations received in 2008 to articles published in 2006 and 2007. The 3.613 initial score ranks JHM No. 21 out of 107 journals in the Internal and General Medicine subject category.
Impact Factor scores are used as a proxy for the importance of a journal to its field. Academic researchers are evaluated on the “impact” of their publications based on this score.
“There are journals that are 20 years old that don’t have impact factors as high as we do,” says Mark V. Williams, MD, FACP, FHM, professor and chief of the division of hospital medicine at Northwestern University’s Feinberg School of Medicine in Chicago and editor of JHM. “Hopefully, this will lead to academicians across the world being interested in submitting their scholarly work.”
JHM’s top-cited source is Core Competencies in Hospital Medicine: A Framework for Curriculum Development (www.hospitalmedicine.org/ResourceRoomRedesign/RR_Main/html/Core_Competencies.cfm). The clinical content is an essential tool for practicing hospitalists, providing guidance in the areas of clinical conditions, procedures, healthcare systems, development, and methodology.
“SHM is very proud of our journal, JHM, and getting such a sterling impact factor is a further acknowledgement of JHM’s credibility, reach, and world-class content,” says Larry Wellikson, MD, FHM, CEO of SHM. TH
Freelance Writer Richard Quinn contributed to this report.
Letters
SHM Should Support Reform Measures to Medicare System
As part of healthcare reform, I believe SHM should support the following ideas for Medicare reform:
- Primary-care physician (PCP) reimbursement should increase by 25%;
- Surgical reimbursement should decrease by 10%;
- Medical subspecialist reimbursement should decrease by 10%;
- All HIV/AIDS patients should be covered under Medicaid;
- All end-stage renal disease (ESRD) should be covered under Medicaid;
- Community health center funding should be covered under Medicaid;
- Children’s Health Insurance Plan (CHIP) funding should not come out of the Medicare fund;
- National Institutes of Health (NIH) funding should not come out of the Medicare fund;
- The Medicare tax on income before deductions should have no income ceiling; and
- The Social Security tax should be higher for those earning more than $250,000 per year before any deductions.
These changes would strengthen the Medicare fund to provide for our senior citizens’ healthcare and retirement. The above will be better than budget-neutral. Those to be covered (above) under Medicaid (HIV, ESRD, CHC, etc.) will actually have to pay less out of pocket for medications, services, procedures, and hospitalization.
The disproportionately low reimbursement to PCPs would be partially corrected in line with the medical home program concept. Partial financial correction of the overcompensated specialists and procedurists who dominate the rate commission would be accomplished with only a small amount of financial distress, which PCPs have been suffering for more than a decade.
Robert Beshany, MD,
SHM charter member,
Colorado Springs, Colo.
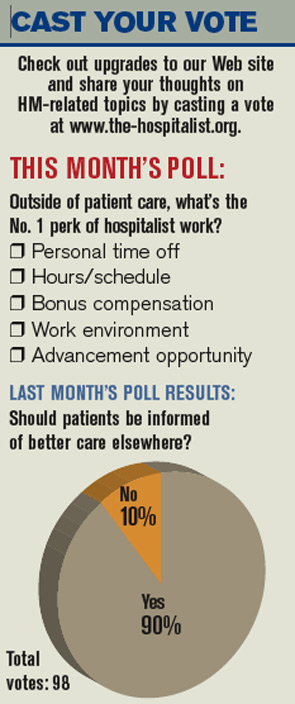
SHM responds:
SHM advocates for reforms that increase access to affordable healthcare and deliver safer, higher-quality, and more cost-effective healthcare to all Americans. Over the past five years, SHM has become widely respected for our progressive and collaborative approach to healthcare payment reform.
We advocate for:
- Improved care coordination, particularly during transitions of care. We have met with MedPAC, key Congressional leaders, and CMS to advocate for reimbursement that supports better care transitions and reduces unnecessary rehospitalizations.
- Incentive alignment. Providers, hospitals, and payors must have aligned incentives that consistently reward quality as well as evidence-based, cost-effective care. To that end, we have strongly supported such pay-for-performance initiatives as the Physician Quality Reporting Initiative and Hospital Value Based Purchasing. We also support exploration of new payment methodologies, such as bundled payments to accountable-care organizations, which is still at the demonstration project stage. Properly structured, these new reimbursement models could spur innovation, reduce compartmentalization of care, and decrease costs.
- Expanded federal support for the Agency for Healthcare Research and Quality, as well as robust funding for comparative effectiveness research.
- Incentives supporting the adoption of e-prescribing and health information technology.
- Replacement of the flawed Sustainable Growth Rate with a stable, predictable payment methodology.
- Support for initiatives that encourage physicians to choose generalist tracks.
We encourage our members to visit our Legislative Advocacy Web site (www.hospitalmedicine.org/advocacy) to see where we stand on healthcare reform.
Eric M. Siegal, MD, FHM,
chairman, SHM Public
Policy Committee
On June 19, the Journal of Hospital Medicine (JHM) received a higher-than-expected first Impact Factor score, the measure of citations received in 2008 to articles published in 2006 and 2007. The 3.613 initial score ranks JHM No. 21 out of 107 journals in the Internal and General Medicine subject category.
Impact Factor scores are used as a proxy for the importance of a journal to its field. Academic researchers are evaluated on the “impact” of their publications based on this score.
“There are journals that are 20 years old that don’t have impact factors as high as we do,” says Mark V. Williams, MD, FACP, FHM, professor and chief of the division of hospital medicine at Northwestern University’s Feinberg School of Medicine in Chicago and editor of JHM. “Hopefully, this will lead to academicians across the world being interested in submitting their scholarly work.”
JHM’s top-cited source is Core Competencies in Hospital Medicine: A Framework for Curriculum Development (www.hospitalmedicine.org/ResourceRoomRedesign/RR_Main/html/Core_Competencies.cfm). The clinical content is an essential tool for practicing hospitalists, providing guidance in the areas of clinical conditions, procedures, healthcare systems, development, and methodology.
“SHM is very proud of our journal, JHM, and getting such a sterling impact factor is a further acknowledgement of JHM’s credibility, reach, and world-class content,” says Larry Wellikson, MD, FHM, CEO of SHM. TH
Freelance Writer Richard Quinn contributed to this report.
Letters
SHM Should Support Reform Measures to Medicare System
As part of healthcare reform, I believe SHM should support the following ideas for Medicare reform:
- Primary-care physician (PCP) reimbursement should increase by 25%;
- Surgical reimbursement should decrease by 10%;
- Medical subspecialist reimbursement should decrease by 10%;
- All HIV/AIDS patients should be covered under Medicaid;
- All end-stage renal disease (ESRD) should be covered under Medicaid;
- Community health center funding should be covered under Medicaid;
- Children’s Health Insurance Plan (CHIP) funding should not come out of the Medicare fund;
- National Institutes of Health (NIH) funding should not come out of the Medicare fund;
- The Medicare tax on income before deductions should have no income ceiling; and
- The Social Security tax should be higher for those earning more than $250,000 per year before any deductions.
These changes would strengthen the Medicare fund to provide for our senior citizens’ healthcare and retirement. The above will be better than budget-neutral. Those to be covered (above) under Medicaid (HIV, ESRD, CHC, etc.) will actually have to pay less out of pocket for medications, services, procedures, and hospitalization.
The disproportionately low reimbursement to PCPs would be partially corrected in line with the medical home program concept. Partial financial correction of the overcompensated specialists and procedurists who dominate the rate commission would be accomplished with only a small amount of financial distress, which PCPs have been suffering for more than a decade.
Robert Beshany, MD,
SHM charter member,
Colorado Springs, Colo.
SHM responds:
SHM advocates for reforms that increase access to affordable healthcare and deliver safer, higher-quality, and more cost-effective healthcare to all Americans. Over the past five years, SHM has become widely respected for our progressive and collaborative approach to healthcare payment reform.
We advocate for:
- Improved care coordination, particularly during transitions of care. We have met with MedPAC, key Congressional leaders, and CMS to advocate for reimbursement that supports better care transitions and reduces unnecessary rehospitalizations.
- Incentive alignment. Providers, hospitals, and payors must have aligned incentives that consistently reward quality as well as evidence-based, cost-effective care. To that end, we have strongly supported such pay-for-performance initiatives as the Physician Quality Reporting Initiative and Hospital Value Based Purchasing. We also support exploration of new payment methodologies, such as bundled payments to accountable-care organizations, which is still at the demonstration project stage. Properly structured, these new reimbursement models could spur innovation, reduce compartmentalization of care, and decrease costs.
- Expanded federal support for the Agency for Healthcare Research and Quality, as well as robust funding for comparative effectiveness research.
- Incentives supporting the adoption of e-prescribing and health information technology.
- Replacement of the flawed Sustainable Growth Rate with a stable, predictable payment methodology.
- Support for initiatives that encourage physicians to choose generalist tracks.
We encourage our members to visit our Legislative Advocacy Web site (www.hospitalmedicine.org/advocacy) to see where we stand on healthcare reform.
Eric M. Siegal, MD, FHM,
chairman, SHM Public
Policy Committee
Lack of Evidence
In the late 1940s, Patricia Sanchez remembers sleeping on a cot in her oldest son’s bedroom most winter nights, listening for the vaporizer to run out of water so she could quickly refill it. The flu or even a bad cold invariably exacerbated his asthma, often causing him to wheeze and gasp for breath.
“We didn’t have any good medicines. It was a scary time,” she says. “I think we had to take him to the emergency department almost every winter.”
Today, with such medical advances as inhaled corticosteroids, many hospitalizations for asthma-related conditions can be avoided. Similarly, the use of ondansetron (Zofran) in children with gastroenteritis has decreased hospitalization rates. Many such medications originally developed for adults are helping to advance the treatment of childhood diseases, especially in oncology. But has the attraction of newer, stronger medications contributed to overuse for certain pediatric diseases?
A number of pediatric hospitalists think it has. Medication use in children has—for the most part—not received enough study. Therefore, hospitalists don’t always have enough evidence to guide their treatment decisions for young patients. Until the research catches up with the medications, hospitalists should be cautious.
HM physicians must stay abreast of the latest drug information and treatment guidelines. More importantly, they need to maintain clear lines of communication and outline reasonable expectations with their patients and their patients’ families.
Too Much, Too Soon?
Overuse of antibiotics and the growing threat of methicillin-resistant Staphylococcus aureus (MRSA) and other resistant strains frequently affect hospitalists in their practices, says Jack Percelay, MD, MPH, FAAP, FHM, a pediatric hospitalist with E.L.M.O. Pediatrics in New York City and a member of SHM’s board of directors. So does pressure from worried parents who want to employ whatever it takes to make their child better. “We want to be really careful about giving kids antibiotics,” he says, “and not use the biggest, newest guns in the hospital when they are not necessary.”

—Brian Alverson, MD, pediatric hospitalist, Hasbro Children’s Hospital, Providence, R.I.
Knowing how young and how much is safe and effective isn’t easy. Samir S. Shah, MD, MSCE, assistant professor of pediatrics and epidemiology at the University of Pennsylvania School of Medicine and attending physician in the divisions of infectious diseases and general pediatrics at The Children’s Hospital of Philadelphia, and his colleagues examined the use of adjuvant corticosteroids in children with bacterial meningitis. What they found was a worrisome upward trend of increased steroid administration, even though current evidence does not warrant the approach.1 When bacterial meningitis is caused by Haemophilus influenzae type B, adjuvant corticosteroids show a reduction in hearing loss in children, but studies conducted in the current era (when Streptococcus pneumoniae and Neisseria meningitidies are common causes of bacterial meningitis) do not show similar benefit.
In childhood cancer, oncology physicians and researchers have done an excellent job of refining treatment protocols, says Mark Shen, MD, medical director of hospital medicine at Dell Children’s Medical Center in Austin, Texas, and pediatric editor of The Hospitalist. Nearly 70% of all children with cancer in the U.S. are enrolled in clinical trials, which allows for expanded evidence on treatments and outcomes.
In other settings, it might be too early to tell whether children are being overmedicated, undermedicated, or appropriately medicated. The real question: What will the consequences of long-term medication be?
Direct-to-consumer advertising; expansion of the Diagnostic and Statistical Manual of Mental Disorders (DSM) criteria for attention deficit hyperactivity disorder (ADHD), bipolar disorder, and autism spectrum disorder; and the acceptance of “biological psychiatry” as the theoretical basis for the etiology of behavioral and emotional disorders all contribute to the increased use of psychotropics, says Julie M. Zito, PhD, professor of pharmacy and psychiatry in the Pharmaceutical Health Services Research Department at the University of Maryland at Baltimore. Using Medicaid administrative claims data for Texas youth in foster care in 2004, Dr. Zito and colleagues found that more than a third of these children (37.9%) had been prescribed a psychotropic medication.2 Of those receiving medications, 41.3% were receiving at least three different classes of drugs, most frequently antidepressants, ADHD drugs, and anti-psychotic agents.
Although the foster child population is relatively small (513,000 children in the U.S. were in foster care in 2005, according to the Department of Health and Human Services), the trend seen in this population is concerning. Medco Health Solutions’ 2007 survey of drug trends predicts that prescriptions for medications to treat ADHD will continue to increase at a rate of about 3% per year.3
Another concern is that the use of atypical antipsychotic medications to treat behavioral or bipolar disorders in children could result in weight gain (as it does in adults), which can trigger metabolic syndrome and increased risk of diabetes.
A Florida study that Dr. Zito co-authored demonstrated increased cardiovascular visits to the ED in Medicaid-insured children who had received stimulants.4 “It’s clear that we need to know more about safety and efficacy [of these medications in children],” Dr. Zito says.
The Parent Trap
Daniel Coghlin, MD, a general pediatrician for eight years and now a pediatric hospitalist at Hasbro Children’s Hospital in Providence, R.I., believes parents’ expectations of their physicians—and medications—often are too high. Many think the doctor should provide a solution to all of their children’s illnesses, and the expected solution often entails a prescription.
Does parental pressure influence prescribing patterns? One study showed that pediatricians would prescribe antimicrobials 62% of the time if they thought the parents wanted them—even for a presumed viral illness.5
Dr. Shah points out that physicians might misunderstand the parents’ expectations; he suggests having a frank discussion about efficacy of antibiotics. “Studies have also shown that if the physician explains that antibiotics won’t work against viruses, that there is no benefit but there is potential harm, [then] that’s an answer that’s acceptable to most parents,” he says.
To be fair, says Brian Alverson, MD, also a pediatric hospitalist at Hasbro Children’s Hospital, physicians also contribute to overuse of antibiotics by ordering tests that drive up their inappropriate use. An X-ray might show small areas of lung atelectasis, which could be interpreted as pneumonia. A CBC test with an elevated white count could trigger an antimicrobial order. For the record, Dr. Alverson says neither test is indicated on a routine basis in the setting of bronchiolitis.
Over-the-Counter Risk
American consumers purchase 95 million packages of over-the-counter (OTC) cough and cold preparations for their sick children each year, according to the Consumer Healthcare Products Association. Many in the scientific community, including the American Academy of Pediatrics (AAP) and Wayne Snodgrass, MD, of the University of Texas Medical Branch’s department of pharmacology in Galveston, have pressed for more regulatory action, pointing to published evidence that ingredients such as brompheniramine are no more effective than a placebo in stopping a cough.6,7 Prompted by reports of two deaths in children, the FDA last October recommended that OTC cough-and-cold products not be given to infants or children under age 2. The FDA also is reviewing its recommendations for children ages 2 to 11.
Since initiation of the Pediatric Exclusivity Provision, which extends six months of patent exclusivity for products undergoing testing in children, and passage of the Best Pharmaceuticals for Children Act (BPCA) in 2002, more than 133 labeling changes have resulted from 300 pediatric-specific studies. (For a comprehensive list of the labeling changes, visit www.fda.gov/oc/opt/pediatriclabeling.html.)
In addition, National Institutes of Health prioritization of medications for future research studies in youth now consider frequency-of-use data from insured populations, Dr. Zito says. These changes have led to some improvements—for example, “black box” warnings against stimulants given for ADHD and selective serotonin reuptake inhibitors (SSRIs) prescribed for depression. The moves also underline the need for more research.
Key safety questions remain in the pediatric community. For example, is it acceptable to calculate smaller doses by weight of drugs approved safe for adults? On this subject, pediatric hospitalists “are woefully, inadequately armed with evidence,” Dr. Alverson says. “We routinely use medications in children where the dosing is arbitrarily guessed at.”
A 2007 study conducted by Dr. Shah and colleagues validates this point. The study found that most of the children hospitalized at 31 tertiary-care pediatric hospitals received at least one medication outside the FDA product license indication.8 Although the finding does not necessarily mean the medications were inappropriate, it highlights the dearth of studies establishing the proper dosages and uses of medications in children, and the long-term outcomes of their usage.
One way in which hospitalists can help is educating parents about the perils of OTC medicines, Dr. Shen says. An example of a safety concern is parents giving their children acetaminophen (Tylenol) and ibuprofen (Motrin) together; evidence shows that this kind of dosing error by parents is relatively common.
Fill the Knowledge Gap
When it comes to choosing medications and dosages for children, pediatric hospitalists often make treatment decisions based on their clinical experience, observational studies, or by extrapolating data from adult studies.
“There are countless examples of places where evidence-based physicians must still make educated guesses,” Dr. Alverson says.
However, experts point out that children are not “little adults.” Extrapolating from adult data can lead to unpredictable clinical responses and the possibility of overmedication. Going forward, the trick will be to tease out, with rigorous research, which medications—and at which dosages—are best for which kids.
Dr. Alverson suggests hospitalists stay on top of the literature, take advantage of all available CME, and plug into a listserv, such as the American Academy of Pediatrics’ HM listserv (download instructions and an enrollment form at www.aap.org/sections/hospcare/listservSOHM.pdf).
Above all, the key to dealing with families, he says, is to give them an open assessment of risks, benefits, and gaps in the scientific knowledge. TH
Gretchen Henkel is a freelance writer based in California.
References
- Mongelluzzo J, Mohamad Z, Ten Have TR, Shah SS. Corticosteroids and mortality in children with bacterial meningitis. JAMA. 2008;299(17):2048-2055.
- Zito JM, Safer DJ, Sai D, et al. Psychotropic medication patterns among youth in foster care. Pediatrics. 2008;121(1):e157-163.
- Drug Trend Report 2008. Medco Corporate Web site. Available at: www.medcohealth.com/medco/corporate/home.jsp?ltSess=y&articleID=DT_2008_Report_Pdf<Sess=y. Accessed April 1, 2009.
- Winterstein AG, Gerhard T, Shuster J, et al. Cardiac safety of central nervous system stimulants in children and adolescents with attention-deficit/hyperactivity disorder. Pediatrics. 2007;120(6):e1494-1501.
- Mangione-Smith R, McGlynn EA, Elliott MN, Krogstad P, Brook RH. The relationship between perceived parental expectations and physician antimicrobial prescribing behavior. Pediatrics. 1999;103(4 Pt 1):711-718.
- Sharfstein JM, North M, Serwint JR. Over the counter but no longer under the radar—pediatric cough and cold medications. N Engl J Med. 2007;357(23): 2321-2324.
- Clemens CJ, Taylor JA, Almquist JR, Quinn HC, Mehta A, Naylor GS. Is an antihistamine-decongestant combination effective in temporarily relieving symptoms of the common cold in preschool children? J Pediatr. 1997;130(3):463-466.
- Shah SS, Hall M, Goodman DM, et al. Off-label drug use in hospitalized children. Arch Pediatr Adolesc Med. 2007;161(3):282-290.
In the late 1940s, Patricia Sanchez remembers sleeping on a cot in her oldest son’s bedroom most winter nights, listening for the vaporizer to run out of water so she could quickly refill it. The flu or even a bad cold invariably exacerbated his asthma, often causing him to wheeze and gasp for breath.
“We didn’t have any good medicines. It was a scary time,” she says. “I think we had to take him to the emergency department almost every winter.”
Today, with such medical advances as inhaled corticosteroids, many hospitalizations for asthma-related conditions can be avoided. Similarly, the use of ondansetron (Zofran) in children with gastroenteritis has decreased hospitalization rates. Many such medications originally developed for adults are helping to advance the treatment of childhood diseases, especially in oncology. But has the attraction of newer, stronger medications contributed to overuse for certain pediatric diseases?
A number of pediatric hospitalists think it has. Medication use in children has—for the most part—not received enough study. Therefore, hospitalists don’t always have enough evidence to guide their treatment decisions for young patients. Until the research catches up with the medications, hospitalists should be cautious.
HM physicians must stay abreast of the latest drug information and treatment guidelines. More importantly, they need to maintain clear lines of communication and outline reasonable expectations with their patients and their patients’ families.
Too Much, Too Soon?
Overuse of antibiotics and the growing threat of methicillin-resistant Staphylococcus aureus (MRSA) and other resistant strains frequently affect hospitalists in their practices, says Jack Percelay, MD, MPH, FAAP, FHM, a pediatric hospitalist with E.L.M.O. Pediatrics in New York City and a member of SHM’s board of directors. So does pressure from worried parents who want to employ whatever it takes to make their child better. “We want to be really careful about giving kids antibiotics,” he says, “and not use the biggest, newest guns in the hospital when they are not necessary.”
—Brian Alverson, MD, pediatric hospitalist, Hasbro Children’s Hospital, Providence, R.I.
Knowing how young and how much is safe and effective isn’t easy. Samir S. Shah, MD, MSCE, assistant professor of pediatrics and epidemiology at the University of Pennsylvania School of Medicine and attending physician in the divisions of infectious diseases and general pediatrics at The Children’s Hospital of Philadelphia, and his colleagues examined the use of adjuvant corticosteroids in children with bacterial meningitis. What they found was a worrisome upward trend of increased steroid administration, even though current evidence does not warrant the approach.1 When bacterial meningitis is caused by Haemophilus influenzae type B, adjuvant corticosteroids show a reduction in hearing loss in children, but studies conducted in the current era (when Streptococcus pneumoniae and Neisseria meningitidies are common causes of bacterial meningitis) do not show similar benefit.
In childhood cancer, oncology physicians and researchers have done an excellent job of refining treatment protocols, says Mark Shen, MD, medical director of hospital medicine at Dell Children’s Medical Center in Austin, Texas, and pediatric editor of The Hospitalist. Nearly 70% of all children with cancer in the U.S. are enrolled in clinical trials, which allows for expanded evidence on treatments and outcomes.
In other settings, it might be too early to tell whether children are being overmedicated, undermedicated, or appropriately medicated. The real question: What will the consequences of long-term medication be?
Direct-to-consumer advertising; expansion of the Diagnostic and Statistical Manual of Mental Disorders (DSM) criteria for attention deficit hyperactivity disorder (ADHD), bipolar disorder, and autism spectrum disorder; and the acceptance of “biological psychiatry” as the theoretical basis for the etiology of behavioral and emotional disorders all contribute to the increased use of psychotropics, says Julie M. Zito, PhD, professor of pharmacy and psychiatry in the Pharmaceutical Health Services Research Department at the University of Maryland at Baltimore. Using Medicaid administrative claims data for Texas youth in foster care in 2004, Dr. Zito and colleagues found that more than a third of these children (37.9%) had been prescribed a psychotropic medication.2 Of those receiving medications, 41.3% were receiving at least three different classes of drugs, most frequently antidepressants, ADHD drugs, and anti-psychotic agents.
Although the foster child population is relatively small (513,000 children in the U.S. were in foster care in 2005, according to the Department of Health and Human Services), the trend seen in this population is concerning. Medco Health Solutions’ 2007 survey of drug trends predicts that prescriptions for medications to treat ADHD will continue to increase at a rate of about 3% per year.3
Another concern is that the use of atypical antipsychotic medications to treat behavioral or bipolar disorders in children could result in weight gain (as it does in adults), which can trigger metabolic syndrome and increased risk of diabetes.
A Florida study that Dr. Zito co-authored demonstrated increased cardiovascular visits to the ED in Medicaid-insured children who had received stimulants.4 “It’s clear that we need to know more about safety and efficacy [of these medications in children],” Dr. Zito says.
The Parent Trap
Daniel Coghlin, MD, a general pediatrician for eight years and now a pediatric hospitalist at Hasbro Children’s Hospital in Providence, R.I., believes parents’ expectations of their physicians—and medications—often are too high. Many think the doctor should provide a solution to all of their children’s illnesses, and the expected solution often entails a prescription.
Does parental pressure influence prescribing patterns? One study showed that pediatricians would prescribe antimicrobials 62% of the time if they thought the parents wanted them—even for a presumed viral illness.5
Dr. Shah points out that physicians might misunderstand the parents’ expectations; he suggests having a frank discussion about efficacy of antibiotics. “Studies have also shown that if the physician explains that antibiotics won’t work against viruses, that there is no benefit but there is potential harm, [then] that’s an answer that’s acceptable to most parents,” he says.
To be fair, says Brian Alverson, MD, also a pediatric hospitalist at Hasbro Children’s Hospital, physicians also contribute to overuse of antibiotics by ordering tests that drive up their inappropriate use. An X-ray might show small areas of lung atelectasis, which could be interpreted as pneumonia. A CBC test with an elevated white count could trigger an antimicrobial order. For the record, Dr. Alverson says neither test is indicated on a routine basis in the setting of bronchiolitis.
Over-the-Counter Risk
American consumers purchase 95 million packages of over-the-counter (OTC) cough and cold preparations for their sick children each year, according to the Consumer Healthcare Products Association. Many in the scientific community, including the American Academy of Pediatrics (AAP) and Wayne Snodgrass, MD, of the University of Texas Medical Branch’s department of pharmacology in Galveston, have pressed for more regulatory action, pointing to published evidence that ingredients such as brompheniramine are no more effective than a placebo in stopping a cough.6,7 Prompted by reports of two deaths in children, the FDA last October recommended that OTC cough-and-cold products not be given to infants or children under age 2. The FDA also is reviewing its recommendations for children ages 2 to 11.
Since initiation of the Pediatric Exclusivity Provision, which extends six months of patent exclusivity for products undergoing testing in children, and passage of the Best Pharmaceuticals for Children Act (BPCA) in 2002, more than 133 labeling changes have resulted from 300 pediatric-specific studies. (For a comprehensive list of the labeling changes, visit www.fda.gov/oc/opt/pediatriclabeling.html.)
In addition, National Institutes of Health prioritization of medications for future research studies in youth now consider frequency-of-use data from insured populations, Dr. Zito says. These changes have led to some improvements—for example, “black box” warnings against stimulants given for ADHD and selective serotonin reuptake inhibitors (SSRIs) prescribed for depression. The moves also underline the need for more research.
Key safety questions remain in the pediatric community. For example, is it acceptable to calculate smaller doses by weight of drugs approved safe for adults? On this subject, pediatric hospitalists “are woefully, inadequately armed with evidence,” Dr. Alverson says. “We routinely use medications in children where the dosing is arbitrarily guessed at.”
A 2007 study conducted by Dr. Shah and colleagues validates this point. The study found that most of the children hospitalized at 31 tertiary-care pediatric hospitals received at least one medication outside the FDA product license indication.8 Although the finding does not necessarily mean the medications were inappropriate, it highlights the dearth of studies establishing the proper dosages and uses of medications in children, and the long-term outcomes of their usage.
One way in which hospitalists can help is educating parents about the perils of OTC medicines, Dr. Shen says. An example of a safety concern is parents giving their children acetaminophen (Tylenol) and ibuprofen (Motrin) together; evidence shows that this kind of dosing error by parents is relatively common.
Fill the Knowledge Gap
When it comes to choosing medications and dosages for children, pediatric hospitalists often make treatment decisions based on their clinical experience, observational studies, or by extrapolating data from adult studies.
“There are countless examples of places where evidence-based physicians must still make educated guesses,” Dr. Alverson says.
However, experts point out that children are not “little adults.” Extrapolating from adult data can lead to unpredictable clinical responses and the possibility of overmedication. Going forward, the trick will be to tease out, with rigorous research, which medications—and at which dosages—are best for which kids.
Dr. Alverson suggests hospitalists stay on top of the literature, take advantage of all available CME, and plug into a listserv, such as the American Academy of Pediatrics’ HM listserv (download instructions and an enrollment form at www.aap.org/sections/hospcare/listservSOHM.pdf).
Above all, the key to dealing with families, he says, is to give them an open assessment of risks, benefits, and gaps in the scientific knowledge. TH
Gretchen Henkel is a freelance writer based in California.
References
- Mongelluzzo J, Mohamad Z, Ten Have TR, Shah SS. Corticosteroids and mortality in children with bacterial meningitis. JAMA. 2008;299(17):2048-2055.
- Zito JM, Safer DJ, Sai D, et al. Psychotropic medication patterns among youth in foster care. Pediatrics. 2008;121(1):e157-163.
- Drug Trend Report 2008. Medco Corporate Web site. Available at: www.medcohealth.com/medco/corporate/home.jsp?ltSess=y&articleID=DT_2008_Report_Pdf<Sess=y. Accessed April 1, 2009.
- Winterstein AG, Gerhard T, Shuster J, et al. Cardiac safety of central nervous system stimulants in children and adolescents with attention-deficit/hyperactivity disorder. Pediatrics. 2007;120(6):e1494-1501.
- Mangione-Smith R, McGlynn EA, Elliott MN, Krogstad P, Brook RH. The relationship between perceived parental expectations and physician antimicrobial prescribing behavior. Pediatrics. 1999;103(4 Pt 1):711-718.
- Sharfstein JM, North M, Serwint JR. Over the counter but no longer under the radar—pediatric cough and cold medications. N Engl J Med. 2007;357(23): 2321-2324.
- Clemens CJ, Taylor JA, Almquist JR, Quinn HC, Mehta A, Naylor GS. Is an antihistamine-decongestant combination effective in temporarily relieving symptoms of the common cold in preschool children? J Pediatr. 1997;130(3):463-466.
- Shah SS, Hall M, Goodman DM, et al. Off-label drug use in hospitalized children. Arch Pediatr Adolesc Med. 2007;161(3):282-290.
Myriad Warnings Blur the Message
A plethora of posters, a load of labels, and a rainbow of colored wristbands confront the average hospitalist every day. They serve as reminders to wash your hands, avoid using an extremity for blood draws, and other warnings both important and not so much. In this day and age, with a multitude of visual and technological reminders confronting physicians, some raise concerns about the consequences of too many reminders, also known as “alert fatigue.”
“The premise of [warning] signs is to improve quality,” says David Grace, MD, FHM, area medical officer for the Schumacher Group in Lafayette, La., and a member of Team Hospitalist. “I am not at all convinced that this is being accomplished. There is so much visual noise [in the hospital] that important messages get lost in the clutter.”
Alert fatigue is most often used to describe a phenomenon seen in computerized decision support systems. It’s the result of a physician receiving so many warnings that they grow numb and stop looking at them. Although it hasn’t been studied to the same extent in the low- or no-tech arena, alert fatigue is an issue in hospital-based signage.
Marilyn Sue Bogner, PhD, chief scientist at the Institute for the Study of Human Error, LLC, in Bethesda, Md., says alert oversaturation can have unintended consequences. “If there are too many signs, you really have no signs because people don’t pay attention,” she says. “I wouldn’t call it information overload, because you have to take information in before you can be overloaded.”
This lack of attention can lead to important information being ignored or misunderstood. It could cause serious disruptions in patient care and adverse outcomes, including the possibility of injury or even death.
Too Much of a Good Thing
One potentially harmful trend of warning signs in the hospital setting is what psychologists call “dilution.” The more warnings there are, the more people tend to lose sight of why the warning is there in the first place, and low-importance warnings “dilute” the strength of important ones.
“I would like to see a system where only truly high-risk patients are the ones who get the warnings,” Dr. Grace says. “If you restricted precautionary signs to those patients at high risk for transmitting something bad, or those at high risk for getting something bad, you would get better adherence than currently, where you seem to have signs for any patient with any risk for transmitting anything.”
For all the visual cues in the hospital setting to warn physicians of potential dangers, there exists no standardized system to help hospitalists sort out the direct patient-threats from the more mundane housekeeping chores.
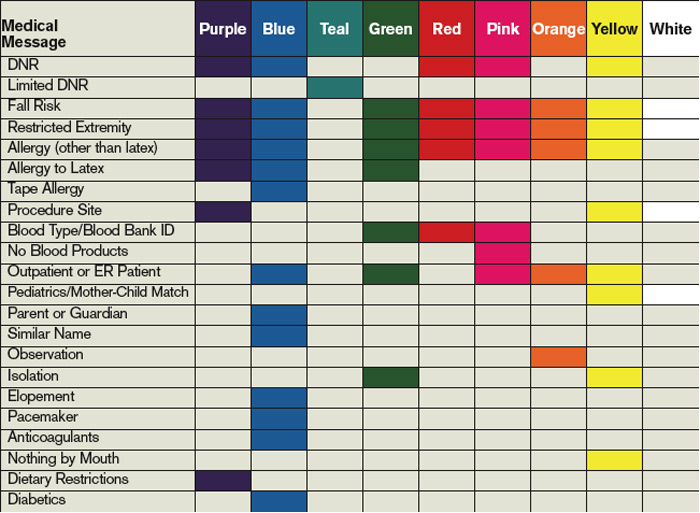
“Even a warning that is effective by itself may get buried when there are others hanging around it,” Dr. Bogner says. “There is no hierarchy of importance in most hospitals because there is no central authority making sure that red, for instance, is saved only for a warning about the most dangerous incidents.”
Often specialists are responsible for signs relating to their area of expertise without taking into account the addition to the chaos as well as how the warning will fit in with the realities of the hospital unit. Clutter in the ICU and other areas of the hospital can be exacerbated by multiple disciplines putting up their own signs. There is no method for hospitalists to look around and see which warnings pertain to them.
“There is a reason why all stop signs are red and have eight sides,” Dr. Grace says. “[It] makes it easy to for all to recognize at a glance what is being communicated. In hospitals, the same warning may be many different shapes and colors. This can make it hard for hospitalists, especially those who go to more than one hospital, to know what is being said and the response expected.”
Placement of visual warning signs can add to the confusion and limit effectiveness. Information is best placed near where it is to be used. For example, a sign telling staff that a certain extremity should not be used for blood draws is more likely to be seen and acted upon if it is in the form of a wristband attached to the arm instead of a warning sign on the door. It also is important to have easy access to the tools needed to follow the warning sign’s directions.
“Hospitals don’t have the resources to put a fully stocked isolation cart near every door,” Dr. Grace says. “You get a busy doctor down the far end of the hall and they may decide to just pop in and see their patient for a second, instead of taking the long walk back to the cart. Others follow the lead of the physician and, eventually, there will be a real need for the protection and it won’t be worn. The outcome is an increase in cluster outbreaks.”
Regulatory Requirements
Some of what one of the experts called “the metastasis of signage” can be laid at the feet of the various organizations that regulate healthcare in the U.S. For example, many signs and their placement are required by regulators with, as one hospital risk management expert says, little or no understanding of the impact the mandates have on sign pollution.
“There are guidelines from The Joint Commission and others indicating when you have to put signs up, and often mandate both their content and placement,” says Elaine Ziemba, managing director of risk management at the Stanford Hospitals and Clinics in Palo Alto, Calif. “Environmental health and safety people will decide signage related to medical gasses and fire safety, and biomedical engineering will make decisions related to their equipment.”
Warning signs are added according to the perceived needs of the specific discipline involved. Risk managers are not routinely consulted about warning signs and notices put up around her hospital, Ziemba says. There also is little guidance in the literature about the effectiveness of multiple warning signs, especially when compared with the wide range of studies that assess alert fatigue in electronic medical record systems.
Although hardly restricted to the requirements of The Joint Commission or other agencies, complex and wordy signs add to the visual chaos and actually impair compliance. “Too many signs try to communicate too much information out of a fear that they may be leaving something important out,” Dr. Bogner says. “It is a lot easier to put everything in than to distill things down to get to the nugget you want to get across.”
David Yu, MD, FACP, medical director of hospitalist services at Decatur Memorial Hospital in Decatur, Ill., agrees. A member of Team Hospitalist, Dr. Yu’s mantra is “less is better.” Put the fewest words possible on the sign, then educate the staff on how to implement the information.
“We discourage signs that are overly verbose,” he says. “At the end of the day, the efficacy of signs depends largely on the training and attentiveness of those caring for the patient. It is not fail-safe and requires the staff to acknowledge the sign and institute the indicated policies correctly.”
In some cases, the best sign might not even be a sign.
“Color coding is used extensively in the military,” Dr. Yu says. “On an aircraft carrier, all of the people running around the deck are color-coded. Just by looking around, you can see who deals with armament, who is the refueler, and who does traffic control.”
Dr. Yu’s hospital issues red footies to patients who are at high risk for falls. When any staff member sees a red-footed patient wandering around without an escort, they immediately know they should intervene. It conveys the required message anywhere in the hospital.

—David Grace, MD, FHM, area medical officer, Schumacher Group, Lafayette, La.
“Fire and Forget”
Although many visual warnings have the best of intentions, it doesn’t mean they are effective. Few hospitals have systems in place to follow up and make sure the warning actually has an effect on patient care.
“Alerts should be viewed initially as an experiment, requiring tracking to make sure it works as intended,” says Scott A. Flanders, MD, FHM, president of SHM and professor of medicine and director of the hospitalist program at the University of Michigan at Ann Arbor. “Too frequently in healthcare we put up signs in an attempt to fix a problem, but then don’t follow up to see if it is working.”
A similar phenomenon is seen when early warnings follow a patient through subsequent hospitalizations. This is especially true with isolation protocols, as the patient might not require the same warnings as previous admissions.
“It seems as though anyone who has ever had methicillin-resistant Staphylococcus aureus [MRSA] gets one of those things slapped on their door the minute they come in,” Dr. Grace says. “I have personally seen patients who had a boil grow out [of] MRSA 10 years ago still get a sticker on their door after all this time.”
Thus, warning signs that are not serving their intended purpose don’t ever get taken down; they dilute the usefulness of those that are timely and effective. The trend might indicate that defensive signage (a cousin to defensive medicine) is a driver, the theory being it’s safer and “legally defensible” if a hospital posts a multitude of alerts, rather than miss a sign that could have averted a poor outcome.
Effectiveness Questioned
Even though hospitalists have witnessed a marked increase in visual warnings, there is little to suggest they are effective. For example, studies in Asia during the 2003 SARS scare suggest that isolation precautions were followed closely, yet there was no change in MRSA transmission rates.
The other concern is whether the saturation of warnings causes harm. Dr. Grace receives a warning flag on almost every chart requesting DVT prophylaxis—even for patients who are on heparin infusions or already are on prophylaxis. “Doctors get frustrated and start to ignore the [alerts],” he says. “Then, when someone slips through the cracks and doesn’t get needed treatment, we are less likely to catch it because of alert fatigue.”
Although they are the most visual, and perhaps the most frustrating, part of patient safety, warning signs are not the only bullets in the gunfight.
“I don’t think any institution views [warning] signs as the ultimate solution to problems,” Dr. Flanders says. “Signs end up being one part of a multifactorial intervention—a common and easy first piece of the puzzle.”
Warning signs in the hospital can serve an important communication function, alerting providers of key safety concerns. However, too many warnings can dilute the effectiveness of the signage and hinder patient care.
Hospitalists need to recognize the possibility of sign fatigue in their own practice and link warnings to truly high-risk situations. Alerts can be of help, but they should be viewed as a back-up—not a substitute—for good communication between physicians, colleagues, and the hospital staff. TH
Kurt Ullman is a freelance writer based in Indiana.
A plethora of posters, a load of labels, and a rainbow of colored wristbands confront the average hospitalist every day. They serve as reminders to wash your hands, avoid using an extremity for blood draws, and other warnings both important and not so much. In this day and age, with a multitude of visual and technological reminders confronting physicians, some raise concerns about the consequences of too many reminders, also known as “alert fatigue.”
“The premise of [warning] signs is to improve quality,” says David Grace, MD, FHM, area medical officer for the Schumacher Group in Lafayette, La., and a member of Team Hospitalist. “I am not at all convinced that this is being accomplished. There is so much visual noise [in the hospital] that important messages get lost in the clutter.”
Alert fatigue is most often used to describe a phenomenon seen in computerized decision support systems. It’s the result of a physician receiving so many warnings that they grow numb and stop looking at them. Although it hasn’t been studied to the same extent in the low- or no-tech arena, alert fatigue is an issue in hospital-based signage.
Marilyn Sue Bogner, PhD, chief scientist at the Institute for the Study of Human Error, LLC, in Bethesda, Md., says alert oversaturation can have unintended consequences. “If there are too many signs, you really have no signs because people don’t pay attention,” she says. “I wouldn’t call it information overload, because you have to take information in before you can be overloaded.”
This lack of attention can lead to important information being ignored or misunderstood. It could cause serious disruptions in patient care and adverse outcomes, including the possibility of injury or even death.
Too Much of a Good Thing
One potentially harmful trend of warning signs in the hospital setting is what psychologists call “dilution.” The more warnings there are, the more people tend to lose sight of why the warning is there in the first place, and low-importance warnings “dilute” the strength of important ones.
“I would like to see a system where only truly high-risk patients are the ones who get the warnings,” Dr. Grace says. “If you restricted precautionary signs to those patients at high risk for transmitting something bad, or those at high risk for getting something bad, you would get better adherence than currently, where you seem to have signs for any patient with any risk for transmitting anything.”
For all the visual cues in the hospital setting to warn physicians of potential dangers, there exists no standardized system to help hospitalists sort out the direct patient-threats from the more mundane housekeeping chores.
“Even a warning that is effective by itself may get buried when there are others hanging around it,” Dr. Bogner says. “There is no hierarchy of importance in most hospitals because there is no central authority making sure that red, for instance, is saved only for a warning about the most dangerous incidents.”
Often specialists are responsible for signs relating to their area of expertise without taking into account the addition to the chaos as well as how the warning will fit in with the realities of the hospital unit. Clutter in the ICU and other areas of the hospital can be exacerbated by multiple disciplines putting up their own signs. There is no method for hospitalists to look around and see which warnings pertain to them.
“There is a reason why all stop signs are red and have eight sides,” Dr. Grace says. “[It] makes it easy to for all to recognize at a glance what is being communicated. In hospitals, the same warning may be many different shapes and colors. This can make it hard for hospitalists, especially those who go to more than one hospital, to know what is being said and the response expected.”
Placement of visual warning signs can add to the confusion and limit effectiveness. Information is best placed near where it is to be used. For example, a sign telling staff that a certain extremity should not be used for blood draws is more likely to be seen and acted upon if it is in the form of a wristband attached to the arm instead of a warning sign on the door. It also is important to have easy access to the tools needed to follow the warning sign’s directions.
“Hospitals don’t have the resources to put a fully stocked isolation cart near every door,” Dr. Grace says. “You get a busy doctor down the far end of the hall and they may decide to just pop in and see their patient for a second, instead of taking the long walk back to the cart. Others follow the lead of the physician and, eventually, there will be a real need for the protection and it won’t be worn. The outcome is an increase in cluster outbreaks.”
Regulatory Requirements
Some of what one of the experts called “the metastasis of signage” can be laid at the feet of the various organizations that regulate healthcare in the U.S. For example, many signs and their placement are required by regulators with, as one hospital risk management expert says, little or no understanding of the impact the mandates have on sign pollution.
“There are guidelines from The Joint Commission and others indicating when you have to put signs up, and often mandate both their content and placement,” says Elaine Ziemba, managing director of risk management at the Stanford Hospitals and Clinics in Palo Alto, Calif. “Environmental health and safety people will decide signage related to medical gasses and fire safety, and biomedical engineering will make decisions related to their equipment.”
Warning signs are added according to the perceived needs of the specific discipline involved. Risk managers are not routinely consulted about warning signs and notices put up around her hospital, Ziemba says. There also is little guidance in the literature about the effectiveness of multiple warning signs, especially when compared with the wide range of studies that assess alert fatigue in electronic medical record systems.
Although hardly restricted to the requirements of The Joint Commission or other agencies, complex and wordy signs add to the visual chaos and actually impair compliance. “Too many signs try to communicate too much information out of a fear that they may be leaving something important out,” Dr. Bogner says. “It is a lot easier to put everything in than to distill things down to get to the nugget you want to get across.”
David Yu, MD, FACP, medical director of hospitalist services at Decatur Memorial Hospital in Decatur, Ill., agrees. A member of Team Hospitalist, Dr. Yu’s mantra is “less is better.” Put the fewest words possible on the sign, then educate the staff on how to implement the information.
“We discourage signs that are overly verbose,” he says. “At the end of the day, the efficacy of signs depends largely on the training and attentiveness of those caring for the patient. It is not fail-safe and requires the staff to acknowledge the sign and institute the indicated policies correctly.”
In some cases, the best sign might not even be a sign.
“Color coding is used extensively in the military,” Dr. Yu says. “On an aircraft carrier, all of the people running around the deck are color-coded. Just by looking around, you can see who deals with armament, who is the refueler, and who does traffic control.”
Dr. Yu’s hospital issues red footies to patients who are at high risk for falls. When any staff member sees a red-footed patient wandering around without an escort, they immediately know they should intervene. It conveys the required message anywhere in the hospital.
—David Grace, MD, FHM, area medical officer, Schumacher Group, Lafayette, La.
“Fire and Forget”
Although many visual warnings have the best of intentions, it doesn’t mean they are effective. Few hospitals have systems in place to follow up and make sure the warning actually has an effect on patient care.
“Alerts should be viewed initially as an experiment, requiring tracking to make sure it works as intended,” says Scott A. Flanders, MD, FHM, president of SHM and professor of medicine and director of the hospitalist program at the University of Michigan at Ann Arbor. “Too frequently in healthcare we put up signs in an attempt to fix a problem, but then don’t follow up to see if it is working.”
A similar phenomenon is seen when early warnings follow a patient through subsequent hospitalizations. This is especially true with isolation protocols, as the patient might not require the same warnings as previous admissions.
“It seems as though anyone who has ever had methicillin-resistant Staphylococcus aureus [MRSA] gets one of those things slapped on their door the minute they come in,” Dr. Grace says. “I have personally seen patients who had a boil grow out [of] MRSA 10 years ago still get a sticker on their door after all this time.”
Thus, warning signs that are not serving their intended purpose don’t ever get taken down; they dilute the usefulness of those that are timely and effective. The trend might indicate that defensive signage (a cousin to defensive medicine) is a driver, the theory being it’s safer and “legally defensible” if a hospital posts a multitude of alerts, rather than miss a sign that could have averted a poor outcome.
Effectiveness Questioned
Even though hospitalists have witnessed a marked increase in visual warnings, there is little to suggest they are effective. For example, studies in Asia during the 2003 SARS scare suggest that isolation precautions were followed closely, yet there was no change in MRSA transmission rates.
The other concern is whether the saturation of warnings causes harm. Dr. Grace receives a warning flag on almost every chart requesting DVT prophylaxis—even for patients who are on heparin infusions or already are on prophylaxis. “Doctors get frustrated and start to ignore the [alerts],” he says. “Then, when someone slips through the cracks and doesn’t get needed treatment, we are less likely to catch it because of alert fatigue.”
Although they are the most visual, and perhaps the most frustrating, part of patient safety, warning signs are not the only bullets in the gunfight.
“I don’t think any institution views [warning] signs as the ultimate solution to problems,” Dr. Flanders says. “Signs end up being one part of a multifactorial intervention—a common and easy first piece of the puzzle.”
Warning signs in the hospital can serve an important communication function, alerting providers of key safety concerns. However, too many warnings can dilute the effectiveness of the signage and hinder patient care.
Hospitalists need to recognize the possibility of sign fatigue in their own practice and link warnings to truly high-risk situations. Alerts can be of help, but they should be viewed as a back-up—not a substitute—for good communication between physicians, colleagues, and the hospital staff. TH
Kurt Ullman is a freelance writer based in Indiana.
A 35-year-old Asian man with jaundice and markedly high aminotransferase levels
A 35-year-old man who was born in Vietnam presents to the emergency department of a local hospital because he has had jaundice for 5 days and fatigue, malaise, and anorexia for 2 weeks. He also has nausea and mild epigastric and right upper quadrant abdominal pain. He denies having fevers, chills, night sweats, vomiting, diarrhea, melena, hematochezia, or weight loss.
His medical history is remarkable only for perinatally acquired hepatitis B virus (HBV) infection, for which he never received antiviral therapy. He does not take any prescribed, over-the-counter, or herbal medications.
He lives in the Midwest region of the United States and works full-time as a physician in private practice. He is married and has two children.
He has not travelled recently. He has no pets at home and has not been exposed to any.
He has never smoked. He drinks alcohol socially but has never used recreational drugs.
In a laboratory evaluation performed a year ago for insurance purposes, his liver function tests—serum albumin, total bilirubin, alkaline phosphatase, alanine aminotransferase, and aspartate aminotransferase levels—were all normal. He was positive for HBV surface antigen and HBV e antigen and negative for antibodies against these antigens.
PHASES OF HBV INFECTION
1. Which of the following best describes the status of HBV infection in this patient before his current symptoms developed?
- Resolved HBV infection
- Chronic inactive HBV infection
- Chronic active HBV infection
- Immune-tolerant chronic HBV infection
The correct answer is immune-tolerant chronic HBV infection.
Resolved infection. In immunocompetent adults, most primary HBV infections are self-limited: people clear the virus and gain lasting immunity (defined as the loss of HBV surface antigen, the development of antibody against surface antigen, no detectable HBV DNA in the serum, and normal alanine and aspartate aminotransferase levels). However, a minority of primary HBV infections persist and become chronic.
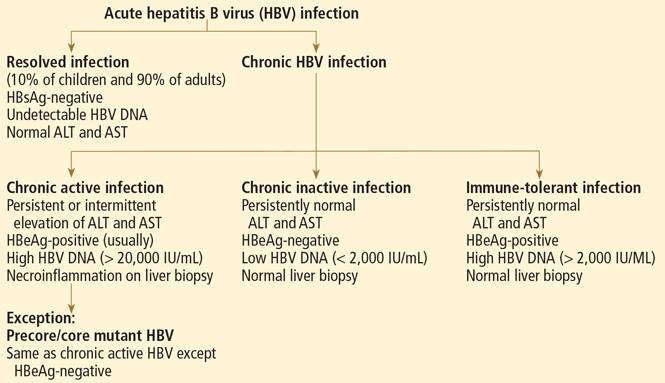
Chronic HBV infection is defined as the persistence of HBV surface antigen in the serum for at least 6 months. Patients with chronic HBV infection can be broadly classified as having either inactive disease (the inactive surface antigen carrier state) or chronic active hepatitis B (Figure 1).1–9
Chronic inactive HBV infection. Carriers of inactive HBV infection have low serum levels of HBV DNA (< 2,000 IU/mL), persistently normal aminotransferase levels, and no HBV e antigen; if a liver biopsy is performed, no significant hepatitis is found.
Chronic active HBV infection. Patients with chronic active HBV infection, in contrast, have high serum HBV DNA levels (> 20,000 IU/mL) and persistently or intermittently high aminotransferase levels; they do have HBV e antigen, and a liver biopsy shows moderate or severe necroinflammation.
A small group of patients with chronic active hepatitis B may be negative for e antigen but still have high aminotransferase levels, high HBV DNA levels, and continued necroinflammation in the liver.4 The virus in these patients has a mutation in its precore or core promoter gene that prevents the production of e antigen.
Patients with chronic active HBV infection (whether positive or negative for e antigen) are at a significantly greater risk of progressive liver injury and developing cirrhosis and hepatocellular carcinoma than are inactive carriers of HBV.
Immune-tolerant chronic HBV infection. Patients who acquired HBV at birth (eg, our patient) may have immune-tolerant HBV infection, which is characterized by significant HBV replication manifested by the presence of HBV e antigen and high levels of HBV DNA in the serum. However, these patients have no clinical or pathologic evidence of active liver disease (no symptoms, normal serum alanine aminotransferase levels, and minimal changes on liver biopsy).5 This was obviously the case in our patient, based on his history and laboratory results before his current symptoms developed.
Case continues: Liver function abnormalities
On physical examination, the patient’s temperature is 99.9°F (37.7°C), heart rate 106 per minute, blood pressure 98/54 mm Hg, respiratory rate 18 per minute, and oxygen saturation 100% while breathing ambient air. He is alert and oriented to time, place, and person.
He has icteric sclera, and his skin is jaundiced. His lymph nodes are not palpable. His cardiac examination is normal except for tachycardia. His lungs are clear to auscultation and percussion. He has mild epigastric and right upper quadrant abdominal tenderness with no peritoneal signs, hepatosplenomegaly, or masses.
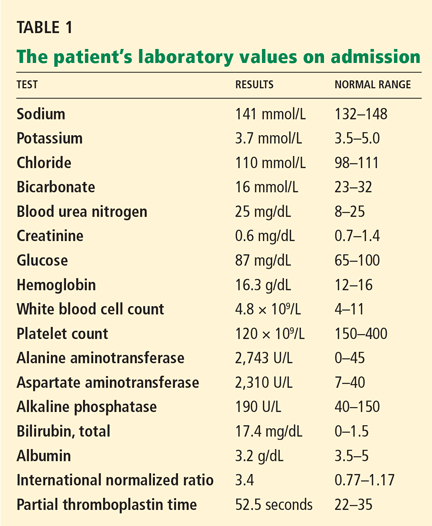
His basic laboratory values on admission are listed in Table 1. His amylase and lipase levels are normal. A urine dipstick test is positive for bilirubin.
WHAT IS THE LEAST LIKELY DIAGNOSIS?
2. Which one of the following is the least likely diagnosis in this patient?
- Reactivation of hepatitis B
- Drug-associated liver injury
- Acute viral hepatitis
- Acute alcoholic hepatitis
- Ischemic hepatitis
The degree and pattern of liver function abnormalities in our patient reflect hepatocellular injury rather than cholestatic liver disease, because his aminotransferase levels are elevated much higher than his alkaline phosphatase level (Table 1). Bilirubin elevation does not help differentiate the two conditions.
The degree and pattern of aminotransferase elevations are also helpful in narrowing the differential diagnosis. Serum aminotransferase levels of more than 1,000 U/L are mainly seen in patients with ischemic, viral, and toxininduced liver injury. Other rare causes of such high levels include Budd-Chiari syndrome, Wilson disease, and autoimmune hepatitis.
Ischemic hepatitis. Our patient has mild hypotension, but it does not seem to have been severe enough or of long enough duration to have caused ischemic hepatitis.
Drug-associated liver injury. Hepatotoxicity associated with drugs (most commonly acetaminophen [Tylenol]), herbal therapy, or mushroom poisoning should be considered in any patient whose aminotransferase levels are this high. However, our patient denies taking any medications (prescribed or over-the-counter), herbal remedies, or illicit drugs.
Acute viral hepatitis can certainly explain the patient’s clinical picture. Infection with hepatitis A virus, hepatitis D virus, hepatitis E virus, cytomegalovirus, Epstein-Barr virus, herpes simplex viruses types 1 and 2, and varicella zoster virus have all been implicated in severe acute hepatitis. Although hepatitis E virus infection is more common in developing countries, it has been reported in the United States.6 It is unlikely that acute hepatitis C virus infection is producing this degree of elevation in aminotransferase levels.
Reactivation of the patient’s chronic HBV infection can also account for his clinical presentation.
Acute alcoholic hepatitis should be suspected clinically if a patient has a history of heavy alcohol use and clinical and laboratory findings that are compatible with the diagnosis. However, the absolute values of serum aspartate aminotransferase and alanine aminotransferase in acute alcoholic hepatitis are almost always less than 500 IU/L (and typically less than 300 IU/L). Our patient’s values are much higher, and he says he does not drink very much. Although people sometimes underestimate their alcohol intake, alcoholic hepatitis is the least likely diagnosis in our patient.
Case continues: The patient is hospitalized
The patient is admitted with a diagnosis of acute hepatitis. Given his history of chronic hepatitis B, he is empirically started on lamivudine (Epivir-HBV).
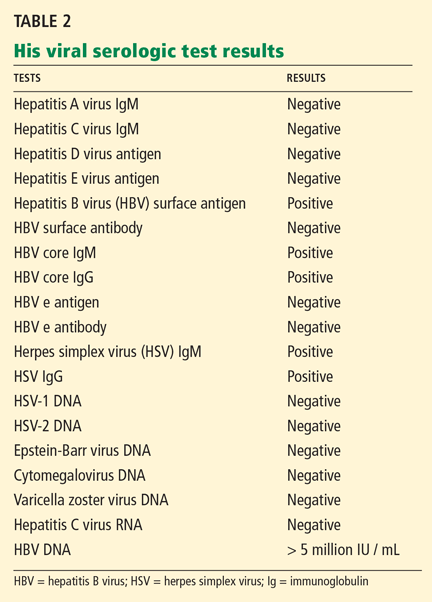
- Antinuclear antibody negative
- Autoimmune liver disease panel negative
- Serum ceruloplasmin 30 mg/dL (normal range 15–60)
- Alpha fetoprotein 35.1 μg/L (< 10).
Abdominal ultrasonography is performed and reveals a small stone in the gallbladder with no evidence of biliary dilatation; otherwise, the gallbladder appears normal. Doppler ultrasonography shows the liver vessels to be patent; the liver is normal in appearance. The abdomen and pelvis appear to be normal on computed tomography without intravenous contrast.
On the third hospital day, the patient’s blood test results are:
- Aspartate aminotransferase 199 U/L (normal range 7–40)
- Alanine aminotransferase 735 U/L (0–45)
- Total bilirubin 22.9 mg/dL (0–1.5)
- International normalized ratio 6.0 (0.77–1.17)
- White blood cell count 5.1 × 10⁹/L (4–11)
- Hemoglobin 11.7 g/dL (12–16)
- Platelet count 166 × 109/L (150–400)
- Blood and urine cultures negative.
WHAT IS CAUSING HIS ACUTE HEPATITIS?
3. On the basis of the new data, which of the following statements about the cause of acute hepatitis in this patient is the most accurate?
- Herpetic hepatitis is the most likely cause, given his positive test for immunoglobulin M (IgM) against herpes simplex virus
- Hepatitis C cannot be excluded with the available data
- Negative HBV e antigen does not exclude the diagnosis of acute exacerbation of HBV infection
- Hepatocellular carcinoma is the likely diagnosis, given the elevated alpha fetoprotein level
The third answer above is correct: a negative test for hepatitis B e antigen does not exclude the diagnosis of acute exacerbation of HBV infection
Herpetic hepatitis. Although not common, hepatitis due to herpes simplex virus infection should be considered in the differential diagnosis of any patient presenting with severe acute hepatitis, particularly when fever is present. Common features of herpetic hepatitis on presentation include high fever, leukopenia, markedly elevated aminotransferases, and mild cholestasis. Vesicular rash occurs in only less than half of cases of herpetic hepatitis.10
Serologic testing is of limited value because it has high rates of false-positive and false-negative results. The diagnosis can be confirmed only by viral polymerase chain reaction testing or by identifying herpes simplex viral inclusions in the liver biopsy.
However, the death rate is high in this disease, and since herpetic hepatitis is one of the few treatable causes of acute liver failure, parenteral acyclovir (Zovirax) should be considered empirically in patients presenting with acute liver failure. Our patient was started on acyclovir when his tests for IgM against herpes simplex virus came back positive.
Hepatitis C. Antibodies against hepatitis C virus do not develop immediately after this virus is contracted; they may take up to 12 weeks to develop after exposure. For this reason, about 30% to 50% of patients with acute hepatitis C virus infection are negative for these antibodies initially. In those patients, hepatitis C virus RNA in the blood is the most sensitive test to detect acute hepatitis C virus infection.
Our patient has neither antibodies against hepatitis C virus nor hepatitis C virus RNA by polymerase chain reaction testing, which rules out hepatitis C virus infection.
Disappearance of e antigen in HBV infection. The disappearance of HBV e antigen is usually associated with a decrease in serum HBV DNA and remission of liver disease. However, some patients continue to have active liver disease and high levels of HBV DNA despite e antigen seroconversion. This is due to a stop codon mutation in the precore region of the viral genome that decreases or prevents production of HBV e antigen.4 In other words, even though HBV e antigen is a good marker of HBV replication in general, a subgroup of patients with chronic HBV infection are negative for e antigen but still have a high rate of viral replication as evidenced by high serum HBV DNA levels.
Patients with perinatally acquired chronic HBV infection most often have immune-tolerant chronic HBV infection. Among those patients (mostly Asian),5,7 the virus is spontaneously cleared at a rate of approximately 2% to 3% per year,8 most often during the second and third decades of age.
Transition from the immune-tolerant phase to the immune clearance phase is frequently associated with mild transient worsening of the liver function profile.9,11,12 However, in a small percentage of patients, hepatic decompensation and even (rarely) death from hepatic failure may occur secondary to a sudden activation of the immune system as it attempts to clear the virus. This may result in an increase in immune-mediated lysis of infected hepatocytes.
Hepatocellular carcinoma. Exacerbation of hepatitis B may be associated with an elevation of alpha fetoprotein, which may falsely raise concerns about the possibility of hepatocellular carcinoma. However, our patient had abdominal imaging with both ultrasonography and computed tomography, which showed no evidence of hepatocellular carcinoma.
Comment. The most likely cause of the patient’s acute liver failure is an acute exacerbation of hepatitis B. However, herpetic hepatitis should be ruled out by testing for herpes simplex virus by polymerase chain reaction, performing a liver biopsy, or both.
Case continues: His condition worsens
A transjugular liver biopsy shows changes associated with chronic hepatitis B, severe acute hepatitis with extensive confluent and submassive hepatic necrosis, and no intracellular viral inclusions. Subsequently, acyclovir is stopped.
On the 6th hospital day, he develops progressive metabolic acidosis and hypotension, with worsening hypoxemia. A chest radiograph is obtained to look for pneumonia, but it is indeterminate; computed tomography of the chest without contrast medium is likewise unremarkable. Duplex ultrasonography of the four extremities is negative for venous thrombosis.
The patient becomes more lethargic and difficult to arouse. He is transferred to the intensive care unit and intubated. His prothrombin and partial thromboplastin times continue to rise, the prothrombin time reaching values of more than 50 seconds. In addition, progressive renal insufficiency develops.
WHAT IS THE NEXT STEP?
4. Which of the following is the most appropriate next step in the management of this patient?
- Liver transplantation
- HBV immunoglobulin only
- Interferon and a nucleoside analogue
- Liver-assist devices
- Continue supportive care only
Liver transplantation. Since the patient’s severe acute hepatitis is accompanied by coagulopathy and encephalopathy, he meets the definition of having acute liver failure. Liver transplantation remains the only definitive therapy.
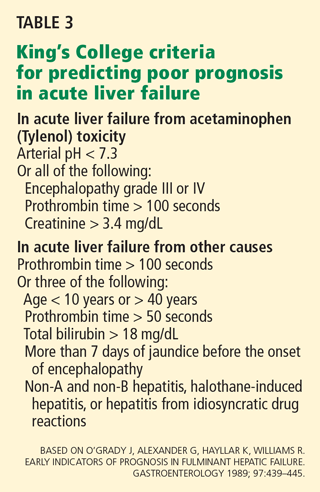
HBV immune globulin immunoprophylaxis is indicated in patients with HBV infection undergoing liver transplantation, to prevent recurrence of hepatitis B after the transplant, particularly in those with a high pretransplant viral load.17 The use of pretransplant antiviral therapy and the posttransplant combination of antiviral therapy and HBV immune globulin has reduced the rate of hepatitis B recurrence to less than 10%. However, immune globulin is by no means the best single next step in managing this patient, who clearly needs a new liver.
Interferon, nucleoside analogues. Options for antiviral treatment are interferon alfa and nucleoside analogues. Interferon therapy is contraindicated in patients such as ours, who have decompensated liver disease, because it can exacerbate the disease.18
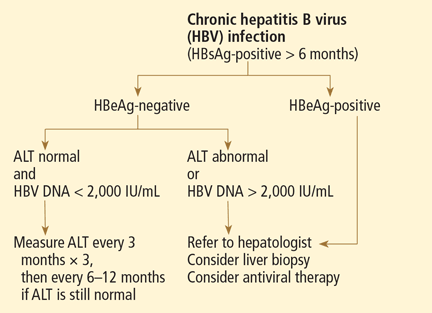
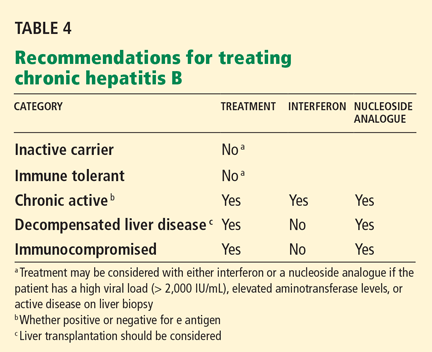
Liver-assist devices. Because liver allografts are in short supply, there has been a strong interest in developing a device that would provide the same benefits for patients with liver failure as hemodialysis does for patients with renal failure. Trials are under way to determine the efficacy and safety of these devices.20
Case continues: He receives a liver
The patient undergoes liver transplantation. He is given HBV immune globulin during and after the surgery.
Pathologic review. Under the microscope, his old liver has widespread necrosis and hemorrhage as well as inflammatory changes suggesting a chronic viral process. Regenerative nodules are present in the small amount of surviving liver parenchyma, consistent with early cirrhosis. Iron staining shows +3 depositions in areas of hepatic collapse (a nonspecific finding). Periodic acid-Schiff staining after diastase (used to detect alpha-1 antitrypsin deficiency) is negative. Herpetic viral inclusions are not present.
An immunoassay for herpes simplex virus antigen is negative. Immunostaining with antibodies to the HBV core antigen is negative. HBV surface antigen is strongly and diffusely positive in the cytoplasm of 80% to 90% of hepatocytes. The immunohistologic staining pattern is consistent with integration of HBV DNA into the DNA of hepatic tissue.
Postoperative course. Lamivudine is continued after surgery, and the patient is sent home. He has resumed the level of functioning he had before becoming ill.
Comment. The outcome of liver transplantation for hepatitis B has notably improved since HBV immune globulin and nucleoside analogues were introduced. The results of liver transplantation for hepatitis B, particuarly patient and graft survival rates, are now better than those in transplant patients with hepatitis C and similar to those in transplant patients with other types of liver disease.21 The combination of HBV immune globulin and lamivudine has cut the rate of HBV reinfection after liver transplantation to approximately 10% and increased the 5-year survival rate after transplantation to about 80%.17,22
KEY POINTS
- In immunocompetent adults, most primary HBV infections are self-limited.
- Chronic HBV infection is defined as the persistence of HBV surface antigen in the serum for at least 6 months. Patients having chronic HBV infection can be broadly classified as inactive carriers or having chronic active disease.
- Most patients with chronic active HBV infection are positive for HBV e antigen, except patients in whom the virus has a mutation in the precore or core region of its genome that prevents the production of e antigen.
- Patients who carry inactive HBV or who are immune-tolerant require serial measurements of aminotransferase and HBV DNA levels. Treatment can be considered if the patient has a high viral load (> 2,000 IU/mL), elevated aminotransferases, or active disease on liver biopsy.
- Carriers of chronic active HBV (whether positive or negative for HBV e antigen) should be referred to a hepatologist for consideration of liver biopsy and treatment.
- Interferon should not be used in immunocompromised patients or those with decompensated liver disease because it can further exacerbate the liver disease.
- Liver transplantation should be considered in patients with acute liver failure who have a poor prognosis according to the King’s College Hospital criteria.
- Dusheiko G. Hepatitis B. In:Bircher J, Benhamou JP, McIntyre N, Rizzetto M, Rodes J, editors. Oxford Textbook of Clinical Hepatology. 2nd ed. Oxford, UK: Oxford University Press; 1999:876–896.
- Chu CJ, Hussain M, Lok AS. Quantitative serum HBV DNA levels during different stages of chronic hepatitis B infection. Hepatology 2002; 36:1408–1415.
- Pawlotsky JM, Bastie A, Hezode C, et al. Routine detection and quantification of hepatitis B virus DNA in clinical laboratories: performance of three commercial assays. J Virol Methods 2000; 85:11–21.
- Brunetto MR, Giarin MM, Oliveri F, et al. Wild-type and e-antigen-minus hepatitis viruses and course of chronic hepatitis. Proc Natl Acad Sci USA 1991; 88:4186–4190.
- Lok AS, Lai CL. A longitudinal follow-up of asymptomatic hepatitis B surface antigen-positive Chinese children. Hepatology 1988; 5:1130–1133.
- Hsu HY, Chang MH, Hsieh KH, et al. Cellular immune response to HBcAg in mother-to-infant transmission of hepatitis B virus. Hepatology 1992; 15:770–776.
- Chang MH, Hsu HY, Hsu HC, Ni YH, Chen JS, Chen DS. The significance of spontaneous hepatitis B e antigen seroconversion in childhood: with special emphasis on the clearance of hepatitis B e antigen before 3 years of age. Hepatology 1995; 22:1387–1392.
- Ruiz-Moreno M, Otero M, Millan A, et al. Clinical and histological outcome after hepatitis B e antigen to antibody seroconversion in children with chronic hepatitis B. Hepatology 1999; 29:572–575.
- Liaw YF, Chu CM, Su IJ, Huang MJ, Lin DY, Chang-Chien CS. Clinical and histological events preceding hepatitis B e antigen seroconversion in chronic type B hepatitis. Gastroenterology 1983; 84:216–219.
- Norvell JP, Blei AT, Jovanovic BD, Levitsky J. Herpes simplex virus hepatitis: an analysis of the published literature and institutional cases. Liver Transplant 2007; 13:1428–1434,
- Liaw YF, Pao CC, Chu CM, Sheen IS, Huang MJ. Changes of serum hepatitis B virus DNA in two types of clinical events preceding spontaneous hepatitis B e antigen seroconversion in chronic type B hepatitis. Hepatology 1987; 7:1–3.
- Maruyama T, Iino S, Koike K, Yasuda K, Milich DR. Serology of acute exacerbation in chronic hepatitis B virus infection. Gastroenterology 1993; 105:1141–1151.
- O'Grady JG, Alexander GJ, Hayllar KM, Williams R. Early indicators of prognosis in fulminant hepatic failure. Gastroenterology 1989; 97:439–445.
- Shakil AO, Kramer D, Mazariegos GV, Fung JJ, Rakela J. Acute liver failure: clinical features, outcome analysis, and applicability of prognostic criteria. Liver Transplant 2000; 6:163–169.
- Anand AC, Nightingale P, Neuberger JM. Early indicators of prognosis in fulminant hepatic failure: an assessment of the King’s criteria. J Hepatol 1997; 26:62–68.
- Schmidt LE, Dalhoff K. Serum phosphate is an early predictor of outcome in severe acetaminophen-induced hepatotoxicity. Hepatology 2002; 36:659–665.
- Samuel D, Muller R, Alexander G, et al. Liver transplantation in European patients with the hepatitis B surface antigen. N Engl J Med 1993; 329:1842–1847.
- Lok A, McMahon BJ. Chronic hepatitis B. Hepatology 2007; 45:507–539.
- Sorren MF, Belangia EA, Costa J, et al. National Institutes of Health consensus development conference statement: management of hepatitis B. Ann Intern Med 2009; 150:104–110.
- Kjaergard LL, Liu J, Als-Nielsen B, Gluud C. Artificial and bioartificial support systems for acute and acute-on-chronic liver failure: a systematic review. JAMA 2003; 289:217–222.
- Kim WR, Poterucha JJ, Kremers WK, Ishitani MB, Dickson ER. Outcome of liver transplantation for hepatitis B in the United States. Liver Transplant 2004; 10:968–974.
- Terrault NA, Zhou S, Combs C, et al. Prophylaxis in liver transplant recipients using a fixed dosing schedule of hepatitis B immunoglobulin. Hepatology 1996; 24:1327–1333.
A 35-year-old man who was born in Vietnam presents to the emergency department of a local hospital because he has had jaundice for 5 days and fatigue, malaise, and anorexia for 2 weeks. He also has nausea and mild epigastric and right upper quadrant abdominal pain. He denies having fevers, chills, night sweats, vomiting, diarrhea, melena, hematochezia, or weight loss.
His medical history is remarkable only for perinatally acquired hepatitis B virus (HBV) infection, for which he never received antiviral therapy. He does not take any prescribed, over-the-counter, or herbal medications.
He lives in the Midwest region of the United States and works full-time as a physician in private practice. He is married and has two children.
He has not travelled recently. He has no pets at home and has not been exposed to any.
He has never smoked. He drinks alcohol socially but has never used recreational drugs.
In a laboratory evaluation performed a year ago for insurance purposes, his liver function tests—serum albumin, total bilirubin, alkaline phosphatase, alanine aminotransferase, and aspartate aminotransferase levels—were all normal. He was positive for HBV surface antigen and HBV e antigen and negative for antibodies against these antigens.
PHASES OF HBV INFECTION
1. Which of the following best describes the status of HBV infection in this patient before his current symptoms developed?
- Resolved HBV infection
- Chronic inactive HBV infection
- Chronic active HBV infection
- Immune-tolerant chronic HBV infection
The correct answer is immune-tolerant chronic HBV infection.
Resolved infection. In immunocompetent adults, most primary HBV infections are self-limited: people clear the virus and gain lasting immunity (defined as the loss of HBV surface antigen, the development of antibody against surface antigen, no detectable HBV DNA in the serum, and normal alanine and aspartate aminotransferase levels). However, a minority of primary HBV infections persist and become chronic.
Chronic HBV infection is defined as the persistence of HBV surface antigen in the serum for at least 6 months. Patients with chronic HBV infection can be broadly classified as having either inactive disease (the inactive surface antigen carrier state) or chronic active hepatitis B (Figure 1).1–9
Chronic inactive HBV infection. Carriers of inactive HBV infection have low serum levels of HBV DNA (< 2,000 IU/mL), persistently normal aminotransferase levels, and no HBV e antigen; if a liver biopsy is performed, no significant hepatitis is found.
Chronic active HBV infection. Patients with chronic active HBV infection, in contrast, have high serum HBV DNA levels (> 20,000 IU/mL) and persistently or intermittently high aminotransferase levels; they do have HBV e antigen, and a liver biopsy shows moderate or severe necroinflammation.
A small group of patients with chronic active hepatitis B may be negative for e antigen but still have high aminotransferase levels, high HBV DNA levels, and continued necroinflammation in the liver.4 The virus in these patients has a mutation in its precore or core promoter gene that prevents the production of e antigen.
Patients with chronic active HBV infection (whether positive or negative for e antigen) are at a significantly greater risk of progressive liver injury and developing cirrhosis and hepatocellular carcinoma than are inactive carriers of HBV.
Immune-tolerant chronic HBV infection. Patients who acquired HBV at birth (eg, our patient) may have immune-tolerant HBV infection, which is characterized by significant HBV replication manifested by the presence of HBV e antigen and high levels of HBV DNA in the serum. However, these patients have no clinical or pathologic evidence of active liver disease (no symptoms, normal serum alanine aminotransferase levels, and minimal changes on liver biopsy).5 This was obviously the case in our patient, based on his history and laboratory results before his current symptoms developed.
Case continues: Liver function abnormalities
On physical examination, the patient’s temperature is 99.9°F (37.7°C), heart rate 106 per minute, blood pressure 98/54 mm Hg, respiratory rate 18 per minute, and oxygen saturation 100% while breathing ambient air. He is alert and oriented to time, place, and person.
He has icteric sclera, and his skin is jaundiced. His lymph nodes are not palpable. His cardiac examination is normal except for tachycardia. His lungs are clear to auscultation and percussion. He has mild epigastric and right upper quadrant abdominal tenderness with no peritoneal signs, hepatosplenomegaly, or masses.
His basic laboratory values on admission are listed in Table 1. His amylase and lipase levels are normal. A urine dipstick test is positive for bilirubin.
WHAT IS THE LEAST LIKELY DIAGNOSIS?
2. Which one of the following is the least likely diagnosis in this patient?
- Reactivation of hepatitis B
- Drug-associated liver injury
- Acute viral hepatitis
- Acute alcoholic hepatitis
- Ischemic hepatitis
The degree and pattern of liver function abnormalities in our patient reflect hepatocellular injury rather than cholestatic liver disease, because his aminotransferase levels are elevated much higher than his alkaline phosphatase level (Table 1). Bilirubin elevation does not help differentiate the two conditions.
The degree and pattern of aminotransferase elevations are also helpful in narrowing the differential diagnosis. Serum aminotransferase levels of more than 1,000 U/L are mainly seen in patients with ischemic, viral, and toxininduced liver injury. Other rare causes of such high levels include Budd-Chiari syndrome, Wilson disease, and autoimmune hepatitis.
Ischemic hepatitis. Our patient has mild hypotension, but it does not seem to have been severe enough or of long enough duration to have caused ischemic hepatitis.
Drug-associated liver injury. Hepatotoxicity associated with drugs (most commonly acetaminophen [Tylenol]), herbal therapy, or mushroom poisoning should be considered in any patient whose aminotransferase levels are this high. However, our patient denies taking any medications (prescribed or over-the-counter), herbal remedies, or illicit drugs.
Acute viral hepatitis can certainly explain the patient’s clinical picture. Infection with hepatitis A virus, hepatitis D virus, hepatitis E virus, cytomegalovirus, Epstein-Barr virus, herpes simplex viruses types 1 and 2, and varicella zoster virus have all been implicated in severe acute hepatitis. Although hepatitis E virus infection is more common in developing countries, it has been reported in the United States.6 It is unlikely that acute hepatitis C virus infection is producing this degree of elevation in aminotransferase levels.
Reactivation of the patient’s chronic HBV infection can also account for his clinical presentation.
Acute alcoholic hepatitis should be suspected clinically if a patient has a history of heavy alcohol use and clinical and laboratory findings that are compatible with the diagnosis. However, the absolute values of serum aspartate aminotransferase and alanine aminotransferase in acute alcoholic hepatitis are almost always less than 500 IU/L (and typically less than 300 IU/L). Our patient’s values are much higher, and he says he does not drink very much. Although people sometimes underestimate their alcohol intake, alcoholic hepatitis is the least likely diagnosis in our patient.
Case continues: The patient is hospitalized
The patient is admitted with a diagnosis of acute hepatitis. Given his history of chronic hepatitis B, he is empirically started on lamivudine (Epivir-HBV).
- Antinuclear antibody negative
- Autoimmune liver disease panel negative
- Serum ceruloplasmin 30 mg/dL (normal range 15–60)
- Alpha fetoprotein 35.1 μg/L (< 10).
Abdominal ultrasonography is performed and reveals a small stone in the gallbladder with no evidence of biliary dilatation; otherwise, the gallbladder appears normal. Doppler ultrasonography shows the liver vessels to be patent; the liver is normal in appearance. The abdomen and pelvis appear to be normal on computed tomography without intravenous contrast.
On the third hospital day, the patient’s blood test results are:
- Aspartate aminotransferase 199 U/L (normal range 7–40)
- Alanine aminotransferase 735 U/L (0–45)
- Total bilirubin 22.9 mg/dL (0–1.5)
- International normalized ratio 6.0 (0.77–1.17)
- White blood cell count 5.1 × 10⁹/L (4–11)
- Hemoglobin 11.7 g/dL (12–16)
- Platelet count 166 × 109/L (150–400)
- Blood and urine cultures negative.
WHAT IS CAUSING HIS ACUTE HEPATITIS?
3. On the basis of the new data, which of the following statements about the cause of acute hepatitis in this patient is the most accurate?
- Herpetic hepatitis is the most likely cause, given his positive test for immunoglobulin M (IgM) against herpes simplex virus
- Hepatitis C cannot be excluded with the available data
- Negative HBV e antigen does not exclude the diagnosis of acute exacerbation of HBV infection
- Hepatocellular carcinoma is the likely diagnosis, given the elevated alpha fetoprotein level
The third answer above is correct: a negative test for hepatitis B e antigen does not exclude the diagnosis of acute exacerbation of HBV infection
Herpetic hepatitis. Although not common, hepatitis due to herpes simplex virus infection should be considered in the differential diagnosis of any patient presenting with severe acute hepatitis, particularly when fever is present. Common features of herpetic hepatitis on presentation include high fever, leukopenia, markedly elevated aminotransferases, and mild cholestasis. Vesicular rash occurs in only less than half of cases of herpetic hepatitis.10
Serologic testing is of limited value because it has high rates of false-positive and false-negative results. The diagnosis can be confirmed only by viral polymerase chain reaction testing or by identifying herpes simplex viral inclusions in the liver biopsy.
However, the death rate is high in this disease, and since herpetic hepatitis is one of the few treatable causes of acute liver failure, parenteral acyclovir (Zovirax) should be considered empirically in patients presenting with acute liver failure. Our patient was started on acyclovir when his tests for IgM against herpes simplex virus came back positive.
Hepatitis C. Antibodies against hepatitis C virus do not develop immediately after this virus is contracted; they may take up to 12 weeks to develop after exposure. For this reason, about 30% to 50% of patients with acute hepatitis C virus infection are negative for these antibodies initially. In those patients, hepatitis C virus RNA in the blood is the most sensitive test to detect acute hepatitis C virus infection.
Our patient has neither antibodies against hepatitis C virus nor hepatitis C virus RNA by polymerase chain reaction testing, which rules out hepatitis C virus infection.
Disappearance of e antigen in HBV infection. The disappearance of HBV e antigen is usually associated with a decrease in serum HBV DNA and remission of liver disease. However, some patients continue to have active liver disease and high levels of HBV DNA despite e antigen seroconversion. This is due to a stop codon mutation in the precore region of the viral genome that decreases or prevents production of HBV e antigen.4 In other words, even though HBV e antigen is a good marker of HBV replication in general, a subgroup of patients with chronic HBV infection are negative for e antigen but still have a high rate of viral replication as evidenced by high serum HBV DNA levels.
Patients with perinatally acquired chronic HBV infection most often have immune-tolerant chronic HBV infection. Among those patients (mostly Asian),5,7 the virus is spontaneously cleared at a rate of approximately 2% to 3% per year,8 most often during the second and third decades of age.
Transition from the immune-tolerant phase to the immune clearance phase is frequently associated with mild transient worsening of the liver function profile.9,11,12 However, in a small percentage of patients, hepatic decompensation and even (rarely) death from hepatic failure may occur secondary to a sudden activation of the immune system as it attempts to clear the virus. This may result in an increase in immune-mediated lysis of infected hepatocytes.
Hepatocellular carcinoma. Exacerbation of hepatitis B may be associated with an elevation of alpha fetoprotein, which may falsely raise concerns about the possibility of hepatocellular carcinoma. However, our patient had abdominal imaging with both ultrasonography and computed tomography, which showed no evidence of hepatocellular carcinoma.
Comment. The most likely cause of the patient’s acute liver failure is an acute exacerbation of hepatitis B. However, herpetic hepatitis should be ruled out by testing for herpes simplex virus by polymerase chain reaction, performing a liver biopsy, or both.
Case continues: His condition worsens
A transjugular liver biopsy shows changes associated with chronic hepatitis B, severe acute hepatitis with extensive confluent and submassive hepatic necrosis, and no intracellular viral inclusions. Subsequently, acyclovir is stopped.
On the 6th hospital day, he develops progressive metabolic acidosis and hypotension, with worsening hypoxemia. A chest radiograph is obtained to look for pneumonia, but it is indeterminate; computed tomography of the chest without contrast medium is likewise unremarkable. Duplex ultrasonography of the four extremities is negative for venous thrombosis.
The patient becomes more lethargic and difficult to arouse. He is transferred to the intensive care unit and intubated. His prothrombin and partial thromboplastin times continue to rise, the prothrombin time reaching values of more than 50 seconds. In addition, progressive renal insufficiency develops.
WHAT IS THE NEXT STEP?
4. Which of the following is the most appropriate next step in the management of this patient?
- Liver transplantation
- HBV immunoglobulin only
- Interferon and a nucleoside analogue
- Liver-assist devices
- Continue supportive care only
Liver transplantation. Since the patient’s severe acute hepatitis is accompanied by coagulopathy and encephalopathy, he meets the definition of having acute liver failure. Liver transplantation remains the only definitive therapy.
HBV immune globulin immunoprophylaxis is indicated in patients with HBV infection undergoing liver transplantation, to prevent recurrence of hepatitis B after the transplant, particularly in those with a high pretransplant viral load.17 The use of pretransplant antiviral therapy and the posttransplant combination of antiviral therapy and HBV immune globulin has reduced the rate of hepatitis B recurrence to less than 10%. However, immune globulin is by no means the best single next step in managing this patient, who clearly needs a new liver.
Interferon, nucleoside analogues. Options for antiviral treatment are interferon alfa and nucleoside analogues. Interferon therapy is contraindicated in patients such as ours, who have decompensated liver disease, because it can exacerbate the disease.18
Liver-assist devices. Because liver allografts are in short supply, there has been a strong interest in developing a device that would provide the same benefits for patients with liver failure as hemodialysis does for patients with renal failure. Trials are under way to determine the efficacy and safety of these devices.20
Case continues: He receives a liver
The patient undergoes liver transplantation. He is given HBV immune globulin during and after the surgery.
Pathologic review. Under the microscope, his old liver has widespread necrosis and hemorrhage as well as inflammatory changes suggesting a chronic viral process. Regenerative nodules are present in the small amount of surviving liver parenchyma, consistent with early cirrhosis. Iron staining shows +3 depositions in areas of hepatic collapse (a nonspecific finding). Periodic acid-Schiff staining after diastase (used to detect alpha-1 antitrypsin deficiency) is negative. Herpetic viral inclusions are not present.
An immunoassay for herpes simplex virus antigen is negative. Immunostaining with antibodies to the HBV core antigen is negative. HBV surface antigen is strongly and diffusely positive in the cytoplasm of 80% to 90% of hepatocytes. The immunohistologic staining pattern is consistent with integration of HBV DNA into the DNA of hepatic tissue.
Postoperative course. Lamivudine is continued after surgery, and the patient is sent home. He has resumed the level of functioning he had before becoming ill.
Comment. The outcome of liver transplantation for hepatitis B has notably improved since HBV immune globulin and nucleoside analogues were introduced. The results of liver transplantation for hepatitis B, particuarly patient and graft survival rates, are now better than those in transplant patients with hepatitis C and similar to those in transplant patients with other types of liver disease.21 The combination of HBV immune globulin and lamivudine has cut the rate of HBV reinfection after liver transplantation to approximately 10% and increased the 5-year survival rate after transplantation to about 80%.17,22
KEY POINTS
- In immunocompetent adults, most primary HBV infections are self-limited.
- Chronic HBV infection is defined as the persistence of HBV surface antigen in the serum for at least 6 months. Patients having chronic HBV infection can be broadly classified as inactive carriers or having chronic active disease.
- Most patients with chronic active HBV infection are positive for HBV e antigen, except patients in whom the virus has a mutation in the precore or core region of its genome that prevents the production of e antigen.
- Patients who carry inactive HBV or who are immune-tolerant require serial measurements of aminotransferase and HBV DNA levels. Treatment can be considered if the patient has a high viral load (> 2,000 IU/mL), elevated aminotransferases, or active disease on liver biopsy.
- Carriers of chronic active HBV (whether positive or negative for HBV e antigen) should be referred to a hepatologist for consideration of liver biopsy and treatment.
- Interferon should not be used in immunocompromised patients or those with decompensated liver disease because it can further exacerbate the liver disease.
- Liver transplantation should be considered in patients with acute liver failure who have a poor prognosis according to the King’s College Hospital criteria.
- Dusheiko G. Hepatitis B. In:Bircher J, Benhamou JP, McIntyre N, Rizzetto M, Rodes J, editors. Oxford Textbook of Clinical Hepatology. 2nd ed. Oxford, UK: Oxford University Press; 1999:876–896.
- Chu CJ, Hussain M, Lok AS. Quantitative serum HBV DNA levels during different stages of chronic hepatitis B infection. Hepatology 2002; 36:1408–1415.
- Pawlotsky JM, Bastie A, Hezode C, et al. Routine detection and quantification of hepatitis B virus DNA in clinical laboratories: performance of three commercial assays. J Virol Methods 2000; 85:11–21.
- Brunetto MR, Giarin MM, Oliveri F, et al. Wild-type and e-antigen-minus hepatitis viruses and course of chronic hepatitis. Proc Natl Acad Sci USA 1991; 88:4186–4190.
- Lok AS, Lai CL. A longitudinal follow-up of asymptomatic hepatitis B surface antigen-positive Chinese children. Hepatology 1988; 5:1130–1133.
- Hsu HY, Chang MH, Hsieh KH, et al. Cellular immune response to HBcAg in mother-to-infant transmission of hepatitis B virus. Hepatology 1992; 15:770–776.
- Chang MH, Hsu HY, Hsu HC, Ni YH, Chen JS, Chen DS. The significance of spontaneous hepatitis B e antigen seroconversion in childhood: with special emphasis on the clearance of hepatitis B e antigen before 3 years of age. Hepatology 1995; 22:1387–1392.
- Ruiz-Moreno M, Otero M, Millan A, et al. Clinical and histological outcome after hepatitis B e antigen to antibody seroconversion in children with chronic hepatitis B. Hepatology 1999; 29:572–575.
- Liaw YF, Chu CM, Su IJ, Huang MJ, Lin DY, Chang-Chien CS. Clinical and histological events preceding hepatitis B e antigen seroconversion in chronic type B hepatitis. Gastroenterology 1983; 84:216–219.
- Norvell JP, Blei AT, Jovanovic BD, Levitsky J. Herpes simplex virus hepatitis: an analysis of the published literature and institutional cases. Liver Transplant 2007; 13:1428–1434,
- Liaw YF, Pao CC, Chu CM, Sheen IS, Huang MJ. Changes of serum hepatitis B virus DNA in two types of clinical events preceding spontaneous hepatitis B e antigen seroconversion in chronic type B hepatitis. Hepatology 1987; 7:1–3.
- Maruyama T, Iino S, Koike K, Yasuda K, Milich DR. Serology of acute exacerbation in chronic hepatitis B virus infection. Gastroenterology 1993; 105:1141–1151.
- O'Grady JG, Alexander GJ, Hayllar KM, Williams R. Early indicators of prognosis in fulminant hepatic failure. Gastroenterology 1989; 97:439–445.
- Shakil AO, Kramer D, Mazariegos GV, Fung JJ, Rakela J. Acute liver failure: clinical features, outcome analysis, and applicability of prognostic criteria. Liver Transplant 2000; 6:163–169.
- Anand AC, Nightingale P, Neuberger JM. Early indicators of prognosis in fulminant hepatic failure: an assessment of the King’s criteria. J Hepatol 1997; 26:62–68.
- Schmidt LE, Dalhoff K. Serum phosphate is an early predictor of outcome in severe acetaminophen-induced hepatotoxicity. Hepatology 2002; 36:659–665.
- Samuel D, Muller R, Alexander G, et al. Liver transplantation in European patients with the hepatitis B surface antigen. N Engl J Med 1993; 329:1842–1847.
- Lok A, McMahon BJ. Chronic hepatitis B. Hepatology 2007; 45:507–539.
- Sorren MF, Belangia EA, Costa J, et al. National Institutes of Health consensus development conference statement: management of hepatitis B. Ann Intern Med 2009; 150:104–110.
- Kjaergard LL, Liu J, Als-Nielsen B, Gluud C. Artificial and bioartificial support systems for acute and acute-on-chronic liver failure: a systematic review. JAMA 2003; 289:217–222.
- Kim WR, Poterucha JJ, Kremers WK, Ishitani MB, Dickson ER. Outcome of liver transplantation for hepatitis B in the United States. Liver Transplant 2004; 10:968–974.
- Terrault NA, Zhou S, Combs C, et al. Prophylaxis in liver transplant recipients using a fixed dosing schedule of hepatitis B immunoglobulin. Hepatology 1996; 24:1327–1333.
What’s new in prostate cancer screening and prevention?
In spite of some recent studies, or perhaps because of them, we still are unsure about how best to screen for and prevent prostate cancer. Two large trials of screening with prostate-specific antigen (PSA) measurements came to seemingly opposite conclusions.1,2 Furthermore, a large trial of selenium and vitamin E found that these agents have no value as preventive agents.3
Nevertheless, negative studies also advance science, and steady progress is being made in prostate cancer research. In this paper I briefly summarize and comment on some of the recent findings.
TO SCREEN OR NOT TO SCREEN?
All cases of prostate cancer are clinically relevant in that they can cause anxiety or can lead to treatment-related morbidity. The challenge is to detect the minority of cases of cancer that are biologically significant, ie, those that will cause serious illness or death.
Many men have prostate cancer
In the United States, the lifetime probability of developing prostate cancer is 1 in 6, and the probability increases with age. Prostate cancer is primarily a disease of the Western world, but it is becoming more common in other areas as well.
Risk factors for prostate cancer are age, race, and family history. Clinically apparent disease is very rare in men younger than 40 years; until recently, most guidelines suggested that screening for it should begin at age 50. African American men have the highest risk of developing and dying of prostate cancer, for reasons that are not clear. In the past, this finding was attributed to disparities in access and less aggressive therapy in black men, but recent studies suggest the differences persist even in the absence of these factors, suggesting there is a biological difference in cancers between blacks and whites. Having a father or brother who had prostate cancer increases one’s risk twofold (threefold if the father or brother was affected before the age of 60); having a father and a brother with prostate cancer increases one’s risk fourfold, and true hereditary cancer raises the risk fivefold.4
But relatively few men die of it
The Scandinavian Prostate Cancer Group5 randomized 695 men with early prostate cancer (mostly discovered by digital rectal examination or by symptoms) to undergo either radical prostatectomy or a program of watchful waiting. In 8.2 years of follow-up, 8.6% of the men in the surgery group and 14.4% of those in the watchful waiting group died of prostate cancer. Thus, we can conclude that surgery is beneficial in this situation.
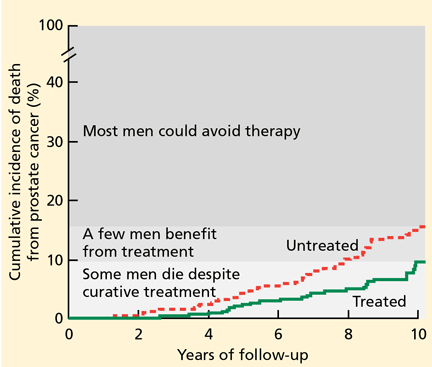
Despite these calculations, in contemporary practice in the United States, about 90% of men with newly diagnosed low-grade prostate cancer choose to be treated.6 This high level of intervention reflects our current inability to predict which cancers will remain indolent vs which will progress and the lack of validated markers that tell us when to intervene in patients who are managed expectantly and not lose the chance for cure. Most often, patients and their physicians, who are paid to intervene, deal with this uncertainty by choosing the high likelihood of cure with early intervention despite treatment-related morbidity.
What PSA has wrought
When PSA screening was introduced in the late 1980s and early 1990s, it brought about several changes in the epidemiology and clinical profile of this disease that led us to believe that it was making a meaningful difference.
A spike in the apparent incidence of prostate cancer occurred in the late 1980s and early 1990s with the introduction of PSA screening. The spike was temporary, representing detection of preexisting cases. Now, the incidence may have leveled off.7
A shift in the stages of cancers detected. In 1982, half of men with newly diagnosed prostate cancer had incurable disease.8 Five years after the introduction of PSA testing, 95% had curable disease.9
An increase in the rate of cure after radical prostatectomy was seen.
A decrease in the death rate from prostate cancer since the early 1990s has been noted, which is likely due not only to earlier detection but also to earlier and better treatment.
Limitations of PSA screening
PSA screening has low specificity. PSA is more sensitive than digital rectal examination, but most men with “elevated” PSA do not have prostate cancer. Nevertheless, although it is not a perfect screening test, it is still the best cancer marker that we have.
In the Prostate Cancer Prevention Trial (PCPT),10 finasteride (Proscar) decreased the incidence of prostate cancer by about 25% over 7 years. But there were also lessons to be learned from the placebo group, which underwent PSA testing every year and prostate biopsy at the end of the study.
We used to think the cutoff PSA level that had high sensitivity and specificity for finding cancer was 4 ng/mL. However, in the PCPT, 6.6% of men with PSA levels below 0.5 ng/mL were found to have cancer, and 12.5% of those cancers were high-grade. Of those with PSA levels of 3.1 to 4.0 ng/mL, 26.9% had cancer, and 25.0% of the cancers were high-grade. These data demonstrate that there is no PSA level below which risk of cancer is zero, and that there is no PSA cutoff with sufficient sensitivity and specificity to be clinically useful.
The PCPT risk calculator (http://deb.uthscsa.edu/URORiskCalc/Pages/uroriskcalc.jsp) is a wonderful tool that came out of that study. It uses seven variables—race, age, PSA level, family history of prostate cancer, findings on digital rectal examination, whether the patient has ever undergone a prostate biopsy, and whether the patient is taking finasteride—and calculates the patient’s risk of harboring prostate cancer and, more important, the risk of having high-grade prostate cancer. This tool allows estimation of individual risk and helps identify who is at risk of cancer that may require therapy.
Other factors can affect PSA levels. Men with a higher body mass index have lower PSA levels. The reason is not clear; it may be a hormonal effect, or heavier men may simply have higher blood volume, which may dilute the PSA. Furthermore, there are genetic differences that make some men secrete more PSA, but this effect is probably not clinically important. And a study by Hamilton et al11 suggested that statin drugs lower PSA levels. As these findings are confirmed, in the future it may be necessary to adjust PSA levels to account for their effects before deciding on the need for biopsy.
Two new, conflicting studies
Two large trials of PSA screening, published simultaneously in March 2009, came to opposite conclusions.
The European Randomized Study of Screening for Prostate Cancer2 randomized 162,243 men between the ages of 55 and 69 to undergo PSA screening at an average of once every 4 years or to a control group. Most of the participating centers used a PSA level of 3.0 ng/mL as an indication for biopsy. At an average follow-up time of 8.8 years, 214 men had died of prostate cancer in the screening group, compared with 326 in the control group, for an adjusted rate ratio of 0.80 (95% confidence interval [CI] 0.65–0.98, P = .04). In other words, screening decreased the risk of death from prostate cancer by 20%.
The Prostate, Lung, Colorectal, and Ovarian (PLCO) Cancer Screening Trial,1 conducted in the United States, came to the opposite conclusion, ie, that there is no benefit from PSA screening. This study was smaller, with 76,693 men between ages 55 and 74 randomly assigned to receive PSA testing every year for 6 years and digital rectal examination for 4 years, or usual care. A PSA level of more than 4.0 ng/mL was considered to be positive for prostate cancer. At 7 years, of those who reported undergoing no more than one PSA test at baseline, 48 men had died of prostate cancer in the screening group, compared with 41 in the control group (rate ratio 1.16, 95% CI 0.76–1.76).
Why were the findings different? The PLCO investigators offered several possible explanations for their negative results. The PSA threshold of 4 ng/mL that was used in that study may not be effective. More than half the men in the control group actually had a PSA test in the first 6 years of the study, potentially diluting any effect of testing. (This was the most worrisome flaw in the study, in my opinion.) About 44% of the men in the study had already had one or more PSA tests at baseline, which would have eliminated cancers detectable on screening from the study, and not all men who were advised to undergo biopsy actually did so. The follow-up time may not yet be long enough for the benefit to be apparent. Most important, in their opinion, treatment for prostate cancer improved during the time of the trial, so that fewer men than expected died of prostate cancer in both groups.
Improvements to PSA screening
Derivatives of PSA have been used in an attempt to improve its performance characteristics for detecting cancer.
PSA density, defined as serum PSA divided by prostate volume, has some predictive power but requires performance of transrectal ultrasonography. It is therefore not a good screening test in the primary care setting.
PSA velocity or doubling time, based on the rate of change over time, is predictive of prostate cancer, but is highly dependent on the absolute value of PSA and does not add independent information to the variables defined in the PCPT risk calculator or other standard predictive variables.12
A PSA level between the ages of 44 and 50 may predict the lifetime risk of prostate cancer, according to a study by Lilja et al13 in Sweden. This finding suggests that we should measure PSA early in life and screen men who have higher values more frequently or with better strategies. This recommendation has been adopted by the American Urological Association, which released updated screening guidelines in April 2009 (available at www.auanet.org/content/guidelines-and-quality-care/clinical-guidelines/main-reports/psa09.pdf).
New markers under study
A number of new biological markers probably will improve our ability to detect prostate cancer, although they are not yet ready for widespread use.
Urinary PCA3. Prostate cancer gene 3 (PCA3) codes for a messenger RNA that is highly overexpressed in the urine of men with prostate cancer. Urine is collected after prostate massage. Marks et al14 reported that PCA3 scores predicted biopsy outcomes in men with serum PSA levels of 2.5 ng/mL or higher.
Serum EPCA-2 (early prostate cancer antigen 2) is another candidate marker undergoing study.
Gene fusions, specifically of TRMPSS2 and the ETS gene family, are detectable in high levels in the urine of some men with prostate cancer, and appear to be very promising markers for detection.
Metabolomics is a technique that uses mass spectroscopy to detect the metabolic signature of cancer. Sreekumar et al15 identified sarcosine as a potential marker of prostate cancer using this technique.
Genetic tests: Not yet
Some data suggest that we can use genetic tests to screen for prostate cancer, but the tests are not yet as good as we would like.
Zheng et al16 reported that 16 singlenucleotide polymorphisms (SNPs) in five chromosomal regions plus a family history of prostate cancer have a cumulative association with prostate cancer: men who had any five or more of these SNPs had a risk of prostate cancer nearly 10 times as high as men without any of them. However, the number of men who actually fall into this category is so low that routine use in the general population is not cost-effective; it may, however, be useful in men with a family history of prostate cancer.
Other SNPs have been linked to prostate cancer (reviewed by Witte17). Having any one of these loci increases one’s risk only modestly, however. Only about 2% of the population has five or more of these SNPS, and the sensitivity is about only about 16%.
A commercially available DNA test (Decode Genetics, Reykjavik, Iceland) can detect eight variants that, according to the company, account for about half of all cases of prostate cancer.
Prostate cancer screening: My interpretation
I believe the two new studies of PSA screening suggest there is a modest benefit from screening in terms of preventing deaths from prostate cancer. But I also believe we should be more judicious in recommending treatment for men whom we know have biologically indolent tumors, although we cannot yet identify them perfectly.
In the past, we used an arbitrary PSA cutoff to detect prostate cancer of any grade, and men with high levels were advised to have a biopsy. Currently, we use continuous-risk models to look for any cancer and biologically significant cancers. These involve nomograms, a risk calculator, and new markers.
We use the PCPT risk calculator routinely in our practice. I recommend—completely arbitrarily—that a man undergo biopsy if he has a 10% or higher risk of high-grade cancer, but not if the risk is less. I believe this is more accurate than a simple PSA cutoff value.
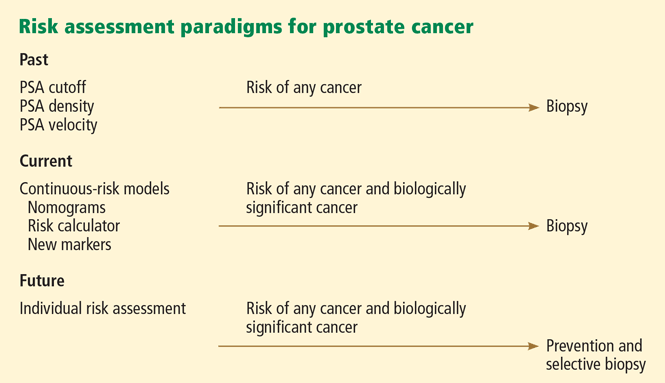
CAN WE PREVENT PROSTATE CANCER?
Prostate cancer is a significant public health risk, with 186,000 new cases and 26,000 deaths yearly. Its risk factors (age, race, and genes) are not modifiable. The benefit of screening in terms of preventing deaths is not as good as we would like, and therapy is associated with morbidity. That leaves prevention as a potential way to reduce the morbidity and perhaps mortality of prostate cancer and its therapy.
Epidemiologic studies suggest that certain lifestyle factors may increase the risk, ie, consumption of fat, red meat, fried foods, and dairy; high calcium intake; smoking; total calories; and body size. Other factors may decrease the risk: plant-based foods and vegetables, especially lycopene-containing foods such as tomatoes, cruciferous vegetables, soy, and legumes, specific nutrients such as carotenoids, lycopene, total antioxidants, fish oil (omega-3 fatty acids), and moderate to vigorous exercise. However, there have been few randomized trials to determine if any of these agents are beneficial.
Findings of trials of prevention
Selenium and vitamin E do not prevent prostate cancer, lung cancer, colorectal cancer, other primary cancers, or deaths. The Selenium and Vitamin E Cancer Prevention Trial (SELECT)3 involved 35,533 men 55 years of age or older (or 50 and older if they were African American). They were randomized to receive one of four treatments: selenium 200 μg/day plus vitamin E placebo, vitamin E 400 IU/day plus selenium placebo, selenium plus vitamin E, or double placebo. At a median follow-up of 5.46 years, compared with the placebo group, the hazard ratio for prostate cancer was 1.04 in the selenium-only group, 1.13 in the vitamin E-only group, and 1.05 in the selenium-plus-vitamin E group. None of the differences was statistically significant.
The Physician’s Health Study18 also found that vitamin E at the same dose given every other day does not prevent prostate cancer.
Finasteride prevents prostate cancer. The PCPT19 included 18,882 men, 55 years of age or older, who had PSA levels of 3.0 ng/mL or less and normal findings on digital rectal examination. Treatment was with finasteride 5 mg/day or placebo. At 7 years, prostate cancer had been discovered in 18.4% of the finasteride group vs 24.4% of the placebo group, a 24.8% reduction (95% CI 18.6–30.6, P < .001). Sexual side effects were more common in the men who received finasteride, while urinary symptoms were more common in the placebo group.
At the time of the original PCPT report in 2003,19 tumors of Gleason grade 7 or higher were more common in the finasteride group, accounting for 37.0% of the tumors discovered, than in the placebo group (22.2%), creating concern that finasteride might somehow cause the tumors that occurred to be more aggressive. However, a subsequent analysis20 found the opposite to be true, ie, that finasteride decreases the risk of high-grade cancers. A companion quality-of-life study showed that chronic use of finasteride had clinically insignificant effects on sexual function, and the PCPT and other studies have shown benefits of finasteride in reducing lower urinary tract symptoms due to benign prostatic hyperplasia (BPH), reducing the risk of acute urinary retention and the need for surgical intervention for BPH, and reducing the risk of prostatitis.
Dutasteride also prevents prostate cancer. A large-scale trial of another 5-alpha reductase inhibitor, dutasteride (Avodart), was reported by Andriole at the annual meeting of the American Urological Association in April 2009.21 The Reduction by Dutasteride of Prostate Events (REDUCE) trial included men who were 50 to 75 years old, inclusively, and who had PSA levels between 2.5 and 10 ng/mL, prostate volume less than 80 cc, and one prior negative prostate biopsy within 6 months of enrollment, representing a group at high risk for cancer on a subsequent biopsy. The trial accrued 8,231 men. At 4 years, prostate cancer had occurred in 659 men in the dutasteride group vs 857 in the placebo group, a 23% reduction (P < .0001). Interestingly, no significant increase in Gleason grade 8 to grade 10 tumors was observed in the study.
Preliminary analyses also suggest that dutasteride enhanced the utility of PSA as a diagnostic test for prostate cancer, had beneficial effects on BPH, and was generally well tolerated. The fact that the results of REDUCE were congruent with those of the PCPT with respect to the magnitude of risk reduction, beneficial effects on benign prostatic hypertrophy, minimal toxicity, and no issues related to tumor grade suggests a class effect for 5-alpha reductase inhibitors, and suggests that these agents should be used more liberally for the prevention of prostate cancer.
There is current debate about whether 5-alpha reductase inhibitors should be used by all men at risk of prostate cancer or only by those at high risk. However, the American Urological Association and the American Society of Clinical Oncology have issued guidelines stating that men at risk should consider this intervention.22
- Andriole GL, Grubb RL, Buys SS, et al; PLCO Project Team. Mortality results from a randomized prostate cancer screening trial. N Engl J Med 2009; 360:1310–1319.
- Schröder FH, Hugosson J, Roobol MJ, et al; ERSPC Investigators. Screening and prostate cancer mortality in a randomized European study. N Engl J Med 2009; 360:1351–1354.
- Lippman SM, Klein EA, Goodman PJ, et al. Effect of selenium and vitamin E on risk of prostate cancer and other cancers: the Selenium and Vitamin E Cancer Prevention Trial (SELECT). JAMA 2009; 301:39–51.
- Bratt O. Hereditary prostate cancer: clinical aspects. J Urol 2002; 168:906–913.
- Bill-Axelson A, Holmberg L, Ruutu M, et al; Scandinavian Prostate Cancer Group Study No. 4. Radical prostatectomy versus watchful waiting in early prostate cancer. N Engl J Med 2005; 352:1977–1984.
- Cooperberg MR, Broering JM, Kantoff PW, Carroll PR. Contemporary trends in low risk prostate cancer: risk assessment and treatment. J Urol 2007; 178:S14–S19.
- Horner MJ, Ries LAG, Krapcho M, et al, editors. SEER Cancer Statistics Review, 1975–2006, National Cancer Institute. Bethesda, MD, http://seer.cancer.gov/csr/1975_2006/, based on November 2008 SEER data submission, posted to the SEER web site, 2009. Accessed 6/28/2009.
- Murphy GP, Natarajan N, Pontes JE, et al. The national survey of prostate cancer in the United States by the American College of Surgeons. J Urol 1982; 127:928–934.
- Catalona WJ, Smith DS, Ratliff TL, Basler JW. Detection of organconfined prostate cancer is increased through prostate-specific antigen-based screening. JAMA 1993; 270:948–954.
- Thompson IM, Pauler DK, Goodman PJ, et al. Prevalence of prostate cancer among men with a prostate-specific antigen level < or = 4.0 ng per milliliter. N Engl J Med 2004; 350:2239–2246.
- Hamilton RJ, Goldberg KC, Platz EA, Freedland SJ. The influence of statin medications on prostate-specific antigen levels. N Natl Cancer Inst 2008; 100:1487–1488.
- Vickers AJ, Savage C, O’Brien MF, Lilja H. Systematic review of pretreatment prostate-specific antigen velocity and doubling time as predictors for prostate cancer. J Clin Oncol 2009; 27:398–403.
- Lilja H, Ulmert D, Vickers AJ. Prostate-specific antigen and prostate cancer: prediction, detection and monitoring. Nat Rev Cancer 2008; 8:268–278.
- Marks LS, Fradet Y, Deras IL, et al. PCA molecular urine assay for prostate cancer in men undergoing repeat biopsy. Urology 2007; 69:532–535.
- Sreekumar A, Poisson LM, Thekkelnaycke M, et al. Metabolomic profile delineates potential role for sarcosine in prostate cancer progression. Nature 2009; 457:910–914.
- Zheng SL, Sun J, Wiklund F, et al. Cumulative association of five genetic variants with prostate cancer. N Engl J Med 2008; 358:910–919.
- Witte JS. Prostate cancer genomics: toward a new understanding. Nat Rev Genet 2009; 10:77–82.
- Gaziano JM, Glynn RJ, Christen WG, et al. Vitamins E and C in the prevention of prostate and total cancer in men: the Physicians’ Health Study II randomized controlled trial. JAMA 2009; 301:52–62.
- Thompson IM, Goodman PJ, Tangen CM, et al. The influence of finasteride on the development of prostate cancer. N Engl J Med 2003; 349:215–224.
- Lucia MS, Darke AK, Goodman PJ, et al. Pathologic characteristics of cancers detected in the Prostate Cancer Prevention Trial: implications for prostate cancer detection and chemoprevention. Cancer Prev Res (Phila PA) 2008; 1:167–173.
- Andriole G, Bostwick D, Brawley O, et al. Further analyses from the REDUCE prostate cancer risk reduction trial [abstract]. J Urol 2009; 181:( suppl):555.
- Kramer BS, Hagerty KL, Justman S, et al; American Society of Clinical Oncology/American Urological Association. Use of 5-alpha-reductase inhibitors for prostate cancer chemoprevention: American Society of Clinical Oncology/American Urological Association 2008 Clinical Practice Guideline. J Urol 2009; 181:1642–1657.
In spite of some recent studies, or perhaps because of them, we still are unsure about how best to screen for and prevent prostate cancer. Two large trials of screening with prostate-specific antigen (PSA) measurements came to seemingly opposite conclusions.1,2 Furthermore, a large trial of selenium and vitamin E found that these agents have no value as preventive agents.3
Nevertheless, negative studies also advance science, and steady progress is being made in prostate cancer research. In this paper I briefly summarize and comment on some of the recent findings.
TO SCREEN OR NOT TO SCREEN?
All cases of prostate cancer are clinically relevant in that they can cause anxiety or can lead to treatment-related morbidity. The challenge is to detect the minority of cases of cancer that are biologically significant, ie, those that will cause serious illness or death.
Many men have prostate cancer
In the United States, the lifetime probability of developing prostate cancer is 1 in 6, and the probability increases with age. Prostate cancer is primarily a disease of the Western world, but it is becoming more common in other areas as well.
Risk factors for prostate cancer are age, race, and family history. Clinically apparent disease is very rare in men younger than 40 years; until recently, most guidelines suggested that screening for it should begin at age 50. African American men have the highest risk of developing and dying of prostate cancer, for reasons that are not clear. In the past, this finding was attributed to disparities in access and less aggressive therapy in black men, but recent studies suggest the differences persist even in the absence of these factors, suggesting there is a biological difference in cancers between blacks and whites. Having a father or brother who had prostate cancer increases one’s risk twofold (threefold if the father or brother was affected before the age of 60); having a father and a brother with prostate cancer increases one’s risk fourfold, and true hereditary cancer raises the risk fivefold.4
But relatively few men die of it
The Scandinavian Prostate Cancer Group5 randomized 695 men with early prostate cancer (mostly discovered by digital rectal examination or by symptoms) to undergo either radical prostatectomy or a program of watchful waiting. In 8.2 years of follow-up, 8.6% of the men in the surgery group and 14.4% of those in the watchful waiting group died of prostate cancer. Thus, we can conclude that surgery is beneficial in this situation.
Despite these calculations, in contemporary practice in the United States, about 90% of men with newly diagnosed low-grade prostate cancer choose to be treated.6 This high level of intervention reflects our current inability to predict which cancers will remain indolent vs which will progress and the lack of validated markers that tell us when to intervene in patients who are managed expectantly and not lose the chance for cure. Most often, patients and their physicians, who are paid to intervene, deal with this uncertainty by choosing the high likelihood of cure with early intervention despite treatment-related morbidity.
What PSA has wrought
When PSA screening was introduced in the late 1980s and early 1990s, it brought about several changes in the epidemiology and clinical profile of this disease that led us to believe that it was making a meaningful difference.
A spike in the apparent incidence of prostate cancer occurred in the late 1980s and early 1990s with the introduction of PSA screening. The spike was temporary, representing detection of preexisting cases. Now, the incidence may have leveled off.7
A shift in the stages of cancers detected. In 1982, half of men with newly diagnosed prostate cancer had incurable disease.8 Five years after the introduction of PSA testing, 95% had curable disease.9
An increase in the rate of cure after radical prostatectomy was seen.
A decrease in the death rate from prostate cancer since the early 1990s has been noted, which is likely due not only to earlier detection but also to earlier and better treatment.
Limitations of PSA screening
PSA screening has low specificity. PSA is more sensitive than digital rectal examination, but most men with “elevated” PSA do not have prostate cancer. Nevertheless, although it is not a perfect screening test, it is still the best cancer marker that we have.
In the Prostate Cancer Prevention Trial (PCPT),10 finasteride (Proscar) decreased the incidence of prostate cancer by about 25% over 7 years. But there were also lessons to be learned from the placebo group, which underwent PSA testing every year and prostate biopsy at the end of the study.
We used to think the cutoff PSA level that had high sensitivity and specificity for finding cancer was 4 ng/mL. However, in the PCPT, 6.6% of men with PSA levels below 0.5 ng/mL were found to have cancer, and 12.5% of those cancers were high-grade. Of those with PSA levels of 3.1 to 4.0 ng/mL, 26.9% had cancer, and 25.0% of the cancers were high-grade. These data demonstrate that there is no PSA level below which risk of cancer is zero, and that there is no PSA cutoff with sufficient sensitivity and specificity to be clinically useful.
The PCPT risk calculator (http://deb.uthscsa.edu/URORiskCalc/Pages/uroriskcalc.jsp) is a wonderful tool that came out of that study. It uses seven variables—race, age, PSA level, family history of prostate cancer, findings on digital rectal examination, whether the patient has ever undergone a prostate biopsy, and whether the patient is taking finasteride—and calculates the patient’s risk of harboring prostate cancer and, more important, the risk of having high-grade prostate cancer. This tool allows estimation of individual risk and helps identify who is at risk of cancer that may require therapy.
Other factors can affect PSA levels. Men with a higher body mass index have lower PSA levels. The reason is not clear; it may be a hormonal effect, or heavier men may simply have higher blood volume, which may dilute the PSA. Furthermore, there are genetic differences that make some men secrete more PSA, but this effect is probably not clinically important. And a study by Hamilton et al11 suggested that statin drugs lower PSA levels. As these findings are confirmed, in the future it may be necessary to adjust PSA levels to account for their effects before deciding on the need for biopsy.
Two new, conflicting studies
Two large trials of PSA screening, published simultaneously in March 2009, came to opposite conclusions.
The European Randomized Study of Screening for Prostate Cancer2 randomized 162,243 men between the ages of 55 and 69 to undergo PSA screening at an average of once every 4 years or to a control group. Most of the participating centers used a PSA level of 3.0 ng/mL as an indication for biopsy. At an average follow-up time of 8.8 years, 214 men had died of prostate cancer in the screening group, compared with 326 in the control group, for an adjusted rate ratio of 0.80 (95% confidence interval [CI] 0.65–0.98, P = .04). In other words, screening decreased the risk of death from prostate cancer by 20%.
The Prostate, Lung, Colorectal, and Ovarian (PLCO) Cancer Screening Trial,1 conducted in the United States, came to the opposite conclusion, ie, that there is no benefit from PSA screening. This study was smaller, with 76,693 men between ages 55 and 74 randomly assigned to receive PSA testing every year for 6 years and digital rectal examination for 4 years, or usual care. A PSA level of more than 4.0 ng/mL was considered to be positive for prostate cancer. At 7 years, of those who reported undergoing no more than one PSA test at baseline, 48 men had died of prostate cancer in the screening group, compared with 41 in the control group (rate ratio 1.16, 95% CI 0.76–1.76).
Why were the findings different? The PLCO investigators offered several possible explanations for their negative results. The PSA threshold of 4 ng/mL that was used in that study may not be effective. More than half the men in the control group actually had a PSA test in the first 6 years of the study, potentially diluting any effect of testing. (This was the most worrisome flaw in the study, in my opinion.) About 44% of the men in the study had already had one or more PSA tests at baseline, which would have eliminated cancers detectable on screening from the study, and not all men who were advised to undergo biopsy actually did so. The follow-up time may not yet be long enough for the benefit to be apparent. Most important, in their opinion, treatment for prostate cancer improved during the time of the trial, so that fewer men than expected died of prostate cancer in both groups.
Improvements to PSA screening
Derivatives of PSA have been used in an attempt to improve its performance characteristics for detecting cancer.
PSA density, defined as serum PSA divided by prostate volume, has some predictive power but requires performance of transrectal ultrasonography. It is therefore not a good screening test in the primary care setting.
PSA velocity or doubling time, based on the rate of change over time, is predictive of prostate cancer, but is highly dependent on the absolute value of PSA and does not add independent information to the variables defined in the PCPT risk calculator or other standard predictive variables.12
A PSA level between the ages of 44 and 50 may predict the lifetime risk of prostate cancer, according to a study by Lilja et al13 in Sweden. This finding suggests that we should measure PSA early in life and screen men who have higher values more frequently or with better strategies. This recommendation has been adopted by the American Urological Association, which released updated screening guidelines in April 2009 (available at www.auanet.org/content/guidelines-and-quality-care/clinical-guidelines/main-reports/psa09.pdf).
New markers under study
A number of new biological markers probably will improve our ability to detect prostate cancer, although they are not yet ready for widespread use.
Urinary PCA3. Prostate cancer gene 3 (PCA3) codes for a messenger RNA that is highly overexpressed in the urine of men with prostate cancer. Urine is collected after prostate massage. Marks et al14 reported that PCA3 scores predicted biopsy outcomes in men with serum PSA levels of 2.5 ng/mL or higher.
Serum EPCA-2 (early prostate cancer antigen 2) is another candidate marker undergoing study.
Gene fusions, specifically of TRMPSS2 and the ETS gene family, are detectable in high levels in the urine of some men with prostate cancer, and appear to be very promising markers for detection.
Metabolomics is a technique that uses mass spectroscopy to detect the metabolic signature of cancer. Sreekumar et al15 identified sarcosine as a potential marker of prostate cancer using this technique.
Genetic tests: Not yet
Some data suggest that we can use genetic tests to screen for prostate cancer, but the tests are not yet as good as we would like.
Zheng et al16 reported that 16 singlenucleotide polymorphisms (SNPs) in five chromosomal regions plus a family history of prostate cancer have a cumulative association with prostate cancer: men who had any five or more of these SNPs had a risk of prostate cancer nearly 10 times as high as men without any of them. However, the number of men who actually fall into this category is so low that routine use in the general population is not cost-effective; it may, however, be useful in men with a family history of prostate cancer.
Other SNPs have been linked to prostate cancer (reviewed by Witte17). Having any one of these loci increases one’s risk only modestly, however. Only about 2% of the population has five or more of these SNPS, and the sensitivity is about only about 16%.
A commercially available DNA test (Decode Genetics, Reykjavik, Iceland) can detect eight variants that, according to the company, account for about half of all cases of prostate cancer.
Prostate cancer screening: My interpretation
I believe the two new studies of PSA screening suggest there is a modest benefit from screening in terms of preventing deaths from prostate cancer. But I also believe we should be more judicious in recommending treatment for men whom we know have biologically indolent tumors, although we cannot yet identify them perfectly.
In the past, we used an arbitrary PSA cutoff to detect prostate cancer of any grade, and men with high levels were advised to have a biopsy. Currently, we use continuous-risk models to look for any cancer and biologically significant cancers. These involve nomograms, a risk calculator, and new markers.
We use the PCPT risk calculator routinely in our practice. I recommend—completely arbitrarily—that a man undergo biopsy if he has a 10% or higher risk of high-grade cancer, but not if the risk is less. I believe this is more accurate than a simple PSA cutoff value.
CAN WE PREVENT PROSTATE CANCER?
Prostate cancer is a significant public health risk, with 186,000 new cases and 26,000 deaths yearly. Its risk factors (age, race, and genes) are not modifiable. The benefit of screening in terms of preventing deaths is not as good as we would like, and therapy is associated with morbidity. That leaves prevention as a potential way to reduce the morbidity and perhaps mortality of prostate cancer and its therapy.
Epidemiologic studies suggest that certain lifestyle factors may increase the risk, ie, consumption of fat, red meat, fried foods, and dairy; high calcium intake; smoking; total calories; and body size. Other factors may decrease the risk: plant-based foods and vegetables, especially lycopene-containing foods such as tomatoes, cruciferous vegetables, soy, and legumes, specific nutrients such as carotenoids, lycopene, total antioxidants, fish oil (omega-3 fatty acids), and moderate to vigorous exercise. However, there have been few randomized trials to determine if any of these agents are beneficial.
Findings of trials of prevention
Selenium and vitamin E do not prevent prostate cancer, lung cancer, colorectal cancer, other primary cancers, or deaths. The Selenium and Vitamin E Cancer Prevention Trial (SELECT)3 involved 35,533 men 55 years of age or older (or 50 and older if they were African American). They were randomized to receive one of four treatments: selenium 200 μg/day plus vitamin E placebo, vitamin E 400 IU/day plus selenium placebo, selenium plus vitamin E, or double placebo. At a median follow-up of 5.46 years, compared with the placebo group, the hazard ratio for prostate cancer was 1.04 in the selenium-only group, 1.13 in the vitamin E-only group, and 1.05 in the selenium-plus-vitamin E group. None of the differences was statistically significant.
The Physician’s Health Study18 also found that vitamin E at the same dose given every other day does not prevent prostate cancer.
Finasteride prevents prostate cancer. The PCPT19 included 18,882 men, 55 years of age or older, who had PSA levels of 3.0 ng/mL or less and normal findings on digital rectal examination. Treatment was with finasteride 5 mg/day or placebo. At 7 years, prostate cancer had been discovered in 18.4% of the finasteride group vs 24.4% of the placebo group, a 24.8% reduction (95% CI 18.6–30.6, P < .001). Sexual side effects were more common in the men who received finasteride, while urinary symptoms were more common in the placebo group.
At the time of the original PCPT report in 2003,19 tumors of Gleason grade 7 or higher were more common in the finasteride group, accounting for 37.0% of the tumors discovered, than in the placebo group (22.2%), creating concern that finasteride might somehow cause the tumors that occurred to be more aggressive. However, a subsequent analysis20 found the opposite to be true, ie, that finasteride decreases the risk of high-grade cancers. A companion quality-of-life study showed that chronic use of finasteride had clinically insignificant effects on sexual function, and the PCPT and other studies have shown benefits of finasteride in reducing lower urinary tract symptoms due to benign prostatic hyperplasia (BPH), reducing the risk of acute urinary retention and the need for surgical intervention for BPH, and reducing the risk of prostatitis.
Dutasteride also prevents prostate cancer. A large-scale trial of another 5-alpha reductase inhibitor, dutasteride (Avodart), was reported by Andriole at the annual meeting of the American Urological Association in April 2009.21 The Reduction by Dutasteride of Prostate Events (REDUCE) trial included men who were 50 to 75 years old, inclusively, and who had PSA levels between 2.5 and 10 ng/mL, prostate volume less than 80 cc, and one prior negative prostate biopsy within 6 months of enrollment, representing a group at high risk for cancer on a subsequent biopsy. The trial accrued 8,231 men. At 4 years, prostate cancer had occurred in 659 men in the dutasteride group vs 857 in the placebo group, a 23% reduction (P < .0001). Interestingly, no significant increase in Gleason grade 8 to grade 10 tumors was observed in the study.
Preliminary analyses also suggest that dutasteride enhanced the utility of PSA as a diagnostic test for prostate cancer, had beneficial effects on BPH, and was generally well tolerated. The fact that the results of REDUCE were congruent with those of the PCPT with respect to the magnitude of risk reduction, beneficial effects on benign prostatic hypertrophy, minimal toxicity, and no issues related to tumor grade suggests a class effect for 5-alpha reductase inhibitors, and suggests that these agents should be used more liberally for the prevention of prostate cancer.
There is current debate about whether 5-alpha reductase inhibitors should be used by all men at risk of prostate cancer or only by those at high risk. However, the American Urological Association and the American Society of Clinical Oncology have issued guidelines stating that men at risk should consider this intervention.22
- Andriole GL, Grubb RL, Buys SS, et al; PLCO Project Team. Mortality results from a randomized prostate cancer screening trial. N Engl J Med 2009; 360:1310–1319.
- Schröder FH, Hugosson J, Roobol MJ, et al; ERSPC Investigators. Screening and prostate cancer mortality in a randomized European study. N Engl J Med 2009; 360:1351–1354.
- Lippman SM, Klein EA, Goodman PJ, et al. Effect of selenium and vitamin E on risk of prostate cancer and other cancers: the Selenium and Vitamin E Cancer Prevention Trial (SELECT). JAMA 2009; 301:39–51.
- Bratt O. Hereditary prostate cancer: clinical aspects. J Urol 2002; 168:906–913.
- Bill-Axelson A, Holmberg L, Ruutu M, et al; Scandinavian Prostate Cancer Group Study No. 4. Radical prostatectomy versus watchful waiting in early prostate cancer. N Engl J Med 2005; 352:1977–1984.
- Cooperberg MR, Broering JM, Kantoff PW, Carroll PR. Contemporary trends in low risk prostate cancer: risk assessment and treatment. J Urol 2007; 178:S14–S19.
- Horner MJ, Ries LAG, Krapcho M, et al, editors. SEER Cancer Statistics Review, 1975–2006, National Cancer Institute. Bethesda, MD, http://seer.cancer.gov/csr/1975_2006/, based on November 2008 SEER data submission, posted to the SEER web site, 2009. Accessed 6/28/2009.
- Murphy GP, Natarajan N, Pontes JE, et al. The national survey of prostate cancer in the United States by the American College of Surgeons. J Urol 1982; 127:928–934.
- Catalona WJ, Smith DS, Ratliff TL, Basler JW. Detection of organconfined prostate cancer is increased through prostate-specific antigen-based screening. JAMA 1993; 270:948–954.
- Thompson IM, Pauler DK, Goodman PJ, et al. Prevalence of prostate cancer among men with a prostate-specific antigen level < or = 4.0 ng per milliliter. N Engl J Med 2004; 350:2239–2246.
- Hamilton RJ, Goldberg KC, Platz EA, Freedland SJ. The influence of statin medications on prostate-specific antigen levels. N Natl Cancer Inst 2008; 100:1487–1488.
- Vickers AJ, Savage C, O’Brien MF, Lilja H. Systematic review of pretreatment prostate-specific antigen velocity and doubling time as predictors for prostate cancer. J Clin Oncol 2009; 27:398–403.
- Lilja H, Ulmert D, Vickers AJ. Prostate-specific antigen and prostate cancer: prediction, detection and monitoring. Nat Rev Cancer 2008; 8:268–278.
- Marks LS, Fradet Y, Deras IL, et al. PCA molecular urine assay for prostate cancer in men undergoing repeat biopsy. Urology 2007; 69:532–535.
- Sreekumar A, Poisson LM, Thekkelnaycke M, et al. Metabolomic profile delineates potential role for sarcosine in prostate cancer progression. Nature 2009; 457:910–914.
- Zheng SL, Sun J, Wiklund F, et al. Cumulative association of five genetic variants with prostate cancer. N Engl J Med 2008; 358:910–919.
- Witte JS. Prostate cancer genomics: toward a new understanding. Nat Rev Genet 2009; 10:77–82.
- Gaziano JM, Glynn RJ, Christen WG, et al. Vitamins E and C in the prevention of prostate and total cancer in men: the Physicians’ Health Study II randomized controlled trial. JAMA 2009; 301:52–62.
- Thompson IM, Goodman PJ, Tangen CM, et al. The influence of finasteride on the development of prostate cancer. N Engl J Med 2003; 349:215–224.
- Lucia MS, Darke AK, Goodman PJ, et al. Pathologic characteristics of cancers detected in the Prostate Cancer Prevention Trial: implications for prostate cancer detection and chemoprevention. Cancer Prev Res (Phila PA) 2008; 1:167–173.
- Andriole G, Bostwick D, Brawley O, et al. Further analyses from the REDUCE prostate cancer risk reduction trial [abstract]. J Urol 2009; 181:( suppl):555.
- Kramer BS, Hagerty KL, Justman S, et al; American Society of Clinical Oncology/American Urological Association. Use of 5-alpha-reductase inhibitors for prostate cancer chemoprevention: American Society of Clinical Oncology/American Urological Association 2008 Clinical Practice Guideline. J Urol 2009; 181:1642–1657.
KEY POINTS
- An elevated PSA level lacks specificity as a test for prostate cancer, but PSA measurements can be useful in combination with clinical risk factors or to measure changes in PSA over time.
- Rather than relying on PSA screening alone, we should stratify the risk of prostate cancer on the basis of race, age, PSA level, family history, findings on digital rectal examination, whether the patient has ever undergone a prostate biopsy, and whether the patient is taking finasteride (Proscar). A simple online tool is available to do this.
- There is no PSA level below which the risk of cancer is zero.
- Finasteride has been found in a randomized trial to decrease the risk of prostate cancer, but vitamin E and selenium supplements have failed to show a benefit.
Grand Rounds: Man, 29, With Apparent Throat Obstruction
A 29-year-old man presented to the emergency department (ED) with a chief complaint of food stuck in his throat. He reported that he had swallowed a piece of chicken and felt it get stuck. Drinking water to help it go down was unsuccessful.
The patient’s history was positive for childhood asthma and nine years of solid food dysphagia. There was no history of a caustic chemical ingestion or of drug-induced esophagitis. He denied having dyspepsia, heartburn, or chest pain. He was not taking any medications and had no allergies.
When his dysphagia symptoms began nine years ago, he was diagnosed with acid reflux disease, confirmed by an upper gastrointestinal (GI) tract x-ray. Since that time, he reported having to swallow liquid after every bite of food and said he suffered from severe anxiety over fear of choking.
Evaluation in the ED consisted of endoscopic examination by a gastroenterologist. In addition to dislodging a food bolus, the endoscope revealed a narrowed, ringed esophagus with mucosal changes throughout the length of the esophagus (see Figures 1 through 3). Esophageal biopsies were taken, and the esophagus was dilated successfully with a 40-Fr Maloney dilator. The endoscopist detected too much resistance to pass a larger dilator.
Biopsy results revealed eosinophilic esophagitis. The patient was given oral fluticasone propionate. At one-month follow-up, he reported feeling much better. Upper endoscopy revealed some improvement, and the gastroenterologist was able to pass both a 46- and a 48-Fr Maloney dilator with only mild resistance. (The largest Maloney dilator, a 60-Fr dilator, should easily pass through a normal esophagus, according to T. L. Sack, MD, oral communication, June 2009.)
Discussion
Eosinophilic esophagitis (EE) involves the infiltration of the esophageal mucosa with eosinophils, causing edema, inflammation, and eventually, thickening and stenotic changes of the esophageal mucosa.1
The normal esophageal mucosa contains lymphocytes, mast cells, and dendritic cells, which protect the esophagus from invading toxins and microorganisms. Eosinophils are not usually present, but when they are, they can have toxic effects on the esophageal mucosa.2 EE is associated with solid food dysphagia, a direct result of damage to the esophageal mucosa, and other causes that are not clearly understood.
Research findings suggest that symptoms of dysphagia may be caused by degranulating eosinophils and mast cells, which have an antagonistic effect on the muscarinic receptors and cause smooth muscle to contract.3,4 The proposed triggering mechanism of EE is an immunoglobulin E (IgE) immune–mediated response to an allergen.2 Based on results from IgE radioallergosorbent testing (RAST), aeroallergens are more likely than food to act as triggers.5
EE in the Adult Patient
Traditionally, EE has been a condition seen in the pediatric population, with symptoms of nausea, vomiting, and failure to thrive; however, it is becoming increasingly recognized among adults. The typical patient is a man in his 20s or 30s (although cases of EE have been reported among women and older adults) with acute and recurrent solid food dysphagia, with or without food impaction.4
Often the patient reports a history of environmental or food allergies, asthma, rhinitis, or eczema.2,4-6 Researchers have reported the presence of allergic symptoms in at least 50% of patients diagnosed with EE,2 and many patients experience exacerbations associated with seasonal changes.7
GERD may coexist with EE; however, no relationship has been identified between the two.8 EE should be considered in patients with gastrointestinal symptoms that persist despite at least four weeks’ treatment with a proton pump inhibitor (PPI).2
Dysphagia: Differential Diagnosis
Adult patients with esophageal dysphagia usually report the feeling of food getting stuck when they try to swallow.9 Dysphagia may result from a mechanical obstruction or a neuromuscular/motility condition. Patients with mechanical obstructions usually have difficulty swallowing solids, while those with motility disorders tend to have difficulty with both liquids and solids.1,9
Mechanical obstructions may include carcinomas (intrinsic and extrinsic), strictures, or Schatzki rings (small thin mucosal rings of unknown etiology located at the gastroesophageal junction).1,9 Progressive dysphagia to solids over a short period of time is often indicative of esophageal carcinoma. GERD, pill-induced trauma, previous ingestion of a caustic chemical, and radiation are common causes of esophageal stricture formation. For a list of medications that are particularly caustic to the esophageal mucosa, see the table.9,10
Neuromuscular manifestations of dysphagia include achalasia, diffuse esophageal spasm, nutcracker esophagus, and scleroderma.1 These are usually associated with progressive difficulty in swallowing.9
Evaluating the Patient
A thorough patient history can often reveal potential causes of dysphagia and eliminate others. This should include current medications, chronic medical conditions and details regarding their onset and duration, and symptoms associated with dysphagia.9
Physical examination should include palpation of the thyroid because of the potential for a thyroid mass to cause extrinsic compression of the esophagus, palpation of the abdomen for masses or organomegaly, and a complete neurologic evaluation.9
Laboratory tests should be ordered based on the information obtained from the history and physical. Testing may include thyroid studies to eliminate hypothyroid or hyperthyroid causes of dysphagia, and complete blood count (CBC) with differential to rule out inflammatory or infectious processes.9 While eosinophilia may be present in the differential, it is not a universally accepted marker for establishing the diagnosis of EE.2,5 Stools should be checked for occult blood, because a positive finding may suggest esophageal carcinoma.9
Diagnosis
In the primary care setting, a barium esophagram may be used during the initial workup to evaluate the anatomic structures of the esophagus and to differentiate between a mechanical obstruction and a neuromuscular disorder.1,9 This noninvasive test requires the patient to swallow a radiopaque liquid as x-rays are taken.
The gold standard for diagnosing EE, however, is upper endoscopy with biopsy of the esophageal mucosa.6 Endoscopic findings that indicate EE are atypical of GERD; they may include a narrowed, small-caliber esophagus, concentric mucosal rings, proximal stenosis, linear ulcerations, atrophic changes, and white papules associated with eosinophilic microabscesses.6
Although there is no consensus regarding the number of eosinophils that should be present for an accurate diagnosis of EE, microscopic interpretation of the biopsy from both the proximal and the distal esophageal epithelia5 usually shows 15 or more eosinophils per high-power field.2,11 It has been suggested that mucosal biopsies be taken along the entire length of the esophagus, as eosinophilic infiltration may extend from the proximal to the distal esophagus.2
GERD and trauma induced by medication use may also be associated with esophageal eosinophilic infiltration5; however, eosinophils are usually present only in the distal esophageal mucosa3 and are not as abundant as in EE.7 If endoscopy reveals persistent eosinophilia despite four to eight weeks’ treatment with a PPI, the diagnosis of EE is confirmed.2
Treatment
Treatment for EE is still under investigation. Research has examined the association between EE and food allergies or aeroallergens.4 Evaluation by an allergist using skin prick tests or RAST is recommended in the adult patient to help determine the source of the underlying inflammation.5,7 Eliminating any identified allergen should help alleviate symptoms.4
For patients in whom no source of inflammation can be identified, treatment with 1.0 to 2.0 mg/kg/d of oral prednisone for acute exacerbations has been shown to significantly improve symptoms and histology12; however, because of the associated risk for adverse systemic effects, long-term use is not recommended.
In many patients, the inhaled corticosteroid fluticasone has also proved successful in reducing EE—associated inflammation.6 Current evidence supports adult dosing between 880 and 1,760 mcg per day for six to eight weeks, administered with a metered-dose inhaler and no spacer. Fluticasone should be sprayed directly into the mouth and swallowed, after which the patient should take nothing by mouth for 30 minutes.13 Prolonged fluticasone use has been associated with esophageal candidiasis.2 There are currently no recommendations regarding its use as maintenance therapy.
Montelukast, a leukotriene receptor antagonist, has also been shown in some studies to reduce the inflammatory process11; however, one study team recently found it to have no therapeutic effect.13
PPIs may be effective for improving EE symptoms even in the absence of GERD because of the reduced gastric acid production,7 but they do not usually improve EE’s histologic features.3
Use of esophageal dilation in patients with EE is controversial because of an associated risk for perforation.14 If this intervention is to be performed, the patient should be treated in advance with oral corticosteroids to reduce esophageal inflammation.15,16 In addition, the endoscopist should start with small-sized dilators and carefully proceed to larger sizes.11 Critics of esophageal dilation argue that the procedure is only a temporary solution and does nothing for the underlying condition.4,8
Regarding endoscopic surveillance, an interval of at least four weeks between interventions is recommended.13
Role of the Primary Care Clinician
Undiagnosed EE can cause the patient discomfort, frustration, and anxiety, as seen in the case study. Many patients with undiagnosed EE have been exposed to unnecessary medical therapy and antireflux surgery.3 Without proper diagnosis and treatment, EE may worsen, causing complications associated with chronic inflammation (ie, esophageal fibrosis and strictures).2,6
The long-term prognosis of EE is unknown at this time.8 The disease is usually chronic, with periods of remission and exacerbation. With an understanding of EE and appropriate therapies, the primary care practitioner can team with the gastroenterologist to provide effective disease management through endoscopic surveillance and intervention for acute exacerbations. Guidelines recommend that patients be closely followed with regular office visits to reassess symptoms, compliance with therapy, and adverse effects, with the goal of preventing complications associated with EE.13
Conclusion
To effectively evaluate the patient who presents with dysphagia, the primary care provider should have a working knowledge of EE, as well as an understanding of the key elements in the history and physical examination to help ensure an accurate diagnosis. This will facilitate timely referral to a gastroenterologist for endoscopic evaluation, when indicated.
1. McQuaid KR. Gastrointestinal disorders. In: McPhee S, Papadakis M. CURRENT Medical Diagnosis & Treatment 2009. New York: McGraw-Hill: 2009:487-581.
2. Nurko S, Furuta GT. Eosinophilic esophagitis (2006). GI Motility Online. www.nature.com/gimo/contents/pt1/full/gimo49.html. Accessed July 27, 2009.
3. Parfitt JR, Gregor JC, Suskin NG, et al. Eosinophilic esophagitis in adults: distinguishing features from gastroesophageal reflux disease: a study of 41 patients. Mod Pathol. 2006;19(1):90-96.
4. Swoger JM, Weiler CR, Arora AS. Eosinophilic esophagitis: is it all allergies? Mayo Clin Proc. 2007;82(12):1541-1549.
5. Conus S, Simon HU. General laboratory diagnostics of eosinophilic GI diseases. Best Pract Res Clin Gastroenterol. 2008;22(3):441-453.
6. Remedios M, Campbell C, Jones DM, Kerlin P. Eosinophilic esophagitis in adults: clinical, endoscopic, histologic findings, and response to treatment with fluticasone propionate. Gastrointest Endosc. 2006;63(1):3-12.
7. Rothenberg ME. Eosinophilic gastrointestinal disorders (EGID). J Allergy Clin Immunol. 2004; 113(1):11-28.
8. Lucendo AJ, Carrion G, Navarro M, et al. Eosinophilic esophagitis in adults: an emerging disease. Dig Dis Sci. 2004;49(11-12):1884-1888.
9. Spieker MR. Evaluating dysphagia. Am Fam Physician. 2000;61(12):3639-3648.
10. Boyce HW. Drug-induced esophageal damage: diseases of medical progress. Gastrointest Endosc. 1998;47:547-550.
11. Potter JW, Saeian K, Staff D, et al. Eosinophilic esophagitis in adults: an emerging problem with unique esophageal features. Gastrointest Endosc. 2004;59(3):355-361.
12. Schaefer ET, Fitzgerald JF, Molleston JP, et al. Comparison of oral prednisone and topical fluticasone in the treatment of eosinophilic esophagitis: a randomized trial in children. Clin Gastroenterol Hepatol. 2008;6(2):165-173.
13. Furuta GT, Liacouras CA, Collins MH, et al; First International Gastrointestinal Eosinophil Research Symposium (FIGERS) Subcommittees. Eosinophilic esophagitis in children and adults: a systematic review and consensus recommendation for diagnosis and treatment. Gastroenterology. 2007;133(4): 1342-1363.
14. Straumann A, Rossi L, Simon HU, et al. Fragility of the esophageal mucosa: a pathognomonic endoscopic sign of primary eosinophilic esophagitis. Gastrointest Endosc. 2003;57(3):407-412.
15. Hawari R, Pasricha PJ. Images in clinical medicine: eosinophilic esophagitis. N Engl J Med. 2007; 356(20):e20.
16. Leclercq P, Marting A, Gast P. Eosinophilic esophagitis. N Engl J Med. 2007;357(14):1446.
A 29-year-old man presented to the emergency department (ED) with a chief complaint of food stuck in his throat. He reported that he had swallowed a piece of chicken and felt it get stuck. Drinking water to help it go down was unsuccessful.
The patient’s history was positive for childhood asthma and nine years of solid food dysphagia. There was no history of a caustic chemical ingestion or of drug-induced esophagitis. He denied having dyspepsia, heartburn, or chest pain. He was not taking any medications and had no allergies.
When his dysphagia symptoms began nine years ago, he was diagnosed with acid reflux disease, confirmed by an upper gastrointestinal (GI) tract x-ray. Since that time, he reported having to swallow liquid after every bite of food and said he suffered from severe anxiety over fear of choking.
Evaluation in the ED consisted of endoscopic examination by a gastroenterologist. In addition to dislodging a food bolus, the endoscope revealed a narrowed, ringed esophagus with mucosal changes throughout the length of the esophagus (see Figures 1 through 3). Esophageal biopsies were taken, and the esophagus was dilated successfully with a 40-Fr Maloney dilator. The endoscopist detected too much resistance to pass a larger dilator.
Biopsy results revealed eosinophilic esophagitis. The patient was given oral fluticasone propionate. At one-month follow-up, he reported feeling much better. Upper endoscopy revealed some improvement, and the gastroenterologist was able to pass both a 46- and a 48-Fr Maloney dilator with only mild resistance. (The largest Maloney dilator, a 60-Fr dilator, should easily pass through a normal esophagus, according to T. L. Sack, MD, oral communication, June 2009.)
Discussion
Eosinophilic esophagitis (EE) involves the infiltration of the esophageal mucosa with eosinophils, causing edema, inflammation, and eventually, thickening and stenotic changes of the esophageal mucosa.1
The normal esophageal mucosa contains lymphocytes, mast cells, and dendritic cells, which protect the esophagus from invading toxins and microorganisms. Eosinophils are not usually present, but when they are, they can have toxic effects on the esophageal mucosa.2 EE is associated with solid food dysphagia, a direct result of damage to the esophageal mucosa, and other causes that are not clearly understood.
Research findings suggest that symptoms of dysphagia may be caused by degranulating eosinophils and mast cells, which have an antagonistic effect on the muscarinic receptors and cause smooth muscle to contract.3,4 The proposed triggering mechanism of EE is an immunoglobulin E (IgE) immune–mediated response to an allergen.2 Based on results from IgE radioallergosorbent testing (RAST), aeroallergens are more likely than food to act as triggers.5
EE in the Adult Patient
Traditionally, EE has been a condition seen in the pediatric population, with symptoms of nausea, vomiting, and failure to thrive; however, it is becoming increasingly recognized among adults. The typical patient is a man in his 20s or 30s (although cases of EE have been reported among women and older adults) with acute and recurrent solid food dysphagia, with or without food impaction.4
Often the patient reports a history of environmental or food allergies, asthma, rhinitis, or eczema.2,4-6 Researchers have reported the presence of allergic symptoms in at least 50% of patients diagnosed with EE,2 and many patients experience exacerbations associated with seasonal changes.7
GERD may coexist with EE; however, no relationship has been identified between the two.8 EE should be considered in patients with gastrointestinal symptoms that persist despite at least four weeks’ treatment with a proton pump inhibitor (PPI).2
Dysphagia: Differential Diagnosis
Adult patients with esophageal dysphagia usually report the feeling of food getting stuck when they try to swallow.9 Dysphagia may result from a mechanical obstruction or a neuromuscular/motility condition. Patients with mechanical obstructions usually have difficulty swallowing solids, while those with motility disorders tend to have difficulty with both liquids and solids.1,9
Mechanical obstructions may include carcinomas (intrinsic and extrinsic), strictures, or Schatzki rings (small thin mucosal rings of unknown etiology located at the gastroesophageal junction).1,9 Progressive dysphagia to solids over a short period of time is often indicative of esophageal carcinoma. GERD, pill-induced trauma, previous ingestion of a caustic chemical, and radiation are common causes of esophageal stricture formation. For a list of medications that are particularly caustic to the esophageal mucosa, see the table.9,10
Neuromuscular manifestations of dysphagia include achalasia, diffuse esophageal spasm, nutcracker esophagus, and scleroderma.1 These are usually associated with progressive difficulty in swallowing.9
Evaluating the Patient
A thorough patient history can often reveal potential causes of dysphagia and eliminate others. This should include current medications, chronic medical conditions and details regarding their onset and duration, and symptoms associated with dysphagia.9
Physical examination should include palpation of the thyroid because of the potential for a thyroid mass to cause extrinsic compression of the esophagus, palpation of the abdomen for masses or organomegaly, and a complete neurologic evaluation.9
Laboratory tests should be ordered based on the information obtained from the history and physical. Testing may include thyroid studies to eliminate hypothyroid or hyperthyroid causes of dysphagia, and complete blood count (CBC) with differential to rule out inflammatory or infectious processes.9 While eosinophilia may be present in the differential, it is not a universally accepted marker for establishing the diagnosis of EE.2,5 Stools should be checked for occult blood, because a positive finding may suggest esophageal carcinoma.9
Diagnosis
In the primary care setting, a barium esophagram may be used during the initial workup to evaluate the anatomic structures of the esophagus and to differentiate between a mechanical obstruction and a neuromuscular disorder.1,9 This noninvasive test requires the patient to swallow a radiopaque liquid as x-rays are taken.
The gold standard for diagnosing EE, however, is upper endoscopy with biopsy of the esophageal mucosa.6 Endoscopic findings that indicate EE are atypical of GERD; they may include a narrowed, small-caliber esophagus, concentric mucosal rings, proximal stenosis, linear ulcerations, atrophic changes, and white papules associated with eosinophilic microabscesses.6
Although there is no consensus regarding the number of eosinophils that should be present for an accurate diagnosis of EE, microscopic interpretation of the biopsy from both the proximal and the distal esophageal epithelia5 usually shows 15 or more eosinophils per high-power field.2,11 It has been suggested that mucosal biopsies be taken along the entire length of the esophagus, as eosinophilic infiltration may extend from the proximal to the distal esophagus.2
GERD and trauma induced by medication use may also be associated with esophageal eosinophilic infiltration5; however, eosinophils are usually present only in the distal esophageal mucosa3 and are not as abundant as in EE.7 If endoscopy reveals persistent eosinophilia despite four to eight weeks’ treatment with a PPI, the diagnosis of EE is confirmed.2
Treatment
Treatment for EE is still under investigation. Research has examined the association between EE and food allergies or aeroallergens.4 Evaluation by an allergist using skin prick tests or RAST is recommended in the adult patient to help determine the source of the underlying inflammation.5,7 Eliminating any identified allergen should help alleviate symptoms.4
For patients in whom no source of inflammation can be identified, treatment with 1.0 to 2.0 mg/kg/d of oral prednisone for acute exacerbations has been shown to significantly improve symptoms and histology12; however, because of the associated risk for adverse systemic effects, long-term use is not recommended.
In many patients, the inhaled corticosteroid fluticasone has also proved successful in reducing EE—associated inflammation.6 Current evidence supports adult dosing between 880 and 1,760 mcg per day for six to eight weeks, administered with a metered-dose inhaler and no spacer. Fluticasone should be sprayed directly into the mouth and swallowed, after which the patient should take nothing by mouth for 30 minutes.13 Prolonged fluticasone use has been associated with esophageal candidiasis.2 There are currently no recommendations regarding its use as maintenance therapy.
Montelukast, a leukotriene receptor antagonist, has also been shown in some studies to reduce the inflammatory process11; however, one study team recently found it to have no therapeutic effect.13
PPIs may be effective for improving EE symptoms even in the absence of GERD because of the reduced gastric acid production,7 but they do not usually improve EE’s histologic features.3
Use of esophageal dilation in patients with EE is controversial because of an associated risk for perforation.14 If this intervention is to be performed, the patient should be treated in advance with oral corticosteroids to reduce esophageal inflammation.15,16 In addition, the endoscopist should start with small-sized dilators and carefully proceed to larger sizes.11 Critics of esophageal dilation argue that the procedure is only a temporary solution and does nothing for the underlying condition.4,8
Regarding endoscopic surveillance, an interval of at least four weeks between interventions is recommended.13
Role of the Primary Care Clinician
Undiagnosed EE can cause the patient discomfort, frustration, and anxiety, as seen in the case study. Many patients with undiagnosed EE have been exposed to unnecessary medical therapy and antireflux surgery.3 Without proper diagnosis and treatment, EE may worsen, causing complications associated with chronic inflammation (ie, esophageal fibrosis and strictures).2,6
The long-term prognosis of EE is unknown at this time.8 The disease is usually chronic, with periods of remission and exacerbation. With an understanding of EE and appropriate therapies, the primary care practitioner can team with the gastroenterologist to provide effective disease management through endoscopic surveillance and intervention for acute exacerbations. Guidelines recommend that patients be closely followed with regular office visits to reassess symptoms, compliance with therapy, and adverse effects, with the goal of preventing complications associated with EE.13
Conclusion
To effectively evaluate the patient who presents with dysphagia, the primary care provider should have a working knowledge of EE, as well as an understanding of the key elements in the history and physical examination to help ensure an accurate diagnosis. This will facilitate timely referral to a gastroenterologist for endoscopic evaluation, when indicated.
1. McQuaid KR. Gastrointestinal disorders. In: McPhee S, Papadakis M. CURRENT Medical Diagnosis & Treatment 2009. New York: McGraw-Hill: 2009:487-581.
2. Nurko S, Furuta GT. Eosinophilic esophagitis (2006). GI Motility Online. www.nature.com/gimo/contents/pt1/full/gimo49.html. Accessed July 27, 2009.
3. Parfitt JR, Gregor JC, Suskin NG, et al. Eosinophilic esophagitis in adults: distinguishing features from gastroesophageal reflux disease: a study of 41 patients. Mod Pathol. 2006;19(1):90-96.
4. Swoger JM, Weiler CR, Arora AS. Eosinophilic esophagitis: is it all allergies? Mayo Clin Proc. 2007;82(12):1541-1549.
5. Conus S, Simon HU. General laboratory diagnostics of eosinophilic GI diseases. Best Pract Res Clin Gastroenterol. 2008;22(3):441-453.
6. Remedios M, Campbell C, Jones DM, Kerlin P. Eosinophilic esophagitis in adults: clinical, endoscopic, histologic findings, and response to treatment with fluticasone propionate. Gastrointest Endosc. 2006;63(1):3-12.
7. Rothenberg ME. Eosinophilic gastrointestinal disorders (EGID). J Allergy Clin Immunol. 2004; 113(1):11-28.
8. Lucendo AJ, Carrion G, Navarro M, et al. Eosinophilic esophagitis in adults: an emerging disease. Dig Dis Sci. 2004;49(11-12):1884-1888.
9. Spieker MR. Evaluating dysphagia. Am Fam Physician. 2000;61(12):3639-3648.
10. Boyce HW. Drug-induced esophageal damage: diseases of medical progress. Gastrointest Endosc. 1998;47:547-550.
11. Potter JW, Saeian K, Staff D, et al. Eosinophilic esophagitis in adults: an emerging problem with unique esophageal features. Gastrointest Endosc. 2004;59(3):355-361.
12. Schaefer ET, Fitzgerald JF, Molleston JP, et al. Comparison of oral prednisone and topical fluticasone in the treatment of eosinophilic esophagitis: a randomized trial in children. Clin Gastroenterol Hepatol. 2008;6(2):165-173.
13. Furuta GT, Liacouras CA, Collins MH, et al; First International Gastrointestinal Eosinophil Research Symposium (FIGERS) Subcommittees. Eosinophilic esophagitis in children and adults: a systematic review and consensus recommendation for diagnosis and treatment. Gastroenterology. 2007;133(4): 1342-1363.
14. Straumann A, Rossi L, Simon HU, et al. Fragility of the esophageal mucosa: a pathognomonic endoscopic sign of primary eosinophilic esophagitis. Gastrointest Endosc. 2003;57(3):407-412.
15. Hawari R, Pasricha PJ. Images in clinical medicine: eosinophilic esophagitis. N Engl J Med. 2007; 356(20):e20.
16. Leclercq P, Marting A, Gast P. Eosinophilic esophagitis. N Engl J Med. 2007;357(14):1446.