Difficult Conversations

Article Type
Changed
Display Headline
Difficult Conversations

Several recently published studies have documented a variety of disparities in the provision of end-of-life care. In some cases, these disparities reflect socio-economic and cultural differences, information that could help hospitalists respond appropriately to different patients’ needs, says Tochi Iroku-Malize, MD, MPH, SFHM, chair of family medicine at North Shore-Long Island Jewish Health System in Great Neck, N.Y.

"One approach does not fit all patients," says Dr. Iroku-Malize, a former HM group director who is board-certified in hospice and palliative medicine. "If you understand that end-of-life care is important, and you know about disparities in care, you will understand the need to deal with these diverse populations."

Hospitalists should appreciate that even if they are not able to refer a seriously ill patient to palliative care or hospice during an initial acute encounter, they can plant a seed for subsequent conversations. They should also report these conversations back to the primary-care physician (PCP), as they would for other medical treatments, she adds.

Racial and ethnic differences independent of socio-economic status are seen in end-of-life care in ICUs, reports the journal Chest (2011;139(5):1025-1033). Nonwhite patients are less likely to have living wills and more likely to die on full life support, to have a documented family conference where prognosis was discussed, and to have discord within the family or with the physician over treatment choices.

A phone survey of cancer patients found that black patients are more likely than white patients to spend everything they have on aggressive treatments that might prolong their lives, regardless of how sick they are, their income, savings, or age. In addition, the Dartmouth Atlas of Health's recent report "Trends and Variations in End-of-Life Care for Medicare Beneficiaries with Severe Chronic Illness" (PDF) found persistent evidence of widespread geographical differences in end-of-life care. In the last six months of their lives, chronically ill Medicare beneficiaries in some regions of the country spent three times as many days in the hospital and 10 times as many days in the ICU as patients in other regions.

Another survey found PCPs are more likely to choose for themselves treatments with higher rates of death but lower rates of adverse events than they would recommend to their patients (Arch Int Med 2011;171:630-634).

Issue
The Hospitalist - 2011(06)
Publications
Sections

Several recently published studies have documented a variety of disparities in the provision of end-of-life care. In some cases, these disparities reflect socio-economic and cultural differences, information that could help hospitalists respond appropriately to different patients’ needs, says Tochi Iroku-Malize, MD, MPH, SFHM, chair of family medicine at North Shore-Long Island Jewish Health System in Great Neck, N.Y.

"One approach does not fit all patients," says Dr. Iroku-Malize, a former HM group director who is board-certified in hospice and palliative medicine. "If you understand that end-of-life care is important, and you know about disparities in care, you will understand the need to deal with these diverse populations."

Hospitalists should appreciate that even if they are not able to refer a seriously ill patient to palliative care or hospice during an initial acute encounter, they can plant a seed for subsequent conversations. They should also report these conversations back to the primary-care physician (PCP), as they would for other medical treatments, she adds.

Racial and ethnic differences independent of socio-economic status are seen in end-of-life care in ICUs, reports the journal Chest (2011;139(5):1025-1033). Nonwhite patients are less likely to have living wills and more likely to die on full life support, to have a documented family conference where prognosis was discussed, and to have discord within the family or with the physician over treatment choices.

A phone survey of cancer patients found that black patients are more likely than white patients to spend everything they have on aggressive treatments that might prolong their lives, regardless of how sick they are, their income, savings, or age. In addition, the Dartmouth Atlas of Health's recent report "Trends and Variations in End-of-Life Care for Medicare Beneficiaries with Severe Chronic Illness" (PDF) found persistent evidence of widespread geographical differences in end-of-life care. In the last six months of their lives, chronically ill Medicare beneficiaries in some regions of the country spent three times as many days in the hospital and 10 times as many days in the ICU as patients in other regions.

Another survey found PCPs are more likely to choose for themselves treatments with higher rates of death but lower rates of adverse events than they would recommend to their patients (Arch Int Med 2011;171:630-634).

Several recently published studies have documented a variety of disparities in the provision of end-of-life care. In some cases, these disparities reflect socio-economic and cultural differences, information that could help hospitalists respond appropriately to different patients’ needs, says Tochi Iroku-Malize, MD, MPH, SFHM, chair of family medicine at North Shore-Long Island Jewish Health System in Great Neck, N.Y.

"One approach does not fit all patients," says Dr. Iroku-Malize, a former HM group director who is board-certified in hospice and palliative medicine. "If you understand that end-of-life care is important, and you know about disparities in care, you will understand the need to deal with these diverse populations."

Hospitalists should appreciate that even if they are not able to refer a seriously ill patient to palliative care or hospice during an initial acute encounter, they can plant a seed for subsequent conversations. They should also report these conversations back to the primary-care physician (PCP), as they would for other medical treatments, she adds.

Racial and ethnic differences independent of socio-economic status are seen in end-of-life care in ICUs, reports the journal Chest (2011;139(5):1025-1033). Nonwhite patients are less likely to have living wills and more likely to die on full life support, to have a documented family conference where prognosis was discussed, and to have discord within the family or with the physician over treatment choices.

A phone survey of cancer patients found that black patients are more likely than white patients to spend everything they have on aggressive treatments that might prolong their lives, regardless of how sick they are, their income, savings, or age. In addition, the Dartmouth Atlas of Health's recent report "Trends and Variations in End-of-Life Care for Medicare Beneficiaries with Severe Chronic Illness" (PDF) found persistent evidence of widespread geographical differences in end-of-life care. In the last six months of their lives, chronically ill Medicare beneficiaries in some regions of the country spent three times as many days in the hospital and 10 times as many days in the ICU as patients in other regions.

Another survey found PCPs are more likely to choose for themselves treatments with higher rates of death but lower rates of adverse events than they would recommend to their patients (Arch Int Med 2011;171:630-634).

Issue
The Hospitalist - 2011(06)
Issue
The Hospitalist - 2011(06)
Publications
Publications
Article Type
Display Headline
Difficult Conversations
Display Headline
Difficult Conversations
Sections
Disallow All Ads
Content Gating
No Gating (article Unlocked/Free)

European Trial Upholds Use of Erlotinib in EGFR-Mutant Lung Cancer

Article Type
Changed
Display Headline
European Trial Upholds Use of Erlotinib in EGFR-Mutant Lung Cancer

CHICAGO – Data from the prospective, phase-III EURTAC trial cement the need for personalized treatment of lung cancer patients but also leave clinicians in uncharted waters in terms of treatment options.

First-line erlotinib (Tarceva) improved the primary end point of progression-free survival from 5.2 months with standard platinum-based chemotherapy to 9.4 months in white patients who had advanced non-small cell lung cancer (NSCLC) with epidermal growth factor receptor (EGFR) mutations in an interim analysis.

Study cochair Dr. Rafael Rosell, president of the Spanish Lung Cancer Group, reported a significant 63% reduction in the risk of progression (hazard ratio, 0.37; log-rank P less than .0001) in an updated analysis presented at the annual meeting of the American Society of Clinical Oncology.

Based on positive results in the earlier interim analysis, Genentech and partner OSI Pharmaceuticals announced in January that the trial had been halted and they were set to pursue a broader indication for erlotinib as first-line treatment in NSCLC with EGFR mutations.

Erlotinib, a tyrosine kinase inhibitor (TKI), is approved in the United States and Europe as a maintenance and second-line treatment for advanced or metastatic NSCLC with and without EGFR activating mutations. Genentech’s parent company, Roche, submitted a bid to the European Medicines Agency in June 2010 to expand the drug’s label.

Even though the proverbial cat had already been let out of the bag by the drug makers, EURTAC caused a stir at ASCO, where the full data were formally presented and the study was chosen as one of the Best of ASCO 2011.

Invited discussant Dr. Tony Mok of the Chinese University of Hong Kong called the data trustworthy and a true reflection of erlotinib’s efficacy in patients with EGFR mutations. He drew parallels between EURTAC and the OPTIMAL trial in which erlotinib proved potent among Asians with this genetically distinct form of lung cancer. EGFR mutations are present in about 10% of patients in the West and about 30% of Asians, and they are associated with an increased response to erlotinib and the TKI gefitinib (Iressa).

Dr. Mok said that there’s a good chance erlotinib will be approved as first-line therapy. The EURTAC data are on par with the IPASS trial that helped gain approval for gefitinib (Iressa) as first-line therapy for patients with EGFR mutations in more than 70 countries, except the United States, where gefitinib use is restricted and AstraZeneca has said it will not seek a new indication for the drug.

"Now we have two drugs," said Dr. Mok, principal investigator of IPASS. "What are we going to do when faced with an EGFR mutation? Is there a difference in terms of the effectiveness between the TKIs in patients with EGFR mutations? That is the million-dollar question or the billion-dollar question."

Dr. Mok pointed out that three other TKIs are in the pipeline for patients with EGFR mutations, including icotinib (Zhejang BetaPharma); afatinib (Boehringer Ingelheim), which binds EGFR and inhibits HER2; and the oral, once-daily PF-299804 (Pfizer). A poster presented at ASCO on the phase-III ICOGEN trial reported that icotinib provides similar overall efficacy and better tolerability than gefitinib in patients with NSCLC who progressed after one to two lines of chemotherapy; it also improved efficacy in a subset of EGFR-mutant patient.

The EURTAC trial randomly assigned 174 chemo-naive, stage IIIB/IV NSCLC patients with exon 19 deletions or L858R mutations to receive erlotinib 150 mg/day or platinum-based doublet chemotherapy every 3 weeks for four cycles. The doublet could include cisplatin 75 mg/m2 on day 1 plus docetaxel 75 mg/m2 on day 1; cisplatin 75 mg/m2 on day 1 plus gemcitabine 1,250 mg/m2 on days 1 and 8; carboplatin area under the curve (AUC) 6 on day 1 plus docetaxel 75 mg/m2 on day 1 or carboplatin AUC 5 on day 1 plus gemcitabine 1,000 mg/m2 on days 1 and 8.

The objective response rate was 58% for erlotinib vs. 15% for chemotherapy in the updated analysis, said Dr. Rosell, head of medical oncology at the Catalan Institute of Oncology in Barcelona. At the time of the interim analysis, two patients had a complete response to erlotinib and 40 had partial responses, with 8 additional partial responses reported in the updated analysis. No patient had a complete response with chemotherapy, eight patients had partial responses early on, and five more reported partial responses in the updated analysis.

The disease control rate in the interim analysis was 79% for erlotinib vs. 66% in the updated analysis.

Median overall survival was 18.8 months with chemotherapy and 22.9 months in the interim analysis (hazard ratio, 0.80; log rank P = 0.42). As of the Jan. 26, 2011 cutoff date for the updated analysis, 94 patients remain in overall survival follow-up, with a high level of known crossover, Dr. Rosell said. A subgroup analysis suggested that progression-free survival was better in patients with a performance status of 0, never-smokers, and those with an exon 19 deletion.


The majority of patients who relapsed on erlotinib were switched to chemotherapy. The tolerability of erlotinib was consistent with previous studies, he noted.

The Spanish Lung Cancer Group sponsored the trial. Dr. Rosell disclosed a consultant/advisory role with Roche. Two of his coauthors reported a similar role, with one also providing expert testimony for Roche. Dr. Mok disclosed relationships with several drug companies, including AstraZeneca, Roche, Boehringer Ingelheim, and Pfizer.

Meeting/Event
Author and Disclosure Information

Publications
Topics
Legacy Keywords
EURTAC trial, lung cancer, First-line erlotinib, Tarceva, platinum-based chemotherapy, white patients, advanced non-small cell lung cancer, NSCLC, epidermal growth factor receptor mutations, EGFR, Dr. Rafael Rosell, Spanish Lung Cancer Group, American Society of Clinical Oncology.

Author and Disclosure Information

Author and Disclosure Information

Meeting/Event
Meeting/Event

CHICAGO – Data from the prospective, phase-III EURTAC trial cement the need for personalized treatment of lung cancer patients but also leave clinicians in uncharted waters in terms of treatment options.

First-line erlotinib (Tarceva) improved the primary end point of progression-free survival from 5.2 months with standard platinum-based chemotherapy to 9.4 months in white patients who had advanced non-small cell lung cancer (NSCLC) with epidermal growth factor receptor (EGFR) mutations in an interim analysis.

Study cochair Dr. Rafael Rosell, president of the Spanish Lung Cancer Group, reported a significant 63% reduction in the risk of progression (hazard ratio, 0.37; log-rank P less than .0001) in an updated analysis presented at the annual meeting of the American Society of Clinical Oncology.

Based on positive results in the earlier interim analysis, Genentech and partner OSI Pharmaceuticals announced in January that the trial had been halted and they were set to pursue a broader indication for erlotinib as first-line treatment in NSCLC with EGFR mutations.

Erlotinib, a tyrosine kinase inhibitor (TKI), is approved in the United States and Europe as a maintenance and second-line treatment for advanced or metastatic NSCLC with and without EGFR activating mutations. Genentech’s parent company, Roche, submitted a bid to the European Medicines Agency in June 2010 to expand the drug’s label.

Even though the proverbial cat had already been let out of the bag by the drug makers, EURTAC caused a stir at ASCO, where the full data were formally presented and the study was chosen as one of the Best of ASCO 2011.

Invited discussant Dr. Tony Mok of the Chinese University of Hong Kong called the data trustworthy and a true reflection of erlotinib’s efficacy in patients with EGFR mutations. He drew parallels between EURTAC and the OPTIMAL trial in which erlotinib proved potent among Asians with this genetically distinct form of lung cancer. EGFR mutations are present in about 10% of patients in the West and about 30% of Asians, and they are associated with an increased response to erlotinib and the TKI gefitinib (Iressa).

Dr. Mok said that there’s a good chance erlotinib will be approved as first-line therapy. The EURTAC data are on par with the IPASS trial that helped gain approval for gefitinib (Iressa) as first-line therapy for patients with EGFR mutations in more than 70 countries, except the United States, where gefitinib use is restricted and AstraZeneca has said it will not seek a new indication for the drug.

"Now we have two drugs," said Dr. Mok, principal investigator of IPASS. "What are we going to do when faced with an EGFR mutation? Is there a difference in terms of the effectiveness between the TKIs in patients with EGFR mutations? That is the million-dollar question or the billion-dollar question."

Dr. Mok pointed out that three other TKIs are in the pipeline for patients with EGFR mutations, including icotinib (Zhejang BetaPharma); afatinib (Boehringer Ingelheim), which binds EGFR and inhibits HER2; and the oral, once-daily PF-299804 (Pfizer). A poster presented at ASCO on the phase-III ICOGEN trial reported that icotinib provides similar overall efficacy and better tolerability than gefitinib in patients with NSCLC who progressed after one to two lines of chemotherapy; it also improved efficacy in a subset of EGFR-mutant patient.

The EURTAC trial randomly assigned 174 chemo-naive, stage IIIB/IV NSCLC patients with exon 19 deletions or L858R mutations to receive erlotinib 150 mg/day or platinum-based doublet chemotherapy every 3 weeks for four cycles. The doublet could include cisplatin 75 mg/m2 on day 1 plus docetaxel 75 mg/m2 on day 1; cisplatin 75 mg/m2 on day 1 plus gemcitabine 1,250 mg/m2 on days 1 and 8; carboplatin area under the curve (AUC) 6 on day 1 plus docetaxel 75 mg/m2 on day 1 or carboplatin AUC 5 on day 1 plus gemcitabine 1,000 mg/m2 on days 1 and 8.

The objective response rate was 58% for erlotinib vs. 15% for chemotherapy in the updated analysis, said Dr. Rosell, head of medical oncology at the Catalan Institute of Oncology in Barcelona. At the time of the interim analysis, two patients had a complete response to erlotinib and 40 had partial responses, with 8 additional partial responses reported in the updated analysis. No patient had a complete response with chemotherapy, eight patients had partial responses early on, and five more reported partial responses in the updated analysis.

The disease control rate in the interim analysis was 79% for erlotinib vs. 66% in the updated analysis.

Median overall survival was 18.8 months with chemotherapy and 22.9 months in the interim analysis (hazard ratio, 0.80; log rank P = 0.42). As of the Jan. 26, 2011 cutoff date for the updated analysis, 94 patients remain in overall survival follow-up, with a high level of known crossover, Dr. Rosell said. A subgroup analysis suggested that progression-free survival was better in patients with a performance status of 0, never-smokers, and those with an exon 19 deletion.


The majority of patients who relapsed on erlotinib were switched to chemotherapy. The tolerability of erlotinib was consistent with previous studies, he noted.

The Spanish Lung Cancer Group sponsored the trial. Dr. Rosell disclosed a consultant/advisory role with Roche. Two of his coauthors reported a similar role, with one also providing expert testimony for Roche. Dr. Mok disclosed relationships with several drug companies, including AstraZeneca, Roche, Boehringer Ingelheim, and Pfizer.

CHICAGO – Data from the prospective, phase-III EURTAC trial cement the need for personalized treatment of lung cancer patients but also leave clinicians in uncharted waters in terms of treatment options.

First-line erlotinib (Tarceva) improved the primary end point of progression-free survival from 5.2 months with standard platinum-based chemotherapy to 9.4 months in white patients who had advanced non-small cell lung cancer (NSCLC) with epidermal growth factor receptor (EGFR) mutations in an interim analysis.

Study cochair Dr. Rafael Rosell, president of the Spanish Lung Cancer Group, reported a significant 63% reduction in the risk of progression (hazard ratio, 0.37; log-rank P less than .0001) in an updated analysis presented at the annual meeting of the American Society of Clinical Oncology.

Based on positive results in the earlier interim analysis, Genentech and partner OSI Pharmaceuticals announced in January that the trial had been halted and they were set to pursue a broader indication for erlotinib as first-line treatment in NSCLC with EGFR mutations.

Erlotinib, a tyrosine kinase inhibitor (TKI), is approved in the United States and Europe as a maintenance and second-line treatment for advanced or metastatic NSCLC with and without EGFR activating mutations. Genentech’s parent company, Roche, submitted a bid to the European Medicines Agency in June 2010 to expand the drug’s label.

Even though the proverbial cat had already been let out of the bag by the drug makers, EURTAC caused a stir at ASCO, where the full data were formally presented and the study was chosen as one of the Best of ASCO 2011.

Invited discussant Dr. Tony Mok of the Chinese University of Hong Kong called the data trustworthy and a true reflection of erlotinib’s efficacy in patients with EGFR mutations. He drew parallels between EURTAC and the OPTIMAL trial in which erlotinib proved potent among Asians with this genetically distinct form of lung cancer. EGFR mutations are present in about 10% of patients in the West and about 30% of Asians, and they are associated with an increased response to erlotinib and the TKI gefitinib (Iressa).

Dr. Mok said that there’s a good chance erlotinib will be approved as first-line therapy. The EURTAC data are on par with the IPASS trial that helped gain approval for gefitinib (Iressa) as first-line therapy for patients with EGFR mutations in more than 70 countries, except the United States, where gefitinib use is restricted and AstraZeneca has said it will not seek a new indication for the drug.

"Now we have two drugs," said Dr. Mok, principal investigator of IPASS. "What are we going to do when faced with an EGFR mutation? Is there a difference in terms of the effectiveness between the TKIs in patients with EGFR mutations? That is the million-dollar question or the billion-dollar question."

Dr. Mok pointed out that three other TKIs are in the pipeline for patients with EGFR mutations, including icotinib (Zhejang BetaPharma); afatinib (Boehringer Ingelheim), which binds EGFR and inhibits HER2; and the oral, once-daily PF-299804 (Pfizer). A poster presented at ASCO on the phase-III ICOGEN trial reported that icotinib provides similar overall efficacy and better tolerability than gefitinib in patients with NSCLC who progressed after one to two lines of chemotherapy; it also improved efficacy in a subset of EGFR-mutant patient.

The EURTAC trial randomly assigned 174 chemo-naive, stage IIIB/IV NSCLC patients with exon 19 deletions or L858R mutations to receive erlotinib 150 mg/day or platinum-based doublet chemotherapy every 3 weeks for four cycles. The doublet could include cisplatin 75 mg/m2 on day 1 plus docetaxel 75 mg/m2 on day 1; cisplatin 75 mg/m2 on day 1 plus gemcitabine 1,250 mg/m2 on days 1 and 8; carboplatin area under the curve (AUC) 6 on day 1 plus docetaxel 75 mg/m2 on day 1 or carboplatin AUC 5 on day 1 plus gemcitabine 1,000 mg/m2 on days 1 and 8.

The objective response rate was 58% for erlotinib vs. 15% for chemotherapy in the updated analysis, said Dr. Rosell, head of medical oncology at the Catalan Institute of Oncology in Barcelona. At the time of the interim analysis, two patients had a complete response to erlotinib and 40 had partial responses, with 8 additional partial responses reported in the updated analysis. No patient had a complete response with chemotherapy, eight patients had partial responses early on, and five more reported partial responses in the updated analysis.

The disease control rate in the interim analysis was 79% for erlotinib vs. 66% in the updated analysis.

Median overall survival was 18.8 months with chemotherapy and 22.9 months in the interim analysis (hazard ratio, 0.80; log rank P = 0.42). As of the Jan. 26, 2011 cutoff date for the updated analysis, 94 patients remain in overall survival follow-up, with a high level of known crossover, Dr. Rosell said. A subgroup analysis suggested that progression-free survival was better in patients with a performance status of 0, never-smokers, and those with an exon 19 deletion.


The majority of patients who relapsed on erlotinib were switched to chemotherapy. The tolerability of erlotinib was consistent with previous studies, he noted.

The Spanish Lung Cancer Group sponsored the trial. Dr. Rosell disclosed a consultant/advisory role with Roche. Two of his coauthors reported a similar role, with one also providing expert testimony for Roche. Dr. Mok disclosed relationships with several drug companies, including AstraZeneca, Roche, Boehringer Ingelheim, and Pfizer.

Publications
Publications
Topics
Article Type
Display Headline
European Trial Upholds Use of Erlotinib in EGFR-Mutant Lung Cancer
Display Headline
European Trial Upholds Use of Erlotinib in EGFR-Mutant Lung Cancer
Legacy Keywords
EURTAC trial, lung cancer, First-line erlotinib, Tarceva, platinum-based chemotherapy, white patients, advanced non-small cell lung cancer, NSCLC, epidermal growth factor receptor mutations, EGFR, Dr. Rafael Rosell, Spanish Lung Cancer Group, American Society of Clinical Oncology.

Legacy Keywords
EURTAC trial, lung cancer, First-line erlotinib, Tarceva, platinum-based chemotherapy, white patients, advanced non-small cell lung cancer, NSCLC, epidermal growth factor receptor mutations, EGFR, Dr. Rafael Rosell, Spanish Lung Cancer Group, American Society of Clinical Oncology.

Article Source

FFROM THE ANNUAL MEETING OF THE AMERICAN SOCIETY OF CLINICAL ONCOLOGY

PURLs Copyright

Inside the Article

Vitals

Major Finding: Erlotinib resulted in a significant 63% reduction in the risk of progression, compared with standard chemotherapy (HR 0.37).

Data Source: Phase-III, prospective randomized EURTAC trial in 174 white patients with advanced non-small cell lung cancer and EGFR mutations.

Disclosures: The Spanish Lung Cancer Group sponsored the trial. Dr. Rosell disclosed a consultant/advisory role with Roche. Two of his coauthors reported a similar role, with one also providing expert testimony for Roche. Dr. Mok disclosed relationships with several drug companies, including AstraZeneca, Roche, Boehringer Ingelheim, and Pfizer.

European Trial Upholds Use of Erlotinib in EGFR-Mutant Lung Cancer

Article Type
Changed
Display Headline
European Trial Upholds Use of Erlotinib in EGFR-Mutant Lung Cancer

CHICAGO – Data from the prospective, phase-III EURTAC trial cement the need for personalized treatment of lung cancer patients but also leave clinicians in uncharted waters in terms of treatment options.

First-line erlotinib (Tarceva) improved the primary end point of progression-free survival from 5.2 months with standard platinum-based chemotherapy to 9.4 months in white patients who had advanced non-small cell lung cancer (NSCLC) with epidermal growth factor receptor (EGFR) mutations in an interim analysis.

Study cochair Dr. Rafael Rosell, president of the Spanish Lung Cancer Group, reported a significant 63% reduction in the risk of progression (hazard ratio, 0.37; log-rank P less than .0001) in an updated analysis presented at the annual meeting of the American Society of Clinical Oncology.

Based on positive results in the earlier interim analysis, Genentech and partner OSI Pharmaceuticals announced in January that the trial had been halted and they were set to pursue a broader indication for erlotinib as first-line treatment in NSCLC with EGFR mutations.

Erlotinib, a tyrosine kinase inhibitor (TKI), is approved in the United States and Europe as a maintenance and second-line treatment for advanced or metastatic NSCLC with and without EGFR activating mutations. Genentech’s parent company, Roche, submitted a bid to the European Medicines Agency in June 2010 to expand the drug’s label.

Even though the proverbial cat had already been let out of the bag by the drug makers, EURTAC caused a stir at ASCO, where the full data were formally presented and the study was chosen as one of the Best of ASCO 2011.

Invited discussant Dr. Tony Mok of the Chinese University of Hong Kong called the data trustworthy and a true reflection of erlotinib’s efficacy in patients with EGFR mutations. He drew parallels between EURTAC and the OPTIMAL trial in which erlotinib proved potent among Asians with this genetically distinct form of lung cancer. EGFR mutations are present in about 10% of patients in the West and about 30% of Asians, and they are associated with an increased response to erlotinib and the TKI gefitinib (Iressa).

Dr. Mok said that there’s a good chance erlotinib will be approved as first-line therapy. The EURTAC data are on par with the IPASS trial that helped gain approval for gefitinib (Iressa) as first-line therapy for patients with EGFR mutations in more than 70 countries, except the United States, where gefitinib use is restricted and AstraZeneca has said it will not seek a new indication for the drug.

"Now we have two drugs," said Dr. Mok, principal investigator of IPASS. "What are we going to do when faced with an EGFR mutation? Is there a difference in terms of the effectiveness between the TKIs in patients with EGFR mutations? That is the million-dollar question or the billion-dollar question."

Dr. Mok pointed out that three other TKIs are in the pipeline for patients with EGFR mutations, including icotinib (Zhejang BetaPharma); afatinib (Boehringer Ingelheim), which binds EGFR and inhibits HER2; and the oral, once-daily PF-299804 (Pfizer). A poster presented at ASCO on the phase-III ICOGEN trial reported that icotinib provides similar overall efficacy and better tolerability than gefitinib in patients with NSCLC who progressed after one to two lines of chemotherapy; it also improved efficacy in a subset of EGFR-mutant patient.

The EURTAC trial randomly assigned 174 chemo-naive, stage IIIB/IV NSCLC patients with exon 19 deletions or L858R mutations to receive erlotinib 150 mg/day or platinum-based doublet chemotherapy every 3 weeks for four cycles. The doublet could include cisplatin 75 mg/m2 on day 1 plus docetaxel 75 mg/m2 on day 1; cisplatin 75 mg/m2 on day 1 plus gemcitabine 1,250 mg/m2 on days 1 and 8; carboplatin area under the curve (AUC) 6 on day 1 plus docetaxel 75 mg/m2 on day 1 or carboplatin AUC 5 on day 1 plus gemcitabine 1,000 mg/m2 on days 1 and 8.

The objective response rate was 58% for erlotinib vs. 15% for chemotherapy in the updated analysis, said Dr. Rosell, head of medical oncology at the Catalan Institute of Oncology in Barcelona. At the time of the interim analysis, two patients had a complete response to erlotinib and 40 had partial responses, with 8 additional partial responses reported in the updated analysis. No patient had a complete response with chemotherapy, eight patients had partial responses early on, and five more reported partial responses in the updated analysis.

The disease control rate in the interim analysis was 79% for erlotinib vs. 66% in the updated analysis.

Median overall survival was 18.8 months with chemotherapy and 22.9 months in the interim analysis (hazard ratio, 0.80; log rank P = 0.42). As of the Jan. 26, 2011 cutoff date for the updated analysis, 94 patients remain in overall survival follow-up, with a high level of known crossover, Dr. Rosell said. A subgroup analysis suggested that progression-free survival was better in patients with a performance status of 0, never-smokers, and those with an exon 19 deletion.


The majority of patients who relapsed on erlotinib were switched to chemotherapy. The tolerability of erlotinib was consistent with previous studies, he noted.

The Spanish Lung Cancer Group sponsored the trial. Dr. Rosell disclosed a consultant/advisory role with Roche. Two of his coauthors reported a similar role, with one also providing expert testimony for Roche. Dr. Mok disclosed relationships with several drug companies, including AstraZeneca, Roche, Boehringer Ingelheim, and Pfizer.

Meeting/Event
Author and Disclosure Information

Publications
Topics
Legacy Keywords
EURTAC trial, lung cancer, First-line erlotinib, Tarceva, platinum-based chemotherapy, white patients, advanced non-small cell lung cancer, NSCLC, epidermal growth factor receptor mutations, EGFR, Dr. Rafael Rosell, Spanish Lung Cancer Group, American Society of Clinical Oncology.

Sections
Author and Disclosure Information

Author and Disclosure Information

Meeting/Event
Meeting/Event

CHICAGO – Data from the prospective, phase-III EURTAC trial cement the need for personalized treatment of lung cancer patients but also leave clinicians in uncharted waters in terms of treatment options.

First-line erlotinib (Tarceva) improved the primary end point of progression-free survival from 5.2 months with standard platinum-based chemotherapy to 9.4 months in white patients who had advanced non-small cell lung cancer (NSCLC) with epidermal growth factor receptor (EGFR) mutations in an interim analysis.

Study cochair Dr. Rafael Rosell, president of the Spanish Lung Cancer Group, reported a significant 63% reduction in the risk of progression (hazard ratio, 0.37; log-rank P less than .0001) in an updated analysis presented at the annual meeting of the American Society of Clinical Oncology.

Based on positive results in the earlier interim analysis, Genentech and partner OSI Pharmaceuticals announced in January that the trial had been halted and they were set to pursue a broader indication for erlotinib as first-line treatment in NSCLC with EGFR mutations.

Erlotinib, a tyrosine kinase inhibitor (TKI), is approved in the United States and Europe as a maintenance and second-line treatment for advanced or metastatic NSCLC with and without EGFR activating mutations. Genentech’s parent company, Roche, submitted a bid to the European Medicines Agency in June 2010 to expand the drug’s label.

Even though the proverbial cat had already been let out of the bag by the drug makers, EURTAC caused a stir at ASCO, where the full data were formally presented and the study was chosen as one of the Best of ASCO 2011.

Invited discussant Dr. Tony Mok of the Chinese University of Hong Kong called the data trustworthy and a true reflection of erlotinib’s efficacy in patients with EGFR mutations. He drew parallels between EURTAC and the OPTIMAL trial in which erlotinib proved potent among Asians with this genetically distinct form of lung cancer. EGFR mutations are present in about 10% of patients in the West and about 30% of Asians, and they are associated with an increased response to erlotinib and the TKI gefitinib (Iressa).

Dr. Mok said that there’s a good chance erlotinib will be approved as first-line therapy. The EURTAC data are on par with the IPASS trial that helped gain approval for gefitinib (Iressa) as first-line therapy for patients with EGFR mutations in more than 70 countries, except the United States, where gefitinib use is restricted and AstraZeneca has said it will not seek a new indication for the drug.

"Now we have two drugs," said Dr. Mok, principal investigator of IPASS. "What are we going to do when faced with an EGFR mutation? Is there a difference in terms of the effectiveness between the TKIs in patients with EGFR mutations? That is the million-dollar question or the billion-dollar question."

Dr. Mok pointed out that three other TKIs are in the pipeline for patients with EGFR mutations, including icotinib (Zhejang BetaPharma); afatinib (Boehringer Ingelheim), which binds EGFR and inhibits HER2; and the oral, once-daily PF-299804 (Pfizer). A poster presented at ASCO on the phase-III ICOGEN trial reported that icotinib provides similar overall efficacy and better tolerability than gefitinib in patients with NSCLC who progressed after one to two lines of chemotherapy; it also improved efficacy in a subset of EGFR-mutant patient.

The EURTAC trial randomly assigned 174 chemo-naive, stage IIIB/IV NSCLC patients with exon 19 deletions or L858R mutations to receive erlotinib 150 mg/day or platinum-based doublet chemotherapy every 3 weeks for four cycles. The doublet could include cisplatin 75 mg/m2 on day 1 plus docetaxel 75 mg/m2 on day 1; cisplatin 75 mg/m2 on day 1 plus gemcitabine 1,250 mg/m2 on days 1 and 8; carboplatin area under the curve (AUC) 6 on day 1 plus docetaxel 75 mg/m2 on day 1 or carboplatin AUC 5 on day 1 plus gemcitabine 1,000 mg/m2 on days 1 and 8.

The objective response rate was 58% for erlotinib vs. 15% for chemotherapy in the updated analysis, said Dr. Rosell, head of medical oncology at the Catalan Institute of Oncology in Barcelona. At the time of the interim analysis, two patients had a complete response to erlotinib and 40 had partial responses, with 8 additional partial responses reported in the updated analysis. No patient had a complete response with chemotherapy, eight patients had partial responses early on, and five more reported partial responses in the updated analysis.

The disease control rate in the interim analysis was 79% for erlotinib vs. 66% in the updated analysis.

Median overall survival was 18.8 months with chemotherapy and 22.9 months in the interim analysis (hazard ratio, 0.80; log rank P = 0.42). As of the Jan. 26, 2011 cutoff date for the updated analysis, 94 patients remain in overall survival follow-up, with a high level of known crossover, Dr. Rosell said. A subgroup analysis suggested that progression-free survival was better in patients with a performance status of 0, never-smokers, and those with an exon 19 deletion.


The majority of patients who relapsed on erlotinib were switched to chemotherapy. The tolerability of erlotinib was consistent with previous studies, he noted.

The Spanish Lung Cancer Group sponsored the trial. Dr. Rosell disclosed a consultant/advisory role with Roche. Two of his coauthors reported a similar role, with one also providing expert testimony for Roche. Dr. Mok disclosed relationships with several drug companies, including AstraZeneca, Roche, Boehringer Ingelheim, and Pfizer.

CHICAGO – Data from the prospective, phase-III EURTAC trial cement the need for personalized treatment of lung cancer patients but also leave clinicians in uncharted waters in terms of treatment options.

First-line erlotinib (Tarceva) improved the primary end point of progression-free survival from 5.2 months with standard platinum-based chemotherapy to 9.4 months in white patients who had advanced non-small cell lung cancer (NSCLC) with epidermal growth factor receptor (EGFR) mutations in an interim analysis.

Study cochair Dr. Rafael Rosell, president of the Spanish Lung Cancer Group, reported a significant 63% reduction in the risk of progression (hazard ratio, 0.37; log-rank P less than .0001) in an updated analysis presented at the annual meeting of the American Society of Clinical Oncology.

Based on positive results in the earlier interim analysis, Genentech and partner OSI Pharmaceuticals announced in January that the trial had been halted and they were set to pursue a broader indication for erlotinib as first-line treatment in NSCLC with EGFR mutations.

Erlotinib, a tyrosine kinase inhibitor (TKI), is approved in the United States and Europe as a maintenance and second-line treatment for advanced or metastatic NSCLC with and without EGFR activating mutations. Genentech’s parent company, Roche, submitted a bid to the European Medicines Agency in June 2010 to expand the drug’s label.

Even though the proverbial cat had already been let out of the bag by the drug makers, EURTAC caused a stir at ASCO, where the full data were formally presented and the study was chosen as one of the Best of ASCO 2011.

Invited discussant Dr. Tony Mok of the Chinese University of Hong Kong called the data trustworthy and a true reflection of erlotinib’s efficacy in patients with EGFR mutations. He drew parallels between EURTAC and the OPTIMAL trial in which erlotinib proved potent among Asians with this genetically distinct form of lung cancer. EGFR mutations are present in about 10% of patients in the West and about 30% of Asians, and they are associated with an increased response to erlotinib and the TKI gefitinib (Iressa).

Dr. Mok said that there’s a good chance erlotinib will be approved as first-line therapy. The EURTAC data are on par with the IPASS trial that helped gain approval for gefitinib (Iressa) as first-line therapy for patients with EGFR mutations in more than 70 countries, except the United States, where gefitinib use is restricted and AstraZeneca has said it will not seek a new indication for the drug.

"Now we have two drugs," said Dr. Mok, principal investigator of IPASS. "What are we going to do when faced with an EGFR mutation? Is there a difference in terms of the effectiveness between the TKIs in patients with EGFR mutations? That is the million-dollar question or the billion-dollar question."

Dr. Mok pointed out that three other TKIs are in the pipeline for patients with EGFR mutations, including icotinib (Zhejang BetaPharma); afatinib (Boehringer Ingelheim), which binds EGFR and inhibits HER2; and the oral, once-daily PF-299804 (Pfizer). A poster presented at ASCO on the phase-III ICOGEN trial reported that icotinib provides similar overall efficacy and better tolerability than gefitinib in patients with NSCLC who progressed after one to two lines of chemotherapy; it also improved efficacy in a subset of EGFR-mutant patient.

The EURTAC trial randomly assigned 174 chemo-naive, stage IIIB/IV NSCLC patients with exon 19 deletions or L858R mutations to receive erlotinib 150 mg/day or platinum-based doublet chemotherapy every 3 weeks for four cycles. The doublet could include cisplatin 75 mg/m2 on day 1 plus docetaxel 75 mg/m2 on day 1; cisplatin 75 mg/m2 on day 1 plus gemcitabine 1,250 mg/m2 on days 1 and 8; carboplatin area under the curve (AUC) 6 on day 1 plus docetaxel 75 mg/m2 on day 1 or carboplatin AUC 5 on day 1 plus gemcitabine 1,000 mg/m2 on days 1 and 8.

The objective response rate was 58% for erlotinib vs. 15% for chemotherapy in the updated analysis, said Dr. Rosell, head of medical oncology at the Catalan Institute of Oncology in Barcelona. At the time of the interim analysis, two patients had a complete response to erlotinib and 40 had partial responses, with 8 additional partial responses reported in the updated analysis. No patient had a complete response with chemotherapy, eight patients had partial responses early on, and five more reported partial responses in the updated analysis.

The disease control rate in the interim analysis was 79% for erlotinib vs. 66% in the updated analysis.

Median overall survival was 18.8 months with chemotherapy and 22.9 months in the interim analysis (hazard ratio, 0.80; log rank P = 0.42). As of the Jan. 26, 2011 cutoff date for the updated analysis, 94 patients remain in overall survival follow-up, with a high level of known crossover, Dr. Rosell said. A subgroup analysis suggested that progression-free survival was better in patients with a performance status of 0, never-smokers, and those with an exon 19 deletion.


The majority of patients who relapsed on erlotinib were switched to chemotherapy. The tolerability of erlotinib was consistent with previous studies, he noted.

The Spanish Lung Cancer Group sponsored the trial. Dr. Rosell disclosed a consultant/advisory role with Roche. Two of his coauthors reported a similar role, with one also providing expert testimony for Roche. Dr. Mok disclosed relationships with several drug companies, including AstraZeneca, Roche, Boehringer Ingelheim, and Pfizer.

Publications
Publications
Topics
Article Type
Display Headline
European Trial Upholds Use of Erlotinib in EGFR-Mutant Lung Cancer
Display Headline
European Trial Upholds Use of Erlotinib in EGFR-Mutant Lung Cancer
Legacy Keywords
EURTAC trial, lung cancer, First-line erlotinib, Tarceva, platinum-based chemotherapy, white patients, advanced non-small cell lung cancer, NSCLC, epidermal growth factor receptor mutations, EGFR, Dr. Rafael Rosell, Spanish Lung Cancer Group, American Society of Clinical Oncology.

Legacy Keywords
EURTAC trial, lung cancer, First-line erlotinib, Tarceva, platinum-based chemotherapy, white patients, advanced non-small cell lung cancer, NSCLC, epidermal growth factor receptor mutations, EGFR, Dr. Rafael Rosell, Spanish Lung Cancer Group, American Society of Clinical Oncology.

Sections
Article Source

FFROM THE ANNUAL MEETING OF THE AMERICAN SOCIETY OF CLINICAL ONCOLOGY

PURLs Copyright

Inside the Article

Vitals

Major Finding: Erlotinib resulted in a significant 63% reduction in the risk of progression, compared with standard chemotherapy (HR 0.37).

Data Source: Phase-III, prospective randomized EURTAC trial in 174 white patients with advanced non-small cell lung cancer and EGFR mutations.

Disclosures: The Spanish Lung Cancer Group sponsored the trial. Dr. Rosell disclosed a consultant/advisory role with Roche. Two of his coauthors reported a similar role, with one also providing expert testimony for Roche. Dr. Mok disclosed relationships with several drug companies, including AstraZeneca, Roche, Boehringer Ingelheim, and Pfizer.

Accurate Biomarker Testing Key to Experimental MetMAb in Lung Cancer

Article Type
Changed
Display Headline
Accurate Biomarker Testing Key to Experimental MetMAb in Lung Cancer

CHICAGO – Final efficacy results from the phase II OAM4458g trial confirm that the success of MetMAb in previously treated advanced lung cancer lies in accurate biomarker testing.

While some patients gained a striking survival advantage when given the investigational monoclonal antibody as second-or third-line therapy for non–small cell lung cancer (NSCLC), the study group as a whole did not and others actually did worse. The difference appears to be driven by expression of the c-Met receptor.

    Dr. David Spigel

MetMAb targets hepatocyte growth factor and its receptor, c-Met. Expression of c-Met is associated with a worse prognosis in many cancers, including NSCLC. Met activation by hepatocyte growth factor is also thought to decrease sensitivity to erlotinib (Tarceva). Hence the interest in combining MetMAb with erlotinib. In this trial patients received either a combination of the two drugs or erlotinib with a placebo.

In NSCLC patients whose tumors were classified as Met positive, the addition of MetMAb to erlotinib nearly doubled the median time that they were free of disease from 1.5 months to 2.9 months (hazard ratio, 0.53; log rank P = .04) and tripled median overall survival from 3.8 months to 12.6 months (HR, 0.37; log rank P = .002), Dr. David Spigel said at the annual meeting of the American Society of Clinical Oncology.

When MetMAb plus erlotinib was given to patients with Met-negative tumors, however, median progression-free survival was significantly lower at 1.4 months, compared with 2.7 months in the control arm given erlotinib plus placebo (HR, 1.82; P = .05).

Median overall survival was also shorter with the combination in the Met-negative group – 8.1 months vs. 15.3 months with erlotinib and placebo – although the difference did not reach statistical significance (HR, 1.78; P = .158), said Dr Spigel, director of lung cancer research at the Sarah Cannon Research Institute in Nashville, Tenn.

Invited discussant Dr. Tony Mok, with the Chinese University of Hong Kong, said there’s no doubt that MetMAb should move into phase III evaluation, but stressed the need for accurate biomarker testing in patients to determine Met status.

"This is the key to the success of this drug," he said. "Is this biomarker valid and trustworthy?"

The Met diagnostic test used in the phase II study was developed by Ventana Medical Systems, a tissue diagnostics company owned by Roche, the parent company of the study sponsor, Genentech. Met status was assessed after randomization and prior to unblinding, with 93% of all 137 patients having adequate tissue for evaluation of c-Met by immunohistochemistry. In all, 52% of patients with evaluable tissue were "Met diagnostic positive," defined by at least 50% of tumor cells with moderate or strong staining intensity, Dr. Spigel explained.

Patients were randomized to erlotinib 150 mg daily plus MetMAb 15 mg/kg IV every 3 weeks or the same dosing of erlotinib and placebo. Coprimary end points were progression-free survival in the Met diagnostic–positive and intention-to-treat populations.

In the latter, the combination of MetMAb and erlotinib failed to significantly improve median time to progression over erlotinib (2.2 months vs. 2.6 months; HR, = 1.09; P = .69) or overall survival (8.9 months vs. 7.4 months; HR, 0.80; P = .34), he said.

The researchers performed additional analyses in key subpopulations, suggesting that the benefit from MetMAb is not related to epidermal growth factor receptor mutation or fluorescence in situ hybridization (FISH) status.

Although the patient numbers were small, an overall survival advantage was observed with MetMAb for patients with high Met expression (at least 5 copies) by FISH (HR, 0.60; P = .35), and was maintained in FISH-negative/Met diagnostic–positive patients (HR, 0.37; P = .01), Dr. Spigel said. Patients who were Met diagnostic positive and did not have an epidermal growth factor receptor mutation also gained a survival advantage (HR, 0.42; P = .01).

"Outcomes in the diagnostic subpopulations highlight the importance of developing tools to identify patients who might best benefit from this treatment," he said, adding that immunohistochemistry appears to be more sensitive than FISH in determining benefit from combination MetMAb/erlotinib.

The study confirmed that Met expression by immunohistochemistry is associated with worse outcomes. An analysis of the 68 patients treated with erlotinib plus placebo confirmed that Met expression revealed that progression-free survival was worse among Met diagnostic–positive vs. Met diagnostic–negative patients (1.5 months vs. 2.7 months; HR, 1.71; P = .06), as was overall survival (3.8 months vs. 15.3 months; HR, 2.61; P = .004).

In response to audience questions, Dr. Spigel said it is unknown whether metastatic sites have different Met expression than primary tumor sites or why outcomes are worse in low Met tumors.


Dr. Spigel observed that no new safety concerns emerged in the trial, although patients treated with MetMAb had more peripheral edema that was largely low grade, reversible, and manageable.

A phase III study testing MetMAb plus erlotinib in Met diagnostic–positive patients is expected to start enrolling this year, he said.

Dr. Spigel disclosed a consultant/advisory role with Genentech, which sponsored the study. His coauthors disclosed financial relationships with several firms including employment with Genentech.

Meeting/Event
Author and Disclosure Information

Publications
Topics
Author and Disclosure Information

Author and Disclosure Information

Meeting/Event
Meeting/Event

CHICAGO – Final efficacy results from the phase II OAM4458g trial confirm that the success of MetMAb in previously treated advanced lung cancer lies in accurate biomarker testing.

While some patients gained a striking survival advantage when given the investigational monoclonal antibody as second-or third-line therapy for non–small cell lung cancer (NSCLC), the study group as a whole did not and others actually did worse. The difference appears to be driven by expression of the c-Met receptor.

    Dr. David Spigel

MetMAb targets hepatocyte growth factor and its receptor, c-Met. Expression of c-Met is associated with a worse prognosis in many cancers, including NSCLC. Met activation by hepatocyte growth factor is also thought to decrease sensitivity to erlotinib (Tarceva). Hence the interest in combining MetMAb with erlotinib. In this trial patients received either a combination of the two drugs or erlotinib with a placebo.

In NSCLC patients whose tumors were classified as Met positive, the addition of MetMAb to erlotinib nearly doubled the median time that they were free of disease from 1.5 months to 2.9 months (hazard ratio, 0.53; log rank P = .04) and tripled median overall survival from 3.8 months to 12.6 months (HR, 0.37; log rank P = .002), Dr. David Spigel said at the annual meeting of the American Society of Clinical Oncology.

When MetMAb plus erlotinib was given to patients with Met-negative tumors, however, median progression-free survival was significantly lower at 1.4 months, compared with 2.7 months in the control arm given erlotinib plus placebo (HR, 1.82; P = .05).

Median overall survival was also shorter with the combination in the Met-negative group – 8.1 months vs. 15.3 months with erlotinib and placebo – although the difference did not reach statistical significance (HR, 1.78; P = .158), said Dr Spigel, director of lung cancer research at the Sarah Cannon Research Institute in Nashville, Tenn.

Invited discussant Dr. Tony Mok, with the Chinese University of Hong Kong, said there’s no doubt that MetMAb should move into phase III evaluation, but stressed the need for accurate biomarker testing in patients to determine Met status.

"This is the key to the success of this drug," he said. "Is this biomarker valid and trustworthy?"

The Met diagnostic test used in the phase II study was developed by Ventana Medical Systems, a tissue diagnostics company owned by Roche, the parent company of the study sponsor, Genentech. Met status was assessed after randomization and prior to unblinding, with 93% of all 137 patients having adequate tissue for evaluation of c-Met by immunohistochemistry. In all, 52% of patients with evaluable tissue were "Met diagnostic positive," defined by at least 50% of tumor cells with moderate or strong staining intensity, Dr. Spigel explained.

Patients were randomized to erlotinib 150 mg daily plus MetMAb 15 mg/kg IV every 3 weeks or the same dosing of erlotinib and placebo. Coprimary end points were progression-free survival in the Met diagnostic–positive and intention-to-treat populations.

In the latter, the combination of MetMAb and erlotinib failed to significantly improve median time to progression over erlotinib (2.2 months vs. 2.6 months; HR, = 1.09; P = .69) or overall survival (8.9 months vs. 7.4 months; HR, 0.80; P = .34), he said.

The researchers performed additional analyses in key subpopulations, suggesting that the benefit from MetMAb is not related to epidermal growth factor receptor mutation or fluorescence in situ hybridization (FISH) status.

Although the patient numbers were small, an overall survival advantage was observed with MetMAb for patients with high Met expression (at least 5 copies) by FISH (HR, 0.60; P = .35), and was maintained in FISH-negative/Met diagnostic–positive patients (HR, 0.37; P = .01), Dr. Spigel said. Patients who were Met diagnostic positive and did not have an epidermal growth factor receptor mutation also gained a survival advantage (HR, 0.42; P = .01).

"Outcomes in the diagnostic subpopulations highlight the importance of developing tools to identify patients who might best benefit from this treatment," he said, adding that immunohistochemistry appears to be more sensitive than FISH in determining benefit from combination MetMAb/erlotinib.

The study confirmed that Met expression by immunohistochemistry is associated with worse outcomes. An analysis of the 68 patients treated with erlotinib plus placebo confirmed that Met expression revealed that progression-free survival was worse among Met diagnostic–positive vs. Met diagnostic–negative patients (1.5 months vs. 2.7 months; HR, 1.71; P = .06), as was overall survival (3.8 months vs. 15.3 months; HR, 2.61; P = .004).

In response to audience questions, Dr. Spigel said it is unknown whether metastatic sites have different Met expression than primary tumor sites or why outcomes are worse in low Met tumors.


Dr. Spigel observed that no new safety concerns emerged in the trial, although patients treated with MetMAb had more peripheral edema that was largely low grade, reversible, and manageable.

A phase III study testing MetMAb plus erlotinib in Met diagnostic–positive patients is expected to start enrolling this year, he said.

Dr. Spigel disclosed a consultant/advisory role with Genentech, which sponsored the study. His coauthors disclosed financial relationships with several firms including employment with Genentech.

CHICAGO – Final efficacy results from the phase II OAM4458g trial confirm that the success of MetMAb in previously treated advanced lung cancer lies in accurate biomarker testing.

While some patients gained a striking survival advantage when given the investigational monoclonal antibody as second-or third-line therapy for non–small cell lung cancer (NSCLC), the study group as a whole did not and others actually did worse. The difference appears to be driven by expression of the c-Met receptor.

    Dr. David Spigel

MetMAb targets hepatocyte growth factor and its receptor, c-Met. Expression of c-Met is associated with a worse prognosis in many cancers, including NSCLC. Met activation by hepatocyte growth factor is also thought to decrease sensitivity to erlotinib (Tarceva). Hence the interest in combining MetMAb with erlotinib. In this trial patients received either a combination of the two drugs or erlotinib with a placebo.

In NSCLC patients whose tumors were classified as Met positive, the addition of MetMAb to erlotinib nearly doubled the median time that they were free of disease from 1.5 months to 2.9 months (hazard ratio, 0.53; log rank P = .04) and tripled median overall survival from 3.8 months to 12.6 months (HR, 0.37; log rank P = .002), Dr. David Spigel said at the annual meeting of the American Society of Clinical Oncology.

When MetMAb plus erlotinib was given to patients with Met-negative tumors, however, median progression-free survival was significantly lower at 1.4 months, compared with 2.7 months in the control arm given erlotinib plus placebo (HR, 1.82; P = .05).

Median overall survival was also shorter with the combination in the Met-negative group – 8.1 months vs. 15.3 months with erlotinib and placebo – although the difference did not reach statistical significance (HR, 1.78; P = .158), said Dr Spigel, director of lung cancer research at the Sarah Cannon Research Institute in Nashville, Tenn.

Invited discussant Dr. Tony Mok, with the Chinese University of Hong Kong, said there’s no doubt that MetMAb should move into phase III evaluation, but stressed the need for accurate biomarker testing in patients to determine Met status.

"This is the key to the success of this drug," he said. "Is this biomarker valid and trustworthy?"

The Met diagnostic test used in the phase II study was developed by Ventana Medical Systems, a tissue diagnostics company owned by Roche, the parent company of the study sponsor, Genentech. Met status was assessed after randomization and prior to unblinding, with 93% of all 137 patients having adequate tissue for evaluation of c-Met by immunohistochemistry. In all, 52% of patients with evaluable tissue were "Met diagnostic positive," defined by at least 50% of tumor cells with moderate or strong staining intensity, Dr. Spigel explained.

Patients were randomized to erlotinib 150 mg daily plus MetMAb 15 mg/kg IV every 3 weeks or the same dosing of erlotinib and placebo. Coprimary end points were progression-free survival in the Met diagnostic–positive and intention-to-treat populations.

In the latter, the combination of MetMAb and erlotinib failed to significantly improve median time to progression over erlotinib (2.2 months vs. 2.6 months; HR, = 1.09; P = .69) or overall survival (8.9 months vs. 7.4 months; HR, 0.80; P = .34), he said.

The researchers performed additional analyses in key subpopulations, suggesting that the benefit from MetMAb is not related to epidermal growth factor receptor mutation or fluorescence in situ hybridization (FISH) status.

Although the patient numbers were small, an overall survival advantage was observed with MetMAb for patients with high Met expression (at least 5 copies) by FISH (HR, 0.60; P = .35), and was maintained in FISH-negative/Met diagnostic–positive patients (HR, 0.37; P = .01), Dr. Spigel said. Patients who were Met diagnostic positive and did not have an epidermal growth factor receptor mutation also gained a survival advantage (HR, 0.42; P = .01).

"Outcomes in the diagnostic subpopulations highlight the importance of developing tools to identify patients who might best benefit from this treatment," he said, adding that immunohistochemistry appears to be more sensitive than FISH in determining benefit from combination MetMAb/erlotinib.

The study confirmed that Met expression by immunohistochemistry is associated with worse outcomes. An analysis of the 68 patients treated with erlotinib plus placebo confirmed that Met expression revealed that progression-free survival was worse among Met diagnostic–positive vs. Met diagnostic–negative patients (1.5 months vs. 2.7 months; HR, 1.71; P = .06), as was overall survival (3.8 months vs. 15.3 months; HR, 2.61; P = .004).

In response to audience questions, Dr. Spigel said it is unknown whether metastatic sites have different Met expression than primary tumor sites or why outcomes are worse in low Met tumors.


Dr. Spigel observed that no new safety concerns emerged in the trial, although patients treated with MetMAb had more peripheral edema that was largely low grade, reversible, and manageable.

A phase III study testing MetMAb plus erlotinib in Met diagnostic–positive patients is expected to start enrolling this year, he said.

Dr. Spigel disclosed a consultant/advisory role with Genentech, which sponsored the study. His coauthors disclosed financial relationships with several firms including employment with Genentech.

Publications
Publications
Topics
Article Type
Display Headline
Accurate Biomarker Testing Key to Experimental MetMAb in Lung Cancer
Display Headline
Accurate Biomarker Testing Key to Experimental MetMAb in Lung Cancer
Article Source

FROM THE ANNUAL MEETING OF THE AMERICAN SOCIETY OF CLINICAL ONCOLOGY

PURLs Copyright

Inside the Article

Vitals

Major Finding: Among Met-positive patients, median progression-free survival doubled from 1.5 months with erlotinib to 2.9 months with the addition of MetMAb (HR, 0.53; P = .04).

Data Source: Randomized phase II trial in 137 patients with advanced non–small cell lung cancer.

Disclosures: Dr. Spigel disclosed a consultant/advisory role with Genentech, which sponsored the study. His coauthors disclosed financial relationships with several firms including employment with Genentech.

Statin Cuts Recurrent Stroke Risk Similarly in Diabetic, Nondiabetic Patients

Article Type
Changed
Display Headline
Statin Cuts Recurrent Stroke Risk Similarly in Diabetic, Nondiabetic Patients

Statin therapy appears to reduce the risk of recurrent stroke among patients with diabetes or the metabolic syndrome to the same degree that it does in patients who have neither disorder, according to a planned post hoc analysis of data collected in the Stroke Prevention by Aggressive Reduction in Cholesterol Levels clinical trial.

However, since patients with diabetes start off with a much higher risk of recurrent stroke, their risk remains higher than that of nondiabetic patients even after statin therapy, Dr. Alfred Callahan of Vanderbilt University, Nashville, Tenn., and his associates reported online June 13 in Archives of Neurology.

Until now, no information has been available on the effect of statin treatment on secondary stroke prevention in patients with type 2 diabetes or the metabolic syndrome, the investigators noted.

The primary conclusion of the SPARCL clinical trial was that atorvastatin (Lipitor) reduced stroke risk in general. For this secondary analysis, Dr. Callahan and his colleagues assessed stroke risk in 794 adults who had type 2 diabetes, 642 who had the metabolic syndrome, and a reference group of 3,295 who had neither disorder.

The study subjects were ambulatory men and women with no known coronary heart disease who had had ischemic stroke, hemorrhagic stroke, or transient ischemic attack (TIA) 1-6 months before undergoing randomization in the SPARCL trial. They were treated at 205 medical centers in Africa, Australia, Europe, the Middle East, North America, and South America. The mean age was 63 years, and subjects were assessed every 6 months for a mean of 5 years.

Treatment with atorvastatin decreased LDL cholesterol levels to a similar degree across the three study groups, and lowered triglycerides by 11% in the group with diabetes, 20% in the group with metabolic syndrome, and 9% in the reference group.

Despite these treatment benefits, subjects with diabetes remained at increased risk of recurrent stroke (hazard ratio, 1.62), of major cardiovascular events (HR, 1.66), and of revascularization procedures (HR, 2.39), compared with the reference group. Subjects with metabolic syndrome were at increased risk of revascularization procedures (HR, 1.78) but not of other adverse cardiovascular outcomes.

At the conclusion of the study, the rate of recurrent stroke was 18% in patients with diabetes, 11% in those with metabolic syndrome, and 11% in the reference group.

"There was no evidence of a difference in treatment effect" among the three study groups, Dr. Callahan and his associates said (Arch. Neurol. 2011 June 13 [doi:10.1001/archneurol.2011.146]).

"These results should be viewed as exploratory" because the SPARCL trial was not powered to test for subgroup effects, they noted.

However, the findings agree with those of the Cholesterol Treatment Trialists’ collaboration, which also found that the effect of statins on stroke risk was similar between diabetic and nondiabetic patients, the researchers added.

Pfizer sponsored the study. Dr. Callahan reported receiving support from Pfizer, Sanofi-Aventis, and Bristol-Myers Squibb. His associates reported ties to numerous pharmaceutical and device companies.

Author and Disclosure Information

Publications
Topics
Legacy Keywords
Statin therapy, recurrent stroke, diabetes, metabolic syndrome, Stroke Prevention by Aggressive Reduction in Cholesterol Levels clinical trial, Dr. Alfred Callahan, Archives of Neurology, atorvastatin, Lipitor
Author and Disclosure Information

Author and Disclosure Information

Statin therapy appears to reduce the risk of recurrent stroke among patients with diabetes or the metabolic syndrome to the same degree that it does in patients who have neither disorder, according to a planned post hoc analysis of data collected in the Stroke Prevention by Aggressive Reduction in Cholesterol Levels clinical trial.

However, since patients with diabetes start off with a much higher risk of recurrent stroke, their risk remains higher than that of nondiabetic patients even after statin therapy, Dr. Alfred Callahan of Vanderbilt University, Nashville, Tenn., and his associates reported online June 13 in Archives of Neurology.

Until now, no information has been available on the effect of statin treatment on secondary stroke prevention in patients with type 2 diabetes or the metabolic syndrome, the investigators noted.

The primary conclusion of the SPARCL clinical trial was that atorvastatin (Lipitor) reduced stroke risk in general. For this secondary analysis, Dr. Callahan and his colleagues assessed stroke risk in 794 adults who had type 2 diabetes, 642 who had the metabolic syndrome, and a reference group of 3,295 who had neither disorder.

The study subjects were ambulatory men and women with no known coronary heart disease who had had ischemic stroke, hemorrhagic stroke, or transient ischemic attack (TIA) 1-6 months before undergoing randomization in the SPARCL trial. They were treated at 205 medical centers in Africa, Australia, Europe, the Middle East, North America, and South America. The mean age was 63 years, and subjects were assessed every 6 months for a mean of 5 years.

Treatment with atorvastatin decreased LDL cholesterol levels to a similar degree across the three study groups, and lowered triglycerides by 11% in the group with diabetes, 20% in the group with metabolic syndrome, and 9% in the reference group.

Despite these treatment benefits, subjects with diabetes remained at increased risk of recurrent stroke (hazard ratio, 1.62), of major cardiovascular events (HR, 1.66), and of revascularization procedures (HR, 2.39), compared with the reference group. Subjects with metabolic syndrome were at increased risk of revascularization procedures (HR, 1.78) but not of other adverse cardiovascular outcomes.

At the conclusion of the study, the rate of recurrent stroke was 18% in patients with diabetes, 11% in those with metabolic syndrome, and 11% in the reference group.

"There was no evidence of a difference in treatment effect" among the three study groups, Dr. Callahan and his associates said (Arch. Neurol. 2011 June 13 [doi:10.1001/archneurol.2011.146]).

"These results should be viewed as exploratory" because the SPARCL trial was not powered to test for subgroup effects, they noted.

However, the findings agree with those of the Cholesterol Treatment Trialists’ collaboration, which also found that the effect of statins on stroke risk was similar between diabetic and nondiabetic patients, the researchers added.

Pfizer sponsored the study. Dr. Callahan reported receiving support from Pfizer, Sanofi-Aventis, and Bristol-Myers Squibb. His associates reported ties to numerous pharmaceutical and device companies.

Statin therapy appears to reduce the risk of recurrent stroke among patients with diabetes or the metabolic syndrome to the same degree that it does in patients who have neither disorder, according to a planned post hoc analysis of data collected in the Stroke Prevention by Aggressive Reduction in Cholesterol Levels clinical trial.

However, since patients with diabetes start off with a much higher risk of recurrent stroke, their risk remains higher than that of nondiabetic patients even after statin therapy, Dr. Alfred Callahan of Vanderbilt University, Nashville, Tenn., and his associates reported online June 13 in Archives of Neurology.

Until now, no information has been available on the effect of statin treatment on secondary stroke prevention in patients with type 2 diabetes or the metabolic syndrome, the investigators noted.

The primary conclusion of the SPARCL clinical trial was that atorvastatin (Lipitor) reduced stroke risk in general. For this secondary analysis, Dr. Callahan and his colleagues assessed stroke risk in 794 adults who had type 2 diabetes, 642 who had the metabolic syndrome, and a reference group of 3,295 who had neither disorder.

The study subjects were ambulatory men and women with no known coronary heart disease who had had ischemic stroke, hemorrhagic stroke, or transient ischemic attack (TIA) 1-6 months before undergoing randomization in the SPARCL trial. They were treated at 205 medical centers in Africa, Australia, Europe, the Middle East, North America, and South America. The mean age was 63 years, and subjects were assessed every 6 months for a mean of 5 years.

Treatment with atorvastatin decreased LDL cholesterol levels to a similar degree across the three study groups, and lowered triglycerides by 11% in the group with diabetes, 20% in the group with metabolic syndrome, and 9% in the reference group.

Despite these treatment benefits, subjects with diabetes remained at increased risk of recurrent stroke (hazard ratio, 1.62), of major cardiovascular events (HR, 1.66), and of revascularization procedures (HR, 2.39), compared with the reference group. Subjects with metabolic syndrome were at increased risk of revascularization procedures (HR, 1.78) but not of other adverse cardiovascular outcomes.

At the conclusion of the study, the rate of recurrent stroke was 18% in patients with diabetes, 11% in those with metabolic syndrome, and 11% in the reference group.

"There was no evidence of a difference in treatment effect" among the three study groups, Dr. Callahan and his associates said (Arch. Neurol. 2011 June 13 [doi:10.1001/archneurol.2011.146]).

"These results should be viewed as exploratory" because the SPARCL trial was not powered to test for subgroup effects, they noted.

However, the findings agree with those of the Cholesterol Treatment Trialists’ collaboration, which also found that the effect of statins on stroke risk was similar between diabetic and nondiabetic patients, the researchers added.

Pfizer sponsored the study. Dr. Callahan reported receiving support from Pfizer, Sanofi-Aventis, and Bristol-Myers Squibb. His associates reported ties to numerous pharmaceutical and device companies.

Publications
Publications
Topics
Article Type
Display Headline
Statin Cuts Recurrent Stroke Risk Similarly in Diabetic, Nondiabetic Patients
Display Headline
Statin Cuts Recurrent Stroke Risk Similarly in Diabetic, Nondiabetic Patients
Legacy Keywords
Statin therapy, recurrent stroke, diabetes, metabolic syndrome, Stroke Prevention by Aggressive Reduction in Cholesterol Levels clinical trial, Dr. Alfred Callahan, Archives of Neurology, atorvastatin, Lipitor
Legacy Keywords
Statin therapy, recurrent stroke, diabetes, metabolic syndrome, Stroke Prevention by Aggressive Reduction in Cholesterol Levels clinical trial, Dr. Alfred Callahan, Archives of Neurology, atorvastatin, Lipitor
Article Source

FROM ARCHIVES OF NEUROLOGY

PURLs Copyright

Inside the Article

Vitals

Major Finding: The rate of recurrent stroke was 18% in patients with type 2 diabetes, 11% in patients with metabolic syndrome, and 11% in patients who had neither disorder.

Data Source: A planned secondary analysis of data from the international Stroke Prevention by Aggressive Reduction in Cholesterol Levels (SPARCL) trial involving 4,731 patients with recent stroke or transient ischemic attack who were followed for a mean of 5 years.

Disclosures: Pfizer sponsored the study. Dr. Callahan reported receiving support from Pfizer, Sanofi-Aventis, and Bristol-Myers Squibb. His associates reported ties to numerous pharmaceutical and device companies.

JAK inhibitor ruxolitinib improves treatment landscape in MF
Article Type
Changed
Display Headline
JAK inhibitor ruxolitinib improves treatment landscape in MF

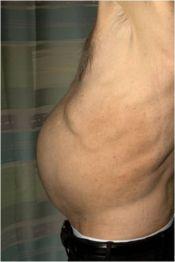
Splenomegaly

CHICAGO—Two phase 3 studies demonstrate the effectiveness of the investigational Janus kinase (JAK) inhibitor INC424 (ruxolitinib) in treating patients with myelofibrosis (MF), according to presentations at the 2011 ASCO Annual Meeting.

Ruxolitinib has the potential to change the treatment landscape in MF, said Alessandro Vannucchi, MD, of the University of Florence, who reported the results of the COMFORT-II trial.

Srdan Verostovsek, MD, PhD, of the MD Anderson Cancer Center, presented results from COMFORT-I.

COMFORT-II

In the COMFORT-II trial, ruxolitinib produced a volumetric spleen size reduction of 35% or greater in 28.5% of MF patients at 48 weeks. None of the patients receiving best available therapy (BAT) experienced such a reduction, Dr Vannucchi said.

At week 24, 31.9% of ruxolitinib-treated patients had a 35% or greater volumetric spleen size reduction, compared to none of the BAT-treated patients. Ruxolitinib also showed a marked improvement in overall quality of life measures, functioning, and symptoms relative to the BAT arm.

This open-label, phase 3 study included 146 patients randomized to ruxolitinib starting at doses of 15 or 20 mg twice daily and 73 patients randomized to BAT, which was administered at doses and schedules determined by the investigator.

Two-thirds of the BAT patients received at least one medication, and one-third received no medication. The most commonly administered agents were hydroxyurea (47% of patients) and glucocorticoids (16% of patients).

All study participants had intermediate-2 or high-risk primary MF, post-polycythemia vera MF, or post-essential thrombocythemia MF.

The safety profile of ruxolitinib was consistent with previous studies, Dr Vannucchi said. The most common grade 3 or higher adverse events in the ruxolitinib arm were anemia and thrombocytopenia. In the BAT arm, the most common events were anemia, thrombocytopenia, pneumonia, and dyspnea.

COMFORT-I

The COMFORT-I trial enrolled 309 patients with intermediate-2 or high-risk primary MF, post-polycythemia vera MF, or post-essential thrombocythemia MF. They were randomly assigned to twice-daily oral ruxolitinib (155 patients) or placebo (154 patients).

Ruxolitinib was dosed at 15 mg or 20 mg, depending on the baseline platelet count. Patients in the placebo arm could cross over to the ruxolitinib arm upon disease progression, and nearly a quarter of patients did cross over (11% prior to week 24 and 13% after week 24).

The median follow-up was 32 weeks. A significantly higher proportion of patients on the ruxolitinib arm (41.9%) attained the primary endpoint of at least a 35% reduction in spleen volume after 24 weeks of therapy compared with placebo patients (0.7%), Dr Verstovsek reported.

Ruxolitinib was also more effective than placebo for improving symptom burden, as 45.9% of patients in the ruxolitinib had at least a 50% improvement in symptom burden, compared to 5.3% of placebo-treated patients.

Symptoms that significantly improved with ruxolitinib included abdominal discomfort, pain under the left ribs, early satiety, night sweats, itching, bone or muscle pain, and inactivity.

“Data from the COMFORT studies indicate that ruxolitinib has the potential to significantly improve the current treatment landscape for most patients with MF,” Dr Vannucchi said.

Publications
Topics

Splenomegaly

CHICAGO—Two phase 3 studies demonstrate the effectiveness of the investigational Janus kinase (JAK) inhibitor INC424 (ruxolitinib) in treating patients with myelofibrosis (MF), according to presentations at the 2011 ASCO Annual Meeting.

Ruxolitinib has the potential to change the treatment landscape in MF, said Alessandro Vannucchi, MD, of the University of Florence, who reported the results of the COMFORT-II trial.

Srdan Verostovsek, MD, PhD, of the MD Anderson Cancer Center, presented results from COMFORT-I.

COMFORT-II

In the COMFORT-II trial, ruxolitinib produced a volumetric spleen size reduction of 35% or greater in 28.5% of MF patients at 48 weeks. None of the patients receiving best available therapy (BAT) experienced such a reduction, Dr Vannucchi said.

At week 24, 31.9% of ruxolitinib-treated patients had a 35% or greater volumetric spleen size reduction, compared to none of the BAT-treated patients. Ruxolitinib also showed a marked improvement in overall quality of life measures, functioning, and symptoms relative to the BAT arm.

This open-label, phase 3 study included 146 patients randomized to ruxolitinib starting at doses of 15 or 20 mg twice daily and 73 patients randomized to BAT, which was administered at doses and schedules determined by the investigator.

Two-thirds of the BAT patients received at least one medication, and one-third received no medication. The most commonly administered agents were hydroxyurea (47% of patients) and glucocorticoids (16% of patients).

All study participants had intermediate-2 or high-risk primary MF, post-polycythemia vera MF, or post-essential thrombocythemia MF.

The safety profile of ruxolitinib was consistent with previous studies, Dr Vannucchi said. The most common grade 3 or higher adverse events in the ruxolitinib arm were anemia and thrombocytopenia. In the BAT arm, the most common events were anemia, thrombocytopenia, pneumonia, and dyspnea.

COMFORT-I

The COMFORT-I trial enrolled 309 patients with intermediate-2 or high-risk primary MF, post-polycythemia vera MF, or post-essential thrombocythemia MF. They were randomly assigned to twice-daily oral ruxolitinib (155 patients) or placebo (154 patients).

Ruxolitinib was dosed at 15 mg or 20 mg, depending on the baseline platelet count. Patients in the placebo arm could cross over to the ruxolitinib arm upon disease progression, and nearly a quarter of patients did cross over (11% prior to week 24 and 13% after week 24).

The median follow-up was 32 weeks. A significantly higher proportion of patients on the ruxolitinib arm (41.9%) attained the primary endpoint of at least a 35% reduction in spleen volume after 24 weeks of therapy compared with placebo patients (0.7%), Dr Verstovsek reported.

Ruxolitinib was also more effective than placebo for improving symptom burden, as 45.9% of patients in the ruxolitinib had at least a 50% improvement in symptom burden, compared to 5.3% of placebo-treated patients.

Symptoms that significantly improved with ruxolitinib included abdominal discomfort, pain under the left ribs, early satiety, night sweats, itching, bone or muscle pain, and inactivity.

“Data from the COMFORT studies indicate that ruxolitinib has the potential to significantly improve the current treatment landscape for most patients with MF,” Dr Vannucchi said.

Splenomegaly

CHICAGO—Two phase 3 studies demonstrate the effectiveness of the investigational Janus kinase (JAK) inhibitor INC424 (ruxolitinib) in treating patients with myelofibrosis (MF), according to presentations at the 2011 ASCO Annual Meeting.

Ruxolitinib has the potential to change the treatment landscape in MF, said Alessandro Vannucchi, MD, of the University of Florence, who reported the results of the COMFORT-II trial.

Srdan Verostovsek, MD, PhD, of the MD Anderson Cancer Center, presented results from COMFORT-I.

COMFORT-II

In the COMFORT-II trial, ruxolitinib produced a volumetric spleen size reduction of 35% or greater in 28.5% of MF patients at 48 weeks. None of the patients receiving best available therapy (BAT) experienced such a reduction, Dr Vannucchi said.

At week 24, 31.9% of ruxolitinib-treated patients had a 35% or greater volumetric spleen size reduction, compared to none of the BAT-treated patients. Ruxolitinib also showed a marked improvement in overall quality of life measures, functioning, and symptoms relative to the BAT arm.

This open-label, phase 3 study included 146 patients randomized to ruxolitinib starting at doses of 15 or 20 mg twice daily and 73 patients randomized to BAT, which was administered at doses and schedules determined by the investigator.

Two-thirds of the BAT patients received at least one medication, and one-third received no medication. The most commonly administered agents were hydroxyurea (47% of patients) and glucocorticoids (16% of patients).

All study participants had intermediate-2 or high-risk primary MF, post-polycythemia vera MF, or post-essential thrombocythemia MF.

The safety profile of ruxolitinib was consistent with previous studies, Dr Vannucchi said. The most common grade 3 or higher adverse events in the ruxolitinib arm were anemia and thrombocytopenia. In the BAT arm, the most common events were anemia, thrombocytopenia, pneumonia, and dyspnea.

COMFORT-I

The COMFORT-I trial enrolled 309 patients with intermediate-2 or high-risk primary MF, post-polycythemia vera MF, or post-essential thrombocythemia MF. They were randomly assigned to twice-daily oral ruxolitinib (155 patients) or placebo (154 patients).

Ruxolitinib was dosed at 15 mg or 20 mg, depending on the baseline platelet count. Patients in the placebo arm could cross over to the ruxolitinib arm upon disease progression, and nearly a quarter of patients did cross over (11% prior to week 24 and 13% after week 24).

The median follow-up was 32 weeks. A significantly higher proportion of patients on the ruxolitinib arm (41.9%) attained the primary endpoint of at least a 35% reduction in spleen volume after 24 weeks of therapy compared with placebo patients (0.7%), Dr Verstovsek reported.

Ruxolitinib was also more effective than placebo for improving symptom burden, as 45.9% of patients in the ruxolitinib had at least a 50% improvement in symptom burden, compared to 5.3% of placebo-treated patients.

Symptoms that significantly improved with ruxolitinib included abdominal discomfort, pain under the left ribs, early satiety, night sweats, itching, bone or muscle pain, and inactivity.

“Data from the COMFORT studies indicate that ruxolitinib has the potential to significantly improve the current treatment landscape for most patients with MF,” Dr Vannucchi said.

Publications
Publications
Topics
Article Type
Display Headline
JAK inhibitor ruxolitinib improves treatment landscape in MF
Display Headline
JAK inhibitor ruxolitinib improves treatment landscape in MF
Disallow All Ads
Content Gating
No Gating (article Unlocked/Free)
Alternative CME
Disqus Comments
Default
Use ProPublica

ONLINE EXCLUSIVE: Listen to experts discuss new anticoagulants

Article Type
Changed
Display Headline
ONLINE EXCLUSIVE: Listen to experts discuss new anticoagulants

Click here to listen to Dr. Merli


Audio / Podcast
Issue
The Hospitalist - 2011(06)
Publications
Sections
Audio / Podcast
Audio / Podcast

Click here to listen to Dr. Merli


Click here to listen to Dr. Merli


Issue
The Hospitalist - 2011(06)
Issue
The Hospitalist - 2011(06)
Publications
Publications
Article Type
Display Headline
ONLINE EXCLUSIVE: Listen to experts discuss new anticoagulants
Display Headline
ONLINE EXCLUSIVE: Listen to experts discuss new anticoagulants
Sections
Disallow All Ads
Content Gating
No Gating (article Unlocked/Free)

Treatment of Diabetes in Emergency Dept.

Article Type
Changed
Display Headline
Treatment of inpatient hyperglycemia beginning in the emergency department: A randomized trial using insulins aspart and detemir compared with usual care

Current consensus guidelines from the American Diabetes Association and the American Association of Clinical Endocrinologists recommend the use of insulin‐based treatment protocols for most hospitalized patients with hyperglycemia.1 For noncritically ill patients, it is recommended to target a fasting blood glucose (BG) < 140 mg/dL and a random BG < 180‐200 mg/dL, without excess hypoglycemia. Prior studies recommended using a basal‐bolus insulin protocol that specifies starting doses and parameters for dose adjustment, applied by well‐educated teams of physicians and nurses.27 We have shown that insulin detemir given as a once‐daily basal injection coupled with rapid‐acting insulin aspart with meals is an effective regimen for managing hyperglycemia in hospitalized patients with type 2 diabetes.7 We and others have shown that once‐daily basal insulin mealtime rapid‐acting insulin is significantly more effective than sliding‐scale regular insulin in the hospital setting.6, 8

The majority of patients admitted to general medical units are first evaluated in the emergency department (ED), and significant hyperglycemia is not uncommon in ED patients. However, protocols for the treatment of hyperglycemia in the ED have not been widely implemented. Ginde et al studied 160 ED patients with a history of diabetes and BG > 200 mg/dL and found that although 73% were admitted to the hospital, only 31% were treated with insulin, and only 18% had a diagnosis of diabetes charted.9 A recent survey of 152 residents and attendings in 3 academic EDs found that only 32% would give insulin for a BG > 200 mg/dL, 59% for a BG > 250 mg/dL, and 91% for a BG > 300 mg/dL to ED patients with known diabetes.10 We completed a preliminary study of a novel protocol for the administration of subcutaneous insulin aspart in the ED at Rush University in 2008.11 We found that the mean BG was significantly lowered during an ED stay, from 333 to 158 mg/dL, and that the protocol was easily adopted by ED staff, with a low rate of hypoglycemia. Historically, only 35% of hyperglycemic patients with diabetes received insulin in our ED.11 Reasons for limited ED management of hyperglycemia may include presence of more critical issues, time and resource restriction, unfamiliarity with glycemic targets, and concerns regarding hypoglycemia.9, 10

In the current study we focused on 3 questions:

  • Could we further reduce the risk of hypoglycemia by modifying our original Rush ED insulin protocol? We reduced insulin aspart from 0.1 to 0.05 units/kg for BG 200‐299 mg/dL, from 0.15 to 0.1 units/kg for BG 300‐399 mg/dL, and from 0.2 to 0.15 units/kg for BG 400 mg/dL.

  • Could we couple our ED insulin aspart protocol with prompt initiation of a detemir‐aspart protocol in those patients who were subsequently admitted to general medical units from the ED?

  • Would the hospital length of stay, mean BG, and incidence of hypoglycemia be improved by the use of 2 back‐to‐back subcutaneous insulin protocols in a randomized clinical trial compared with the usual care provided in the ED and general medical inpatient units?


Research Design and Methods

From May 2008 through June 2009, patients presenting to the Rush University Medical Center ED with a history of type 2 diabetes and an initial point‐of‐care BG 200 mg/dL were randomized to an intervention group (INT) or to a usual care group (UC) after giving informed consent. Inclusion criteria for the study were: ages 18‐80 years, history of type 2 diabetes for at least 3 months, and prior therapy with dietary management, oral agents, or insulin. Patients were excluded if subsequently found to have diabetic ketoacidosis, hyperosmolar nonketotic syndrome, or critical illness requiring intensive care unit admission/direct surgical intervention. Other exclusion criteria included a positive pregnancy test or an inability to give informed consent secondary to acute drug or alcohol intoxication or active mental illness. Patients with clinically significant liver disease, with ALT or AST > 3 times the upper limit of normal, or with a history of end‐stage renal disease requiring dialysis were also excluded because of their increased risk of hypoglycemia, as they have required a more conservative insulin regimen. Similarly, we excluded patients with a history of type 1 diabetes because our aspart algorithm for the ED had only been tested in a type 2 diabetes population, and we did not want to disrupt the insulin regimen of type 1 diabetes patients, usually glargine‐based or an insulin pump.

The study consisted of 2 phases. Patients randomized to INT or UC in phase 1 stayed in their respective groups through phase 2. After informed consent was obtained by the study staff, implementation of the protocol was carried out by the ED staff. ED nurses were trained in the study protocol. During phase 1, INT patients received subcutaneous aspart every 2 hours while in the ED if BG was > 200 mg/dL. Aspart dosing per protocol was limited to 2 doses. Uncommonly, when a third dose of aspart was needed, physician input was requested. Aspart dosing was weight‐ and BG level based (0.05 units/kg for BG 200‐299 mg/dL, 0.1 units/kg for BG 300‐399 mg/dL, or 0.15 units/kg for BG 400mg/dL; see Supporting Appendix Fig. 1). Regardless of BG level, the ED aspart protocol was discontinued on patient discharge home or admission to the hospital. UC patients received treatment for hyperglycemia at the discretion of their ED physicians. INT subjects who required hospital admission were transitioned to basal‐bolus insulin therapy with detemir and aspart, receiving their first dose of detemir in the ED. Detemir dosing was weight‐based (0.3 units/kg) if the patient was not on home insulin or based on the patient's home dose of insulin (same dose for detemir, unit‐for‐unit conversion from glargine to detemir, or 80% of total NPH dose). If a patient received basal insulin prior to arrival, the first dose of detemir was held until 12 hours after the last dose of NPH or until 20 hours after the last dose of glargine or detemir. We found from our preliminary study that inadvertent overlaps in long‐acting insulin were one cause of hypoglycemia. We compared differences between groups in the final ED BG level, frequency of hypoglycemia, and ED length of stay (LOS).

Patients subsequently admitted to the hospital entered phase 2. During phase 2, INT patients had detemir and premeal aspart titrated by study staff using a predefined protocol (see Supporting Appendix Fig. 2). Detemir was given once daily, 24 hours after the initial ED dose. UC patients had their diabetes managed by medical house staff teams. House staff members have been educated on the Rush inpatient insulin protocol on which the INT protocol was based. The Rush inpatient diabetes protocol is implemented via a single computerized order set in which all patients should receive mealtime insulin using aspart and a basal insulin (glargine or detemir or NPH). We compared differences between groups in the mean admission BG level, mean daily BG level, mean BG level before each meal, hospital LOS, and frequency of hypoglycemic events. Moderate hypoglycemia was defined as a BG between 50 and 69 mg/dL, and severe hypoglycemia was defined as a BG < 50 mg/dL. We also compared the frequency of BG < 60 mg/dL.

The Rush University Medical Center institutional review board approved the study. Statistical analysis was done using SPSS version 11.0. The Student t test was used to determine any significant difference in BG means between the INT and UC groups. The Fisher's exact test or the chi‐square test was used to determine any difference in proportions of hypoglycemic events between INT and UC patients.

Results

Phase 1: Emergency Department

A total of 176 patients were randomized: 87 to the INT group and 89 to the UC group. Baseline characteristics were similar between groups (Table 1). Mean initial ED BG was similar: 300 70 mg/dL for INT patients and 307 82 mg/dL for UC patients. During phase 1, all INT patients were treated with aspart every 2 hours if BG > 200 mg/dL until discharge home or admission to the hospital. They received an initial mean insulin dose of 0.08 0.04 units/kg of subscutaneous aspart. Twenty‐five percent of INT patients received a second dose of aspart, and 3% received a third dose. For UC patients, only 55% received insulin therapy. Aspart was used for all UC patients who received insulin. Of those in the UC group who received insulin, 11% received a second dose for persistent hyperglycemia; none received a third dose. The mean initial ED BG for UC patients who received insulin was 358 73 mg/dL, and they received an initial mean dose of 0.11 0.05 units/kg. UC patients who did not receive insulin had a lower mean initial ED BG, 241 35 mg/dL. The mean final ED BG was 217 71 mg/dL for the INT group and 257 89 mg/dL for the UC group (P < .01; Fig. 1). The mean ED LOS was 30 minutes longer in the INT group (P = .06; Table 1). Sixty INT patients (69%) and 61 UC patients (69%) were admitted to the hospital. Fifty‐six percent of INT patients received the first dose of detemir based on their home insulin dose, and 44% received a weight‐based dose per protocol.

Figure 1
Blood glucose trend during ED phase (mean ± SEM).
Patient Characteristics and Biochemical Parameters
 Intervention (n = 87)Usual Care (n = 89)Significance
  • Data are in means standard deviation or percentages.

Age (y)55 1355 13 
Sex (% male)4839 
BMI (kg/m2)34 933 9 
Ethnicity (%)
African American5866 
Hispanic2419
White1511
Other34
Duration of diabetes (y)13 912 10 
HA1C10.4 2.29.8 2.6 
Insulin treatment at home (%)5662 
Presenting complaint/diagnosis (%)
Cardiac2023 
Gastrointestinal3023
Hyperglycemia1318
Infection911
Initial ED blood glucose (mg/dL)300 70307 82 
Final ED blood glucose (mg/dL)217 71256 89P < .01
ED length of stay (h)5.4 1.74.9 1.9P = .06
Patients treated with insulin in ED (%)10054 
Initial dose of SQ aspart (units)7.9 4.29.5 4 
ED patients admitted (%)6969 
Admission blood glucose (mg/dL)184 70224 93P < .01
Treatment of hyperglycemia in hospital (%)
Detemir aspart insulin1007 
Glargine aspart insulin036
NPH aspart insulin034
Oral agents08
None015
Hospital length of stay (days)2.7 2.03.1 1.9P = .58

Phase 2: Inpatient Setting

In phase 2, mean admission BG was significantly lower in the INT group (184 70 mg/dL) than in the UC group (223 93 mg/dL), P < .01, as a result of aspart given in the ED. The day 1 mean fasting BG for INT patients was 148 54 mg/dL, significantly lower than the day 1 mean fasting BG for UC patients: 212 81 mg/dL (P < .01). The mean fasting BG for the entire hospitalization was significantly lower for INT patients, 135 48 mg/dL, than for UC patients, 185 72 mg/dL (P < .01). During phase 2, all INT patients had detemir and aspart titrated daily per protocol. Treatment of UC patients was as follows: 78.5% with insulin, 8.2% with oral agents, and 11.5% did not receive medication for hyperglycemia. Of those in the UC group who received insulin, 36.0% were treated with lantus/aspart or detemir/aspart, 34.4% with NPH/aspart, 6.5% with lantus or detemir alone, and 1.6% with aspart alone. Overall, 76.9% of UC received basal insulin, and 70.4% received nutritional insulin. Only 47% of UC patients had insulin adjusted on a daily basis despite persistent hyperglycemia. Significant differences were also seen between INT and UC patients in mean prelunch and predinner BG levels, but not in mean bedtime BG level (Fig. 2). Mean daily BG levels for the initial 5 days of inpatient stay were significantly lower in the INT group (P < .01), except for day 5, when only 21 patients remained in the study (Fig. 3). Patient‐day weighted mean glucose was 163 39 mg/dL for INT patients versus 202 39 mg/dL for UC patients (P < .01). On admission, day 1 mean insulin total daily dose (TDD) was 0.65 0.26 units/kg for INT patients and 0.52 0.29 units/kg for UC patients. The final mean TDD was 0.75 0.35 units/kg for INT patients and 0.61 0.38 units/kg for UC patients. Mean hospital LOS was 9.6 hours shorter for INT patients (2.7 2 days) than for UC patients (3.1 1.9 days), P = .58.

Figure 2
Blood glucose by time of day (mean ± SEM).
Figure 3
Blood glucose by hospital day (mean ± SEM).

Patient Safety: Frequency of Hypoglycemia

The frequency of hypoglycemia is shown in Table 2. During the ED phase, 3 UC patients (3.4%) had a BG < 50 mg/dL, and 2 INT patients (2.3%) had a BG of 67 mg/dL.

Frequency of Hypoglycemia
Blood GlucoseEmergency Department (Number of Episodes)SignificanceInpatient Phase (Patient Stays)Significance
Usual CareInterventionUsual CareIntervention
< 50 mg/dL30P = .5061P = .11
< 60 mg/dL30P = .5078P = .98
5069 mg/dL02P = .23612P = .20

During the hospital phase, INT patients had 4.3% of patient‐days and UC had 4.5% of patient‐days with any BG < 70 mg/dL. During 12 patient‐stays (20%) in the INT group there was an episode of moderate hypoglycemia, and during 1 patient‐stay (1.7%) there was an episode of severe hypoglycemia. During 6 patient‐stays (9.8%) in the UC group there was an episode of moderate hypoglycemia, and during 6 patient‐stays (9.8%) there was an episode of severe hypoglycemia (Table 2). The odds ratio (OR) for moderate hypoglycemia in the INT group compared with the UC group was 1.93 (95% CI, 0.7‐5.29), but for severe hypoglycemia the OR was 0.15 (95% CI, 0.018‐1.33). Moderate and severe hypoglycemic events in the UC group were split evenly between patients treated with glargine/detemir‐aspart and those treated with NPH‐aspart.

Discussion

This is the first randomized trial comparing the Rush Emergency Department Hyperglycemia Intervention (REDHI) protocol with usual care for the treatment of hyperglycemia in the ED. We believe this may be the first trial to initiate subcutaneous basal insulin therapy in the ED at the time of hospital admission. Initiation of our protocol for type 2 diabetic patients with BG > 200 mg/dL resulted in lower final ED and admission BGs compared with those in the UC group. Although a higher mean initial ED BG of 358 73 mg/dL was required to prompt initiation of insulin therapy for UC patients, 3 experienced severe hypoglycemia. By following the REDHI protocol, ED nurses avoided BG < 50 mg/dL in INT patients. Our first version of the REDHI protocol dosed more insulin than our current version, and we saw excess hypoglycemia.11 With a reduced dosing formula, there was less lowering of BG, but we eliminated all BG < 60 mg/dL. There was a trend toward an increased ED LOS in INT patients compared with UC patients. This may be because of delays in the administration of insulin or the requirement for a final BG check prior to discharge from the ED for INT patients. However, we did not receive feedback from ED nursing that either factor was a significant issue.

During phase 2, we observed improved glycemic control in INT, likely due to two factors: early initiation of basal insulin and protocol driven daily titration of both basal and mealtime insulin. We achieved a mean fasting BG of 148 54 mg/dL in INT the morning after the ED dose of detemir. BG levels in both groups continued to improve each day, but since the admission BG for INT was lower, this group maintained significantly lower BG levels throughout most of the hospitalization. There were also significant differences between groups at different times of day. Basal doses for INT patients were adjusted daily per fasting BG. Scheduled mealtime doses were based on the basal dose; each mealtime aspart dose was a third of the basal detemir dose. Therefore, patients who required larger doses for certain meals may have received less aspart than needed. This may explain why fasting BG control was better than BG control later in the day.

Current Rush guidelines recommend the same insulin doses as those that our intervention used, but patients in the UC group were less likely to have insulin titrated daily. Cook et al found that clinical inertia, or failure of health care providers to initiate or intensify therapy when indicated, is a common problem among medical residents treating inpatients with insulin.15 Reasons for clinical inertia may include unawareness of inpatient glycemic targets, lack of training or confidence in titrating insulin, and concerns regarding hypoglycemia. Our study shows that this is still an operative issue, even after residents have participated in multiple small‐group educational sessions. Details of the Rush inpatient insulin protocol are also on pocket cards distributed to residents. However, fewer than half of UC patients had insulin adjusted appropriately for persistent hyperglycemia. This may be one explanation for the improved control seen in the INT group and underscores the importance of daily dose titrations based on a uniform protocol.

During phase 2, despite improved glycemic control in INT, there was no significant difference in rates of hypoglycemia between the groups. The number of patient‐stays with moderate hypoglycemia was more in the INT group than in the UC group, 12 versus 6, respectively, but not statistically different (P = .20). There was a trend toward fewer patient‐stays with severe hypoglycemia in the INT group than in the UC group, 1 versus 6, respectively (P = .11).

Other studies have described improved inpatient glycemic control without excess hypoglycemia. In the RABBIT 2 trial, institution of a glargine‐glulisine insulin protocol, TTD of 0.4‐5 units/kg, among insulin‐naive inpatients resulted in a mean fasting BG of 147 36 mg/dL and a mean hospital BG of 166 32 mg/dL, with 3% of patient‐stays having a BG < 60 mg/dL.6 In a second trial, detemir‐aspart was compared with NPH‐aspart TTD of 0.4‐5 units/kg.7 Both groups achieved a similar mean fasting BG of 146 mg/dL and a mean hospital BG of 157 mg/dL. However, the rate of hypoglycemia was higher: 29% of patient‐stays overall. In our study, we achieved a mean fasting BG of 135 48 mg/dL and a mean hospital BG of 163 40 mg/dL in the INT group, using a mean initial TTD of 0.65 0.23 units/kg. The frequency of hypoglycemia in this trial, 22% of INT patient‐stays and 20% of UC patient‐stays, was less than that in Umpierrez et al,7 despite a lower mean fasting BG in our current trial. Maynard et al found 16% of patient‐stays and 3% of patient‐days had an episode of BG < 60 mg/dL in a trial of glarginerapid‐acting insulin (0.4‐5 units/kg TTD).12 Schnipper et al found that 6.1% of patient‐days had an episode of BG < 60 mg/dL using either glargine or NPH and a rapid‐acting insulin, TTD 0.6 units/kg.13 Our hypoglycemia rates were higher; however, we defined hypoglycemia as BG < 70 mg/dL, as suggested by the ADA workgroup.14 If we use a cutoff of < 60 mg/dL for hypoglycemia, it occurred in 13.3% of patient‐stays and 4.3% of patient‐days in the INT group, comparable to that in previous studies.

Our study has several limitations. First, this was a single‐center study, and our ED protocol should be tested in other ED settings, both academic and community. Second, although there were trends toward lower rates of severe hypoglycemia in the INT group, the study was underpowered to detect possible significant differences. Third, although ED nurses implemented the study protocol, study staff closely monitored nurses to ensure adherence. Therefore, it is difficult to speculate on protocol adherence under normal circumstances. Successful implementation requires ongoing nursing and medical staff education. A fourth limitation is the absence of patients with type 1 diabetes.

In conclusion we demonstrated that weight‐based subcutaneous aspart insulin therapy begun in the ED, coupled with prompt initiation of a detemir‐aspart insulin protocol, results in rapid correction of hyperglycemia and improved inpatient glycemic control without increasing hypoglycemia. Diabetes is a common comorbidity in patients presenting to the ED that is not uniformly addressed. These patients may present with uncontrolled hyperglycemia or diabetes‐related infections, and prompt, efficacious glucose control is important. The nurse‐driven Rush ED hyperglycemia protocol ensures that hyperglycemia is safely addressed, allowing the ED physician to address more critical issues. By initiating basal insulin in the ED, our protocol allows for a prompt and smooth transition to a basal‐bolus insulin regimen for the inpatient setting.

Files
References
  1. Moghissi ES,Korytkowski MT,DiNardo M, et al.American Association of Clinical Endocrinologists and American Diabetes Association Consensus Statement on Inpatient Glycemic Control.Diabetes Care.2009;32:11191131.
  2. Clement S,Braithwaite SS,Magee MF, et al.Management of diabetes and hyperglycemia in hospitals.Diabetes Care.2004;27:553591.
  3. Baldwin D,Villanueva G.,McNutt R.,Bhatnagar S.Eliminating inpatient sliding scale insulin: a re‐education project with medical house staff.Diabetes Care.2008;28:10081011.
  4. Schmeltz LR,DeSantis AJ,Thiyagarajan V, et al.Reduction of surgical mortality and morbidity in diabetic patients undergoing cardiac surgery with a combined intravenous and subcutaneous insulin glucose management strategy.Diabetes Care.2007;30:823828.
  5. Yeldandi R,Lurie A,Baldwin D.Comparison of once daily glargine insulin with twice‐daily NPH/Regular insulin for control of hyperglycemia in inpatients after cardiovascular surgery.Diabetes Technol Ther.2006;8:609616.
  6. Umpierrez GE,Smiley D,Zisman A, et al.Randomized study of basal‐bolus insulin therapy in the inpatient management of patients with type 2 diabetes (RABBIT 2 trial).Diabetes Care.2007;30:21812186.
  7. Umpierrez GE,Hor T,Smiley D, et al.Comparison of inpatient insulin regimens with detemir plus aspart versus neutral protamine Hagedorn plus regular in medical patients with type 2 diabetes.J Clin Endocrinol Metab.2009;94:564569.
  8. Datta S,Qaadir A,Villanueva G,Baldwin D.Once daily insulin glargine vs. six hourly sliding scale regular insulin for control of hyperglycemia after bariatric surgery: a randomized clinical trial.Endocr Pract.2007;13:225231.
  9. Ginde AA,Savaser DJ,Camargo CA.Limited communication and management of emergency department hyperglycemia in hospitalized patients.J Hosp Med.2009;4:4449.
  10. Ginde AA,Delaney KE,Pallin DJ,Camargo CA.Multicenter survey of emergency physician management and referral for hyperglycemia.J Emerg Med.2010;38:264272.
  11. Munoz C,Villanueva G,Fogg L,Johnson T,Baldwin D.Impact of a nurse‐driven subcutaneous insulin protocol: Rush Emergency Department Hyperglycemia Intervention (REDHI).J Emerg Med.2008 [Epub ahead of print].
  12. Maynard G,Lee J,Phillips G,Fink E,Renvall M.Improved inpatient use of basal insulin, reduced hypoglycemia, and improved glycemic control: effect of structured subcutaneous insulin orders and an insulin management algorithm.J Hosp Med.2009;4:315.
  13. Schnipper JL,Ndumele CD,Liang CL,Pendergrass ML.Effects of a subcutaneous insulin protocol, clinical education, and computerized order set on the quality of inpatient management of hyperglycemia: results of a clinical trial.J Hosp Med.2009;4:1627.
  14. ADA Workgroup on Hypoglycemia.Defining and reporting hypoglycemia in diabetes.Diabetes Care.2005;28:12451249.
  15. Cook CB,Castro JC,Schmidt RE et al.Diabetes care in hospitalized noncritically ill patients: More evidence for clinical inertia and negative therapeutic momentum.J Hosp Med.2007;2:203211.
Article PDF
Issue
Journal of Hospital Medicine - 6(5)
Page Number
279-284
Legacy Keywords
diabetes mellitus, hyperglycemia management, resident education
Sections
Files
Files
Article PDF
Article PDF

Current consensus guidelines from the American Diabetes Association and the American Association of Clinical Endocrinologists recommend the use of insulin‐based treatment protocols for most hospitalized patients with hyperglycemia.1 For noncritically ill patients, it is recommended to target a fasting blood glucose (BG) < 140 mg/dL and a random BG < 180‐200 mg/dL, without excess hypoglycemia. Prior studies recommended using a basal‐bolus insulin protocol that specifies starting doses and parameters for dose adjustment, applied by well‐educated teams of physicians and nurses.27 We have shown that insulin detemir given as a once‐daily basal injection coupled with rapid‐acting insulin aspart with meals is an effective regimen for managing hyperglycemia in hospitalized patients with type 2 diabetes.7 We and others have shown that once‐daily basal insulin mealtime rapid‐acting insulin is significantly more effective than sliding‐scale regular insulin in the hospital setting.6, 8

The majority of patients admitted to general medical units are first evaluated in the emergency department (ED), and significant hyperglycemia is not uncommon in ED patients. However, protocols for the treatment of hyperglycemia in the ED have not been widely implemented. Ginde et al studied 160 ED patients with a history of diabetes and BG > 200 mg/dL and found that although 73% were admitted to the hospital, only 31% were treated with insulin, and only 18% had a diagnosis of diabetes charted.9 A recent survey of 152 residents and attendings in 3 academic EDs found that only 32% would give insulin for a BG > 200 mg/dL, 59% for a BG > 250 mg/dL, and 91% for a BG > 300 mg/dL to ED patients with known diabetes.10 We completed a preliminary study of a novel protocol for the administration of subcutaneous insulin aspart in the ED at Rush University in 2008.11 We found that the mean BG was significantly lowered during an ED stay, from 333 to 158 mg/dL, and that the protocol was easily adopted by ED staff, with a low rate of hypoglycemia. Historically, only 35% of hyperglycemic patients with diabetes received insulin in our ED.11 Reasons for limited ED management of hyperglycemia may include presence of more critical issues, time and resource restriction, unfamiliarity with glycemic targets, and concerns regarding hypoglycemia.9, 10

In the current study we focused on 3 questions:

  • Could we further reduce the risk of hypoglycemia by modifying our original Rush ED insulin protocol? We reduced insulin aspart from 0.1 to 0.05 units/kg for BG 200‐299 mg/dL, from 0.15 to 0.1 units/kg for BG 300‐399 mg/dL, and from 0.2 to 0.15 units/kg for BG 400 mg/dL.

  • Could we couple our ED insulin aspart protocol with prompt initiation of a detemir‐aspart protocol in those patients who were subsequently admitted to general medical units from the ED?

  • Would the hospital length of stay, mean BG, and incidence of hypoglycemia be improved by the use of 2 back‐to‐back subcutaneous insulin protocols in a randomized clinical trial compared with the usual care provided in the ED and general medical inpatient units?


Research Design and Methods

From May 2008 through June 2009, patients presenting to the Rush University Medical Center ED with a history of type 2 diabetes and an initial point‐of‐care BG 200 mg/dL were randomized to an intervention group (INT) or to a usual care group (UC) after giving informed consent. Inclusion criteria for the study were: ages 18‐80 years, history of type 2 diabetes for at least 3 months, and prior therapy with dietary management, oral agents, or insulin. Patients were excluded if subsequently found to have diabetic ketoacidosis, hyperosmolar nonketotic syndrome, or critical illness requiring intensive care unit admission/direct surgical intervention. Other exclusion criteria included a positive pregnancy test or an inability to give informed consent secondary to acute drug or alcohol intoxication or active mental illness. Patients with clinically significant liver disease, with ALT or AST > 3 times the upper limit of normal, or with a history of end‐stage renal disease requiring dialysis were also excluded because of their increased risk of hypoglycemia, as they have required a more conservative insulin regimen. Similarly, we excluded patients with a history of type 1 diabetes because our aspart algorithm for the ED had only been tested in a type 2 diabetes population, and we did not want to disrupt the insulin regimen of type 1 diabetes patients, usually glargine‐based or an insulin pump.

The study consisted of 2 phases. Patients randomized to INT or UC in phase 1 stayed in their respective groups through phase 2. After informed consent was obtained by the study staff, implementation of the protocol was carried out by the ED staff. ED nurses were trained in the study protocol. During phase 1, INT patients received subcutaneous aspart every 2 hours while in the ED if BG was > 200 mg/dL. Aspart dosing per protocol was limited to 2 doses. Uncommonly, when a third dose of aspart was needed, physician input was requested. Aspart dosing was weight‐ and BG level based (0.05 units/kg for BG 200‐299 mg/dL, 0.1 units/kg for BG 300‐399 mg/dL, or 0.15 units/kg for BG 400mg/dL; see Supporting Appendix Fig. 1). Regardless of BG level, the ED aspart protocol was discontinued on patient discharge home or admission to the hospital. UC patients received treatment for hyperglycemia at the discretion of their ED physicians. INT subjects who required hospital admission were transitioned to basal‐bolus insulin therapy with detemir and aspart, receiving their first dose of detemir in the ED. Detemir dosing was weight‐based (0.3 units/kg) if the patient was not on home insulin or based on the patient's home dose of insulin (same dose for detemir, unit‐for‐unit conversion from glargine to detemir, or 80% of total NPH dose). If a patient received basal insulin prior to arrival, the first dose of detemir was held until 12 hours after the last dose of NPH or until 20 hours after the last dose of glargine or detemir. We found from our preliminary study that inadvertent overlaps in long‐acting insulin were one cause of hypoglycemia. We compared differences between groups in the final ED BG level, frequency of hypoglycemia, and ED length of stay (LOS).

Patients subsequently admitted to the hospital entered phase 2. During phase 2, INT patients had detemir and premeal aspart titrated by study staff using a predefined protocol (see Supporting Appendix Fig. 2). Detemir was given once daily, 24 hours after the initial ED dose. UC patients had their diabetes managed by medical house staff teams. House staff members have been educated on the Rush inpatient insulin protocol on which the INT protocol was based. The Rush inpatient diabetes protocol is implemented via a single computerized order set in which all patients should receive mealtime insulin using aspart and a basal insulin (glargine or detemir or NPH). We compared differences between groups in the mean admission BG level, mean daily BG level, mean BG level before each meal, hospital LOS, and frequency of hypoglycemic events. Moderate hypoglycemia was defined as a BG between 50 and 69 mg/dL, and severe hypoglycemia was defined as a BG < 50 mg/dL. We also compared the frequency of BG < 60 mg/dL.

The Rush University Medical Center institutional review board approved the study. Statistical analysis was done using SPSS version 11.0. The Student t test was used to determine any significant difference in BG means between the INT and UC groups. The Fisher's exact test or the chi‐square test was used to determine any difference in proportions of hypoglycemic events between INT and UC patients.

Results

Phase 1: Emergency Department

A total of 176 patients were randomized: 87 to the INT group and 89 to the UC group. Baseline characteristics were similar between groups (Table 1). Mean initial ED BG was similar: 300 70 mg/dL for INT patients and 307 82 mg/dL for UC patients. During phase 1, all INT patients were treated with aspart every 2 hours if BG > 200 mg/dL until discharge home or admission to the hospital. They received an initial mean insulin dose of 0.08 0.04 units/kg of subscutaneous aspart. Twenty‐five percent of INT patients received a second dose of aspart, and 3% received a third dose. For UC patients, only 55% received insulin therapy. Aspart was used for all UC patients who received insulin. Of those in the UC group who received insulin, 11% received a second dose for persistent hyperglycemia; none received a third dose. The mean initial ED BG for UC patients who received insulin was 358 73 mg/dL, and they received an initial mean dose of 0.11 0.05 units/kg. UC patients who did not receive insulin had a lower mean initial ED BG, 241 35 mg/dL. The mean final ED BG was 217 71 mg/dL for the INT group and 257 89 mg/dL for the UC group (P < .01; Fig. 1). The mean ED LOS was 30 minutes longer in the INT group (P = .06; Table 1). Sixty INT patients (69%) and 61 UC patients (69%) were admitted to the hospital. Fifty‐six percent of INT patients received the first dose of detemir based on their home insulin dose, and 44% received a weight‐based dose per protocol.

Figure 1
Blood glucose trend during ED phase (mean ± SEM).
Patient Characteristics and Biochemical Parameters
 Intervention (n = 87)Usual Care (n = 89)Significance
  • Data are in means standard deviation or percentages.

Age (y)55 1355 13 
Sex (% male)4839 
BMI (kg/m2)34 933 9 
Ethnicity (%)
African American5866 
Hispanic2419
White1511
Other34
Duration of diabetes (y)13 912 10 
HA1C10.4 2.29.8 2.6 
Insulin treatment at home (%)5662 
Presenting complaint/diagnosis (%)
Cardiac2023 
Gastrointestinal3023
Hyperglycemia1318
Infection911
Initial ED blood glucose (mg/dL)300 70307 82 
Final ED blood glucose (mg/dL)217 71256 89P < .01
ED length of stay (h)5.4 1.74.9 1.9P = .06
Patients treated with insulin in ED (%)10054 
Initial dose of SQ aspart (units)7.9 4.29.5 4 
ED patients admitted (%)6969 
Admission blood glucose (mg/dL)184 70224 93P < .01
Treatment of hyperglycemia in hospital (%)
Detemir aspart insulin1007 
Glargine aspart insulin036
NPH aspart insulin034
Oral agents08
None015
Hospital length of stay (days)2.7 2.03.1 1.9P = .58

Phase 2: Inpatient Setting

In phase 2, mean admission BG was significantly lower in the INT group (184 70 mg/dL) than in the UC group (223 93 mg/dL), P < .01, as a result of aspart given in the ED. The day 1 mean fasting BG for INT patients was 148 54 mg/dL, significantly lower than the day 1 mean fasting BG for UC patients: 212 81 mg/dL (P < .01). The mean fasting BG for the entire hospitalization was significantly lower for INT patients, 135 48 mg/dL, than for UC patients, 185 72 mg/dL (P < .01). During phase 2, all INT patients had detemir and aspart titrated daily per protocol. Treatment of UC patients was as follows: 78.5% with insulin, 8.2% with oral agents, and 11.5% did not receive medication for hyperglycemia. Of those in the UC group who received insulin, 36.0% were treated with lantus/aspart or detemir/aspart, 34.4% with NPH/aspart, 6.5% with lantus or detemir alone, and 1.6% with aspart alone. Overall, 76.9% of UC received basal insulin, and 70.4% received nutritional insulin. Only 47% of UC patients had insulin adjusted on a daily basis despite persistent hyperglycemia. Significant differences were also seen between INT and UC patients in mean prelunch and predinner BG levels, but not in mean bedtime BG level (Fig. 2). Mean daily BG levels for the initial 5 days of inpatient stay were significantly lower in the INT group (P < .01), except for day 5, when only 21 patients remained in the study (Fig. 3). Patient‐day weighted mean glucose was 163 39 mg/dL for INT patients versus 202 39 mg/dL for UC patients (P < .01). On admission, day 1 mean insulin total daily dose (TDD) was 0.65 0.26 units/kg for INT patients and 0.52 0.29 units/kg for UC patients. The final mean TDD was 0.75 0.35 units/kg for INT patients and 0.61 0.38 units/kg for UC patients. Mean hospital LOS was 9.6 hours shorter for INT patients (2.7 2 days) than for UC patients (3.1 1.9 days), P = .58.

Figure 2
Blood glucose by time of day (mean ± SEM).
Figure 3
Blood glucose by hospital day (mean ± SEM).

Patient Safety: Frequency of Hypoglycemia

The frequency of hypoglycemia is shown in Table 2. During the ED phase, 3 UC patients (3.4%) had a BG < 50 mg/dL, and 2 INT patients (2.3%) had a BG of 67 mg/dL.

Frequency of Hypoglycemia
Blood GlucoseEmergency Department (Number of Episodes)SignificanceInpatient Phase (Patient Stays)Significance
Usual CareInterventionUsual CareIntervention
< 50 mg/dL30P = .5061P = .11
< 60 mg/dL30P = .5078P = .98
5069 mg/dL02P = .23612P = .20

During the hospital phase, INT patients had 4.3% of patient‐days and UC had 4.5% of patient‐days with any BG < 70 mg/dL. During 12 patient‐stays (20%) in the INT group there was an episode of moderate hypoglycemia, and during 1 patient‐stay (1.7%) there was an episode of severe hypoglycemia. During 6 patient‐stays (9.8%) in the UC group there was an episode of moderate hypoglycemia, and during 6 patient‐stays (9.8%) there was an episode of severe hypoglycemia (Table 2). The odds ratio (OR) for moderate hypoglycemia in the INT group compared with the UC group was 1.93 (95% CI, 0.7‐5.29), but for severe hypoglycemia the OR was 0.15 (95% CI, 0.018‐1.33). Moderate and severe hypoglycemic events in the UC group were split evenly between patients treated with glargine/detemir‐aspart and those treated with NPH‐aspart.

Discussion

This is the first randomized trial comparing the Rush Emergency Department Hyperglycemia Intervention (REDHI) protocol with usual care for the treatment of hyperglycemia in the ED. We believe this may be the first trial to initiate subcutaneous basal insulin therapy in the ED at the time of hospital admission. Initiation of our protocol for type 2 diabetic patients with BG > 200 mg/dL resulted in lower final ED and admission BGs compared with those in the UC group. Although a higher mean initial ED BG of 358 73 mg/dL was required to prompt initiation of insulin therapy for UC patients, 3 experienced severe hypoglycemia. By following the REDHI protocol, ED nurses avoided BG < 50 mg/dL in INT patients. Our first version of the REDHI protocol dosed more insulin than our current version, and we saw excess hypoglycemia.11 With a reduced dosing formula, there was less lowering of BG, but we eliminated all BG < 60 mg/dL. There was a trend toward an increased ED LOS in INT patients compared with UC patients. This may be because of delays in the administration of insulin or the requirement for a final BG check prior to discharge from the ED for INT patients. However, we did not receive feedback from ED nursing that either factor was a significant issue.

During phase 2, we observed improved glycemic control in INT, likely due to two factors: early initiation of basal insulin and protocol driven daily titration of both basal and mealtime insulin. We achieved a mean fasting BG of 148 54 mg/dL in INT the morning after the ED dose of detemir. BG levels in both groups continued to improve each day, but since the admission BG for INT was lower, this group maintained significantly lower BG levels throughout most of the hospitalization. There were also significant differences between groups at different times of day. Basal doses for INT patients were adjusted daily per fasting BG. Scheduled mealtime doses were based on the basal dose; each mealtime aspart dose was a third of the basal detemir dose. Therefore, patients who required larger doses for certain meals may have received less aspart than needed. This may explain why fasting BG control was better than BG control later in the day.

Current Rush guidelines recommend the same insulin doses as those that our intervention used, but patients in the UC group were less likely to have insulin titrated daily. Cook et al found that clinical inertia, or failure of health care providers to initiate or intensify therapy when indicated, is a common problem among medical residents treating inpatients with insulin.15 Reasons for clinical inertia may include unawareness of inpatient glycemic targets, lack of training or confidence in titrating insulin, and concerns regarding hypoglycemia. Our study shows that this is still an operative issue, even after residents have participated in multiple small‐group educational sessions. Details of the Rush inpatient insulin protocol are also on pocket cards distributed to residents. However, fewer than half of UC patients had insulin adjusted appropriately for persistent hyperglycemia. This may be one explanation for the improved control seen in the INT group and underscores the importance of daily dose titrations based on a uniform protocol.

During phase 2, despite improved glycemic control in INT, there was no significant difference in rates of hypoglycemia between the groups. The number of patient‐stays with moderate hypoglycemia was more in the INT group than in the UC group, 12 versus 6, respectively, but not statistically different (P = .20). There was a trend toward fewer patient‐stays with severe hypoglycemia in the INT group than in the UC group, 1 versus 6, respectively (P = .11).

Other studies have described improved inpatient glycemic control without excess hypoglycemia. In the RABBIT 2 trial, institution of a glargine‐glulisine insulin protocol, TTD of 0.4‐5 units/kg, among insulin‐naive inpatients resulted in a mean fasting BG of 147 36 mg/dL and a mean hospital BG of 166 32 mg/dL, with 3% of patient‐stays having a BG < 60 mg/dL.6 In a second trial, detemir‐aspart was compared with NPH‐aspart TTD of 0.4‐5 units/kg.7 Both groups achieved a similar mean fasting BG of 146 mg/dL and a mean hospital BG of 157 mg/dL. However, the rate of hypoglycemia was higher: 29% of patient‐stays overall. In our study, we achieved a mean fasting BG of 135 48 mg/dL and a mean hospital BG of 163 40 mg/dL in the INT group, using a mean initial TTD of 0.65 0.23 units/kg. The frequency of hypoglycemia in this trial, 22% of INT patient‐stays and 20% of UC patient‐stays, was less than that in Umpierrez et al,7 despite a lower mean fasting BG in our current trial. Maynard et al found 16% of patient‐stays and 3% of patient‐days had an episode of BG < 60 mg/dL in a trial of glarginerapid‐acting insulin (0.4‐5 units/kg TTD).12 Schnipper et al found that 6.1% of patient‐days had an episode of BG < 60 mg/dL using either glargine or NPH and a rapid‐acting insulin, TTD 0.6 units/kg.13 Our hypoglycemia rates were higher; however, we defined hypoglycemia as BG < 70 mg/dL, as suggested by the ADA workgroup.14 If we use a cutoff of < 60 mg/dL for hypoglycemia, it occurred in 13.3% of patient‐stays and 4.3% of patient‐days in the INT group, comparable to that in previous studies.

Our study has several limitations. First, this was a single‐center study, and our ED protocol should be tested in other ED settings, both academic and community. Second, although there were trends toward lower rates of severe hypoglycemia in the INT group, the study was underpowered to detect possible significant differences. Third, although ED nurses implemented the study protocol, study staff closely monitored nurses to ensure adherence. Therefore, it is difficult to speculate on protocol adherence under normal circumstances. Successful implementation requires ongoing nursing and medical staff education. A fourth limitation is the absence of patients with type 1 diabetes.

In conclusion we demonstrated that weight‐based subcutaneous aspart insulin therapy begun in the ED, coupled with prompt initiation of a detemir‐aspart insulin protocol, results in rapid correction of hyperglycemia and improved inpatient glycemic control without increasing hypoglycemia. Diabetes is a common comorbidity in patients presenting to the ED that is not uniformly addressed. These patients may present with uncontrolled hyperglycemia or diabetes‐related infections, and prompt, efficacious glucose control is important. The nurse‐driven Rush ED hyperglycemia protocol ensures that hyperglycemia is safely addressed, allowing the ED physician to address more critical issues. By initiating basal insulin in the ED, our protocol allows for a prompt and smooth transition to a basal‐bolus insulin regimen for the inpatient setting.

Current consensus guidelines from the American Diabetes Association and the American Association of Clinical Endocrinologists recommend the use of insulin‐based treatment protocols for most hospitalized patients with hyperglycemia.1 For noncritically ill patients, it is recommended to target a fasting blood glucose (BG) < 140 mg/dL and a random BG < 180‐200 mg/dL, without excess hypoglycemia. Prior studies recommended using a basal‐bolus insulin protocol that specifies starting doses and parameters for dose adjustment, applied by well‐educated teams of physicians and nurses.27 We have shown that insulin detemir given as a once‐daily basal injection coupled with rapid‐acting insulin aspart with meals is an effective regimen for managing hyperglycemia in hospitalized patients with type 2 diabetes.7 We and others have shown that once‐daily basal insulin mealtime rapid‐acting insulin is significantly more effective than sliding‐scale regular insulin in the hospital setting.6, 8

The majority of patients admitted to general medical units are first evaluated in the emergency department (ED), and significant hyperglycemia is not uncommon in ED patients. However, protocols for the treatment of hyperglycemia in the ED have not been widely implemented. Ginde et al studied 160 ED patients with a history of diabetes and BG > 200 mg/dL and found that although 73% were admitted to the hospital, only 31% were treated with insulin, and only 18% had a diagnosis of diabetes charted.9 A recent survey of 152 residents and attendings in 3 academic EDs found that only 32% would give insulin for a BG > 200 mg/dL, 59% for a BG > 250 mg/dL, and 91% for a BG > 300 mg/dL to ED patients with known diabetes.10 We completed a preliminary study of a novel protocol for the administration of subcutaneous insulin aspart in the ED at Rush University in 2008.11 We found that the mean BG was significantly lowered during an ED stay, from 333 to 158 mg/dL, and that the protocol was easily adopted by ED staff, with a low rate of hypoglycemia. Historically, only 35% of hyperglycemic patients with diabetes received insulin in our ED.11 Reasons for limited ED management of hyperglycemia may include presence of more critical issues, time and resource restriction, unfamiliarity with glycemic targets, and concerns regarding hypoglycemia.9, 10

In the current study we focused on 3 questions:

  • Could we further reduce the risk of hypoglycemia by modifying our original Rush ED insulin protocol? We reduced insulin aspart from 0.1 to 0.05 units/kg for BG 200‐299 mg/dL, from 0.15 to 0.1 units/kg for BG 300‐399 mg/dL, and from 0.2 to 0.15 units/kg for BG 400 mg/dL.

  • Could we couple our ED insulin aspart protocol with prompt initiation of a detemir‐aspart protocol in those patients who were subsequently admitted to general medical units from the ED?

  • Would the hospital length of stay, mean BG, and incidence of hypoglycemia be improved by the use of 2 back‐to‐back subcutaneous insulin protocols in a randomized clinical trial compared with the usual care provided in the ED and general medical inpatient units?


Research Design and Methods

From May 2008 through June 2009, patients presenting to the Rush University Medical Center ED with a history of type 2 diabetes and an initial point‐of‐care BG 200 mg/dL were randomized to an intervention group (INT) or to a usual care group (UC) after giving informed consent. Inclusion criteria for the study were: ages 18‐80 years, history of type 2 diabetes for at least 3 months, and prior therapy with dietary management, oral agents, or insulin. Patients were excluded if subsequently found to have diabetic ketoacidosis, hyperosmolar nonketotic syndrome, or critical illness requiring intensive care unit admission/direct surgical intervention. Other exclusion criteria included a positive pregnancy test or an inability to give informed consent secondary to acute drug or alcohol intoxication or active mental illness. Patients with clinically significant liver disease, with ALT or AST > 3 times the upper limit of normal, or with a history of end‐stage renal disease requiring dialysis were also excluded because of their increased risk of hypoglycemia, as they have required a more conservative insulin regimen. Similarly, we excluded patients with a history of type 1 diabetes because our aspart algorithm for the ED had only been tested in a type 2 diabetes population, and we did not want to disrupt the insulin regimen of type 1 diabetes patients, usually glargine‐based or an insulin pump.

The study consisted of 2 phases. Patients randomized to INT or UC in phase 1 stayed in their respective groups through phase 2. After informed consent was obtained by the study staff, implementation of the protocol was carried out by the ED staff. ED nurses were trained in the study protocol. During phase 1, INT patients received subcutaneous aspart every 2 hours while in the ED if BG was > 200 mg/dL. Aspart dosing per protocol was limited to 2 doses. Uncommonly, when a third dose of aspart was needed, physician input was requested. Aspart dosing was weight‐ and BG level based (0.05 units/kg for BG 200‐299 mg/dL, 0.1 units/kg for BG 300‐399 mg/dL, or 0.15 units/kg for BG 400mg/dL; see Supporting Appendix Fig. 1). Regardless of BG level, the ED aspart protocol was discontinued on patient discharge home or admission to the hospital. UC patients received treatment for hyperglycemia at the discretion of their ED physicians. INT subjects who required hospital admission were transitioned to basal‐bolus insulin therapy with detemir and aspart, receiving their first dose of detemir in the ED. Detemir dosing was weight‐based (0.3 units/kg) if the patient was not on home insulin or based on the patient's home dose of insulin (same dose for detemir, unit‐for‐unit conversion from glargine to detemir, or 80% of total NPH dose). If a patient received basal insulin prior to arrival, the first dose of detemir was held until 12 hours after the last dose of NPH or until 20 hours after the last dose of glargine or detemir. We found from our preliminary study that inadvertent overlaps in long‐acting insulin were one cause of hypoglycemia. We compared differences between groups in the final ED BG level, frequency of hypoglycemia, and ED length of stay (LOS).

Patients subsequently admitted to the hospital entered phase 2. During phase 2, INT patients had detemir and premeal aspart titrated by study staff using a predefined protocol (see Supporting Appendix Fig. 2). Detemir was given once daily, 24 hours after the initial ED dose. UC patients had their diabetes managed by medical house staff teams. House staff members have been educated on the Rush inpatient insulin protocol on which the INT protocol was based. The Rush inpatient diabetes protocol is implemented via a single computerized order set in which all patients should receive mealtime insulin using aspart and a basal insulin (glargine or detemir or NPH). We compared differences between groups in the mean admission BG level, mean daily BG level, mean BG level before each meal, hospital LOS, and frequency of hypoglycemic events. Moderate hypoglycemia was defined as a BG between 50 and 69 mg/dL, and severe hypoglycemia was defined as a BG < 50 mg/dL. We also compared the frequency of BG < 60 mg/dL.

The Rush University Medical Center institutional review board approved the study. Statistical analysis was done using SPSS version 11.0. The Student t test was used to determine any significant difference in BG means between the INT and UC groups. The Fisher's exact test or the chi‐square test was used to determine any difference in proportions of hypoglycemic events between INT and UC patients.

Results

Phase 1: Emergency Department

A total of 176 patients were randomized: 87 to the INT group and 89 to the UC group. Baseline characteristics were similar between groups (Table 1). Mean initial ED BG was similar: 300 70 mg/dL for INT patients and 307 82 mg/dL for UC patients. During phase 1, all INT patients were treated with aspart every 2 hours if BG > 200 mg/dL until discharge home or admission to the hospital. They received an initial mean insulin dose of 0.08 0.04 units/kg of subscutaneous aspart. Twenty‐five percent of INT patients received a second dose of aspart, and 3% received a third dose. For UC patients, only 55% received insulin therapy. Aspart was used for all UC patients who received insulin. Of those in the UC group who received insulin, 11% received a second dose for persistent hyperglycemia; none received a third dose. The mean initial ED BG for UC patients who received insulin was 358 73 mg/dL, and they received an initial mean dose of 0.11 0.05 units/kg. UC patients who did not receive insulin had a lower mean initial ED BG, 241 35 mg/dL. The mean final ED BG was 217 71 mg/dL for the INT group and 257 89 mg/dL for the UC group (P < .01; Fig. 1). The mean ED LOS was 30 minutes longer in the INT group (P = .06; Table 1). Sixty INT patients (69%) and 61 UC patients (69%) were admitted to the hospital. Fifty‐six percent of INT patients received the first dose of detemir based on their home insulin dose, and 44% received a weight‐based dose per protocol.

Figure 1
Blood glucose trend during ED phase (mean ± SEM).
Patient Characteristics and Biochemical Parameters
 Intervention (n = 87)Usual Care (n = 89)Significance
  • Data are in means standard deviation or percentages.

Age (y)55 1355 13 
Sex (% male)4839 
BMI (kg/m2)34 933 9 
Ethnicity (%)
African American5866 
Hispanic2419
White1511
Other34
Duration of diabetes (y)13 912 10 
HA1C10.4 2.29.8 2.6 
Insulin treatment at home (%)5662 
Presenting complaint/diagnosis (%)
Cardiac2023 
Gastrointestinal3023
Hyperglycemia1318
Infection911
Initial ED blood glucose (mg/dL)300 70307 82 
Final ED blood glucose (mg/dL)217 71256 89P < .01
ED length of stay (h)5.4 1.74.9 1.9P = .06
Patients treated with insulin in ED (%)10054 
Initial dose of SQ aspart (units)7.9 4.29.5 4 
ED patients admitted (%)6969 
Admission blood glucose (mg/dL)184 70224 93P < .01
Treatment of hyperglycemia in hospital (%)
Detemir aspart insulin1007 
Glargine aspart insulin036
NPH aspart insulin034
Oral agents08
None015
Hospital length of stay (days)2.7 2.03.1 1.9P = .58

Phase 2: Inpatient Setting

In phase 2, mean admission BG was significantly lower in the INT group (184 70 mg/dL) than in the UC group (223 93 mg/dL), P < .01, as a result of aspart given in the ED. The day 1 mean fasting BG for INT patients was 148 54 mg/dL, significantly lower than the day 1 mean fasting BG for UC patients: 212 81 mg/dL (P < .01). The mean fasting BG for the entire hospitalization was significantly lower for INT patients, 135 48 mg/dL, than for UC patients, 185 72 mg/dL (P < .01). During phase 2, all INT patients had detemir and aspart titrated daily per protocol. Treatment of UC patients was as follows: 78.5% with insulin, 8.2% with oral agents, and 11.5% did not receive medication for hyperglycemia. Of those in the UC group who received insulin, 36.0% were treated with lantus/aspart or detemir/aspart, 34.4% with NPH/aspart, 6.5% with lantus or detemir alone, and 1.6% with aspart alone. Overall, 76.9% of UC received basal insulin, and 70.4% received nutritional insulin. Only 47% of UC patients had insulin adjusted on a daily basis despite persistent hyperglycemia. Significant differences were also seen between INT and UC patients in mean prelunch and predinner BG levels, but not in mean bedtime BG level (Fig. 2). Mean daily BG levels for the initial 5 days of inpatient stay were significantly lower in the INT group (P < .01), except for day 5, when only 21 patients remained in the study (Fig. 3). Patient‐day weighted mean glucose was 163 39 mg/dL for INT patients versus 202 39 mg/dL for UC patients (P < .01). On admission, day 1 mean insulin total daily dose (TDD) was 0.65 0.26 units/kg for INT patients and 0.52 0.29 units/kg for UC patients. The final mean TDD was 0.75 0.35 units/kg for INT patients and 0.61 0.38 units/kg for UC patients. Mean hospital LOS was 9.6 hours shorter for INT patients (2.7 2 days) than for UC patients (3.1 1.9 days), P = .58.

Figure 2
Blood glucose by time of day (mean ± SEM).
Figure 3
Blood glucose by hospital day (mean ± SEM).

Patient Safety: Frequency of Hypoglycemia

The frequency of hypoglycemia is shown in Table 2. During the ED phase, 3 UC patients (3.4%) had a BG < 50 mg/dL, and 2 INT patients (2.3%) had a BG of 67 mg/dL.

Frequency of Hypoglycemia
Blood GlucoseEmergency Department (Number of Episodes)SignificanceInpatient Phase (Patient Stays)Significance
Usual CareInterventionUsual CareIntervention
< 50 mg/dL30P = .5061P = .11
< 60 mg/dL30P = .5078P = .98
5069 mg/dL02P = .23612P = .20

During the hospital phase, INT patients had 4.3% of patient‐days and UC had 4.5% of patient‐days with any BG < 70 mg/dL. During 12 patient‐stays (20%) in the INT group there was an episode of moderate hypoglycemia, and during 1 patient‐stay (1.7%) there was an episode of severe hypoglycemia. During 6 patient‐stays (9.8%) in the UC group there was an episode of moderate hypoglycemia, and during 6 patient‐stays (9.8%) there was an episode of severe hypoglycemia (Table 2). The odds ratio (OR) for moderate hypoglycemia in the INT group compared with the UC group was 1.93 (95% CI, 0.7‐5.29), but for severe hypoglycemia the OR was 0.15 (95% CI, 0.018‐1.33). Moderate and severe hypoglycemic events in the UC group were split evenly between patients treated with glargine/detemir‐aspart and those treated with NPH‐aspart.

Discussion

This is the first randomized trial comparing the Rush Emergency Department Hyperglycemia Intervention (REDHI) protocol with usual care for the treatment of hyperglycemia in the ED. We believe this may be the first trial to initiate subcutaneous basal insulin therapy in the ED at the time of hospital admission. Initiation of our protocol for type 2 diabetic patients with BG > 200 mg/dL resulted in lower final ED and admission BGs compared with those in the UC group. Although a higher mean initial ED BG of 358 73 mg/dL was required to prompt initiation of insulin therapy for UC patients, 3 experienced severe hypoglycemia. By following the REDHI protocol, ED nurses avoided BG < 50 mg/dL in INT patients. Our first version of the REDHI protocol dosed more insulin than our current version, and we saw excess hypoglycemia.11 With a reduced dosing formula, there was less lowering of BG, but we eliminated all BG < 60 mg/dL. There was a trend toward an increased ED LOS in INT patients compared with UC patients. This may be because of delays in the administration of insulin or the requirement for a final BG check prior to discharge from the ED for INT patients. However, we did not receive feedback from ED nursing that either factor was a significant issue.

During phase 2, we observed improved glycemic control in INT, likely due to two factors: early initiation of basal insulin and protocol driven daily titration of both basal and mealtime insulin. We achieved a mean fasting BG of 148 54 mg/dL in INT the morning after the ED dose of detemir. BG levels in both groups continued to improve each day, but since the admission BG for INT was lower, this group maintained significantly lower BG levels throughout most of the hospitalization. There were also significant differences between groups at different times of day. Basal doses for INT patients were adjusted daily per fasting BG. Scheduled mealtime doses were based on the basal dose; each mealtime aspart dose was a third of the basal detemir dose. Therefore, patients who required larger doses for certain meals may have received less aspart than needed. This may explain why fasting BG control was better than BG control later in the day.

Current Rush guidelines recommend the same insulin doses as those that our intervention used, but patients in the UC group were less likely to have insulin titrated daily. Cook et al found that clinical inertia, or failure of health care providers to initiate or intensify therapy when indicated, is a common problem among medical residents treating inpatients with insulin.15 Reasons for clinical inertia may include unawareness of inpatient glycemic targets, lack of training or confidence in titrating insulin, and concerns regarding hypoglycemia. Our study shows that this is still an operative issue, even after residents have participated in multiple small‐group educational sessions. Details of the Rush inpatient insulin protocol are also on pocket cards distributed to residents. However, fewer than half of UC patients had insulin adjusted appropriately for persistent hyperglycemia. This may be one explanation for the improved control seen in the INT group and underscores the importance of daily dose titrations based on a uniform protocol.

During phase 2, despite improved glycemic control in INT, there was no significant difference in rates of hypoglycemia between the groups. The number of patient‐stays with moderate hypoglycemia was more in the INT group than in the UC group, 12 versus 6, respectively, but not statistically different (P = .20). There was a trend toward fewer patient‐stays with severe hypoglycemia in the INT group than in the UC group, 1 versus 6, respectively (P = .11).

Other studies have described improved inpatient glycemic control without excess hypoglycemia. In the RABBIT 2 trial, institution of a glargine‐glulisine insulin protocol, TTD of 0.4‐5 units/kg, among insulin‐naive inpatients resulted in a mean fasting BG of 147 36 mg/dL and a mean hospital BG of 166 32 mg/dL, with 3% of patient‐stays having a BG < 60 mg/dL.6 In a second trial, detemir‐aspart was compared with NPH‐aspart TTD of 0.4‐5 units/kg.7 Both groups achieved a similar mean fasting BG of 146 mg/dL and a mean hospital BG of 157 mg/dL. However, the rate of hypoglycemia was higher: 29% of patient‐stays overall. In our study, we achieved a mean fasting BG of 135 48 mg/dL and a mean hospital BG of 163 40 mg/dL in the INT group, using a mean initial TTD of 0.65 0.23 units/kg. The frequency of hypoglycemia in this trial, 22% of INT patient‐stays and 20% of UC patient‐stays, was less than that in Umpierrez et al,7 despite a lower mean fasting BG in our current trial. Maynard et al found 16% of patient‐stays and 3% of patient‐days had an episode of BG < 60 mg/dL in a trial of glarginerapid‐acting insulin (0.4‐5 units/kg TTD).12 Schnipper et al found that 6.1% of patient‐days had an episode of BG < 60 mg/dL using either glargine or NPH and a rapid‐acting insulin, TTD 0.6 units/kg.13 Our hypoglycemia rates were higher; however, we defined hypoglycemia as BG < 70 mg/dL, as suggested by the ADA workgroup.14 If we use a cutoff of < 60 mg/dL for hypoglycemia, it occurred in 13.3% of patient‐stays and 4.3% of patient‐days in the INT group, comparable to that in previous studies.

Our study has several limitations. First, this was a single‐center study, and our ED protocol should be tested in other ED settings, both academic and community. Second, although there were trends toward lower rates of severe hypoglycemia in the INT group, the study was underpowered to detect possible significant differences. Third, although ED nurses implemented the study protocol, study staff closely monitored nurses to ensure adherence. Therefore, it is difficult to speculate on protocol adherence under normal circumstances. Successful implementation requires ongoing nursing and medical staff education. A fourth limitation is the absence of patients with type 1 diabetes.

In conclusion we demonstrated that weight‐based subcutaneous aspart insulin therapy begun in the ED, coupled with prompt initiation of a detemir‐aspart insulin protocol, results in rapid correction of hyperglycemia and improved inpatient glycemic control without increasing hypoglycemia. Diabetes is a common comorbidity in patients presenting to the ED that is not uniformly addressed. These patients may present with uncontrolled hyperglycemia or diabetes‐related infections, and prompt, efficacious glucose control is important. The nurse‐driven Rush ED hyperglycemia protocol ensures that hyperglycemia is safely addressed, allowing the ED physician to address more critical issues. By initiating basal insulin in the ED, our protocol allows for a prompt and smooth transition to a basal‐bolus insulin regimen for the inpatient setting.

References
  1. Moghissi ES,Korytkowski MT,DiNardo M, et al.American Association of Clinical Endocrinologists and American Diabetes Association Consensus Statement on Inpatient Glycemic Control.Diabetes Care.2009;32:11191131.
  2. Clement S,Braithwaite SS,Magee MF, et al.Management of diabetes and hyperglycemia in hospitals.Diabetes Care.2004;27:553591.
  3. Baldwin D,Villanueva G.,McNutt R.,Bhatnagar S.Eliminating inpatient sliding scale insulin: a re‐education project with medical house staff.Diabetes Care.2008;28:10081011.
  4. Schmeltz LR,DeSantis AJ,Thiyagarajan V, et al.Reduction of surgical mortality and morbidity in diabetic patients undergoing cardiac surgery with a combined intravenous and subcutaneous insulin glucose management strategy.Diabetes Care.2007;30:823828.
  5. Yeldandi R,Lurie A,Baldwin D.Comparison of once daily glargine insulin with twice‐daily NPH/Regular insulin for control of hyperglycemia in inpatients after cardiovascular surgery.Diabetes Technol Ther.2006;8:609616.
  6. Umpierrez GE,Smiley D,Zisman A, et al.Randomized study of basal‐bolus insulin therapy in the inpatient management of patients with type 2 diabetes (RABBIT 2 trial).Diabetes Care.2007;30:21812186.
  7. Umpierrez GE,Hor T,Smiley D, et al.Comparison of inpatient insulin regimens with detemir plus aspart versus neutral protamine Hagedorn plus regular in medical patients with type 2 diabetes.J Clin Endocrinol Metab.2009;94:564569.
  8. Datta S,Qaadir A,Villanueva G,Baldwin D.Once daily insulin glargine vs. six hourly sliding scale regular insulin for control of hyperglycemia after bariatric surgery: a randomized clinical trial.Endocr Pract.2007;13:225231.
  9. Ginde AA,Savaser DJ,Camargo CA.Limited communication and management of emergency department hyperglycemia in hospitalized patients.J Hosp Med.2009;4:4449.
  10. Ginde AA,Delaney KE,Pallin DJ,Camargo CA.Multicenter survey of emergency physician management and referral for hyperglycemia.J Emerg Med.2010;38:264272.
  11. Munoz C,Villanueva G,Fogg L,Johnson T,Baldwin D.Impact of a nurse‐driven subcutaneous insulin protocol: Rush Emergency Department Hyperglycemia Intervention (REDHI).J Emerg Med.2008 [Epub ahead of print].
  12. Maynard G,Lee J,Phillips G,Fink E,Renvall M.Improved inpatient use of basal insulin, reduced hypoglycemia, and improved glycemic control: effect of structured subcutaneous insulin orders and an insulin management algorithm.J Hosp Med.2009;4:315.
  13. Schnipper JL,Ndumele CD,Liang CL,Pendergrass ML.Effects of a subcutaneous insulin protocol, clinical education, and computerized order set on the quality of inpatient management of hyperglycemia: results of a clinical trial.J Hosp Med.2009;4:1627.
  14. ADA Workgroup on Hypoglycemia.Defining and reporting hypoglycemia in diabetes.Diabetes Care.2005;28:12451249.
  15. Cook CB,Castro JC,Schmidt RE et al.Diabetes care in hospitalized noncritically ill patients: More evidence for clinical inertia and negative therapeutic momentum.J Hosp Med.2007;2:203211.
References
  1. Moghissi ES,Korytkowski MT,DiNardo M, et al.American Association of Clinical Endocrinologists and American Diabetes Association Consensus Statement on Inpatient Glycemic Control.Diabetes Care.2009;32:11191131.
  2. Clement S,Braithwaite SS,Magee MF, et al.Management of diabetes and hyperglycemia in hospitals.Diabetes Care.2004;27:553591.
  3. Baldwin D,Villanueva G.,McNutt R.,Bhatnagar S.Eliminating inpatient sliding scale insulin: a re‐education project with medical house staff.Diabetes Care.2008;28:10081011.
  4. Schmeltz LR,DeSantis AJ,Thiyagarajan V, et al.Reduction of surgical mortality and morbidity in diabetic patients undergoing cardiac surgery with a combined intravenous and subcutaneous insulin glucose management strategy.Diabetes Care.2007;30:823828.
  5. Yeldandi R,Lurie A,Baldwin D.Comparison of once daily glargine insulin with twice‐daily NPH/Regular insulin for control of hyperglycemia in inpatients after cardiovascular surgery.Diabetes Technol Ther.2006;8:609616.
  6. Umpierrez GE,Smiley D,Zisman A, et al.Randomized study of basal‐bolus insulin therapy in the inpatient management of patients with type 2 diabetes (RABBIT 2 trial).Diabetes Care.2007;30:21812186.
  7. Umpierrez GE,Hor T,Smiley D, et al.Comparison of inpatient insulin regimens with detemir plus aspart versus neutral protamine Hagedorn plus regular in medical patients with type 2 diabetes.J Clin Endocrinol Metab.2009;94:564569.
  8. Datta S,Qaadir A,Villanueva G,Baldwin D.Once daily insulin glargine vs. six hourly sliding scale regular insulin for control of hyperglycemia after bariatric surgery: a randomized clinical trial.Endocr Pract.2007;13:225231.
  9. Ginde AA,Savaser DJ,Camargo CA.Limited communication and management of emergency department hyperglycemia in hospitalized patients.J Hosp Med.2009;4:4449.
  10. Ginde AA,Delaney KE,Pallin DJ,Camargo CA.Multicenter survey of emergency physician management and referral for hyperglycemia.J Emerg Med.2010;38:264272.
  11. Munoz C,Villanueva G,Fogg L,Johnson T,Baldwin D.Impact of a nurse‐driven subcutaneous insulin protocol: Rush Emergency Department Hyperglycemia Intervention (REDHI).J Emerg Med.2008 [Epub ahead of print].
  12. Maynard G,Lee J,Phillips G,Fink E,Renvall M.Improved inpatient use of basal insulin, reduced hypoglycemia, and improved glycemic control: effect of structured subcutaneous insulin orders and an insulin management algorithm.J Hosp Med.2009;4:315.
  13. Schnipper JL,Ndumele CD,Liang CL,Pendergrass ML.Effects of a subcutaneous insulin protocol, clinical education, and computerized order set on the quality of inpatient management of hyperglycemia: results of a clinical trial.J Hosp Med.2009;4:1627.
  14. ADA Workgroup on Hypoglycemia.Defining and reporting hypoglycemia in diabetes.Diabetes Care.2005;28:12451249.
  15. Cook CB,Castro JC,Schmidt RE et al.Diabetes care in hospitalized noncritically ill patients: More evidence for clinical inertia and negative therapeutic momentum.J Hosp Med.2007;2:203211.
Issue
Journal of Hospital Medicine - 6(5)
Issue
Journal of Hospital Medicine - 6(5)
Page Number
279-284
Page Number
279-284
Article Type
Display Headline
Treatment of inpatient hyperglycemia beginning in the emergency department: A randomized trial using insulins aspart and detemir compared with usual care
Display Headline
Treatment of inpatient hyperglycemia beginning in the emergency department: A randomized trial using insulins aspart and detemir compared with usual care
Legacy Keywords
diabetes mellitus, hyperglycemia management, resident education
Legacy Keywords
diabetes mellitus, hyperglycemia management, resident education
Sections
Article Source

Copyright © 2010 Society of Hospital Medicine

Disallow All Ads
Correspondence Location
1725 W. Harrison St., Suite 250, Chicago, IL 60612
Content Gating
No Gating (article Unlocked/Free)
Alternative CME
Article PDF Media
Media Files

ECG Score as Embolism Predictor

Article Type
Changed
Display Headline
Electrocardiogram score predicts severity of pulmonary embolism in hemodynamically stable patients

The clinical outcome of patients with pulmonary embolism (PE) has a wide spectrum, ranging from a benign course, with early resolution of symptoms, to death. Prognostic stratification of patients with PE is therefore essential to guide therapy. Currently, this stratification is primarily based on blood pressure on admission. Hemodynamic instability or shock carries a bad prognosis, and is associated with a 3‐fold to 7‐fold increase in mortality.1 Thrombolytic therapy is warranted in these cases.2 There is a subset of patients that, despite normal blood pressure on presentation, can subsequently suffer hemodynamic deterioration and death.3

Echocardiography has been proposed as a useful tool to identify a subset of patients at a higher risk. It has been suggested that the finding of right ventricle dysfunction (RVD) in echocardiography predicts a worse prognosis, even in patients with normal blood pressure on presentation.4 Also, computed tomography pulmonary angiography (CTPA) is increasingly used as the main test to diagnose PE. This technique can also assess the degree of pulmonary arterial obstruction and the presence of signs suggestive of RVD. It has been suggested that CTPA findings can predict outcome in PE.5

Electrocardiography (ECG) has a widespread use and is routinely carried out and interpreted in the emergency room. Some ECG findings in patients with PE are suggestive of right ventricular strain and might therefore be used to prioritize cases that require closer monitoring.6

This study was designed with the objectives of assessing the correlation of standard ECG findings with echocardiography and CTPA signs of RVD, with the anatomic severity of the pulmonary vascular obstruction, and with the degree of hypoxemia, in hemodynamically stable patients with PE. Secondary objectives were determining if ECG could accurately predict RVD, and determining the interobserver agreement for the ECG score.

Patients and Methods

Patients and Study Design

We recently carried out a prospective, descriptive, single‐center follow‐up study to assess the prevalence of RVD and pulmonary hypertension (PH) in PE patients who presented with hemodynamic stability.7 We herein analyze ECG findings in these cases. The present, noninterventional study was approved by our institution's review board. The population studied included consecutive patients presenting with PE to our emergency room. Inclusion criteria were age >18 years and PE confirmed by CTPA. Exclusion criteria were high‐risk PE (presence of 2 consecutive systolic blood pressure measurements <90 mm Hg, measured >15 minutes apart or requiring inotropic support); comorbidity predictive of a 6‐month mortality >50% (eg, metastatic cancer or end‐stage respiratory or heart disease); creatinine clearance <35 mL/minute; or allergy to ionidated contrast media. All the patients gave informed consent to participate in the study.

Protocol

Initial assessment included clinical history, physical examination, ECG, arterial blood gas analysis, echocardiography, CTPA, and lower‐limb venous ultrasonography. All included individuals were treated with anticoagulation, and fibrinolytic therapy was not used.

ECG

A standard 12‐lead ECG was promptly obtained for all patients in the emergency room. We used the scoring system described by Daniel et al.8 (Table 1). This score is based on 4 signs that were previously found to be associated with high‐risk PE: tachycardia, incomplete or complete right bundle branch block, T wave inversion, and S1Q3T3 pattern. Two investigators trained in the interpretation of ECG results scored the ECG independently, and were blinded to patient clinical status and to echocardiography and CTPA findings.

ECG Scoring Method Used in the Study
CharacteristicsScore
  • If present check maximum only.

Tachycardia (>100 beats/min)2
Incomplete right bundle‐branch block2
Complete right bundle‐branch block3
T‐wave inversion in lead V1 through V44
T wave inversion in lead V1*
<1 mm0
12 mm1
>2 mm2
T wave inversion in lead V2*
<1 mm1
12 mm2
>2 mm3
T wave inversion in lead V3*
<1 mm1
12 mm2
>2 mm3
S wave in lead 10
Q wave in lead 31
Inverted T wave in lead 31
If all S1Q3T3, add2
Total score (maximum: 21)

Echocardiography

The study was done as soon as possible after admission using a SONOS 5500 (Hewlett Packard, Palo Alto, CA) ultrasound imaging system with a S4 transducer. In all cases M‐mode, 2‐dimensional, Doppler (continuous and pulsed wave), and color Doppler was performed with the patient in the left lateral position. The structure of the mitral, aortic, tricuspid, and pulmonary valves (different grades of regurgitation and stenosis were assessed), and the systolic and diastolic function of the left ventricle (LV) were systematically assessed.

We assessed if patients had either RVD or isolated PH. Individuals with at least 1 of the following findings were diagnosed as having RVD: right ventricle (RV) hypokinesis (asymmetrical or delayed contraction, usually in the RV base), paradoxical septal systolic motion or right ventricular dilatation (end‐diastolic diameter > 30 mm or right to left ventricular end‐diastolic diameter ratio 1 in the apical 4‐chamber view); PH was defined as pulmonary arterial systolic pressure (PASP) > 40 mm Hg.9 PASP was derived from the right atrioventricular pressure gradient, using peak velocity of tricuspid flow regurgitation with continuous wave Doppler in the apical 4‐chamber view and the modified Bernoulli equation.10 Right atrial pressure was considered equal to 5 mm Hg or 10 mm Hg, according to whether the inferior vena cava collapsed during inspiration, respectively.11

Computed Tomographic Pulmonary Angiography

All CTPAs were performed within 6 hours of patient arrival to the emergency room. Nonionic contrast (100 mL) was administered intravenously at an injection rate of 2.5 mL/second for 40 seconds. Images were obtained on the same single‐detector scanner (Somatron PQ 2000S; Picker International, Cleveland, OH). If possible, scanning was performed during a 32‐second breath hold. If patients were dyspneic, spiral CT angiography was performed during shallow breathing. The scans were obtained using 125 mA and 130 kV. A 5 mm/second table feed was used to scan a 16‐cm volume in the craniocaudal direction (pitch of 1.5). An imaging delay of 20 seconds was used, and overlapping images were reconstructed every 1.5 mm and viewed on films at lung and mediastinal settings.

PE was diagnosed by the on‐duty radiologist if an intraluminal filling defect was seen. For the purpose of the study, the images were reviewed by a senior radiologist. The pulmonary obstruction index was determined according to Qanadli et al.12 The RV to LV diameter ratio was obtained by computing the ratio between the widths of the right and the left ventricular cavities assessed on axial images obtained at the plane of maximal distance between the ventricular endocardial free wall and the interventricular septum, perpendicular to the long axis. A RV/LV ratio > 1 was accepted as suggestive of RV dysfunction. The diameter of the main pulmonary artery (PA) was measured just before the division into its 2 main branches.

Definition of Clinical Endpoints

Primary outcome measures were the prevalence of echocardiography‐assessed RVD or PH at diagnosis, the prevalence of CTPA signs of RVD, the CTPA‐measured severity of the pulmonary vascular obstruction, and the degree of hypoxemia.

Statistical Analysis

Normal distribution of data was assessed using the D'agostino‐Pearson test. Data are shown as mean standard deviation (for normally distributed data) or median (interquartile range) (for non‐normally distributed data). Comparisons between different groups were made using unpaired t test or Wilcoxon rank‐sum test, as appropriate. Correlation between the ECG score and the different variables measured was assessed using Spearman's rank correlation coefficient. Receiver operating characteristic (ROC) curves were constructed to assess the value of ECG score to predict echocardiography or CTPA‐detected RVD. Kappa measurement was performed to examine the interobserver agreement for the ECG score. A 2‐tailed value of P < 0.05 was considered significant.

Results

A total of 103 patients were included in the study (mean age = 69 15 years). One patient died from fatal PE soon after the diagnosis, before echocardiography could be performed. During the 6‐month follow‐up, one patient died from septic shock and another suffered a thromboembolic recurrence (deep vein thrombosis). Echocardiography‐assessed RVD was found in 25 cases (24.5%) and isolated pulmonary hypertension in 20 (19.6%). Median value of the vascular obstruction index was 43.8% (25‐65). Thirty‐three patients (32%) had signs of RVD in CTPA.

Median value of ECG score was 2.5 (1‐6). The level of interobserver agreement regarding ECG score was substantial ( = 0.80). Table 2 shows correlation between ECG score and echocardiography, arterial blood gases, and CTPA parameters. ECG correlated significantly with all the variables measured. Correlation was higher for the vascular obstruction index and the RV/LV ratio, measured with echocardiography. ECG scores were significantly different for groups with varying degrees of severity of PE. Table 3 shows the ECG scores for patients grouped according to different criteria of severity of the disease.

Correlation Between ECG Score and Echocardiography/CTPA Parameters
VariableR (95% CI)P
  • PASP: pulmonary artery systolic pressure; pO2 (A‐a): alveolar‐arterial gradient of oxygen. PA: pulmonary artery. RV/LV: right ventricle to left ventricle. CTPA: computed tomography pulmonary angiography.

Vascular obstruction index0.41 (0.220.57)<0.001
PASP0.31 (0.090.49)0.006
pO2(A‐a)0.29 (0.080.47)0.007
PA diameter0.28 (0.070.47)0.011
RV/LV ratio (echocardiography)0.42 (0.220.57)<0.001
RV/LV ratio (CTPA)0.36 (0.130.56)0.004
ECG Scores for Groups of Patients with Varying Severity of PE According to Different Criteria
CriteriaECG scoreP
  • RVD: right ventricle dysfunction; PH: pulmonary hypertension; CTPA: computed tomography pulmonary angiography; PaO2: arterial oxygen tension; PE: pulmonary embolism. Results are expressed as median [IQR].

RVD (echocardiography) present10 [615]<0.0001
RVD (echocardiography) absent2 [04] 
PH (echocardiography) present6 [1.7512.00]0.029
PH (echocardiography) absent2 [04] 
RVD (CTPA) present6 [311]0.0015
RVD (CTPA) absent2 [13] 
Vascular obstruction score >50%7 [211]0.0005
Vascular obstruction score 50%2 [03] 
PaO2 < 60 mmHg4 [1.252.75]0.015
PaO2 60 mmHg2 [14] 
Bilateral PE5 [111]0.028
Unilateral PE2 [0.754.00] 
Central PE4 [210]0.0011
Peripheral PE2 [03] 

Figure 1 shows the ROC curve for the ECG score and the presence of echocardiography‐detected RVD. Area under the ROC curve was 0.82 (95% confidence interval [CI]: 0.72‐0.89). A cut‐off point of 6 for the ECG score showed the highest accuracy for detecting RVD; sensitivity = 76.5% (95% CI: 50.1‐93.0), specificity = 88.6% (95% CI: 78.7‐94.9), positive likelihood ratio (+LR) = 6.69, negative likelihood ratio (LR) = 0.37. If the ECG score was to be used as a screening method to exclude RVD, a cut‐off point of 0 showed sensitivity = 94.1% (95% CI: 71.2‐99.0), specificity = 27.1% (95% CI: 17.2‐39.1), +LR = 1.29, LR = 0.22. If the ECG score was considered for confirming RVD, the more useful value was 9; sensitivity = 58.8% (95% CI: 33.0‐81.5), specificity = 92.0% (95% CI: 84.1‐97.6), +LR = 8.23, LR = 0.44. Area under the ROC curve to predict CTPA‐detected RVD was slightly lower than for echocardiography: 0.74 (95% CI: 0.61‐0.84).

Figure 1
ROC curve for the ECG score and the presence of echocardiography‐detected RVD.

Discussion

This study shows that a simple, easy‐to‐use ECG scoring system correlates well with the severity of PE, assessed by different methods, in hemodynamically stable patients. Interobserver agreement regarding the scoring system was substantial. Several previous studies have found that ECG signs of RV strain correlate with the presence of RVD.6, 1316 However, some of these studies are limited by a retrospective design that could lead to selection bias or by the inclusion of relatively few (eg, <100) cases.6, 13, 14 Moreover, only a few of these articles have specifically examined patients with normal blood pressure.6, 15 Although our study is still small, one of its strengths is that it prospectively recruited a population of consecutive, normotensive patients and both echocardiography and CTPA were systematically performed. Classifying cases with normal blood pressure by severity is particularly relevant, because of the uncertainty about best treatment when hemodynamic instability is not present. These patients who are not at high risk for PE can be further stratified according to the presence of RVD and/or myocardial injury into intermediate‐risk and low‐risk PE.17 Early hospital discharge or initial outpatient treatment might be considered in low‐risk patients.17, 18 However, echocardiography can be difficult to perform in the emergency setting. Also, the presence of RVD is not easy to predict on clinical grounds. Our study suggests that a standard 12‐lead ECG can be useful to prioritize patients for more exhaustive monitoring or additional risk stratifying tests. An ECG score of 0 would exclude RVD with enough sensitivity to avoid getting an echocardiogram in these cases. On the other hand, a score 9 would suggest the possibility that RVD was present, and an echocardiography ought to be considered in these patients.

Previous studies regarding correlation between ECG and anatomic extension of the pulmonary vascular obstruction in PE have revealed conflicting data. Iles et al. found that ECG score identified those patients with the greatest percentage of perfusion defect on ventilation/perfusion scan.19 However, Kanbay et al. did not find significant differences in ECG scores for patients with pulmonary vascular obstruction scores <50% or 50%, also assessed with ventilation/perfusion scan.20 Subramaniam et al. used CTPA to assess clot burden score, and they did not see a significant association between ECG score and the anatomic severity of PE.21 This study found a significant association between higher ECG score and a more severe vascular obstruction index. This finding might have potential clinical implications, because some reports suggest that a higher CTPA‐measured clot load score can be associated with poorer outcome in PE.22 However, the utility of CTPA scores of vascular obstruction severity as a marker of clinical evolution is controversial, and several other authors have found that these scores are poor predictors of mortality or adverse outcome events.23, 24 Therefore, the positive correlation between ECG and the vascular obstruction index in our study is interesting mainly in the sense that it independently supports the validity of the ECG score as a marker of a potentially more severe PE.

In this study, we have not systematically excluded patients with comorbidities (eg, chronic obstructive pulmonary disease) that could account for RVD or PH. Our intention was to reflect a real‐life clinical scenario. When a patient attends the emergency room with PE, clinical decisions must usually be taken without complete information on comorbidities that may contribute to the existence of RV overload. Also, these subjects have a reduced cardiorespiratory reserve, and the PE might impose an unbearable strain to the RV, so risk stratification is especially important. Therefore, we felt that the study should include all patients presenting with PE, so that the results can be extrapolated to usual clinical practice.

Our results suggest that, by selecting the appropriate cut‐off value, the ECG score can be used with adequate sensitivity and specificity to exclude and confirm, respectively, RVD in hemodynamically stable PE patients. This finding implies that ECG may be useful to design management strategies in these cases, selecting patients that may benefit from further tests.

There are some limitations for the present study. Echocardiography was not immediately performed after the ECG. Thus, we might have missed some patients who presented with transient RVD, which resolved between tests. It is likely that the correlation between ECG and echocardiography would have improved if this delay had been avoided. Also, we did not use a multidetector scanner for performing CTPAs. Consequently, small emboli might have been missed and the clot score might have been underestimated. It is plausible that this may have reduced to some extent the correlation between ECG and CTPA. Also, this a single‐center study, with relatively few patients studied. Finally, due to the low incidence of adverse events in our patients, our study is underpowered to make conclusions about the independent prognostic value of ECG for predicting adverse events.

In conclusion, an easy‐to‐use ECG score correlates significantly with the severity of PE, as assessed with echocardiography, CTPA, and arterial blood gas analysis, in normotensive patients. It can be used to predict with acceptable sensitivity and specificity the presence of RVD in these cases and, accordingly, it has potential value in risk‐stratification strategies. Larger, multicenter studies, should confirm these results before they can be applied to clinical practice.

References
  1. Goldhaber SZ,Visani L,De Rosa M.Acute pulmonary embolism: clinical outcomes in the International Cooperative Pulmonary Embolism Registry (ICOPER).Lancet.1999;353:13861389.
  2. Wan S,Quinlan DJ,Agnelli G,Eikelboom JW.Thrombolysis compared with heparin for the initial treatment of pulmonary embolism. A meta‐analysis of the randomized controlled trials.Circulation.2004;110:744749.
  3. Kasper W,Konstantinides S,Geibel A, et al.Management strategies and determinants of outcome in acute major pulmonary embolism: results of a multicenter registry.J Am Coll Cardiol.1997;30:11651171
  4. Ten Wolde M,Söhne M,Quak E,Mac Gillavry MR,Büller HR.Prognostic value of echocardiographycally assessed right ventricular dysfunction in patients with pulmonary embolism.Arch Intern Med.2004;164:16851689.
  5. Schoepf UJ,Kucher N,Kipfmueller F, et al.Right ventricular enlargement on chest computed tomography. A predictor of early death in acute pulmonary embolism.Circulation.2004;110:32763280.
  6. Punukollu G,Gowda RM,Vasavada BC,Khan IA.Role of electrocardiography in identifying right ventricular dysfunction in acute pulmonary embolism.Am J Cardiol.2005;96:450452.
  7. Golpe R,Pérez‐de‐Llano LA,Castro‐Añón O, et al.Right ventricle dysfunction and pulmonary hypertension in hemodynamically stable pulmonary embolism.Respir Med.2010;104:13701376.
  8. Daniel KR,Courtney M,Kline JA.Assessment of cardiac stress from massive pulmonary embolism with 12‐lead ECG.Chest.2001;120:474481.
  9. McQuillan BM,Picard MH,Leavitt M, et al.Clinical correlates and reference intervals for pulmonary artery systolic pressure among echocardiographically normal subjects.Circulation.2001;104:27972802.
  10. Berger M,Haimowitz A,Van Tosh A, et al.Quantitative assessment of pulmonary hypertension in patients with tricuspid regurgitation using continuous wave Doppler ultrasound.J Am Coll Cardiol.1985;6:359365.
  11. Kircher BJ,Himelman RB,Schiller NB.Noninvasive estimation of right atrial pressure from the inspiratory collapse of the inferior vena cava.Am J Cardiol.1990;66:493496.
  12. Qanadli SD,El Hajjam M,Vieillard‐Baron A, et al.New CT index to quantify arterial obstruction in pulmonary embolism: comparison with angiographic index and echocardiography.AJR Am J Roentgenol.2001;176:14151420.
  13. Toosi MS,Merlino JD,Leeper KV.Electrocardiographic score and short‐term outcomes of acute pulmonary embolism.Am J Cardiol.2007;100:11721176.
  14. Kostrubiec M,Hrynkiewicz A,Pedowska‐Wtoszek J, et al.Is it possible to use standard electrocardiography for risk assessment of patients with pulmonary embolism?Kardiol Pol.2009;67:744750.
  15. Vanni S,Polidori G,Vergara R, et al.Prognostic value of ECG among patients with acute pulmonary embolism and normal blood pressure.Am J Med.2009;122:257264.
  16. Kucher N,Walpoth N,Wustmann K,Noveanu M,Gertsch M.QR in V1‐an ECG sign associated with right ventricular strain and adverse clinical outcome in pulmonary embolism.Eur Heart J.2003;24:11131119.
  17. Torbicki A,Perrier A,Konstantinides S, et al.Guidelines on the diagnosis and management of acute pulmonary embolism. The Task Force for the Diagnosis and Management of Acute Pulmonary Embolism of the European Society of Cardiology (ESC).Eur Heart J.2008;29:22762315.
  18. Konstantinides S.Acute pulmonary embolism.N Eng J Med.2008;359:28042813.
  19. Iles S,Le Heron CJ,Davies G,Turner JG,Beckert LEL.ECG score predicts those with the greatest percentage of perfusion defects due to acute pulmonary thromboembolic disease.Chest.2004;125:16511656.
  20. Kanbay A,Kokturk N,Kaya MG, et al.Electrocardiography and Wells scoring in predicting the anatomic severity of pulmonary embolism.Respir Med.2007;101:11711176.
  21. Subramaniam RM,Mandrekar J,Chang C, et al.Pulmonary embolism outcome: a prospective evaluation of CT pulmonary angiographic clot burden score and ECG score.AJR Am J Roentgenol.2008;190:15991604.
  22. Van der Meer RW,Pattynama PMT,Van Strijen MJL, et al.Right ventricular dysfunction and pulmonary obstruction index at helical CT: prediction of clinical outcome during 3‐month follow‐up in patients with acute pulmonary embolism.Radiology.2005;235:798803.
  23. Ghuysen AE,Ghaye B,Villems V,Dondelinger RF,D'Orio V.Acute PE mortality prediction by analysis of helical computed tomography angiography and hemodynamic evaluation.Thorax.2005;60:956961.
  24. Araoz PA,Gotway MB,Harrington JR,Harmsen WS,Mandrekar JN.Pulmonary embolism: prognostic CT findings.Radiology.2007;242:889893.
Article PDF
Issue
Journal of Hospital Medicine - 6(5)
Page Number
285-289
Legacy Keywords
electrocardiography, pulmonary embolism, right ventricular function, computer tomography, echocardiography
Sections
Article PDF
Article PDF

The clinical outcome of patients with pulmonary embolism (PE) has a wide spectrum, ranging from a benign course, with early resolution of symptoms, to death. Prognostic stratification of patients with PE is therefore essential to guide therapy. Currently, this stratification is primarily based on blood pressure on admission. Hemodynamic instability or shock carries a bad prognosis, and is associated with a 3‐fold to 7‐fold increase in mortality.1 Thrombolytic therapy is warranted in these cases.2 There is a subset of patients that, despite normal blood pressure on presentation, can subsequently suffer hemodynamic deterioration and death.3

Echocardiography has been proposed as a useful tool to identify a subset of patients at a higher risk. It has been suggested that the finding of right ventricle dysfunction (RVD) in echocardiography predicts a worse prognosis, even in patients with normal blood pressure on presentation.4 Also, computed tomography pulmonary angiography (CTPA) is increasingly used as the main test to diagnose PE. This technique can also assess the degree of pulmonary arterial obstruction and the presence of signs suggestive of RVD. It has been suggested that CTPA findings can predict outcome in PE.5

Electrocardiography (ECG) has a widespread use and is routinely carried out and interpreted in the emergency room. Some ECG findings in patients with PE are suggestive of right ventricular strain and might therefore be used to prioritize cases that require closer monitoring.6

This study was designed with the objectives of assessing the correlation of standard ECG findings with echocardiography and CTPA signs of RVD, with the anatomic severity of the pulmonary vascular obstruction, and with the degree of hypoxemia, in hemodynamically stable patients with PE. Secondary objectives were determining if ECG could accurately predict RVD, and determining the interobserver agreement for the ECG score.

Patients and Methods

Patients and Study Design

We recently carried out a prospective, descriptive, single‐center follow‐up study to assess the prevalence of RVD and pulmonary hypertension (PH) in PE patients who presented with hemodynamic stability.7 We herein analyze ECG findings in these cases. The present, noninterventional study was approved by our institution's review board. The population studied included consecutive patients presenting with PE to our emergency room. Inclusion criteria were age >18 years and PE confirmed by CTPA. Exclusion criteria were high‐risk PE (presence of 2 consecutive systolic blood pressure measurements <90 mm Hg, measured >15 minutes apart or requiring inotropic support); comorbidity predictive of a 6‐month mortality >50% (eg, metastatic cancer or end‐stage respiratory or heart disease); creatinine clearance <35 mL/minute; or allergy to ionidated contrast media. All the patients gave informed consent to participate in the study.

Protocol

Initial assessment included clinical history, physical examination, ECG, arterial blood gas analysis, echocardiography, CTPA, and lower‐limb venous ultrasonography. All included individuals were treated with anticoagulation, and fibrinolytic therapy was not used.

ECG

A standard 12‐lead ECG was promptly obtained for all patients in the emergency room. We used the scoring system described by Daniel et al.8 (Table 1). This score is based on 4 signs that were previously found to be associated with high‐risk PE: tachycardia, incomplete or complete right bundle branch block, T wave inversion, and S1Q3T3 pattern. Two investigators trained in the interpretation of ECG results scored the ECG independently, and were blinded to patient clinical status and to echocardiography and CTPA findings.

ECG Scoring Method Used in the Study
CharacteristicsScore
  • If present check maximum only.

Tachycardia (>100 beats/min)2
Incomplete right bundle‐branch block2
Complete right bundle‐branch block3
T‐wave inversion in lead V1 through V44
T wave inversion in lead V1*
<1 mm0
12 mm1
>2 mm2
T wave inversion in lead V2*
<1 mm1
12 mm2
>2 mm3
T wave inversion in lead V3*
<1 mm1
12 mm2
>2 mm3
S wave in lead 10
Q wave in lead 31
Inverted T wave in lead 31
If all S1Q3T3, add2
Total score (maximum: 21)

Echocardiography

The study was done as soon as possible after admission using a SONOS 5500 (Hewlett Packard, Palo Alto, CA) ultrasound imaging system with a S4 transducer. In all cases M‐mode, 2‐dimensional, Doppler (continuous and pulsed wave), and color Doppler was performed with the patient in the left lateral position. The structure of the mitral, aortic, tricuspid, and pulmonary valves (different grades of regurgitation and stenosis were assessed), and the systolic and diastolic function of the left ventricle (LV) were systematically assessed.

We assessed if patients had either RVD or isolated PH. Individuals with at least 1 of the following findings were diagnosed as having RVD: right ventricle (RV) hypokinesis (asymmetrical or delayed contraction, usually in the RV base), paradoxical septal systolic motion or right ventricular dilatation (end‐diastolic diameter > 30 mm or right to left ventricular end‐diastolic diameter ratio 1 in the apical 4‐chamber view); PH was defined as pulmonary arterial systolic pressure (PASP) > 40 mm Hg.9 PASP was derived from the right atrioventricular pressure gradient, using peak velocity of tricuspid flow regurgitation with continuous wave Doppler in the apical 4‐chamber view and the modified Bernoulli equation.10 Right atrial pressure was considered equal to 5 mm Hg or 10 mm Hg, according to whether the inferior vena cava collapsed during inspiration, respectively.11

Computed Tomographic Pulmonary Angiography

All CTPAs were performed within 6 hours of patient arrival to the emergency room. Nonionic contrast (100 mL) was administered intravenously at an injection rate of 2.5 mL/second for 40 seconds. Images were obtained on the same single‐detector scanner (Somatron PQ 2000S; Picker International, Cleveland, OH). If possible, scanning was performed during a 32‐second breath hold. If patients were dyspneic, spiral CT angiography was performed during shallow breathing. The scans were obtained using 125 mA and 130 kV. A 5 mm/second table feed was used to scan a 16‐cm volume in the craniocaudal direction (pitch of 1.5). An imaging delay of 20 seconds was used, and overlapping images were reconstructed every 1.5 mm and viewed on films at lung and mediastinal settings.

PE was diagnosed by the on‐duty radiologist if an intraluminal filling defect was seen. For the purpose of the study, the images were reviewed by a senior radiologist. The pulmonary obstruction index was determined according to Qanadli et al.12 The RV to LV diameter ratio was obtained by computing the ratio between the widths of the right and the left ventricular cavities assessed on axial images obtained at the plane of maximal distance between the ventricular endocardial free wall and the interventricular septum, perpendicular to the long axis. A RV/LV ratio > 1 was accepted as suggestive of RV dysfunction. The diameter of the main pulmonary artery (PA) was measured just before the division into its 2 main branches.

Definition of Clinical Endpoints

Primary outcome measures were the prevalence of echocardiography‐assessed RVD or PH at diagnosis, the prevalence of CTPA signs of RVD, the CTPA‐measured severity of the pulmonary vascular obstruction, and the degree of hypoxemia.

Statistical Analysis

Normal distribution of data was assessed using the D'agostino‐Pearson test. Data are shown as mean standard deviation (for normally distributed data) or median (interquartile range) (for non‐normally distributed data). Comparisons between different groups were made using unpaired t test or Wilcoxon rank‐sum test, as appropriate. Correlation between the ECG score and the different variables measured was assessed using Spearman's rank correlation coefficient. Receiver operating characteristic (ROC) curves were constructed to assess the value of ECG score to predict echocardiography or CTPA‐detected RVD. Kappa measurement was performed to examine the interobserver agreement for the ECG score. A 2‐tailed value of P < 0.05 was considered significant.

Results

A total of 103 patients were included in the study (mean age = 69 15 years). One patient died from fatal PE soon after the diagnosis, before echocardiography could be performed. During the 6‐month follow‐up, one patient died from septic shock and another suffered a thromboembolic recurrence (deep vein thrombosis). Echocardiography‐assessed RVD was found in 25 cases (24.5%) and isolated pulmonary hypertension in 20 (19.6%). Median value of the vascular obstruction index was 43.8% (25‐65). Thirty‐three patients (32%) had signs of RVD in CTPA.

Median value of ECG score was 2.5 (1‐6). The level of interobserver agreement regarding ECG score was substantial ( = 0.80). Table 2 shows correlation between ECG score and echocardiography, arterial blood gases, and CTPA parameters. ECG correlated significantly with all the variables measured. Correlation was higher for the vascular obstruction index and the RV/LV ratio, measured with echocardiography. ECG scores were significantly different for groups with varying degrees of severity of PE. Table 3 shows the ECG scores for patients grouped according to different criteria of severity of the disease.

Correlation Between ECG Score and Echocardiography/CTPA Parameters
VariableR (95% CI)P
  • PASP: pulmonary artery systolic pressure; pO2 (A‐a): alveolar‐arterial gradient of oxygen. PA: pulmonary artery. RV/LV: right ventricle to left ventricle. CTPA: computed tomography pulmonary angiography.

Vascular obstruction index0.41 (0.220.57)<0.001
PASP0.31 (0.090.49)0.006
pO2(A‐a)0.29 (0.080.47)0.007
PA diameter0.28 (0.070.47)0.011
RV/LV ratio (echocardiography)0.42 (0.220.57)<0.001
RV/LV ratio (CTPA)0.36 (0.130.56)0.004
ECG Scores for Groups of Patients with Varying Severity of PE According to Different Criteria
CriteriaECG scoreP
  • RVD: right ventricle dysfunction; PH: pulmonary hypertension; CTPA: computed tomography pulmonary angiography; PaO2: arterial oxygen tension; PE: pulmonary embolism. Results are expressed as median [IQR].

RVD (echocardiography) present10 [615]<0.0001
RVD (echocardiography) absent2 [04] 
PH (echocardiography) present6 [1.7512.00]0.029
PH (echocardiography) absent2 [04] 
RVD (CTPA) present6 [311]0.0015
RVD (CTPA) absent2 [13] 
Vascular obstruction score >50%7 [211]0.0005
Vascular obstruction score 50%2 [03] 
PaO2 < 60 mmHg4 [1.252.75]0.015
PaO2 60 mmHg2 [14] 
Bilateral PE5 [111]0.028
Unilateral PE2 [0.754.00] 
Central PE4 [210]0.0011
Peripheral PE2 [03] 

Figure 1 shows the ROC curve for the ECG score and the presence of echocardiography‐detected RVD. Area under the ROC curve was 0.82 (95% confidence interval [CI]: 0.72‐0.89). A cut‐off point of 6 for the ECG score showed the highest accuracy for detecting RVD; sensitivity = 76.5% (95% CI: 50.1‐93.0), specificity = 88.6% (95% CI: 78.7‐94.9), positive likelihood ratio (+LR) = 6.69, negative likelihood ratio (LR) = 0.37. If the ECG score was to be used as a screening method to exclude RVD, a cut‐off point of 0 showed sensitivity = 94.1% (95% CI: 71.2‐99.0), specificity = 27.1% (95% CI: 17.2‐39.1), +LR = 1.29, LR = 0.22. If the ECG score was considered for confirming RVD, the more useful value was 9; sensitivity = 58.8% (95% CI: 33.0‐81.5), specificity = 92.0% (95% CI: 84.1‐97.6), +LR = 8.23, LR = 0.44. Area under the ROC curve to predict CTPA‐detected RVD was slightly lower than for echocardiography: 0.74 (95% CI: 0.61‐0.84).

Figure 1
ROC curve for the ECG score and the presence of echocardiography‐detected RVD.

Discussion

This study shows that a simple, easy‐to‐use ECG scoring system correlates well with the severity of PE, assessed by different methods, in hemodynamically stable patients. Interobserver agreement regarding the scoring system was substantial. Several previous studies have found that ECG signs of RV strain correlate with the presence of RVD.6, 1316 However, some of these studies are limited by a retrospective design that could lead to selection bias or by the inclusion of relatively few (eg, <100) cases.6, 13, 14 Moreover, only a few of these articles have specifically examined patients with normal blood pressure.6, 15 Although our study is still small, one of its strengths is that it prospectively recruited a population of consecutive, normotensive patients and both echocardiography and CTPA were systematically performed. Classifying cases with normal blood pressure by severity is particularly relevant, because of the uncertainty about best treatment when hemodynamic instability is not present. These patients who are not at high risk for PE can be further stratified according to the presence of RVD and/or myocardial injury into intermediate‐risk and low‐risk PE.17 Early hospital discharge or initial outpatient treatment might be considered in low‐risk patients.17, 18 However, echocardiography can be difficult to perform in the emergency setting. Also, the presence of RVD is not easy to predict on clinical grounds. Our study suggests that a standard 12‐lead ECG can be useful to prioritize patients for more exhaustive monitoring or additional risk stratifying tests. An ECG score of 0 would exclude RVD with enough sensitivity to avoid getting an echocardiogram in these cases. On the other hand, a score 9 would suggest the possibility that RVD was present, and an echocardiography ought to be considered in these patients.

Previous studies regarding correlation between ECG and anatomic extension of the pulmonary vascular obstruction in PE have revealed conflicting data. Iles et al. found that ECG score identified those patients with the greatest percentage of perfusion defect on ventilation/perfusion scan.19 However, Kanbay et al. did not find significant differences in ECG scores for patients with pulmonary vascular obstruction scores <50% or 50%, also assessed with ventilation/perfusion scan.20 Subramaniam et al. used CTPA to assess clot burden score, and they did not see a significant association between ECG score and the anatomic severity of PE.21 This study found a significant association between higher ECG score and a more severe vascular obstruction index. This finding might have potential clinical implications, because some reports suggest that a higher CTPA‐measured clot load score can be associated with poorer outcome in PE.22 However, the utility of CTPA scores of vascular obstruction severity as a marker of clinical evolution is controversial, and several other authors have found that these scores are poor predictors of mortality or adverse outcome events.23, 24 Therefore, the positive correlation between ECG and the vascular obstruction index in our study is interesting mainly in the sense that it independently supports the validity of the ECG score as a marker of a potentially more severe PE.

In this study, we have not systematically excluded patients with comorbidities (eg, chronic obstructive pulmonary disease) that could account for RVD or PH. Our intention was to reflect a real‐life clinical scenario. When a patient attends the emergency room with PE, clinical decisions must usually be taken without complete information on comorbidities that may contribute to the existence of RV overload. Also, these subjects have a reduced cardiorespiratory reserve, and the PE might impose an unbearable strain to the RV, so risk stratification is especially important. Therefore, we felt that the study should include all patients presenting with PE, so that the results can be extrapolated to usual clinical practice.

Our results suggest that, by selecting the appropriate cut‐off value, the ECG score can be used with adequate sensitivity and specificity to exclude and confirm, respectively, RVD in hemodynamically stable PE patients. This finding implies that ECG may be useful to design management strategies in these cases, selecting patients that may benefit from further tests.

There are some limitations for the present study. Echocardiography was not immediately performed after the ECG. Thus, we might have missed some patients who presented with transient RVD, which resolved between tests. It is likely that the correlation between ECG and echocardiography would have improved if this delay had been avoided. Also, we did not use a multidetector scanner for performing CTPAs. Consequently, small emboli might have been missed and the clot score might have been underestimated. It is plausible that this may have reduced to some extent the correlation between ECG and CTPA. Also, this a single‐center study, with relatively few patients studied. Finally, due to the low incidence of adverse events in our patients, our study is underpowered to make conclusions about the independent prognostic value of ECG for predicting adverse events.

In conclusion, an easy‐to‐use ECG score correlates significantly with the severity of PE, as assessed with echocardiography, CTPA, and arterial blood gas analysis, in normotensive patients. It can be used to predict with acceptable sensitivity and specificity the presence of RVD in these cases and, accordingly, it has potential value in risk‐stratification strategies. Larger, multicenter studies, should confirm these results before they can be applied to clinical practice.

The clinical outcome of patients with pulmonary embolism (PE) has a wide spectrum, ranging from a benign course, with early resolution of symptoms, to death. Prognostic stratification of patients with PE is therefore essential to guide therapy. Currently, this stratification is primarily based on blood pressure on admission. Hemodynamic instability or shock carries a bad prognosis, and is associated with a 3‐fold to 7‐fold increase in mortality.1 Thrombolytic therapy is warranted in these cases.2 There is a subset of patients that, despite normal blood pressure on presentation, can subsequently suffer hemodynamic deterioration and death.3

Echocardiography has been proposed as a useful tool to identify a subset of patients at a higher risk. It has been suggested that the finding of right ventricle dysfunction (RVD) in echocardiography predicts a worse prognosis, even in patients with normal blood pressure on presentation.4 Also, computed tomography pulmonary angiography (CTPA) is increasingly used as the main test to diagnose PE. This technique can also assess the degree of pulmonary arterial obstruction and the presence of signs suggestive of RVD. It has been suggested that CTPA findings can predict outcome in PE.5

Electrocardiography (ECG) has a widespread use and is routinely carried out and interpreted in the emergency room. Some ECG findings in patients with PE are suggestive of right ventricular strain and might therefore be used to prioritize cases that require closer monitoring.6

This study was designed with the objectives of assessing the correlation of standard ECG findings with echocardiography and CTPA signs of RVD, with the anatomic severity of the pulmonary vascular obstruction, and with the degree of hypoxemia, in hemodynamically stable patients with PE. Secondary objectives were determining if ECG could accurately predict RVD, and determining the interobserver agreement for the ECG score.

Patients and Methods

Patients and Study Design

We recently carried out a prospective, descriptive, single‐center follow‐up study to assess the prevalence of RVD and pulmonary hypertension (PH) in PE patients who presented with hemodynamic stability.7 We herein analyze ECG findings in these cases. The present, noninterventional study was approved by our institution's review board. The population studied included consecutive patients presenting with PE to our emergency room. Inclusion criteria were age >18 years and PE confirmed by CTPA. Exclusion criteria were high‐risk PE (presence of 2 consecutive systolic blood pressure measurements <90 mm Hg, measured >15 minutes apart or requiring inotropic support); comorbidity predictive of a 6‐month mortality >50% (eg, metastatic cancer or end‐stage respiratory or heart disease); creatinine clearance <35 mL/minute; or allergy to ionidated contrast media. All the patients gave informed consent to participate in the study.

Protocol

Initial assessment included clinical history, physical examination, ECG, arterial blood gas analysis, echocardiography, CTPA, and lower‐limb venous ultrasonography. All included individuals were treated with anticoagulation, and fibrinolytic therapy was not used.

ECG

A standard 12‐lead ECG was promptly obtained for all patients in the emergency room. We used the scoring system described by Daniel et al.8 (Table 1). This score is based on 4 signs that were previously found to be associated with high‐risk PE: tachycardia, incomplete or complete right bundle branch block, T wave inversion, and S1Q3T3 pattern. Two investigators trained in the interpretation of ECG results scored the ECG independently, and were blinded to patient clinical status and to echocardiography and CTPA findings.

ECG Scoring Method Used in the Study
CharacteristicsScore
  • If present check maximum only.

Tachycardia (>100 beats/min)2
Incomplete right bundle‐branch block2
Complete right bundle‐branch block3
T‐wave inversion in lead V1 through V44
T wave inversion in lead V1*
<1 mm0
12 mm1
>2 mm2
T wave inversion in lead V2*
<1 mm1
12 mm2
>2 mm3
T wave inversion in lead V3*
<1 mm1
12 mm2
>2 mm3
S wave in lead 10
Q wave in lead 31
Inverted T wave in lead 31
If all S1Q3T3, add2
Total score (maximum: 21)

Echocardiography

The study was done as soon as possible after admission using a SONOS 5500 (Hewlett Packard, Palo Alto, CA) ultrasound imaging system with a S4 transducer. In all cases M‐mode, 2‐dimensional, Doppler (continuous and pulsed wave), and color Doppler was performed with the patient in the left lateral position. The structure of the mitral, aortic, tricuspid, and pulmonary valves (different grades of regurgitation and stenosis were assessed), and the systolic and diastolic function of the left ventricle (LV) were systematically assessed.

We assessed if patients had either RVD or isolated PH. Individuals with at least 1 of the following findings were diagnosed as having RVD: right ventricle (RV) hypokinesis (asymmetrical or delayed contraction, usually in the RV base), paradoxical septal systolic motion or right ventricular dilatation (end‐diastolic diameter > 30 mm or right to left ventricular end‐diastolic diameter ratio 1 in the apical 4‐chamber view); PH was defined as pulmonary arterial systolic pressure (PASP) > 40 mm Hg.9 PASP was derived from the right atrioventricular pressure gradient, using peak velocity of tricuspid flow regurgitation with continuous wave Doppler in the apical 4‐chamber view and the modified Bernoulli equation.10 Right atrial pressure was considered equal to 5 mm Hg or 10 mm Hg, according to whether the inferior vena cava collapsed during inspiration, respectively.11

Computed Tomographic Pulmonary Angiography

All CTPAs were performed within 6 hours of patient arrival to the emergency room. Nonionic contrast (100 mL) was administered intravenously at an injection rate of 2.5 mL/second for 40 seconds. Images were obtained on the same single‐detector scanner (Somatron PQ 2000S; Picker International, Cleveland, OH). If possible, scanning was performed during a 32‐second breath hold. If patients were dyspneic, spiral CT angiography was performed during shallow breathing. The scans were obtained using 125 mA and 130 kV. A 5 mm/second table feed was used to scan a 16‐cm volume in the craniocaudal direction (pitch of 1.5). An imaging delay of 20 seconds was used, and overlapping images were reconstructed every 1.5 mm and viewed on films at lung and mediastinal settings.

PE was diagnosed by the on‐duty radiologist if an intraluminal filling defect was seen. For the purpose of the study, the images were reviewed by a senior radiologist. The pulmonary obstruction index was determined according to Qanadli et al.12 The RV to LV diameter ratio was obtained by computing the ratio between the widths of the right and the left ventricular cavities assessed on axial images obtained at the plane of maximal distance between the ventricular endocardial free wall and the interventricular septum, perpendicular to the long axis. A RV/LV ratio > 1 was accepted as suggestive of RV dysfunction. The diameter of the main pulmonary artery (PA) was measured just before the division into its 2 main branches.

Definition of Clinical Endpoints

Primary outcome measures were the prevalence of echocardiography‐assessed RVD or PH at diagnosis, the prevalence of CTPA signs of RVD, the CTPA‐measured severity of the pulmonary vascular obstruction, and the degree of hypoxemia.

Statistical Analysis

Normal distribution of data was assessed using the D'agostino‐Pearson test. Data are shown as mean standard deviation (for normally distributed data) or median (interquartile range) (for non‐normally distributed data). Comparisons between different groups were made using unpaired t test or Wilcoxon rank‐sum test, as appropriate. Correlation between the ECG score and the different variables measured was assessed using Spearman's rank correlation coefficient. Receiver operating characteristic (ROC) curves were constructed to assess the value of ECG score to predict echocardiography or CTPA‐detected RVD. Kappa measurement was performed to examine the interobserver agreement for the ECG score. A 2‐tailed value of P < 0.05 was considered significant.

Results

A total of 103 patients were included in the study (mean age = 69 15 years). One patient died from fatal PE soon after the diagnosis, before echocardiography could be performed. During the 6‐month follow‐up, one patient died from septic shock and another suffered a thromboembolic recurrence (deep vein thrombosis). Echocardiography‐assessed RVD was found in 25 cases (24.5%) and isolated pulmonary hypertension in 20 (19.6%). Median value of the vascular obstruction index was 43.8% (25‐65). Thirty‐three patients (32%) had signs of RVD in CTPA.

Median value of ECG score was 2.5 (1‐6). The level of interobserver agreement regarding ECG score was substantial ( = 0.80). Table 2 shows correlation between ECG score and echocardiography, arterial blood gases, and CTPA parameters. ECG correlated significantly with all the variables measured. Correlation was higher for the vascular obstruction index and the RV/LV ratio, measured with echocardiography. ECG scores were significantly different for groups with varying degrees of severity of PE. Table 3 shows the ECG scores for patients grouped according to different criteria of severity of the disease.

Correlation Between ECG Score and Echocardiography/CTPA Parameters
VariableR (95% CI)P
  • PASP: pulmonary artery systolic pressure; pO2 (A‐a): alveolar‐arterial gradient of oxygen. PA: pulmonary artery. RV/LV: right ventricle to left ventricle. CTPA: computed tomography pulmonary angiography.

Vascular obstruction index0.41 (0.220.57)<0.001
PASP0.31 (0.090.49)0.006
pO2(A‐a)0.29 (0.080.47)0.007
PA diameter0.28 (0.070.47)0.011
RV/LV ratio (echocardiography)0.42 (0.220.57)<0.001
RV/LV ratio (CTPA)0.36 (0.130.56)0.004
ECG Scores for Groups of Patients with Varying Severity of PE According to Different Criteria
CriteriaECG scoreP
  • RVD: right ventricle dysfunction; PH: pulmonary hypertension; CTPA: computed tomography pulmonary angiography; PaO2: arterial oxygen tension; PE: pulmonary embolism. Results are expressed as median [IQR].

RVD (echocardiography) present10 [615]<0.0001
RVD (echocardiography) absent2 [04] 
PH (echocardiography) present6 [1.7512.00]0.029
PH (echocardiography) absent2 [04] 
RVD (CTPA) present6 [311]0.0015
RVD (CTPA) absent2 [13] 
Vascular obstruction score >50%7 [211]0.0005
Vascular obstruction score 50%2 [03] 
PaO2 < 60 mmHg4 [1.252.75]0.015
PaO2 60 mmHg2 [14] 
Bilateral PE5 [111]0.028
Unilateral PE2 [0.754.00] 
Central PE4 [210]0.0011
Peripheral PE2 [03] 

Figure 1 shows the ROC curve for the ECG score and the presence of echocardiography‐detected RVD. Area under the ROC curve was 0.82 (95% confidence interval [CI]: 0.72‐0.89). A cut‐off point of 6 for the ECG score showed the highest accuracy for detecting RVD; sensitivity = 76.5% (95% CI: 50.1‐93.0), specificity = 88.6% (95% CI: 78.7‐94.9), positive likelihood ratio (+LR) = 6.69, negative likelihood ratio (LR) = 0.37. If the ECG score was to be used as a screening method to exclude RVD, a cut‐off point of 0 showed sensitivity = 94.1% (95% CI: 71.2‐99.0), specificity = 27.1% (95% CI: 17.2‐39.1), +LR = 1.29, LR = 0.22. If the ECG score was considered for confirming RVD, the more useful value was 9; sensitivity = 58.8% (95% CI: 33.0‐81.5), specificity = 92.0% (95% CI: 84.1‐97.6), +LR = 8.23, LR = 0.44. Area under the ROC curve to predict CTPA‐detected RVD was slightly lower than for echocardiography: 0.74 (95% CI: 0.61‐0.84).

Figure 1
ROC curve for the ECG score and the presence of echocardiography‐detected RVD.

Discussion

This study shows that a simple, easy‐to‐use ECG scoring system correlates well with the severity of PE, assessed by different methods, in hemodynamically stable patients. Interobserver agreement regarding the scoring system was substantial. Several previous studies have found that ECG signs of RV strain correlate with the presence of RVD.6, 1316 However, some of these studies are limited by a retrospective design that could lead to selection bias or by the inclusion of relatively few (eg, <100) cases.6, 13, 14 Moreover, only a few of these articles have specifically examined patients with normal blood pressure.6, 15 Although our study is still small, one of its strengths is that it prospectively recruited a population of consecutive, normotensive patients and both echocardiography and CTPA were systematically performed. Classifying cases with normal blood pressure by severity is particularly relevant, because of the uncertainty about best treatment when hemodynamic instability is not present. These patients who are not at high risk for PE can be further stratified according to the presence of RVD and/or myocardial injury into intermediate‐risk and low‐risk PE.17 Early hospital discharge or initial outpatient treatment might be considered in low‐risk patients.17, 18 However, echocardiography can be difficult to perform in the emergency setting. Also, the presence of RVD is not easy to predict on clinical grounds. Our study suggests that a standard 12‐lead ECG can be useful to prioritize patients for more exhaustive monitoring or additional risk stratifying tests. An ECG score of 0 would exclude RVD with enough sensitivity to avoid getting an echocardiogram in these cases. On the other hand, a score 9 would suggest the possibility that RVD was present, and an echocardiography ought to be considered in these patients.

Previous studies regarding correlation between ECG and anatomic extension of the pulmonary vascular obstruction in PE have revealed conflicting data. Iles et al. found that ECG score identified those patients with the greatest percentage of perfusion defect on ventilation/perfusion scan.19 However, Kanbay et al. did not find significant differences in ECG scores for patients with pulmonary vascular obstruction scores <50% or 50%, also assessed with ventilation/perfusion scan.20 Subramaniam et al. used CTPA to assess clot burden score, and they did not see a significant association between ECG score and the anatomic severity of PE.21 This study found a significant association between higher ECG score and a more severe vascular obstruction index. This finding might have potential clinical implications, because some reports suggest that a higher CTPA‐measured clot load score can be associated with poorer outcome in PE.22 However, the utility of CTPA scores of vascular obstruction severity as a marker of clinical evolution is controversial, and several other authors have found that these scores are poor predictors of mortality or adverse outcome events.23, 24 Therefore, the positive correlation between ECG and the vascular obstruction index in our study is interesting mainly in the sense that it independently supports the validity of the ECG score as a marker of a potentially more severe PE.

In this study, we have not systematically excluded patients with comorbidities (eg, chronic obstructive pulmonary disease) that could account for RVD or PH. Our intention was to reflect a real‐life clinical scenario. When a patient attends the emergency room with PE, clinical decisions must usually be taken without complete information on comorbidities that may contribute to the existence of RV overload. Also, these subjects have a reduced cardiorespiratory reserve, and the PE might impose an unbearable strain to the RV, so risk stratification is especially important. Therefore, we felt that the study should include all patients presenting with PE, so that the results can be extrapolated to usual clinical practice.

Our results suggest that, by selecting the appropriate cut‐off value, the ECG score can be used with adequate sensitivity and specificity to exclude and confirm, respectively, RVD in hemodynamically stable PE patients. This finding implies that ECG may be useful to design management strategies in these cases, selecting patients that may benefit from further tests.

There are some limitations for the present study. Echocardiography was not immediately performed after the ECG. Thus, we might have missed some patients who presented with transient RVD, which resolved between tests. It is likely that the correlation between ECG and echocardiography would have improved if this delay had been avoided. Also, we did not use a multidetector scanner for performing CTPAs. Consequently, small emboli might have been missed and the clot score might have been underestimated. It is plausible that this may have reduced to some extent the correlation between ECG and CTPA. Also, this a single‐center study, with relatively few patients studied. Finally, due to the low incidence of adverse events in our patients, our study is underpowered to make conclusions about the independent prognostic value of ECG for predicting adverse events.

In conclusion, an easy‐to‐use ECG score correlates significantly with the severity of PE, as assessed with echocardiography, CTPA, and arterial blood gas analysis, in normotensive patients. It can be used to predict with acceptable sensitivity and specificity the presence of RVD in these cases and, accordingly, it has potential value in risk‐stratification strategies. Larger, multicenter studies, should confirm these results before they can be applied to clinical practice.

References
  1. Goldhaber SZ,Visani L,De Rosa M.Acute pulmonary embolism: clinical outcomes in the International Cooperative Pulmonary Embolism Registry (ICOPER).Lancet.1999;353:13861389.
  2. Wan S,Quinlan DJ,Agnelli G,Eikelboom JW.Thrombolysis compared with heparin for the initial treatment of pulmonary embolism. A meta‐analysis of the randomized controlled trials.Circulation.2004;110:744749.
  3. Kasper W,Konstantinides S,Geibel A, et al.Management strategies and determinants of outcome in acute major pulmonary embolism: results of a multicenter registry.J Am Coll Cardiol.1997;30:11651171
  4. Ten Wolde M,Söhne M,Quak E,Mac Gillavry MR,Büller HR.Prognostic value of echocardiographycally assessed right ventricular dysfunction in patients with pulmonary embolism.Arch Intern Med.2004;164:16851689.
  5. Schoepf UJ,Kucher N,Kipfmueller F, et al.Right ventricular enlargement on chest computed tomography. A predictor of early death in acute pulmonary embolism.Circulation.2004;110:32763280.
  6. Punukollu G,Gowda RM,Vasavada BC,Khan IA.Role of electrocardiography in identifying right ventricular dysfunction in acute pulmonary embolism.Am J Cardiol.2005;96:450452.
  7. Golpe R,Pérez‐de‐Llano LA,Castro‐Añón O, et al.Right ventricle dysfunction and pulmonary hypertension in hemodynamically stable pulmonary embolism.Respir Med.2010;104:13701376.
  8. Daniel KR,Courtney M,Kline JA.Assessment of cardiac stress from massive pulmonary embolism with 12‐lead ECG.Chest.2001;120:474481.
  9. McQuillan BM,Picard MH,Leavitt M, et al.Clinical correlates and reference intervals for pulmonary artery systolic pressure among echocardiographically normal subjects.Circulation.2001;104:27972802.
  10. Berger M,Haimowitz A,Van Tosh A, et al.Quantitative assessment of pulmonary hypertension in patients with tricuspid regurgitation using continuous wave Doppler ultrasound.J Am Coll Cardiol.1985;6:359365.
  11. Kircher BJ,Himelman RB,Schiller NB.Noninvasive estimation of right atrial pressure from the inspiratory collapse of the inferior vena cava.Am J Cardiol.1990;66:493496.
  12. Qanadli SD,El Hajjam M,Vieillard‐Baron A, et al.New CT index to quantify arterial obstruction in pulmonary embolism: comparison with angiographic index and echocardiography.AJR Am J Roentgenol.2001;176:14151420.
  13. Toosi MS,Merlino JD,Leeper KV.Electrocardiographic score and short‐term outcomes of acute pulmonary embolism.Am J Cardiol.2007;100:11721176.
  14. Kostrubiec M,Hrynkiewicz A,Pedowska‐Wtoszek J, et al.Is it possible to use standard electrocardiography for risk assessment of patients with pulmonary embolism?Kardiol Pol.2009;67:744750.
  15. Vanni S,Polidori G,Vergara R, et al.Prognostic value of ECG among patients with acute pulmonary embolism and normal blood pressure.Am J Med.2009;122:257264.
  16. Kucher N,Walpoth N,Wustmann K,Noveanu M,Gertsch M.QR in V1‐an ECG sign associated with right ventricular strain and adverse clinical outcome in pulmonary embolism.Eur Heart J.2003;24:11131119.
  17. Torbicki A,Perrier A,Konstantinides S, et al.Guidelines on the diagnosis and management of acute pulmonary embolism. The Task Force for the Diagnosis and Management of Acute Pulmonary Embolism of the European Society of Cardiology (ESC).Eur Heart J.2008;29:22762315.
  18. Konstantinides S.Acute pulmonary embolism.N Eng J Med.2008;359:28042813.
  19. Iles S,Le Heron CJ,Davies G,Turner JG,Beckert LEL.ECG score predicts those with the greatest percentage of perfusion defects due to acute pulmonary thromboembolic disease.Chest.2004;125:16511656.
  20. Kanbay A,Kokturk N,Kaya MG, et al.Electrocardiography and Wells scoring in predicting the anatomic severity of pulmonary embolism.Respir Med.2007;101:11711176.
  21. Subramaniam RM,Mandrekar J,Chang C, et al.Pulmonary embolism outcome: a prospective evaluation of CT pulmonary angiographic clot burden score and ECG score.AJR Am J Roentgenol.2008;190:15991604.
  22. Van der Meer RW,Pattynama PMT,Van Strijen MJL, et al.Right ventricular dysfunction and pulmonary obstruction index at helical CT: prediction of clinical outcome during 3‐month follow‐up in patients with acute pulmonary embolism.Radiology.2005;235:798803.
  23. Ghuysen AE,Ghaye B,Villems V,Dondelinger RF,D'Orio V.Acute PE mortality prediction by analysis of helical computed tomography angiography and hemodynamic evaluation.Thorax.2005;60:956961.
  24. Araoz PA,Gotway MB,Harrington JR,Harmsen WS,Mandrekar JN.Pulmonary embolism: prognostic CT findings.Radiology.2007;242:889893.
References
  1. Goldhaber SZ,Visani L,De Rosa M.Acute pulmonary embolism: clinical outcomes in the International Cooperative Pulmonary Embolism Registry (ICOPER).Lancet.1999;353:13861389.
  2. Wan S,Quinlan DJ,Agnelli G,Eikelboom JW.Thrombolysis compared with heparin for the initial treatment of pulmonary embolism. A meta‐analysis of the randomized controlled trials.Circulation.2004;110:744749.
  3. Kasper W,Konstantinides S,Geibel A, et al.Management strategies and determinants of outcome in acute major pulmonary embolism: results of a multicenter registry.J Am Coll Cardiol.1997;30:11651171
  4. Ten Wolde M,Söhne M,Quak E,Mac Gillavry MR,Büller HR.Prognostic value of echocardiographycally assessed right ventricular dysfunction in patients with pulmonary embolism.Arch Intern Med.2004;164:16851689.
  5. Schoepf UJ,Kucher N,Kipfmueller F, et al.Right ventricular enlargement on chest computed tomography. A predictor of early death in acute pulmonary embolism.Circulation.2004;110:32763280.
  6. Punukollu G,Gowda RM,Vasavada BC,Khan IA.Role of electrocardiography in identifying right ventricular dysfunction in acute pulmonary embolism.Am J Cardiol.2005;96:450452.
  7. Golpe R,Pérez‐de‐Llano LA,Castro‐Añón O, et al.Right ventricle dysfunction and pulmonary hypertension in hemodynamically stable pulmonary embolism.Respir Med.2010;104:13701376.
  8. Daniel KR,Courtney M,Kline JA.Assessment of cardiac stress from massive pulmonary embolism with 12‐lead ECG.Chest.2001;120:474481.
  9. McQuillan BM,Picard MH,Leavitt M, et al.Clinical correlates and reference intervals for pulmonary artery systolic pressure among echocardiographically normal subjects.Circulation.2001;104:27972802.
  10. Berger M,Haimowitz A,Van Tosh A, et al.Quantitative assessment of pulmonary hypertension in patients with tricuspid regurgitation using continuous wave Doppler ultrasound.J Am Coll Cardiol.1985;6:359365.
  11. Kircher BJ,Himelman RB,Schiller NB.Noninvasive estimation of right atrial pressure from the inspiratory collapse of the inferior vena cava.Am J Cardiol.1990;66:493496.
  12. Qanadli SD,El Hajjam M,Vieillard‐Baron A, et al.New CT index to quantify arterial obstruction in pulmonary embolism: comparison with angiographic index and echocardiography.AJR Am J Roentgenol.2001;176:14151420.
  13. Toosi MS,Merlino JD,Leeper KV.Electrocardiographic score and short‐term outcomes of acute pulmonary embolism.Am J Cardiol.2007;100:11721176.
  14. Kostrubiec M,Hrynkiewicz A,Pedowska‐Wtoszek J, et al.Is it possible to use standard electrocardiography for risk assessment of patients with pulmonary embolism?Kardiol Pol.2009;67:744750.
  15. Vanni S,Polidori G,Vergara R, et al.Prognostic value of ECG among patients with acute pulmonary embolism and normal blood pressure.Am J Med.2009;122:257264.
  16. Kucher N,Walpoth N,Wustmann K,Noveanu M,Gertsch M.QR in V1‐an ECG sign associated with right ventricular strain and adverse clinical outcome in pulmonary embolism.Eur Heart J.2003;24:11131119.
  17. Torbicki A,Perrier A,Konstantinides S, et al.Guidelines on the diagnosis and management of acute pulmonary embolism. The Task Force for the Diagnosis and Management of Acute Pulmonary Embolism of the European Society of Cardiology (ESC).Eur Heart J.2008;29:22762315.
  18. Konstantinides S.Acute pulmonary embolism.N Eng J Med.2008;359:28042813.
  19. Iles S,Le Heron CJ,Davies G,Turner JG,Beckert LEL.ECG score predicts those with the greatest percentage of perfusion defects due to acute pulmonary thromboembolic disease.Chest.2004;125:16511656.
  20. Kanbay A,Kokturk N,Kaya MG, et al.Electrocardiography and Wells scoring in predicting the anatomic severity of pulmonary embolism.Respir Med.2007;101:11711176.
  21. Subramaniam RM,Mandrekar J,Chang C, et al.Pulmonary embolism outcome: a prospective evaluation of CT pulmonary angiographic clot burden score and ECG score.AJR Am J Roentgenol.2008;190:15991604.
  22. Van der Meer RW,Pattynama PMT,Van Strijen MJL, et al.Right ventricular dysfunction and pulmonary obstruction index at helical CT: prediction of clinical outcome during 3‐month follow‐up in patients with acute pulmonary embolism.Radiology.2005;235:798803.
  23. Ghuysen AE,Ghaye B,Villems V,Dondelinger RF,D'Orio V.Acute PE mortality prediction by analysis of helical computed tomography angiography and hemodynamic evaluation.Thorax.2005;60:956961.
  24. Araoz PA,Gotway MB,Harrington JR,Harmsen WS,Mandrekar JN.Pulmonary embolism: prognostic CT findings.Radiology.2007;242:889893.
Issue
Journal of Hospital Medicine - 6(5)
Issue
Journal of Hospital Medicine - 6(5)
Page Number
285-289
Page Number
285-289
Article Type
Display Headline
Electrocardiogram score predicts severity of pulmonary embolism in hemodynamically stable patients
Display Headline
Electrocardiogram score predicts severity of pulmonary embolism in hemodynamically stable patients
Legacy Keywords
electrocardiography, pulmonary embolism, right ventricular function, computer tomography, echocardiography
Legacy Keywords
electrocardiography, pulmonary embolism, right ventricular function, computer tomography, echocardiography
Sections
Article Source

Copyright © 2010 Society of Hospital Medicine

Disallow All Ads
Correspondence Location
Servicio de Neumología, Complexo Hospitalario Xeral‐Calde, c/Dr Ochoa, s/n. 27004 Lugo, Spain
Content Gating
No Gating (article Unlocked/Free)
Alternative CME
Article PDF Media

Continuing Medical Education Program in

Article Type
Changed
Display Headline
Continuing Medical Education Program in the Journal of Hospital Medicine

If you wish to receive credit for this activity, please refer to the website: www.wileyblackwellcme.com.

Accreditation and Designation Statement

Blackwell Futura Media Services designates this journal‐based CME activity for a maximum of 1 AMA PRA Category 1 Credit.. Physicians should only claim credit commensurate with the extent of their participation in the activity.

Blackwell Futura Media Services is accredited by the Accreditation Council for Continuing Medical Education to provide continuing medical education for physicians.

Educational Objectives

Upon completion of this educational activity, participants will be better able to:

  • Illustrate the elements of a systematic approach to successful hospital smoking cessation programs.

  • Describe the efficacy of a coordinated real world&#148; hospital smoking cessation program in a U.S. hospital.

  • Evaluate the barriers to successful hospital smoking cessation programs.


This manuscript underwent peer review in line with the standards of editorial integrity and publication ethics maintained by Journal of Hospital Medicine. The peer reviewers have no relevant financial relationships. The peer review process for Journal of Hospital Medicine is blinded. As such, the identities of the reviewers are not disclosed in line with the standard accepted practices of medical journal peer review.

Conflicts of interest have been identified and resolved in accordance with Blackwell Futura Media Services's Policy on Activity Disclosure and Conflict of Interest. The primary resolution method used was peer review and review by a non‐conflicted expert.

Instructions on Receiving Credit

For information on applicability and acceptance of CME credit for this activity, please consult your professional licensing board.

This activity is designed to be completed within an hour; physicians should claim only those credits that reflect the time actually spent in the activity. To successfully earn credit, participants must complete the activity during the valid credit period, which is up to two years from initial publication.

Follow these steps to earn credit:

  • Log on to www.wileyblackwellcme.com

  • Read the target audience, learning objectives, and author disclosures.

  • Read the article in print or online format.

  • Reflect on the article.

  • Access the CME Exam, and choose the best answer to each question.

  • Complete the required evaluation component of the activity.


This activity will be available for CME credit for twelve months following its publication date. At that time, it will be reviewed and potentially updated and extended for an additional twelve months.

Article PDF
Issue
Journal of Hospital Medicine - 6(5)
Page Number
290-290
Sections
Article PDF
Article PDF

If you wish to receive credit for this activity, please refer to the website: www.wileyblackwellcme.com.

Accreditation and Designation Statement

Blackwell Futura Media Services designates this journal‐based CME activity for a maximum of 1 AMA PRA Category 1 Credit.. Physicians should only claim credit commensurate with the extent of their participation in the activity.

Blackwell Futura Media Services is accredited by the Accreditation Council for Continuing Medical Education to provide continuing medical education for physicians.

Educational Objectives

Upon completion of this educational activity, participants will be better able to:

  • Illustrate the elements of a systematic approach to successful hospital smoking cessation programs.

  • Describe the efficacy of a coordinated real world&#148; hospital smoking cessation program in a U.S. hospital.

  • Evaluate the barriers to successful hospital smoking cessation programs.


This manuscript underwent peer review in line with the standards of editorial integrity and publication ethics maintained by Journal of Hospital Medicine. The peer reviewers have no relevant financial relationships. The peer review process for Journal of Hospital Medicine is blinded. As such, the identities of the reviewers are not disclosed in line with the standard accepted practices of medical journal peer review.

Conflicts of interest have been identified and resolved in accordance with Blackwell Futura Media Services's Policy on Activity Disclosure and Conflict of Interest. The primary resolution method used was peer review and review by a non‐conflicted expert.

Instructions on Receiving Credit

For information on applicability and acceptance of CME credit for this activity, please consult your professional licensing board.

This activity is designed to be completed within an hour; physicians should claim only those credits that reflect the time actually spent in the activity. To successfully earn credit, participants must complete the activity during the valid credit period, which is up to two years from initial publication.

Follow these steps to earn credit:

  • Log on to www.wileyblackwellcme.com

  • Read the target audience, learning objectives, and author disclosures.

  • Read the article in print or online format.

  • Reflect on the article.

  • Access the CME Exam, and choose the best answer to each question.

  • Complete the required evaluation component of the activity.


This activity will be available for CME credit for twelve months following its publication date. At that time, it will be reviewed and potentially updated and extended for an additional twelve months.

If you wish to receive credit for this activity, please refer to the website: www.wileyblackwellcme.com.

Accreditation and Designation Statement

Blackwell Futura Media Services designates this journal‐based CME activity for a maximum of 1 AMA PRA Category 1 Credit.. Physicians should only claim credit commensurate with the extent of their participation in the activity.

Blackwell Futura Media Services is accredited by the Accreditation Council for Continuing Medical Education to provide continuing medical education for physicians.

Educational Objectives

Upon completion of this educational activity, participants will be better able to:

  • Illustrate the elements of a systematic approach to successful hospital smoking cessation programs.

  • Describe the efficacy of a coordinated real world&#148; hospital smoking cessation program in a U.S. hospital.

  • Evaluate the barriers to successful hospital smoking cessation programs.


This manuscript underwent peer review in line with the standards of editorial integrity and publication ethics maintained by Journal of Hospital Medicine. The peer reviewers have no relevant financial relationships. The peer review process for Journal of Hospital Medicine is blinded. As such, the identities of the reviewers are not disclosed in line with the standard accepted practices of medical journal peer review.

Conflicts of interest have been identified and resolved in accordance with Blackwell Futura Media Services's Policy on Activity Disclosure and Conflict of Interest. The primary resolution method used was peer review and review by a non‐conflicted expert.

Instructions on Receiving Credit

For information on applicability and acceptance of CME credit for this activity, please consult your professional licensing board.

This activity is designed to be completed within an hour; physicians should claim only those credits that reflect the time actually spent in the activity. To successfully earn credit, participants must complete the activity during the valid credit period, which is up to two years from initial publication.

Follow these steps to earn credit:

  • Log on to www.wileyblackwellcme.com

  • Read the target audience, learning objectives, and author disclosures.

  • Read the article in print or online format.

  • Reflect on the article.

  • Access the CME Exam, and choose the best answer to each question.

  • Complete the required evaluation component of the activity.


This activity will be available for CME credit for twelve months following its publication date. At that time, it will be reviewed and potentially updated and extended for an additional twelve months.

Issue
Journal of Hospital Medicine - 6(5)
Issue
Journal of Hospital Medicine - 6(5)
Page Number
290-290
Page Number
290-290
Article Type
Display Headline
Continuing Medical Education Program in the Journal of Hospital Medicine
Display Headline
Continuing Medical Education Program in the Journal of Hospital Medicine
Sections
Article Source

Copyright © 2010 Society of Hospital Medicine

Disallow All Ads
Correspondence Location
Department of Preventive Medicine and Public Health, Mail‐Stop 1008, University of Kansas Medical Center, 3901 Rainbow Boulevard, Kansas City, KS 66160
Content Gating
No Gating (article Unlocked/Free)
Alternative CME
Article PDF Media