User login
The clinical outcome of patients with pulmonary embolism (PE) has a wide spectrum, ranging from a benign course, with early resolution of symptoms, to death. Prognostic stratification of patients with PE is therefore essential to guide therapy. Currently, this stratification is primarily based on blood pressure on admission. Hemodynamic instability or shock carries a bad prognosis, and is associated with a 3‐fold to 7‐fold increase in mortality.1 Thrombolytic therapy is warranted in these cases.2 There is a subset of patients that, despite normal blood pressure on presentation, can subsequently suffer hemodynamic deterioration and death.3
Echocardiography has been proposed as a useful tool to identify a subset of patients at a higher risk. It has been suggested that the finding of right ventricle dysfunction (RVD) in echocardiography predicts a worse prognosis, even in patients with normal blood pressure on presentation.4 Also, computed tomography pulmonary angiography (CTPA) is increasingly used as the main test to diagnose PE. This technique can also assess the degree of pulmonary arterial obstruction and the presence of signs suggestive of RVD. It has been suggested that CTPA findings can predict outcome in PE.5
Electrocardiography (ECG) has a widespread use and is routinely carried out and interpreted in the emergency room. Some ECG findings in patients with PE are suggestive of right ventricular strain and might therefore be used to prioritize cases that require closer monitoring.6
This study was designed with the objectives of assessing the correlation of standard ECG findings with echocardiography and CTPA signs of RVD, with the anatomic severity of the pulmonary vascular obstruction, and with the degree of hypoxemia, in hemodynamically stable patients with PE. Secondary objectives were determining if ECG could accurately predict RVD, and determining the interobserver agreement for the ECG score.
Patients and Methods
Patients and Study Design
We recently carried out a prospective, descriptive, single‐center follow‐up study to assess the prevalence of RVD and pulmonary hypertension (PH) in PE patients who presented with hemodynamic stability.7 We herein analyze ECG findings in these cases. The present, noninterventional study was approved by our institution's review board. The population studied included consecutive patients presenting with PE to our emergency room. Inclusion criteria were age >18 years and PE confirmed by CTPA. Exclusion criteria were high‐risk PE (presence of 2 consecutive systolic blood pressure measurements <90 mm Hg, measured >15 minutes apart or requiring inotropic support); comorbidity predictive of a 6‐month mortality >50% (eg, metastatic cancer or end‐stage respiratory or heart disease); creatinine clearance <35 mL/minute; or allergy to ionidated contrast media. All the patients gave informed consent to participate in the study.
Protocol
Initial assessment included clinical history, physical examination, ECG, arterial blood gas analysis, echocardiography, CTPA, and lower‐limb venous ultrasonography. All included individuals were treated with anticoagulation, and fibrinolytic therapy was not used.
ECG
A standard 12‐lead ECG was promptly obtained for all patients in the emergency room. We used the scoring system described by Daniel et al.8 (Table 1). This score is based on 4 signs that were previously found to be associated with high‐risk PE: tachycardia, incomplete or complete right bundle branch block, T wave inversion, and S1Q3T3 pattern. Two investigators trained in the interpretation of ECG results scored the ECG independently, and were blinded to patient clinical status and to echocardiography and CTPA findings.
| Characteristics | Score |
|---|---|
| |
| Tachycardia (>100 beats/min) | 2 |
| Incomplete right bundle‐branch block | 2 |
| Complete right bundle‐branch block | 3 |
| T‐wave inversion in lead V1 through V4 | 4 |
| T wave inversion in lead V1* | |
| <1 mm | 0 |
| 12 mm | 1 |
| >2 mm | 2 |
| T wave inversion in lead V2* | |
| <1 mm | 1 |
| 12 mm | 2 |
| >2 mm | 3 |
| T wave inversion in lead V3* | |
| <1 mm | 1 |
| 12 mm | 2 |
| >2 mm | 3 |
| S wave in lead 1 | 0 |
| Q wave in lead 3 | 1 |
| Inverted T wave in lead 3 | 1 |
| If all S1Q3T3, add | 2 |
| Total score (maximum: 21) | |
Echocardiography
The study was done as soon as possible after admission using a SONOS 5500 (Hewlett Packard, Palo Alto, CA) ultrasound imaging system with a S4 transducer. In all cases M‐mode, 2‐dimensional, Doppler (continuous and pulsed wave), and color Doppler was performed with the patient in the left lateral position. The structure of the mitral, aortic, tricuspid, and pulmonary valves (different grades of regurgitation and stenosis were assessed), and the systolic and diastolic function of the left ventricle (LV) were systematically assessed.
We assessed if patients had either RVD or isolated PH. Individuals with at least 1 of the following findings were diagnosed as having RVD: right ventricle (RV) hypokinesis (asymmetrical or delayed contraction, usually in the RV base), paradoxical septal systolic motion or right ventricular dilatation (end‐diastolic diameter > 30 mm or right to left ventricular end‐diastolic diameter ratio 1 in the apical 4‐chamber view); PH was defined as pulmonary arterial systolic pressure (PASP) > 40 mm Hg.9 PASP was derived from the right atrioventricular pressure gradient, using peak velocity of tricuspid flow regurgitation with continuous wave Doppler in the apical 4‐chamber view and the modified Bernoulli equation.10 Right atrial pressure was considered equal to 5 mm Hg or 10 mm Hg, according to whether the inferior vena cava collapsed during inspiration, respectively.11
Computed Tomographic Pulmonary Angiography
All CTPAs were performed within 6 hours of patient arrival to the emergency room. Nonionic contrast (100 mL) was administered intravenously at an injection rate of 2.5 mL/second for 40 seconds. Images were obtained on the same single‐detector scanner (Somatron PQ 2000S; Picker International, Cleveland, OH). If possible, scanning was performed during a 32‐second breath hold. If patients were dyspneic, spiral CT angiography was performed during shallow breathing. The scans were obtained using 125 mA and 130 kV. A 5 mm/second table feed was used to scan a 16‐cm volume in the craniocaudal direction (pitch of 1.5). An imaging delay of 20 seconds was used, and overlapping images were reconstructed every 1.5 mm and viewed on films at lung and mediastinal settings.
PE was diagnosed by the on‐duty radiologist if an intraluminal filling defect was seen. For the purpose of the study, the images were reviewed by a senior radiologist. The pulmonary obstruction index was determined according to Qanadli et al.12 The RV to LV diameter ratio was obtained by computing the ratio between the widths of the right and the left ventricular cavities assessed on axial images obtained at the plane of maximal distance between the ventricular endocardial free wall and the interventricular septum, perpendicular to the long axis. A RV/LV ratio > 1 was accepted as suggestive of RV dysfunction. The diameter of the main pulmonary artery (PA) was measured just before the division into its 2 main branches.
Definition of Clinical Endpoints
Primary outcome measures were the prevalence of echocardiography‐assessed RVD or PH at diagnosis, the prevalence of CTPA signs of RVD, the CTPA‐measured severity of the pulmonary vascular obstruction, and the degree of hypoxemia.
Statistical Analysis
Normal distribution of data was assessed using the D'agostino‐Pearson test. Data are shown as mean standard deviation (for normally distributed data) or median (interquartile range) (for non‐normally distributed data). Comparisons between different groups were made using unpaired t test or Wilcoxon rank‐sum test, as appropriate. Correlation between the ECG score and the different variables measured was assessed using Spearman's rank correlation coefficient. Receiver operating characteristic (ROC) curves were constructed to assess the value of ECG score to predict echocardiography or CTPA‐detected RVD. Kappa measurement was performed to examine the interobserver agreement for the ECG score. A 2‐tailed value of P < 0.05 was considered significant.
Results
A total of 103 patients were included in the study (mean age = 69 15 years). One patient died from fatal PE soon after the diagnosis, before echocardiography could be performed. During the 6‐month follow‐up, one patient died from septic shock and another suffered a thromboembolic recurrence (deep vein thrombosis). Echocardiography‐assessed RVD was found in 25 cases (24.5%) and isolated pulmonary hypertension in 20 (19.6%). Median value of the vascular obstruction index was 43.8% (25‐65). Thirty‐three patients (32%) had signs of RVD in CTPA.
Median value of ECG score was 2.5 (1‐6). The level of interobserver agreement regarding ECG score was substantial ( = 0.80). Table 2 shows correlation between ECG score and echocardiography, arterial blood gases, and CTPA parameters. ECG correlated significantly with all the variables measured. Correlation was higher for the vascular obstruction index and the RV/LV ratio, measured with echocardiography. ECG scores were significantly different for groups with varying degrees of severity of PE. Table 3 shows the ECG scores for patients grouped according to different criteria of severity of the disease.
| Variable | R (95% CI) | P |
|---|---|---|
| ||
| Vascular obstruction index | 0.41 (0.220.57) | <0.001 |
| PASP | 0.31 (0.090.49) | 0.006 |
| pO2(A‐a) | 0.29 (0.080.47) | 0.007 |
| PA diameter | 0.28 (0.070.47) | 0.011 |
| RV/LV ratio (echocardiography) | 0.42 (0.220.57) | <0.001 |
| RV/LV ratio (CTPA) | 0.36 (0.130.56) | 0.004 |
| Criteria | ECG score | P |
|---|---|---|
| ||
| RVD (echocardiography) present | 10 [615] | <0.0001 |
| RVD (echocardiography) absent | 2 [04] | |
| PH (echocardiography) present | 6 [1.7512.00] | 0.029 |
| PH (echocardiography) absent | 2 [04] | |
| RVD (CTPA) present | 6 [311] | 0.0015 |
| RVD (CTPA) absent | 2 [13] | |
| Vascular obstruction score >50% | 7 [211] | 0.0005 |
| Vascular obstruction score 50% | 2 [03] | |
| PaO2 < 60 mmHg | 4 [1.252.75] | 0.015 |
| PaO2 60 mmHg | 2 [14] | |
| Bilateral PE | 5 [111] | 0.028 |
| Unilateral PE | 2 [0.754.00] | |
| Central PE | 4 [210] | 0.0011 |
| Peripheral PE | 2 [03] | |
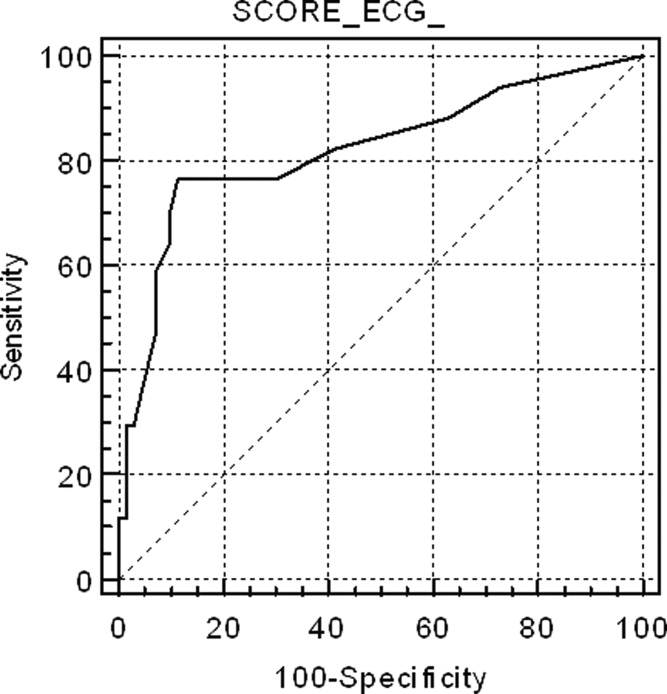
Figure 1 shows the ROC curve for the ECG score and the presence of echocardiography‐detected RVD. Area under the ROC curve was 0.82 (95% confidence interval [CI]: 0.72‐0.89). A cut‐off point of 6 for the ECG score showed the highest accuracy for detecting RVD; sensitivity = 76.5% (95% CI: 50.1‐93.0), specificity = 88.6% (95% CI: 78.7‐94.9), positive likelihood ratio (+LR) = 6.69, negative likelihood ratio (LR) = 0.37. If the ECG score was to be used as a screening method to exclude RVD, a cut‐off point of 0 showed sensitivity = 94.1% (95% CI: 71.2‐99.0), specificity = 27.1% (95% CI: 17.2‐39.1), +LR = 1.29, LR = 0.22. If the ECG score was considered for confirming RVD, the more useful value was 9; sensitivity = 58.8% (95% CI: 33.0‐81.5), specificity = 92.0% (95% CI: 84.1‐97.6), +LR = 8.23, LR = 0.44. Area under the ROC curve to predict CTPA‐detected RVD was slightly lower than for echocardiography: 0.74 (95% CI: 0.61‐0.84).

Discussion
This study shows that a simple, easy‐to‐use ECG scoring system correlates well with the severity of PE, assessed by different methods, in hemodynamically stable patients. Interobserver agreement regarding the scoring system was substantial. Several previous studies have found that ECG signs of RV strain correlate with the presence of RVD.6, 1316 However, some of these studies are limited by a retrospective design that could lead to selection bias or by the inclusion of relatively few (eg, <100) cases.6, 13, 14 Moreover, only a few of these articles have specifically examined patients with normal blood pressure.6, 15 Although our study is still small, one of its strengths is that it prospectively recruited a population of consecutive, normotensive patients and both echocardiography and CTPA were systematically performed. Classifying cases with normal blood pressure by severity is particularly relevant, because of the uncertainty about best treatment when hemodynamic instability is not present. These patients who are not at high risk for PE can be further stratified according to the presence of RVD and/or myocardial injury into intermediate‐risk and low‐risk PE.17 Early hospital discharge or initial outpatient treatment might be considered in low‐risk patients.17, 18 However, echocardiography can be difficult to perform in the emergency setting. Also, the presence of RVD is not easy to predict on clinical grounds. Our study suggests that a standard 12‐lead ECG can be useful to prioritize patients for more exhaustive monitoring or additional risk stratifying tests. An ECG score of 0 would exclude RVD with enough sensitivity to avoid getting an echocardiogram in these cases. On the other hand, a score 9 would suggest the possibility that RVD was present, and an echocardiography ought to be considered in these patients.
Previous studies regarding correlation between ECG and anatomic extension of the pulmonary vascular obstruction in PE have revealed conflicting data. Iles et al. found that ECG score identified those patients with the greatest percentage of perfusion defect on ventilation/perfusion scan.19 However, Kanbay et al. did not find significant differences in ECG scores for patients with pulmonary vascular obstruction scores <50% or 50%, also assessed with ventilation/perfusion scan.20 Subramaniam et al. used CTPA to assess clot burden score, and they did not see a significant association between ECG score and the anatomic severity of PE.21 This study found a significant association between higher ECG score and a more severe vascular obstruction index. This finding might have potential clinical implications, because some reports suggest that a higher CTPA‐measured clot load score can be associated with poorer outcome in PE.22 However, the utility of CTPA scores of vascular obstruction severity as a marker of clinical evolution is controversial, and several other authors have found that these scores are poor predictors of mortality or adverse outcome events.23, 24 Therefore, the positive correlation between ECG and the vascular obstruction index in our study is interesting mainly in the sense that it independently supports the validity of the ECG score as a marker of a potentially more severe PE.
In this study, we have not systematically excluded patients with comorbidities (eg, chronic obstructive pulmonary disease) that could account for RVD or PH. Our intention was to reflect a real‐life clinical scenario. When a patient attends the emergency room with PE, clinical decisions must usually be taken without complete information on comorbidities that may contribute to the existence of RV overload. Also, these subjects have a reduced cardiorespiratory reserve, and the PE might impose an unbearable strain to the RV, so risk stratification is especially important. Therefore, we felt that the study should include all patients presenting with PE, so that the results can be extrapolated to usual clinical practice.
Our results suggest that, by selecting the appropriate cut‐off value, the ECG score can be used with adequate sensitivity and specificity to exclude and confirm, respectively, RVD in hemodynamically stable PE patients. This finding implies that ECG may be useful to design management strategies in these cases, selecting patients that may benefit from further tests.
There are some limitations for the present study. Echocardiography was not immediately performed after the ECG. Thus, we might have missed some patients who presented with transient RVD, which resolved between tests. It is likely that the correlation between ECG and echocardiography would have improved if this delay had been avoided. Also, we did not use a multidetector scanner for performing CTPAs. Consequently, small emboli might have been missed and the clot score might have been underestimated. It is plausible that this may have reduced to some extent the correlation between ECG and CTPA. Also, this a single‐center study, with relatively few patients studied. Finally, due to the low incidence of adverse events in our patients, our study is underpowered to make conclusions about the independent prognostic value of ECG for predicting adverse events.
In conclusion, an easy‐to‐use ECG score correlates significantly with the severity of PE, as assessed with echocardiography, CTPA, and arterial blood gas analysis, in normotensive patients. It can be used to predict with acceptable sensitivity and specificity the presence of RVD in these cases and, accordingly, it has potential value in risk‐stratification strategies. Larger, multicenter studies, should confirm these results before they can be applied to clinical practice.
- ,,.Acute pulmonary embolism: clinical outcomes in the International Cooperative Pulmonary Embolism Registry (ICOPER).Lancet.1999;353:1386–1389.
- ,,,.Thrombolysis compared with heparin for the initial treatment of pulmonary embolism. A meta‐analysis of the randomized controlled trials.Circulation.2004;110:744–749.
- ,,, et al.Management strategies and determinants of outcome in acute major pulmonary embolism: results of a multicenter registry.J Am Coll Cardiol.1997;30:1165–1171
- ,,,,.Prognostic value of echocardiographycally assessed right ventricular dysfunction in patients with pulmonary embolism.Arch Intern Med.2004;164:1685–1689.
- ,,, et al.Right ventricular enlargement on chest computed tomography. A predictor of early death in acute pulmonary embolism.Circulation.2004;110:3276–3280.
- ,,,.Role of electrocardiography in identifying right ventricular dysfunction in acute pulmonary embolism.Am J Cardiol.2005;96:450–452.
- ,,, et al.Right ventricle dysfunction and pulmonary hypertension in hemodynamically stable pulmonary embolism.Respir Med.2010;104:1370–1376.
- ,,.Assessment of cardiac stress from massive pulmonary embolism with 12‐lead ECG.Chest.2001;120:474–481.
- ,,, et al.Clinical correlates and reference intervals for pulmonary artery systolic pressure among echocardiographically normal subjects.Circulation.2001;104:2797–2802.
- ,,, et al.Quantitative assessment of pulmonary hypertension in patients with tricuspid regurgitation using continuous wave Doppler ultrasound.J Am Coll Cardiol.1985;6:359–365.
- ,,.Noninvasive estimation of right atrial pressure from the inspiratory collapse of the inferior vena cava.Am J Cardiol.1990;66:493–496.
- ,,, et al.New CT index to quantify arterial obstruction in pulmonary embolism: comparison with angiographic index and echocardiography.AJR Am J Roentgenol.2001;176:1415–1420.
- ,,.Electrocardiographic score and short‐term outcomes of acute pulmonary embolism.Am J Cardiol.2007;100:1172–1176.
- ,,, et al.Is it possible to use standard electrocardiography for risk assessment of patients with pulmonary embolism?Kardiol Pol.2009;67:744–750.
- ,,, et al.Prognostic value of ECG among patients with acute pulmonary embolism and normal blood pressure.Am J Med.2009;122:257–264.
- ,,,,.QR in V1‐an ECG sign associated with right ventricular strain and adverse clinical outcome in pulmonary embolism.Eur Heart J.2003;24:1113–1119.
- ,,, et al.Guidelines on the diagnosis and management of acute pulmonary embolism. The Task Force for the Diagnosis and Management of Acute Pulmonary Embolism of the European Society of Cardiology (ESC).Eur Heart J.2008;29:2276–2315.
- .Acute pulmonary embolism.N Eng J Med.2008;359:2804–2813.
- ,,,,.ECG score predicts those with the greatest percentage of perfusion defects due to acute pulmonary thromboembolic disease.Chest.2004;125:1651–1656.
- ,,, et al.Electrocardiography and Wells scoring in predicting the anatomic severity of pulmonary embolism.Respir Med.2007;101:1171–1176.
- ,,, et al.Pulmonary embolism outcome: a prospective evaluation of CT pulmonary angiographic clot burden score and ECG score.AJR Am J Roentgenol.2008;190:1599–1604.
- ,,, et al.Right ventricular dysfunction and pulmonary obstruction index at helical CT: prediction of clinical outcome during 3‐month follow‐up in patients with acute pulmonary embolism.Radiology.2005;235:798–803.
- ,,,,.Acute PE mortality prediction by analysis of helical computed tomography angiography and hemodynamic evaluation.Thorax.2005;60:956–961.
- ,,,,.Pulmonary embolism: prognostic CT findings.Radiology.2007;242:889–893.
The clinical outcome of patients with pulmonary embolism (PE) has a wide spectrum, ranging from a benign course, with early resolution of symptoms, to death. Prognostic stratification of patients with PE is therefore essential to guide therapy. Currently, this stratification is primarily based on blood pressure on admission. Hemodynamic instability or shock carries a bad prognosis, and is associated with a 3‐fold to 7‐fold increase in mortality.1 Thrombolytic therapy is warranted in these cases.2 There is a subset of patients that, despite normal blood pressure on presentation, can subsequently suffer hemodynamic deterioration and death.3
Echocardiography has been proposed as a useful tool to identify a subset of patients at a higher risk. It has been suggested that the finding of right ventricle dysfunction (RVD) in echocardiography predicts a worse prognosis, even in patients with normal blood pressure on presentation.4 Also, computed tomography pulmonary angiography (CTPA) is increasingly used as the main test to diagnose PE. This technique can also assess the degree of pulmonary arterial obstruction and the presence of signs suggestive of RVD. It has been suggested that CTPA findings can predict outcome in PE.5
Electrocardiography (ECG) has a widespread use and is routinely carried out and interpreted in the emergency room. Some ECG findings in patients with PE are suggestive of right ventricular strain and might therefore be used to prioritize cases that require closer monitoring.6
This study was designed with the objectives of assessing the correlation of standard ECG findings with echocardiography and CTPA signs of RVD, with the anatomic severity of the pulmonary vascular obstruction, and with the degree of hypoxemia, in hemodynamically stable patients with PE. Secondary objectives were determining if ECG could accurately predict RVD, and determining the interobserver agreement for the ECG score.
Patients and Methods
Patients and Study Design
We recently carried out a prospective, descriptive, single‐center follow‐up study to assess the prevalence of RVD and pulmonary hypertension (PH) in PE patients who presented with hemodynamic stability.7 We herein analyze ECG findings in these cases. The present, noninterventional study was approved by our institution's review board. The population studied included consecutive patients presenting with PE to our emergency room. Inclusion criteria were age >18 years and PE confirmed by CTPA. Exclusion criteria were high‐risk PE (presence of 2 consecutive systolic blood pressure measurements <90 mm Hg, measured >15 minutes apart or requiring inotropic support); comorbidity predictive of a 6‐month mortality >50% (eg, metastatic cancer or end‐stage respiratory or heart disease); creatinine clearance <35 mL/minute; or allergy to ionidated contrast media. All the patients gave informed consent to participate in the study.
Protocol
Initial assessment included clinical history, physical examination, ECG, arterial blood gas analysis, echocardiography, CTPA, and lower‐limb venous ultrasonography. All included individuals were treated with anticoagulation, and fibrinolytic therapy was not used.
ECG
A standard 12‐lead ECG was promptly obtained for all patients in the emergency room. We used the scoring system described by Daniel et al.8 (Table 1). This score is based on 4 signs that were previously found to be associated with high‐risk PE: tachycardia, incomplete or complete right bundle branch block, T wave inversion, and S1Q3T3 pattern. Two investigators trained in the interpretation of ECG results scored the ECG independently, and were blinded to patient clinical status and to echocardiography and CTPA findings.
| Characteristics | Score |
|---|---|
| |
| Tachycardia (>100 beats/min) | 2 |
| Incomplete right bundle‐branch block | 2 |
| Complete right bundle‐branch block | 3 |
| T‐wave inversion in lead V1 through V4 | 4 |
| T wave inversion in lead V1* | |
| <1 mm | 0 |
| 12 mm | 1 |
| >2 mm | 2 |
| T wave inversion in lead V2* | |
| <1 mm | 1 |
| 12 mm | 2 |
| >2 mm | 3 |
| T wave inversion in lead V3* | |
| <1 mm | 1 |
| 12 mm | 2 |
| >2 mm | 3 |
| S wave in lead 1 | 0 |
| Q wave in lead 3 | 1 |
| Inverted T wave in lead 3 | 1 |
| If all S1Q3T3, add | 2 |
| Total score (maximum: 21) | |
Echocardiography
The study was done as soon as possible after admission using a SONOS 5500 (Hewlett Packard, Palo Alto, CA) ultrasound imaging system with a S4 transducer. In all cases M‐mode, 2‐dimensional, Doppler (continuous and pulsed wave), and color Doppler was performed with the patient in the left lateral position. The structure of the mitral, aortic, tricuspid, and pulmonary valves (different grades of regurgitation and stenosis were assessed), and the systolic and diastolic function of the left ventricle (LV) were systematically assessed.
We assessed if patients had either RVD or isolated PH. Individuals with at least 1 of the following findings were diagnosed as having RVD: right ventricle (RV) hypokinesis (asymmetrical or delayed contraction, usually in the RV base), paradoxical septal systolic motion or right ventricular dilatation (end‐diastolic diameter > 30 mm or right to left ventricular end‐diastolic diameter ratio 1 in the apical 4‐chamber view); PH was defined as pulmonary arterial systolic pressure (PASP) > 40 mm Hg.9 PASP was derived from the right atrioventricular pressure gradient, using peak velocity of tricuspid flow regurgitation with continuous wave Doppler in the apical 4‐chamber view and the modified Bernoulli equation.10 Right atrial pressure was considered equal to 5 mm Hg or 10 mm Hg, according to whether the inferior vena cava collapsed during inspiration, respectively.11
Computed Tomographic Pulmonary Angiography
All CTPAs were performed within 6 hours of patient arrival to the emergency room. Nonionic contrast (100 mL) was administered intravenously at an injection rate of 2.5 mL/second for 40 seconds. Images were obtained on the same single‐detector scanner (Somatron PQ 2000S; Picker International, Cleveland, OH). If possible, scanning was performed during a 32‐second breath hold. If patients were dyspneic, spiral CT angiography was performed during shallow breathing. The scans were obtained using 125 mA and 130 kV. A 5 mm/second table feed was used to scan a 16‐cm volume in the craniocaudal direction (pitch of 1.5). An imaging delay of 20 seconds was used, and overlapping images were reconstructed every 1.5 mm and viewed on films at lung and mediastinal settings.
PE was diagnosed by the on‐duty radiologist if an intraluminal filling defect was seen. For the purpose of the study, the images were reviewed by a senior radiologist. The pulmonary obstruction index was determined according to Qanadli et al.12 The RV to LV diameter ratio was obtained by computing the ratio between the widths of the right and the left ventricular cavities assessed on axial images obtained at the plane of maximal distance between the ventricular endocardial free wall and the interventricular septum, perpendicular to the long axis. A RV/LV ratio > 1 was accepted as suggestive of RV dysfunction. The diameter of the main pulmonary artery (PA) was measured just before the division into its 2 main branches.
Definition of Clinical Endpoints
Primary outcome measures were the prevalence of echocardiography‐assessed RVD or PH at diagnosis, the prevalence of CTPA signs of RVD, the CTPA‐measured severity of the pulmonary vascular obstruction, and the degree of hypoxemia.
Statistical Analysis
Normal distribution of data was assessed using the D'agostino‐Pearson test. Data are shown as mean standard deviation (for normally distributed data) or median (interquartile range) (for non‐normally distributed data). Comparisons between different groups were made using unpaired t test or Wilcoxon rank‐sum test, as appropriate. Correlation between the ECG score and the different variables measured was assessed using Spearman's rank correlation coefficient. Receiver operating characteristic (ROC) curves were constructed to assess the value of ECG score to predict echocardiography or CTPA‐detected RVD. Kappa measurement was performed to examine the interobserver agreement for the ECG score. A 2‐tailed value of P < 0.05 was considered significant.
Results
A total of 103 patients were included in the study (mean age = 69 15 years). One patient died from fatal PE soon after the diagnosis, before echocardiography could be performed. During the 6‐month follow‐up, one patient died from septic shock and another suffered a thromboembolic recurrence (deep vein thrombosis). Echocardiography‐assessed RVD was found in 25 cases (24.5%) and isolated pulmonary hypertension in 20 (19.6%). Median value of the vascular obstruction index was 43.8% (25‐65). Thirty‐three patients (32%) had signs of RVD in CTPA.
Median value of ECG score was 2.5 (1‐6). The level of interobserver agreement regarding ECG score was substantial ( = 0.80). Table 2 shows correlation between ECG score and echocardiography, arterial blood gases, and CTPA parameters. ECG correlated significantly with all the variables measured. Correlation was higher for the vascular obstruction index and the RV/LV ratio, measured with echocardiography. ECG scores were significantly different for groups with varying degrees of severity of PE. Table 3 shows the ECG scores for patients grouped according to different criteria of severity of the disease.
| Variable | R (95% CI) | P |
|---|---|---|
| ||
| Vascular obstruction index | 0.41 (0.220.57) | <0.001 |
| PASP | 0.31 (0.090.49) | 0.006 |
| pO2(A‐a) | 0.29 (0.080.47) | 0.007 |
| PA diameter | 0.28 (0.070.47) | 0.011 |
| RV/LV ratio (echocardiography) | 0.42 (0.220.57) | <0.001 |
| RV/LV ratio (CTPA) | 0.36 (0.130.56) | 0.004 |
| Criteria | ECG score | P |
|---|---|---|
| ||
| RVD (echocardiography) present | 10 [615] | <0.0001 |
| RVD (echocardiography) absent | 2 [04] | |
| PH (echocardiography) present | 6 [1.7512.00] | 0.029 |
| PH (echocardiography) absent | 2 [04] | |
| RVD (CTPA) present | 6 [311] | 0.0015 |
| RVD (CTPA) absent | 2 [13] | |
| Vascular obstruction score >50% | 7 [211] | 0.0005 |
| Vascular obstruction score 50% | 2 [03] | |
| PaO2 < 60 mmHg | 4 [1.252.75] | 0.015 |
| PaO2 60 mmHg | 2 [14] | |
| Bilateral PE | 5 [111] | 0.028 |
| Unilateral PE | 2 [0.754.00] | |
| Central PE | 4 [210] | 0.0011 |
| Peripheral PE | 2 [03] | |
Figure 1 shows the ROC curve for the ECG score and the presence of echocardiography‐detected RVD. Area under the ROC curve was 0.82 (95% confidence interval [CI]: 0.72‐0.89). A cut‐off point of 6 for the ECG score showed the highest accuracy for detecting RVD; sensitivity = 76.5% (95% CI: 50.1‐93.0), specificity = 88.6% (95% CI: 78.7‐94.9), positive likelihood ratio (+LR) = 6.69, negative likelihood ratio (LR) = 0.37. If the ECG score was to be used as a screening method to exclude RVD, a cut‐off point of 0 showed sensitivity = 94.1% (95% CI: 71.2‐99.0), specificity = 27.1% (95% CI: 17.2‐39.1), +LR = 1.29, LR = 0.22. If the ECG score was considered for confirming RVD, the more useful value was 9; sensitivity = 58.8% (95% CI: 33.0‐81.5), specificity = 92.0% (95% CI: 84.1‐97.6), +LR = 8.23, LR = 0.44. Area under the ROC curve to predict CTPA‐detected RVD was slightly lower than for echocardiography: 0.74 (95% CI: 0.61‐0.84).
Discussion
This study shows that a simple, easy‐to‐use ECG scoring system correlates well with the severity of PE, assessed by different methods, in hemodynamically stable patients. Interobserver agreement regarding the scoring system was substantial. Several previous studies have found that ECG signs of RV strain correlate with the presence of RVD.6, 1316 However, some of these studies are limited by a retrospective design that could lead to selection bias or by the inclusion of relatively few (eg, <100) cases.6, 13, 14 Moreover, only a few of these articles have specifically examined patients with normal blood pressure.6, 15 Although our study is still small, one of its strengths is that it prospectively recruited a population of consecutive, normotensive patients and both echocardiography and CTPA were systematically performed. Classifying cases with normal blood pressure by severity is particularly relevant, because of the uncertainty about best treatment when hemodynamic instability is not present. These patients who are not at high risk for PE can be further stratified according to the presence of RVD and/or myocardial injury into intermediate‐risk and low‐risk PE.17 Early hospital discharge or initial outpatient treatment might be considered in low‐risk patients.17, 18 However, echocardiography can be difficult to perform in the emergency setting. Also, the presence of RVD is not easy to predict on clinical grounds. Our study suggests that a standard 12‐lead ECG can be useful to prioritize patients for more exhaustive monitoring or additional risk stratifying tests. An ECG score of 0 would exclude RVD with enough sensitivity to avoid getting an echocardiogram in these cases. On the other hand, a score 9 would suggest the possibility that RVD was present, and an echocardiography ought to be considered in these patients.
Previous studies regarding correlation between ECG and anatomic extension of the pulmonary vascular obstruction in PE have revealed conflicting data. Iles et al. found that ECG score identified those patients with the greatest percentage of perfusion defect on ventilation/perfusion scan.19 However, Kanbay et al. did not find significant differences in ECG scores for patients with pulmonary vascular obstruction scores <50% or 50%, also assessed with ventilation/perfusion scan.20 Subramaniam et al. used CTPA to assess clot burden score, and they did not see a significant association between ECG score and the anatomic severity of PE.21 This study found a significant association between higher ECG score and a more severe vascular obstruction index. This finding might have potential clinical implications, because some reports suggest that a higher CTPA‐measured clot load score can be associated with poorer outcome in PE.22 However, the utility of CTPA scores of vascular obstruction severity as a marker of clinical evolution is controversial, and several other authors have found that these scores are poor predictors of mortality or adverse outcome events.23, 24 Therefore, the positive correlation between ECG and the vascular obstruction index in our study is interesting mainly in the sense that it independently supports the validity of the ECG score as a marker of a potentially more severe PE.
In this study, we have not systematically excluded patients with comorbidities (eg, chronic obstructive pulmonary disease) that could account for RVD or PH. Our intention was to reflect a real‐life clinical scenario. When a patient attends the emergency room with PE, clinical decisions must usually be taken without complete information on comorbidities that may contribute to the existence of RV overload. Also, these subjects have a reduced cardiorespiratory reserve, and the PE might impose an unbearable strain to the RV, so risk stratification is especially important. Therefore, we felt that the study should include all patients presenting with PE, so that the results can be extrapolated to usual clinical practice.
Our results suggest that, by selecting the appropriate cut‐off value, the ECG score can be used with adequate sensitivity and specificity to exclude and confirm, respectively, RVD in hemodynamically stable PE patients. This finding implies that ECG may be useful to design management strategies in these cases, selecting patients that may benefit from further tests.
There are some limitations for the present study. Echocardiography was not immediately performed after the ECG. Thus, we might have missed some patients who presented with transient RVD, which resolved between tests. It is likely that the correlation between ECG and echocardiography would have improved if this delay had been avoided. Also, we did not use a multidetector scanner for performing CTPAs. Consequently, small emboli might have been missed and the clot score might have been underestimated. It is plausible that this may have reduced to some extent the correlation between ECG and CTPA. Also, this a single‐center study, with relatively few patients studied. Finally, due to the low incidence of adverse events in our patients, our study is underpowered to make conclusions about the independent prognostic value of ECG for predicting adverse events.
In conclusion, an easy‐to‐use ECG score correlates significantly with the severity of PE, as assessed with echocardiography, CTPA, and arterial blood gas analysis, in normotensive patients. It can be used to predict with acceptable sensitivity and specificity the presence of RVD in these cases and, accordingly, it has potential value in risk‐stratification strategies. Larger, multicenter studies, should confirm these results before they can be applied to clinical practice.
- ,,.Acute pulmonary embolism: clinical outcomes in the International Cooperative Pulmonary Embolism Registry (ICOPER).Lancet.1999;353:1386–1389.
- ,,,.Thrombolysis compared with heparin for the initial treatment of pulmonary embolism. A meta‐analysis of the randomized controlled trials.Circulation.2004;110:744–749.
- ,,, et al.Management strategies and determinants of outcome in acute major pulmonary embolism: results of a multicenter registry.J Am Coll Cardiol.1997;30:1165–1171
- ,,,,.Prognostic value of echocardiographycally assessed right ventricular dysfunction in patients with pulmonary embolism.Arch Intern Med.2004;164:1685–1689.
- ,,, et al.Right ventricular enlargement on chest computed tomography. A predictor of early death in acute pulmonary embolism.Circulation.2004;110:3276–3280.
- ,,,.Role of electrocardiography in identifying right ventricular dysfunction in acute pulmonary embolism.Am J Cardiol.2005;96:450–452.
- ,,, et al.Right ventricle dysfunction and pulmonary hypertension in hemodynamically stable pulmonary embolism.Respir Med.2010;104:1370–1376.
- ,,.Assessment of cardiac stress from massive pulmonary embolism with 12‐lead ECG.Chest.2001;120:474–481.
- ,,, et al.Clinical correlates and reference intervals for pulmonary artery systolic pressure among echocardiographically normal subjects.Circulation.2001;104:2797–2802.
- ,,, et al.Quantitative assessment of pulmonary hypertension in patients with tricuspid regurgitation using continuous wave Doppler ultrasound.J Am Coll Cardiol.1985;6:359–365.
- ,,.Noninvasive estimation of right atrial pressure from the inspiratory collapse of the inferior vena cava.Am J Cardiol.1990;66:493–496.
- ,,, et al.New CT index to quantify arterial obstruction in pulmonary embolism: comparison with angiographic index and echocardiography.AJR Am J Roentgenol.2001;176:1415–1420.
- ,,.Electrocardiographic score and short‐term outcomes of acute pulmonary embolism.Am J Cardiol.2007;100:1172–1176.
- ,,, et al.Is it possible to use standard electrocardiography for risk assessment of patients with pulmonary embolism?Kardiol Pol.2009;67:744–750.
- ,,, et al.Prognostic value of ECG among patients with acute pulmonary embolism and normal blood pressure.Am J Med.2009;122:257–264.
- ,,,,.QR in V1‐an ECG sign associated with right ventricular strain and adverse clinical outcome in pulmonary embolism.Eur Heart J.2003;24:1113–1119.
- ,,, et al.Guidelines on the diagnosis and management of acute pulmonary embolism. The Task Force for the Diagnosis and Management of Acute Pulmonary Embolism of the European Society of Cardiology (ESC).Eur Heart J.2008;29:2276–2315.
- .Acute pulmonary embolism.N Eng J Med.2008;359:2804–2813.
- ,,,,.ECG score predicts those with the greatest percentage of perfusion defects due to acute pulmonary thromboembolic disease.Chest.2004;125:1651–1656.
- ,,, et al.Electrocardiography and Wells scoring in predicting the anatomic severity of pulmonary embolism.Respir Med.2007;101:1171–1176.
- ,,, et al.Pulmonary embolism outcome: a prospective evaluation of CT pulmonary angiographic clot burden score and ECG score.AJR Am J Roentgenol.2008;190:1599–1604.
- ,,, et al.Right ventricular dysfunction and pulmonary obstruction index at helical CT: prediction of clinical outcome during 3‐month follow‐up in patients with acute pulmonary embolism.Radiology.2005;235:798–803.
- ,,,,.Acute PE mortality prediction by analysis of helical computed tomography angiography and hemodynamic evaluation.Thorax.2005;60:956–961.
- ,,,,.Pulmonary embolism: prognostic CT findings.Radiology.2007;242:889–893.
Copyright © 2010 Society of Hospital Medicine