User login
Dedicated Texas Team Improves Quality of Care
I have been a hospitalist for eight years but joined SHM two and a half years ago at the encouragement of my sister, a hospitalist program director in New York. I am the chief of staff and have been the sole hospitalist at a rural Texas hospital since April of this year, as the other hospitalist was let go. I decided to be the only hospitalist for a while so that I would be able to take the responsibility on myself to improve core measures, decrease readmissions, etc. Quite honestly, it had been a challenge getting our core measures up, per CMS requirements, for a number of reasons (physicians, staff, etc.)
Through all that I have learned from SHM over the past two and a half years, I am pleased to report that we were the only hospital in a 100-mile radius to be at the 99th percentile on our Press Ganey scores and HCAPS. As a matter of fact, we scored 14th in the state of Texas.
It took a lot of dedication on all of our parts, including the RNs, MDs, and other hospital staff to make it happen, but we were determined to provide the quality of care our patients deserve—and we did it.
Thank you, SHM, for your leadership in striving for excellence!
I. Upendran, MD, chief of staff, East Texas Medical Center, Regional Healthcare System, Tyler, Texas
I have been a hospitalist for eight years but joined SHM two and a half years ago at the encouragement of my sister, a hospitalist program director in New York. I am the chief of staff and have been the sole hospitalist at a rural Texas hospital since April of this year, as the other hospitalist was let go. I decided to be the only hospitalist for a while so that I would be able to take the responsibility on myself to improve core measures, decrease readmissions, etc. Quite honestly, it had been a challenge getting our core measures up, per CMS requirements, for a number of reasons (physicians, staff, etc.)
Through all that I have learned from SHM over the past two and a half years, I am pleased to report that we were the only hospital in a 100-mile radius to be at the 99th percentile on our Press Ganey scores and HCAPS. As a matter of fact, we scored 14th in the state of Texas.
It took a lot of dedication on all of our parts, including the RNs, MDs, and other hospital staff to make it happen, but we were determined to provide the quality of care our patients deserve—and we did it.
Thank you, SHM, for your leadership in striving for excellence!
I. Upendran, MD, chief of staff, East Texas Medical Center, Regional Healthcare System, Tyler, Texas
I have been a hospitalist for eight years but joined SHM two and a half years ago at the encouragement of my sister, a hospitalist program director in New York. I am the chief of staff and have been the sole hospitalist at a rural Texas hospital since April of this year, as the other hospitalist was let go. I decided to be the only hospitalist for a while so that I would be able to take the responsibility on myself to improve core measures, decrease readmissions, etc. Quite honestly, it had been a challenge getting our core measures up, per CMS requirements, for a number of reasons (physicians, staff, etc.)
Through all that I have learned from SHM over the past two and a half years, I am pleased to report that we were the only hospital in a 100-mile radius to be at the 99th percentile on our Press Ganey scores and HCAPS. As a matter of fact, we scored 14th in the state of Texas.
It took a lot of dedication on all of our parts, including the RNs, MDs, and other hospital staff to make it happen, but we were determined to provide the quality of care our patients deserve—and we did it.
Thank you, SHM, for your leadership in striving for excellence!
I. Upendran, MD, chief of staff, East Texas Medical Center, Regional Healthcare System, Tyler, Texas
Six Ways You Can Help Reduce HAIs in Your Hospital
- Encourage good hand hygiene. This should be obvious, but hospitals are struggling to achieve compliance rates of even 50%. One study has found significant improvement by appealing to medical providers’ altruistic sense: “Hand hygiene prevents patients from catching diseases.”1
- Embrace checklists. If they work for airline pilots, they can work for you. Study after study has supported their effectiveness, particularly in preventing CLABSIs and CAUTIs when well-integrated into a multifaceted approach.
- Bundle up. A bundled approach that emphasized proper hand hygiene, disinfection, catheter avoidance, and timely removal cut CLABSI rates by morethan half, on average, in Veterans Administration ICUs throughout the U.S.2
- Team up. For a C. diff-reduction effort at Kaiser Permanente Medical Center in Santa Clara, Calif., success meant getting doctors, nurses, specialists, and administrators on board, both to brainstorm and to sustain momentum.
- Be a role model. Consistently following HAI-prevention protocols, such as contact precautions, can make adherence contagious—in a very good way.
- Be an innovator. By virtue of being ubiquitous in inpatient wards, hospitalists know what works and what doesn’t; your insight can be particularly valuable for a team-based, HAI-reduction effort.
References
- Grant AM, Hofmann DA. It’s not all about me: Motivating hospital hand hygiene by focusing on patients. Psychol Sci. 2011;22:1494-1499.
- Render ML, Hasselbeck R, Freyberg RW, Hofer TP, et al. Reduction of central line infections in Veterans Administration intensive care units: an observational cohort using a central infrastructure to support learning and improvement. BMJ Qual Saf. 2011;20(8):725-732.
- Encourage good hand hygiene. This should be obvious, but hospitals are struggling to achieve compliance rates of even 50%. One study has found significant improvement by appealing to medical providers’ altruistic sense: “Hand hygiene prevents patients from catching diseases.”1
- Embrace checklists. If they work for airline pilots, they can work for you. Study after study has supported their effectiveness, particularly in preventing CLABSIs and CAUTIs when well-integrated into a multifaceted approach.
- Bundle up. A bundled approach that emphasized proper hand hygiene, disinfection, catheter avoidance, and timely removal cut CLABSI rates by morethan half, on average, in Veterans Administration ICUs throughout the U.S.2
- Team up. For a C. diff-reduction effort at Kaiser Permanente Medical Center in Santa Clara, Calif., success meant getting doctors, nurses, specialists, and administrators on board, both to brainstorm and to sustain momentum.
- Be a role model. Consistently following HAI-prevention protocols, such as contact precautions, can make adherence contagious—in a very good way.
- Be an innovator. By virtue of being ubiquitous in inpatient wards, hospitalists know what works and what doesn’t; your insight can be particularly valuable for a team-based, HAI-reduction effort.
References
- Grant AM, Hofmann DA. It’s not all about me: Motivating hospital hand hygiene by focusing on patients. Psychol Sci. 2011;22:1494-1499.
- Render ML, Hasselbeck R, Freyberg RW, Hofer TP, et al. Reduction of central line infections in Veterans Administration intensive care units: an observational cohort using a central infrastructure to support learning and improvement. BMJ Qual Saf. 2011;20(8):725-732.
- Encourage good hand hygiene. This should be obvious, but hospitals are struggling to achieve compliance rates of even 50%. One study has found significant improvement by appealing to medical providers’ altruistic sense: “Hand hygiene prevents patients from catching diseases.”1
- Embrace checklists. If they work for airline pilots, they can work for you. Study after study has supported their effectiveness, particularly in preventing CLABSIs and CAUTIs when well-integrated into a multifaceted approach.
- Bundle up. A bundled approach that emphasized proper hand hygiene, disinfection, catheter avoidance, and timely removal cut CLABSI rates by morethan half, on average, in Veterans Administration ICUs throughout the U.S.2
- Team up. For a C. diff-reduction effort at Kaiser Permanente Medical Center in Santa Clara, Calif., success meant getting doctors, nurses, specialists, and administrators on board, both to brainstorm and to sustain momentum.
- Be a role model. Consistently following HAI-prevention protocols, such as contact precautions, can make adherence contagious—in a very good way.
- Be an innovator. By virtue of being ubiquitous in inpatient wards, hospitalists know what works and what doesn’t; your insight can be particularly valuable for a team-based, HAI-reduction effort.
References
- Grant AM, Hofmann DA. It’s not all about me: Motivating hospital hand hygiene by focusing on patients. Psychol Sci. 2011;22:1494-1499.
- Render ML, Hasselbeck R, Freyberg RW, Hofer TP, et al. Reduction of central line infections in Veterans Administration intensive care units: an observational cohort using a central infrastructure to support learning and improvement. BMJ Qual Saf. 2011;20(8):725-732.
Why Surgeons Can Say “No”
Each day, hospitalists interact with a variety of specialists and sub‐specialists to provide consultative or procedural assistance in care of their patients. Physicians have a duty to practice beneficently and to simultaneously respect patients' autonomy.1 Whether to offer a treatment is a function of many variables, but when benefits approach zero, or when risks substantially outweigh benefits, physicians may justifiably withhold therapies without assent or consent of patients.2 The purpose of this article is to explore why it is accepted practice in the United States to permit unilateral withholding of some potentially life‐prolonging treatments (eg, surgery as the paradigm), while it is not common practice for other critical care procedures (eg, cardiopulmonary resuscitation [CPR]). We offer that these examples demonstrate the tension of 2 pillars of medical ethical conduct, namely beneficence and respect of autonomy.1
Consider 2 real cases that demonstrated a juxtaposition of diametrically opposing views of thoughtful, capable surgeons asked to provide life‐saving surgery to critically ill patients.
CASE 1
A 33‐year‐old man, with a history of obesity, presents with mild epigastric pain and hematemesis of a day's duration. Endoscopic evaluation demonstrates a deep gastric ulcer with visible vessel that is injected with epinephrine. He is transferred to the medical intensive care unit (ICU) for monitoring and has an uneventful first 24 hours. On his second hospital day, he develops severe epigastric pain of sudden onset, accompanied by light‐headedness. He is diaphoretic and dyspneic, sitting bolt upright. His body mass index (BMI) is 40 kg/m2, and his vital signs are: 130/min, 140/80 mmHg, 30/min, 99.0F. Examination is normal except for severe upper abdominal tenderness, absent bowel sounds, and voluntary guarding. Abdominal computed tomography demonstrates a perforation, free air, and a loculated collection adjacent to the original ulcer. He is treated with 4 liters of crystalloids, oxygen, and an emergent surgical consultation is performed. The examining surgeon confirms the diagnosis of acute perforation, but asserts that his operative risk of mortality, due to obesity, is excessive. He will never get off the ventilator. He advises watchful waiting. The medical intensivist believes the patient will die without surgery; he asks for a second opinion. A more senior colleague assesses the patient and reiterates the first surgeon's opinion. The intensivist begins preparations to transfer the patient to the nearest tertiary care center for a third opinion, when the surgeons reverse themselves. The patient is taken to surgery where the collection is removed, with partial gastrectomy. He is extubated in the recovery room, spends 12 hours in the ICU, and is transferred to the wards where he undergoes an uneventful recovery.
CASE 2
A 50‐year‐old man, with a history of end‐stage alcoholic cirrhosis, presents to the intensive care unit with respiratory embarrassment associated with tense ascites, complicated by pneumococcal pneumonia. He responds to antibiotics but has rapidly reaccumulating ascites, where large volume paracentesis (of 4‐5 liters of transudative fluid) is required every 3 to 4 days to promote weaning trials. On his 20th hospital day, the patient develops fulminant septic shock, and work‐up reveals free air in the abdomen. A Board‐certified critical care surgeon meets with the family and informs them that he is willing to attempt exploratory laparotomy, but that operative mortality exceeds 95%. However, he was willing to try because the alternative otherwise is >99% mortality. The family asks for surgery, which reveals a small perforation, but the patient dies shortly thereafter.
In both cases, patients were very likely, if not certain, to die without operative procedures. Equally certain, the (critical care) surgeon in the second case might find case 1s surgeons neglectful. And they might consider operating on case 2with >95% preoperative mortalitymalpractice.
WHY IS SURGERY DIFFERENT FROM CPR? BENEFICENCE VERSUS AUTONOMY MODELS
Why can surgeons withhold potentially life‐saving surgery, whereas most US physicianssurgeons or internistsdo not (routinely) unilaterally withhold CPR or mechanical ventilation?3 A variety of possible reasons may underlie this asymmetry. First, to compel a surgeon to cut another human against his/her judgment would violate the surgeon's autonomy. But why is the act of cutting viewed differently from the act of intubating and ventilating, or compressing and shocking? The bodily integrity of the patient is violated in both. Nobody would take issue with a surgeon who assesses a 2% chance of survival and so does not offer surgery. Yet physicians struggle often with patients/surrogates who demand CPR/mechanical ventilation for similar prognoses.4 In the United States, CPR has crept into general acceptance (ie, when the only other option is death) as a system‐wide default. In the case of surgery, the judgment of the physician is accepted both by patients and the medical establishment, whereas for CPRwith hypothetically identical consequencesthe patient must opt out. Neither model is right or wrong; but the focus in the balance of decision‐making (paternalism/beneficence vs autonomy) is different.
Albert Jonsen introduced the rule of rescue which suggests that we have an instinctive response to rescue the doomed.5 Surgeons can make the reasonable argument that, in some cases, surgery is only likely to hasten death, and so beneficence requires that they not provide it. The same argument cannot be made for CPR; we do not provide it until patients have already died. And some (albeit small) fraction of the sickest patients survive. For example, 6.4% of those on 2 or more vasopressors who arrest, survive hospitalization.4 Another distinction between CPR and surgery is that when a physician does not withhold CPR for a patient who he thinks is not likely to benefit, he is ordinarily not the party providing the CPR. Most hospitals have teams of individuals who may or may not know the patient and the precise pathophysiology and ethics of their case. So there is greater physical distance (than with surgery) between making the decision and performing the procedure. Moreover, the process of informed consent is temporally proximate and prior to the need for surgery, whereas informed consent is not uniformly obtained a priori, and never after cardiac arrest in a patient who has not previously opted out.
PROBLEMS INHERENT IN BOTH EXTREMES
Viewed through the prism of ethical principlism,1 the ability to withhold surgery may be viewed as beneficence‐strong/autonomy‐weak (BS/AW) whereas prohibiting physicians from withholding CPR when it is only likely to prolong death is beneficence‐weak/autonomy‐strong (BW/AS). These extremes have definable risks that can be named and minimized.
Risks of Beneficence at the Expense of Autonomy
All physicians routinely assess patients to determine whether the risk of a particular intervention (eg, surgery or CPR) outweighs potential benefits. Since unilateral withholding of CPR has not been studied, we can only examine what is known about factors that may impact decisions to withhold surgery. While an elegant study demonstrated substantial interoperator variability of surgeons' opinions for elective cases,1 no similar studies have been performed to quantify or qualify this problem for emergency cases. Nonetheless, some factors that may contribute include:
-
Knowledge and heuristicsWe only know what we know. So the surgeon's knowledge about a particular surgical problem and heuristics are sure to contribute to the result of the calculus preceding whether to offer surgery.610 Unilateral withholding of any potentially life‐saving therapy (surgery or CPR) should be predicated on near‐certitude. Unfortunately, clinicians of all specialties are not particularly good at prognosticating. All available evidence suggests that doctors are very poor at predicting which severely ill patients will live or die, and when.1113 In a study that calls into serious question the accuracy of prognostication of critically ill patients, Meadow and colleagues showed that only half of patients with a prediction of death before discharge actually died in hospital.11 So the clinical judgment upon which risk estimates are predicated, are themselves imprecise and vulnerable to a multitude of heuristics.8
-
Risk aversionRisk proclivity is inherent in all medical disciplines, and is likely impacted by a multitude of factors, including genetics,14, 15 upbringing, moral beliefs, fear of litigation (even if reduced by informed consent), and effect of bad outcomes on reputation and morale. A review demonstrates the epidemiology of risk‐taking across various disciplines, but there is very little data regarding the impact of risk and ambiguity on surgeons' practice.16 Medical culture can also impact risk aversion. Morbidity and Mortality Conference (M&M) could serve as a disincentive to undertaking risky care, but such fears can be attenuated by minimizing cultures of blame.17
-
ExperienceThere is scarce data on the effects of years of experience on surgeons' practice. It is plausible that surgeons with greater experiencewith a more extensive personal library of casesare more comfortable or certain about outcomes. There is data to support that older surgeons are more risk‐averse, but the reasons have not been deciphered.18
-
Death by omission or commissionEthicists argue that if the result is the same (ie, the patient is very likely to die irrespective), acts of commission are not morally distinguishable from those of omission. Yet, clinicians in various fields are predisposed to omission bias, that is, when faced with the choice of action or inaction, when the result is likely to be the same, we often favor inaction.1921 So it is not surprising that some surgeons, when faced with difficult, lifedeath decisions regarding surgery, favor omission, because to actto perform surgery and the patient dies nonethelessincludes the possibility that their action could have caused the death, whereas the result from the alternative (ie, no surgery) is unknown.20 The reciprocal is also true, but omission bias allows the surgeon to attribute death entirely to the disease (even if there was a small chance that surgery could have changed the course). If the chances of success of surgery are small, and the chances of death and/or prolonging suffering are substantially larger, beneficence (and non‐malfeasance) is certainly an appropriate consideration.2 But the thresholds, that is, percent likelihood of success versus percent likelihood of failure defined as death or prolonged suffering, at which surgeons withhold (ie, omit consideration; don't offer surgery) will vary based on their own views of professional and moral obligation,22 and some of the factors (ie, knowledge, heuristics, risk aversion) suggested above.
Withholding CPR does not cause the death of the patient, who has already died. We may have hard‐wired survival bias that CPR will not harm a dead personbecause success entails life. There is an intrinsic (biological or value‐laden) presumption that life is always preferable to death, so there is nothing to lose. Yet many patients don't want CPR after they've learned the risks, benefits, and alternatives.23 And beyond issues of patient autonomy, CPR by default has a number of additional negative consequences, including reinforcement of false optimism,24 prolongation of dying in many initial survivors, and distress to clinicians who administer this invasive therapy to some patients who are highly unlikely to benefit. But, as Pope articulates, there is currently a now supposed right of patients to make requests for non‐indicated CPR.24
-
OtherMedical decision‐making is an extremely complex process and is certainly impacted by a multitude of variables. Even nonmedical or logistic exigencies, not considered here, couldin theoryaffect or frame decisions. Surgery often involves hours of hard work and a large emotional investment, whereas CPR is a relatively impersonal procedure, most often performed on an individual we don't know, and seldom lasting for more than an hour. So it is possible that differences in operators' personal/emotional investment impact the apparent inconsistency (of why surgeons can say no, while it is rare to unilaterally withhold CPR).
Other psychological factors, including patients' expectations and physicians' fears may also play a role. Popular culture has (mis‐)shapen patients' understanding of CPR, grossly overestimating success of the procedure.25 Misunderstanding is coupled to creep of CPR from a procedure initially introduced for highly selected cardiac care patients, to a default/right for all Americans. Patients simply don't expect life‐saving surgery on demand; whether it's the mystery of the OR, or some other factor, they're more willing to rely on the surgeon's clinical judgment.
We offer the 4 possibilities discussed above, not as an exhaustive list, but rather to spur greater consideration and discourse on this subject. Even a survey, similar to that undertaken by Rutkow and colleagues to examine elective surgery decisions,6 would be a first step to answering this question with more precision and detail.
RECOMMENDATIONS FOR MINIMIZING ETHICAL RISKS
Life‐Saving Surgery
The inherent ethical risks of extremes (eg, BS/AW as with withholding surgery vs BW/AS as with CPR) can be attenuated. Those who are highly uncomfortable with high risk could make it known, and their exposure to covering in situations where high‐risk patients are likely to be encountered could be minimized wherever possible. In recent years, acute care surgeons have been self‐selected and trained to deal with critically ill patients.26 It stands to reason that ranges of risk aversion are likely to exist among surgeonsand that those who select acute care surgery will have greater facility and comfort with high‐risk critically ill patients. Since there are insufficient acute care surgeons in the country, even if they were preferable (which is unproven) for high‐risk critical care surgery, general surgeons would still be required to fill the manpower gap to staff acute care hospitals appropriately for these problems.26, 27 Surgery, like all of Medicine, will always remain as much art as science, and variability is sure to impact what decisions are made in the care of acutely ill patients; it is a premise of being human. Those who know that they are risk‐averse, but are in a situation of assessing a case with very high but not 100% risk, could acknowledge this in their assessments and offer opportunities for second opinions using validated prognostic tools where possible.28
As some have suggested,9 metacognition, that is, greater attention to thinking about how we think, should be included in all medical curricula. If we consider carefully is there no chance of survival or only small chance of survival, then an optimal model of shared decision‐making can result. For those where they estimate no chance: It is my best professional opinion that your loved one will certainly die if surgery is performed, so I cannot provide it in good faith. But since this decision involves such finality, I'm glad to help you obtain a second opinion if it will help your peace of mind. Or: It is my best professional opinion that your loved one will die without surgery. While there may be a very remote possibility of a miracle, surgery is only likely to prolong death and suffering; the likelihood of survival is very low and the quality of that survival is likely to be very poor what would he want? Such an approach acknowledges the imprecision of medical science, and fully respects autonomy of patients. Beneficence, non‐malfeasance, and respect of autonomy can be served simultaneously without unilateral withholding, in those cases where perioperative mortality is not believed to be 100%.
Additionally, metacognition is a deliberate method for increasing the likelihood that our conclusions are predicated on sound medical science and judgment, and not on biases (eg, heuristics), exigencies related to the healthcare system (eg, resource/personnel availability), fear of litigation, or patient traits. To the extent that socioeconomic variables impact the quality and quantity of care provided to American citizens,29 it is particularly imperative that unconscious, value‐laden effectors of behavior not impact life and death decisions.
Surgical leaders should provide psychological safety30 for surgeons who offer surgery that is not futile, but highly unlikely to succeed, if proper care is taken to quantify and share risks, benefits, and alternatives with patients/surrogates.
Finally, medical physicians who request surgical consultations should always communicate directly, whenever possible, with surgical colleagues. Not infrequently, details are clarified that permit the most accurate costbenefit ratio. If a surgeon feels that surgery will only prolong dying or cause immediate death, and the internist is not so sure (as in case 1 above), a second opinion can be requested respectfully.
Withholding Cardiopulmonary Resuscitation
Unilateral withholding of CPR is a more difficult problem. Since some (albeit a small percentage) of even the most critically ill patients survive, it would be difficult to assert that CPR would be futile in the preponderance of very ill patients.4 There is simply no tool that pre‐defines with certainty successes and failure. There are patients with end‐stage diseases (eg, widely metastatic cancer, end‐stage dementia, or heart disease) where the short‐term prognosis without cardiac arrest is abysmal, and survival after CPR is only likely to extend a patient's suffering. To date, some medical cultures, notably the United States, have not allowed physicians to act beneficently to withhold CPR in such circumstances, requiring instead consent or assent of the patient or surrogate.31, 32 For those who practice in this model, there is room for greater beneficence at the expense of autonomy, but such will come only if accepted norms of conduct change in this medical culture. Medical norms in other countries permit physicians greater latitude to withhold CPR in such situations,33 whereas it is not common in the United States. The risk, of course, is that CPR is withheld unilaterally for patients who otherwise would have wanted it and survived. Nonetheless, perhaps greater emphasis on truly informed consent for CPR increases our duty to beneficence and reduces the likelihood that a patient will insist on CPR that is contrary to their best (medical) interests. There is abundant evidence that patients do not fully understand the risks, benefits, and alternatives of CPR, but when apprised, many opt out.23 The improbable likelihood of survival and the long‐term prognosis (including quality of life) following CPR, and the resulting stay in the critical care unit, should be included in truly informed consent for this procedure. Then, beneficence can be served more fully, albeit short of unilateral withholding. Importantly, while informed consent for CPR may respect patient autonomy, it does not address the (arguably incorrect) notion that CPR is a right.24 Such a shift in views/practicesof both clinicians and laypersonsmight require substantial investment by professional societies and policy‐makers to engage citizens. It has taken 50 years for CPR to be viewed as a right in the United States, and it is likely to require considerable focus and effort to modify that expectation.
Our acutely and critically ill patients are most vulnerable and at the highest risk of adverse and irreversible consequences resulting from medical decisionswhether for surgical or nonsurgical treatments. We will never eliminate entirely interprovider variability of skills and behaviors. But to the extent possible, we might acknowledge and attenuate, where possible, human and systems features that contribute to inconsistent care. It is worth stressing here that while this discussion has been focused through the prism of surgical care, these concepts apply to all medical disciplines. A transparent, mindful approachthat applies shared, rather than unilateral decision‐making, whenever possiblemay simultaneously protect the autonomy of both physicians and patients.
Postscript
Interested readers can explore this topic in greater detail in: Lo B. Resolving Ethical Dilemmas: A Guide for Clinicians. Philadelphia, PA: Lippincott Williams & Wilkins; 2009.
- Medical professionalism in the new millennium: a physician charter.Ann Intern Med.2002;136:243–246.
- Opinion 2.035: Futile Care. AMA Code of Medical Ethics. Available at: http://www.ama‐assn.org/ama/pub/physician‐resources/medical‐ethics/code‐medical‐ethics/opinion2035.page. Accessed March 23,2011.
- .The Texas advance directives act is ethically flawed: medical futility disputes must be resolved by a fair process.Chest.2009;136:971–973.
- ,,, et al.Outcomes of critically ill patients who received cardiopulmonary resuscitation.Am J Respir Crit Care Med.2010;182:501–506.
- .Bentham in a box: technology assessment and health care allocation.Law Med Health Care.1986;14:172–174.
- ,,.Surgical decision making. The reliability of clinical judgment.Ann Surg.1979;190:409–419.
- ,,.Risk taking and tolerance of uncertainty: implications for surgeons.J Surg Res.2006;131:1–6.
- .Simple inference heuristics versus complex decision machines.Minds and Machines.1999;9:461–477.
- ,,.Surgeons and cognitive processes.Br J Surg.2003;90:1–6.
- ,,,,,.Evaluation of patients with severe symptomatic aortic stenosis who do not undergo aortic valve replacement: the potential role of subjectively overestimated operative risk.Circ Cardiovasc Qual Outcomes.2009;2:533–539.
- ,,, et al.Power and limitations of daily prognostications of death in the medical intensive care unit.Crit Care Med.2011;39:474–479.
- ,.Extent and determinants of error in doctors' prognoses in terminally ill patients: prospective cohort study.BMJ.2000;320:469–473.
- ,.Prognostic disclosure to patients with cancer near the end of life.Ann Intern Med.2001;134:1096–1105.
- ,,,.Genetic and environmental influences on disordered gambling in men and women.Arch Gen Psychiatry.2010;67:624–630.
- ,,,,.The dopamine transporter gene, a spectrum of most common risky behaviors, and the legal status of the behaviors.PLoS ONE.2010;22:e935216..
- ,,, et al.An international comparison of physicians' judgments of outcome rates of cardiac procedures and attitudes toward risk, uncertainty, justifiability and regret.Med Decis Making.1998;18:131–140.
- ,,,,.Educational quality improvement report: outcomes from a revised morbidity and mortality format that emphasized patient safety.Qual Saf Health Care.2007;16:422–427.
- ,,,.Risk attitudes of anesthesiologists and surgeons in clinical decision making with expected years of life.J Clin Anesthesia.2000;12:146–150.
- .Intention and the omission bias: omissions perceived as nondecisions.Acta Psychol.1996;93:161–172.
- ,,, et al.An objective analysis of process errors in trauma resuscitations.Acad Emerg Med.2000;1303–1310.
- ,,.Omission bias and decision making in pulmonary and critical care medicine.Chest.2005;128:1497–1505.
- .Professing ethically. On the place of ethics in defining decisions.JAMA.1983;249:1305–1310.
- ,,, et al.The influence of the probability of survival on patients' preferences regarding cardiopulmonary resuscitation.N Engl J Med.1994;330:545–549.
- .Restricting CPR to patients who provide informed consent will not permit physicians to unilaterally refuse requested CPR.Am J Bioethics.2010;10:82–83.
- ,,.Cardiopulmonary resuscitation on television. Miracles and misinformation.N Engl J Med.1996;334:1578–1582.
- ,.Acute care surgery in evolution.Crit Care Med.2010;38:S405–S410.
- ,,,.Acute care surgery survey: opinion of surgeons about a new training paradigm.Arch Surg.2011;146:101–106.
- ,,,.ASA classification and perioperative variables as predictors of postoperative outcome.Br J Anaesth.1996;77:217–222.
- ,.Multicultural Medicine and Health Disparities.New York, NY:McGraw‐Hill;2006.
- ,.Making it safe: the effects of leader inclusiveness and professional status on psychological safety and improvement efforts in health care teams.J Organiz Behav.2006;27:941–966.
- .Counterpoint: is it ethical to order “do not resuscitation” without patient consent?Chest.2007;132:751–754.
- ,.Point: the ethics of unilateral “do not resuscitate” orders: the role of “informed assent.”Chest.2007;132:748–751.
- ,,,.Reviving the conversation around CPR/DNR.Am J Bioethics.2010;10:61–67.
Each day, hospitalists interact with a variety of specialists and sub‐specialists to provide consultative or procedural assistance in care of their patients. Physicians have a duty to practice beneficently and to simultaneously respect patients' autonomy.1 Whether to offer a treatment is a function of many variables, but when benefits approach zero, or when risks substantially outweigh benefits, physicians may justifiably withhold therapies without assent or consent of patients.2 The purpose of this article is to explore why it is accepted practice in the United States to permit unilateral withholding of some potentially life‐prolonging treatments (eg, surgery as the paradigm), while it is not common practice for other critical care procedures (eg, cardiopulmonary resuscitation [CPR]). We offer that these examples demonstrate the tension of 2 pillars of medical ethical conduct, namely beneficence and respect of autonomy.1
Consider 2 real cases that demonstrated a juxtaposition of diametrically opposing views of thoughtful, capable surgeons asked to provide life‐saving surgery to critically ill patients.
CASE 1
A 33‐year‐old man, with a history of obesity, presents with mild epigastric pain and hematemesis of a day's duration. Endoscopic evaluation demonstrates a deep gastric ulcer with visible vessel that is injected with epinephrine. He is transferred to the medical intensive care unit (ICU) for monitoring and has an uneventful first 24 hours. On his second hospital day, he develops severe epigastric pain of sudden onset, accompanied by light‐headedness. He is diaphoretic and dyspneic, sitting bolt upright. His body mass index (BMI) is 40 kg/m2, and his vital signs are: 130/min, 140/80 mmHg, 30/min, 99.0F. Examination is normal except for severe upper abdominal tenderness, absent bowel sounds, and voluntary guarding. Abdominal computed tomography demonstrates a perforation, free air, and a loculated collection adjacent to the original ulcer. He is treated with 4 liters of crystalloids, oxygen, and an emergent surgical consultation is performed. The examining surgeon confirms the diagnosis of acute perforation, but asserts that his operative risk of mortality, due to obesity, is excessive. He will never get off the ventilator. He advises watchful waiting. The medical intensivist believes the patient will die without surgery; he asks for a second opinion. A more senior colleague assesses the patient and reiterates the first surgeon's opinion. The intensivist begins preparations to transfer the patient to the nearest tertiary care center for a third opinion, when the surgeons reverse themselves. The patient is taken to surgery where the collection is removed, with partial gastrectomy. He is extubated in the recovery room, spends 12 hours in the ICU, and is transferred to the wards where he undergoes an uneventful recovery.
CASE 2
A 50‐year‐old man, with a history of end‐stage alcoholic cirrhosis, presents to the intensive care unit with respiratory embarrassment associated with tense ascites, complicated by pneumococcal pneumonia. He responds to antibiotics but has rapidly reaccumulating ascites, where large volume paracentesis (of 4‐5 liters of transudative fluid) is required every 3 to 4 days to promote weaning trials. On his 20th hospital day, the patient develops fulminant septic shock, and work‐up reveals free air in the abdomen. A Board‐certified critical care surgeon meets with the family and informs them that he is willing to attempt exploratory laparotomy, but that operative mortality exceeds 95%. However, he was willing to try because the alternative otherwise is >99% mortality. The family asks for surgery, which reveals a small perforation, but the patient dies shortly thereafter.
In both cases, patients were very likely, if not certain, to die without operative procedures. Equally certain, the (critical care) surgeon in the second case might find case 1s surgeons neglectful. And they might consider operating on case 2with >95% preoperative mortalitymalpractice.
WHY IS SURGERY DIFFERENT FROM CPR? BENEFICENCE VERSUS AUTONOMY MODELS
Why can surgeons withhold potentially life‐saving surgery, whereas most US physicianssurgeons or internistsdo not (routinely) unilaterally withhold CPR or mechanical ventilation?3 A variety of possible reasons may underlie this asymmetry. First, to compel a surgeon to cut another human against his/her judgment would violate the surgeon's autonomy. But why is the act of cutting viewed differently from the act of intubating and ventilating, or compressing and shocking? The bodily integrity of the patient is violated in both. Nobody would take issue with a surgeon who assesses a 2% chance of survival and so does not offer surgery. Yet physicians struggle often with patients/surrogates who demand CPR/mechanical ventilation for similar prognoses.4 In the United States, CPR has crept into general acceptance (ie, when the only other option is death) as a system‐wide default. In the case of surgery, the judgment of the physician is accepted both by patients and the medical establishment, whereas for CPRwith hypothetically identical consequencesthe patient must opt out. Neither model is right or wrong; but the focus in the balance of decision‐making (paternalism/beneficence vs autonomy) is different.
Albert Jonsen introduced the rule of rescue which suggests that we have an instinctive response to rescue the doomed.5 Surgeons can make the reasonable argument that, in some cases, surgery is only likely to hasten death, and so beneficence requires that they not provide it. The same argument cannot be made for CPR; we do not provide it until patients have already died. And some (albeit small) fraction of the sickest patients survive. For example, 6.4% of those on 2 or more vasopressors who arrest, survive hospitalization.4 Another distinction between CPR and surgery is that when a physician does not withhold CPR for a patient who he thinks is not likely to benefit, he is ordinarily not the party providing the CPR. Most hospitals have teams of individuals who may or may not know the patient and the precise pathophysiology and ethics of their case. So there is greater physical distance (than with surgery) between making the decision and performing the procedure. Moreover, the process of informed consent is temporally proximate and prior to the need for surgery, whereas informed consent is not uniformly obtained a priori, and never after cardiac arrest in a patient who has not previously opted out.
PROBLEMS INHERENT IN BOTH EXTREMES
Viewed through the prism of ethical principlism,1 the ability to withhold surgery may be viewed as beneficence‐strong/autonomy‐weak (BS/AW) whereas prohibiting physicians from withholding CPR when it is only likely to prolong death is beneficence‐weak/autonomy‐strong (BW/AS). These extremes have definable risks that can be named and minimized.
Risks of Beneficence at the Expense of Autonomy
All physicians routinely assess patients to determine whether the risk of a particular intervention (eg, surgery or CPR) outweighs potential benefits. Since unilateral withholding of CPR has not been studied, we can only examine what is known about factors that may impact decisions to withhold surgery. While an elegant study demonstrated substantial interoperator variability of surgeons' opinions for elective cases,1 no similar studies have been performed to quantify or qualify this problem for emergency cases. Nonetheless, some factors that may contribute include:
-
Knowledge and heuristicsWe only know what we know. So the surgeon's knowledge about a particular surgical problem and heuristics are sure to contribute to the result of the calculus preceding whether to offer surgery.610 Unilateral withholding of any potentially life‐saving therapy (surgery or CPR) should be predicated on near‐certitude. Unfortunately, clinicians of all specialties are not particularly good at prognosticating. All available evidence suggests that doctors are very poor at predicting which severely ill patients will live or die, and when.1113 In a study that calls into serious question the accuracy of prognostication of critically ill patients, Meadow and colleagues showed that only half of patients with a prediction of death before discharge actually died in hospital.11 So the clinical judgment upon which risk estimates are predicated, are themselves imprecise and vulnerable to a multitude of heuristics.8
-
Risk aversionRisk proclivity is inherent in all medical disciplines, and is likely impacted by a multitude of factors, including genetics,14, 15 upbringing, moral beliefs, fear of litigation (even if reduced by informed consent), and effect of bad outcomes on reputation and morale. A review demonstrates the epidemiology of risk‐taking across various disciplines, but there is very little data regarding the impact of risk and ambiguity on surgeons' practice.16 Medical culture can also impact risk aversion. Morbidity and Mortality Conference (M&M) could serve as a disincentive to undertaking risky care, but such fears can be attenuated by minimizing cultures of blame.17
-
ExperienceThere is scarce data on the effects of years of experience on surgeons' practice. It is plausible that surgeons with greater experiencewith a more extensive personal library of casesare more comfortable or certain about outcomes. There is data to support that older surgeons are more risk‐averse, but the reasons have not been deciphered.18
-
Death by omission or commissionEthicists argue that if the result is the same (ie, the patient is very likely to die irrespective), acts of commission are not morally distinguishable from those of omission. Yet, clinicians in various fields are predisposed to omission bias, that is, when faced with the choice of action or inaction, when the result is likely to be the same, we often favor inaction.1921 So it is not surprising that some surgeons, when faced with difficult, lifedeath decisions regarding surgery, favor omission, because to actto perform surgery and the patient dies nonethelessincludes the possibility that their action could have caused the death, whereas the result from the alternative (ie, no surgery) is unknown.20 The reciprocal is also true, but omission bias allows the surgeon to attribute death entirely to the disease (even if there was a small chance that surgery could have changed the course). If the chances of success of surgery are small, and the chances of death and/or prolonging suffering are substantially larger, beneficence (and non‐malfeasance) is certainly an appropriate consideration.2 But the thresholds, that is, percent likelihood of success versus percent likelihood of failure defined as death or prolonged suffering, at which surgeons withhold (ie, omit consideration; don't offer surgery) will vary based on their own views of professional and moral obligation,22 and some of the factors (ie, knowledge, heuristics, risk aversion) suggested above.
Withholding CPR does not cause the death of the patient, who has already died. We may have hard‐wired survival bias that CPR will not harm a dead personbecause success entails life. There is an intrinsic (biological or value‐laden) presumption that life is always preferable to death, so there is nothing to lose. Yet many patients don't want CPR after they've learned the risks, benefits, and alternatives.23 And beyond issues of patient autonomy, CPR by default has a number of additional negative consequences, including reinforcement of false optimism,24 prolongation of dying in many initial survivors, and distress to clinicians who administer this invasive therapy to some patients who are highly unlikely to benefit. But, as Pope articulates, there is currently a now supposed right of patients to make requests for non‐indicated CPR.24
-
OtherMedical decision‐making is an extremely complex process and is certainly impacted by a multitude of variables. Even nonmedical or logistic exigencies, not considered here, couldin theoryaffect or frame decisions. Surgery often involves hours of hard work and a large emotional investment, whereas CPR is a relatively impersonal procedure, most often performed on an individual we don't know, and seldom lasting for more than an hour. So it is possible that differences in operators' personal/emotional investment impact the apparent inconsistency (of why surgeons can say no, while it is rare to unilaterally withhold CPR).
Other psychological factors, including patients' expectations and physicians' fears may also play a role. Popular culture has (mis‐)shapen patients' understanding of CPR, grossly overestimating success of the procedure.25 Misunderstanding is coupled to creep of CPR from a procedure initially introduced for highly selected cardiac care patients, to a default/right for all Americans. Patients simply don't expect life‐saving surgery on demand; whether it's the mystery of the OR, or some other factor, they're more willing to rely on the surgeon's clinical judgment.
We offer the 4 possibilities discussed above, not as an exhaustive list, but rather to spur greater consideration and discourse on this subject. Even a survey, similar to that undertaken by Rutkow and colleagues to examine elective surgery decisions,6 would be a first step to answering this question with more precision and detail.
RECOMMENDATIONS FOR MINIMIZING ETHICAL RISKS
Life‐Saving Surgery
The inherent ethical risks of extremes (eg, BS/AW as with withholding surgery vs BW/AS as with CPR) can be attenuated. Those who are highly uncomfortable with high risk could make it known, and their exposure to covering in situations where high‐risk patients are likely to be encountered could be minimized wherever possible. In recent years, acute care surgeons have been self‐selected and trained to deal with critically ill patients.26 It stands to reason that ranges of risk aversion are likely to exist among surgeonsand that those who select acute care surgery will have greater facility and comfort with high‐risk critically ill patients. Since there are insufficient acute care surgeons in the country, even if they were preferable (which is unproven) for high‐risk critical care surgery, general surgeons would still be required to fill the manpower gap to staff acute care hospitals appropriately for these problems.26, 27 Surgery, like all of Medicine, will always remain as much art as science, and variability is sure to impact what decisions are made in the care of acutely ill patients; it is a premise of being human. Those who know that they are risk‐averse, but are in a situation of assessing a case with very high but not 100% risk, could acknowledge this in their assessments and offer opportunities for second opinions using validated prognostic tools where possible.28
As some have suggested,9 metacognition, that is, greater attention to thinking about how we think, should be included in all medical curricula. If we consider carefully is there no chance of survival or only small chance of survival, then an optimal model of shared decision‐making can result. For those where they estimate no chance: It is my best professional opinion that your loved one will certainly die if surgery is performed, so I cannot provide it in good faith. But since this decision involves such finality, I'm glad to help you obtain a second opinion if it will help your peace of mind. Or: It is my best professional opinion that your loved one will die without surgery. While there may be a very remote possibility of a miracle, surgery is only likely to prolong death and suffering; the likelihood of survival is very low and the quality of that survival is likely to be very poor what would he want? Such an approach acknowledges the imprecision of medical science, and fully respects autonomy of patients. Beneficence, non‐malfeasance, and respect of autonomy can be served simultaneously without unilateral withholding, in those cases where perioperative mortality is not believed to be 100%.
Additionally, metacognition is a deliberate method for increasing the likelihood that our conclusions are predicated on sound medical science and judgment, and not on biases (eg, heuristics), exigencies related to the healthcare system (eg, resource/personnel availability), fear of litigation, or patient traits. To the extent that socioeconomic variables impact the quality and quantity of care provided to American citizens,29 it is particularly imperative that unconscious, value‐laden effectors of behavior not impact life and death decisions.
Surgical leaders should provide psychological safety30 for surgeons who offer surgery that is not futile, but highly unlikely to succeed, if proper care is taken to quantify and share risks, benefits, and alternatives with patients/surrogates.
Finally, medical physicians who request surgical consultations should always communicate directly, whenever possible, with surgical colleagues. Not infrequently, details are clarified that permit the most accurate costbenefit ratio. If a surgeon feels that surgery will only prolong dying or cause immediate death, and the internist is not so sure (as in case 1 above), a second opinion can be requested respectfully.
Withholding Cardiopulmonary Resuscitation
Unilateral withholding of CPR is a more difficult problem. Since some (albeit a small percentage) of even the most critically ill patients survive, it would be difficult to assert that CPR would be futile in the preponderance of very ill patients.4 There is simply no tool that pre‐defines with certainty successes and failure. There are patients with end‐stage diseases (eg, widely metastatic cancer, end‐stage dementia, or heart disease) where the short‐term prognosis without cardiac arrest is abysmal, and survival after CPR is only likely to extend a patient's suffering. To date, some medical cultures, notably the United States, have not allowed physicians to act beneficently to withhold CPR in such circumstances, requiring instead consent or assent of the patient or surrogate.31, 32 For those who practice in this model, there is room for greater beneficence at the expense of autonomy, but such will come only if accepted norms of conduct change in this medical culture. Medical norms in other countries permit physicians greater latitude to withhold CPR in such situations,33 whereas it is not common in the United States. The risk, of course, is that CPR is withheld unilaterally for patients who otherwise would have wanted it and survived. Nonetheless, perhaps greater emphasis on truly informed consent for CPR increases our duty to beneficence and reduces the likelihood that a patient will insist on CPR that is contrary to their best (medical) interests. There is abundant evidence that patients do not fully understand the risks, benefits, and alternatives of CPR, but when apprised, many opt out.23 The improbable likelihood of survival and the long‐term prognosis (including quality of life) following CPR, and the resulting stay in the critical care unit, should be included in truly informed consent for this procedure. Then, beneficence can be served more fully, albeit short of unilateral withholding. Importantly, while informed consent for CPR may respect patient autonomy, it does not address the (arguably incorrect) notion that CPR is a right.24 Such a shift in views/practicesof both clinicians and laypersonsmight require substantial investment by professional societies and policy‐makers to engage citizens. It has taken 50 years for CPR to be viewed as a right in the United States, and it is likely to require considerable focus and effort to modify that expectation.
Our acutely and critically ill patients are most vulnerable and at the highest risk of adverse and irreversible consequences resulting from medical decisionswhether for surgical or nonsurgical treatments. We will never eliminate entirely interprovider variability of skills and behaviors. But to the extent possible, we might acknowledge and attenuate, where possible, human and systems features that contribute to inconsistent care. It is worth stressing here that while this discussion has been focused through the prism of surgical care, these concepts apply to all medical disciplines. A transparent, mindful approachthat applies shared, rather than unilateral decision‐making, whenever possiblemay simultaneously protect the autonomy of both physicians and patients.
Postscript
Interested readers can explore this topic in greater detail in: Lo B. Resolving Ethical Dilemmas: A Guide for Clinicians. Philadelphia, PA: Lippincott Williams & Wilkins; 2009.
Each day, hospitalists interact with a variety of specialists and sub‐specialists to provide consultative or procedural assistance in care of their patients. Physicians have a duty to practice beneficently and to simultaneously respect patients' autonomy.1 Whether to offer a treatment is a function of many variables, but when benefits approach zero, or when risks substantially outweigh benefits, physicians may justifiably withhold therapies without assent or consent of patients.2 The purpose of this article is to explore why it is accepted practice in the United States to permit unilateral withholding of some potentially life‐prolonging treatments (eg, surgery as the paradigm), while it is not common practice for other critical care procedures (eg, cardiopulmonary resuscitation [CPR]). We offer that these examples demonstrate the tension of 2 pillars of medical ethical conduct, namely beneficence and respect of autonomy.1
Consider 2 real cases that demonstrated a juxtaposition of diametrically opposing views of thoughtful, capable surgeons asked to provide life‐saving surgery to critically ill patients.
CASE 1
A 33‐year‐old man, with a history of obesity, presents with mild epigastric pain and hematemesis of a day's duration. Endoscopic evaluation demonstrates a deep gastric ulcer with visible vessel that is injected with epinephrine. He is transferred to the medical intensive care unit (ICU) for monitoring and has an uneventful first 24 hours. On his second hospital day, he develops severe epigastric pain of sudden onset, accompanied by light‐headedness. He is diaphoretic and dyspneic, sitting bolt upright. His body mass index (BMI) is 40 kg/m2, and his vital signs are: 130/min, 140/80 mmHg, 30/min, 99.0F. Examination is normal except for severe upper abdominal tenderness, absent bowel sounds, and voluntary guarding. Abdominal computed tomography demonstrates a perforation, free air, and a loculated collection adjacent to the original ulcer. He is treated with 4 liters of crystalloids, oxygen, and an emergent surgical consultation is performed. The examining surgeon confirms the diagnosis of acute perforation, but asserts that his operative risk of mortality, due to obesity, is excessive. He will never get off the ventilator. He advises watchful waiting. The medical intensivist believes the patient will die without surgery; he asks for a second opinion. A more senior colleague assesses the patient and reiterates the first surgeon's opinion. The intensivist begins preparations to transfer the patient to the nearest tertiary care center for a third opinion, when the surgeons reverse themselves. The patient is taken to surgery where the collection is removed, with partial gastrectomy. He is extubated in the recovery room, spends 12 hours in the ICU, and is transferred to the wards where he undergoes an uneventful recovery.
CASE 2
A 50‐year‐old man, with a history of end‐stage alcoholic cirrhosis, presents to the intensive care unit with respiratory embarrassment associated with tense ascites, complicated by pneumococcal pneumonia. He responds to antibiotics but has rapidly reaccumulating ascites, where large volume paracentesis (of 4‐5 liters of transudative fluid) is required every 3 to 4 days to promote weaning trials. On his 20th hospital day, the patient develops fulminant septic shock, and work‐up reveals free air in the abdomen. A Board‐certified critical care surgeon meets with the family and informs them that he is willing to attempt exploratory laparotomy, but that operative mortality exceeds 95%. However, he was willing to try because the alternative otherwise is >99% mortality. The family asks for surgery, which reveals a small perforation, but the patient dies shortly thereafter.
In both cases, patients were very likely, if not certain, to die without operative procedures. Equally certain, the (critical care) surgeon in the second case might find case 1s surgeons neglectful. And they might consider operating on case 2with >95% preoperative mortalitymalpractice.
WHY IS SURGERY DIFFERENT FROM CPR? BENEFICENCE VERSUS AUTONOMY MODELS
Why can surgeons withhold potentially life‐saving surgery, whereas most US physicianssurgeons or internistsdo not (routinely) unilaterally withhold CPR or mechanical ventilation?3 A variety of possible reasons may underlie this asymmetry. First, to compel a surgeon to cut another human against his/her judgment would violate the surgeon's autonomy. But why is the act of cutting viewed differently from the act of intubating and ventilating, or compressing and shocking? The bodily integrity of the patient is violated in both. Nobody would take issue with a surgeon who assesses a 2% chance of survival and so does not offer surgery. Yet physicians struggle often with patients/surrogates who demand CPR/mechanical ventilation for similar prognoses.4 In the United States, CPR has crept into general acceptance (ie, when the only other option is death) as a system‐wide default. In the case of surgery, the judgment of the physician is accepted both by patients and the medical establishment, whereas for CPRwith hypothetically identical consequencesthe patient must opt out. Neither model is right or wrong; but the focus in the balance of decision‐making (paternalism/beneficence vs autonomy) is different.
Albert Jonsen introduced the rule of rescue which suggests that we have an instinctive response to rescue the doomed.5 Surgeons can make the reasonable argument that, in some cases, surgery is only likely to hasten death, and so beneficence requires that they not provide it. The same argument cannot be made for CPR; we do not provide it until patients have already died. And some (albeit small) fraction of the sickest patients survive. For example, 6.4% of those on 2 or more vasopressors who arrest, survive hospitalization.4 Another distinction between CPR and surgery is that when a physician does not withhold CPR for a patient who he thinks is not likely to benefit, he is ordinarily not the party providing the CPR. Most hospitals have teams of individuals who may or may not know the patient and the precise pathophysiology and ethics of their case. So there is greater physical distance (than with surgery) between making the decision and performing the procedure. Moreover, the process of informed consent is temporally proximate and prior to the need for surgery, whereas informed consent is not uniformly obtained a priori, and never after cardiac arrest in a patient who has not previously opted out.
PROBLEMS INHERENT IN BOTH EXTREMES
Viewed through the prism of ethical principlism,1 the ability to withhold surgery may be viewed as beneficence‐strong/autonomy‐weak (BS/AW) whereas prohibiting physicians from withholding CPR when it is only likely to prolong death is beneficence‐weak/autonomy‐strong (BW/AS). These extremes have definable risks that can be named and minimized.
Risks of Beneficence at the Expense of Autonomy
All physicians routinely assess patients to determine whether the risk of a particular intervention (eg, surgery or CPR) outweighs potential benefits. Since unilateral withholding of CPR has not been studied, we can only examine what is known about factors that may impact decisions to withhold surgery. While an elegant study demonstrated substantial interoperator variability of surgeons' opinions for elective cases,1 no similar studies have been performed to quantify or qualify this problem for emergency cases. Nonetheless, some factors that may contribute include:
-
Knowledge and heuristicsWe only know what we know. So the surgeon's knowledge about a particular surgical problem and heuristics are sure to contribute to the result of the calculus preceding whether to offer surgery.610 Unilateral withholding of any potentially life‐saving therapy (surgery or CPR) should be predicated on near‐certitude. Unfortunately, clinicians of all specialties are not particularly good at prognosticating. All available evidence suggests that doctors are very poor at predicting which severely ill patients will live or die, and when.1113 In a study that calls into serious question the accuracy of prognostication of critically ill patients, Meadow and colleagues showed that only half of patients with a prediction of death before discharge actually died in hospital.11 So the clinical judgment upon which risk estimates are predicated, are themselves imprecise and vulnerable to a multitude of heuristics.8
-
Risk aversionRisk proclivity is inherent in all medical disciplines, and is likely impacted by a multitude of factors, including genetics,14, 15 upbringing, moral beliefs, fear of litigation (even if reduced by informed consent), and effect of bad outcomes on reputation and morale. A review demonstrates the epidemiology of risk‐taking across various disciplines, but there is very little data regarding the impact of risk and ambiguity on surgeons' practice.16 Medical culture can also impact risk aversion. Morbidity and Mortality Conference (M&M) could serve as a disincentive to undertaking risky care, but such fears can be attenuated by minimizing cultures of blame.17
-
ExperienceThere is scarce data on the effects of years of experience on surgeons' practice. It is plausible that surgeons with greater experiencewith a more extensive personal library of casesare more comfortable or certain about outcomes. There is data to support that older surgeons are more risk‐averse, but the reasons have not been deciphered.18
-
Death by omission or commissionEthicists argue that if the result is the same (ie, the patient is very likely to die irrespective), acts of commission are not morally distinguishable from those of omission. Yet, clinicians in various fields are predisposed to omission bias, that is, when faced with the choice of action or inaction, when the result is likely to be the same, we often favor inaction.1921 So it is not surprising that some surgeons, when faced with difficult, lifedeath decisions regarding surgery, favor omission, because to actto perform surgery and the patient dies nonethelessincludes the possibility that their action could have caused the death, whereas the result from the alternative (ie, no surgery) is unknown.20 The reciprocal is also true, but omission bias allows the surgeon to attribute death entirely to the disease (even if there was a small chance that surgery could have changed the course). If the chances of success of surgery are small, and the chances of death and/or prolonging suffering are substantially larger, beneficence (and non‐malfeasance) is certainly an appropriate consideration.2 But the thresholds, that is, percent likelihood of success versus percent likelihood of failure defined as death or prolonged suffering, at which surgeons withhold (ie, omit consideration; don't offer surgery) will vary based on their own views of professional and moral obligation,22 and some of the factors (ie, knowledge, heuristics, risk aversion) suggested above.
Withholding CPR does not cause the death of the patient, who has already died. We may have hard‐wired survival bias that CPR will not harm a dead personbecause success entails life. There is an intrinsic (biological or value‐laden) presumption that life is always preferable to death, so there is nothing to lose. Yet many patients don't want CPR after they've learned the risks, benefits, and alternatives.23 And beyond issues of patient autonomy, CPR by default has a number of additional negative consequences, including reinforcement of false optimism,24 prolongation of dying in many initial survivors, and distress to clinicians who administer this invasive therapy to some patients who are highly unlikely to benefit. But, as Pope articulates, there is currently a now supposed right of patients to make requests for non‐indicated CPR.24
-
OtherMedical decision‐making is an extremely complex process and is certainly impacted by a multitude of variables. Even nonmedical or logistic exigencies, not considered here, couldin theoryaffect or frame decisions. Surgery often involves hours of hard work and a large emotional investment, whereas CPR is a relatively impersonal procedure, most often performed on an individual we don't know, and seldom lasting for more than an hour. So it is possible that differences in operators' personal/emotional investment impact the apparent inconsistency (of why surgeons can say no, while it is rare to unilaterally withhold CPR).
Other psychological factors, including patients' expectations and physicians' fears may also play a role. Popular culture has (mis‐)shapen patients' understanding of CPR, grossly overestimating success of the procedure.25 Misunderstanding is coupled to creep of CPR from a procedure initially introduced for highly selected cardiac care patients, to a default/right for all Americans. Patients simply don't expect life‐saving surgery on demand; whether it's the mystery of the OR, or some other factor, they're more willing to rely on the surgeon's clinical judgment.
We offer the 4 possibilities discussed above, not as an exhaustive list, but rather to spur greater consideration and discourse on this subject. Even a survey, similar to that undertaken by Rutkow and colleagues to examine elective surgery decisions,6 would be a first step to answering this question with more precision and detail.
RECOMMENDATIONS FOR MINIMIZING ETHICAL RISKS
Life‐Saving Surgery
The inherent ethical risks of extremes (eg, BS/AW as with withholding surgery vs BW/AS as with CPR) can be attenuated. Those who are highly uncomfortable with high risk could make it known, and their exposure to covering in situations where high‐risk patients are likely to be encountered could be minimized wherever possible. In recent years, acute care surgeons have been self‐selected and trained to deal with critically ill patients.26 It stands to reason that ranges of risk aversion are likely to exist among surgeonsand that those who select acute care surgery will have greater facility and comfort with high‐risk critically ill patients. Since there are insufficient acute care surgeons in the country, even if they were preferable (which is unproven) for high‐risk critical care surgery, general surgeons would still be required to fill the manpower gap to staff acute care hospitals appropriately for these problems.26, 27 Surgery, like all of Medicine, will always remain as much art as science, and variability is sure to impact what decisions are made in the care of acutely ill patients; it is a premise of being human. Those who know that they are risk‐averse, but are in a situation of assessing a case with very high but not 100% risk, could acknowledge this in their assessments and offer opportunities for second opinions using validated prognostic tools where possible.28
As some have suggested,9 metacognition, that is, greater attention to thinking about how we think, should be included in all medical curricula. If we consider carefully is there no chance of survival or only small chance of survival, then an optimal model of shared decision‐making can result. For those where they estimate no chance: It is my best professional opinion that your loved one will certainly die if surgery is performed, so I cannot provide it in good faith. But since this decision involves such finality, I'm glad to help you obtain a second opinion if it will help your peace of mind. Or: It is my best professional opinion that your loved one will die without surgery. While there may be a very remote possibility of a miracle, surgery is only likely to prolong death and suffering; the likelihood of survival is very low and the quality of that survival is likely to be very poor what would he want? Such an approach acknowledges the imprecision of medical science, and fully respects autonomy of patients. Beneficence, non‐malfeasance, and respect of autonomy can be served simultaneously without unilateral withholding, in those cases where perioperative mortality is not believed to be 100%.
Additionally, metacognition is a deliberate method for increasing the likelihood that our conclusions are predicated on sound medical science and judgment, and not on biases (eg, heuristics), exigencies related to the healthcare system (eg, resource/personnel availability), fear of litigation, or patient traits. To the extent that socioeconomic variables impact the quality and quantity of care provided to American citizens,29 it is particularly imperative that unconscious, value‐laden effectors of behavior not impact life and death decisions.
Surgical leaders should provide psychological safety30 for surgeons who offer surgery that is not futile, but highly unlikely to succeed, if proper care is taken to quantify and share risks, benefits, and alternatives with patients/surrogates.
Finally, medical physicians who request surgical consultations should always communicate directly, whenever possible, with surgical colleagues. Not infrequently, details are clarified that permit the most accurate costbenefit ratio. If a surgeon feels that surgery will only prolong dying or cause immediate death, and the internist is not so sure (as in case 1 above), a second opinion can be requested respectfully.
Withholding Cardiopulmonary Resuscitation
Unilateral withholding of CPR is a more difficult problem. Since some (albeit a small percentage) of even the most critically ill patients survive, it would be difficult to assert that CPR would be futile in the preponderance of very ill patients.4 There is simply no tool that pre‐defines with certainty successes and failure. There are patients with end‐stage diseases (eg, widely metastatic cancer, end‐stage dementia, or heart disease) where the short‐term prognosis without cardiac arrest is abysmal, and survival after CPR is only likely to extend a patient's suffering. To date, some medical cultures, notably the United States, have not allowed physicians to act beneficently to withhold CPR in such circumstances, requiring instead consent or assent of the patient or surrogate.31, 32 For those who practice in this model, there is room for greater beneficence at the expense of autonomy, but such will come only if accepted norms of conduct change in this medical culture. Medical norms in other countries permit physicians greater latitude to withhold CPR in such situations,33 whereas it is not common in the United States. The risk, of course, is that CPR is withheld unilaterally for patients who otherwise would have wanted it and survived. Nonetheless, perhaps greater emphasis on truly informed consent for CPR increases our duty to beneficence and reduces the likelihood that a patient will insist on CPR that is contrary to their best (medical) interests. There is abundant evidence that patients do not fully understand the risks, benefits, and alternatives of CPR, but when apprised, many opt out.23 The improbable likelihood of survival and the long‐term prognosis (including quality of life) following CPR, and the resulting stay in the critical care unit, should be included in truly informed consent for this procedure. Then, beneficence can be served more fully, albeit short of unilateral withholding. Importantly, while informed consent for CPR may respect patient autonomy, it does not address the (arguably incorrect) notion that CPR is a right.24 Such a shift in views/practicesof both clinicians and laypersonsmight require substantial investment by professional societies and policy‐makers to engage citizens. It has taken 50 years for CPR to be viewed as a right in the United States, and it is likely to require considerable focus and effort to modify that expectation.
Our acutely and critically ill patients are most vulnerable and at the highest risk of adverse and irreversible consequences resulting from medical decisionswhether for surgical or nonsurgical treatments. We will never eliminate entirely interprovider variability of skills and behaviors. But to the extent possible, we might acknowledge and attenuate, where possible, human and systems features that contribute to inconsistent care. It is worth stressing here that while this discussion has been focused through the prism of surgical care, these concepts apply to all medical disciplines. A transparent, mindful approachthat applies shared, rather than unilateral decision‐making, whenever possiblemay simultaneously protect the autonomy of both physicians and patients.
Postscript
Interested readers can explore this topic in greater detail in: Lo B. Resolving Ethical Dilemmas: A Guide for Clinicians. Philadelphia, PA: Lippincott Williams & Wilkins; 2009.
- Medical professionalism in the new millennium: a physician charter.Ann Intern Med.2002;136:243–246.
- Opinion 2.035: Futile Care. AMA Code of Medical Ethics. Available at: http://www.ama‐assn.org/ama/pub/physician‐resources/medical‐ethics/code‐medical‐ethics/opinion2035.page. Accessed March 23,2011.
- .The Texas advance directives act is ethically flawed: medical futility disputes must be resolved by a fair process.Chest.2009;136:971–973.
- ,,, et al.Outcomes of critically ill patients who received cardiopulmonary resuscitation.Am J Respir Crit Care Med.2010;182:501–506.
- .Bentham in a box: technology assessment and health care allocation.Law Med Health Care.1986;14:172–174.
- ,,.Surgical decision making. The reliability of clinical judgment.Ann Surg.1979;190:409–419.
- ,,.Risk taking and tolerance of uncertainty: implications for surgeons.J Surg Res.2006;131:1–6.
- .Simple inference heuristics versus complex decision machines.Minds and Machines.1999;9:461–477.
- ,,.Surgeons and cognitive processes.Br J Surg.2003;90:1–6.
- ,,,,,.Evaluation of patients with severe symptomatic aortic stenosis who do not undergo aortic valve replacement: the potential role of subjectively overestimated operative risk.Circ Cardiovasc Qual Outcomes.2009;2:533–539.
- ,,, et al.Power and limitations of daily prognostications of death in the medical intensive care unit.Crit Care Med.2011;39:474–479.
- ,.Extent and determinants of error in doctors' prognoses in terminally ill patients: prospective cohort study.BMJ.2000;320:469–473.
- ,.Prognostic disclosure to patients with cancer near the end of life.Ann Intern Med.2001;134:1096–1105.
- ,,,.Genetic and environmental influences on disordered gambling in men and women.Arch Gen Psychiatry.2010;67:624–630.
- ,,,,.The dopamine transporter gene, a spectrum of most common risky behaviors, and the legal status of the behaviors.PLoS ONE.2010;22:e935216..
- ,,, et al.An international comparison of physicians' judgments of outcome rates of cardiac procedures and attitudes toward risk, uncertainty, justifiability and regret.Med Decis Making.1998;18:131–140.
- ,,,,.Educational quality improvement report: outcomes from a revised morbidity and mortality format that emphasized patient safety.Qual Saf Health Care.2007;16:422–427.
- ,,,.Risk attitudes of anesthesiologists and surgeons in clinical decision making with expected years of life.J Clin Anesthesia.2000;12:146–150.
- .Intention and the omission bias: omissions perceived as nondecisions.Acta Psychol.1996;93:161–172.
- ,,, et al.An objective analysis of process errors in trauma resuscitations.Acad Emerg Med.2000;1303–1310.
- ,,.Omission bias and decision making in pulmonary and critical care medicine.Chest.2005;128:1497–1505.
- .Professing ethically. On the place of ethics in defining decisions.JAMA.1983;249:1305–1310.
- ,,, et al.The influence of the probability of survival on patients' preferences regarding cardiopulmonary resuscitation.N Engl J Med.1994;330:545–549.
- .Restricting CPR to patients who provide informed consent will not permit physicians to unilaterally refuse requested CPR.Am J Bioethics.2010;10:82–83.
- ,,.Cardiopulmonary resuscitation on television. Miracles and misinformation.N Engl J Med.1996;334:1578–1582.
- ,.Acute care surgery in evolution.Crit Care Med.2010;38:S405–S410.
- ,,,.Acute care surgery survey: opinion of surgeons about a new training paradigm.Arch Surg.2011;146:101–106.
- ,,,.ASA classification and perioperative variables as predictors of postoperative outcome.Br J Anaesth.1996;77:217–222.
- ,.Multicultural Medicine and Health Disparities.New York, NY:McGraw‐Hill;2006.
- ,.Making it safe: the effects of leader inclusiveness and professional status on psychological safety and improvement efforts in health care teams.J Organiz Behav.2006;27:941–966.
- .Counterpoint: is it ethical to order “do not resuscitation” without patient consent?Chest.2007;132:751–754.
- ,.Point: the ethics of unilateral “do not resuscitate” orders: the role of “informed assent.”Chest.2007;132:748–751.
- ,,,.Reviving the conversation around CPR/DNR.Am J Bioethics.2010;10:61–67.
- Medical professionalism in the new millennium: a physician charter.Ann Intern Med.2002;136:243–246.
- Opinion 2.035: Futile Care. AMA Code of Medical Ethics. Available at: http://www.ama‐assn.org/ama/pub/physician‐resources/medical‐ethics/code‐medical‐ethics/opinion2035.page. Accessed March 23,2011.
- .The Texas advance directives act is ethically flawed: medical futility disputes must be resolved by a fair process.Chest.2009;136:971–973.
- ,,, et al.Outcomes of critically ill patients who received cardiopulmonary resuscitation.Am J Respir Crit Care Med.2010;182:501–506.
- .Bentham in a box: technology assessment and health care allocation.Law Med Health Care.1986;14:172–174.
- ,,.Surgical decision making. The reliability of clinical judgment.Ann Surg.1979;190:409–419.
- ,,.Risk taking and tolerance of uncertainty: implications for surgeons.J Surg Res.2006;131:1–6.
- .Simple inference heuristics versus complex decision machines.Minds and Machines.1999;9:461–477.
- ,,.Surgeons and cognitive processes.Br J Surg.2003;90:1–6.
- ,,,,,.Evaluation of patients with severe symptomatic aortic stenosis who do not undergo aortic valve replacement: the potential role of subjectively overestimated operative risk.Circ Cardiovasc Qual Outcomes.2009;2:533–539.
- ,,, et al.Power and limitations of daily prognostications of death in the medical intensive care unit.Crit Care Med.2011;39:474–479.
- ,.Extent and determinants of error in doctors' prognoses in terminally ill patients: prospective cohort study.BMJ.2000;320:469–473.
- ,.Prognostic disclosure to patients with cancer near the end of life.Ann Intern Med.2001;134:1096–1105.
- ,,,.Genetic and environmental influences on disordered gambling in men and women.Arch Gen Psychiatry.2010;67:624–630.
- ,,,,.The dopamine transporter gene, a spectrum of most common risky behaviors, and the legal status of the behaviors.PLoS ONE.2010;22:e935216..
- ,,, et al.An international comparison of physicians' judgments of outcome rates of cardiac procedures and attitudes toward risk, uncertainty, justifiability and regret.Med Decis Making.1998;18:131–140.
- ,,,,.Educational quality improvement report: outcomes from a revised morbidity and mortality format that emphasized patient safety.Qual Saf Health Care.2007;16:422–427.
- ,,,.Risk attitudes of anesthesiologists and surgeons in clinical decision making with expected years of life.J Clin Anesthesia.2000;12:146–150.
- .Intention and the omission bias: omissions perceived as nondecisions.Acta Psychol.1996;93:161–172.
- ,,, et al.An objective analysis of process errors in trauma resuscitations.Acad Emerg Med.2000;1303–1310.
- ,,.Omission bias and decision making in pulmonary and critical care medicine.Chest.2005;128:1497–1505.
- .Professing ethically. On the place of ethics in defining decisions.JAMA.1983;249:1305–1310.
- ,,, et al.The influence of the probability of survival on patients' preferences regarding cardiopulmonary resuscitation.N Engl J Med.1994;330:545–549.
- .Restricting CPR to patients who provide informed consent will not permit physicians to unilaterally refuse requested CPR.Am J Bioethics.2010;10:82–83.
- ,,.Cardiopulmonary resuscitation on television. Miracles and misinformation.N Engl J Med.1996;334:1578–1582.
- ,.Acute care surgery in evolution.Crit Care Med.2010;38:S405–S410.
- ,,,.Acute care surgery survey: opinion of surgeons about a new training paradigm.Arch Surg.2011;146:101–106.
- ,,,.ASA classification and perioperative variables as predictors of postoperative outcome.Br J Anaesth.1996;77:217–222.
- ,.Multicultural Medicine and Health Disparities.New York, NY:McGraw‐Hill;2006.
- ,.Making it safe: the effects of leader inclusiveness and professional status on psychological safety and improvement efforts in health care teams.J Organiz Behav.2006;27:941–966.
- .Counterpoint: is it ethical to order “do not resuscitation” without patient consent?Chest.2007;132:751–754.
- ,.Point: the ethics of unilateral “do not resuscitate” orders: the role of “informed assent.”Chest.2007;132:748–751.
- ,,,.Reviving the conversation around CPR/DNR.Am J Bioethics.2010;10:61–67.
Duration of VTE Risk in Medically Ill Patients
Patients who are hospitalized for acute medical illness are at an increased risk of developing venous thromboembolism (VTE), which comprises deep‐vein thrombosis (DVT) and pulmonary embolism (PE).13 In a recent real‐world study of 158,325 US medical patients by Spyropoulos et al,4 4.0% of patients developed DVT, 1.5% developed PE, and 0.2% developed both DVT and PE. Furthermore, results from a population‐based case‐control study indicate that hospitalization for medical illness accounted for a proportion of VTE events similar to that of hospitalization for surgery (22% and 24%, respectively).5
Thromboprophylaxis reduces VTE incidence in at‐risk medical patients and is recommended according to evidence‐based guidelines from the American College of Chest Physicians (ACCP).1 The ACCP guidelines advocate that acutely ill medical patients admitted to the hospital with congestive heart failure (CHF) or severe lung disease/chronic obstructive pulmonary disease (COPD) or those who are confined to bed and have one or more additional risk factors (including active cancer, previous VTE, sepsis, acute neurologic disease, or inflammatory bowel disease) receive pharmacological prophylaxis with lowmolecular weight heparin (LMWH), low‐dose unfractionated heparin (UFH), or fondaparinux.1 Although guidelines provide recommendations for the duration of prophylaxis after major orthopedic surgery, such recommendations are unavailable for medical patients. In clinical trials of acutely ill medical patients, prophylaxis regimens found to be effective were provided for a duration of hospitalization of 6‐14 days.68 The mean length of hospital stay for medical illnesses is decreasing and is currently shorter than 6‐14 days.9, 10
In clinical practice, the duration of VTE risk during and after hospitalization is not well understood in medical patients, particularly in the context of shortening hospital stays. Such information could, however, provide insight into whether current thromboprophylaxis practices reflect real‐world need. To gain a greater understanding of the period during which patients are at risk of VTE, this retrospective, observational study assessed the incidence and time course of symptomatic VTE events during and after hospitalization in a large population of US medical patients.
METHODS
Data and Patient Selection
This study employed linked administrative claims data and hospital billing data contained in the Thomson Reuters MarketScan Inpatient Drug Link File. This combines longitudinal patient‐level inpatient and outpatient medical and pharmaceutical claims data from the MarketScan Commercial claims data from the MarketScan Commercial Claims and Encounters (Commercial) and Medicare Supplemental and Coordination of Benefits (Medicare Supplemental) databases, with hospital discharge records detailing services used and drugs administered during a hospitalization, which are included in the Hospital Drug Database. The linked data sources enable analysis of a patient's experience before, during, and after a hospitalization. The present study was not designed to obtain bleeding rates.
The study cohort comprised patients considered to be at‐risk for VTE as a result of a medical hospitalization occurring between January 1, 2005, and December 31, 2008. At‐risk medical hospitalizations were those for which the primary diagnosis was for cancer, CHF, severe lung disease/COPD, or infectious disease (see Supporting Information, Appendix I, for International Classification of Diseases, 9th Revision, Clinical Modification [ICD‐9‐CM] codes used to identify patients with medical illnesses). Included patients were required to be at least 18 years of age at the time of admission and were required to be continuously enrolled in their insurance benefits for at least 12 months before admission (the baseline period) and for at least 180 days after the admission date (the evaluation period) to ensure that all administrative claims data during that period were captured. Patients who died in‐hospital from any cause were exempted from the continuous enrollment criterion, as long as they had been continuously enrolled prior to inpatient death. Patients transferred from or discharged to another acute‐care facility were excluded because of the possibility for incomplete inpatient data capture. For patients who had multiple medical hospitalizations between January 1, 2005, and December 31, 2008, the hospitalization around which the analysis focused was randomly selected from the set of potential medical hospitalizations.
Prophylaxis
Pharmacological prophylaxis was identified via charge codes during hospitalization or via pharmacy claims after discharge for UFH, enoxaparin, dalteparin, warfarin, and fondaparinux. All dosages of a pharmacological agent were considered prophylactic only if there was no evidence of VTE during the admission, with the exception of warfarin (Supporting Information, Appendix II). Post‐discharge use of anticoagulation therapy was measured for up to 35 days after discharge from the hospital. Use of mechanical prophylaxis during hospitalization was identified via charge codes for graduated compression stockings and charge codes indicating use of intermittent pneumatic compression devices and/or venous foot pumps. The appropriateness of prophylaxis was not assessed.
Analysis
The risk of VTE was estimated across an evaluation period of 180 days by measuring VTE occurrence and person‐time exposure. Inpatient VTE occurrence was defined as any nonprimary diagnosis of DVT and/or PE during the at‐risk hospitalization. VTE after discharge was defined as an ICD‐9‐CM diagnosis code, whether primary or secondary, for DVT or PE in the evaluation period during an emergency room or inpatient admission, or on an outpatient claim with 1 or more of the following confirmatory events: an emergency room or inpatient admission for VTE within 2 days of the outpatient diagnosis; a prescription claim for enoxaparin, fondaparinux, or UFH within 15 days after diagnosis; or a prescription claim for warfarin within 15 days after diagnosis and no evidence of atrial fibrillation or atrial flutter in the 6 months before the outpatient diagnosis for DVT or PE. Person‐time exposure was measured as the number of days from the hospital admission date to the first occurrence of VTE, or censoring at a subsequent at‐risk hospitalization, death, or 180 days after admission.
Cumulative risk of VTE over the 180‐day evaluation period was calculated by the Kaplan‐Meier product limit method of survival analysis and displayed for deciles of cumulative risk at 180 days after the hospital admission date. The risk of VTE at each point of time during the evaluation period (the hazard function) was first calculated on a daily basis and then smoothed via LOESS regression, a locally weighted regression procedure.
RESULTS
Patient Demographics
A total of 11,139 medical patients were included in the analysis (Figure 1), with a mean standard deviation (SD) age of 67.6 13.9 years, and 51.6% were women (Table 1). Of the reasons for admission to the hospital, 51.5% of patients were admitted for severe lung disease/COPD, 20.1% were admitted for cancer, 15.3% were admitted for CHF, and 13.1% were admitted for severe infectious disease. Most patients were treated in an urban hospital (87.5%), in a hospital without teaching status (87.9%), and in the South Census region (74.1%). The majority of patients were treated in medium‐sized to large care facilities. Risk factors for VTE during the baseline period included hospitalization for a medical condition with a high risk for VTE (75.6%), a prior at‐risk hospitalization (18.6%), cancer therapy (10.0% of all medical patients combined and 18.5% of cancer patients), trauma (9.2%), and previous VTE (4.3%).
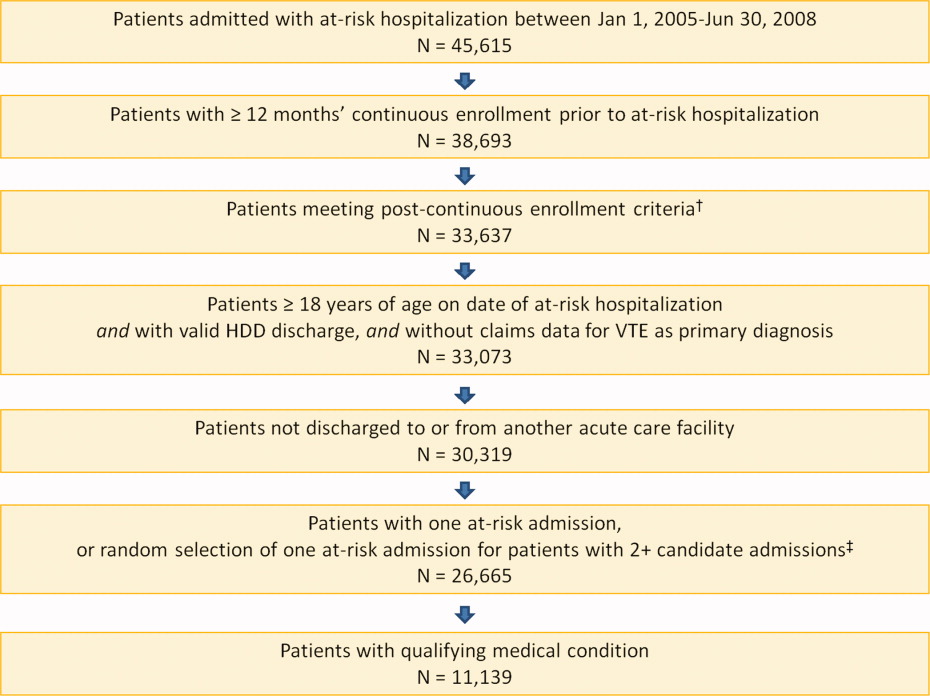
| Characteristic | Medical Patients (N = 11,139) |
|---|---|
| |
| Gender | |
| Men | 5389 (48.4) |
| Women | 5750 (51.6) |
| Reason for hospitalization | |
| Cancer | 2243 (20.1) |
| CHF | 1705 (15.3) |
| Severe lung disease/COPD | 5736 (51.5) |
| Severe infectious disease | 1455 (13.1) |
| Age group, years | |
| 1834 | 230 (2.1) |
| 3544 | 442 (4.0) |
| 4554 | 1188 (10.7) |
| 5564 | 2644 (23.7) |
| 6574 | 2657 (23.9) |
| 7584 | 2969 (26.7) |
| 85 years | 1009 (9.1) |
| Median age SD, years | 67.6 13.9 |
| Primary payer* | |
| Medicare | 6819 (61.2) |
| Commercial | 4320 (38.8) |
| Geographical area | |
| Northeast | 122 (1.1) |
| North Central | 2649 (23.8) |
| South | 8258 (74.1) |
| West | 110 (1.0) |
| Urban location | 9743 (87.5) |
| Teaching hospital | 1345 (12.1) |
| Licensed bed size | |
| 1199 | 1621 (14.6) |
| 200299 | 2869 (25.8) |
| 300499 | 4005 (36.0) |
| 500 | 2644 (23.7) |
VTE Prophylaxis
Patients stayed in hospital for a mean SD duration of 5.3 5.3 days, varying from 4.6 3.9 days in patients with CHF to 6.7 6.5 days in patients with infectious disease, during which 46.7% of patients received pharmacological VTE prophylaxis. Inpatient pharmacological prophylaxis rates ranged from 64.1% in patients with CHF to 30.7% in patients with cancer (Table 2). Overall, the most commonly used form of inpatient pharmacological prophylaxis was enoxaparin (26.8% of all patients), followed by UFH (13.5% of all patients). Mechanical prophylaxis was received by 12.2% of all patients. Mean SD VTE prophylaxis duration during hospitalization was 5.0 4.7 days, varying from 4.2 4.0 days in patients with cancer to 6.2 5.5 days in patients with infectious disease.
| n (%) | Infectious Disease (n = 1455) | CHF (n = 1705) | Severe Lung Disease/COPD (n = 5736) | Cancer (n = 2243) | Any Medical (N = 11,139) |
|---|---|---|---|---|---|
| |||||
| Pharmacological prophylaxis during hospitalization* | 599 (41.2) | 1093 (64.1) | 2820 (49.2) | 688 (30.7) | 5200 (46.7) |
| Enoxaparin | 362 (24.9) | 466 (27.3) | 1877 (32.7) | 282 (12.6) | 2987 (26.8) |
| UFH | 191 (13.1) | 400 (23.5) | 527 (9.2) | 383 (17.1) | 1501 (13.5) |
| Warfarin | 135 (9.3) | 498 (29.2) | 622 (10.8) | 95 (4.2) | 1350 (12.1) |
| Dalteparin | 16 (1.1) | 21 (1.2) | 109 (1.9) | 16 (0.7) | 162 (1.5) |
| Fondaparinux | 5 (0.3) | 4 (0.2) | 22 (0.4) | 2 (0.1) | 33 (0.3) |
| Mechanical prophylaxis in hospital | 148 (10.2) | 65 (3.8) | 343 (6.0) | 803 (35.8) | 1359 (12.2) |
| Anticoagulation within 35 days after discharge | 104 (7.1) | 315 (18.5) | 397 (6.9) | 166 (7.4) | 982 (8.8) |
| Enoxaparin | 15 (1.0) | 14 (0.8) | 32 (0.6) | 25 (1.1) | 86 (0.8) |
| UFH | 17 (1.2) | 10 (0.6) | 23 (0.4) | 35 (1.6) | 85 (0.8) |
| Warfarin | 79 (5.4) | 302 (17.7) | 357 (6.2) | 116 (5.2) | 854 (7.7) |
| Dalteparin | 0 | 0 | 2 (<0.1) | 1 (<0.1) | 3 (<0.1) |
| Fondaparinux | 1 (0.1) | 0 | 0 | 2 (0.1) | 3 (<0.1) |
| Antiplatelet therapy within 35 days after discharge | 72 (4.9) | 217 (12.7) | 351 (6.1) | 53 (2.4) | 693 (6.2) |
In the 35 days after discharge, 8.8% of patients received anticoagulation therapy, most commonly warfarin (7.7%). The rate of outpatient prophylaxis was highest in patients hospitalized for CHF (18.5%) compared with other medical conditions (7%).
Time Course of VTE Risk and Hazard Function
Overall, there were 366 symptomatic VTE events, representing a VTE rate of 3.3%. These events comprised 241 DVT‐only events, 98 PE‐only events, and 27 events with evidence of both DVT and PE. In total, 43.4% of events occurred during hospitalization (Figure 2). The VTE rate was 5.7% in patients with cancer (30.5% of events occurring in hospital), 4.3% with infectious disease (61.9% in hospital), 3.1% with CHF (54.7% in hospital), and 2.1% with severe lung disease/COPD (42.6% in hospital). The highest number of VTE events, 97 events (62 DVT only, 26 PE only, and 9 events both DVT and PE), occurred in the first 9 days after the hospital admission date, of which 87.6% were during hospitalization. During days 10‐19, there were 82 VTE events (50 DVT only, 24 PE only, and 8 both DVT and PE), 70.7% of which occurred in the hospital. Over the following 10‐day periods, VTE incidence gradually declined (Figure 2) and fluctuated at a background level of 4‐8 events during each 10‐day interval from 120 to 180 days.
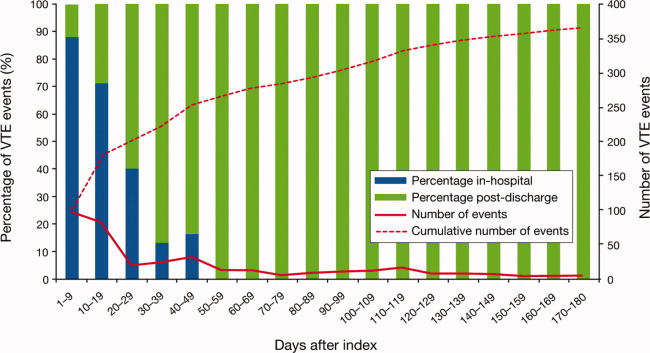
The cumulative probability of VTE among all patients was 0.035 (Figure 3A). Half of the VTE risk had accumulated by day 23, and 75% had accumulated by day 71. By day 30, the proportion of cumulative risk was 52.6% overall, and ranged from 41.9% with cancer to 72.9% with infectious disease (Figure 3).
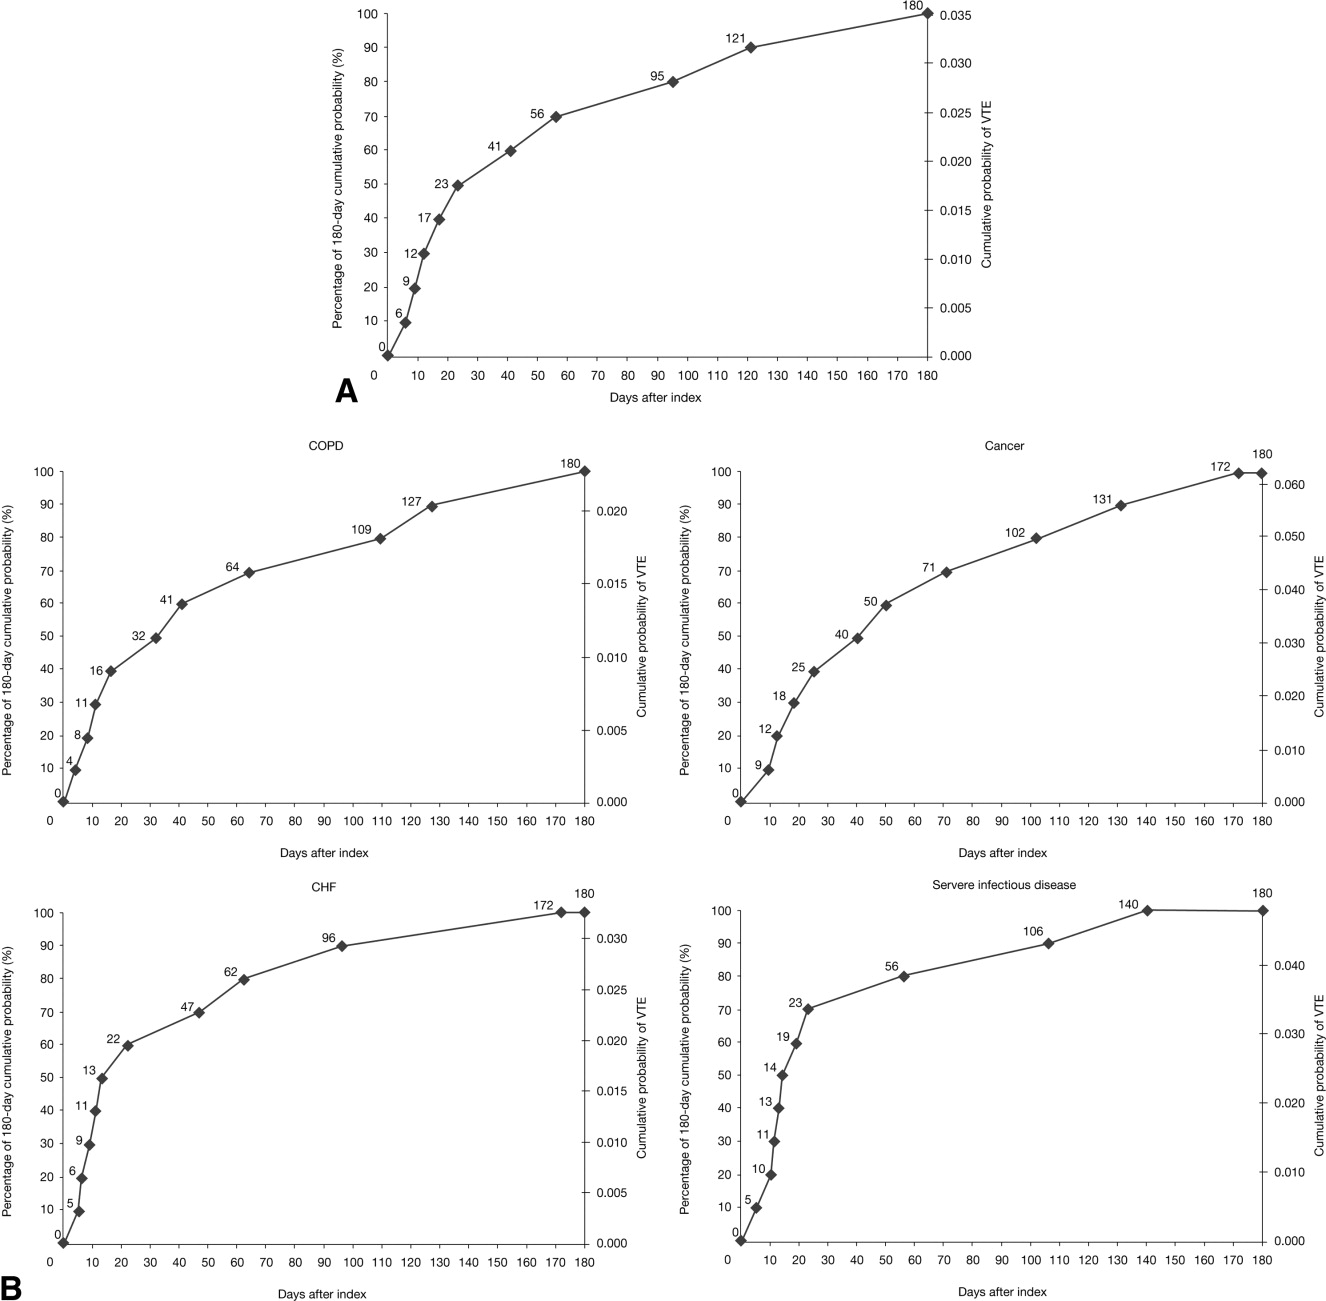
The VTE hazard peaked at approximately 1.05 VTE events per 1000 person‐days on day 8 after the hospital admission date overall (Figure 4A). The cumulative hazard at the peak day was 18.2% of the total VTE hazard over the 180‐day evaluation period. The hazard peak ranged from day 7 in patients with severe lung disease/COPD to day 12 in patients with infectious disease (Figure 4B). The cumulative hazard at the peak day was 39.7% for patients with infectious disease, 29.2% for patients with CHF, and approximately 19% for cancer or severe lung disease/COPD. After the peak risk day, the VTE hazard function decreased until the curve reached an inflection point, at day 28, when the cumulative risk was 51.8% (Figure 4A). After the inflection point, the VTE hazard increased to 0.3 VTE events per 1000 person‐days at approximately day 40‐45 and then decreased to <0.2 events per 1000 person‐days. The timing of the inflection varied by approximately 1 week across the medical illnesses (ranging from day 25 for severe lung disease/COPD to day 33 for CHF), with the cumulative risk at the inflection point ranging from 41.9% with cancer to 72.9% with infectious disease.
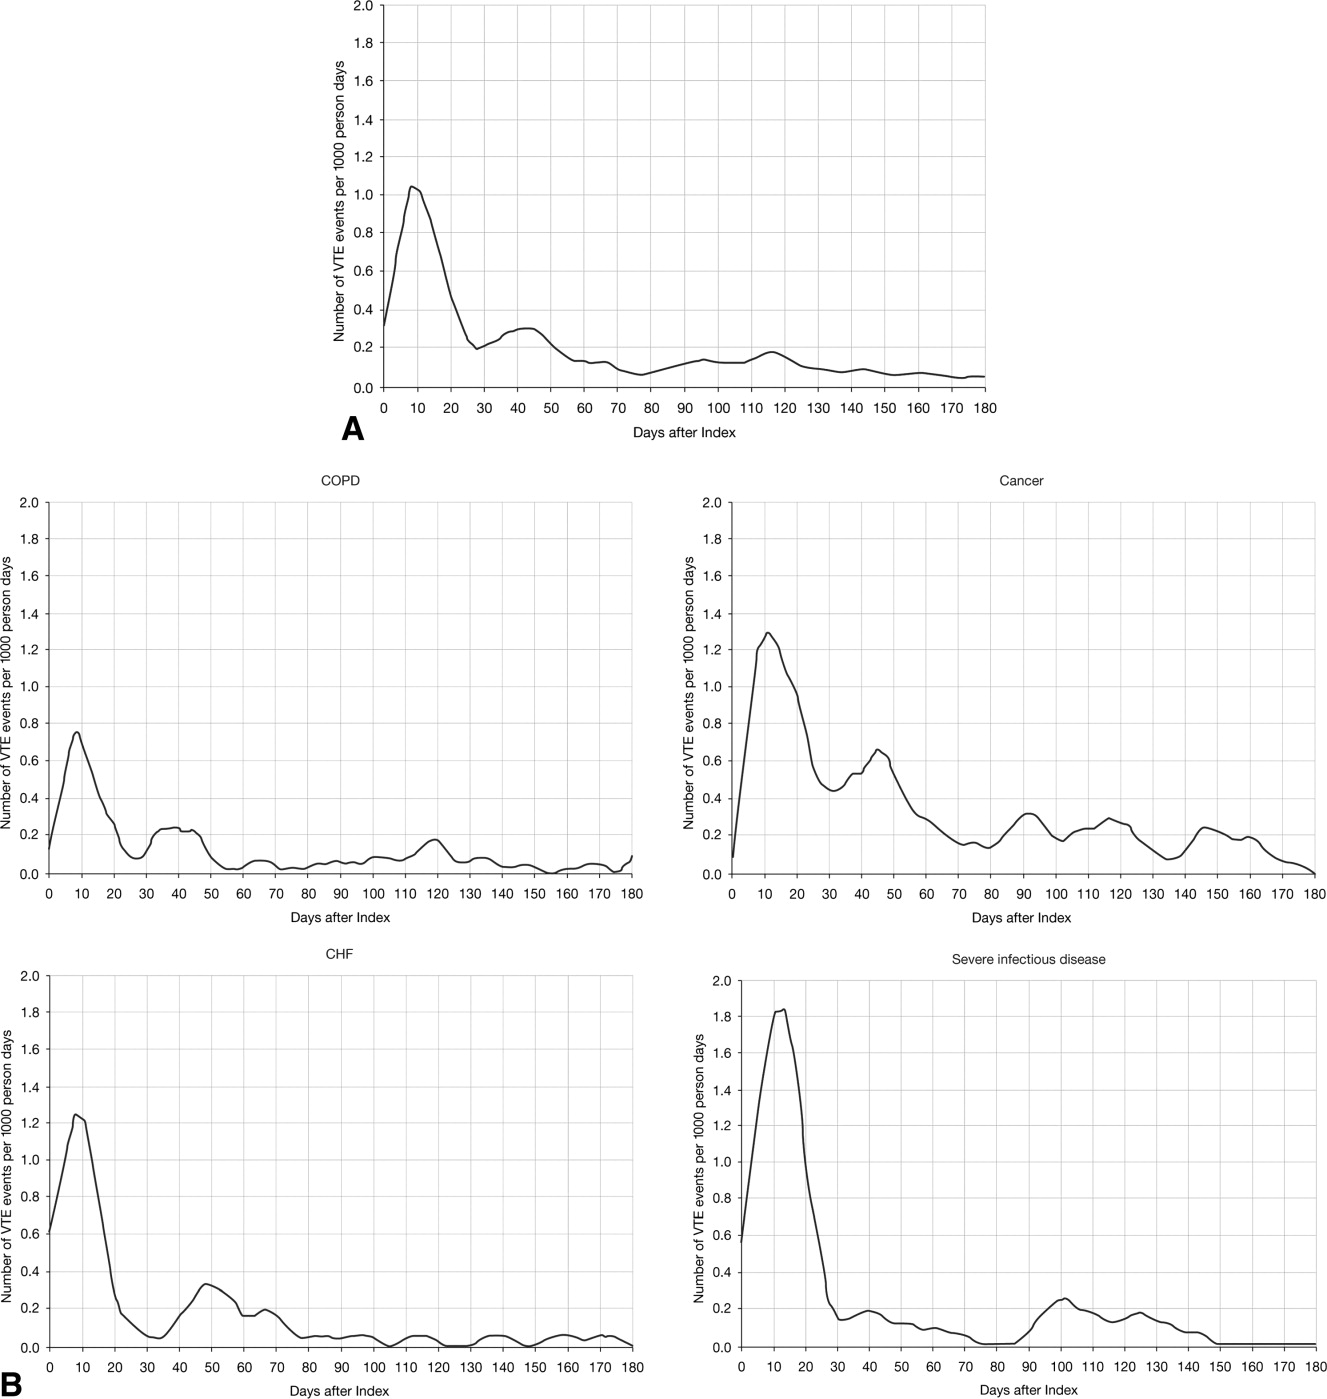
DISCUSSION
The results from this large, real‐world study provide new insights into the duration of risk of symptomatic VTE in medical patients and demonstrate that the number of VTE events was highest during days 0‐19, with the peak of VTE hazard at day 8. Half of the total 180‐day cumulative risk had been incurred by day 23 after hospital admission, and the period of greatest increased risk extended up to at least 30 days. Importantly, more than half of VTE events occurred after discharge (56.6%). A particularly high proportion of VTE events (69.5%) had occurred after discharge in patients with cancer. Although it was assumed that most VTE events that could be reasonably attributed to an at‐risk hospitalization would occur within 90 days as shown previously,4, 11 the 180‐day evaluation period was used to examine whether there was a prolonged period of continually diminished VTE risk from 90 to 180 days. Thus, events occurring within the later portions of the evaluation period may or may not have been attributable to the index hospitalization, potentially reflecting a background rate of VTE as noted above. Although these events are included in our estimate of the 180‐day cumulative risk of VTE, interpretation of the study results excluding such events is possible by examining the cumulative risk that had been incurred at each time point during the evaluation period.
Few other studies have assessed the duration of VTE risk in hospitalized medical patients. In a study by Spyropoulos et al,4 the median time to a DVT and/or PE event was 74 days, ranging from 62 days in severe infectious disease to 126 days in CHF. In another observational study that included patients who had recently been hospitalized but had not undergone surgery, 66.9% of patients who experienced DVT and/or PE events were diagnosed with DVT and/or PE within the first month after hospital discharge; 19.9% between months 1 and 2, and 13.2% between months 2 and 3.12
Fewer than half of the patients in the present study received thromboprophylaxis, which is consistent with other studies demonstrating the low prophylaxis rates in medical inpatients.9, 1315 In a recently published US study of discharge records that included 22,455 medical inpatients, prophylaxis rates were 59.4% in patients with CHF, 52.3% with cancer, 45.8% with severe lung disease/COPD, and 40.4% with infectious disease.14 Fewer than 10% of patients in the present study received prophylaxis after discharge, a result that is consistent with other studies.4, 9
The effect of extended prophylaxis in acutely ill medical patients with the LMWH enoxaparin beyond 6‐14 days has been investigated in the EXCLAIM study.16 This trial included approximately 5800 acutely ill medical patients at significant risk of developing VTE due to a recent reduction in mobility. Patients in the extended prophylaxis group had a lower risk of VTE (2.5% vs 4% for placebo; absolute risk reduction 1.5% [95.8% confidence interval 2.54% to 0.52%]), but had increased major bleeding events (0.8% vs 0.3% for placebo; absolute risk difference favoring placebo, 0.51% [95% confidence interval, 0.12% to 0.89%]). The patient populations with most benefit from an additional 28 days prophylaxis with enoxaparin, in addition to the usual short‐term prophylaxis of 10 days, were patients with restricted mobility (level 1; total bed rest/sedentary), elderly patients (age >75 years), and women. A limitation of the EXCLAIM trial is that estimates of efficacy and safety are difficult to interpret: after an interim analysis of adjudicated efficacy and safety outcomes, amendments were made to the original study protocol by changing eligibility criteria for patients with level 2 immobility (level 1 with bathroom privileges).16
The optimal duration of prophylaxis for medical patients has not been determined; prophylaxis is generally administered to at‐risk medical patients for the duration of hospitalization. In the current study, mean length of stay was 5.3 5.3 days overall. As hospital stays shorten, many medical patients who are prescribed inpatient prophylaxis alone are unlikely to receive the standard 6‐14 days of prophylaxis shown to be effective in clinical trials.68 Furthermore, the extended period of VTE risk in the present study and the finding that 56.6% of events occurred after discharge also suggest that current practices for inpatient prophylaxis alone may need to be evaluated.
This study reports real‐world data from a large, well‐defined population and obtains the incidence of symptomatic VTE events. Even though certain demographic data deviate from the national averagefor example, 74.1% of patients were treated in the South Census region, whereas this region is served by 37.6% of US hospitals17; 87.5% of hospitals had an urban location (compared with 60.1% of US hospitals18), and 85.4% of hospitals had a licensed bed size of at least 200 beds (compared with 28.2% of US hospitals, with the average US hospital having fewer than 100 beds19)these data may be beneficial in guiding policy and health care strategies for gaining understanding of the duration of risk for VTE.
Limitations of the study include characterization of the VTE risk period through examination of the cumulative risk and hazard of VTE across time, as the actual VTE risk period cannot be determined with exact precision. We used ICD‐9‐CM diagnosis coding to identify VTE. Since many cases of PE are asymptomatic and detected at autopsy,20 our approach may have missed such cases, as they would not have been recorded within the database. Furthermore, validation studies suggest that suboptimal specificity exists for ICD‐9‐CM diagnosis codes used to identify VTE.21 In an attempt to improve the specificity of our VTE identification algorithm, we required that post‐discharge VTE was recorded either during an emergency room or subsequent inpatient admission (which would be indicative of acute care for VTE) or on an outpatient claim with subsequent evidence of treatment for VTE. The true sensitivity and specificity of the VTE identification algorithms used for this study remain unknown, however, so the study findings should be interpreted in light of this limitation. The databases used for the analysis may not be representative of the US population as a whole; for example, this study used claims data from commercial and Medicare supplemental databases, which do not include Medicaid patients. Another limitation was that outpatient mechanical prophylaxis, such as graded compression stockings, was not captured due to over‐the‐counter availability. In addition, appropriateness of prophylaxis was not determined in this study, because these data could not be obtained from the claims database used. Further studies are warranted to obtain information on the incidence of VTE after hospitalization for medical illness in patients who received appropriate prophylaxis during hospitalization.
Finally, all dosages of a pharmacological agent were considered prophylactic only if a VTE event did not occur, with the exception of warfarin; any dose of warfarin was considered for prophylaxis, regardless of a VTE diagnosis. Warfarin may be used for purposes other than VTE prophylaxis (eg, prophylaxis for a thromboembolic cerebrovascular accident). The data source does not allow for identifying the exact reason for anticoagulation therapy with warfarin. Nonetheless, warfarin therapy will confer a decreased risk of VTE regardless of its purpose.
Results from this large cohort of medical patients indicate that symptomatic VTE risk is highest within the first 19 days after hospital admission (a period that may encompass both the duration of hospitalization as well as the period after discharge) with a considerable risk of VTE extending into the period after discharge. Receiving appropriate prophylaxis in‐hospital remains of great importance to prevent inpatient and likely post‐discharge VTE in patients with acute medical illness. In addition, given the time course of VTE events, with VTE incidence peaking at 8 days but with increased risk extending to 30 days, and the number of out‐of‐hospital VTE events incurred, the results of this study suggest that future research is warranted to investigate the risks and benefits of improving thromboprophylaxis practices in the period after hospitalization.
Acknowledgements
Funding Source: sanofi‐aventis U.S. provided funding to Thomson Reuters to perform this study. The authors received editorial/writing support from Tessa Hartog of Excerpta Medica in the preparation of the manuscript funded by sanofi‐aventis U.S.
Disclosure: Alpesh Amin has received research honorarium and is on the speakers bureau for sanofi‐aventis U.S. Otsuka Pharmaceutical, and Boehringer‐Ingelheim. Helen Varker, Nicole Princic, and Stephen Johnston are employees at Thomson Reuters, which received funding from sanofi‐aventis U.S. Jay Lin is an employee of Novosys Health, which received funding from sanofi‐aventis U.S. Stephen Thompson is an employee of sanofi‐aventis U.S.
- , , , et al. Prevention of venous thromboembolism: American College of Chest Physicians Evidence‐Based Clinical Practice Guidelines (8th Edition). Chest. 2008;133(6 Suppl):381S–453S.
- , , , , , . Risk factors for deep vein thrombosis and pulmonary embolism: a population‐based case‐control study. Arch Intern Med. 2000;160:809–815.
- . The epidemiology of venous thromboembolism in the community. Arterioscler Thromb Vasc Biol. 2008;28:370–372.
- , , , . Rates of venous thromboembolism occurrence in medical patients among the insured population. Thromb Haemost. 2009;102:951–957.
- , , , et al. Relative impact of risk factors for deep vein thrombosis and pulmonary embolism: a population‐based study. Arch Intern Med. 2002;162:1245–1248.
- , , , et al. A comparison of enoxaparin with placebo for the prevention of venous thromboembolism in acutely ill medical patients. Prophylaxis in Medical Patients with Enoxaparin Study Group. N Engl J Med. 1999;341:793–800.
- , , , et al. Randomized, placebo‐controlled trial of dalteparin for the prevention of venous thromboembolism in acutely ill medical patients. Circulation. 2004;110:874–879.
- , , , et al. Efficacy and safety of fondaparinux for the prevention of venous thromboembolism in older acute medical patients: randomised placebo controlled trial. BMJ. 2006;332:325–329.
- , , . Lack of thromboprophylaxis across the care continuum in US medical patients. Hosp Pract (Minneap). 2010;38:17–25.
- HCUP NIS Related Reports. Healthcare Cost and Utilization Project (HCUP), September 2008. Available at: www.hcup‐us.ahrq.gov/db/nation/nis/nisrelatedreports.jsp. Accessed June 2011.
- , . Direct medical costs of venous thromboembolism and subsequent hospital readmission rates: an administrative claims analysis from 30 managed care organizations. J Manag Care Pharm. 2007;13:475–486.
- , , , , . Venous thromboembolism in the outpatient setting. Arch Intern Med. 2007;167:1471–1475.
- , , , . Inpatient thromboprophylaxis use in U.S. hospitals: adherence to the seventh American College of Chest Physician's recommendations for at‐risk medical and surgical patients. J Hosp Med. 2009;4:E15–E21.
- , , , et al. Are hospitals delivering appropriate VTE prevention? The venous thromboembolism study to assess the rate of thromboprophylaxis (VTE start). J Thromb Thrombolysis. 2010;29:326–339.
- , , , et al. Venous thromboembolism risk and prophylaxis in hospitalised medically ill patients. The ENDORSE Global Survey. Thromb Haemost. 2010;103:736–748.
- , , , et al. Extended‐duration venous thromboembolism prophylaxis in acutely ill medical patients with recently reduced mobility: a randomized trial. Ann Intern Med. 2010;153:8–18.
- American Society for Healthcare Engineering of the American Hospital Association. Overview of the Hospital Market, 2009. Available from: www.ashe.org/e2c/pdfs/energy/heg_ch2_background.pdf. Accessed June 2011.
- American Hospital Association. Fast Facts on US Hospitals, 2009. Available at: http://www.aha.org/aha/resource‐center/Statistics‐and‐Studies/fast‐facts.html. Accessed June 2011.
- American Hospital Association. AHA Annual Survey of Hospitals Database, 2009. Available from: http://www.ahadata.com/ahadata_app/index.jsp. Accessed June 2011.
- . The epidemiology of venous thromboembolism. Circulation. 2003;107(23 suppl 1):I4–I8.
- , , , et al. How valid is the ICD‐9‐CM based AHRQ patient safety indicator for postoperative venous thromboembolism? Med Care. 2009;47:1237–1243.
Patients who are hospitalized for acute medical illness are at an increased risk of developing venous thromboembolism (VTE), which comprises deep‐vein thrombosis (DVT) and pulmonary embolism (PE).13 In a recent real‐world study of 158,325 US medical patients by Spyropoulos et al,4 4.0% of patients developed DVT, 1.5% developed PE, and 0.2% developed both DVT and PE. Furthermore, results from a population‐based case‐control study indicate that hospitalization for medical illness accounted for a proportion of VTE events similar to that of hospitalization for surgery (22% and 24%, respectively).5
Thromboprophylaxis reduces VTE incidence in at‐risk medical patients and is recommended according to evidence‐based guidelines from the American College of Chest Physicians (ACCP).1 The ACCP guidelines advocate that acutely ill medical patients admitted to the hospital with congestive heart failure (CHF) or severe lung disease/chronic obstructive pulmonary disease (COPD) or those who are confined to bed and have one or more additional risk factors (including active cancer, previous VTE, sepsis, acute neurologic disease, or inflammatory bowel disease) receive pharmacological prophylaxis with lowmolecular weight heparin (LMWH), low‐dose unfractionated heparin (UFH), or fondaparinux.1 Although guidelines provide recommendations for the duration of prophylaxis after major orthopedic surgery, such recommendations are unavailable for medical patients. In clinical trials of acutely ill medical patients, prophylaxis regimens found to be effective were provided for a duration of hospitalization of 6‐14 days.68 The mean length of hospital stay for medical illnesses is decreasing and is currently shorter than 6‐14 days.9, 10
In clinical practice, the duration of VTE risk during and after hospitalization is not well understood in medical patients, particularly in the context of shortening hospital stays. Such information could, however, provide insight into whether current thromboprophylaxis practices reflect real‐world need. To gain a greater understanding of the period during which patients are at risk of VTE, this retrospective, observational study assessed the incidence and time course of symptomatic VTE events during and after hospitalization in a large population of US medical patients.
METHODS
Data and Patient Selection
This study employed linked administrative claims data and hospital billing data contained in the Thomson Reuters MarketScan Inpatient Drug Link File. This combines longitudinal patient‐level inpatient and outpatient medical and pharmaceutical claims data from the MarketScan Commercial claims data from the MarketScan Commercial Claims and Encounters (Commercial) and Medicare Supplemental and Coordination of Benefits (Medicare Supplemental) databases, with hospital discharge records detailing services used and drugs administered during a hospitalization, which are included in the Hospital Drug Database. The linked data sources enable analysis of a patient's experience before, during, and after a hospitalization. The present study was not designed to obtain bleeding rates.
The study cohort comprised patients considered to be at‐risk for VTE as a result of a medical hospitalization occurring between January 1, 2005, and December 31, 2008. At‐risk medical hospitalizations were those for which the primary diagnosis was for cancer, CHF, severe lung disease/COPD, or infectious disease (see Supporting Information, Appendix I, for International Classification of Diseases, 9th Revision, Clinical Modification [ICD‐9‐CM] codes used to identify patients with medical illnesses). Included patients were required to be at least 18 years of age at the time of admission and were required to be continuously enrolled in their insurance benefits for at least 12 months before admission (the baseline period) and for at least 180 days after the admission date (the evaluation period) to ensure that all administrative claims data during that period were captured. Patients who died in‐hospital from any cause were exempted from the continuous enrollment criterion, as long as they had been continuously enrolled prior to inpatient death. Patients transferred from or discharged to another acute‐care facility were excluded because of the possibility for incomplete inpatient data capture. For patients who had multiple medical hospitalizations between January 1, 2005, and December 31, 2008, the hospitalization around which the analysis focused was randomly selected from the set of potential medical hospitalizations.
Prophylaxis
Pharmacological prophylaxis was identified via charge codes during hospitalization or via pharmacy claims after discharge for UFH, enoxaparin, dalteparin, warfarin, and fondaparinux. All dosages of a pharmacological agent were considered prophylactic only if there was no evidence of VTE during the admission, with the exception of warfarin (Supporting Information, Appendix II). Post‐discharge use of anticoagulation therapy was measured for up to 35 days after discharge from the hospital. Use of mechanical prophylaxis during hospitalization was identified via charge codes for graduated compression stockings and charge codes indicating use of intermittent pneumatic compression devices and/or venous foot pumps. The appropriateness of prophylaxis was not assessed.
Analysis
The risk of VTE was estimated across an evaluation period of 180 days by measuring VTE occurrence and person‐time exposure. Inpatient VTE occurrence was defined as any nonprimary diagnosis of DVT and/or PE during the at‐risk hospitalization. VTE after discharge was defined as an ICD‐9‐CM diagnosis code, whether primary or secondary, for DVT or PE in the evaluation period during an emergency room or inpatient admission, or on an outpatient claim with 1 or more of the following confirmatory events: an emergency room or inpatient admission for VTE within 2 days of the outpatient diagnosis; a prescription claim for enoxaparin, fondaparinux, or UFH within 15 days after diagnosis; or a prescription claim for warfarin within 15 days after diagnosis and no evidence of atrial fibrillation or atrial flutter in the 6 months before the outpatient diagnosis for DVT or PE. Person‐time exposure was measured as the number of days from the hospital admission date to the first occurrence of VTE, or censoring at a subsequent at‐risk hospitalization, death, or 180 days after admission.
Cumulative risk of VTE over the 180‐day evaluation period was calculated by the Kaplan‐Meier product limit method of survival analysis and displayed for deciles of cumulative risk at 180 days after the hospital admission date. The risk of VTE at each point of time during the evaluation period (the hazard function) was first calculated on a daily basis and then smoothed via LOESS regression, a locally weighted regression procedure.
RESULTS
Patient Demographics
A total of 11,139 medical patients were included in the analysis (Figure 1), with a mean standard deviation (SD) age of 67.6 13.9 years, and 51.6% were women (Table 1). Of the reasons for admission to the hospital, 51.5% of patients were admitted for severe lung disease/COPD, 20.1% were admitted for cancer, 15.3% were admitted for CHF, and 13.1% were admitted for severe infectious disease. Most patients were treated in an urban hospital (87.5%), in a hospital without teaching status (87.9%), and in the South Census region (74.1%). The majority of patients were treated in medium‐sized to large care facilities. Risk factors for VTE during the baseline period included hospitalization for a medical condition with a high risk for VTE (75.6%), a prior at‐risk hospitalization (18.6%), cancer therapy (10.0% of all medical patients combined and 18.5% of cancer patients), trauma (9.2%), and previous VTE (4.3%).
| Characteristic | Medical Patients (N = 11,139) |
|---|---|
| |
| Gender | |
| Men | 5389 (48.4) |
| Women | 5750 (51.6) |
| Reason for hospitalization | |
| Cancer | 2243 (20.1) |
| CHF | 1705 (15.3) |
| Severe lung disease/COPD | 5736 (51.5) |
| Severe infectious disease | 1455 (13.1) |
| Age group, years | |
| 1834 | 230 (2.1) |
| 3544 | 442 (4.0) |
| 4554 | 1188 (10.7) |
| 5564 | 2644 (23.7) |
| 6574 | 2657 (23.9) |
| 7584 | 2969 (26.7) |
| 85 years | 1009 (9.1) |
| Median age SD, years | 67.6 13.9 |
| Primary payer* | |
| Medicare | 6819 (61.2) |
| Commercial | 4320 (38.8) |
| Geographical area | |
| Northeast | 122 (1.1) |
| North Central | 2649 (23.8) |
| South | 8258 (74.1) |
| West | 110 (1.0) |
| Urban location | 9743 (87.5) |
| Teaching hospital | 1345 (12.1) |
| Licensed bed size | |
| 1199 | 1621 (14.6) |
| 200299 | 2869 (25.8) |
| 300499 | 4005 (36.0) |
| 500 | 2644 (23.7) |
VTE Prophylaxis
Patients stayed in hospital for a mean SD duration of 5.3 5.3 days, varying from 4.6 3.9 days in patients with CHF to 6.7 6.5 days in patients with infectious disease, during which 46.7% of patients received pharmacological VTE prophylaxis. Inpatient pharmacological prophylaxis rates ranged from 64.1% in patients with CHF to 30.7% in patients with cancer (Table 2). Overall, the most commonly used form of inpatient pharmacological prophylaxis was enoxaparin (26.8% of all patients), followed by UFH (13.5% of all patients). Mechanical prophylaxis was received by 12.2% of all patients. Mean SD VTE prophylaxis duration during hospitalization was 5.0 4.7 days, varying from 4.2 4.0 days in patients with cancer to 6.2 5.5 days in patients with infectious disease.
| n (%) | Infectious Disease (n = 1455) | CHF (n = 1705) | Severe Lung Disease/COPD (n = 5736) | Cancer (n = 2243) | Any Medical (N = 11,139) |
|---|---|---|---|---|---|
| |||||
| Pharmacological prophylaxis during hospitalization* | 599 (41.2) | 1093 (64.1) | 2820 (49.2) | 688 (30.7) | 5200 (46.7) |
| Enoxaparin | 362 (24.9) | 466 (27.3) | 1877 (32.7) | 282 (12.6) | 2987 (26.8) |
| UFH | 191 (13.1) | 400 (23.5) | 527 (9.2) | 383 (17.1) | 1501 (13.5) |
| Warfarin | 135 (9.3) | 498 (29.2) | 622 (10.8) | 95 (4.2) | 1350 (12.1) |
| Dalteparin | 16 (1.1) | 21 (1.2) | 109 (1.9) | 16 (0.7) | 162 (1.5) |
| Fondaparinux | 5 (0.3) | 4 (0.2) | 22 (0.4) | 2 (0.1) | 33 (0.3) |
| Mechanical prophylaxis in hospital | 148 (10.2) | 65 (3.8) | 343 (6.0) | 803 (35.8) | 1359 (12.2) |
| Anticoagulation within 35 days after discharge | 104 (7.1) | 315 (18.5) | 397 (6.9) | 166 (7.4) | 982 (8.8) |
| Enoxaparin | 15 (1.0) | 14 (0.8) | 32 (0.6) | 25 (1.1) | 86 (0.8) |
| UFH | 17 (1.2) | 10 (0.6) | 23 (0.4) | 35 (1.6) | 85 (0.8) |
| Warfarin | 79 (5.4) | 302 (17.7) | 357 (6.2) | 116 (5.2) | 854 (7.7) |
| Dalteparin | 0 | 0 | 2 (<0.1) | 1 (<0.1) | 3 (<0.1) |
| Fondaparinux | 1 (0.1) | 0 | 0 | 2 (0.1) | 3 (<0.1) |
| Antiplatelet therapy within 35 days after discharge | 72 (4.9) | 217 (12.7) | 351 (6.1) | 53 (2.4) | 693 (6.2) |
In the 35 days after discharge, 8.8% of patients received anticoagulation therapy, most commonly warfarin (7.7%). The rate of outpatient prophylaxis was highest in patients hospitalized for CHF (18.5%) compared with other medical conditions (7%).
Time Course of VTE Risk and Hazard Function
Overall, there were 366 symptomatic VTE events, representing a VTE rate of 3.3%. These events comprised 241 DVT‐only events, 98 PE‐only events, and 27 events with evidence of both DVT and PE. In total, 43.4% of events occurred during hospitalization (Figure 2). The VTE rate was 5.7% in patients with cancer (30.5% of events occurring in hospital), 4.3% with infectious disease (61.9% in hospital), 3.1% with CHF (54.7% in hospital), and 2.1% with severe lung disease/COPD (42.6% in hospital). The highest number of VTE events, 97 events (62 DVT only, 26 PE only, and 9 events both DVT and PE), occurred in the first 9 days after the hospital admission date, of which 87.6% were during hospitalization. During days 10‐19, there were 82 VTE events (50 DVT only, 24 PE only, and 8 both DVT and PE), 70.7% of which occurred in the hospital. Over the following 10‐day periods, VTE incidence gradually declined (Figure 2) and fluctuated at a background level of 4‐8 events during each 10‐day interval from 120 to 180 days.
The cumulative probability of VTE among all patients was 0.035 (Figure 3A). Half of the VTE risk had accumulated by day 23, and 75% had accumulated by day 71. By day 30, the proportion of cumulative risk was 52.6% overall, and ranged from 41.9% with cancer to 72.9% with infectious disease (Figure 3).
The VTE hazard peaked at approximately 1.05 VTE events per 1000 person‐days on day 8 after the hospital admission date overall (Figure 4A). The cumulative hazard at the peak day was 18.2% of the total VTE hazard over the 180‐day evaluation period. The hazard peak ranged from day 7 in patients with severe lung disease/COPD to day 12 in patients with infectious disease (Figure 4B). The cumulative hazard at the peak day was 39.7% for patients with infectious disease, 29.2% for patients with CHF, and approximately 19% for cancer or severe lung disease/COPD. After the peak risk day, the VTE hazard function decreased until the curve reached an inflection point, at day 28, when the cumulative risk was 51.8% (Figure 4A). After the inflection point, the VTE hazard increased to 0.3 VTE events per 1000 person‐days at approximately day 40‐45 and then decreased to <0.2 events per 1000 person‐days. The timing of the inflection varied by approximately 1 week across the medical illnesses (ranging from day 25 for severe lung disease/COPD to day 33 for CHF), with the cumulative risk at the inflection point ranging from 41.9% with cancer to 72.9% with infectious disease.
DISCUSSION
The results from this large, real‐world study provide new insights into the duration of risk of symptomatic VTE in medical patients and demonstrate that the number of VTE events was highest during days 0‐19, with the peak of VTE hazard at day 8. Half of the total 180‐day cumulative risk had been incurred by day 23 after hospital admission, and the period of greatest increased risk extended up to at least 30 days. Importantly, more than half of VTE events occurred after discharge (56.6%). A particularly high proportion of VTE events (69.5%) had occurred after discharge in patients with cancer. Although it was assumed that most VTE events that could be reasonably attributed to an at‐risk hospitalization would occur within 90 days as shown previously,4, 11 the 180‐day evaluation period was used to examine whether there was a prolonged period of continually diminished VTE risk from 90 to 180 days. Thus, events occurring within the later portions of the evaluation period may or may not have been attributable to the index hospitalization, potentially reflecting a background rate of VTE as noted above. Although these events are included in our estimate of the 180‐day cumulative risk of VTE, interpretation of the study results excluding such events is possible by examining the cumulative risk that had been incurred at each time point during the evaluation period.
Few other studies have assessed the duration of VTE risk in hospitalized medical patients. In a study by Spyropoulos et al,4 the median time to a DVT and/or PE event was 74 days, ranging from 62 days in severe infectious disease to 126 days in CHF. In another observational study that included patients who had recently been hospitalized but had not undergone surgery, 66.9% of patients who experienced DVT and/or PE events were diagnosed with DVT and/or PE within the first month after hospital discharge; 19.9% between months 1 and 2, and 13.2% between months 2 and 3.12
Fewer than half of the patients in the present study received thromboprophylaxis, which is consistent with other studies demonstrating the low prophylaxis rates in medical inpatients.9, 1315 In a recently published US study of discharge records that included 22,455 medical inpatients, prophylaxis rates were 59.4% in patients with CHF, 52.3% with cancer, 45.8% with severe lung disease/COPD, and 40.4% with infectious disease.14 Fewer than 10% of patients in the present study received prophylaxis after discharge, a result that is consistent with other studies.4, 9
The effect of extended prophylaxis in acutely ill medical patients with the LMWH enoxaparin beyond 6‐14 days has been investigated in the EXCLAIM study.16 This trial included approximately 5800 acutely ill medical patients at significant risk of developing VTE due to a recent reduction in mobility. Patients in the extended prophylaxis group had a lower risk of VTE (2.5% vs 4% for placebo; absolute risk reduction 1.5% [95.8% confidence interval 2.54% to 0.52%]), but had increased major bleeding events (0.8% vs 0.3% for placebo; absolute risk difference favoring placebo, 0.51% [95% confidence interval, 0.12% to 0.89%]). The patient populations with most benefit from an additional 28 days prophylaxis with enoxaparin, in addition to the usual short‐term prophylaxis of 10 days, were patients with restricted mobility (level 1; total bed rest/sedentary), elderly patients (age >75 years), and women. A limitation of the EXCLAIM trial is that estimates of efficacy and safety are difficult to interpret: after an interim analysis of adjudicated efficacy and safety outcomes, amendments were made to the original study protocol by changing eligibility criteria for patients with level 2 immobility (level 1 with bathroom privileges).16
The optimal duration of prophylaxis for medical patients has not been determined; prophylaxis is generally administered to at‐risk medical patients for the duration of hospitalization. In the current study, mean length of stay was 5.3 5.3 days overall. As hospital stays shorten, many medical patients who are prescribed inpatient prophylaxis alone are unlikely to receive the standard 6‐14 days of prophylaxis shown to be effective in clinical trials.68 Furthermore, the extended period of VTE risk in the present study and the finding that 56.6% of events occurred after discharge also suggest that current practices for inpatient prophylaxis alone may need to be evaluated.
This study reports real‐world data from a large, well‐defined population and obtains the incidence of symptomatic VTE events. Even though certain demographic data deviate from the national averagefor example, 74.1% of patients were treated in the South Census region, whereas this region is served by 37.6% of US hospitals17; 87.5% of hospitals had an urban location (compared with 60.1% of US hospitals18), and 85.4% of hospitals had a licensed bed size of at least 200 beds (compared with 28.2% of US hospitals, with the average US hospital having fewer than 100 beds19)these data may be beneficial in guiding policy and health care strategies for gaining understanding of the duration of risk for VTE.
Limitations of the study include characterization of the VTE risk period through examination of the cumulative risk and hazard of VTE across time, as the actual VTE risk period cannot be determined with exact precision. We used ICD‐9‐CM diagnosis coding to identify VTE. Since many cases of PE are asymptomatic and detected at autopsy,20 our approach may have missed such cases, as they would not have been recorded within the database. Furthermore, validation studies suggest that suboptimal specificity exists for ICD‐9‐CM diagnosis codes used to identify VTE.21 In an attempt to improve the specificity of our VTE identification algorithm, we required that post‐discharge VTE was recorded either during an emergency room or subsequent inpatient admission (which would be indicative of acute care for VTE) or on an outpatient claim with subsequent evidence of treatment for VTE. The true sensitivity and specificity of the VTE identification algorithms used for this study remain unknown, however, so the study findings should be interpreted in light of this limitation. The databases used for the analysis may not be representative of the US population as a whole; for example, this study used claims data from commercial and Medicare supplemental databases, which do not include Medicaid patients. Another limitation was that outpatient mechanical prophylaxis, such as graded compression stockings, was not captured due to over‐the‐counter availability. In addition, appropriateness of prophylaxis was not determined in this study, because these data could not be obtained from the claims database used. Further studies are warranted to obtain information on the incidence of VTE after hospitalization for medical illness in patients who received appropriate prophylaxis during hospitalization.
Finally, all dosages of a pharmacological agent were considered prophylactic only if a VTE event did not occur, with the exception of warfarin; any dose of warfarin was considered for prophylaxis, regardless of a VTE diagnosis. Warfarin may be used for purposes other than VTE prophylaxis (eg, prophylaxis for a thromboembolic cerebrovascular accident). The data source does not allow for identifying the exact reason for anticoagulation therapy with warfarin. Nonetheless, warfarin therapy will confer a decreased risk of VTE regardless of its purpose.
Results from this large cohort of medical patients indicate that symptomatic VTE risk is highest within the first 19 days after hospital admission (a period that may encompass both the duration of hospitalization as well as the period after discharge) with a considerable risk of VTE extending into the period after discharge. Receiving appropriate prophylaxis in‐hospital remains of great importance to prevent inpatient and likely post‐discharge VTE in patients with acute medical illness. In addition, given the time course of VTE events, with VTE incidence peaking at 8 days but with increased risk extending to 30 days, and the number of out‐of‐hospital VTE events incurred, the results of this study suggest that future research is warranted to investigate the risks and benefits of improving thromboprophylaxis practices in the period after hospitalization.
Acknowledgements
Funding Source: sanofi‐aventis U.S. provided funding to Thomson Reuters to perform this study. The authors received editorial/writing support from Tessa Hartog of Excerpta Medica in the preparation of the manuscript funded by sanofi‐aventis U.S.
Disclosure: Alpesh Amin has received research honorarium and is on the speakers bureau for sanofi‐aventis U.S. Otsuka Pharmaceutical, and Boehringer‐Ingelheim. Helen Varker, Nicole Princic, and Stephen Johnston are employees at Thomson Reuters, which received funding from sanofi‐aventis U.S. Jay Lin is an employee of Novosys Health, which received funding from sanofi‐aventis U.S. Stephen Thompson is an employee of sanofi‐aventis U.S.
Patients who are hospitalized for acute medical illness are at an increased risk of developing venous thromboembolism (VTE), which comprises deep‐vein thrombosis (DVT) and pulmonary embolism (PE).13 In a recent real‐world study of 158,325 US medical patients by Spyropoulos et al,4 4.0% of patients developed DVT, 1.5% developed PE, and 0.2% developed both DVT and PE. Furthermore, results from a population‐based case‐control study indicate that hospitalization for medical illness accounted for a proportion of VTE events similar to that of hospitalization for surgery (22% and 24%, respectively).5
Thromboprophylaxis reduces VTE incidence in at‐risk medical patients and is recommended according to evidence‐based guidelines from the American College of Chest Physicians (ACCP).1 The ACCP guidelines advocate that acutely ill medical patients admitted to the hospital with congestive heart failure (CHF) or severe lung disease/chronic obstructive pulmonary disease (COPD) or those who are confined to bed and have one or more additional risk factors (including active cancer, previous VTE, sepsis, acute neurologic disease, or inflammatory bowel disease) receive pharmacological prophylaxis with lowmolecular weight heparin (LMWH), low‐dose unfractionated heparin (UFH), or fondaparinux.1 Although guidelines provide recommendations for the duration of prophylaxis after major orthopedic surgery, such recommendations are unavailable for medical patients. In clinical trials of acutely ill medical patients, prophylaxis regimens found to be effective were provided for a duration of hospitalization of 6‐14 days.68 The mean length of hospital stay for medical illnesses is decreasing and is currently shorter than 6‐14 days.9, 10
In clinical practice, the duration of VTE risk during and after hospitalization is not well understood in medical patients, particularly in the context of shortening hospital stays. Such information could, however, provide insight into whether current thromboprophylaxis practices reflect real‐world need. To gain a greater understanding of the period during which patients are at risk of VTE, this retrospective, observational study assessed the incidence and time course of symptomatic VTE events during and after hospitalization in a large population of US medical patients.
METHODS
Data and Patient Selection
This study employed linked administrative claims data and hospital billing data contained in the Thomson Reuters MarketScan Inpatient Drug Link File. This combines longitudinal patient‐level inpatient and outpatient medical and pharmaceutical claims data from the MarketScan Commercial claims data from the MarketScan Commercial Claims and Encounters (Commercial) and Medicare Supplemental and Coordination of Benefits (Medicare Supplemental) databases, with hospital discharge records detailing services used and drugs administered during a hospitalization, which are included in the Hospital Drug Database. The linked data sources enable analysis of a patient's experience before, during, and after a hospitalization. The present study was not designed to obtain bleeding rates.
The study cohort comprised patients considered to be at‐risk for VTE as a result of a medical hospitalization occurring between January 1, 2005, and December 31, 2008. At‐risk medical hospitalizations were those for which the primary diagnosis was for cancer, CHF, severe lung disease/COPD, or infectious disease (see Supporting Information, Appendix I, for International Classification of Diseases, 9th Revision, Clinical Modification [ICD‐9‐CM] codes used to identify patients with medical illnesses). Included patients were required to be at least 18 years of age at the time of admission and were required to be continuously enrolled in their insurance benefits for at least 12 months before admission (the baseline period) and for at least 180 days after the admission date (the evaluation period) to ensure that all administrative claims data during that period were captured. Patients who died in‐hospital from any cause were exempted from the continuous enrollment criterion, as long as they had been continuously enrolled prior to inpatient death. Patients transferred from or discharged to another acute‐care facility were excluded because of the possibility for incomplete inpatient data capture. For patients who had multiple medical hospitalizations between January 1, 2005, and December 31, 2008, the hospitalization around which the analysis focused was randomly selected from the set of potential medical hospitalizations.
Prophylaxis
Pharmacological prophylaxis was identified via charge codes during hospitalization or via pharmacy claims after discharge for UFH, enoxaparin, dalteparin, warfarin, and fondaparinux. All dosages of a pharmacological agent were considered prophylactic only if there was no evidence of VTE during the admission, with the exception of warfarin (Supporting Information, Appendix II). Post‐discharge use of anticoagulation therapy was measured for up to 35 days after discharge from the hospital. Use of mechanical prophylaxis during hospitalization was identified via charge codes for graduated compression stockings and charge codes indicating use of intermittent pneumatic compression devices and/or venous foot pumps. The appropriateness of prophylaxis was not assessed.
Analysis
The risk of VTE was estimated across an evaluation period of 180 days by measuring VTE occurrence and person‐time exposure. Inpatient VTE occurrence was defined as any nonprimary diagnosis of DVT and/or PE during the at‐risk hospitalization. VTE after discharge was defined as an ICD‐9‐CM diagnosis code, whether primary or secondary, for DVT or PE in the evaluation period during an emergency room or inpatient admission, or on an outpatient claim with 1 or more of the following confirmatory events: an emergency room or inpatient admission for VTE within 2 days of the outpatient diagnosis; a prescription claim for enoxaparin, fondaparinux, or UFH within 15 days after diagnosis; or a prescription claim for warfarin within 15 days after diagnosis and no evidence of atrial fibrillation or atrial flutter in the 6 months before the outpatient diagnosis for DVT or PE. Person‐time exposure was measured as the number of days from the hospital admission date to the first occurrence of VTE, or censoring at a subsequent at‐risk hospitalization, death, or 180 days after admission.
Cumulative risk of VTE over the 180‐day evaluation period was calculated by the Kaplan‐Meier product limit method of survival analysis and displayed for deciles of cumulative risk at 180 days after the hospital admission date. The risk of VTE at each point of time during the evaluation period (the hazard function) was first calculated on a daily basis and then smoothed via LOESS regression, a locally weighted regression procedure.
RESULTS
Patient Demographics
A total of 11,139 medical patients were included in the analysis (Figure 1), with a mean standard deviation (SD) age of 67.6 13.9 years, and 51.6% were women (Table 1). Of the reasons for admission to the hospital, 51.5% of patients were admitted for severe lung disease/COPD, 20.1% were admitted for cancer, 15.3% were admitted for CHF, and 13.1% were admitted for severe infectious disease. Most patients were treated in an urban hospital (87.5%), in a hospital without teaching status (87.9%), and in the South Census region (74.1%). The majority of patients were treated in medium‐sized to large care facilities. Risk factors for VTE during the baseline period included hospitalization for a medical condition with a high risk for VTE (75.6%), a prior at‐risk hospitalization (18.6%), cancer therapy (10.0% of all medical patients combined and 18.5% of cancer patients), trauma (9.2%), and previous VTE (4.3%).
| Characteristic | Medical Patients (N = 11,139) |
|---|---|
| |
| Gender | |
| Men | 5389 (48.4) |
| Women | 5750 (51.6) |
| Reason for hospitalization | |
| Cancer | 2243 (20.1) |
| CHF | 1705 (15.3) |
| Severe lung disease/COPD | 5736 (51.5) |
| Severe infectious disease | 1455 (13.1) |
| Age group, years | |
| 1834 | 230 (2.1) |
| 3544 | 442 (4.0) |
| 4554 | 1188 (10.7) |
| 5564 | 2644 (23.7) |
| 6574 | 2657 (23.9) |
| 7584 | 2969 (26.7) |
| 85 years | 1009 (9.1) |
| Median age SD, years | 67.6 13.9 |
| Primary payer* | |
| Medicare | 6819 (61.2) |
| Commercial | 4320 (38.8) |
| Geographical area | |
| Northeast | 122 (1.1) |
| North Central | 2649 (23.8) |
| South | 8258 (74.1) |
| West | 110 (1.0) |
| Urban location | 9743 (87.5) |
| Teaching hospital | 1345 (12.1) |
| Licensed bed size | |
| 1199 | 1621 (14.6) |
| 200299 | 2869 (25.8) |
| 300499 | 4005 (36.0) |
| 500 | 2644 (23.7) |
VTE Prophylaxis
Patients stayed in hospital for a mean SD duration of 5.3 5.3 days, varying from 4.6 3.9 days in patients with CHF to 6.7 6.5 days in patients with infectious disease, during which 46.7% of patients received pharmacological VTE prophylaxis. Inpatient pharmacological prophylaxis rates ranged from 64.1% in patients with CHF to 30.7% in patients with cancer (Table 2). Overall, the most commonly used form of inpatient pharmacological prophylaxis was enoxaparin (26.8% of all patients), followed by UFH (13.5% of all patients). Mechanical prophylaxis was received by 12.2% of all patients. Mean SD VTE prophylaxis duration during hospitalization was 5.0 4.7 days, varying from 4.2 4.0 days in patients with cancer to 6.2 5.5 days in patients with infectious disease.
| n (%) | Infectious Disease (n = 1455) | CHF (n = 1705) | Severe Lung Disease/COPD (n = 5736) | Cancer (n = 2243) | Any Medical (N = 11,139) |
|---|---|---|---|---|---|
| |||||
| Pharmacological prophylaxis during hospitalization* | 599 (41.2) | 1093 (64.1) | 2820 (49.2) | 688 (30.7) | 5200 (46.7) |
| Enoxaparin | 362 (24.9) | 466 (27.3) | 1877 (32.7) | 282 (12.6) | 2987 (26.8) |
| UFH | 191 (13.1) | 400 (23.5) | 527 (9.2) | 383 (17.1) | 1501 (13.5) |
| Warfarin | 135 (9.3) | 498 (29.2) | 622 (10.8) | 95 (4.2) | 1350 (12.1) |
| Dalteparin | 16 (1.1) | 21 (1.2) | 109 (1.9) | 16 (0.7) | 162 (1.5) |
| Fondaparinux | 5 (0.3) | 4 (0.2) | 22 (0.4) | 2 (0.1) | 33 (0.3) |
| Mechanical prophylaxis in hospital | 148 (10.2) | 65 (3.8) | 343 (6.0) | 803 (35.8) | 1359 (12.2) |
| Anticoagulation within 35 days after discharge | 104 (7.1) | 315 (18.5) | 397 (6.9) | 166 (7.4) | 982 (8.8) |
| Enoxaparin | 15 (1.0) | 14 (0.8) | 32 (0.6) | 25 (1.1) | 86 (0.8) |
| UFH | 17 (1.2) | 10 (0.6) | 23 (0.4) | 35 (1.6) | 85 (0.8) |
| Warfarin | 79 (5.4) | 302 (17.7) | 357 (6.2) | 116 (5.2) | 854 (7.7) |
| Dalteparin | 0 | 0 | 2 (<0.1) | 1 (<0.1) | 3 (<0.1) |
| Fondaparinux | 1 (0.1) | 0 | 0 | 2 (0.1) | 3 (<0.1) |
| Antiplatelet therapy within 35 days after discharge | 72 (4.9) | 217 (12.7) | 351 (6.1) | 53 (2.4) | 693 (6.2) |
In the 35 days after discharge, 8.8% of patients received anticoagulation therapy, most commonly warfarin (7.7%). The rate of outpatient prophylaxis was highest in patients hospitalized for CHF (18.5%) compared with other medical conditions (7%).
Time Course of VTE Risk and Hazard Function
Overall, there were 366 symptomatic VTE events, representing a VTE rate of 3.3%. These events comprised 241 DVT‐only events, 98 PE‐only events, and 27 events with evidence of both DVT and PE. In total, 43.4% of events occurred during hospitalization (Figure 2). The VTE rate was 5.7% in patients with cancer (30.5% of events occurring in hospital), 4.3% with infectious disease (61.9% in hospital), 3.1% with CHF (54.7% in hospital), and 2.1% with severe lung disease/COPD (42.6% in hospital). The highest number of VTE events, 97 events (62 DVT only, 26 PE only, and 9 events both DVT and PE), occurred in the first 9 days after the hospital admission date, of which 87.6% were during hospitalization. During days 10‐19, there were 82 VTE events (50 DVT only, 24 PE only, and 8 both DVT and PE), 70.7% of which occurred in the hospital. Over the following 10‐day periods, VTE incidence gradually declined (Figure 2) and fluctuated at a background level of 4‐8 events during each 10‐day interval from 120 to 180 days.
The cumulative probability of VTE among all patients was 0.035 (Figure 3A). Half of the VTE risk had accumulated by day 23, and 75% had accumulated by day 71. By day 30, the proportion of cumulative risk was 52.6% overall, and ranged from 41.9% with cancer to 72.9% with infectious disease (Figure 3).
The VTE hazard peaked at approximately 1.05 VTE events per 1000 person‐days on day 8 after the hospital admission date overall (Figure 4A). The cumulative hazard at the peak day was 18.2% of the total VTE hazard over the 180‐day evaluation period. The hazard peak ranged from day 7 in patients with severe lung disease/COPD to day 12 in patients with infectious disease (Figure 4B). The cumulative hazard at the peak day was 39.7% for patients with infectious disease, 29.2% for patients with CHF, and approximately 19% for cancer or severe lung disease/COPD. After the peak risk day, the VTE hazard function decreased until the curve reached an inflection point, at day 28, when the cumulative risk was 51.8% (Figure 4A). After the inflection point, the VTE hazard increased to 0.3 VTE events per 1000 person‐days at approximately day 40‐45 and then decreased to <0.2 events per 1000 person‐days. The timing of the inflection varied by approximately 1 week across the medical illnesses (ranging from day 25 for severe lung disease/COPD to day 33 for CHF), with the cumulative risk at the inflection point ranging from 41.9% with cancer to 72.9% with infectious disease.
DISCUSSION
The results from this large, real‐world study provide new insights into the duration of risk of symptomatic VTE in medical patients and demonstrate that the number of VTE events was highest during days 0‐19, with the peak of VTE hazard at day 8. Half of the total 180‐day cumulative risk had been incurred by day 23 after hospital admission, and the period of greatest increased risk extended up to at least 30 days. Importantly, more than half of VTE events occurred after discharge (56.6%). A particularly high proportion of VTE events (69.5%) had occurred after discharge in patients with cancer. Although it was assumed that most VTE events that could be reasonably attributed to an at‐risk hospitalization would occur within 90 days as shown previously,4, 11 the 180‐day evaluation period was used to examine whether there was a prolonged period of continually diminished VTE risk from 90 to 180 days. Thus, events occurring within the later portions of the evaluation period may or may not have been attributable to the index hospitalization, potentially reflecting a background rate of VTE as noted above. Although these events are included in our estimate of the 180‐day cumulative risk of VTE, interpretation of the study results excluding such events is possible by examining the cumulative risk that had been incurred at each time point during the evaluation period.
Few other studies have assessed the duration of VTE risk in hospitalized medical patients. In a study by Spyropoulos et al,4 the median time to a DVT and/or PE event was 74 days, ranging from 62 days in severe infectious disease to 126 days in CHF. In another observational study that included patients who had recently been hospitalized but had not undergone surgery, 66.9% of patients who experienced DVT and/or PE events were diagnosed with DVT and/or PE within the first month after hospital discharge; 19.9% between months 1 and 2, and 13.2% between months 2 and 3.12
Fewer than half of the patients in the present study received thromboprophylaxis, which is consistent with other studies demonstrating the low prophylaxis rates in medical inpatients.9, 1315 In a recently published US study of discharge records that included 22,455 medical inpatients, prophylaxis rates were 59.4% in patients with CHF, 52.3% with cancer, 45.8% with severe lung disease/COPD, and 40.4% with infectious disease.14 Fewer than 10% of patients in the present study received prophylaxis after discharge, a result that is consistent with other studies.4, 9
The effect of extended prophylaxis in acutely ill medical patients with the LMWH enoxaparin beyond 6‐14 days has been investigated in the EXCLAIM study.16 This trial included approximately 5800 acutely ill medical patients at significant risk of developing VTE due to a recent reduction in mobility. Patients in the extended prophylaxis group had a lower risk of VTE (2.5% vs 4% for placebo; absolute risk reduction 1.5% [95.8% confidence interval 2.54% to 0.52%]), but had increased major bleeding events (0.8% vs 0.3% for placebo; absolute risk difference favoring placebo, 0.51% [95% confidence interval, 0.12% to 0.89%]). The patient populations with most benefit from an additional 28 days prophylaxis with enoxaparin, in addition to the usual short‐term prophylaxis of 10 days, were patients with restricted mobility (level 1; total bed rest/sedentary), elderly patients (age >75 years), and women. A limitation of the EXCLAIM trial is that estimates of efficacy and safety are difficult to interpret: after an interim analysis of adjudicated efficacy and safety outcomes, amendments were made to the original study protocol by changing eligibility criteria for patients with level 2 immobility (level 1 with bathroom privileges).16
The optimal duration of prophylaxis for medical patients has not been determined; prophylaxis is generally administered to at‐risk medical patients for the duration of hospitalization. In the current study, mean length of stay was 5.3 5.3 days overall. As hospital stays shorten, many medical patients who are prescribed inpatient prophylaxis alone are unlikely to receive the standard 6‐14 days of prophylaxis shown to be effective in clinical trials.68 Furthermore, the extended period of VTE risk in the present study and the finding that 56.6% of events occurred after discharge also suggest that current practices for inpatient prophylaxis alone may need to be evaluated.
This study reports real‐world data from a large, well‐defined population and obtains the incidence of symptomatic VTE events. Even though certain demographic data deviate from the national averagefor example, 74.1% of patients were treated in the South Census region, whereas this region is served by 37.6% of US hospitals17; 87.5% of hospitals had an urban location (compared with 60.1% of US hospitals18), and 85.4% of hospitals had a licensed bed size of at least 200 beds (compared with 28.2% of US hospitals, with the average US hospital having fewer than 100 beds19)these data may be beneficial in guiding policy and health care strategies for gaining understanding of the duration of risk for VTE.
Limitations of the study include characterization of the VTE risk period through examination of the cumulative risk and hazard of VTE across time, as the actual VTE risk period cannot be determined with exact precision. We used ICD‐9‐CM diagnosis coding to identify VTE. Since many cases of PE are asymptomatic and detected at autopsy,20 our approach may have missed such cases, as they would not have been recorded within the database. Furthermore, validation studies suggest that suboptimal specificity exists for ICD‐9‐CM diagnosis codes used to identify VTE.21 In an attempt to improve the specificity of our VTE identification algorithm, we required that post‐discharge VTE was recorded either during an emergency room or subsequent inpatient admission (which would be indicative of acute care for VTE) or on an outpatient claim with subsequent evidence of treatment for VTE. The true sensitivity and specificity of the VTE identification algorithms used for this study remain unknown, however, so the study findings should be interpreted in light of this limitation. The databases used for the analysis may not be representative of the US population as a whole; for example, this study used claims data from commercial and Medicare supplemental databases, which do not include Medicaid patients. Another limitation was that outpatient mechanical prophylaxis, such as graded compression stockings, was not captured due to over‐the‐counter availability. In addition, appropriateness of prophylaxis was not determined in this study, because these data could not be obtained from the claims database used. Further studies are warranted to obtain information on the incidence of VTE after hospitalization for medical illness in patients who received appropriate prophylaxis during hospitalization.
Finally, all dosages of a pharmacological agent were considered prophylactic only if a VTE event did not occur, with the exception of warfarin; any dose of warfarin was considered for prophylaxis, regardless of a VTE diagnosis. Warfarin may be used for purposes other than VTE prophylaxis (eg, prophylaxis for a thromboembolic cerebrovascular accident). The data source does not allow for identifying the exact reason for anticoagulation therapy with warfarin. Nonetheless, warfarin therapy will confer a decreased risk of VTE regardless of its purpose.
Results from this large cohort of medical patients indicate that symptomatic VTE risk is highest within the first 19 days after hospital admission (a period that may encompass both the duration of hospitalization as well as the period after discharge) with a considerable risk of VTE extending into the period after discharge. Receiving appropriate prophylaxis in‐hospital remains of great importance to prevent inpatient and likely post‐discharge VTE in patients with acute medical illness. In addition, given the time course of VTE events, with VTE incidence peaking at 8 days but with increased risk extending to 30 days, and the number of out‐of‐hospital VTE events incurred, the results of this study suggest that future research is warranted to investigate the risks and benefits of improving thromboprophylaxis practices in the period after hospitalization.
Acknowledgements
Funding Source: sanofi‐aventis U.S. provided funding to Thomson Reuters to perform this study. The authors received editorial/writing support from Tessa Hartog of Excerpta Medica in the preparation of the manuscript funded by sanofi‐aventis U.S.
Disclosure: Alpesh Amin has received research honorarium and is on the speakers bureau for sanofi‐aventis U.S. Otsuka Pharmaceutical, and Boehringer‐Ingelheim. Helen Varker, Nicole Princic, and Stephen Johnston are employees at Thomson Reuters, which received funding from sanofi‐aventis U.S. Jay Lin is an employee of Novosys Health, which received funding from sanofi‐aventis U.S. Stephen Thompson is an employee of sanofi‐aventis U.S.
- , , , et al. Prevention of venous thromboembolism: American College of Chest Physicians Evidence‐Based Clinical Practice Guidelines (8th Edition). Chest. 2008;133(6 Suppl):381S–453S.
- , , , , , . Risk factors for deep vein thrombosis and pulmonary embolism: a population‐based case‐control study. Arch Intern Med. 2000;160:809–815.
- . The epidemiology of venous thromboembolism in the community. Arterioscler Thromb Vasc Biol. 2008;28:370–372.
- , , , . Rates of venous thromboembolism occurrence in medical patients among the insured population. Thromb Haemost. 2009;102:951–957.
- , , , et al. Relative impact of risk factors for deep vein thrombosis and pulmonary embolism: a population‐based study. Arch Intern Med. 2002;162:1245–1248.
- , , , et al. A comparison of enoxaparin with placebo for the prevention of venous thromboembolism in acutely ill medical patients. Prophylaxis in Medical Patients with Enoxaparin Study Group. N Engl J Med. 1999;341:793–800.
- , , , et al. Randomized, placebo‐controlled trial of dalteparin for the prevention of venous thromboembolism in acutely ill medical patients. Circulation. 2004;110:874–879.
- , , , et al. Efficacy and safety of fondaparinux for the prevention of venous thromboembolism in older acute medical patients: randomised placebo controlled trial. BMJ. 2006;332:325–329.
- , , . Lack of thromboprophylaxis across the care continuum in US medical patients. Hosp Pract (Minneap). 2010;38:17–25.
- HCUP NIS Related Reports. Healthcare Cost and Utilization Project (HCUP), September 2008. Available at: www.hcup‐us.ahrq.gov/db/nation/nis/nisrelatedreports.jsp. Accessed June 2011.
- , . Direct medical costs of venous thromboembolism and subsequent hospital readmission rates: an administrative claims analysis from 30 managed care organizations. J Manag Care Pharm. 2007;13:475–486.
- , , , , . Venous thromboembolism in the outpatient setting. Arch Intern Med. 2007;167:1471–1475.
- , , , . Inpatient thromboprophylaxis use in U.S. hospitals: adherence to the seventh American College of Chest Physician's recommendations for at‐risk medical and surgical patients. J Hosp Med. 2009;4:E15–E21.
- , , , et al. Are hospitals delivering appropriate VTE prevention? The venous thromboembolism study to assess the rate of thromboprophylaxis (VTE start). J Thromb Thrombolysis. 2010;29:326–339.
- , , , et al. Venous thromboembolism risk and prophylaxis in hospitalised medically ill patients. The ENDORSE Global Survey. Thromb Haemost. 2010;103:736–748.
- , , , et al. Extended‐duration venous thromboembolism prophylaxis in acutely ill medical patients with recently reduced mobility: a randomized trial. Ann Intern Med. 2010;153:8–18.
- American Society for Healthcare Engineering of the American Hospital Association. Overview of the Hospital Market, 2009. Available from: www.ashe.org/e2c/pdfs/energy/heg_ch2_background.pdf. Accessed June 2011.
- American Hospital Association. Fast Facts on US Hospitals, 2009. Available at: http://www.aha.org/aha/resource‐center/Statistics‐and‐Studies/fast‐facts.html. Accessed June 2011.
- American Hospital Association. AHA Annual Survey of Hospitals Database, 2009. Available from: http://www.ahadata.com/ahadata_app/index.jsp. Accessed June 2011.
- . The epidemiology of venous thromboembolism. Circulation. 2003;107(23 suppl 1):I4–I8.
- , , , et al. How valid is the ICD‐9‐CM based AHRQ patient safety indicator for postoperative venous thromboembolism? Med Care. 2009;47:1237–1243.
- , , , et al. Prevention of venous thromboembolism: American College of Chest Physicians Evidence‐Based Clinical Practice Guidelines (8th Edition). Chest. 2008;133(6 Suppl):381S–453S.
- , , , , , . Risk factors for deep vein thrombosis and pulmonary embolism: a population‐based case‐control study. Arch Intern Med. 2000;160:809–815.
- . The epidemiology of venous thromboembolism in the community. Arterioscler Thromb Vasc Biol. 2008;28:370–372.
- , , , . Rates of venous thromboembolism occurrence in medical patients among the insured population. Thromb Haemost. 2009;102:951–957.
- , , , et al. Relative impact of risk factors for deep vein thrombosis and pulmonary embolism: a population‐based study. Arch Intern Med. 2002;162:1245–1248.
- , , , et al. A comparison of enoxaparin with placebo for the prevention of venous thromboembolism in acutely ill medical patients. Prophylaxis in Medical Patients with Enoxaparin Study Group. N Engl J Med. 1999;341:793–800.
- , , , et al. Randomized, placebo‐controlled trial of dalteparin for the prevention of venous thromboembolism in acutely ill medical patients. Circulation. 2004;110:874–879.
- , , , et al. Efficacy and safety of fondaparinux for the prevention of venous thromboembolism in older acute medical patients: randomised placebo controlled trial. BMJ. 2006;332:325–329.
- , , . Lack of thromboprophylaxis across the care continuum in US medical patients. Hosp Pract (Minneap). 2010;38:17–25.
- HCUP NIS Related Reports. Healthcare Cost and Utilization Project (HCUP), September 2008. Available at: www.hcup‐us.ahrq.gov/db/nation/nis/nisrelatedreports.jsp. Accessed June 2011.
- , . Direct medical costs of venous thromboembolism and subsequent hospital readmission rates: an administrative claims analysis from 30 managed care organizations. J Manag Care Pharm. 2007;13:475–486.
- , , , , . Venous thromboembolism in the outpatient setting. Arch Intern Med. 2007;167:1471–1475.
- , , , . Inpatient thromboprophylaxis use in U.S. hospitals: adherence to the seventh American College of Chest Physician's recommendations for at‐risk medical and surgical patients. J Hosp Med. 2009;4:E15–E21.
- , , , et al. Are hospitals delivering appropriate VTE prevention? The venous thromboembolism study to assess the rate of thromboprophylaxis (VTE start). J Thromb Thrombolysis. 2010;29:326–339.
- , , , et al. Venous thromboembolism risk and prophylaxis in hospitalised medically ill patients. The ENDORSE Global Survey. Thromb Haemost. 2010;103:736–748.
- , , , et al. Extended‐duration venous thromboembolism prophylaxis in acutely ill medical patients with recently reduced mobility: a randomized trial. Ann Intern Med. 2010;153:8–18.
- American Society for Healthcare Engineering of the American Hospital Association. Overview of the Hospital Market, 2009. Available from: www.ashe.org/e2c/pdfs/energy/heg_ch2_background.pdf. Accessed June 2011.
- American Hospital Association. Fast Facts on US Hospitals, 2009. Available at: http://www.aha.org/aha/resource‐center/Statistics‐and‐Studies/fast‐facts.html. Accessed June 2011.
- American Hospital Association. AHA Annual Survey of Hospitals Database, 2009. Available from: http://www.ahadata.com/ahadata_app/index.jsp. Accessed June 2011.
- . The epidemiology of venous thromboembolism. Circulation. 2003;107(23 suppl 1):I4–I8.
- , , , et al. How valid is the ICD‐9‐CM based AHRQ patient safety indicator for postoperative venous thromboembolism? Med Care. 2009;47:1237–1243.
Copyright © 2011 Society of Hospital Medicine
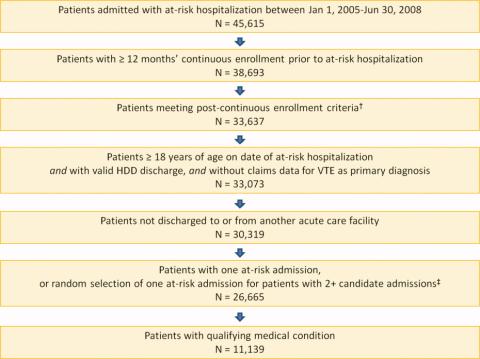
Nominal Group Technique
Pain is considered the fifth vital sign, and the appropriate management of pain is fundamental for patient care. Uncontrolled pain has adverse negative physiological consequences,14 and better pain control in hospitalized patients has been associated with decreased length of stay and improved recovery and physical comfort.36 However, many patients fail to receive state‐of‐the‐art pain relief7; for example, in a study of 176 hospitalized patients with cancer, 46% reported severe pain at the time of the interview.8 The prevalence of pain in hospitalized patients with other diagnoses besides cancer likewise remains high.9
Over the last 2 decades, the quality of care in pain management has gained increasing attention. In 2000, the Joint Commission unveiled an official statement for the purpose of improving the quality of pain management.10 The Joint Commission's 6 core principles include the right of pain assessment and treatment, institution of organizational procedures to assess pain, provision of care of persons with pain, general education, continuity of pain management after hospital discharge, and inclusion of pain management as a performance measure. Pain management is now a hospital accountability indicator. Although multiple initiatives have been undertaken to improve pain control, however, challenges still remain. Effective strategies for consensus development are still needed to prioritize interventions.
The nominal group technique (NGT) is a brainstorming tool for quality improvement; NGT is a highly structured small group discussion used to elicit and prioritize a list of answers to a specific question.1115 We conducted an NGT session to identify the multiple challenges, barriers, and perspectives of healthcare providers in managing pain among hospitalized patients. The ultimate goals were to identify potential areas for pain management improvement, build consensus among caregivers, and introduce the NGT as a tool to elicit caregivers' ideas for quality improvement.
METHODS
In a multistep process, we first identified areas for quality improvement interventions in pain management by using the NGT in hospitalized patients, then organized the information by using an iterative consensus development process, and finally displayed the main findings using a Fishbone diagram.
Setting and Participants
At a large university hospital, we targeted 3 inpatient services based on pain management performance data. We obtained the data from patient satisfaction and the Hospital Consumer Assessment of Healthcare Providers and Systems (HCAHPS) surveys. They included 1 medical, 1 medical‐surgical, and 1 surgical hospital unit at a large academic medical center.
Within these units we recruited participants from a convenience sample of nurses, resident physicians, patient care technicians, and unit clerks. We included patient care technicians and unit clerks as they often interface between patients and providers. To maintain anonymity of the responses, we did not record participant composition during the session. Participation was voluntary and no incentives were provided. The institutional review board at the University of Alabama at Birmingham approved the use of existing quality improvement data.
Nominal Group Technique
During 2009, we conducted an NGT session within each of the 3 inpatient units. Two of the authors (MB, DS) developed the question posed to each group: What causes uncontrolled pain in your unit? The NGT supports equal participation, controls the extraneous discussion that frequently occurs when groups are convened, minimizes real or perceived power differentials among members, and, in the aggregate, minimizes the process loss that exists in unstructured focus group meetings.1116 Thus, the ideas generated by this process provide a valid reflection of the implicit prioritized views held by the group. The NGT also provides concise written documentation summarizing participants' responses, rendering audiotape recording and transcription unnecessary.13, 17
Each NGT session, lasting 1 hour, followed the following steps.13 First, after a brief introduction of the purpose of the session and general instructions, the moderators (MB, DS) posed the question: What causes uncontrolled pain in your unit? Second, in response to the standard question, each participant in the group silently and individually generated a list of ideas and wrote them down. Third, using a round‐robin approach (1 person at a time mentions the idea), each idea was concisely transcribed by the facilitator onto a flip‐chart for all participants to see; debate was not allowed during this step. Fourth, each recorded idea was then discussed for the sole purpose of clarification, and not for evaluation or argument as to the relative importance. The proposer of the idea did not need to defend the idea. During this step, participants were prompted to combine those ideas that were perceived to be substantively similar. Finally, during the voting phase, participants privately selected what they considered to be the 3 most important reasons for uncontrolled pain in their unit. Each participant prioritized their choices on their own and without discussing with other participants, giving a rank of 3 to the most important idea and 1 to the least important idea. The moderator recorded the votes onto the flip‐chart in front of all participants and then tallied the votes for each idea. We discarded a small number of idiosyncratic suggestions, which is a standard procedure in the nominal group technique. The main results were the top 5 suggestions identified within each group; the secondary results were all other suggestions. A more detailed description of the NGT steps is available elsewhere.11
Ishikawa (Fishbone) Diagram
Fishbone diagrams are designed to organize contributing factors to a particular outcome in a pictorial display. This is a common tool used to identify areas for improvement by facilitating brainstorming and graphically displaying the relationship of the causes to the effect. Through an iterative process, 3 of the authors (AP, MB, CAE) categorized all of the generated ideas into common themes until consensus was reached. The top 5 and all other suggestions within each service were organized into the Fishbone diagram.
RESULTS
The 27 health workers representing the 3 units completing the nominal group sessions generated a total of 94 ideas. The Fishbone diagram shown in Figure 1 shows each service's top 5 rankings of the elements perceived contributing most to uncontrolled pain; the elements were organized into 3 main factors and 7 priority themes identified during the iterative process.
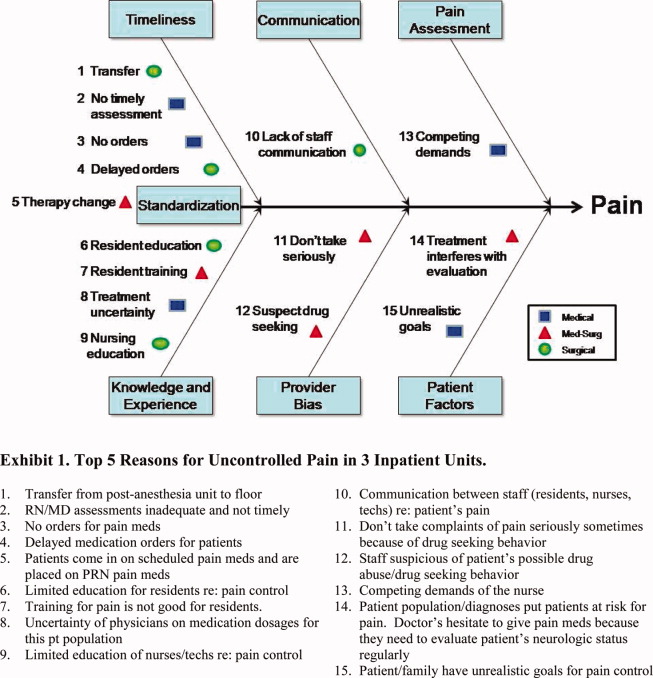
The main categories illustrate system factors (timeliness, communication, pain assessment; Figure 1, top portion), human factors (knowledge and experience, provider bias, patient factors; Figure 1, bottom portion), and an interface between system and human factors (standardization; Figure 1, center left). The remaining 79 ideas, non‐top 5 for each unit, fell into the following priority themes: provider bias (n = 6), knowledge and experience (n = 12), pain assessment (n = 7), communication (n = 10), timeliness (n = 14), standardization (or policies and practice variation) (n = 13), and patient factors (n = 17); the ideas and representative examples are shown in Figure 2.
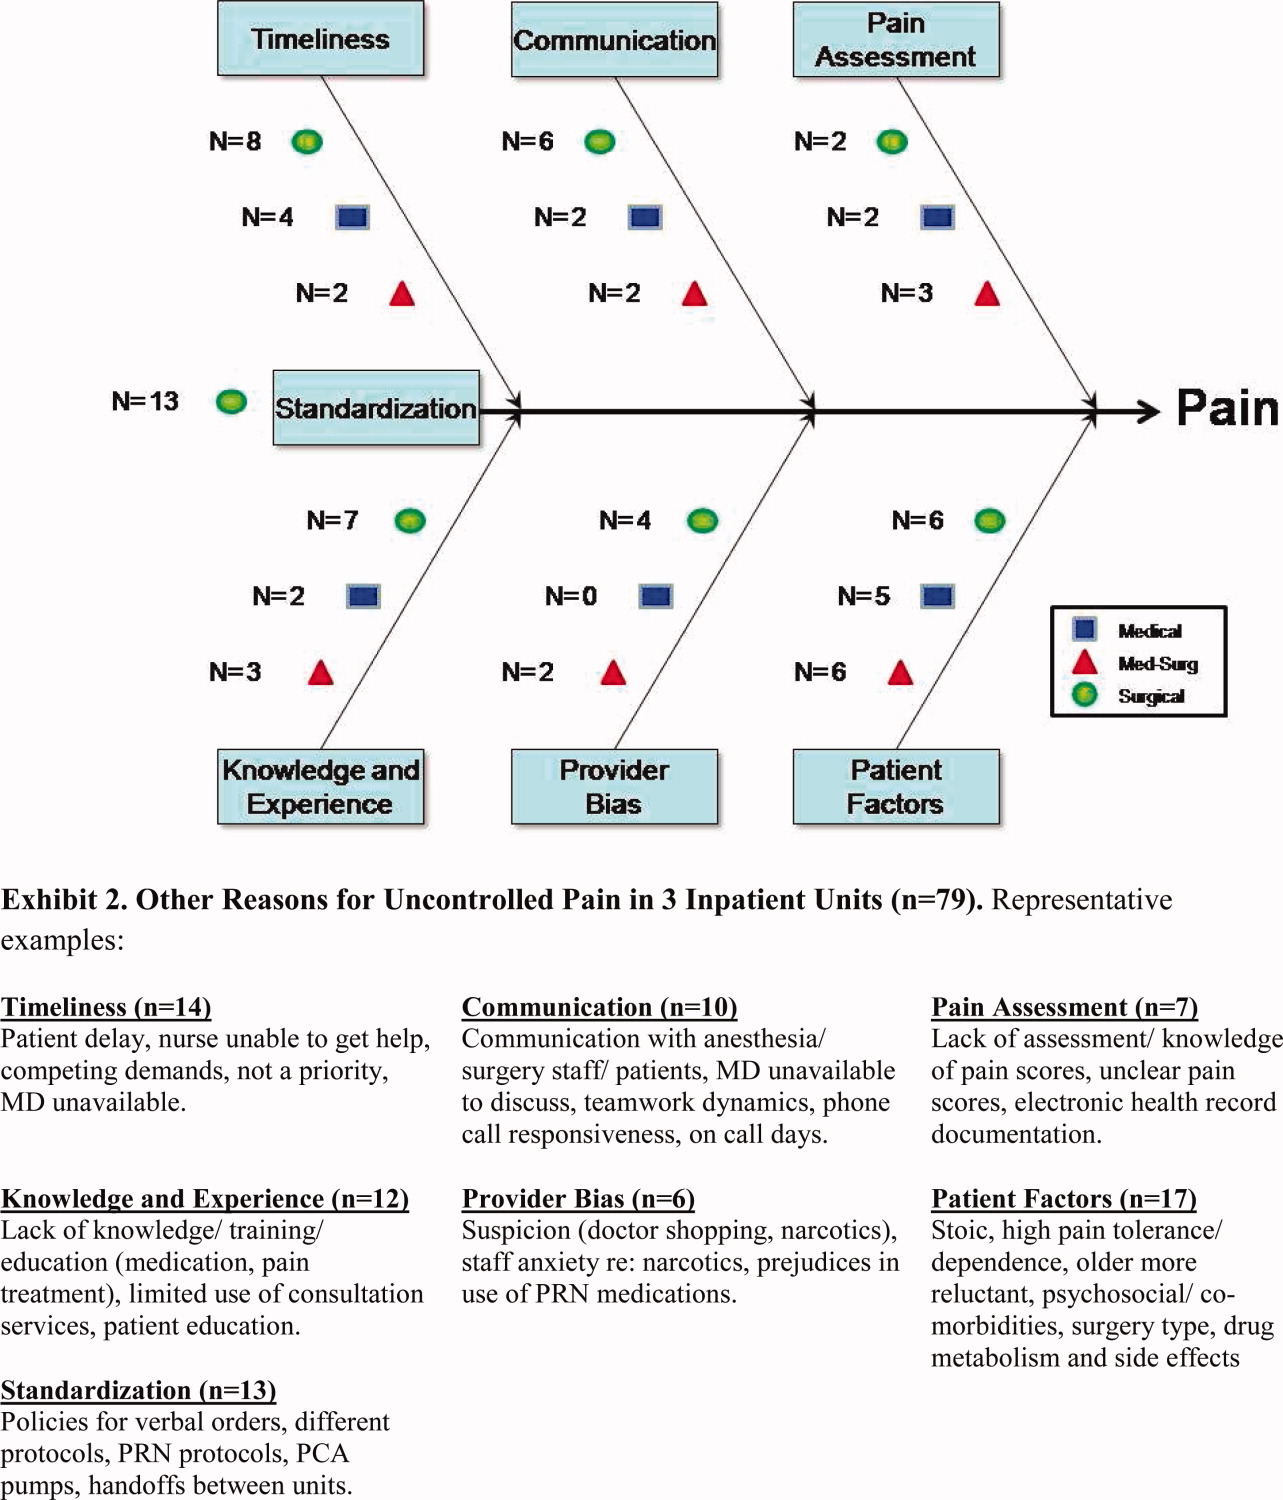
DISCUSSION
Using a brainstorming tool for idea generation (NGT) in quality improvement, we identified almost 100 causes of uncontrolled pain management in hospital units. We identified 7 priority themes along 3 main factors: system factors, human factors, and an interface of system and human factors. Timeliness and education emerged from 2 of the 3 services as top priorities, though they were unique and specific to the providers and patient populations within each service. The third service yielded surprisingly different priorities, with patient issues and provider bias foremost in the minds of the staff caring for these patients.
In the decade since To Err Is Human was released by the Institute of Medicine,18 healthcare improvement work has become commonplace and routine. Projects start by soliciting staff views about possible areas for improvement, usually during group meetings; however, this process is informal and not systematic. Unstructured group meetings and brainstorming have some limitations when used to uncover creative ideas for healthcare improvement.19 The literature has consistently reported that groups produce fewer ideas than an equivalent number of individuals working alone.20 In a meta‐analysis, Mullen et al21 found that interacting groups usually produced ideas of poorer quality than did nominal groups. Interpersonal interactions in a multidisciplinary team may be influenced by perceived roles and dominant personalities, and can impede a collaborative, critical discourse.22
In contrast, in NGT sessions, the weight of each member's opinion is the same, and it appears that process loss is less likely to occur.17 Moreover, the highly structured format of NGT provides an opportunity for group members to achieve a substantial amount of work in a relatively short time. Another advantage of NGT is the deliberate avoidance of interference or interpretation from a moderator or facilitator who, in the case of NGT, has the responsibility to explore but not interfere with or influence the members of the group.13 However, the NGT has some limitations. The composition and representativeness of participants may limit the generalizability of the findings. Also, it requires training and preparation, restricts the discussion to a single topic, and may not allow further elaboration of other ideas.13 Despite its potential benefits, NGT is relatively underutilized in quality improvement initiatives. To the best of our knowledge, this is the first study that has utilized NGT to elicit ideas about potential areas for pain control improvement. NGT is a good method for achieving local solutions to local problems; teams of healthcare providers should consider using NGT to address their own challenges and barriers.
In our study, timeliness, knowledge, and experience were considered the top priorities to improve pain management. Our findings are similar to a Canadian study, where delay of more than an hour to administer analgesia was considered one of the most important factors to provide good pain control management.23 Also our findings are coherent with a recent survey of 225 hospitals in the United Kingdom, where perceived lack of training was a highly ranked contributing factor for suboptimal postoperative pain management.24
Our study also identified other interesting observations that deserve comment. Examining the top priorities among the 3 services, there is some dissonance of reasoning underlying the inadequate pain control. We can speculate several reasons. First, pain control management, like any other condition, happens within a specific context with unique problems or barriers that prevent the delivery of the best care for each service. The other possible explanation is a silo effect. It is possible that workers of the same service represent a relatively homogenous social group despite differing training and backgrounds; they live the same experiences and face similar problems. Workers of one silo may work in parallel but do not interact with members of another silo, so they do not have opportunities to share their experiences or compare their beliefs. Finally, it is possible that the greater number of groups used in this study resulted in a broader array of issues. Studies have confirmed that the presence of several groups using NGT can produce a larger pool of issues, with more variation.16 Thus, the ideas generated in our NGT can be easily grouped into 2 broader categories: human factors (knowledge, experience, provider bias, and patient factors) and system factors (timeliness, communication, and pain assessment).
Our study has some limitations. The study was conducted in a single institution and in a limited number of inpatient units. The list of potential areas for improvement generated in this study may require further confirmation and validation at other institutions and with other sources of information (actual pain assessments, timeliness, knowledge, patient satisfaction). Importantly, the study design only involved healthcare providers and did not involve other stakeholders such as the patients or their families.
Despite these limitations, we propose that the NGT is a good alternative to unstructured brainstorming to systematically identify, characterize, categorize, and prioritize ideas behind inadequate pain management. The NGT is a valuable tool in conducting a robust formative assessment to better understand the multiple challenges, barriers, and perspectives of healthcare providers in guiding quality improvement interventions in a systematic and less biased manner.
CONCLUSIONS
In conclusion, healthcare workers have clear ideas about potential areas for improvement in pain management. Using the NGT, we identified 7 potential areas for improvement encompassed within human and system factors. Knowledge and timeliness emerged from 2 of the 3 clinical services as top priorities, whereas the third group identified disparate concerns suggesting provider bias and patient issues. We believe the nominal group technique is an efficient tool to uncover general and context‐specific priorities and to guide quality improvement work.
- .Success stories: how hospitals are improving care.Am Heart J.2004;148(5 suppl):S52–S55.
- ,.Acute pain.Lancet.1999;353(9169):2051–2058.
- ,,, et al.Improving the management of pain in hospitalized adults.Arch Intern Med.2006;166(9):1033–1039.
- ,,.Pain and satisfaction with pain control in hospitalized medical patients: no such thing as low risk.Arch Intern Med.2004;164(2):175–180.
- ,,,.Pain prevalence study in a large Canadian teaching hospital. Round 2: lessons learned?Pain Manag Nurs.2010;11(1):45–55.
- ,,,,.Pain prevalence study in a large Canadian teaching hospital.Pain Manag Nurs.2008;9(3):104–112.
- Institute of Medicine.Crossing the Quality Chasm: A New Health System for the 21st Century.Washington, DC:National Academy Press;2001.
- .Pain intensity and pain interference in hospitalized patients with cancer.Oncol Nurs Forum.2000;27(6):985–991.
- ,.Incidence and characteristics of pain in a sample of hospitalized cancer patients.Cancer Nurs.1987;10(2):85–92.
- .JCAHO pain management standards are unveiled. Joint Commission on Accreditation of Healthcare Organizations.JAMA.2000;284(4):428–429.
- ,,,,.A pilot study using nominal group technique to assess residents' perceptions of successful attending rounds.J Gen Intern Med.2008;23(7):1060–1065.
- ,,, et al.What should we include in a cultural competence curriculum? An emerging formative evaluation process to foster curriculum development.Acad Med.2011;86(3):333–341.
- Brief 7. Gaining Consensus Among Stakeholders Through the Nominal Group Technique. Available at: http://www.cdc.gov/HealthyYouth/evaluation/pdf/brief7.pdf. Accessed October 19,2011.
- ,.The nominal group as a research instrument for exploratory health studies.Am J Public Health.1972;62(3):337–342.
- ,,, et al.Reasons for not intensifying medications: differentiating “clinical inertia” from appropriate care.J Gen Intern Med.2007;22(12):1648–1655.
- ,,,.Nominal group technique: a process for identifying diabetes self‐care issues among patients and caregivers.Diabetes Educ.2000;26(2):305–310,312,314.
- ,,,,.The nominal group technique: a research tool for general practice?Fam Pract.1993;10(1):76–81.
- Institute of Medicine.To Err Is Human. Building a Safer Health System.Washington, DC:National Academy Press;2000.
- ,,.Quality by Design: A Clinical Microsystems Approach.San Francisco, CA:Jossey‐Bass Wiley;2007.
- ,.Group versus individual performance on tasks requiring ideational proficiency (brainstorming): a review.Eur J Soc Psychol.1973;3(4):361–388.
- ,,.Productivity loss in brainstorming groups: a meta‐analytic integration.Basic Appl Soc Psychol.1991;12:3–23.
- ,.Productivity loss in brainstorming groups: toward the solution of a riddle.J Pers Soc Psychol.1987;53:497–509.
- ,,.An interventional study to improve the quality of analgesia in the emergency department.CJEM.2008;10(5):435–439.
- ,,,.Pain assessment and management in medical wards: an area of unmet need.Postgrad Med J.2010;86(1015):279–284.
Pain is considered the fifth vital sign, and the appropriate management of pain is fundamental for patient care. Uncontrolled pain has adverse negative physiological consequences,14 and better pain control in hospitalized patients has been associated with decreased length of stay and improved recovery and physical comfort.36 However, many patients fail to receive state‐of‐the‐art pain relief7; for example, in a study of 176 hospitalized patients with cancer, 46% reported severe pain at the time of the interview.8 The prevalence of pain in hospitalized patients with other diagnoses besides cancer likewise remains high.9
Over the last 2 decades, the quality of care in pain management has gained increasing attention. In 2000, the Joint Commission unveiled an official statement for the purpose of improving the quality of pain management.10 The Joint Commission's 6 core principles include the right of pain assessment and treatment, institution of organizational procedures to assess pain, provision of care of persons with pain, general education, continuity of pain management after hospital discharge, and inclusion of pain management as a performance measure. Pain management is now a hospital accountability indicator. Although multiple initiatives have been undertaken to improve pain control, however, challenges still remain. Effective strategies for consensus development are still needed to prioritize interventions.
The nominal group technique (NGT) is a brainstorming tool for quality improvement; NGT is a highly structured small group discussion used to elicit and prioritize a list of answers to a specific question.1115 We conducted an NGT session to identify the multiple challenges, barriers, and perspectives of healthcare providers in managing pain among hospitalized patients. The ultimate goals were to identify potential areas for pain management improvement, build consensus among caregivers, and introduce the NGT as a tool to elicit caregivers' ideas for quality improvement.
METHODS
In a multistep process, we first identified areas for quality improvement interventions in pain management by using the NGT in hospitalized patients, then organized the information by using an iterative consensus development process, and finally displayed the main findings using a Fishbone diagram.
Setting and Participants
At a large university hospital, we targeted 3 inpatient services based on pain management performance data. We obtained the data from patient satisfaction and the Hospital Consumer Assessment of Healthcare Providers and Systems (HCAHPS) surveys. They included 1 medical, 1 medical‐surgical, and 1 surgical hospital unit at a large academic medical center.
Within these units we recruited participants from a convenience sample of nurses, resident physicians, patient care technicians, and unit clerks. We included patient care technicians and unit clerks as they often interface between patients and providers. To maintain anonymity of the responses, we did not record participant composition during the session. Participation was voluntary and no incentives were provided. The institutional review board at the University of Alabama at Birmingham approved the use of existing quality improvement data.
Nominal Group Technique
During 2009, we conducted an NGT session within each of the 3 inpatient units. Two of the authors (MB, DS) developed the question posed to each group: What causes uncontrolled pain in your unit? The NGT supports equal participation, controls the extraneous discussion that frequently occurs when groups are convened, minimizes real or perceived power differentials among members, and, in the aggregate, minimizes the process loss that exists in unstructured focus group meetings.1116 Thus, the ideas generated by this process provide a valid reflection of the implicit prioritized views held by the group. The NGT also provides concise written documentation summarizing participants' responses, rendering audiotape recording and transcription unnecessary.13, 17
Each NGT session, lasting 1 hour, followed the following steps.13 First, after a brief introduction of the purpose of the session and general instructions, the moderators (MB, DS) posed the question: What causes uncontrolled pain in your unit? Second, in response to the standard question, each participant in the group silently and individually generated a list of ideas and wrote them down. Third, using a round‐robin approach (1 person at a time mentions the idea), each idea was concisely transcribed by the facilitator onto a flip‐chart for all participants to see; debate was not allowed during this step. Fourth, each recorded idea was then discussed for the sole purpose of clarification, and not for evaluation or argument as to the relative importance. The proposer of the idea did not need to defend the idea. During this step, participants were prompted to combine those ideas that were perceived to be substantively similar. Finally, during the voting phase, participants privately selected what they considered to be the 3 most important reasons for uncontrolled pain in their unit. Each participant prioritized their choices on their own and without discussing with other participants, giving a rank of 3 to the most important idea and 1 to the least important idea. The moderator recorded the votes onto the flip‐chart in front of all participants and then tallied the votes for each idea. We discarded a small number of idiosyncratic suggestions, which is a standard procedure in the nominal group technique. The main results were the top 5 suggestions identified within each group; the secondary results were all other suggestions. A more detailed description of the NGT steps is available elsewhere.11
Ishikawa (Fishbone) Diagram
Fishbone diagrams are designed to organize contributing factors to a particular outcome in a pictorial display. This is a common tool used to identify areas for improvement by facilitating brainstorming and graphically displaying the relationship of the causes to the effect. Through an iterative process, 3 of the authors (AP, MB, CAE) categorized all of the generated ideas into common themes until consensus was reached. The top 5 and all other suggestions within each service were organized into the Fishbone diagram.
RESULTS
The 27 health workers representing the 3 units completing the nominal group sessions generated a total of 94 ideas. The Fishbone diagram shown in Figure 1 shows each service's top 5 rankings of the elements perceived contributing most to uncontrolled pain; the elements were organized into 3 main factors and 7 priority themes identified during the iterative process.
The main categories illustrate system factors (timeliness, communication, pain assessment; Figure 1, top portion), human factors (knowledge and experience, provider bias, patient factors; Figure 1, bottom portion), and an interface between system and human factors (standardization; Figure 1, center left). The remaining 79 ideas, non‐top 5 for each unit, fell into the following priority themes: provider bias (n = 6), knowledge and experience (n = 12), pain assessment (n = 7), communication (n = 10), timeliness (n = 14), standardization (or policies and practice variation) (n = 13), and patient factors (n = 17); the ideas and representative examples are shown in Figure 2.
DISCUSSION
Using a brainstorming tool for idea generation (NGT) in quality improvement, we identified almost 100 causes of uncontrolled pain management in hospital units. We identified 7 priority themes along 3 main factors: system factors, human factors, and an interface of system and human factors. Timeliness and education emerged from 2 of the 3 services as top priorities, though they were unique and specific to the providers and patient populations within each service. The third service yielded surprisingly different priorities, with patient issues and provider bias foremost in the minds of the staff caring for these patients.
In the decade since To Err Is Human was released by the Institute of Medicine,18 healthcare improvement work has become commonplace and routine. Projects start by soliciting staff views about possible areas for improvement, usually during group meetings; however, this process is informal and not systematic. Unstructured group meetings and brainstorming have some limitations when used to uncover creative ideas for healthcare improvement.19 The literature has consistently reported that groups produce fewer ideas than an equivalent number of individuals working alone.20 In a meta‐analysis, Mullen et al21 found that interacting groups usually produced ideas of poorer quality than did nominal groups. Interpersonal interactions in a multidisciplinary team may be influenced by perceived roles and dominant personalities, and can impede a collaborative, critical discourse.22
In contrast, in NGT sessions, the weight of each member's opinion is the same, and it appears that process loss is less likely to occur.17 Moreover, the highly structured format of NGT provides an opportunity for group members to achieve a substantial amount of work in a relatively short time. Another advantage of NGT is the deliberate avoidance of interference or interpretation from a moderator or facilitator who, in the case of NGT, has the responsibility to explore but not interfere with or influence the members of the group.13 However, the NGT has some limitations. The composition and representativeness of participants may limit the generalizability of the findings. Also, it requires training and preparation, restricts the discussion to a single topic, and may not allow further elaboration of other ideas.13 Despite its potential benefits, NGT is relatively underutilized in quality improvement initiatives. To the best of our knowledge, this is the first study that has utilized NGT to elicit ideas about potential areas for pain control improvement. NGT is a good method for achieving local solutions to local problems; teams of healthcare providers should consider using NGT to address their own challenges and barriers.
In our study, timeliness, knowledge, and experience were considered the top priorities to improve pain management. Our findings are similar to a Canadian study, where delay of more than an hour to administer analgesia was considered one of the most important factors to provide good pain control management.23 Also our findings are coherent with a recent survey of 225 hospitals in the United Kingdom, where perceived lack of training was a highly ranked contributing factor for suboptimal postoperative pain management.24
Our study also identified other interesting observations that deserve comment. Examining the top priorities among the 3 services, there is some dissonance of reasoning underlying the inadequate pain control. We can speculate several reasons. First, pain control management, like any other condition, happens within a specific context with unique problems or barriers that prevent the delivery of the best care for each service. The other possible explanation is a silo effect. It is possible that workers of the same service represent a relatively homogenous social group despite differing training and backgrounds; they live the same experiences and face similar problems. Workers of one silo may work in parallel but do not interact with members of another silo, so they do not have opportunities to share their experiences or compare their beliefs. Finally, it is possible that the greater number of groups used in this study resulted in a broader array of issues. Studies have confirmed that the presence of several groups using NGT can produce a larger pool of issues, with more variation.16 Thus, the ideas generated in our NGT can be easily grouped into 2 broader categories: human factors (knowledge, experience, provider bias, and patient factors) and system factors (timeliness, communication, and pain assessment).
Our study has some limitations. The study was conducted in a single institution and in a limited number of inpatient units. The list of potential areas for improvement generated in this study may require further confirmation and validation at other institutions and with other sources of information (actual pain assessments, timeliness, knowledge, patient satisfaction). Importantly, the study design only involved healthcare providers and did not involve other stakeholders such as the patients or their families.
Despite these limitations, we propose that the NGT is a good alternative to unstructured brainstorming to systematically identify, characterize, categorize, and prioritize ideas behind inadequate pain management. The NGT is a valuable tool in conducting a robust formative assessment to better understand the multiple challenges, barriers, and perspectives of healthcare providers in guiding quality improvement interventions in a systematic and less biased manner.
CONCLUSIONS
In conclusion, healthcare workers have clear ideas about potential areas for improvement in pain management. Using the NGT, we identified 7 potential areas for improvement encompassed within human and system factors. Knowledge and timeliness emerged from 2 of the 3 clinical services as top priorities, whereas the third group identified disparate concerns suggesting provider bias and patient issues. We believe the nominal group technique is an efficient tool to uncover general and context‐specific priorities and to guide quality improvement work.
Pain is considered the fifth vital sign, and the appropriate management of pain is fundamental for patient care. Uncontrolled pain has adverse negative physiological consequences,14 and better pain control in hospitalized patients has been associated with decreased length of stay and improved recovery and physical comfort.36 However, many patients fail to receive state‐of‐the‐art pain relief7; for example, in a study of 176 hospitalized patients with cancer, 46% reported severe pain at the time of the interview.8 The prevalence of pain in hospitalized patients with other diagnoses besides cancer likewise remains high.9
Over the last 2 decades, the quality of care in pain management has gained increasing attention. In 2000, the Joint Commission unveiled an official statement for the purpose of improving the quality of pain management.10 The Joint Commission's 6 core principles include the right of pain assessment and treatment, institution of organizational procedures to assess pain, provision of care of persons with pain, general education, continuity of pain management after hospital discharge, and inclusion of pain management as a performance measure. Pain management is now a hospital accountability indicator. Although multiple initiatives have been undertaken to improve pain control, however, challenges still remain. Effective strategies for consensus development are still needed to prioritize interventions.
The nominal group technique (NGT) is a brainstorming tool for quality improvement; NGT is a highly structured small group discussion used to elicit and prioritize a list of answers to a specific question.1115 We conducted an NGT session to identify the multiple challenges, barriers, and perspectives of healthcare providers in managing pain among hospitalized patients. The ultimate goals were to identify potential areas for pain management improvement, build consensus among caregivers, and introduce the NGT as a tool to elicit caregivers' ideas for quality improvement.
METHODS
In a multistep process, we first identified areas for quality improvement interventions in pain management by using the NGT in hospitalized patients, then organized the information by using an iterative consensus development process, and finally displayed the main findings using a Fishbone diagram.
Setting and Participants
At a large university hospital, we targeted 3 inpatient services based on pain management performance data. We obtained the data from patient satisfaction and the Hospital Consumer Assessment of Healthcare Providers and Systems (HCAHPS) surveys. They included 1 medical, 1 medical‐surgical, and 1 surgical hospital unit at a large academic medical center.
Within these units we recruited participants from a convenience sample of nurses, resident physicians, patient care technicians, and unit clerks. We included patient care technicians and unit clerks as they often interface between patients and providers. To maintain anonymity of the responses, we did not record participant composition during the session. Participation was voluntary and no incentives were provided. The institutional review board at the University of Alabama at Birmingham approved the use of existing quality improvement data.
Nominal Group Technique
During 2009, we conducted an NGT session within each of the 3 inpatient units. Two of the authors (MB, DS) developed the question posed to each group: What causes uncontrolled pain in your unit? The NGT supports equal participation, controls the extraneous discussion that frequently occurs when groups are convened, minimizes real or perceived power differentials among members, and, in the aggregate, minimizes the process loss that exists in unstructured focus group meetings.1116 Thus, the ideas generated by this process provide a valid reflection of the implicit prioritized views held by the group. The NGT also provides concise written documentation summarizing participants' responses, rendering audiotape recording and transcription unnecessary.13, 17
Each NGT session, lasting 1 hour, followed the following steps.13 First, after a brief introduction of the purpose of the session and general instructions, the moderators (MB, DS) posed the question: What causes uncontrolled pain in your unit? Second, in response to the standard question, each participant in the group silently and individually generated a list of ideas and wrote them down. Third, using a round‐robin approach (1 person at a time mentions the idea), each idea was concisely transcribed by the facilitator onto a flip‐chart for all participants to see; debate was not allowed during this step. Fourth, each recorded idea was then discussed for the sole purpose of clarification, and not for evaluation or argument as to the relative importance. The proposer of the idea did not need to defend the idea. During this step, participants were prompted to combine those ideas that were perceived to be substantively similar. Finally, during the voting phase, participants privately selected what they considered to be the 3 most important reasons for uncontrolled pain in their unit. Each participant prioritized their choices on their own and without discussing with other participants, giving a rank of 3 to the most important idea and 1 to the least important idea. The moderator recorded the votes onto the flip‐chart in front of all participants and then tallied the votes for each idea. We discarded a small number of idiosyncratic suggestions, which is a standard procedure in the nominal group technique. The main results were the top 5 suggestions identified within each group; the secondary results were all other suggestions. A more detailed description of the NGT steps is available elsewhere.11
Ishikawa (Fishbone) Diagram
Fishbone diagrams are designed to organize contributing factors to a particular outcome in a pictorial display. This is a common tool used to identify areas for improvement by facilitating brainstorming and graphically displaying the relationship of the causes to the effect. Through an iterative process, 3 of the authors (AP, MB, CAE) categorized all of the generated ideas into common themes until consensus was reached. The top 5 and all other suggestions within each service were organized into the Fishbone diagram.
RESULTS
The 27 health workers representing the 3 units completing the nominal group sessions generated a total of 94 ideas. The Fishbone diagram shown in Figure 1 shows each service's top 5 rankings of the elements perceived contributing most to uncontrolled pain; the elements were organized into 3 main factors and 7 priority themes identified during the iterative process.
The main categories illustrate system factors (timeliness, communication, pain assessment; Figure 1, top portion), human factors (knowledge and experience, provider bias, patient factors; Figure 1, bottom portion), and an interface between system and human factors (standardization; Figure 1, center left). The remaining 79 ideas, non‐top 5 for each unit, fell into the following priority themes: provider bias (n = 6), knowledge and experience (n = 12), pain assessment (n = 7), communication (n = 10), timeliness (n = 14), standardization (or policies and practice variation) (n = 13), and patient factors (n = 17); the ideas and representative examples are shown in Figure 2.
DISCUSSION
Using a brainstorming tool for idea generation (NGT) in quality improvement, we identified almost 100 causes of uncontrolled pain management in hospital units. We identified 7 priority themes along 3 main factors: system factors, human factors, and an interface of system and human factors. Timeliness and education emerged from 2 of the 3 services as top priorities, though they were unique and specific to the providers and patient populations within each service. The third service yielded surprisingly different priorities, with patient issues and provider bias foremost in the minds of the staff caring for these patients.
In the decade since To Err Is Human was released by the Institute of Medicine,18 healthcare improvement work has become commonplace and routine. Projects start by soliciting staff views about possible areas for improvement, usually during group meetings; however, this process is informal and not systematic. Unstructured group meetings and brainstorming have some limitations when used to uncover creative ideas for healthcare improvement.19 The literature has consistently reported that groups produce fewer ideas than an equivalent number of individuals working alone.20 In a meta‐analysis, Mullen et al21 found that interacting groups usually produced ideas of poorer quality than did nominal groups. Interpersonal interactions in a multidisciplinary team may be influenced by perceived roles and dominant personalities, and can impede a collaborative, critical discourse.22
In contrast, in NGT sessions, the weight of each member's opinion is the same, and it appears that process loss is less likely to occur.17 Moreover, the highly structured format of NGT provides an opportunity for group members to achieve a substantial amount of work in a relatively short time. Another advantage of NGT is the deliberate avoidance of interference or interpretation from a moderator or facilitator who, in the case of NGT, has the responsibility to explore but not interfere with or influence the members of the group.13 However, the NGT has some limitations. The composition and representativeness of participants may limit the generalizability of the findings. Also, it requires training and preparation, restricts the discussion to a single topic, and may not allow further elaboration of other ideas.13 Despite its potential benefits, NGT is relatively underutilized in quality improvement initiatives. To the best of our knowledge, this is the first study that has utilized NGT to elicit ideas about potential areas for pain control improvement. NGT is a good method for achieving local solutions to local problems; teams of healthcare providers should consider using NGT to address their own challenges and barriers.
In our study, timeliness, knowledge, and experience were considered the top priorities to improve pain management. Our findings are similar to a Canadian study, where delay of more than an hour to administer analgesia was considered one of the most important factors to provide good pain control management.23 Also our findings are coherent with a recent survey of 225 hospitals in the United Kingdom, where perceived lack of training was a highly ranked contributing factor for suboptimal postoperative pain management.24
Our study also identified other interesting observations that deserve comment. Examining the top priorities among the 3 services, there is some dissonance of reasoning underlying the inadequate pain control. We can speculate several reasons. First, pain control management, like any other condition, happens within a specific context with unique problems or barriers that prevent the delivery of the best care for each service. The other possible explanation is a silo effect. It is possible that workers of the same service represent a relatively homogenous social group despite differing training and backgrounds; they live the same experiences and face similar problems. Workers of one silo may work in parallel but do not interact with members of another silo, so they do not have opportunities to share their experiences or compare their beliefs. Finally, it is possible that the greater number of groups used in this study resulted in a broader array of issues. Studies have confirmed that the presence of several groups using NGT can produce a larger pool of issues, with more variation.16 Thus, the ideas generated in our NGT can be easily grouped into 2 broader categories: human factors (knowledge, experience, provider bias, and patient factors) and system factors (timeliness, communication, and pain assessment).
Our study has some limitations. The study was conducted in a single institution and in a limited number of inpatient units. The list of potential areas for improvement generated in this study may require further confirmation and validation at other institutions and with other sources of information (actual pain assessments, timeliness, knowledge, patient satisfaction). Importantly, the study design only involved healthcare providers and did not involve other stakeholders such as the patients or their families.
Despite these limitations, we propose that the NGT is a good alternative to unstructured brainstorming to systematically identify, characterize, categorize, and prioritize ideas behind inadequate pain management. The NGT is a valuable tool in conducting a robust formative assessment to better understand the multiple challenges, barriers, and perspectives of healthcare providers in guiding quality improvement interventions in a systematic and less biased manner.
CONCLUSIONS
In conclusion, healthcare workers have clear ideas about potential areas for improvement in pain management. Using the NGT, we identified 7 potential areas for improvement encompassed within human and system factors. Knowledge and timeliness emerged from 2 of the 3 clinical services as top priorities, whereas the third group identified disparate concerns suggesting provider bias and patient issues. We believe the nominal group technique is an efficient tool to uncover general and context‐specific priorities and to guide quality improvement work.
- .Success stories: how hospitals are improving care.Am Heart J.2004;148(5 suppl):S52–S55.
- ,.Acute pain.Lancet.1999;353(9169):2051–2058.
- ,,, et al.Improving the management of pain in hospitalized adults.Arch Intern Med.2006;166(9):1033–1039.
- ,,.Pain and satisfaction with pain control in hospitalized medical patients: no such thing as low risk.Arch Intern Med.2004;164(2):175–180.
- ,,,.Pain prevalence study in a large Canadian teaching hospital. Round 2: lessons learned?Pain Manag Nurs.2010;11(1):45–55.
- ,,,,.Pain prevalence study in a large Canadian teaching hospital.Pain Manag Nurs.2008;9(3):104–112.
- Institute of Medicine.Crossing the Quality Chasm: A New Health System for the 21st Century.Washington, DC:National Academy Press;2001.
- .Pain intensity and pain interference in hospitalized patients with cancer.Oncol Nurs Forum.2000;27(6):985–991.
- ,.Incidence and characteristics of pain in a sample of hospitalized cancer patients.Cancer Nurs.1987;10(2):85–92.
- .JCAHO pain management standards are unveiled. Joint Commission on Accreditation of Healthcare Organizations.JAMA.2000;284(4):428–429.
- ,,,,.A pilot study using nominal group technique to assess residents' perceptions of successful attending rounds.J Gen Intern Med.2008;23(7):1060–1065.
- ,,, et al.What should we include in a cultural competence curriculum? An emerging formative evaluation process to foster curriculum development.Acad Med.2011;86(3):333–341.
- Brief 7. Gaining Consensus Among Stakeholders Through the Nominal Group Technique. Available at: http://www.cdc.gov/HealthyYouth/evaluation/pdf/brief7.pdf. Accessed October 19,2011.
- ,.The nominal group as a research instrument for exploratory health studies.Am J Public Health.1972;62(3):337–342.
- ,,, et al.Reasons for not intensifying medications: differentiating “clinical inertia” from appropriate care.J Gen Intern Med.2007;22(12):1648–1655.
- ,,,.Nominal group technique: a process for identifying diabetes self‐care issues among patients and caregivers.Diabetes Educ.2000;26(2):305–310,312,314.
- ,,,,.The nominal group technique: a research tool for general practice?Fam Pract.1993;10(1):76–81.
- Institute of Medicine.To Err Is Human. Building a Safer Health System.Washington, DC:National Academy Press;2000.
- ,,.Quality by Design: A Clinical Microsystems Approach.San Francisco, CA:Jossey‐Bass Wiley;2007.
- ,.Group versus individual performance on tasks requiring ideational proficiency (brainstorming): a review.Eur J Soc Psychol.1973;3(4):361–388.
- ,,.Productivity loss in brainstorming groups: a meta‐analytic integration.Basic Appl Soc Psychol.1991;12:3–23.
- ,.Productivity loss in brainstorming groups: toward the solution of a riddle.J Pers Soc Psychol.1987;53:497–509.
- ,,.An interventional study to improve the quality of analgesia in the emergency department.CJEM.2008;10(5):435–439.
- ,,,.Pain assessment and management in medical wards: an area of unmet need.Postgrad Med J.2010;86(1015):279–284.
- .Success stories: how hospitals are improving care.Am Heart J.2004;148(5 suppl):S52–S55.
- ,.Acute pain.Lancet.1999;353(9169):2051–2058.
- ,,, et al.Improving the management of pain in hospitalized adults.Arch Intern Med.2006;166(9):1033–1039.
- ,,.Pain and satisfaction with pain control in hospitalized medical patients: no such thing as low risk.Arch Intern Med.2004;164(2):175–180.
- ,,,.Pain prevalence study in a large Canadian teaching hospital. Round 2: lessons learned?Pain Manag Nurs.2010;11(1):45–55.
- ,,,,.Pain prevalence study in a large Canadian teaching hospital.Pain Manag Nurs.2008;9(3):104–112.
- Institute of Medicine.Crossing the Quality Chasm: A New Health System for the 21st Century.Washington, DC:National Academy Press;2001.
- .Pain intensity and pain interference in hospitalized patients with cancer.Oncol Nurs Forum.2000;27(6):985–991.
- ,.Incidence and characteristics of pain in a sample of hospitalized cancer patients.Cancer Nurs.1987;10(2):85–92.
- .JCAHO pain management standards are unveiled. Joint Commission on Accreditation of Healthcare Organizations.JAMA.2000;284(4):428–429.
- ,,,,.A pilot study using nominal group technique to assess residents' perceptions of successful attending rounds.J Gen Intern Med.2008;23(7):1060–1065.
- ,,, et al.What should we include in a cultural competence curriculum? An emerging formative evaluation process to foster curriculum development.Acad Med.2011;86(3):333–341.
- Brief 7. Gaining Consensus Among Stakeholders Through the Nominal Group Technique. Available at: http://www.cdc.gov/HealthyYouth/evaluation/pdf/brief7.pdf. Accessed October 19,2011.
- ,.The nominal group as a research instrument for exploratory health studies.Am J Public Health.1972;62(3):337–342.
- ,,, et al.Reasons for not intensifying medications: differentiating “clinical inertia” from appropriate care.J Gen Intern Med.2007;22(12):1648–1655.
- ,,,.Nominal group technique: a process for identifying diabetes self‐care issues among patients and caregivers.Diabetes Educ.2000;26(2):305–310,312,314.
- ,,,,.The nominal group technique: a research tool for general practice?Fam Pract.1993;10(1):76–81.
- Institute of Medicine.To Err Is Human. Building a Safer Health System.Washington, DC:National Academy Press;2000.
- ,,.Quality by Design: A Clinical Microsystems Approach.San Francisco, CA:Jossey‐Bass Wiley;2007.
- ,.Group versus individual performance on tasks requiring ideational proficiency (brainstorming): a review.Eur J Soc Psychol.1973;3(4):361–388.
- ,,.Productivity loss in brainstorming groups: a meta‐analytic integration.Basic Appl Soc Psychol.1991;12:3–23.
- ,.Productivity loss in brainstorming groups: toward the solution of a riddle.J Pers Soc Psychol.1987;53:497–509.
- ,,.An interventional study to improve the quality of analgesia in the emergency department.CJEM.2008;10(5):435–439.
- ,,,.Pain assessment and management in medical wards: an area of unmet need.Postgrad Med J.2010;86(1015):279–284.
Copyright © 2011 Society of Hospital Medicine
Inappropriate Prescribing of PPIs
Proton pump inhibitors (PPIs) are the third most commonly prescribed class of medication in the United States, with $13.6 billion in yearly sales.1 Despite their effectiveness in treating acid reflux2 and their mortality benefit in the treatment of patients with gastrointestinal bleeding,3 recent literature has identified a number of risks associated with PPIs, including an increased incidence of Clostridium difficile infection,4 decreased effectiveness of clopidogrel in patients with acute coronary syndrome,5 increased risk of community‐ and hospital‐acquired pneumonia, and an increased risk of hip fracture.69 Additionally, in March of 2011, the US Food and Drug Administration (FDA) issued a warning regarding the potential for PPIs to cause low magnesium levels which can, in turn, cause muscle spasms, an irregular heartbeat, and convulsions.10
Inappropriate PPI prescription practice has been demonstrated in the primary care setting,11 as well as in small studies conducted in the hospital setting.1216 We hypothesized that many hospitalized patients receive these medications without having an accepted indication, and examined 2 populations of hospitalized patients, including administrative data from 6.5 million discharges from US university hospitals, to look for appropriate diagnoses justifying their use.
METHODS
We performed a retrospective review of administrative data collected between January 1, 2008 and December 31, 2009 from 2 patient populations: (a) those discharged from Denver Health (DH), a university‐affiliated public safety net hospital in Denver, CO; and (b) patients discharged from 112 academic health centers and 256 of their affiliated hospitals that participate in the University HealthSystem Consortium (UHC). The Colorado Multiple Institution Review Board reviewed and approved the conduct of this study.
Inclusion criteria for both populations were age >18 or <90 years, and hospitalization on a Medicine service. Prisoners and women known to be pregnant were excluded. In both cohorts, if patients had more than 1 admission during the 2‐year study period, only data from the first admission were used.
We recorded demographics, admitting diagnosis, and discharge diagnoses together with information pertaining to the name, route, and duration of administration of all PPIs (ie, omeprazole, lansoprazole, esomeprazole, pantoprazole, rabeprazole). We created a broadly inclusive set of valid indications for PPIs by incorporating diagnoses that could be identified by International Classification of Diseases, Ninth Revision.
(ICD‐9) codes from a number of previously published sources including the National Institute of Clinical Excellence (NICE) guidelines issued by the National Health Service (NHS) of the United Kingdom in 200012, 1721 (Table 1).
| Indication | ICD‐9 Code |
|---|---|
| |
| Helicobacter pylori | 041.86 |
| Abnormality of secretion of gastrin | 251.5 |
| Esophageal varices with bleeding | 456.0 |
| Esophageal varices without mention of bleeding | 456.1 |
| Esophageal varices in diseases classified elsewhere | 456.2 |
| Esophagitis | 530.10530.19 |
| Perforation of esophagus | 530.4 |
| Gastroesophageal laceration‐hemorrhage syndrome | 530.7 |
| Esophageal reflux | 530.81 |
| Barrett's esophagus | 530.85 |
| Gastric ulcer | 531.0031.91 |
| Duodenal ulcer | 532.00532.91 |
| Peptic ulcer, site unspecified | 533.00533.91 |
| Gastritis and duodenitis | 535.00535.71 |
| Gastroparesis | 536.3 |
| Dyspepsia and other specified disorders of function of stomach | 536.8 |
| Hemorrhage of gastrointestinal tract, unspecified | 578.9 |
To assess the accuracy of the administrative data from DH, we also reviewed the Emergency Department histories, admission histories, progress notes, electronic pharmacy records, endoscopy reports, and discharge summaries of 123 patients randomly selected (ie, a 5% sample) from the group of patients identified by administrative data to have received a PPI without a valid indication, looking for any accepted indication that might have been missed in the administrative data.
All analyses were performed using SAS Enterprise Guide 4.1 (SAS Institute, Cary, NC). A Student t test was used to compare continuous variables and a chi‐square test was used to compare categorical variables. Bonferroni corrections were used for multiple comparisons, such that P values less than 0.01 were considered to be significant for categorical variables.
RESULTS
Inclusion criteria were met by 9875 patients in the Denver Health database and 6,592,100 patients in the UHC database. The demographics and primary discharge diagnoses for these patients are summarized in Table 2.
| DH (N = 9875) | UHC (N = 6,592,100) | ||||
|---|---|---|---|---|---|
| Received a PPI | No PPI | Received a PPI | No PPI | ||
| |||||
| No. (%) | 3962 (40) | 5913 (60) | 918,474 (14) | 5,673,626 (86) | |
| Age (mean SD) | 53 15 | 51 16 | 59 17 | 55 18 | |
| Gender (% male) | 2197 (55) | 3438 (58) | 464,552 (51) | 2,882,577 (51) | |
| Race (% white) | 1610 (41) | 2425 (41) | 619,571 (67) | 3,670,450 (65) | |
| Top 5 primary discharge diagnoses | |||||
| Chest pain | 229 (6) | 462 (8) | Coronary atherosclerosis | 35,470 (4) | 186,321 (3) |
| Alcohol withdrawal | 147 (4) | 174 (3) | Acute myocardial infarction | 26,507 (3) | 132,159 (2) |
| Pneumonia, organism unspecified | 142 (4) | 262 (4) | Heart failure | 21,143 (2) | 103,751 (2) |
| Acute pancreatitis | 132 (3) | 106 (2) | Septicemia | 20,345 (2) | 64,915 (1) |
| Obstructive chronic bronchitis with (acute) exacerbation | 89 (2) | 154 (3) | Chest pain | 16,936 (2) | 107,497 (2) |
Only 39% and 27% of the patients in the DH and UHC databases, respectively, had a valid indication for PPIs on the basis of discharge diagnoses (Table 3). In the DH data, if admission ICD‐9 codes were also inspected for valid PPI indications, 1579 (40%) of patients receiving PPIs had a valid indication (admission ICD‐9 codes were not available for patients in the UHC database). Thirty‐one percent of Denver Health patients spent time in the intensive care unit (ICU) during their hospital stay and 65% of those patients received a PPI without a valid indication, as compared to 59% of patients who remained on the General Medicine ward (Table 3).
| DH (N = 9875) | UHC (N = 6,592,100) | |
|---|---|---|
| ||
| Patients receiving PPIs (% of total) | 3962 (40) | 918,474 (14) |
| Any ICU stay, N (% of all patients) | 1238 (31) | |
| General Medicine ward only, N (% of all patients) | 2724 (69) | |
| Patients with indication for PPI (% of all patients receiving PPIs)* | 1540 (39) | 247,142 (27) |
| Any ICU stay, N (% of all ICU patients) | 434 (35) | |
| General Medicine ward only, N (% of all ward patients) | 1106 (41) | |
| Patients without indication for PPI (% of those receiving PPIs)* | 2422 (61) | 671,332 (73) |
| Any ICU stay, N (% of all ICU patients) | 804 (65) | |
| General Medicine ward only, N (% of all ward patients) | 1618 (59) | |
Higher rates of concurrent C. difficile infections were observed in patients receiving PPIs in both databases; a higher rate of concurrent diagnosis of pneumonia was seen in patients receiving PPIs in the UHC population, with a nonsignificant trend towards the same finding in DH patients (Table 4).
| Denver Health | UHC | |||||
|---|---|---|---|---|---|---|
| Concurrent diagnosis | (+) PPI 3962 | () PPI 5913 | P | (+) PPI 918,474 | () PPI 5,673,626 | P |
| ||||||
| C. difficile | 46 (1.16) | 26 (0.44) | <0.0001 | 12,113 (1.32) | 175 (0.0031) | <0.0001 |
| Pneumonia | 400 (10.1) | 517 (8.7) | 0.0232 | 75,274 (8.2) | 300,557 (5.3) | <0.0001 |
Chart review in the DH population found valid indications for PPIs in 19% of patients who were thought not have a valid indication on the basis of the administrative data (Table 5). For 56% of those in whom no valid indication was confirmed, physicians identified prophylaxis as the justification.
| Characteristic | N (%) |
|---|---|
| |
| Valid indication found on chart review only | 23 (19) |
| No valid indication after chart review | 100 (81) |
| Written indication: prophylaxis | 56 (56) |
| No written documentation of indication present in the chart | 33 (33) |
| Written indication: continue home medication | 9 (9) |
| Intubated with or without written indication of prophylaxis | 16 (16) |
DISCUSSION
The important finding of this study was that the majority of patients in 2 large groups of Medicine patients hospitalized in university‐affiliated hospitals received PPIs without having a valid indication. To our knowledge, the more than 900,000 UHC patients who received a PPI during their hospitalization represent the largest inpatient population evaluated for appropriateness of PPI prescriptions.
Our finding that 41% of the patients admitted to the DH Medicine service received a PPI during their hospital stay is similar to what has been observed by others.9, 14, 22 The rate of PPI prescription was lower in the UHC population (14%) for unclear reasons. By our definition, 61% lacked an adequate diagnosis to justify the prescription of the PPI. After performing a chart review on a randomly selected 5% of these records, we found that the DH administrative database had failed to identify 19% of patients who had a valid indication for receiving a PPI. Adjusting the administrative data accordingly still resulted in 50% of DH patients not having a valid indication for receiving a PPI. This is consistent with the 54% recorded by Batuwitage and colleagues11 in the outpatient setting by direct chart review, as well as a range of 60%‐75% for hospitalized patients in other studies.12, 13, 15, 23, 24
Stomach acidity is believed to provide an important host defense against lower gastrointestinal tract infections including Salmonella, Campylobacter, and Clostridium difficile.25 A recent study by Howell et al26 showed a doseresponse effect between PPI use and C. difficile infection, supporting a causal connection between loss of stomach acidity and development of Clostridium difficile‐associated diarrhea (CDAD). We found that C. difficile infection was more common in both populations of patients receiving PPIs (although the relative risk was much higher in the UHC database) (Table 5). The rate of CDAD in DH patients who received PPIs was 2.6 times higher than in patients who did not receive these acid suppressive agents.
The role of acid suppression in increasing risk for community‐acquired pneumonia is not entirely clear. Theories regarding the loss of an important host defense and bacterial proliferation head the list.6, 8, 27 Gastric and duodenal bacterial overgrowth is significantly more common in patients receiving PPIs than in patients receiving histamine type‐2 (H2) blockers.28 Previous studies have identified an increased rate of hospital‐acquired pneumonia and recurrent community‐acquired pneumonia27 in patients receiving any form of acid suppression therapy, but the risk appears to be greater in patients receiving PPIs than in those receiving H2 receptor antagonists (H2RAs).9 Significantly more patients in the UHC population who were taking PPIs had a concurrent diagnosis of pneumonia, consistent with previous studies alerting to this association6, 8, 9, 27 and consistent with the nonsignificant trend observed in the DH population.
Our study has a number of limitations. Our database comes from a single university‐affiliated public hospital with residents and hospitalists writing orders for all medications. The hospitals in the UHC are also teaching hospitals. Accordingly, our results might not generalize to other settings or reflect prescribing patterns in private, nonteaching hospital environments. Because our study was retrospective, we could not confirm the decision‐making process supporting the prescription of PPIs. Similarly, we could not temporarily relate the existence of the indication with the time the PPI was prescribed. Our list of appropriate indications for prescribing PPIs was developed by reviewing a number of references, and other studies have used slightly different lists (albeit the more commonly recognized indications are the same), but it may be argued that the list either includes or misses diagnoses in error.
While there is considerable debate about the use of PPIs for stress ulcer prophylaxis,29 we specifically chose not to include this as one of our valid indications for PPIs for 4 reasons. First, the American Society of Health‐System Pharmacists (ASHP) Report does not recommend prophylaxis for non‐ICU patients, and only recommends prophylaxis for those ICU patients with a coagulopathy, those requiring mechanical ventilation for more than 48 hours, those with a history of gastrointestinal ulceration or bleeding in the year prior to admission, and those with 2 or more of the following indications: sepsis, ICU stay >1 week, occult bleeding lasting 6 or more days, receiving high‐dose corticosteroids, and selected surgical situations.30 At the time the guideline was written, the authors note that there was insufficient data on PPIs to make any recommendations on their use, but no subsequent guidelines have been issued.30 Second, a review by Mohebbi and Hesch published in 2009, and a meta‐analysis by Lin and colleagues published in 2010, summarize subsequent randomized trials that suggest that PPIs and H2 blockers are, at best, similarly effective at preventing upper gastrointestinal (GI) bleeding among critically ill patients.31, 32 Third, the NICE guidelines do not include stress ulcer prophylaxis as an appropriate indication for PPIs except in the prevention and treatment of NSAID [non‐steroidal anti‐inflammatory drug]‐associated ulcers.19 Finally, H2RAs are currently the only medications with an FDA‐approved indication for stress ulcer prophylaxis. We acknowledge that PPIs may be a reasonable and acceptable choice for stress ulcer prophylaxis in patients who meet indications, but we were unable to identify such patients in either of our administrative databases.
In our Denver Health population, only 31% of our patients spent any time in the intensive care unit, and only a fraction of these would have both an accepted indication for stress ulcer prophylaxis by the ASHP guidelines and an intolerance or contraindication to an H2RA or sulcralfate. While our administrative database lacked the detail necessary to identify this small group of patients, the number of patients who might have been misclassified as not having a valid PPI indication was likely very small. Similar to the findings of previous studies,15, 18, 23, 29 prophylaxis against gastrointestinal bleeding was the stated justification for prescribing the PPI in 56% of the DH patient charts reviewed. It is impossible for us to estimate the number of patients in our administrative database for whom stress ulcer prophylaxis was justified by existing guidelines, as it would be necessary to gather a number of specific clinical details for each patient including: 1) ICU stay; 2) presence of coagulopathy; 3) duration of mechanical ventilation; 4) presence of sepsis; 5) duration of ICU stay; 6) presence of occult bleeding for >6 days; and 7) use of high‐dose corticosteroids. This level of clinical detail would likely only be available through a prospective study design, as has been suggested by other authors.33 Further research into the use, safety, and effectiveness of PPIs specifically for stress ulcer prophylaxis is warranted.
In conclusion, we found that 73% of nearly 1 million Medicine patients discharged from academic medical centers received a PPI without a valid indication during their hospitalization. The implications of our findings are broad. PPIs are more expensive31 than H2RAs and there is increasing evidence that they have significant side effects. In both databases we examined, the rate of C. difficile infection was higher in patients receiving PPIs than others. The prescribing habits of physicians in these university hospital settings appear to be far out of line with published guidelines and evidence‐based practice. Reducing inappropriate prescribing of PPIs would be an important educational and quality assurance project in most institutions.
- IMS Health Web site. Available at: http://www.imshealth.com/deployedfiles/ims/Global/Content/Corporate/Press%20Room/Top‐line%20Market%20Data/2009%20Top‐line%20Market%20Data/Top%20Therapy%20Classes%20by%20U.S.Sales.pdf. Accessed May 1,2011.
- ,, , et al.Comparison of omeprazole and cimetidine in reflux oesophagitis: symptomatic, endoscopic, and histological evaluations.Gut.1990;31(9):968–972.
- ,,, et al.Omeprazole before endoscopy in patients with gastrointestinal bleeding.N Engl J Med.2007;356(16):1631–1640.
- ,,,.Use of gastric acid‐suppressive agents and the risk of community‐acquired Clostridium difficile‐associated disease.JAMA.2005;294(23):2989–2995.
- ,,, et al.Risk of adverse outcomes associated with concomitant use of clopidogrel and proton pump inhibitors following acute coronary syndrome.JAMA.2009;301(9):937–944.
- ,,,,,.Risk of community‐acquired pneumonia and use of gastric acid‐suppressive drugs.JAMA.2004;292(16):1955–1960.
- ,,,.Long‐term proton pump inhibitor therapy and risk of hip fracture.JAMA2006;296(24):2947–2953.
- ,,,,,.Use of proton pump inhibitors and the risk of community‐acquired pneumonia: a population‐based case‐control study.Arch Intern Med.2007;167(9):950–955.
- ,,,.Acid‐suppressive medication use and the risk for hospital‐acquired pneumonia.JAMA.2009;301(20):2120–2128.
- US Food and Drug Administration (FDA) Website. Available at: http://www.fda.gov/Safety/MedWatch/SafetyInformation/SafetyAlertsfor HumanMedicalProducts/ucm245275.htm. Accessed March 2,2011.
- ,,,.Inappropriate prescribing of proton pump inhibitors in primary care.Postgrad Med J.2007;83(975):66–68.
- ,.Stress ulcer prophylaxis in hospitalized patients not in intensive care units.Am J Health Syst Pharm.2007;64(13):1396–1400.
- ,,,.Predictors of inappropriate utilization of intravenous proton pump inhibitors.Aliment Pharmacol Ther.2007;25(5):609–615.
- ,,.Overuse of acid‐suppressive therapy in hospitalized patients.Am J Gastroenterol.2000;95(11):3118–3122.
- ,,,,,.Patterns and predictors of proton pump inhibitor overuse among academic and non‐academic hospitalists.Intern Med2010;49(23):2561–2568.
- ,,, et al.Hospital use of acid‐suppressive medications and its fall‐out on prescribing in general practice: a 1‐month survey.Aliment Pharmacol Ther.2003;17(12):1503–1506.
- ,,.Overuse and inappropriate prescribing of proton pump inhibitors in patients with Clostridium difficile‐associated disease.QJM.2008;101(6):445–448.
- ,,,.Acid suppressive therapy use on an inpatient internal medicine service.Ann Pharmacother.2006;40(7–8):1261–1266.
- National Institute of Clinical Excellence (NICE), National Health Service (NHS), Dyspepsia: Management of dyspepsia in adults in primary care. Web site. Available at: http://www.nice.org.uk/nicemedia/live/10950/29460/29460.pdf. Accessed May 1,2011.
- ,,.When should stress ulcer prophylaxis be used in the ICU?Curr Opin Crit Care.2009;15(2):139–143.
- ,.An evaluation of the use of proton pump inhibitors.Pharm World Sci2001;23(3):116–117.
- ,,.Overuse of proton pump inhibitors.J Clin Pharm Ther.2000;25(5):333–340.
- ,,,.Pattern of intravenous proton pump inhibitors use in ICU and non‐ICU setting: a prospective observational study.Saudi J Gastroenterol.2010;16(4):275–279.
- ,,, et al.Overuse of PPIs in patients at admission, during treatment, and at discharge in a tertiary Spanish hospital.Curr Clin Pharmacol.2010;5(4):288–297.
- ,,.Systematic review of the risk of enteric infection in patients taking acid suppression.Am J Gastroenterol.2007;102(9):2047–2056.
- ,,, et al.Iatrogenic gastric acid suppression and the risk of nosocomial Clostridium difficile infection.Arch Intern Med.2010;170(9):784–790.
- ,,,,.Recurrent community‐acquired pneumonia in patients starting acid‐suppressing drugs.Am J Med.2010;123(1):47–53.
- ,,, et al.Bacterial overgrowth during treatment with omeprazole compared with cimetidine: a prospective randomised double blind study.Gut.1996;39(1):54–59.
- ,,,.Why do physicians prescribe stress ulcer prophylaxis to general medicine patients?South Med J2010;103(11):1103–1110.
- ASHP therapeutic guidelines on stress ulcer prophylaxis.ASHP Commission on Therapeutics and approved by the ASHP Board of Directors on November 14, 1998.Am J Health Syst Pharm.1999;56(4):347–379.
- ,.Stress ulcer prophylaxis in the intensive care unit.Proc (Bayl Univ Med Cent).2009;22(4):373–376.
- ,,,,.The efficacy and safety of proton pump inhibitors vs histamine‐2 receptor antagonists for stress ulcer bleeding prophylaxis among critical care patients: a meta‐analysis.Crit Care Med.2010;38(4):1197–1205.
- ,,.Proton pump inhibitors for the prevention of stress‐related mucosal disease in critically‐ill patients: a meta‐analysis.J Med Assoc Thai.2009;92(5):632–637.
- ,,,.Proton pump inhibitors for prophylaxis of nosocomial upper gastrointestinal tract bleeding: effect of standardized guidelines on prescribing practice.Arch Intern Med.2010;170(9):779–783.
Proton pump inhibitors (PPIs) are the third most commonly prescribed class of medication in the United States, with $13.6 billion in yearly sales.1 Despite their effectiveness in treating acid reflux2 and their mortality benefit in the treatment of patients with gastrointestinal bleeding,3 recent literature has identified a number of risks associated with PPIs, including an increased incidence of Clostridium difficile infection,4 decreased effectiveness of clopidogrel in patients with acute coronary syndrome,5 increased risk of community‐ and hospital‐acquired pneumonia, and an increased risk of hip fracture.69 Additionally, in March of 2011, the US Food and Drug Administration (FDA) issued a warning regarding the potential for PPIs to cause low magnesium levels which can, in turn, cause muscle spasms, an irregular heartbeat, and convulsions.10
Inappropriate PPI prescription practice has been demonstrated in the primary care setting,11 as well as in small studies conducted in the hospital setting.1216 We hypothesized that many hospitalized patients receive these medications without having an accepted indication, and examined 2 populations of hospitalized patients, including administrative data from 6.5 million discharges from US university hospitals, to look for appropriate diagnoses justifying their use.
METHODS
We performed a retrospective review of administrative data collected between January 1, 2008 and December 31, 2009 from 2 patient populations: (a) those discharged from Denver Health (DH), a university‐affiliated public safety net hospital in Denver, CO; and (b) patients discharged from 112 academic health centers and 256 of their affiliated hospitals that participate in the University HealthSystem Consortium (UHC). The Colorado Multiple Institution Review Board reviewed and approved the conduct of this study.
Inclusion criteria for both populations were age >18 or <90 years, and hospitalization on a Medicine service. Prisoners and women known to be pregnant were excluded. In both cohorts, if patients had more than 1 admission during the 2‐year study period, only data from the first admission were used.
We recorded demographics, admitting diagnosis, and discharge diagnoses together with information pertaining to the name, route, and duration of administration of all PPIs (ie, omeprazole, lansoprazole, esomeprazole, pantoprazole, rabeprazole). We created a broadly inclusive set of valid indications for PPIs by incorporating diagnoses that could be identified by International Classification of Diseases, Ninth Revision.
(ICD‐9) codes from a number of previously published sources including the National Institute of Clinical Excellence (NICE) guidelines issued by the National Health Service (NHS) of the United Kingdom in 200012, 1721 (Table 1).
| Indication | ICD‐9 Code |
|---|---|
| |
| Helicobacter pylori | 041.86 |
| Abnormality of secretion of gastrin | 251.5 |
| Esophageal varices with bleeding | 456.0 |
| Esophageal varices without mention of bleeding | 456.1 |
| Esophageal varices in diseases classified elsewhere | 456.2 |
| Esophagitis | 530.10530.19 |
| Perforation of esophagus | 530.4 |
| Gastroesophageal laceration‐hemorrhage syndrome | 530.7 |
| Esophageal reflux | 530.81 |
| Barrett's esophagus | 530.85 |
| Gastric ulcer | 531.0031.91 |
| Duodenal ulcer | 532.00532.91 |
| Peptic ulcer, site unspecified | 533.00533.91 |
| Gastritis and duodenitis | 535.00535.71 |
| Gastroparesis | 536.3 |
| Dyspepsia and other specified disorders of function of stomach | 536.8 |
| Hemorrhage of gastrointestinal tract, unspecified | 578.9 |
To assess the accuracy of the administrative data from DH, we also reviewed the Emergency Department histories, admission histories, progress notes, electronic pharmacy records, endoscopy reports, and discharge summaries of 123 patients randomly selected (ie, a 5% sample) from the group of patients identified by administrative data to have received a PPI without a valid indication, looking for any accepted indication that might have been missed in the administrative data.
All analyses were performed using SAS Enterprise Guide 4.1 (SAS Institute, Cary, NC). A Student t test was used to compare continuous variables and a chi‐square test was used to compare categorical variables. Bonferroni corrections were used for multiple comparisons, such that P values less than 0.01 were considered to be significant for categorical variables.
RESULTS
Inclusion criteria were met by 9875 patients in the Denver Health database and 6,592,100 patients in the UHC database. The demographics and primary discharge diagnoses for these patients are summarized in Table 2.
| DH (N = 9875) | UHC (N = 6,592,100) | ||||
|---|---|---|---|---|---|
| Received a PPI | No PPI | Received a PPI | No PPI | ||
| |||||
| No. (%) | 3962 (40) | 5913 (60) | 918,474 (14) | 5,673,626 (86) | |
| Age (mean SD) | 53 15 | 51 16 | 59 17 | 55 18 | |
| Gender (% male) | 2197 (55) | 3438 (58) | 464,552 (51) | 2,882,577 (51) | |
| Race (% white) | 1610 (41) | 2425 (41) | 619,571 (67) | 3,670,450 (65) | |
| Top 5 primary discharge diagnoses | |||||
| Chest pain | 229 (6) | 462 (8) | Coronary atherosclerosis | 35,470 (4) | 186,321 (3) |
| Alcohol withdrawal | 147 (4) | 174 (3) | Acute myocardial infarction | 26,507 (3) | 132,159 (2) |
| Pneumonia, organism unspecified | 142 (4) | 262 (4) | Heart failure | 21,143 (2) | 103,751 (2) |
| Acute pancreatitis | 132 (3) | 106 (2) | Septicemia | 20,345 (2) | 64,915 (1) |
| Obstructive chronic bronchitis with (acute) exacerbation | 89 (2) | 154 (3) | Chest pain | 16,936 (2) | 107,497 (2) |
Only 39% and 27% of the patients in the DH and UHC databases, respectively, had a valid indication for PPIs on the basis of discharge diagnoses (Table 3). In the DH data, if admission ICD‐9 codes were also inspected for valid PPI indications, 1579 (40%) of patients receiving PPIs had a valid indication (admission ICD‐9 codes were not available for patients in the UHC database). Thirty‐one percent of Denver Health patients spent time in the intensive care unit (ICU) during their hospital stay and 65% of those patients received a PPI without a valid indication, as compared to 59% of patients who remained on the General Medicine ward (Table 3).
| DH (N = 9875) | UHC (N = 6,592,100) | |
|---|---|---|
| ||
| Patients receiving PPIs (% of total) | 3962 (40) | 918,474 (14) |
| Any ICU stay, N (% of all patients) | 1238 (31) | |
| General Medicine ward only, N (% of all patients) | 2724 (69) | |
| Patients with indication for PPI (% of all patients receiving PPIs)* | 1540 (39) | 247,142 (27) |
| Any ICU stay, N (% of all ICU patients) | 434 (35) | |
| General Medicine ward only, N (% of all ward patients) | 1106 (41) | |
| Patients without indication for PPI (% of those receiving PPIs)* | 2422 (61) | 671,332 (73) |
| Any ICU stay, N (% of all ICU patients) | 804 (65) | |
| General Medicine ward only, N (% of all ward patients) | 1618 (59) | |
Higher rates of concurrent C. difficile infections were observed in patients receiving PPIs in both databases; a higher rate of concurrent diagnosis of pneumonia was seen in patients receiving PPIs in the UHC population, with a nonsignificant trend towards the same finding in DH patients (Table 4).
| Denver Health | UHC | |||||
|---|---|---|---|---|---|---|
| Concurrent diagnosis | (+) PPI 3962 | () PPI 5913 | P | (+) PPI 918,474 | () PPI 5,673,626 | P |
| ||||||
| C. difficile | 46 (1.16) | 26 (0.44) | <0.0001 | 12,113 (1.32) | 175 (0.0031) | <0.0001 |
| Pneumonia | 400 (10.1) | 517 (8.7) | 0.0232 | 75,274 (8.2) | 300,557 (5.3) | <0.0001 |
Chart review in the DH population found valid indications for PPIs in 19% of patients who were thought not have a valid indication on the basis of the administrative data (Table 5). For 56% of those in whom no valid indication was confirmed, physicians identified prophylaxis as the justification.
| Characteristic | N (%) |
|---|---|
| |
| Valid indication found on chart review only | 23 (19) |
| No valid indication after chart review | 100 (81) |
| Written indication: prophylaxis | 56 (56) |
| No written documentation of indication present in the chart | 33 (33) |
| Written indication: continue home medication | 9 (9) |
| Intubated with or without written indication of prophylaxis | 16 (16) |
DISCUSSION
The important finding of this study was that the majority of patients in 2 large groups of Medicine patients hospitalized in university‐affiliated hospitals received PPIs without having a valid indication. To our knowledge, the more than 900,000 UHC patients who received a PPI during their hospitalization represent the largest inpatient population evaluated for appropriateness of PPI prescriptions.
Our finding that 41% of the patients admitted to the DH Medicine service received a PPI during their hospital stay is similar to what has been observed by others.9, 14, 22 The rate of PPI prescription was lower in the UHC population (14%) for unclear reasons. By our definition, 61% lacked an adequate diagnosis to justify the prescription of the PPI. After performing a chart review on a randomly selected 5% of these records, we found that the DH administrative database had failed to identify 19% of patients who had a valid indication for receiving a PPI. Adjusting the administrative data accordingly still resulted in 50% of DH patients not having a valid indication for receiving a PPI. This is consistent with the 54% recorded by Batuwitage and colleagues11 in the outpatient setting by direct chart review, as well as a range of 60%‐75% for hospitalized patients in other studies.12, 13, 15, 23, 24
Stomach acidity is believed to provide an important host defense against lower gastrointestinal tract infections including Salmonella, Campylobacter, and Clostridium difficile.25 A recent study by Howell et al26 showed a doseresponse effect between PPI use and C. difficile infection, supporting a causal connection between loss of stomach acidity and development of Clostridium difficile‐associated diarrhea (CDAD). We found that C. difficile infection was more common in both populations of patients receiving PPIs (although the relative risk was much higher in the UHC database) (Table 5). The rate of CDAD in DH patients who received PPIs was 2.6 times higher than in patients who did not receive these acid suppressive agents.
The role of acid suppression in increasing risk for community‐acquired pneumonia is not entirely clear. Theories regarding the loss of an important host defense and bacterial proliferation head the list.6, 8, 27 Gastric and duodenal bacterial overgrowth is significantly more common in patients receiving PPIs than in patients receiving histamine type‐2 (H2) blockers.28 Previous studies have identified an increased rate of hospital‐acquired pneumonia and recurrent community‐acquired pneumonia27 in patients receiving any form of acid suppression therapy, but the risk appears to be greater in patients receiving PPIs than in those receiving H2 receptor antagonists (H2RAs).9 Significantly more patients in the UHC population who were taking PPIs had a concurrent diagnosis of pneumonia, consistent with previous studies alerting to this association6, 8, 9, 27 and consistent with the nonsignificant trend observed in the DH population.
Our study has a number of limitations. Our database comes from a single university‐affiliated public hospital with residents and hospitalists writing orders for all medications. The hospitals in the UHC are also teaching hospitals. Accordingly, our results might not generalize to other settings or reflect prescribing patterns in private, nonteaching hospital environments. Because our study was retrospective, we could not confirm the decision‐making process supporting the prescription of PPIs. Similarly, we could not temporarily relate the existence of the indication with the time the PPI was prescribed. Our list of appropriate indications for prescribing PPIs was developed by reviewing a number of references, and other studies have used slightly different lists (albeit the more commonly recognized indications are the same), but it may be argued that the list either includes or misses diagnoses in error.
While there is considerable debate about the use of PPIs for stress ulcer prophylaxis,29 we specifically chose not to include this as one of our valid indications for PPIs for 4 reasons. First, the American Society of Health‐System Pharmacists (ASHP) Report does not recommend prophylaxis for non‐ICU patients, and only recommends prophylaxis for those ICU patients with a coagulopathy, those requiring mechanical ventilation for more than 48 hours, those with a history of gastrointestinal ulceration or bleeding in the year prior to admission, and those with 2 or more of the following indications: sepsis, ICU stay >1 week, occult bleeding lasting 6 or more days, receiving high‐dose corticosteroids, and selected surgical situations.30 At the time the guideline was written, the authors note that there was insufficient data on PPIs to make any recommendations on their use, but no subsequent guidelines have been issued.30 Second, a review by Mohebbi and Hesch published in 2009, and a meta‐analysis by Lin and colleagues published in 2010, summarize subsequent randomized trials that suggest that PPIs and H2 blockers are, at best, similarly effective at preventing upper gastrointestinal (GI) bleeding among critically ill patients.31, 32 Third, the NICE guidelines do not include stress ulcer prophylaxis as an appropriate indication for PPIs except in the prevention and treatment of NSAID [non‐steroidal anti‐inflammatory drug]‐associated ulcers.19 Finally, H2RAs are currently the only medications with an FDA‐approved indication for stress ulcer prophylaxis. We acknowledge that PPIs may be a reasonable and acceptable choice for stress ulcer prophylaxis in patients who meet indications, but we were unable to identify such patients in either of our administrative databases.
In our Denver Health population, only 31% of our patients spent any time in the intensive care unit, and only a fraction of these would have both an accepted indication for stress ulcer prophylaxis by the ASHP guidelines and an intolerance or contraindication to an H2RA or sulcralfate. While our administrative database lacked the detail necessary to identify this small group of patients, the number of patients who might have been misclassified as not having a valid PPI indication was likely very small. Similar to the findings of previous studies,15, 18, 23, 29 prophylaxis against gastrointestinal bleeding was the stated justification for prescribing the PPI in 56% of the DH patient charts reviewed. It is impossible for us to estimate the number of patients in our administrative database for whom stress ulcer prophylaxis was justified by existing guidelines, as it would be necessary to gather a number of specific clinical details for each patient including: 1) ICU stay; 2) presence of coagulopathy; 3) duration of mechanical ventilation; 4) presence of sepsis; 5) duration of ICU stay; 6) presence of occult bleeding for >6 days; and 7) use of high‐dose corticosteroids. This level of clinical detail would likely only be available through a prospective study design, as has been suggested by other authors.33 Further research into the use, safety, and effectiveness of PPIs specifically for stress ulcer prophylaxis is warranted.
In conclusion, we found that 73% of nearly 1 million Medicine patients discharged from academic medical centers received a PPI without a valid indication during their hospitalization. The implications of our findings are broad. PPIs are more expensive31 than H2RAs and there is increasing evidence that they have significant side effects. In both databases we examined, the rate of C. difficile infection was higher in patients receiving PPIs than others. The prescribing habits of physicians in these university hospital settings appear to be far out of line with published guidelines and evidence‐based practice. Reducing inappropriate prescribing of PPIs would be an important educational and quality assurance project in most institutions.
Proton pump inhibitors (PPIs) are the third most commonly prescribed class of medication in the United States, with $13.6 billion in yearly sales.1 Despite their effectiveness in treating acid reflux2 and their mortality benefit in the treatment of patients with gastrointestinal bleeding,3 recent literature has identified a number of risks associated with PPIs, including an increased incidence of Clostridium difficile infection,4 decreased effectiveness of clopidogrel in patients with acute coronary syndrome,5 increased risk of community‐ and hospital‐acquired pneumonia, and an increased risk of hip fracture.69 Additionally, in March of 2011, the US Food and Drug Administration (FDA) issued a warning regarding the potential for PPIs to cause low magnesium levels which can, in turn, cause muscle spasms, an irregular heartbeat, and convulsions.10
Inappropriate PPI prescription practice has been demonstrated in the primary care setting,11 as well as in small studies conducted in the hospital setting.1216 We hypothesized that many hospitalized patients receive these medications without having an accepted indication, and examined 2 populations of hospitalized patients, including administrative data from 6.5 million discharges from US university hospitals, to look for appropriate diagnoses justifying their use.
METHODS
We performed a retrospective review of administrative data collected between January 1, 2008 and December 31, 2009 from 2 patient populations: (a) those discharged from Denver Health (DH), a university‐affiliated public safety net hospital in Denver, CO; and (b) patients discharged from 112 academic health centers and 256 of their affiliated hospitals that participate in the University HealthSystem Consortium (UHC). The Colorado Multiple Institution Review Board reviewed and approved the conduct of this study.
Inclusion criteria for both populations were age >18 or <90 years, and hospitalization on a Medicine service. Prisoners and women known to be pregnant were excluded. In both cohorts, if patients had more than 1 admission during the 2‐year study period, only data from the first admission were used.
We recorded demographics, admitting diagnosis, and discharge diagnoses together with information pertaining to the name, route, and duration of administration of all PPIs (ie, omeprazole, lansoprazole, esomeprazole, pantoprazole, rabeprazole). We created a broadly inclusive set of valid indications for PPIs by incorporating diagnoses that could be identified by International Classification of Diseases, Ninth Revision.
(ICD‐9) codes from a number of previously published sources including the National Institute of Clinical Excellence (NICE) guidelines issued by the National Health Service (NHS) of the United Kingdom in 200012, 1721 (Table 1).
| Indication | ICD‐9 Code |
|---|---|
| |
| Helicobacter pylori | 041.86 |
| Abnormality of secretion of gastrin | 251.5 |
| Esophageal varices with bleeding | 456.0 |
| Esophageal varices without mention of bleeding | 456.1 |
| Esophageal varices in diseases classified elsewhere | 456.2 |
| Esophagitis | 530.10530.19 |
| Perforation of esophagus | 530.4 |
| Gastroesophageal laceration‐hemorrhage syndrome | 530.7 |
| Esophageal reflux | 530.81 |
| Barrett's esophagus | 530.85 |
| Gastric ulcer | 531.0031.91 |
| Duodenal ulcer | 532.00532.91 |
| Peptic ulcer, site unspecified | 533.00533.91 |
| Gastritis and duodenitis | 535.00535.71 |
| Gastroparesis | 536.3 |
| Dyspepsia and other specified disorders of function of stomach | 536.8 |
| Hemorrhage of gastrointestinal tract, unspecified | 578.9 |
To assess the accuracy of the administrative data from DH, we also reviewed the Emergency Department histories, admission histories, progress notes, electronic pharmacy records, endoscopy reports, and discharge summaries of 123 patients randomly selected (ie, a 5% sample) from the group of patients identified by administrative data to have received a PPI without a valid indication, looking for any accepted indication that might have been missed in the administrative data.
All analyses were performed using SAS Enterprise Guide 4.1 (SAS Institute, Cary, NC). A Student t test was used to compare continuous variables and a chi‐square test was used to compare categorical variables. Bonferroni corrections were used for multiple comparisons, such that P values less than 0.01 were considered to be significant for categorical variables.
RESULTS
Inclusion criteria were met by 9875 patients in the Denver Health database and 6,592,100 patients in the UHC database. The demographics and primary discharge diagnoses for these patients are summarized in Table 2.
| DH (N = 9875) | UHC (N = 6,592,100) | ||||
|---|---|---|---|---|---|
| Received a PPI | No PPI | Received a PPI | No PPI | ||
| |||||
| No. (%) | 3962 (40) | 5913 (60) | 918,474 (14) | 5,673,626 (86) | |
| Age (mean SD) | 53 15 | 51 16 | 59 17 | 55 18 | |
| Gender (% male) | 2197 (55) | 3438 (58) | 464,552 (51) | 2,882,577 (51) | |
| Race (% white) | 1610 (41) | 2425 (41) | 619,571 (67) | 3,670,450 (65) | |
| Top 5 primary discharge diagnoses | |||||
| Chest pain | 229 (6) | 462 (8) | Coronary atherosclerosis | 35,470 (4) | 186,321 (3) |
| Alcohol withdrawal | 147 (4) | 174 (3) | Acute myocardial infarction | 26,507 (3) | 132,159 (2) |
| Pneumonia, organism unspecified | 142 (4) | 262 (4) | Heart failure | 21,143 (2) | 103,751 (2) |
| Acute pancreatitis | 132 (3) | 106 (2) | Septicemia | 20,345 (2) | 64,915 (1) |
| Obstructive chronic bronchitis with (acute) exacerbation | 89 (2) | 154 (3) | Chest pain | 16,936 (2) | 107,497 (2) |
Only 39% and 27% of the patients in the DH and UHC databases, respectively, had a valid indication for PPIs on the basis of discharge diagnoses (Table 3). In the DH data, if admission ICD‐9 codes were also inspected for valid PPI indications, 1579 (40%) of patients receiving PPIs had a valid indication (admission ICD‐9 codes were not available for patients in the UHC database). Thirty‐one percent of Denver Health patients spent time in the intensive care unit (ICU) during their hospital stay and 65% of those patients received a PPI without a valid indication, as compared to 59% of patients who remained on the General Medicine ward (Table 3).
| DH (N = 9875) | UHC (N = 6,592,100) | |
|---|---|---|
| ||
| Patients receiving PPIs (% of total) | 3962 (40) | 918,474 (14) |
| Any ICU stay, N (% of all patients) | 1238 (31) | |
| General Medicine ward only, N (% of all patients) | 2724 (69) | |
| Patients with indication for PPI (% of all patients receiving PPIs)* | 1540 (39) | 247,142 (27) |
| Any ICU stay, N (% of all ICU patients) | 434 (35) | |
| General Medicine ward only, N (% of all ward patients) | 1106 (41) | |
| Patients without indication for PPI (% of those receiving PPIs)* | 2422 (61) | 671,332 (73) |
| Any ICU stay, N (% of all ICU patients) | 804 (65) | |
| General Medicine ward only, N (% of all ward patients) | 1618 (59) | |
Higher rates of concurrent C. difficile infections were observed in patients receiving PPIs in both databases; a higher rate of concurrent diagnosis of pneumonia was seen in patients receiving PPIs in the UHC population, with a nonsignificant trend towards the same finding in DH patients (Table 4).
| Denver Health | UHC | |||||
|---|---|---|---|---|---|---|
| Concurrent diagnosis | (+) PPI 3962 | () PPI 5913 | P | (+) PPI 918,474 | () PPI 5,673,626 | P |
| ||||||
| C. difficile | 46 (1.16) | 26 (0.44) | <0.0001 | 12,113 (1.32) | 175 (0.0031) | <0.0001 |
| Pneumonia | 400 (10.1) | 517 (8.7) | 0.0232 | 75,274 (8.2) | 300,557 (5.3) | <0.0001 |
Chart review in the DH population found valid indications for PPIs in 19% of patients who were thought not have a valid indication on the basis of the administrative data (Table 5). For 56% of those in whom no valid indication was confirmed, physicians identified prophylaxis as the justification.
| Characteristic | N (%) |
|---|---|
| |
| Valid indication found on chart review only | 23 (19) |
| No valid indication after chart review | 100 (81) |
| Written indication: prophylaxis | 56 (56) |
| No written documentation of indication present in the chart | 33 (33) |
| Written indication: continue home medication | 9 (9) |
| Intubated with or without written indication of prophylaxis | 16 (16) |
DISCUSSION
The important finding of this study was that the majority of patients in 2 large groups of Medicine patients hospitalized in university‐affiliated hospitals received PPIs without having a valid indication. To our knowledge, the more than 900,000 UHC patients who received a PPI during their hospitalization represent the largest inpatient population evaluated for appropriateness of PPI prescriptions.
Our finding that 41% of the patients admitted to the DH Medicine service received a PPI during their hospital stay is similar to what has been observed by others.9, 14, 22 The rate of PPI prescription was lower in the UHC population (14%) for unclear reasons. By our definition, 61% lacked an adequate diagnosis to justify the prescription of the PPI. After performing a chart review on a randomly selected 5% of these records, we found that the DH administrative database had failed to identify 19% of patients who had a valid indication for receiving a PPI. Adjusting the administrative data accordingly still resulted in 50% of DH patients not having a valid indication for receiving a PPI. This is consistent with the 54% recorded by Batuwitage and colleagues11 in the outpatient setting by direct chart review, as well as a range of 60%‐75% for hospitalized patients in other studies.12, 13, 15, 23, 24
Stomach acidity is believed to provide an important host defense against lower gastrointestinal tract infections including Salmonella, Campylobacter, and Clostridium difficile.25 A recent study by Howell et al26 showed a doseresponse effect between PPI use and C. difficile infection, supporting a causal connection between loss of stomach acidity and development of Clostridium difficile‐associated diarrhea (CDAD). We found that C. difficile infection was more common in both populations of patients receiving PPIs (although the relative risk was much higher in the UHC database) (Table 5). The rate of CDAD in DH patients who received PPIs was 2.6 times higher than in patients who did not receive these acid suppressive agents.
The role of acid suppression in increasing risk for community‐acquired pneumonia is not entirely clear. Theories regarding the loss of an important host defense and bacterial proliferation head the list.6, 8, 27 Gastric and duodenal bacterial overgrowth is significantly more common in patients receiving PPIs than in patients receiving histamine type‐2 (H2) blockers.28 Previous studies have identified an increased rate of hospital‐acquired pneumonia and recurrent community‐acquired pneumonia27 in patients receiving any form of acid suppression therapy, but the risk appears to be greater in patients receiving PPIs than in those receiving H2 receptor antagonists (H2RAs).9 Significantly more patients in the UHC population who were taking PPIs had a concurrent diagnosis of pneumonia, consistent with previous studies alerting to this association6, 8, 9, 27 and consistent with the nonsignificant trend observed in the DH population.
Our study has a number of limitations. Our database comes from a single university‐affiliated public hospital with residents and hospitalists writing orders for all medications. The hospitals in the UHC are also teaching hospitals. Accordingly, our results might not generalize to other settings or reflect prescribing patterns in private, nonteaching hospital environments. Because our study was retrospective, we could not confirm the decision‐making process supporting the prescription of PPIs. Similarly, we could not temporarily relate the existence of the indication with the time the PPI was prescribed. Our list of appropriate indications for prescribing PPIs was developed by reviewing a number of references, and other studies have used slightly different lists (albeit the more commonly recognized indications are the same), but it may be argued that the list either includes or misses diagnoses in error.
While there is considerable debate about the use of PPIs for stress ulcer prophylaxis,29 we specifically chose not to include this as one of our valid indications for PPIs for 4 reasons. First, the American Society of Health‐System Pharmacists (ASHP) Report does not recommend prophylaxis for non‐ICU patients, and only recommends prophylaxis for those ICU patients with a coagulopathy, those requiring mechanical ventilation for more than 48 hours, those with a history of gastrointestinal ulceration or bleeding in the year prior to admission, and those with 2 or more of the following indications: sepsis, ICU stay >1 week, occult bleeding lasting 6 or more days, receiving high‐dose corticosteroids, and selected surgical situations.30 At the time the guideline was written, the authors note that there was insufficient data on PPIs to make any recommendations on their use, but no subsequent guidelines have been issued.30 Second, a review by Mohebbi and Hesch published in 2009, and a meta‐analysis by Lin and colleagues published in 2010, summarize subsequent randomized trials that suggest that PPIs and H2 blockers are, at best, similarly effective at preventing upper gastrointestinal (GI) bleeding among critically ill patients.31, 32 Third, the NICE guidelines do not include stress ulcer prophylaxis as an appropriate indication for PPIs except in the prevention and treatment of NSAID [non‐steroidal anti‐inflammatory drug]‐associated ulcers.19 Finally, H2RAs are currently the only medications with an FDA‐approved indication for stress ulcer prophylaxis. We acknowledge that PPIs may be a reasonable and acceptable choice for stress ulcer prophylaxis in patients who meet indications, but we were unable to identify such patients in either of our administrative databases.
In our Denver Health population, only 31% of our patients spent any time in the intensive care unit, and only a fraction of these would have both an accepted indication for stress ulcer prophylaxis by the ASHP guidelines and an intolerance or contraindication to an H2RA or sulcralfate. While our administrative database lacked the detail necessary to identify this small group of patients, the number of patients who might have been misclassified as not having a valid PPI indication was likely very small. Similar to the findings of previous studies,15, 18, 23, 29 prophylaxis against gastrointestinal bleeding was the stated justification for prescribing the PPI in 56% of the DH patient charts reviewed. It is impossible for us to estimate the number of patients in our administrative database for whom stress ulcer prophylaxis was justified by existing guidelines, as it would be necessary to gather a number of specific clinical details for each patient including: 1) ICU stay; 2) presence of coagulopathy; 3) duration of mechanical ventilation; 4) presence of sepsis; 5) duration of ICU stay; 6) presence of occult bleeding for >6 days; and 7) use of high‐dose corticosteroids. This level of clinical detail would likely only be available through a prospective study design, as has been suggested by other authors.33 Further research into the use, safety, and effectiveness of PPIs specifically for stress ulcer prophylaxis is warranted.
In conclusion, we found that 73% of nearly 1 million Medicine patients discharged from academic medical centers received a PPI without a valid indication during their hospitalization. The implications of our findings are broad. PPIs are more expensive31 than H2RAs and there is increasing evidence that they have significant side effects. In both databases we examined, the rate of C. difficile infection was higher in patients receiving PPIs than others. The prescribing habits of physicians in these university hospital settings appear to be far out of line with published guidelines and evidence‐based practice. Reducing inappropriate prescribing of PPIs would be an important educational and quality assurance project in most institutions.
- IMS Health Web site. Available at: http://www.imshealth.com/deployedfiles/ims/Global/Content/Corporate/Press%20Room/Top‐line%20Market%20Data/2009%20Top‐line%20Market%20Data/Top%20Therapy%20Classes%20by%20U.S.Sales.pdf. Accessed May 1,2011.
- ,, , et al.Comparison of omeprazole and cimetidine in reflux oesophagitis: symptomatic, endoscopic, and histological evaluations.Gut.1990;31(9):968–972.
- ,,, et al.Omeprazole before endoscopy in patients with gastrointestinal bleeding.N Engl J Med.2007;356(16):1631–1640.
- ,,,.Use of gastric acid‐suppressive agents and the risk of community‐acquired Clostridium difficile‐associated disease.JAMA.2005;294(23):2989–2995.
- ,,, et al.Risk of adverse outcomes associated with concomitant use of clopidogrel and proton pump inhibitors following acute coronary syndrome.JAMA.2009;301(9):937–944.
- ,,,,,.Risk of community‐acquired pneumonia and use of gastric acid‐suppressive drugs.JAMA.2004;292(16):1955–1960.
- ,,,.Long‐term proton pump inhibitor therapy and risk of hip fracture.JAMA2006;296(24):2947–2953.
- ,,,,,.Use of proton pump inhibitors and the risk of community‐acquired pneumonia: a population‐based case‐control study.Arch Intern Med.2007;167(9):950–955.
- ,,,.Acid‐suppressive medication use and the risk for hospital‐acquired pneumonia.JAMA.2009;301(20):2120–2128.
- US Food and Drug Administration (FDA) Website. Available at: http://www.fda.gov/Safety/MedWatch/SafetyInformation/SafetyAlertsfor HumanMedicalProducts/ucm245275.htm. Accessed March 2,2011.
- ,,,.Inappropriate prescribing of proton pump inhibitors in primary care.Postgrad Med J.2007;83(975):66–68.
- ,.Stress ulcer prophylaxis in hospitalized patients not in intensive care units.Am J Health Syst Pharm.2007;64(13):1396–1400.
- ,,,.Predictors of inappropriate utilization of intravenous proton pump inhibitors.Aliment Pharmacol Ther.2007;25(5):609–615.
- ,,.Overuse of acid‐suppressive therapy in hospitalized patients.Am J Gastroenterol.2000;95(11):3118–3122.
- ,,,,,.Patterns and predictors of proton pump inhibitor overuse among academic and non‐academic hospitalists.Intern Med2010;49(23):2561–2568.
- ,,, et al.Hospital use of acid‐suppressive medications and its fall‐out on prescribing in general practice: a 1‐month survey.Aliment Pharmacol Ther.2003;17(12):1503–1506.
- ,,.Overuse and inappropriate prescribing of proton pump inhibitors in patients with Clostridium difficile‐associated disease.QJM.2008;101(6):445–448.
- ,,,.Acid suppressive therapy use on an inpatient internal medicine service.Ann Pharmacother.2006;40(7–8):1261–1266.
- National Institute of Clinical Excellence (NICE), National Health Service (NHS), Dyspepsia: Management of dyspepsia in adults in primary care. Web site. Available at: http://www.nice.org.uk/nicemedia/live/10950/29460/29460.pdf. Accessed May 1,2011.
- ,,.When should stress ulcer prophylaxis be used in the ICU?Curr Opin Crit Care.2009;15(2):139–143.
- ,.An evaluation of the use of proton pump inhibitors.Pharm World Sci2001;23(3):116–117.
- ,,.Overuse of proton pump inhibitors.J Clin Pharm Ther.2000;25(5):333–340.
- ,,,.Pattern of intravenous proton pump inhibitors use in ICU and non‐ICU setting: a prospective observational study.Saudi J Gastroenterol.2010;16(4):275–279.
- ,,, et al.Overuse of PPIs in patients at admission, during treatment, and at discharge in a tertiary Spanish hospital.Curr Clin Pharmacol.2010;5(4):288–297.
- ,,.Systematic review of the risk of enteric infection in patients taking acid suppression.Am J Gastroenterol.2007;102(9):2047–2056.
- ,,, et al.Iatrogenic gastric acid suppression and the risk of nosocomial Clostridium difficile infection.Arch Intern Med.2010;170(9):784–790.
- ,,,,.Recurrent community‐acquired pneumonia in patients starting acid‐suppressing drugs.Am J Med.2010;123(1):47–53.
- ,,, et al.Bacterial overgrowth during treatment with omeprazole compared with cimetidine: a prospective randomised double blind study.Gut.1996;39(1):54–59.
- ,,,.Why do physicians prescribe stress ulcer prophylaxis to general medicine patients?South Med J2010;103(11):1103–1110.
- ASHP therapeutic guidelines on stress ulcer prophylaxis.ASHP Commission on Therapeutics and approved by the ASHP Board of Directors on November 14, 1998.Am J Health Syst Pharm.1999;56(4):347–379.
- ,.Stress ulcer prophylaxis in the intensive care unit.Proc (Bayl Univ Med Cent).2009;22(4):373–376.
- ,,,,.The efficacy and safety of proton pump inhibitors vs histamine‐2 receptor antagonists for stress ulcer bleeding prophylaxis among critical care patients: a meta‐analysis.Crit Care Med.2010;38(4):1197–1205.
- ,,.Proton pump inhibitors for the prevention of stress‐related mucosal disease in critically‐ill patients: a meta‐analysis.J Med Assoc Thai.2009;92(5):632–637.
- ,,,.Proton pump inhibitors for prophylaxis of nosocomial upper gastrointestinal tract bleeding: effect of standardized guidelines on prescribing practice.Arch Intern Med.2010;170(9):779–783.
- IMS Health Web site. Available at: http://www.imshealth.com/deployedfiles/ims/Global/Content/Corporate/Press%20Room/Top‐line%20Market%20Data/2009%20Top‐line%20Market%20Data/Top%20Therapy%20Classes%20by%20U.S.Sales.pdf. Accessed May 1,2011.
- ,, , et al.Comparison of omeprazole and cimetidine in reflux oesophagitis: symptomatic, endoscopic, and histological evaluations.Gut.1990;31(9):968–972.
- ,,, et al.Omeprazole before endoscopy in patients with gastrointestinal bleeding.N Engl J Med.2007;356(16):1631–1640.
- ,,,.Use of gastric acid‐suppressive agents and the risk of community‐acquired Clostridium difficile‐associated disease.JAMA.2005;294(23):2989–2995.
- ,,, et al.Risk of adverse outcomes associated with concomitant use of clopidogrel and proton pump inhibitors following acute coronary syndrome.JAMA.2009;301(9):937–944.
- ,,,,,.Risk of community‐acquired pneumonia and use of gastric acid‐suppressive drugs.JAMA.2004;292(16):1955–1960.
- ,,,.Long‐term proton pump inhibitor therapy and risk of hip fracture.JAMA2006;296(24):2947–2953.
- ,,,,,.Use of proton pump inhibitors and the risk of community‐acquired pneumonia: a population‐based case‐control study.Arch Intern Med.2007;167(9):950–955.
- ,,,.Acid‐suppressive medication use and the risk for hospital‐acquired pneumonia.JAMA.2009;301(20):2120–2128.
- US Food and Drug Administration (FDA) Website. Available at: http://www.fda.gov/Safety/MedWatch/SafetyInformation/SafetyAlertsfor HumanMedicalProducts/ucm245275.htm. Accessed March 2,2011.
- ,,,.Inappropriate prescribing of proton pump inhibitors in primary care.Postgrad Med J.2007;83(975):66–68.
- ,.Stress ulcer prophylaxis in hospitalized patients not in intensive care units.Am J Health Syst Pharm.2007;64(13):1396–1400.
- ,,,.Predictors of inappropriate utilization of intravenous proton pump inhibitors.Aliment Pharmacol Ther.2007;25(5):609–615.
- ,,.Overuse of acid‐suppressive therapy in hospitalized patients.Am J Gastroenterol.2000;95(11):3118–3122.
- ,,,,,.Patterns and predictors of proton pump inhibitor overuse among academic and non‐academic hospitalists.Intern Med2010;49(23):2561–2568.
- ,,, et al.Hospital use of acid‐suppressive medications and its fall‐out on prescribing in general practice: a 1‐month survey.Aliment Pharmacol Ther.2003;17(12):1503–1506.
- ,,.Overuse and inappropriate prescribing of proton pump inhibitors in patients with Clostridium difficile‐associated disease.QJM.2008;101(6):445–448.
- ,,,.Acid suppressive therapy use on an inpatient internal medicine service.Ann Pharmacother.2006;40(7–8):1261–1266.
- National Institute of Clinical Excellence (NICE), National Health Service (NHS), Dyspepsia: Management of dyspepsia in adults in primary care. Web site. Available at: http://www.nice.org.uk/nicemedia/live/10950/29460/29460.pdf. Accessed May 1,2011.
- ,,.When should stress ulcer prophylaxis be used in the ICU?Curr Opin Crit Care.2009;15(2):139–143.
- ,.An evaluation of the use of proton pump inhibitors.Pharm World Sci2001;23(3):116–117.
- ,,.Overuse of proton pump inhibitors.J Clin Pharm Ther.2000;25(5):333–340.
- ,,,.Pattern of intravenous proton pump inhibitors use in ICU and non‐ICU setting: a prospective observational study.Saudi J Gastroenterol.2010;16(4):275–279.
- ,,, et al.Overuse of PPIs in patients at admission, during treatment, and at discharge in a tertiary Spanish hospital.Curr Clin Pharmacol.2010;5(4):288–297.
- ,,.Systematic review of the risk of enteric infection in patients taking acid suppression.Am J Gastroenterol.2007;102(9):2047–2056.
- ,,, et al.Iatrogenic gastric acid suppression and the risk of nosocomial Clostridium difficile infection.Arch Intern Med.2010;170(9):784–790.
- ,,,,.Recurrent community‐acquired pneumonia in patients starting acid‐suppressing drugs.Am J Med.2010;123(1):47–53.
- ,,, et al.Bacterial overgrowth during treatment with omeprazole compared with cimetidine: a prospective randomised double blind study.Gut.1996;39(1):54–59.
- ,,,.Why do physicians prescribe stress ulcer prophylaxis to general medicine patients?South Med J2010;103(11):1103–1110.
- ASHP therapeutic guidelines on stress ulcer prophylaxis.ASHP Commission on Therapeutics and approved by the ASHP Board of Directors on November 14, 1998.Am J Health Syst Pharm.1999;56(4):347–379.
- ,.Stress ulcer prophylaxis in the intensive care unit.Proc (Bayl Univ Med Cent).2009;22(4):373–376.
- ,,,,.The efficacy and safety of proton pump inhibitors vs histamine‐2 receptor antagonists for stress ulcer bleeding prophylaxis among critical care patients: a meta‐analysis.Crit Care Med.2010;38(4):1197–1205.
- ,,.Proton pump inhibitors for the prevention of stress‐related mucosal disease in critically‐ill patients: a meta‐analysis.J Med Assoc Thai.2009;92(5):632–637.
- ,,,.Proton pump inhibitors for prophylaxis of nosocomial upper gastrointestinal tract bleeding: effect of standardized guidelines on prescribing practice.Arch Intern Med.2010;170(9):779–783.
Copyright © 2011 Society of Hospital Medicine
Program Targets "Frequent Fliers"
A new Michigan clinic for a hospital system's ED "frequent fliers" is a chance for HM to help streamline care delivery, a hospitalist involved in the effort says.
Doug Apple, MD, hospitalist division chief for Spectrum Health in Grand Rapids, Mich., says the Spectrum Health Medical Group Center for Integrative Medicine will help deal with patients who have used the ED at least 10 times in the past year. In the past, many of the patients would be admitted to the hospital, becoming part of a hospitalist's census. Often, they will have nonspecific conditions, such as chronic abdominal pain.
"Patients get admitted, they might not see the same hospitalist, they may not see the same surgical specialist or GI specialist," Dr. Apple says. "And so every time they get admitted, there's a different plan, there's a different diagnosis or idea. … The intent is to figure out how are these individuals able to get better care, more appropriate care, in an environment that allows them to actually have somebody that pays strict attention to what their needs are?"
Dr. Apple, who worked on the conceptual planning of the clinic, says hospitalists will have no hands-on role with its initial operation, other than referrals. But he says hospitalists who proactively identify patients best cared for via the clinic could save themselves readmissions and ensure better transitions of care.
"We're trying to figure out how we make these transitions, either into a hospital, or out of a hospital, or between an ED and back to the clinic," he adds. "We're trying to make sure these transitions do not become gaps in healthcare."
A new Michigan clinic for a hospital system's ED "frequent fliers" is a chance for HM to help streamline care delivery, a hospitalist involved in the effort says.
Doug Apple, MD, hospitalist division chief for Spectrum Health in Grand Rapids, Mich., says the Spectrum Health Medical Group Center for Integrative Medicine will help deal with patients who have used the ED at least 10 times in the past year. In the past, many of the patients would be admitted to the hospital, becoming part of a hospitalist's census. Often, they will have nonspecific conditions, such as chronic abdominal pain.
"Patients get admitted, they might not see the same hospitalist, they may not see the same surgical specialist or GI specialist," Dr. Apple says. "And so every time they get admitted, there's a different plan, there's a different diagnosis or idea. … The intent is to figure out how are these individuals able to get better care, more appropriate care, in an environment that allows them to actually have somebody that pays strict attention to what their needs are?"
Dr. Apple, who worked on the conceptual planning of the clinic, says hospitalists will have no hands-on role with its initial operation, other than referrals. But he says hospitalists who proactively identify patients best cared for via the clinic could save themselves readmissions and ensure better transitions of care.
"We're trying to figure out how we make these transitions, either into a hospital, or out of a hospital, or between an ED and back to the clinic," he adds. "We're trying to make sure these transitions do not become gaps in healthcare."
A new Michigan clinic for a hospital system's ED "frequent fliers" is a chance for HM to help streamline care delivery, a hospitalist involved in the effort says.
Doug Apple, MD, hospitalist division chief for Spectrum Health in Grand Rapids, Mich., says the Spectrum Health Medical Group Center for Integrative Medicine will help deal with patients who have used the ED at least 10 times in the past year. In the past, many of the patients would be admitted to the hospital, becoming part of a hospitalist's census. Often, they will have nonspecific conditions, such as chronic abdominal pain.
"Patients get admitted, they might not see the same hospitalist, they may not see the same surgical specialist or GI specialist," Dr. Apple says. "And so every time they get admitted, there's a different plan, there's a different diagnosis or idea. … The intent is to figure out how are these individuals able to get better care, more appropriate care, in an environment that allows them to actually have somebody that pays strict attention to what their needs are?"
Dr. Apple, who worked on the conceptual planning of the clinic, says hospitalists will have no hands-on role with its initial operation, other than referrals. But he says hospitalists who proactively identify patients best cared for via the clinic could save themselves readmissions and ensure better transitions of care.
"We're trying to figure out how we make these transitions, either into a hospital, or out of a hospital, or between an ED and back to the clinic," he adds. "We're trying to make sure these transitions do not become gaps in healthcare."
In the Literature: Research You Need to Know
Clinical question: Can the aortic dissection detection (ADD) risk score be used to screen patients for acute aortic dissection at the bedside?
Background: AAD, a life-threatening condition, often is missed due to relatively low incidence, varied presentation, and need for advanced imaging studies. The American Heart Association and the American College of Cardiology have published guidelines on thoracic aortic disease from which the ADD risk score has been adapted to identify high-risk patients and to suggest additional testing based on pretest probability of disease.
Study design: Retrospective application of ADD risk score to the International Registry of Acute Aortic Dissection (IRAD) database.
Setting: Multinational medical registry compiled from 24 medical centers.
Synopsis: A total of 2,538 patients with confirmed ADD were reviewed. The number of patients presenting with one or more of 12 proposed clinical risk markers was determined. An ADD risk score of 0 to 3 was calculated based on the number of risk categories (high-risk predisposing conditions, pain features, examination features) in which patients met criteria.
Among 108 (4.3%) patients found to be low-risk (ADD score 0), 72 had a chest X-ray, 35 of which were found to have a widened mediastinum. High-risk features (ADD score 2 or 3) were found in 1,503 (59.2%) patients, and the remaining 927 (36.5%) patients had intermediate risk (ADD score 1).
The guidelines recommend further imaging for all intermediate- and high-risk patients and for low-risk patients with a wide mediastinum resulting in very good sensitivity.
Bottom line: The ADD risk score is a sensitive bedside screening tool for aortic dissection, ensuring that more than 95% patients with true dissection undergo further investigation, but it may lead to overinvestigation due to unknown specificity.
Citation: Rogers AM, Hermann LK, Booher AM, et al. Sensitivity of the aortic dissection detection risk score, a novel guideline-based tool for identification of acute aortic dissection at initial presentation: results from the international registry of acute aortic dissection. Circ. 2011;123:2213-2218.
For more physician reviews of HM-related literature, visit our website and search "Literature."
Clinical question: Can the aortic dissection detection (ADD) risk score be used to screen patients for acute aortic dissection at the bedside?
Background: AAD, a life-threatening condition, often is missed due to relatively low incidence, varied presentation, and need for advanced imaging studies. The American Heart Association and the American College of Cardiology have published guidelines on thoracic aortic disease from which the ADD risk score has been adapted to identify high-risk patients and to suggest additional testing based on pretest probability of disease.
Study design: Retrospective application of ADD risk score to the International Registry of Acute Aortic Dissection (IRAD) database.
Setting: Multinational medical registry compiled from 24 medical centers.
Synopsis: A total of 2,538 patients with confirmed ADD were reviewed. The number of patients presenting with one or more of 12 proposed clinical risk markers was determined. An ADD risk score of 0 to 3 was calculated based on the number of risk categories (high-risk predisposing conditions, pain features, examination features) in which patients met criteria.
Among 108 (4.3%) patients found to be low-risk (ADD score 0), 72 had a chest X-ray, 35 of which were found to have a widened mediastinum. High-risk features (ADD score 2 or 3) were found in 1,503 (59.2%) patients, and the remaining 927 (36.5%) patients had intermediate risk (ADD score 1).
The guidelines recommend further imaging for all intermediate- and high-risk patients and for low-risk patients with a wide mediastinum resulting in very good sensitivity.
Bottom line: The ADD risk score is a sensitive bedside screening tool for aortic dissection, ensuring that more than 95% patients with true dissection undergo further investigation, but it may lead to overinvestigation due to unknown specificity.
Citation: Rogers AM, Hermann LK, Booher AM, et al. Sensitivity of the aortic dissection detection risk score, a novel guideline-based tool for identification of acute aortic dissection at initial presentation: results from the international registry of acute aortic dissection. Circ. 2011;123:2213-2218.
For more physician reviews of HM-related literature, visit our website and search "Literature."
Clinical question: Can the aortic dissection detection (ADD) risk score be used to screen patients for acute aortic dissection at the bedside?
Background: AAD, a life-threatening condition, often is missed due to relatively low incidence, varied presentation, and need for advanced imaging studies. The American Heart Association and the American College of Cardiology have published guidelines on thoracic aortic disease from which the ADD risk score has been adapted to identify high-risk patients and to suggest additional testing based on pretest probability of disease.
Study design: Retrospective application of ADD risk score to the International Registry of Acute Aortic Dissection (IRAD) database.
Setting: Multinational medical registry compiled from 24 medical centers.
Synopsis: A total of 2,538 patients with confirmed ADD were reviewed. The number of patients presenting with one or more of 12 proposed clinical risk markers was determined. An ADD risk score of 0 to 3 was calculated based on the number of risk categories (high-risk predisposing conditions, pain features, examination features) in which patients met criteria.
Among 108 (4.3%) patients found to be low-risk (ADD score 0), 72 had a chest X-ray, 35 of which were found to have a widened mediastinum. High-risk features (ADD score 2 or 3) were found in 1,503 (59.2%) patients, and the remaining 927 (36.5%) patients had intermediate risk (ADD score 1).
The guidelines recommend further imaging for all intermediate- and high-risk patients and for low-risk patients with a wide mediastinum resulting in very good sensitivity.
Bottom line: The ADD risk score is a sensitive bedside screening tool for aortic dissection, ensuring that more than 95% patients with true dissection undergo further investigation, but it may lead to overinvestigation due to unknown specificity.
Citation: Rogers AM, Hermann LK, Booher AM, et al. Sensitivity of the aortic dissection detection risk score, a novel guideline-based tool for identification of acute aortic dissection at initial presentation: results from the international registry of acute aortic dissection. Circ. 2011;123:2213-2218.
For more physician reviews of HM-related literature, visit our website and search "Literature."
NPs Improve Discharges, Not Readmissions
Adding a nurse practitioner (NP) to a resident physician team improves the efficiency of the discharge process but does nothing to decrease readmissions, according to a study in this month's Journal of Hospital Medicine.
In a randomized controlled trial at Massachusetts General Hospital (MGH) in Boston, NP use resulted in more discharge summaries completed within 24 hours when compared to a control group (67% vs 47%, P<0.001), according to the report, "Improving the Discharge Process by Embedding a Discharge Facilitator in a Resident Team." The study reported more follow-up appointments scheduled (62% vs. 36%, P<0.0001) scheduled and better attendance at those appointments within two weeks (36% vs. 23%, P<0.0002).
But for all the benefits, study author Kathleen Finn MD, MPhil, FACP, FHM, expresses disappointment in the fact that there was no significant difference between the groups in 30-day ED visits or 30-day readmissions.
"The literature suggests if we improve the discharge process, make it safer, and make sure patients have appropriate follow-ups in a timely fashion, we should be able to reduce readmissions," she says. "When we took a general medical population and did all that, we didn't get those results. However, its a single study, with one nurse, so its hard to say. But that was a little disappointing."
The study's results were enough to prompt the expansion of the program from one resident team to three. In the long term, Dr. Finn wants physician educators who are interested in limiting work hours and admissions to view the discharge process as just as important.
"We don't consider the discharge process as time-consuming, but it does take almost as much time as an admission does and yet patients are being discharged, even on admitting days,” she says. "The discharge is a very vulnerable time as the literature keeps showing. We need to rethink the discharge process."
Adding a nurse practitioner (NP) to a resident physician team improves the efficiency of the discharge process but does nothing to decrease readmissions, according to a study in this month's Journal of Hospital Medicine.
In a randomized controlled trial at Massachusetts General Hospital (MGH) in Boston, NP use resulted in more discharge summaries completed within 24 hours when compared to a control group (67% vs 47%, P<0.001), according to the report, "Improving the Discharge Process by Embedding a Discharge Facilitator in a Resident Team." The study reported more follow-up appointments scheduled (62% vs. 36%, P<0.0001) scheduled and better attendance at those appointments within two weeks (36% vs. 23%, P<0.0002).
But for all the benefits, study author Kathleen Finn MD, MPhil, FACP, FHM, expresses disappointment in the fact that there was no significant difference between the groups in 30-day ED visits or 30-day readmissions.
"The literature suggests if we improve the discharge process, make it safer, and make sure patients have appropriate follow-ups in a timely fashion, we should be able to reduce readmissions," she says. "When we took a general medical population and did all that, we didn't get those results. However, its a single study, with one nurse, so its hard to say. But that was a little disappointing."
The study's results were enough to prompt the expansion of the program from one resident team to three. In the long term, Dr. Finn wants physician educators who are interested in limiting work hours and admissions to view the discharge process as just as important.
"We don't consider the discharge process as time-consuming, but it does take almost as much time as an admission does and yet patients are being discharged, even on admitting days,” she says. "The discharge is a very vulnerable time as the literature keeps showing. We need to rethink the discharge process."
Adding a nurse practitioner (NP) to a resident physician team improves the efficiency of the discharge process but does nothing to decrease readmissions, according to a study in this month's Journal of Hospital Medicine.
In a randomized controlled trial at Massachusetts General Hospital (MGH) in Boston, NP use resulted in more discharge summaries completed within 24 hours when compared to a control group (67% vs 47%, P<0.001), according to the report, "Improving the Discharge Process by Embedding a Discharge Facilitator in a Resident Team." The study reported more follow-up appointments scheduled (62% vs. 36%, P<0.0001) scheduled and better attendance at those appointments within two weeks (36% vs. 23%, P<0.0002).
But for all the benefits, study author Kathleen Finn MD, MPhil, FACP, FHM, expresses disappointment in the fact that there was no significant difference between the groups in 30-day ED visits or 30-day readmissions.
"The literature suggests if we improve the discharge process, make it safer, and make sure patients have appropriate follow-ups in a timely fashion, we should be able to reduce readmissions," she says. "When we took a general medical population and did all that, we didn't get those results. However, its a single study, with one nurse, so its hard to say. But that was a little disappointing."
The study's results were enough to prompt the expansion of the program from one resident team to three. In the long term, Dr. Finn wants physician educators who are interested in limiting work hours and admissions to view the discharge process as just as important.
"We don't consider the discharge process as time-consuming, but it does take almost as much time as an admission does and yet patients are being discharged, even on admitting days,” she says. "The discharge is a very vulnerable time as the literature keeps showing. We need to rethink the discharge process."
Debunking the "Holiday Blues" Myth
Around the winter holidays—for reasons as varied as weather, grieving, holiday stress, or just plain Scrooge-liness—people are more susceptible to the "holiday blues." But Timothy Lineberry, MD, psychiatric hospitalist and medical director of Mayo Psychiatric Hospital and board chair of the American Association of Suicidology, points out that depression and associated suicide risk are year-round issues.
"The holidays aren't necessarily the worst. Depression and suicide are important all year long," Dr. Lineberry says.
In fact, a 2010 Annenberg Public Policy Center study (PDF) found that the rate of suicide in the U.S. is lowest in December. Suicide actually peaks in the spring and fall, a pattern that has not changed in recent years according to the same study.
Physicians write 60% of prescriptions for anti-depressants. And because depression and other mental health issues remain a taboo topic to many Americans, many patients visit their physician instead of a mental health clinician. As such, hospitalists need to be able to accurately assess depression and suicide risk.
Dr. Lineberry suggests the following steps for hospitalists who diagnose patients with depression:
- Consider using the holidays to renew or update systems of practice to better identify depression;
- Use the PHQ-9 questionnaire with patients who display symptoms of depression; and
- Ask direct and clear questions about suicidal thoughts and behaviors. Keep substance abuse as a risk factor in mind.
Around the winter holidays—for reasons as varied as weather, grieving, holiday stress, or just plain Scrooge-liness—people are more susceptible to the "holiday blues." But Timothy Lineberry, MD, psychiatric hospitalist and medical director of Mayo Psychiatric Hospital and board chair of the American Association of Suicidology, points out that depression and associated suicide risk are year-round issues.
"The holidays aren't necessarily the worst. Depression and suicide are important all year long," Dr. Lineberry says.
In fact, a 2010 Annenberg Public Policy Center study (PDF) found that the rate of suicide in the U.S. is lowest in December. Suicide actually peaks in the spring and fall, a pattern that has not changed in recent years according to the same study.
Physicians write 60% of prescriptions for anti-depressants. And because depression and other mental health issues remain a taboo topic to many Americans, many patients visit their physician instead of a mental health clinician. As such, hospitalists need to be able to accurately assess depression and suicide risk.
Dr. Lineberry suggests the following steps for hospitalists who diagnose patients with depression:
- Consider using the holidays to renew or update systems of practice to better identify depression;
- Use the PHQ-9 questionnaire with patients who display symptoms of depression; and
- Ask direct and clear questions about suicidal thoughts and behaviors. Keep substance abuse as a risk factor in mind.
Around the winter holidays—for reasons as varied as weather, grieving, holiday stress, or just plain Scrooge-liness—people are more susceptible to the "holiday blues." But Timothy Lineberry, MD, psychiatric hospitalist and medical director of Mayo Psychiatric Hospital and board chair of the American Association of Suicidology, points out that depression and associated suicide risk are year-round issues.
"The holidays aren't necessarily the worst. Depression and suicide are important all year long," Dr. Lineberry says.
In fact, a 2010 Annenberg Public Policy Center study (PDF) found that the rate of suicide in the U.S. is lowest in December. Suicide actually peaks in the spring and fall, a pattern that has not changed in recent years according to the same study.
Physicians write 60% of prescriptions for anti-depressants. And because depression and other mental health issues remain a taboo topic to many Americans, many patients visit their physician instead of a mental health clinician. As such, hospitalists need to be able to accurately assess depression and suicide risk.
Dr. Lineberry suggests the following steps for hospitalists who diagnose patients with depression:
- Consider using the holidays to renew or update systems of practice to better identify depression;
- Use the PHQ-9 questionnaire with patients who display symptoms of depression; and
- Ask direct and clear questions about suicidal thoughts and behaviors. Keep substance abuse as a risk factor in mind.